for personal use only - asx · denver, co 80111, usa t: +1 (303) 390 8700 f: +1 (303) 390 877 e....
TRANSCRIPT

ir.com
Asia Paci� c/Middle East/AfricaIntegrated Research LimitedLevel 9, 100 Paci� c HighwayNorth Sydney NSW 2060AustraliaT. +61 (2) 9966 1066E. [email protected]
United Kingdom & IrelandIntegrated Research UK LtdThe Atrium, Hare� eld RoadUxbridge, MiddlesexUB8 1PHUnited KingdomT. +44 (0) 189 581 7800E. [email protected]
Americas - West CoastIntegrated Research, Inc.6312 S. Fiddlers Green Circle, Suite 500NDenver, CO 80111, USAT: +1 (303) 390 8700F: +1 (303) 390 877E. [email protected]
SingaporeIntegrated Research (Singapore) Pte. Ltd.Unit 14-03, Palais Renaissance390 Orchard RoadSingapore 238871T. +65 6813 0851E. [email protected]
GermanyIntegrated Research Germany GmbHHamborner Str. 5340472 Düsseldorf, GermanyT. +49 (89) 97 007 132E. [email protected]
Americas - East CoastIntegrated Research, Inc.12950 Worldgate Dr, Suite 720Herndon, VA 20170, USAT: +1 (303) 390 8700F: +1 (303) 390 8777E. [email protected]
Americas - Mid WestIntegrated Research, Inc.6601 Lyndale Ave. S., Suite 330Rich� eld, Minnesota, MN 55423, USAT. +1 (612) 243 6700 F. +1 (303) 390 8777E. [email protected]
Integrated Research A
nnual Report 2019
ABN 76 003 588 449
Integrated ResearchAnnual Report 2019
For
per
sona
l use
onl
y

Corporatedirectory
Directors
Paul BrandlingIndependent Non-Executive Director & Chairman
Nick AbrahamsNon-Executive Director
Garry DinnieIndependent Non-Executive Director
Peter LloydIndependent Non-Executive Director
Anne MyersIndependent Non-Executive Director
Company SecretaryDavid Purdue
Registered O� ceLevel 9, 100 Paci� c HighwayNorth Sydney NSW 2060T. +61 (2) 9966 1066
Share RegistryComputershare
SolicitorsAshurstLevel 11, 5 Martin PlaceSydney NSW 2000
BankersNational Australia BankWestpac Banking CorporationHSBC Bank Australia
Securities Exchange ListingAustralian Securities ExchangeCode: IRI
Country of IncorporationIntegrated Research Limited,incorporated and domiciled inAustralia, is a publicly listedcompany limited by shares.
Notice of Annual General MeetingThe Annual General Meeting ofIntegrated Research Limited will beheld on:
Wednesday 20 November 2019Museum of SydneyCnr. Phillip & Bridge Streets, Sydneyat 10:00am
4975 Designed and Produced by RDA Creative www.rda.com.auThis Annual Report is printed on Impress DM Matt. Impress DM is a FSC Certi� ed paper which is made from elemental chlorine free pulp derived from well-managed forests. It is manufactured by an EMAS and ISO 14001 certi� ed mill.
For
per
sona
l use
onl
y

Integrated Research and its controlled entities Annual Report 2019 1
2 Financial highlights
4 Chairman’s report
7 About IR
8 2019 in IR
11 Directors’ report
25 Remuneration report (audited)
35 Corporate governance statement
43 Financials
79 Directors’ declaration
80 Independent auditor’s report
87 ASX additional information
89 Corporate directory
Contents
For
per
sona
l use
onl
y

Integrated Research and its controlled entities Annual Report 20192
Financial highlights
70.3 84.5 91.2 91.2 100.8
2015 2016 2017 2018 2019
Total revenue (AUD millions)
14.3 16.0 18.5 19.2 21.9
2015 2016 2017 2018 2019
Net profit after tax (AUD millions)
41.0 45.7 53.4 52.6 62.8
2015 2016 2017 2018 2019
Revenue from licence sales (AUD millions)
Strong growth in
Europe and APAC
$101M Revenue
Integrated Research and its controlled entities Annual Report 2019
$22M Profit
2
For
per
sona
l use
onl
y

Integrated Research and its controlled entities Annual Report 2019 3
IN MILLIONS OF AUD (EXCEPT EARNINGS PER SHARE)
Year ended 30 June 2019 2018 % Change
Revenue from licence fees 62.8 52.6 19%
Total revenue 100.8 91.2 11%
Net profit after tax 21.9 19.2 14%
Net assets 69.8 57.8 21%
Cash at balance date 9.3 11.2 -17%
Americas revenue 69.4 64.2 8%
Europe revenue 16.9 13.7 23%
Asia Pacific revenue 15.0 13.2 14%
Earnings per share (cents per share) 12.7 11.2 14%
Year ended 30 June 2019 2018 % Change
Americas revenue (USD) 49.7 49.5 0%
Asia Pacific revenue (AUD) 15.0 13.2 14%
Europe revenue (UK Sterling) 9.4 7.8 19%
Infr
astr
uctu
re re
venu
e
28%
Hea
dcou
nt
270
9/10Top US Banks
7/10Biggest Telcos
6/10Top Fin Services
Companies Globally
6/10Top Automotive Companies
125+of Fortune 500
R&
D in
vest
men
t
17%
Paym
ents
reve
nue
92%Our customers
3Integrated Research and its controlled entities Annual Report 2019
For
per
sona
l use
onl
y

Integrated Research and its controlled entities Annual Report 20194
Chairman’s report
FY 19 PERFORMANCEThe Company surpassed milestones of $100 million revenue and $20 million profit for the first time in its corporate history.
Profit after tax increased 14% over the previous financial year to $21.9 million. Total revenue was up 11% to $100.8 million. Underpinning this growth was a strong performance in new licence sales which grew 19% to $62.8 million.
A key attribute of IR’s performance and business model resilience is the diversified geographic and product portfolio. Over 95% of the Company’s revenue was derived outside of Australia and split across three primary product lines.
Europe was reorganised during the year with new leadership and delivered a 19% increase in revenue to £9.4 million. APAC’s growth trajectory continued with a 14% increase in revenue to $15.1 million. The Americas delivered a solid result of US$49.7 million amidst changes in leadership, which represents nominal growth.
Of the three primary product lines, Payments was the standout performer with 92% revenue growth to $16.0 million. Nine new payments customers were secured during the year and growth with existing customers was achieved through renewals plus expansion by attaching additional product modules and capacity increases.
Infrastructure revenues grew by 28% to $26.3 million with renewals plus additional capacity sales. This mature product line continues to be a rich source of long-term revenue and margin for the Company.
Unified Communications (UC) revenue declined 7% over the previous year to $51.0 million with growth from Cisco customers offset by lower licence sales in Avaya and Microsoft Skype for Business. The Company continued to achieve new revenue growth with service providers. A strong focus by management on improved execution in this space gives the Board confidence in a stronger outlook for UC in FY20.
IR continues to serve top tier organisations across the world and some of the more significant sales during the
year came from major brands such as Airbus, Barclaycard, CenturyLink, DXC Technology, IAG, Target, Walgreens, Mastercard, Visa and Westpac.
The Company’s margins remain strong. EBITDA margin (measured as EBITDA/revenue) has been at 40% for the last three years. NPAT margin (measured as NPAT/revenue) was 22% compared to 21% for the previous year.
IR’s balance sheet remains strong with total cash at 30 June 2019 of $9.3 million and no debt.
INVESTING FOR THE FUTUREOverall expenses were up 9%, with a strong focus on containing or reducing business as usual operating costs helping to enable strong ongoing investment in research and development. General and administrative expenses were reduced by 5% whereas research and development net expenses (gross expenditure plus capitalisation and amortisation) were up 17% with gross research and development spending representing 19% of overall revenue.
IR has a proud history of technical excellence with software solutions that are typically very ‘sticky’ resulting in long term relationships with enterprise scale global customers and retention rates of 95% (measured by maintenance retention). The Company continues to invest in these core solutions delivering regular updates and new functionality thus providing expansion opportunities with existing customers in addition to new logo wins.
Additionally, the Company is investing in a new cloud-based platform which will enable complementary expansion of IR’s solutions to enterprise customers as they typically embrace an environment of on-premise, hybrid and cloud solutions. The first of these cloud-based solutions are expected to be delivered in 2H FY20.
A YEAR OF TRANSFORMATIONWe recognise that top quality people are fundamental in making a good company a great company.
The Board is delighted to welcome John Ruthven as our new CEO. John is an internationally experienced software
Dear IR Shareholders,
Thank you for your continued and valued support of Integrated Research Ltd. I am pleased to present the annual report for the financial year ended 30 June 2019. A year in which your Company achieved record results with notable milestone achievements amidst an industry which is constantly changing and evolving.
For
per
sona
l use
onl
y

Integrated Research and its controlled entities Annual Report 2019 5
executive with a proven track record over more than 20 years of delivering strong profitable growth.
In addition, the Company’s overall leadership bench strength has been significantly enhanced with new senior executive hires to drive product strategy and delivery. A new Chief Commercial Officer (CCO) role has been created to optimise overall sales and field operational performance including through a globally consistent focus on and engagement with customers, and consistent operational processes. A new senior executive was successfully recruited into this role. Field sales and operational capability has been bolstered with new leaders appointed in Europe and the Americas.
The Board was also refreshed during the year with Anne Myers elected at the AGM last November as a new Independent Non-Executive Director.
IR’s founder, Steve Killelea, stepped down as Chairman and we are fortunate to retain access to his experience and deep knowledge as a Strategy Consultant under a contract to support the Strategy Committee.
And of course, I was pleased to step up as the new Chairman, having already served for three years as an Independent Non-Executive Director and Deputy Chair.
DIVIDENDThe Board declared a final dividend of 3.75 cents per share franked to 100%. This takes the total dividend for the year to 7.25 cents compared to the prior year of 6.5 cents per share.
ACKNOWLEDGEMENTSI am confident that we are building a stronger Integrated Research which will continue to deliver compelling solutions for our customers and returns for our shareholders, as well as being a great place to work for our employees.
I thank our customers for their continued support of IR. We are committed to providing software solutions that enhance the performance of our customers and the experiences of their customers.
The Board would like to acknowledge the contribution made by our dedicated team at IR and in particular Peter Adams who was interim CEO for 2H FY19. Peter’s support has been invaluable and we are delighted to retain him as CFO.
Thanks also to my fellow Directors Nick Abrahams, Garry Dinnie, Peter Lloyd and Anne Myers for their commitment, expertise and valuable counsel plus collegiate support as we strive to build an even better Integrated Research.
The Board remains confident in the future for IR and once again, I would like to thank our shareholders for your ongoing support.
Paul BrandlingChairman
“The Company surpassed milestones of $100 million revenue and $20 million profit for the first time in it’s corporate history.”
For
per
sona
l use
onl
y
Integrated Research and its controlled entities Annual Report 20196 Integrated Research and its controlled entities Annual Report 20196
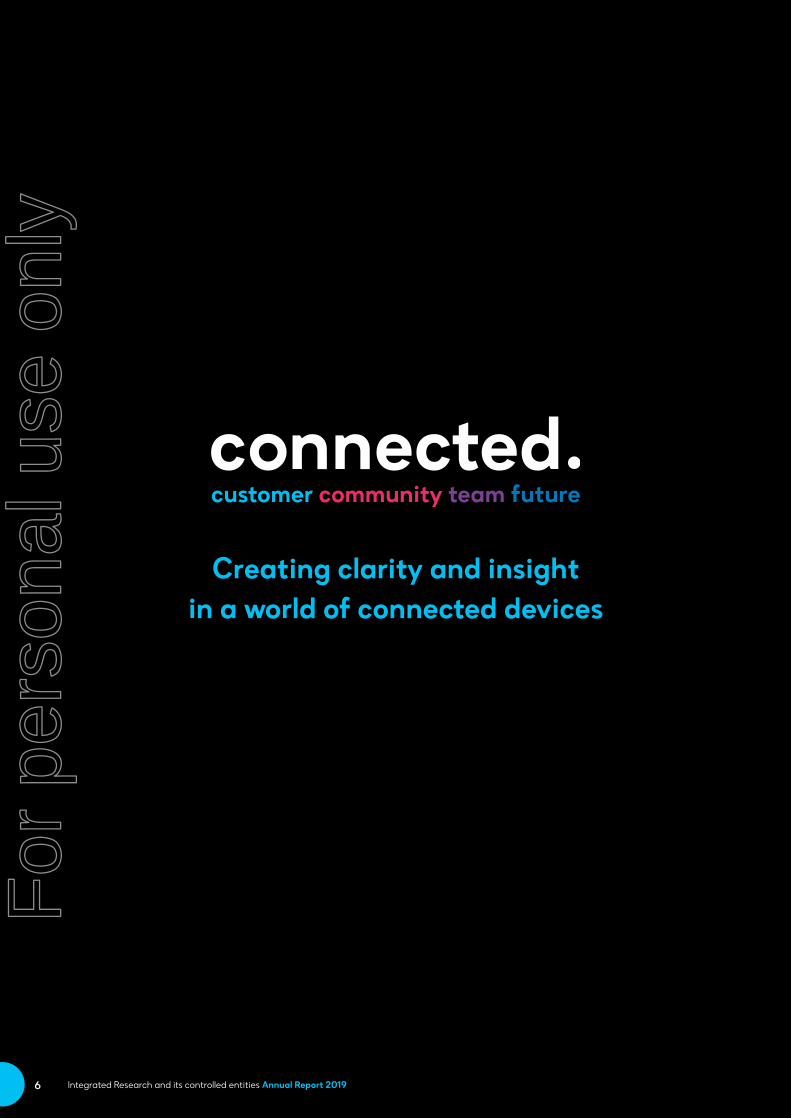
Creating clarity and insight in a world of connected devices
For
per
sona
l use
onl
y

Integrated Research and its controlled entities Annual Report 2019 7
About IR
IR is the corporate brand name of Integrated Research Limited, the leading global provider of proactive experience management solutions for critical unified communications, payments, contact centres and IT infrastructure ecosystems.
The modern world relies on a complex array of technologies to keep turning. IR’s aim is to simplify that complexity.
More than 1,000 organisations in over 60 countries - including some of the world’s largest banks, airlines and telecommunications companies - rely on IR’s experience management solutions to optimise their business-critical systems.
We provide insights, monitoring and support to keep payment hubs, unified communications ecosystems and contact centres running as they should.
Our purpose is to create clarity and insight in a world of connected devices.
Our vision is to make the world a smarter, easier place to live and work, where people and technology interact in a frictionless way.
Our mission is to create innovative technology that optimises operations, predicts business disruption and automates the steps to improve the experience of every interaction.
Prognosis for Unified Communications
Prognosis for Unified Communications is the leading proactive experience management solution for unified communications (UC) on-premises, hybrid or in the cloud. It enables our customers to deliver the best user experience possible for collaboration, meetings and voice or video calls across Avaya, Cisco and Microsoft UC solutions.
Prognosis for Payments
Prognosis for Payments helps customers de-risk deployments of new technology and reap the benefits from their investment sooner. Prognosis performance management is specifically designed to give complete real-time visibility into payments handled by processors such as ACI and FIS, and customers’ internal systems.
Prognosis for Contact Center
Prognosis for Contact Centre ensures the quality of customer interactions across multiple channels, including voice, video and the web. It helps make sure that contact centre systems deliver the performance that organisations expect so they can provide high-quality experiences for customers, make agents more efficient, and gain revenue and cost benefits. We expanded our contact centre solutions with new offers that ensure the quality of call recording activities and stress-test the performance of systems.
Prognosis for Infrastructure
Prognosis for Infrastructure manages the performance of IT systems and spots patterns in data so that customers can stop problems in their tracks. This means they can make systems work better, respond faster, prevent outages and get back to doing what they do best.
For
per
sona
l use
onl
y

Integrated Research and its controlled entities Annual Report 20198
2019 in IR
Customer FirstWe are solutions focused.
Over 30 years of success has been achieved by placing the customer at the heart of everything we do. Growing our customer-facing teams and introducing new Customer Success Manager roles has ensured we continue to make this our top priority.
The IR Summit grew again this year, with a record number of customers and partners joining us in Denver. Attendees participated in three days of hands-on sessions, knowledge sharing, networking and best-practice presentations. The event has proved invaluable in forging connections with our customers, allowing us to better understand their needs and priorities.
Enhancements to the IR Community to improve user experience and improve support processes. This saw an increase of 52% in membership and has created a valuable space for collaboration between our employees, customers and partners.
TeamworkCollaboration, cooperation and communication.
As we expand into new products, platforms and markets, the alignment of the team at all levels is critical. This year our annual Kick Off events focused on the importance of teamwork as we move forward with our ambitious growth plans.
The global IR team is full of outstanding individuals, who play a huge role in our success. One of our primary goals is to retain, reward and attract this talent. To this end, we introduced new programs allowing for more flexible working and parental leave arrangements, as well as opportunities for staff to move between teams and offices, to challenge themselves and grow their skills.
LeadershipWe lead by example.
Our leadership team was further strengthened this year with the addition of Matt Glasner as our Chief Commercial Officer and Frank Hoekstra as Head of Europe.
We strive to lead by example, not just in business, but in every aspect of our operations. We cannot exist without the communities in which we operate. Implementing a new Corporate Social Responsibility initiative enables our employees all over the world to lead by example and give back to their communities through charity work.
Our values are at the core of everything we do, guiding our actions, initiatives and strategy as we embark on the next phase of our journey toward the future.
For
per
sona
l use
onl
y

Integrated Research and its controlled entities Annual Report 2019 9
High PerformanceWe excel in what we do.
IR strive for excellence in everything we do. Achieving record-breaking results in revenue and profit for the 2019 financial year is a testament to the high calibre of the organisation, products and staff.
We introduced a Celebrating Our People program to provide a framework for the company to reward hard work and recognise employees who go above and beyond to embody the IR values.
InnovationLearning and creating.
Innovation is the vital ingredient that drives growth, attracts new business and draws talent to our business.
This year we announced new capabilities for UC Service Providers, including improved multi-tenancy management, role-based security, enhanced testing capabilities and expanded reporting and analytics, so they can continue to meet the evolving and growing UC needs of their customers. We also released a new Merchant Portal allowing Merchant Acquirers to provide real-time transaction performance views to their individual customers.
We joined BT’s Innovation Martlesham located at Adastral Park in the UK, a ‘collaborative ecosystem’ created by a cluster of 100 high-tech IT organizations, where BT customers are now able to see Prognosis in action in the onsite showcase.
For
per
sona
l use
onl
y

Integrated Research and its controlled entities Annual Report 201910 Integrated Research and its controlled entities Annual Report 201910
For
per
sona
l use
onl
y

Integrated Research and its controlled entities Annual Report 2019 11
Contents
12 Review of operations
15 Outlook and strategy for 2020
18 Board of Directors
20 Senior management
22 Directors’ interests
23 Share options and performance rights
25 Remuneration report (audited)
Directors’ report
Integrated Research and its controlled entities Annual Report 2019 11
For
per
sona
l use
onl
y

Integrated Research and its controlled entities Annual Report 201912
Directors’ report
Review of operations and activitiesPrincipal activitiesIntegrated Research Limited’s (the “Company”) principal activities are the design, development, implementation and sale of systems and applications management computer software for business-critical computing, Unified Communication networks and Payment networks.
Group overviewThe Company has a long heritage of providing performance monitoring, diagnostics and management software solutions for business-critical computing environments.
Since its establishment in 1988, the Company has provided its Prognosis products to a cross section of large organisations requiring high levels of computing performance and reliability.
Prognosis is an integrated suite of monitoring and management software, designed to give an organisation’s management and technical personnel operational insight into and optimise the
operation of their HP NonStop, distributed system servers, Unified Communications (“UC”), and Payment environments and the business applications that run on these platforms.
The Company has developed its Prognosis products around a fault-tolerant, highly distributed software architecture, designed to achieve high levels of functionality, scalability and reliability with a low total cost of ownership.
The Company services customers in more than 60 countries through direct sales offices in the USA, UK, Germany, Singapore and Australia, and via a global, channel-driven distribution network. The Company’s customer base consists of many of the world’s largest organisations and includes major stock exchanges, banks, credit card companies, telecommunications carriers, technology companies, service providers and manufacturers.
The Company generates its revenue from licence fees, recurring maintenance, testing solutions and professional services (formerly referred to as consulting). Revenue from the sale of licences where there are no post-delivery obligations is recognised in profit at the date of the delivery of the licence key. Revenue from maintenance contracts is recognised rateably over the service agreement. Revenue from
professional services and testing solution services is recognised over the period the services are delivered. The Company has recently expanded its product offering to Software as a Service (SaaS) with the introduction of cloud based solutions. SaaS revenues are recognised rateably over the delivery period.
Review and results of operationsOverviewThe Company achieved $21.9 million in profit after tax, representing a 14% increase over the prior year and within the guidance provided to the Australian Stock Exchange on July 15, 2019. The result was driven through strong licence sale growth in both Payments and Infrastructure product lines. The licence growth was more than cyclical, with nine new payment customers added during the year and an increase in capacity and deal length with existing customers. Revenue in Unified Communications was down over the prior year with growth on the Cisco platform being more than offset by declines in Avaya and Microsoft. The Company achieved an improvement in profit margin with operating costs growing at a slower pace to revenue growth.
Directors’ report
Annual after tax profit 14%
$21.9MAnnual revenue 11%
$100.8MLicence Fees 19%
$62.8M
For
per
sona
l use
onl
y

Integrated Research and its controlled entities Annual Report 2019 13
RevenueRevenue for the year was $100.8 million, an increase of 11% over 2018 with the strongest growth coming from the Company’s European operations. Licence fees increased by 19% to $62.8 million with strong growth from Payments and Infrastructure.
The following table presents Company revenues for each of the relevant product groups:
In thousands of AUD 2019 2018 % Change
Unified Communications 51,043 54,865 (7%)
Infrastructure 26,343 20,568 28%
Payments 16,047 8,375 92%
Professional services 7,387 7,367 0%
Total revenue 100,820 91,175 11%
Unified Communications (UC) revenue declined 7% over the previous year with growth from Cisco customers offset by lower licence sales in Avaya and Microsoft Skype for Business. The Company continued to achieve new revenue growth with service providers.
Infrastructure revenues increased by 28% to $26.3 million as a result of the cyclical upswing compounded by additional capacity sales. Licence transactions sold during the year were closed on a multi-year term basis with maturities ranging from three to five years.
Payments revenue increased by 92% over the prior year to $16.0 million driven by a combination of new and renewal business. The split was approximately one-third new business and two-thirds renewal. There were nine new customers added over the year facilitating a near doubling of new licence sale growth on the preceding financial year. Existing customers who renewed their Prognosis solution typically were happy to add capacity, additional modules and commit to licence sales for a three to five year period.
The following table presents Company revenues for each of the relevant geographic segments in underlying natural currencies:
2019 2018 % Change
Americas (USD’000) 49,696 49,519 0%
Asia Pacific (A$’000) 15,052 13,189 14%
Europe (£’000) 9,360 7,849 19%
The Americas revenue of US$49.7 million was comparable to the prior year. Strong Prognosis sales to Payments and Infrastructure customers was offset by lower sales in Unified Communications. Asia Pacific achieved growth of 14% to A$15.1 million with strong second half licence growth in Payments and Infrastructure. Europe achieved growth of 19% to £9.4 million with a strong performance across the year and licence growth in all key product lines.
ExpensesThe following table presents the Company’s cost base compared to the preceding year:
In thousands of AUD 2019 2018 % Change
Research and development expenses 17,888 15,335 17%
Sales, professional services and marketing expenses 49,787 45,703 9%
General and administration expenses 5,557 5,849 (5%)
Total expenses 73,232 66,887 9%
For
per
sona
l use
onl
y

Integrated Research and its controlled entities Annual Report 201914
Directors’ report
Total expenses were up 9% to $73.2 million with total staff numbers increasing by 4% over the course of the year to close at 270. Gross spending on research and development expenditure represents 19% of total revenue (FY18:19%):
In thousands of AUD 2019 2018 % Change
Gross research and development spending 18,966 17,341 9%
Capitalisation of development expenses (11,275) (11,524) (2%)
Amortisation of capitalised expenses 10,197 9,518 7%
Net research and development expenses 17,888 15,335 17%
Gross spend as a % of revenue 19% 19%
Shareholder returnsReturns to shareholders remain strong through the payment of franked dividends:
2019 2018 2017
Net profit ($’000) $21,851 $19,180 $18,520
Basic EPS 12.72¢ 11.19¢ 10.86¢
Dividends per share 7.25¢ 6.5¢ 6.5¢
Dividend franking percentage 100% 100% 85%
Return on equity 31% 33% 38%
Financial positionThe following table presents key items from the consolidated statement of financial position:
In thousands of AUD 2019 2018
Assets
Cash and cash equivalents (current) 9,316 11,238
Trade and other receivables (current and non-current) 72,767 71,078
Intangible assets (non-current) 23,101 21,938
Liabilities
Deferred Revenue 22,330 32,014
Equity 69,827 57,838
The Company’s end of year cash position was $9.3 million with no debt. The adoption of AASB15 ‘Revenue from Contracts with Customers’ resulted in a derecognition of non-current trade receivables and deferred revenue of $13.3 million for performance obligations that extend beyond 12 months. Further information on this change can be found in Note 1 to the Financial Report.
The consolidated statement of financial position presented at page 45 together with the accompanying notes provides further details.
For
per
sona
l use
onl
y

Integrated Research and its controlled entities Annual Report 2019 15
Unified Communications (UC) is the largest portfolio segment. Having all but replaced fixed-line telephony across the world, billions of voice and video calls and collaboration sessions are conducted every day, with business communication reliant on the quality of these experiences. IR Prognosis monitors and analyses these interactions to optimise the experience; no jitter, no latency, no interruptions.
On the Payments side of the business, hundreds of millions of people conduct billions of payments transactions using their credit cards or through ATMs. IR Prognosis is used by the world’s largest card issuers, banks, processors and merchants to ensure these transactions are processed flawlessly without network and infrastructure failure, thereby maximising the revenue of these organisations and ensuring consumers in economies across the world have a flawless experience.
The Company’s competitive advantage derives from the company’s know-how and unique intellectual property (IP). The architectural design enables real time insight, monitoring, fault root-cause analysis, business and operational analytics, performance management and optimisation. Being 100% software-based, the solution is highly scalable, extremely flexible and delivers very deep visibility into the diversity of systems and applications that it manages. As such, Prognosis is ideally suited to complex, high transaction volume, mission critical and high traffic environments. Both the increasing nature of business complexity, and the unique IP, make Prognosis more relevant and needed in today’s business world than it was at its origin thirty years ago.
We experience competition in various forms in each of our markets. Firstly, some of the large telephony and payment vendors have developed their own performance management software. These bespoke solutions are generally inferior to Prognosis both in terms of the depth of the metrics captured and analysed (which directly translates into the power of insight and speed of issue resolution) and the inability to monitor heterogeneous multi-vendor environments, as is most often the case. Secondly, some of the large solution software vendors have developed performance management products, which again lack the depth and insight of Prognosis, this discipline not being their core specialisation. Occasionally in specific niches, IR competes with smaller, lower-cost start-ups. Across all three competitive segments, customers choose IR when they value the quality of experience, insight and operational optimisation that Prognosis delivers.
We remain focused on sustaining our competitive advantage in a world of connected devices, through continuing innovation that comes from our research and development efforts.
Through deep visibility, forensic analysis into the root cause of problems, extensive analytics at multiple levels and new automation capabilities, Prognosis enables proactive and rapid resolution of issues, capacity management as well as operational, cost and user experience optimisation.
Outlook and strategy for 2020Integrated Research continues to provide the world’s leading enterprises and organisations clarity and insight into the operations of their mission critical systems.
For
per
sona
l use
onl
y

Integrated Research and its controlled entities Annual Report 201916
Directors’ report
Our solutions provide insight into potential issues before they become business-critical. Prognosis helps users improve their operational maturity by proactively minimising expensive outages, lowering costs, improving user satisfaction, retaining and growing customers and optimising IT operations and resources. Prognosis is progressively using its real-time access to big data to generate and deliver insights into a customer’s business that goes beyond improving and optimising operational efficiency. These capabilities today are delivered on-premise, and increasingly in the cloud.
The Company’s growth comes from expanding the capabilities delivered into existing markets and customers, expanding our sales and service capabilities into new geographic markets as they mature and adopt these core technologies, and by creating new products that open new markets.
Our Infrastructure customers include users of high-end computing systems such as the HP Enterprise NonStop platform for financial, telecommunication, trading, manufacturing and other high-volume, high-value mission critical transaction environments. NonStop remains at the operational core of many of the world’s largest companies, and is an important part of the HPE server strategy. We continue to invest in Prognosis for Nonstop to be aligned with HPE and its customers.
New customers continue to adopt UC applications such as audio and video conferencing, instant messaging, collaboration, mobility and tele-presence, and the number of transactions and multi-party collaboration events is growing rapidly across enterprises worldwide. We anticipate further growth in this segment as customer migrate away from legacy platforms to modern, flexible and collaboration-enabled solutions that provide greater communication efficacy than
voice alone. UC networks are becoming more pervasive, more mission critical and more complex and as such they require effective performance and user experience management. This complexity and high performance demand generates a need for solutions such as Prognosis, and we therefore expect to benefit from this need in terms of further growth. The company will continue to invest in R&D to expand the suite of Prognosis for UC products to cover more platforms, vendors and applications, and by doing so increase the Company’s addressable market and revenue potential. This includes vendors providing ‘Unified Communications as a Service’, for example Microsoft Teams and Cisco Webex Teams.
Prognosis has been used worldwide to monitor voice and video quality and performance for Cisco UC solutions since 2000. Whilst we initially competed directly with Cisco’s own monitoring solution, our success in selling to and managing many large and complex Cisco implementations paved the way to IR joining Cisco’s elite SolutionsPlus program in the second half of FY18. This is Cisco’s partner ecosystem and online marketplace that enables their global channel partners to select and buy the best technologies that support Cisco products, in order to build and deploy the best and most scalable solutions for their customers.
Microsoft’s Skype for Business is now one of the leading global UC solutions for both enterprises and service providers. IR has capitalised on this growth by introducing three Microsoft-specific products, which are now widely used by a proportional share of our customer base, alongside our Cisco and Avaya solutions. Prognosis UC Assessor is our Microsoft-certified cloud-delivered product that provides a comprehensive, end-to-end assessment and troubleshooting solution for customers migrating to Skype for Business, be that in the cloud, hybrid or on-premises. Microsoft partners and customers rely on this software-as-a-service
platform to assess and plan their Skype for Business or Teams infrastructure implementation, which both increases our revenue opportunities earlier in the lifecycle and provides a natural move to using Prognosis as the core monitoring solution for their UC environment.
Microsoft continues to support Skype for Business on-premise, and have also incorporated this core technology into their Office 365 Teams cloud-based collaboration platform. Through our close partnership with Microsoft and our reputation as a leading vendor in the Microsoft ecosystem, IR is well positioned to support customers regardless of which deployment platform they choose; cloud, hybrid or on-premises.
Due to both general economic growth and the explosion in the use of pin-less card transactions such as Paywave and Paypass, payment transaction volumes have grown massively across all of our markets, placing enormous demand on our customers’ infrastructure and therefore increased reliance on Prognosis. We have expanded our suite of Payments solutions by adding new data and analytics capabilities; this expands the company’s addressable market in the Payments segment and increases revenue potential. We will maintain this strategy in the Payments market and work with its leading customers and partners to support the adoption of new payments types. The strategic alliance with ACI, a global leader in the payments market, continues to support our Payments business.
IR Professional Services provide Prognosis customers with implementation, customisation and training services to ensure that they get the most out of their investment in Prognosis. Professional Services also help IR configure unique and repeatable solutions that extend the use and value of Prognosis. The Company will continue to invest in people and processes to grow professional services revenue and margin.
Outlook and strategy for 2020 (continued)
For
per
sona
l use
onl
y

Integrated Research and its controlled entities Annual Report 2019 17
Due to scalability, reliability and ultimately the business insight it provides, Prognosis has proven to be a ‘sticky’ solution, with maintenance retention rates continuing to be maintained at 95%. To ensure that our customers obtain highest economic benefit from Prognosis, we have built a service and support culture that maximizes adoption within our customer base and focusses on delivering their critical success criteria and subsequently the high levels of satisfaction and advocacy. This approach naturally results in a high level of renewal and expansion of share of wallet. Analysis of the Company’s customer base of enterprise customers shows significant potential to cross-sell. Prognosis is a modular solution and customers will typically purchase only a small subset of those modules on their initial purchase. Subsequent purchases may include additional solutions such as Reporting and Analytics, Video Management, Testing solutions, Contact Centre and Call Recording Assurance to name some of the most commonly applicable.
The foundations of our business model are extremely strong.
With close to 90% of our revenue now recurring as multi-year deals, strong retention rates coupled with the expansion of our share of customer wallet, contributes significantly to strong future earnings. We have a proven our capability to acquire new customers, adding 26 new logos during the 2019 financial year. Our continued focus on new customer acquisition and our long-term cloud roadmap are significant factors that management expects to support growth through the financial year ending 30 June 2020 and beyond.
For
per
sona
l use
onl
y

Integrated Research and its controlled entities Annual Report 201918
Directors’ report
Peter LloydMAICDIndependent Non‑Executive Director
Board of DirectorsThe directors of the Company at any time during or since the end of the financial year are listed below:
Paul was appointed a Director in August 2015 and elected Chairman in November 2018. He has worked in the information technology industry for over 30 years and has broad experience in hardware, services and software. He has previously held the positions of Vice President and Managing Director of Hewlett-Packard South Pacific plus Vice President and Managing Director of Compaq South Pacific. From 2001 to 2012, Paul was a member of the International CEO Forum (Australia) and served as a Director of the Australian Information Industry Association (AIIA) from 2002 to 2011. Mr Brandling was previously a Director of Amcom Telecommunications Limited until its acquisition by Vocus and was a Director of Vocus Communications Limited until February 2016. He was a Director of Tesserent Limited (ASX: TNT) until October 2017 and a Director of Avoka Technologies Pty Ltd until December 2018. He currently serves as a Non-Executive Director of Infomedia Ltd (ASX: IFM). Paul’s current term will expire no later than the close of the 2021 Annual General Meeting.
Listed company directorships held in the past three years other than listed above: None.
Nick was appointed as a Director in September 2014. Mr. Abrahams is highly experienced in corporate, intellectual property and international law pertaining to the technology industry, with over 20 years’ experience as a private practice lawyer. He has worked extensively internationally representing Australian high-tech companies as well as working for three years with a law firm in Japan. Mr Abrahams also spent time working in the United States in the late nineties and was an executive with Warner Brothers in Los Angeles, followed by a period as a senior executive at listed technology company, Spike Networks, also in Los Angeles. Mr Abrahams returned to legal practice in 2002 and is a partner of and is global leader for the technology and innovation practice of a global law firm. Mr. Abrahams is on the Board of the Vodafone Foundation, on the Board of Sydney Film Festival and is a Director of the Garvan Research Foundation. Nick’s current term will expire no later than the close of the 2020 Annual General Meeting.
Listed company directorships held in the past three years other than listed above: None.
Nick AbrahamsB Comm, LLB (Hons), MFANon‑Executive Director
Paul BrandlingBSc Hons, MAICDIndependent Non‑Executive Director and Deputy Chairman
Garry DinnieBCom, FCA, FAICD, FAIM, MIIA (Aust)Independent Non‑Executive Director
Garry was appointed a Director in February 2013. He is a Director & Chair of the Audit & Risk Committee of CareFlight Limited, Australian Settlements Limited and a Director of a number of private companies. He is also the Chair or member of a number of Audit & Risk Committees of NSW public sector and private sector entities. He was previously a partner with Ernst & Young for 25 years specialising in audit, advisory and IT services. Garry’s current term will expire no later than the close of the 2019 Annual General Meeting.
Garry is currently Chair of Integrated Research’s Audit & Risk Committee and Nomination and Remuneration Committee.
Listed company directorships held in the past three years other than listed above: None.
Peter was appointed Director in July 2010. He has over 45 years’ experience on computing technology, having worked for both computer hardware and software providers. For the past 35 years, Peter has been specifically involved in the provision of payments solutions for banks and financial institutions. He is currently the proprietor of The Grayrock Group Pty Ltd, a management consultancy company focusing on the payments industry. Peter is a Non-Executive Director of privately held Taggle Pty Ltd., a Non-Executive Director of Flamingo AI Limited (ASX: FGO) and a Non Executive Director of identitii Ltd (ASX:ID8). Peter’s current term will expire no later than the close of the 2019 Annual General Meeting.
Peter is currently Chair of Integrated Research’s Strategy Committee.
Listed company directorships held in the past three years other than listed above: None.
For
per
sona
l use
onl
y

Integrated Research and its controlled entities Annual Report 2019 19
Steve KilleleaAM Non‑Executive Director and Chairman
Steve retired as Chairman and Director of Integrated Research in November 2018.
Steve founded Integrated Research in August 1988 and held the position of Managing Director and Chief Executive Officer until retiring from his executive position in November 2004. He was appointed as a Non-Executive Director in November 2004 and elected Chairman in July 2005. Steve is also Chairman of the Institute for Economics and Peace, Smarter Capital and The Charitable Foundation and for activities involved with these he has received a number of international awards including the Order of Australia and Luxemburg Peace Prize.
Listed company directorships held in the past three years: None.
John was Managing Director and Chief Executive Officer between September 2017 and February 2019.
John is a veteran of the digital industry with 25 years of experience working in technology and digital companies. This includes extensive experience in commercialising technologies as an entrepreneur, consultant, Managing Director, CEO and General Manager of various companies. Prior to joining IR, John was the General Manager of Seek Learning (the education arm of Seek Ltd) and was previously the Managing Director of Experian ANZ, having served as its Managing Director of Marketing Services Asia-Pacific for 5 years.
Listed company directorships held in the past three years: None.
John MerakovskyB.Sc (Hons) PhDManaging Director and Chief Executive Officer
Anne was appointed as a Director in July 2018. Ms. Myers has worked in the finance and technology industry for over 30 years with experience in business strategy, technology, digital innovation and operational functions. Anne is the former Chief Operating Officer and CIO of ING Direct Australia and has acted in executive technology and business roles for QBE, Macquarie Bank and St George Bank. She currently acts as an advisory board member to early phase technology innovators, including TokenOne Pty Limited, is a director of Defence Bank Limited and United Way Australia Limited and is a Council Member of the University of New England. Ms. Myers has also worked in the not for profit sector for United Way Australia, and was a member of the Industry Advisory Network for the University of Technology. Anne’s current term will expire no later than the close of the 2021 Annual General Meeting.
Listed company directorships held in the past three years other than listed above: None.
David was appointed Company Secretary in July 2012. David was also the Company’s Global Commercial Manager until his retirement in July 2016. Prior to this, David spent three years at Integrated Research’s Colorado office to manage the Americas finance operations. David is a Chartered Accountant and Chartered Secretary with over 30 years’ experience in both professional practice and industry.
Anne MyersMBA, GAICDIndependent Non‑Executive Director
Company Secretary
David PurdueBEc, MBA, Grad Dip CSP, FCA, FGIA, FCIS, GAICD
Resigning Directors during the year
For
per
sona
l use
onl
y

Integrated Research and its controlled entities Annual Report 201920
Directors’ report
Senior managementJohn Ruthven B.EdChief Executive Officer
John Ruthven joined IR in July 2019 as the Company’s Chief Executive Officer. John is an internationally experienced software industry executive respected for his strategic approach and operational expertise across global enterprises. John has over 20 years’ experience working in the technology industry with a proven track record of leadership and delivering strong profitable growth. Most recently, John was the Operating Officer - Global Sales at TechnologyOne. Prior to that John was President & Managing Director ANZ of SAP, SVP International Sales at Zuora Inc, and held various senior positions at CA Technologies and Computer Associates Inc. John has extensive international experience in the USA, Europe and Asia Pacific regions.
Peter AdamsB.Com, CAChief Financial Officer
Peter joined Integrated Research in March 2008 and is responsible for overseeing the Company’s finance and administration, including regulatory compliance and investor relations. Peter is a Chartered Accountant with over 25 years experience. He has held a number of senior accounting and finance roles, including seven years as CFO with Infomedia (an ASX-listed technology company), six years with Renison Goldfields (ex ASX top 100 Resources Company) and two years with Transfield Pty Ltd. Peter’s career began with Arthur Andersen, where he was responsible for managing large audit clients.
Jason BarkerBA (hons) Senior Vice President, Asia Pacific, Middle East & Africa
Jason joined IR in October 2014 and is responsible for all business operations across the Asia Pacific, Middle East & Africa regions. Jason joins with 20 years’ experience in Technology, Media & Telecommunications most recently as Vice President Sales, Asia Pacific at Acision where, based out of Singapore, he was responsible for leadership of the Sales team across the region. Prior to this Jason spent 5 years in Australia leading Asia Pacific teams with Subex and Surfkitchen and before this held several European focussed roles, based out of the UK.
Greg Clancy B.App.Sc (CompSc)(Hons), MCS, D.E.S.S. (AI) Chief Product Officer
Greg joined IR in July 2018 and is responsible for the strategy, delivery, and commercialisation of the IR’s product and platform portfolio. With more than 20 years of senior product leadership at global enterprise software companies Greg is a champion of technology innovation and setting product vision and strategy for industry defining impact. Most recently he was based in Silicon Valley, California responsible for transforming Ivanti to the cloud while injecting innovation around analytics, machine learning, bots, and automation.
Matt Glasner B.Eng (Hons), GAICDChief Commercial Officer
Matt is a seasoned business leader and Non-Executive Director with 20 years of successful sales, management and leadership experience. Matt’s previous roles include Managing Director South APAC for First Advantage and Managing Director Experian Marketing Services ANZ. Matt brings solid strategic and tactical expertise across sales and marketing, operations, offshoring, organisational structure, change management and leadership. Matt graduated from the University of Birmingham, England with a Bachelor of Engineering (honors) and is a Graduate of the Australian Institute of Company Directors.
Kevin Ryder M.Mgt, MBA, GAICD Chief Marketing and Customer Officer
Kevin joined IR in October 2013 and is responsible for global brand, marketing and customer experience. He has extensive experience in the ICT industry, including leadership roles in Europe, North America, Asia and Australia. Prior to joining IR, Kevin was the Enterprise Marketing Director at Microsoft and has previously held senior executive roles at KAZ Group, Attachmate and Eicon Technology. Kevin was ranked #18 by CMO Magazine in the 2015 CMO50 list, recognising Australia’s most innovative chief marketing officers.
For
per
sona
l use
onl
y
Integrated Research and its controlled entities Annual Report 2019 21
The directors present their report together with the Financial Statements of Integrated Research Limited (“the consolidated entity”), being the Company and its controlled entities, for the year ended 30 June 2018 and the Auditor’s Report thereon.
ResultsThe net profit of the consolidated entity for the 12 months ended 30 June 2019 after income tax expense was $21.9 million.
DividendsDividends paid or declared by the Company since the end of the previous financial year were:
Cents Per share
Total Amount $’000
Date of Payment
Final 2018 - Ordinary shares 100% franked 3.5 6,012 16 Oct 2018
Interim 2019 - Ordinary shares 100% franked 3.5 6,015 16 Apr 2019
Final 2019 - Ordinary shares 100% franked 3.75 6,445 15 Oct 2019
Events subsequent to reporting dateFor dividends declared after 30 June 2019 see Note 22 in the financial statements. The financial effect of dividends declared and paid after 30 June 2019 has not been brought to account in the financial statements for the year ended 30 June 2019 and will be recognised in subsequent financial statements.
Future developmentsLikely developments in the operations of the consolidated entity in future financial years and the expected results of those operations are referred to generally in the Review of Operations and Activities Report.
Further information on likely developments including expected results would be in the Directors’ opinion, result in unreasonable prejudice to the Company and has therefore not been included in this Report.
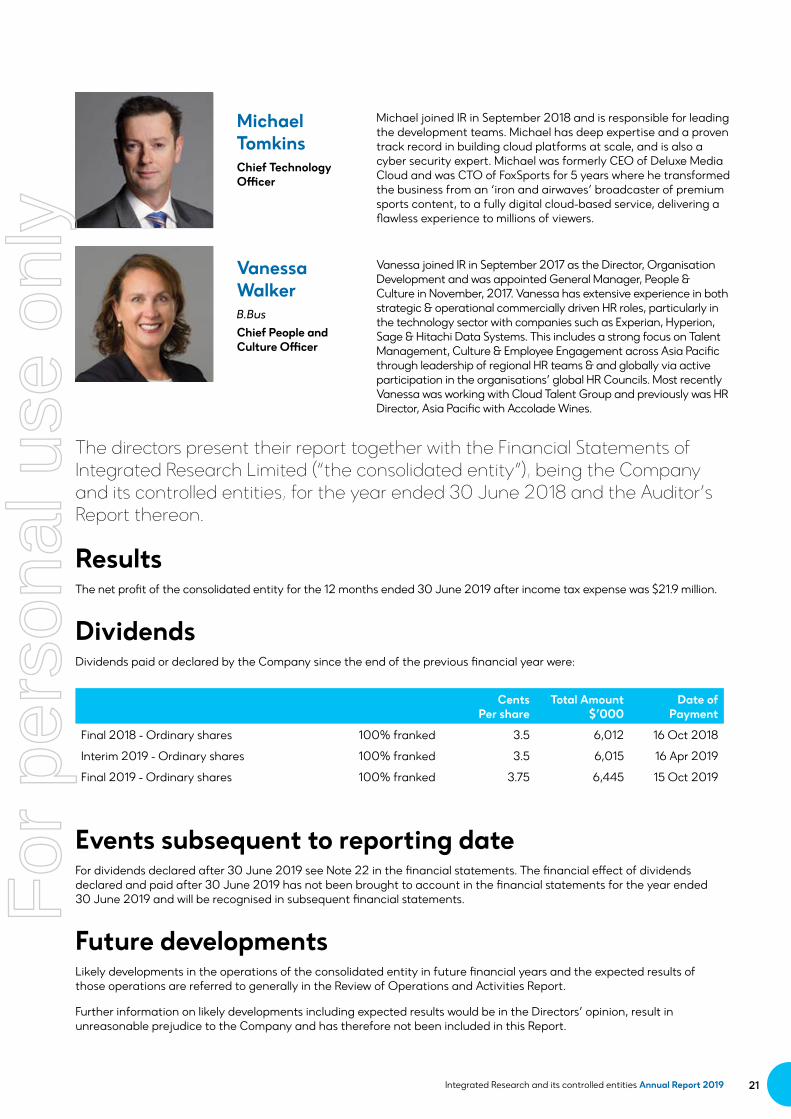
Michael Tomkins Chief Technology Officer
Michael joined IR in September 2018 and is responsible for leading the development teams. Michael has deep expertise and a proven track record in building cloud platforms at scale, and is also a cyber security expert. Michael was formerly CEO of Deluxe Media Cloud and was CTO of FoxSports for 5 years where he transformed the business from an ‘iron and airwaves’ broadcaster of premium sports content, to a fully digital cloud-based service, delivering a flawless experience to millions of viewers.
Vanessa Walker B.Bus Chief People and Culture Officer
Vanessa joined IR in September 2017 as the Director, Organisation Development and was appointed General Manager, People & Culture in November, 2017. Vanessa has extensive experience in both strategic & operational commercially driven HR roles, particularly in the technology sector with companies such as Experian, Hyperion, Sage & Hitachi Data Systems. This includes a strong focus on Talent Management, Culture & Employee Engagement across Asia Pacific through leadership of regional HR teams & and globally via active participation in the organisations’ global HR Councils. Most recently Vanessa was working with Cloud Talent Group and previously was HR Director, Asia Pacific with Accolade Wines.
For
per
sona
l use
onl
y

Integrated Research and its controlled entities Annual Report 201922
Directors’ report
Directors and Company SecretaryDetails of current directors’ qualifications, experience and special responsibilities are set out on pages 18 to 19. Details of the company secretary and his qualifications are set out on page 19.
Officers who were previously partners of the audit firmNo officers of the Company were partners of the current audit firm during the financial year.
Directors’ meetingsThe numbers of meetings of the Company’s board of directors and of each board committee held during the year ended 30 June 2019, and the numbers of meetings attended by each director were:
Board Meetings
Audit and Risk Committee Meetings
Nomination and Remuneration
Committee Meetings
Strategy Committee Meetings
A B A B A B A B
Nick Abrahams 22 23 4 4 - - - -
Paul Brandling 23 23 1 1 2 2 3 3
Garry Dinnie 23 23 4 4 3 3 - -
Peter Lloyd 23 23 - - - - 3 3
Steve Killelea 4 5 - - 1 1 - -
Anne Myers 21 22 3 3 - - 3 3
John Merakovsky 13 13 - - - - - -
A: Number of meetings attended.
B: Number of meetings held during the time the directors held office or was a member of the board or committee during the year.
State of affairsIn the opinion of the directors there were no significant changes in the state of affairs of the consolidated entity that occurred during the financial year under review.
Environmental regulationThe consolidated entity’s operations are not subject to significant environmental regulations under either Commonwealth or State legislation.
Directors’ interestsThe relevant interest of each director in the shares, options or performance rights over ordinary shares issued by the companies in the consolidated entity and other relevant bodies corporate, as notified by the directors to the Australian Securities Exchange in accordance with S205G(1) of the Corporations Act 2001, at the date of this report is as follows:
Ordinary shares in Integrated Research OptionsPerformance
rights
Directly heldBeneficially
held Total Number of options Number of rights
Paul Brandling 10,202 25,104 35,306 - -
Nick Abrahams - 13,446 13,446 - -
Garry Dinnie - 9,000 9,000 - -
Peter Lloyd - 27,000 27,000 - -
Anne Myers - - - - -
For
per
sona
l use
onl
y

Integrated Research and its controlled entities Annual Report 2019 23
Share options and performance rightsOptions and performance rights granted to directors and senior executivesDuring or since the end of the financial year, the Company granted performance rights for no consideration over unissued ordinary shares in Integrated Research Limited to the following named directors and executive officers of the consolidated entity as part of their remuneration:
Number of performance
rights grantedPerformance
hurdle Exercise price Expiry date
Executive Officers
Peter Adams 22,000 No Nil Aug 2021
67,988 No Nil Feb 2022
40,000 No Nil Feb 2021
40,000 No Nil Aug 2022
Matt Glasner 22,000 No Nil Feb 2022
Kevin Ryder 15,000 No Nil Aug 2021
The performance rights were granted under the Integrated Research Performance Rights and Option Plan (established November 2011).
Unissued shares under performance rightsUnissued ordinary shares of Integrated Research Limited under performance rights at the date of this report are as follows:
Performance rights
Expiry date Exercise price Number of shares
Aug 2020 Nil 70,000
Sep 2020 Nil 309,000
Aug 2021 Nil 98,000
Oct 2021 Nil 184,250
Feb 2021 Nil 40,000
Feb 2022 Nil 89,988
Aug 2022 Nil 40,000
Total performance rights 831,238
Performance rights do not entitle the holder to participate in any share issue of the Company or any other body corporate.
Indemnification and insurance of officers and auditorsIndemnificationThe Company has agreed to indemnify the directors of the Company on a full indemnity basis to the full extent permitted by law, for all losses or liabilities incurred by the director as an officer of the Company including, but not limited to, liability for negligence or for reasonable costs and expenses incurred, except where the liability arises out of conduct involving a lack of good faith.
To the extent permitted by law, the Company has agreed to indemnify its auditors, Ernst &Young Australia, as part of the terms of its audit engagement agreement against claims by third parties arising from the audit (for an unspecified amount). No payment of this type has been made to Ernst & Young during or since the financial year.
For
per
sona
l use
onl
y
Integrated Research and its controlled entities Annual Report 201924
Directors’ report
InsuranceDuring the financial year Integrated Research Limited paid a premium to insure the directors and executive officers of the consolidated entity and related bodies corporate.
The liabilities insured include costs and expenses that may be incurred in defending civil or criminal proceedings that may be brought against officers in their capacity as officers of the consolidated entity.
Remuneration reportThe Company’s Remuneration Report, which forms part of this Directors’ Report, is on pages 25 to 33.
Corporate governanceA statement describing the Company’s main corporate governance practices in place throughout the financial year is on pages 35 to 41.
Non‑audit servicesDuring the year Ernst and Young, the Company’s auditor, has performed certain other services in addition to their statutory duties.
The board has considered the non-audit services provided during the year by the auditor and in accordance with written advice provided by resolution of the Audit & Risk Committee, is satisfied that
the provision of those non-audit services during the year by the auditor is compatible with, and did not compromise, the auditor independence requirements of the Corporations Act 2001 for the following reasons:
• All non-audit services were subject to the corporate governance procedures adopted by the Company and have been reviewed by the Audit & Risk Committee to ensure they do not impact the integrity and objectivity of the auditor, and
• The non-audit services provided do not undermine the general principles relating to auditor independence as set out in Professional Statement F1 Professional independence, as they did not involve reviewing or auditing the auditor’s own work, acting in a management or decision making capacity for the Company, acting as an advocate for the Company or jointly sharing risks and rewards.
A copy of the auditors’ independence declaration as required under Section 307C of the Corporations Act is on page 86 and forms part of the Directors’ Report.
AuditorThe Board granted approval under section 324DAA of the Corporations Act for Mr John Robinson to continue as lead auditor, to play a significant role in the audit of the Company for two additional successive financial years being the year ended 30 June 2018 and year ending 30 June 2019. The approval was granted in accordance with
a recommendation from the Audit & Risk Committee who were satisfied the approval is consistent with maintaining the quality of the audit provided to the Company and would not give rise to a conflict of interest situation (as defined under 324CD of the Corporations Act).
The decision is supported by the Audit & Risk Committee’s satisfaction with the quality of Ernst & Young and Mr Robinson’s work as auditor and that the Company maintains, and will continue to maintain, robust auditor independence policies and controls to ensure the independence of the auditor is maintained.
The Board granted approval for the reappointment of Ernst & Young as the Company auditor for a further five years beyond 30 June 2019. The approval was granted after the recommendation to the Board by the Audit & Risk Committee, following the completion of a thorough tender process.
Rounding of amounts to nearest thousand dollars The Company is of a kind referred to in ASIC Corporations Instrument 2016/191 and in accordance with that Class order, amounts in the Financial Statements and the Directors’ Report have been rounded off to the nearest thousand dollars, unless otherwise stated.
This report is made in accordance with a resolution of the directors.
Paul Brandling Chairman
Garry Dinnie Director
Dated at North Sydney this 22nd day of August 2019
For
per
sona
l use
onl
y

Integrated Research and its controlled entities Annual Report 2019 25
Remuneration policies Remuneration levels for key management personnel and secretaries of the Company, and relevant key management personnel of the consolidated entity are competitively set to attract and retain appropriately qualified and experienced directors and senior executives. The Nomination and Remuneration Committee obtains independent advice on the appropriateness of remuneration packages given trends in comparative companies both locally and internationally and the objectives of the Company’s remuneration strategy.
Key management personnel (including directors) have authority and responsibility for planning, directing and controlling the activities of the Company and the consolidated entity.
The remuneration structures explained below are designed to attract suitably qualified candidates, reward the achievement of strategic objectives, and achieve the broader outcome of creation of value for shareholders. The remuneration structure takes into account:
• The capability and experience of the directors and senior executives
• The directors and senior executives’ ability to control the relevant segment’s performance
• The consolidated entity’s performance including:
- The consolidated entity’s earnings
- The growth in share price and returns on shareholder wealth
Remuneration packages include a mix of fixed and variable remuneration and short and long-term performance based incentives.
Fixed remuneration Fixed remuneration consists of base remuneration (which is calculated on a total cost basis and includes any fringe benefits tax (FBT) related to employee benefits including motor vehicles), as well as employer contributions to superannuation funds.
Remuneration levels are reviewed annually through a process that considers individual, segment and overall performance of the consolidated entity. In addition, external remuneration surveys provide periodic analysis to ensure the directors’ and senior executives’ remuneration is competitive in the market place. A senior executive’s remuneration is also reviewed on promotion.
Performance‑linked remuneration Performance linked remuneration includes both short-term and long-term incentives and is designed to reward executive directors and senior executives for exceeding their financial and personal objectives. The short-term incentive (STI) is an “at risk” bonus provided in the form of cash, while the long-term incentive (LTI) is provided as either options or performance rights over ordinary shares of Integrated Research Limited under the rules of the share plans.
Short‑term incentive bonus
The Nomination and Remuneration Committee is responsible for setting the key performance indicators (KPIs) for the Chief Executive Officer, and for approving the KPIs for the senior executives who report to him. The KPIs generally include measures relating to the consolidated entity, the relevant segment, and the individual, and include financial, people, customer, strategy and risk measures. The measures are
chosen as they directly align the individual’s reward to the KPIs of the consolidated entity and to its strategy and performance.
The financial performance objectives vary with position and responsibility and are aligned with each respective year’s budget. The non-financial objectives vary with position and responsibility and include measures such as achieving strategic outcomes and staff development.
At the end of the financial year the Nomination and Remuneration Committee assesses the actual performance of the CEO against the KPIs set at the beginning of the financial year. A percentage of the predetermined maximum amounts for each KPI is awarded depending on results. The committee recommends the cash incentive to be paid to the CEO for approval by the board.
Long‑term incentive
Prior to the 2012 financial year, options were issued to executive directors and other senior executives under the Employee Share Option Plan. In November 2011, the Company established a new plan titled Integrated Research Performance Rights and Options Plan (“IRPROP”). Performance rights are issued to executive directors and other senior executives under the IRPROP. The ability of executive directors to exercise either options or performance rights is conditional on the consolidated entity achieving certain profit after tax (PAT) performance hurdles over the vesting period. PAT was considered the most appropriate performance hurdle given its intrinsic link to creating shareholder wealth. Performance hurdles are tested at each vesting date.
Remuneration report (audited)
For
per
sona
l use
onl
y

Integrated Research and its controlled entities Annual Report 201926
Remuneration report (audited)
Consequences of performance on shareholder wealth In considering the consolidated entity’s performance and benefits for shareholder wealth, the Nomination and Remuneration Committee has regard to the following indices in respect of the current financial year and the previous four financial years:
2019 2018 2017 2016 2015
Licences ($’000) 62,774 52,591 53,441 45,725 41,031
Net profit ($’000) 21,851 19,180 18,520 16,029 14,251
Dividends paid ($’000) 12,027 11,137 11,088 11,906 10,162
Closing share price $3.30 $3.11 $3.22 $2.25 $1.69
Change in share price $0.19 ($0.11) $0.97 $0.56 $0.695
Net profit and licence sales are considered in setting the STI and LTI, as two of the financial performance targets are profit after tax and new licences. The Nomination and Remuneration Committee considers that the above performance linked structure is generating the desired outcomes.
Key management personnelThe following were key management personnel of the consolidated entity at any time during the reporting period and unless otherwise indicated were key management personnel for the entire period:
Directors
Full year Paul Brandling Deputy Chairman (to 31 October 2018); Chairman (from 1 November 2018)
Nick Abrahams
Peter Lloyd
Garry Dinnie
Part year Steve Killelea Chairman (retired 1 November 2018)
John Merakovsky Chief Executive Officer (resigned 18 February 2019)
Anne Myers (appointed 12 July 2018)
Other key management personnel
Full year Peter Adams - Chief Financial Officer (to 17 February 2019); Interim Chief Executive Officer (from 18 February 2019)
Kevin Ryder Chief Marketing and Customer Officer
Part year Matt Glasner Chief Commercial Officer (from 1 January 2019)
Jason Barker Senior Vice President Asia Pacific (to 31 December 2018)
Andre Cuenin President Americas & VP European Field Operations (to 4 January 2019)
For
per
sona
l use
onl
y

Integrated Research and its controlled entities Annual Report 2019 27
Service agreements Service contracts for current executive directors and current senior executives are unlimited in term but capable of termination by either party according to a period specified in the employment contract and the consolidated entity retains the right to terminate the contract immediately by payment in lieu of notice or a severance payment or an amount for redundancy equal to the scale of payments prescribed in the NSW Employment Protection Act.
Mr Peter Adams, Chief Financial Officer
Has a contract of employment with Integrated Research Limited dated 23 January 2008 with subsequent amendments dated 20 December 2018, which provides for specific notice and severance undertakings of up to six months compensation depending on the particular circumstances. Further, other than on a temporary basis, if Mr Adams status or responsibilities are materially diminished, including not holding the most senior finance role within the company or requiring permanent relocation to another office, the notice period is 12 months. Mr Adams can terminate his employment by giving between three to six months prior notice in writing depending upon the particular circumstances.
Mr Jason Barker, Senior Vice President APAC
Has a contract of employment with Integrated Research Singapore Pte Limited dated 21 August 2014 and amended 11 April 2018 which provides for specific notice and severance undertakings of up to three months compensation depending on the particular circumstances. Mr Barker can terminate his employment by giving three months prior notice in writing.
Mr Andre Cuenin, President Americas
Had a contract of employment with Integrated Research Inc dated 22 September 2008, which provides for specific notice and severance undertakings of one month’s compensation depending on the particular circumstances.
Mr Cuenin could terminate his employment by giving one month’s prior notice in writing.
Mr John Merakovsky, Chief Executive Officer
Had a contract of employment with Integrated Research Limited dated 9 June 2017, which provides for specific notice and severance undertakings of up to three months compensation depending on the particular circumstances.
Mr Merakovsky could terminate his employment by giving three months prior notice in writing.
Mr Kevin Ryder, Chief Marketing & Customer Officer
Has a contract of employment with Integrated Research Limited dated 14 October 2013 and amended 26 September 2018, which provides for specific notice and severance undertakings of three months compensation depending on the particular circumstances. Mr Ryder can terminate his employment by giving three months prior notice in writing.
Non‑executive directors Total remuneration for all non-executive directors last voted upon at the Annual General Meeting in November 2013 is not to exceed $750,000 per annum.
Director’s base fees during the financial year were $90,000 per annum inclusive of compulsory superannuation. The chairman receives the base fee by a multiple of two and the deputy chairman receives the base fee by a multiple of one and a half. Director’s fees cover all main board activities and committee membership. Directors receive $10,000 per committee of which they are chair. Directors can elect to salary sacrifice their directors fees into superannuation.
Non-executive directors do not receive performance related compensation or retirement benefits.
For
per
sona
l use
onl
y

Integrated Research and its controlled entities Annual Report 201928
Remuneration report (audited)
Directors’ and executive officers’ remuneration Details of the nature and amount of each major element of the remuneration of each of the key management personnel, director of the Company and each of the executives and relevant group key management executives are reported below.
The estimated value of options and performance rights disclosed is calculated at the date of grant using the Black-Scholes methodology, adjusted to take into account the inability to exercise options during the vesting period. Further details of options and performance rights granted during the year are set out below.
“Executive officers” are officers who are involved in, or who take part in, the management of the affairs of Integrated Research Limited and/or related bodies corporate. Remuneration for overseas-based employees has been translated to Australian dollars at the average exchange rates for the year.
No director or executive appointed during the year received a payment as part of his or her consideration for agreeing to hold the position.
Short term
Post‑ em‑
ploy‑ment
Long term
Share‑based
pay‑ments
Other com‑
pensa‑tion
Pro‑por‑
tion of remu‑nera‑tion
Short term
2019In AUD
Salary & fees
$Bonus
$
Non‑cash
benefits$
Super‑annua‑
tioncontri‑bution
$
Long service
leave$
Value of options
and rights1
$
Termi‑nation
benefit$
Total$
Perfor‑mance related
Value of
options and
rights
Directors
Non‑executive
Paul Brandling 150,685 ‑ ‑ 14,315 ‑ ‑ ‑ 165,000 0% 0%
Steve Killelea2 58,506 ‑ ‑ 5,558 ‑ ‑ ‑ 64,064 0% 0%
Nick Abrahams 82,192 ‑ ‑ 7,808 ‑ ‑ ‑ 90,000 0% 0%
Garry Dinnie 100,457 ‑ ‑ 9,543 ‑ ‑ ‑ 110,000 0% 0%
Peter Lloyd 88,280 ‑ ‑ 8,387 ‑ ‑ ‑ 96,667 0% 0%
Anne Myers2 79,390 ‑ ‑ 7,542 ‑ ‑ ‑ 86,932 0% 0%
Executive
John Merakovsky2 308,113 83,334 ‑ 11,977 6,726 (341,299) 24,267 93,118 89% 0%
Executive officers (excluding directors)
Peter Adams 390,973 129,111 4,532 20,531 9,089 73,248 ‑ 627,484 21% 12%
Jason Barker2 190,639 70,157 ‑ 11,638 ‑ 24,899 ‑ 297,333 24% 8%
Andre Cuenin2 192,715 277,993 15,106 1,922 ‑ (1,136) 42,281 528,881 53% 0%
Matt Glasner2 229,734 120,178 ‑ 10,266 6,005 7,385 ‑ 373,568 32% 2%
Kevin Ryder 280,369 100,948 ‑ 20,531 6,700 24,539 ‑ 433,087 23% 6%
Total compensation: key management (consolidated, including directors)
2,152,053 781,721 19,638 130,018 28,520 (212,364) 66,548 2,966,134
1 Negative figure reflects lapsing and/or forfeiture of performance rights during the financial year
2 Reflects remuneration for the period the individual was determined to be Key Management Personnel only
For
per
sona
l use
onl
y

Integrated Research and its controlled entities Annual Report 2019 29
Short term
Post‑ em‑
ploy‑ment
Long term
Share‑based
pay‑ments
Other com‑
pensa‑tion
Pro‑por‑
tion of remu‑nera‑tion
Short term
2018In AUD
Salary & fees
$Bonus
$
Non‑cash
benefits$
Super‑annua‑
tioncontri‑bution
$
Long service
leave$
Value of options
and rights
$
Termi‑nation
benefit$
Total$
Perfor‑mance related
Value of
options and
rights
Directors
Non‑executive
Nick Abrahams 68,493 - - 6,507 - - - 75,000 - -
Paul Brandling (Deputy Chairman)
75,832 - - 7,204 - - - 83,036 - -
Garry Dinnie 68,493 - - 6,507 - - - 75,000 - -
Peter Lloyd 68,493 - - 6,507 - - - 75,000 - -
Steve Killelea (Chairman) 136,986 - - 13,014 - - - 150,000 - -
Executive
John Merakovsky 462,106 82,460 - 19,213 9,400 341,299 - 914,478 9% 37%
Executive officers (excluding directors)
Peter Adams 310,419 68,524 4,532 20,049 6,728 17,062 - 427,314 16% 4%
Alex Baburin (to October 2017) 322,096 - - 12,346 5,576 - - 340,018 - -
Jason Barker 346,000 226,795 2,779 22,437 - 39,686 - 637,697 36% 6%
Andre Cuenin 349,672 377,658 12,615 10,415 - 49,565 - 799,925 47% 6%
Andrew Dutton1 (to July 2017) 66,000 - - - - - 66,000 - -
Kevin Ryder 270,906 77,910 1,900 26,393 6,288 12,797 - 396,194 20% 3%
Total compensation: key management (consolidated, including directors)
2,545,496 833,347 21,826 150,592 27,992 460,409 - 4,039,662
1 Mr Andrew Dutton was appointed as the Company’s interim CEO. The amounts disclosed above reflect the cost to the Company for services rendered that were billed through an independent third party agent. The amounts disclosed therefore do not necessarily reflect the amounts received by Mr Dutton.
For
per
sona
l use
onl
y

Integrated Research and its controlled entities Annual Report 201930
Remuneration report (audited)
Analysis of bonuses included in remuneration Details of the vesting profile of the short-term incentive cash bonuses awarded as remuneration to each director of the Company and each of the named Company executives and relevant group executives are detailed below:
Short term incentive bonuses
Included in remuneration
$ (A)% vested in
year
% forfeited in year
(B)
Directors
John Merakovsky 83,334 40% 60%
Executives
Peter Adams 129,111 87% 13%
Jason Barker 70,157 56% 44%
Andre Cuenin 277,993 55% 45%
Matthew Glasner 120,178 96% 4%
Kevin Ryder 100,948 110% 0%
A) Amounts included in remuneration for the financial year represents the amount that vested in the financial year based on achievement of personal goals and satisfaction of specified performance criteria. No amounts vest in future financial years in respect of the short-term incentive bonus scheme for the 2019 financial year.
B) The amounts forfeited are due to the performance or service criteria not being met in relation to the current financial year.
For
per
sona
l use
onl
y

Integrated Research and its controlled entities Annual Report 2019 31
Equity instruments All options refer to options over ordinary shares of Integrated Research Limited, which are exercisable on a one-for-one basis under the Employee Share Option Plan (ESOP).
Options and rights over equity instruments granted as compensationNo options have been granted to named executives either during or since the end of the financial year. Performance rights granted as compensation are listed in the table below.
Analysis of rights over equity instruments granted as compensation
Performance rights grantedValue yet to vest or
value vested ($)
Number Date
Fair value per share
($)
Percent vested in
year
Percent forfeited
in year (A)
Financial year in which grant
expiresMin(B)
Max(C)
Directors
John Merakovsky 210,000 Nov-17 3.595 - 100% 2021 - -
Executives
Peter Adams 20,000 Sep-17 3.178 - - 2021 nil 63,558
22,000 Sep-18 2.265 - - 2021 nil 49,823
67,988 Jan-19 2.286 - - 2022 nil 155,418
40,000 Feb-19 2.284 - - 2021 nil 91,352
Jason Barker 60,000 Nov-14 0.775 - 100% 2019 - -
30,000 Dec-15 1.846 - 100% 2019 - -
20,000 Sep-17 3.178 - - 2021 nil 63,558
20,000 Sep-18 2.265 - - 2021 nil 45,294
Andre Cuenin 50,000 Dec-15 1.846 100% - 2020 nil 92,294
25,000 Sep-17 3.178 - 100% 2021 - -
22,000 Sep-18 2.265 - 100% 2021 - -
Matt Glasner 22,000 Jan-19 2.286 - - 2022 nil 50,291
Kevin Ryder 15,000 Sep-17 3.178 - - 2021 nil 47,669
15,000 Sep-18 2.265 - - 2021 nil 33,970
(A) The percentage forfeited in the year represents the reduction from the maximum number of performance rights available to vest due to the performance hurdles not being achieved or due to the resignation of the executive.
(B) The minimum value of performance rights yet to vest is $nil as the executives may not achieve the required performance hurdles or may terminate their employment prior to vesting.
(C) The maximum values presented above are based on the values calculated using the Black-Scholes methodology as applied in estimating the value of performance rights for employee benefit expense purposes.
For
per
sona
l use
onl
y

Integrated Research and its controlled entities Annual Report 201932
Remuneration report (audited)
Other transactions with key management personnelApart from the details disclosed in this note, no director has entered into a material contract with the consolidated entity since the end of the previous financial year and there were no material contracts involving directors’ interests existing at year-end.
Equity instrumentsAll performance rights refer to performance rights over ordinary shares of Integrated Research Limited, which are exercisable on a one-for-one basis under the Integrated Research Performance Rights and Option Plan (IRPROP).
Performance rights over equity instruments granted as compensationThe movement during the reporting year in the number of performance rights over ordinary shares in Integrated Research Limited held, directly, indirectly or beneficially, by each key management person, including their related parties, is as follows:
Current Year
Held at 1 July 2018
Granted as compensa‑
tion ExercisedOther
changes1
Held at30 June
2019
Vested during the
year
Vested and exercised
at 30 June 2019
Directors
John Merakovsky2 210,000 ‑ ‑ (210,000) ‑ ‑ ‑
Executives
Peter Adams 20,000 129,988 ‑ ‑ 149,988 ‑ ‑
Jason Barker2 110,000 20,000 ‑ (60,000) 70,000 ‑ ‑
Andre Cuenin2 75,000 22,000 (50,000) (47,000) ‑ 50,000 50,000
Matt Glasner ‑ 22,000 ‑ ‑ 22,000 ‑ ‑
Kevin Ryder 15,000 15,000 ‑ ‑ 30,000 ‑ ‑
1 Other changes represent performance rights that expired or were forfeited during the year.
2 ‘Held 30 June 2019’ value represents holding on last day as Key Management Personnel.
Prior Year
Held at 1 July2017
Granted as compensa‑
tion ExercisedOther
changes1
Held at30 June
2018
Vested during the
year
Vested and exercised
at 30 June 2018
Directors
John Merakovsky - 210,000 - - 210,000 - -
Executives
Peter Adams 100,000 20,000 (100,000) - 20,000 100,000 100,000
Alex Baburin 100,000 15,000 (100,000) (15,000) - 100,000 100,000
Jason Barker 130,000 20,000 (40,000) - 110,000 40,000 40,000
Andre Cuenin 150,000 25,000 (100,000) - 75,000 100,000 100,000
David Purdue 50,000 - (50,000) - - 50,000 50,000
Kevin Ryder 75,000 15,000 (75,000) - 15,000 75,000 75,000
1 Other changes represent performance rights that expired or were forfeited during the year.
Performance rights expire on the earlier of their expiry date or termination of the individual’s employment. Subsequent to year end, the Company has granted an additional 40,000 performance rights on 9 August 2019 vesting on 31 August 2022. The performance rights were provided at no cost to the recipients.
For
per
sona
l use
onl
y

Integrated Research and its controlled entities Annual Report 2019 33
Movements in sharesThe movement during the reporting period in the number of ordinary shares in Integrated Research Limited held, directly, indirectly or beneficially, by each key management person, including their related parties, is as follows:
Current Year
Held at1 July 2018 Purchases
Received on exercise
of perfor‑mance rights
Other changes* Sales
Held at30 June
2019
Directors
Non‑executive
Paul Brandling 10,202 25,104 ‑ ‑ ‑ 35,306
Nick Abrahams 5,042 8,404 ‑ ‑ ‑ 13,446
Garry Dinnie 2,000 7,000 ‑ ‑ ‑ 9,000
Steve Killelea1 68,193,231 ‑ ‑ ‑ ‑ 69,193,231
Peter Lloyd 2,000 25,000 ‑ ‑ ‑ 27,000
Executive officers (excluding directors)
Peter Adams 10,000 ‑ ‑ ‑ ‑ 10,000
Andre Cuenin ‑ ‑ 50,000 ‑ ‑ 50,000
Kevin Ryder 35,000 ‑ ‑ ‑ ‑ 35,000
1 ‘Held 30 June 2019’ value represents holding on last day as Key Management Personnel
Prior Year
Held at1 July 2017 Purchases
Received on exercise
of perfor‑mance rights
Other changes1 Sales
Held at30 June
2018
Directors
Non‑executive
Nick Abrahams 5,042 - - - - 5,042
Paul Brandling 10,202 - - - - 10,202
Garry Dinnie 2,000 - - - - 2,000
Steve Killelea 89,834,951 - - - (21,641,720) 68,193,231
Peter Lloyd 2,000 - - - - 2,000
Executive officers (excluding directors)
Peter Adams 15,000 - 100,000 - (105,000) 10,000
Alex Baburin 27,800 - 100,000 (25,600) (102,200) -
Andre Cuenin 50,000 - 100,000 - (150,000) -
David Purdue 53,250 - 50,000 - (25,000) 78,250
Kevin Ryder - - 75,000 - (40,000) 35,000
Shareholdings at the date of the Directors’ Report for existing Key Management Personnel remain unchanged.
Other transactions with the consolidated entityThere were no other transactions between the key management personnel, or their personally-related entities, and the consolidated entity.
For
per
sona
l use
onl
y

Integrated Research and its controlled entities Annual Report 201934
Corporate governance statement
Integrated Research and its controlled entities Annual Report 201934
For
per
sona
l use
onl
y

Integrated Research and its controlled entities Annual Report 2019 35
Contents
36 Board of Directors and its committees
39 Risk management
40 Ethical standards
41 Communication with shareholders
Corporate governance statement
Integrated Research and its controlled entities Annual Report 2019 35
For
per
sona
l use
onl
y

Integrated Research and its controlled entities Annual Report 201936
Corporate governance statement
This statement outlines the main corporate governance practices that were in place throughout the financial year, which comply with the ASX Corporate Governance Council recommendations, unless otherwise stated.
Board of Directors and its committeesRole of the boardThe board’s primary role is the protection and enhancement of long-term shareholder value.
To fulfil this role, the board is responsible for the overall corporate governance of the consolidated entity including evaluating and approving its strategic direction, approving and monitoring capital expenditure, setting remuneration, appointing, removing and creating succession policies for directors and senior executives, establishing and monitoring the achievement of management goals and assessing the integrity of internal control and management information systems. It is also responsible for approving and monitoring financial and other reporting.
Board processTo assist in the execution of its responsibilities, the Board has established a number of board committees including a Nomination and Remuneration Committee, an Audit and Risk Committee and a Strategy Committee. These committees have written mandates and operating procedures, which are reviewed on a regular basis. The board has also established a framework for the management of the consolidated entity including board-endorsed policies, a system of internal control, a business risk management process and the establishment of appropriate ethical standards.
The full board currently holds twelve scheduled meetings each year and any extraordinary meetings at such other times as may be necessary to address any specific matters that may arise.
The agenda for its meetings is prepared in conjunction with the chairman, chief executive officer and company secretary. Standing items include strategic matters for discussion, the CEO’s report, financial reports, key performance indicator reports and presentations by key executives and external industry experts. Board papers are circulated in advance. Directors have other opportunities, including visits to operations, for contact with a wider group of employees.
Director educationThe consolidated entity follows an induction process to educate new directors about the nature of the business, current issues, the corporate strategy and expectations of the consolidated entity concerning performance of directors. In addition executives make regular presentations to the board to ensure its familiarity with operational matters. Directors are expected to access external continuing education opportunities to update and enhance their skills and knowledge.
Independent advice and access to company informationEach director has the right of access to all relevant company information and to the company’s executives and, subject to prior consultation with the chairman, may seek independent professional advice from a suitably qualified adviser at the consolidated entity’s expense. A copy of the advice received by the director is made available to all other members of the board.
For
per
sona
l use
onl
y

Integrated Research and its controlled entities Annual Report 2019 37
Composition of the boardThe names of the directors of the company in office at the date of this report are set out on pages 18 to 19 of this report.
The company’s constitution provides for the board to consist of between three and twelve members. At 30 June 2019 the board members were comprised as follows:
• Mr Paul Brandling - Independent Non-Executive Director (Chairman)
• Mr Nick Abrahams - Non-Executive Director
• Mr Garry Dinnie - Independent Non-Executive Director
• Mr Peter Lloyd - Independent Non-Executive Director
• Ms Anne Myers - Independent Non-Executive Director
For the period 1 July 2018 to 1 November 2018 of the financial year, Mr Steve Killelea, who holds 39.7% of the company’s issued shares, was the non-executive chairman. During this period, the Company did not comply with the ASX Corporate Governance Council recommendation that the chairman be an independent director. However, the board was satisfied that the company benefited from Mr Killelea’s experience and knowledge gained through his long involvement with Integrated Research and his associations throughout the information technology industry. Mr Killelea founded Integrated Research in 1988 and was the CEO and managing director of the company until his retirement in November 2004.
Mr Abrahams was appointed as a Non-Executive Director in September 2014. Mr Abrahams was previously deemed not to be independent due to a pre-existing business relationship between Mr Abrahams and Mr Killelea. This business relationship has now ceased and as a result, the Board has determined that Mr Abrahams will be independent effective 1 July 2019.
At each Annual General Meeting one-third of directors, any director who has held office for three years and any director appointed by directors in the preceding year must retire, then being eligible for re-election. The CEO is not required to retire by rotation.
The composition of the board is reviewed on a regular basis to ensure that the board has the appropriate mix of expertise and experience. When a vacancy exists, through whatever cause, or where it is considered that the board would benefit from the services of a new director with particular skills, the Nomination and Remuneration Committee, in conjunction with the board, determines the selection criteria for the position based on the skills deemed necessary for the board to best carry out its responsibilities. The committee then selects a panel of candidates and the board appoints the most suitable candidate who must stand for election at the next general meeting of shareholders.
The company secretary is accountable directly to the board, through the chair, on all matters to do with the proper functioning of the board.
Nomination and Remuneration CommitteeThe Nomination and Remuneration Committee has a documented charter, approved by the board. The Nomination and Remuneration Committee is a committee of the board of directors and is empowered by the board to assist it in fulfilling its duties to shareholders and other stakeholders. In general, the committee has responsibility to: 1) ensure the company has appropriate remuneration policies designed to meet the needs of the company and to enhance corporate and individual performance and 2) review board performance, select and recommend new directors to the board and implement actions for the retirement and re-election of directors.
Responsibilities regarding remuneration The Committee reviews and makes recommendations to the board on:
• The appointment, remuneration, performance objectives and evaluation of the chief executive officer.
• The remuneration packages for senior executives.
• The Company’s recruitment, retention and termination policies and procedures for senior executives.
• Executive remuneration and incentive policies.
• Policies on employee incentive plans, including equity incentive plans.
• Superannuation arrangements.
• The remuneration framework and policy for non-executive directors.
• Remuneration levels are competitively set to attract and retain the most qualified and experienced directors and senior executives. The Remuneration Committee obtains independent advice on the appropriateness of remuneration packages, given trends in comparative companies and industry surveys. Remuneration packages include a mix of fixed remuneration, performance-based remuneration and equity-based remuneration.
For
per
sona
l use
onl
y

Integrated Research and its controlled entities Annual Report 201938
Corporate governance statement
Responsibilities regarding nomination The Committee develops and makes recommendations to the board on:
• The CEO and senior executive succession planning.
• The range of skills, experience and expertise needed on the board and the identification of the particular skills, experience and expertise that will best complement board effectiveness.
• A plan for identifying, reviewing, assessing and enhancing director competencies.
• Board succession plans to maintain a balance of skills, experience and expertise on the board.
• Evaluation of the board’s performance.
• Appointment and removal of directors.
• Appropriate composition of committees.
The terms and conditions of the appointment of non-executive directors are set out in a letter of appointment, including expectations for attendance and preparation for all board meetings, expected time commitments, procedures when dealing with conflicts of interest, and the availability of independent professional advice.
The performance of the Chief Executive Officer and the board was undertaken in the reporting period identifying both strengths and development actions. The performance of other senior management was conducted by the Chief Executive Officer.
The members of the Nomination and Remuneration Committee during the year were:
• Mr Garry Dinnie - Independent Non-Executive Director (Chairman)
• Mr Paul Brandling - Independent Non-Executive Director (From 1 November 2018)
• Mr Steve Killelea - Non-Executive (to 1 November 2018)
The company does not comply with the ASX Corporate Governance Council recommendation that the committee consist of three members, a majority of whom should be independent directors. During this period of non-compliance, the Company utilised the skills and experience of the other independent and non-executive Directors of the Board. Moving towards compliance, the Board have appointed Ms Anne Myers to the Nomination and Remuneration Committee on 21 August 2019.
A matrix of skills and diversity of the board as required by the ASX corporate governance recommendations is available on the Company’s website at www.ir.com.
The Nomination and Remuneration Committee meets at least twice a year and as required. The Committee met three times during the year under review.
Audit and Risk CommitteeThe Audit and Risk Committee has a documented charter, approved by the board. The charter states that all members must be non-executive directors with a majority being independent. The chairman may not be the chairman of the board. The committee advises on the establishment and maintenance of a framework of risk management and internal control of the consolidated entity.
The members of the Audit and Risk Committee during the year were:
• Mr Garry Dinnie - Independent Non-Executive (Chairman)
• Mr Nick Abrahams - Non-Executive Director
• Mr Paul Brandling - Independent Non-Executive Director (member to 1 November 2018)
• Ms Anne Myers - Independent Non-Executive Director (member from 1 November 2018)
During the year, the Audit and Risk Committee provided the Board with updates to the Company’s risk management register (with the Board approving this document).
The external auditor, Chief Executive Officer and Chief Financial Officer are invited to Audit and Risk Committee meetings at the discretion of the committee. The committee met four times during the year and committee members’ attendance record is disclosed in the table of directors’ meetings on page 22.
The external auditor met with the audit committee/board four times during the year, two of which included time without the presence of executive management. The Chief Executive Officer and the Chief Financial Officer declared in writing to the board that the company’s financial reports for the year ended 30 June 2019 comply with accounting standards and present a true and fair view, in all material respects, of the company’s financial condition and operational results.
The main responsibilities of the Audit and Risk Committee as set out in the charter include:
• Serve as an independent party to monitor the financial reporting process and internal control systems.
• Review the performance and independence of the external auditors and make recommendations to the board regarding the appointment or termination of the auditors.
• Review the scope and cost of the annual audit, negotiating and recommending the fee for the annual audit to the board. F
or p
erso
nal u
se o
nly
Integrated Research and its controlled entities Annual Report 2019 39
• Review the external auditor’s management letter and responses by management.
• Provide an avenue of communication between the auditors, management and the board.
• Monitor compliance with all financial statutory requirements and regulations.
• Review financial reports and other financial information distributed to shareholders so that they provide an accurate reflection of the financial health of the company.
• Monitor corporate risk management and assessment processes, and the identification and management of strategic and operational risks.
• Enquire of the auditors of any difficulties encountered during the audit, including any restrictions on the scope of their work, access to information or changes to the planned scope of the audit.
The Audit and Risk Committee reviews the performance of the external auditors on an annual basis and normally meets with them during the year as follows:
• To discuss the external audit plans, identifying any significant changes in structure, operations, internal controls or accounting policies likely to impact the financial statements and to review the fees proposed for the audit work to be performed.
Prior to announcement of results:
• To review the half-year and preliminary final report prior to lodgement with the ASX, and any significant adjustments required as a result of the auditor’s findings.
• To recommend the Board approval of these documents.
• Review the results and findings of the auditor, the adequacy of accounting and financial
controls, and to monitor the implementation of any recommendations made.
To finalise half-year and annual reporting:
• Review the draft financial report and recommend board approval of the financial report.
• As required, to organise, review and report on any special reviews or investigations deemed necessary by the board.
Strategy Committee The Strategy Committee has a documented charter, approved by the board and is responsible for reviewing strategy and recommending strategies to the board to enhance the company’s long-term performance. The committee is comprised of at least three members, including the chairman of the board and the Chief Executive Officer. The board appoints a member of the committee to be chairman.
The members of the Strategy Committee during the year were:
• Mr Peter Lloyd - Independent Non-Executive (Chairman from 1 November 2018)
• Mr Steve Killelea - Non-Executive (Chairman to 1 November 2018 - refer below)
• Mr Paul Brandling - Independent Non-Executive
• Ms Anne Myers - Independent Non-Executive Director (member from 1 November 2018)
• Mr John Merakovsky - Chief Executive Officer (member to 18 February 2019)
With Mr Killelea retiring from the Board effective 1 November and part of a transition plan, the Company entered into a two-year consulting contract with Mr Killelea to provide assistance of an advisory capacity to the Strategy Committee.
The Strategy Committee is responsible for:
• Reviewing and assisting in defining current strategy.
• Assessing new strategic opportunities, including M&A proposals and intellectual property developments or acquisitions.
• Staying close to the business challenges and monitor operational implementation of strategic plans.
• Endorsing strategy and business cases for consideration by the full board.
The Committee met three times during the year under review.
Risk managementUnder the Audit and Risk Charter, the Audit and Risk Committee reviews the status of business risks to the consolidated entity through integrated risk management programs ensuring risks are identified, assessed and appropriately managed and communicated to the board. Major business risks arise from such matters as actions by competitors, government policy changes and the impact of exchange rate movements.
• Comprehensive policies and procedures are established such that:
• Capital expenditure above a certain size requires board approval.
• Financial exposures are controlled, including the use of forward exchange contracts.
• Risks are identified and managed, including internal audit, privacy, insurances, business continuity and compliance.
• Business transactions are properly authorised and executed.
For
per
sona
l use
onl
y

Integrated Research and its controlled entities Annual Report 201940
Corporate governance statement
The Chief Executive Officer and the Chief Financial Officer has declared, in writing to the board that the Company’s financial reports are founded on a sound system of risk management and internal compliance and control which implements the policies adopted by the board.
Internal control frameworkThe board is responsible for the overall internal control framework, but recognises that no cost effective internal control system will preclude all errors and irregularities. The board has instigated the following internal control framework:
• Financial reporting - Monthly actual results are reported against budgets approved by the directors and revised forecasts for the year are prepared monthly.
• Continuous disclosure - Identify matters that may have a material effect on the price of the Company’s securities, notify them to the ASX and post them to the Company’s website.
• Quality and integrity of personnel - Formal appraisals are conducted at least annually for all employees.
• Investment appraisals - Guidelines for capital expenditure include annual budgets, detailed appraisal and review procedures and levels of authority.
Internal AuditThe Company does not have an internal audit function but utilises its financial resources as needed to assist the board in ensuring compliance with internal controls.
Material Exposure to economic, environmental and social sustainability risksBy the nature of the industry that the Company participates in, exposures to economic, environmental and social sustainability risks are not considered material.
Ethical standardsAll directors, managers and employees are expected to act with the utmost integrity and objectivity, striving at all times to enhance the reputation and performance of the consolidated entity. Every employee has a nominated supervisor to whom they may refer any issues arising from their employment.
Conflict of interestEach Director must keep the board advised, on an ongoing basis, of any interest that could potentially conflict with those of the Company. Where the board considers that a significant conflict exists the director concerned does not receive the relevant board papers and is not present at the meeting whilst the item is considered. The board has developed procedures to assist directors to disclose potential conflicts of interest. Details of director related entity transactions with the consolidated entity are set out in Remuneration report page 25 to 33.
Code of conductThe consolidated entity has advised each director, manager and employee that they must comply with the code of conduct. The code aligns behaviour of the board and management with the code of conduct by maintaining appropriate core values
and objectives. It may be reviewed on the company’s website and includes:
• Responsibility to the community and fellow employees to act with honesty and integrity, and without prejudice.
• Compliance with laws and regulations in all areas where the company operates, including employment opportunity, occupational health and safety, trade practices, fair dealing, privacy, drugs and alcohol, and the environment.
• Dealing honestly with customers, suppliers and consultants.
• Ensuring reports and other information are accurate and timely.
• Proper use of company resources, avoidance of conflicts of interest and use of confidential or proprietary information.
Equal Employment OpportunityThe Company has a policy on Equal Employment Opportunity with the provision that commits to a workplace that is free of discrimination of all types. It is Company policy to hire, develop and promote individuals solely on the basis of merit and their ability to perform without prejudice to race, colour, creed, national origin, religion, gender, age, disability, sexual orientation, marital status, membership or non-membership of a trade union, status of employment (whether full or part-time) or any other factors prohibited by law. The board is satisfied that the Equal Employment Opportunity policy is sufficient without the need to further establish a separate policy on gender diversity as required by the ASX Corporate Governance Council recommendation.
For
per
sona
l use
onl
y

Integrated Research and its controlled entities Annual Report 2019 41
Trading in company securities by directors and employeesDirectors and employees may acquire shares in the company, but are prohibited from dealing in company shares whilst in possession of price sensitive information, and except in the periods:
• From 24 hours to 42 days after the release of the company’s half-yearly results announcement.
• From 24 hours to 56 days after release of the company’s annual results announcement.
• Directors must obtain the approval of the Chairman of the board and notify the Company Secretary before they buy or sell shares in the company, subject to board veto. The company advises the ASX of any transactions conducted by directors in shares in the company.
Participants in the Company’s Performance Rights program are specifically prohibited to hedge the exposure to the Integrated Research share price during the vesting period in respect of the unvested performance rights.
Communication with shareholdersThe board provides shareholders with information using a comprehensive continuous disclosure policy which includes identifying matters that may have a material effect on the price of the company’s securities, notifying them to the ASX, posting them on the Company’s website (www.ir.com), and issuing media releases. Disclosures under this policy are in addition to the periodic and other disclosures required under the ASX Listing Rules and the Corporations Act. More details of the policy are available on the Company’s website.
The Chief Executive Officer and the Chief Financial Officer are responsible for interpreting the Company’s policy and where necessary informing the board. The Company Secretary is responsible for all communication with the ASX.
The board encourages full participation of shareholders at the Annual General Meeting to ensure a high level of accountability and identification with the consolidated entity’s strategy and goals. Important issues are presented to the shareholders as single resolutions. The external auditor is requested to attend the Annual General Meetings to answer any questions concerning the audit and the content of the auditor’s report.
The shareholders are requested to vote on the appointment and aggregate remuneration of directors, the granting of options and shares to directors, the Remuneration Report and changes to the Constitution. Copies of the Constitution are available to any shareholder who requests it.
For
per
sona
l use
onl
y

Integrated Research and its controlled entities Annual Report 201942
Financial statements
Integrated Research and its controlled entities Annual Report 201942
For
per
sona
l use
onl
y

Integrated Research and its controlled entities Annual Report 2019 43
Contents
44 Consolidated statement of comprehensive income
45 Consolidated statement of financial position
46 Consolidated statement of changes in equity
47 Consolidated statement of cash flows
48 Notes to the financial statements 48 Note 1: Significant accounting policies 58 Note 2: Segment reporting 59 Note 3: Revenue from contracts with customers 59 Note 4: Expenditure 60 Note 5: Other gains and (losses) 60 Note 6: Finance income 61 Note 7: Auditors’ remuneration 61 Note 8: Income tax expense 62 Note 9: Earnings per share 62 Note 10: Cash and cash equivalents 63 Note 11: Trade and other receivables 64 Note 12: Other assets 64 Note 13: Other financial assets 64 Note 14: Property, plant and equipment 65 Note 15: Deferred tax assets and liabilities 67 Note 16: Intangible assets 68 Note 17: Goodwill 68 Note 18: Trade and other payables 68 Note 19: Employee benefits 70 Note 20: Provisions 70 Note 21: Other financial liabilities 71 Note 22: Capital and reserves 73 Note 23: Financial instruments 76 Note 24: Operating leases 76 Note 25: Consolidated entities 77 Note 26: Reconciliation of cash flows from operating activities 77 Note 27: Key management personnel disclosures 77 Note 28: Related parties 78 Note 29: Parent entity disclosures 78 Note 30: Subsequent events
79 Directors’ declaration
80 Independent auditor’s report
87 ASX additional information
Financials
Integrated Research and its controlled entities Annual Report 2019 43
For
per
sona
l use
onl
y

Integrated Research and its controlled entities Annual Report 201944
Financial statements
Consolidated statement of comprehensive incomeFor the year ended 30 June 2019
Consolidated
In thousands of AUD Notes 2019 2018
Revenue from contracts with customers
Licence fees 62,774 52,591
Maintenance fees 24,995 25,893
SaaS fees 669 117
Testing solution services 4,995 5,207
Professional services 7,387 7,367
Total revenue 3 100,820 91,175
Expenditure
Research and development expenses (17,888) (15,335)
Sales, professional services and marketing expenses (49,787) (45,703)
General and administration expenses (5,557) (5,849)
Total expenditure 4 (73,232) (66,887)
Other gains and (losses) 5 1,312 1,560
Profit before finance income and tax 28,900 25,848
Finance income 6 747 423
Profit before tax 29,647 26,271
Income tax expense 8 (7,796) (7,091)
Profit for the year 21,851 19,180
Other comprehensive income
Items that may be reclassified subsequently to profit
Gain/(Loss) on cash flow hedge taken to equity 95 (176)
Foreign exchange translation differences 749 498
Other comprehensive income 844 322
Total comprehensive income for the year 22,695 19,502
Profit attributable to:
Members of Integrated Research 21,851 19,180
Total comprehensive income attributable to:
Members of Integrated Research 22,695 19,502
Earnings per share attributable to members of Integrated Research:
Basic earnings per share (AUD cents) 9 12.72 11.19
Diluted earnings per share (AUD cents) 9 12.70 11.15
The consolidated statement of comprehensive income is to be read in conjunction with the notes to the financial statements set out on pages 48 to 78.
For
per
sona
l use
onl
y

Integrated Research and its controlled entities Annual Report 2019 45
Consolidated statement of financial positionAs at 30 June 2019
Consolidated
In thousands of AUD Notes 2019 2018
Current assets
Cash and cash equivalents 10 9,316 11,238
Trade and other receivables 11 51,378 44,186
Current tax assets 222 1,037
Other current assets 12 3,133 1,792
Total current assets 64,049 58,253
Non‑current assets
Trade and other receivables 11 21,389 26,892
Other financial assets 13 236 255
Property, plant and equipment 14 2,631 2,547
Deferred tax assets 15 1,286 687
Intangible assets 16 23,101 21,938
Other non-current assets 12 829 -
Total non-current assets 49,472 52,319
Total assets 113,521 110,572
Current liabilities
Trade and other payables 18 9,797 10,140
Provisions 20 3,197 3,085
Income tax liabilities 1,638 1,986
Deferred revenue 21,410 22,643
Other financial liabilities 21 139 329
Total current liabilities 36,181 38,183
Non‑current liabilities
Deferred tax liabilities 15 5,837 4,281
Provisions 20 723 829
Deferred revenue 920 9,371
Other non-current financial liabilities 21 33 70
Total non-current liabilities 7,513 14,551
Total liabilities 43,694 52,734
Net assets 69,827 57,838
Equity
Issued capital 22 1,667 1,667
Reserves 22 3,978 3,043
Retained earnings 64,182 53,128
Total equity 69,827 57,838
The consolidated statement of financial position is to be read in conjunction with the notes to the financial statements set out on pages 48 to 78.
For
per
sona
l use
onl
y

Integrated Research and its controlled entities Annual Report 201946
Financial Statements
Consolidated statement of changes in equityFor the year ended 30 June 2019
ConsolidatedIn thousands of AUD
Share capital
Hedging reserve
Translation reserve
Employee benefit reserve
Retained earnings Total
Balance at 1 July 2018 (as reported) 1,667 (146) (256) 3,445 53,128 57,838
Effect of adoption of new accounting standards (Note 1B) - - - - 1,230 1,230
Balance at 1 July 2018 (restated) 1,667 (146) (256) 3,445 54,358 59,068
Profit for the year - - - - 21,851 21,851
Other comprehensive income for the year (net of tax) - 95 749 - - 844
Total comprehensive income for the year - 95 749 - 21,851 22,695
Share based payments expense - - - 91 - 91
Dividends to shareholders - - - - (12,027) (12,027)
Balance at 30 June 2019 1,667 (51) 493 3,536 64,182 69,827
ConsolidatedIn thousands of AUD
Share capital
Hedging reserve
Translation reserve
Employee benefit reserve
Retained earnings Total
Balance at 1 July 2017 1,667 30 (754) 2,492 45,085 48,520
Profit for the year - - - - 19,180 19,180
Other comprehensive income for the year (net of tax) - (176) 498 - - 322
Total comprehensive income for the year - (176) 498 - 19,180 19,502
Share based payments expense - - - 953 - 953
Dividends to shareholders - - - - (11,137) (11,137)
Balance at 30 June 2018 1,667 (146) (256) 3,445 53,128 57,838
The consolidated statement of changes in equity is to be read in conjunction with the notes to the financial statements set out on pages 48 to 78.
For
per
sona
l use
onl
y

Integrated Research and its controlled entities Annual Report 2019 47
Consolidated statement of cash flowsFor the year ended 30 June 2019
Consolidated
In thousands of AUD Notes 2019 2018
Cash flows from operating activities
Cash receipts from customers 89,472 82,734
Cash paid to suppliers and employees (61,498) (53,362)
Cash generated from operations 27,974 29,372
Income taxes paid (6,737) (7,930)
Net cash provided by operating activities 26 21,237 21,442
Cash flows from investing activities
Payments for capitalised development (11,275) (11,524)
Payments for property, plant and equipment (1,273) (1,158)
Payments for intangible asset (28) (27)
Interest received 799 518
Interest paid (52) (95)
Net cash used in investing activities (11,829) (12,286)
Cash flows from financing activities
Proceeds from borrowings 23 3,000 4,500
Repayment of borrowings 23 (3,000) (4,500)
Payment of dividend 22 (12,027) (11,137)
Net cash used in financing activities (12,027) (11,137)
Net (decrease)/increase in cash and cash equivalents (2,619) (1,981)
Cash and cash equivalents at 1 July 11,238 14,113
Effects of exchange rate changes on cash 697 (894)
Cash and cash equivalents at 30 June 10 9,316 11,238
The consolidated statement of cash flows is to be read in conjunction with the notes to the financial statements set out on pages 48 to 78.
For
per
sona
l use
onl
y

Integrated Research and its controlled entities Annual Report 201948
Financial statements
Note 1: Significant accounting policies Integrated Research Limited (the “Company”) is a company domiciled in Australia. The financial report of the Company for the year ended 30 June 2019 comprises the Company and its subsidiaries (together referred to as the “consolidated entity”).
The financial report was authorised for issue by the directors on 22 August 2019.
Integrated Research is a for-profit Company limited by ordinary shares.
A. Statement of ComplianceThe financial report is a general purpose financial report which has been prepared in accordance with Australian Accounting Standards and Interpretations and the Corporations Act 2001. Financial statements of the consolidated entity comply with International Financial Reporting Standards and interpretations adopted by the International Accounting Standards Board.
B. Basis of preparationThe financial statements are presented in Australian dollars and are prepared on a going concern basis using historical cost, with the exception of derivatives, which are at fair value.
The company is of a kind referred to in ASIC Legislative Instrument 2016/191 and in accordance with that Class Order, amounts in the financial report and Directors’ Report have been rounded off to the nearest thousand dollars, unless otherwise stated.
The preparation of financial statements in conformity with Australian Accounting Standards requires management to make judgements, estimates and assumptions that affect the application of policies and reported amounts of assets and liabilities, income and expenses. The estimates and associated assumptions are based on historical experience and various other factors that are believed to be reasonable under
the circumstances, the results of which form the basis of making the judgements about carrying values of assets and liabilities that are not readily apparent from other sources. Actual results may differ from these estimates. These accounting policies have been consistently applied by each entity in the consolidated entity.
The estimates and underlying assumptions are reviewed on an ongoing basis. Revisions to accounting estimates are recognised in the period in which the estimate is revised if the revision affects only that period or in the period of the revision and future periods if the revision affects both current and future periods.
New accounting standards and interpretations The accounting policies and methods of computation adopted in the preparation of the financial report are consistent with those adopted and disclosed in Integrated Research Limited’s 2018 annual financial report, except for the adoption of new standards for the 2019 financial year. These accounting policies are consistent with Australian Accounting Standards and with International Financial Reporting Standards.
AASB 15 ‘Revenue from Contracts with Customers’
The standard is applicable to the year ended 30 June 2019 and has superseded all current revenue recognition requirements under Australian Accounting Standards.
The Company adopted AASB 15 using the modified retrospective method of adoption and has elected to apply the process to contracts that were not completed at the date of initial application (1 July 2018) only. The cumulative effect of initially applying AASB 15 is recognised at the date of initial application as an adjustment to the opening balance of retained earnings. Therefore, the comparative information was not restated and continues to be reported under AASB 118 and related Interpretations.
Notes to the financial statementsFor the year ended 30 June 2019
For
per
sona
l use
onl
y

Integrated Research and its controlled entities Annual Report 2019 49
Note 1: Significant accounting policies (cont.)The new standard establishes a five-step model to account for revenue arising from contracts with customers. Under AASB 15, revenue is recognised at an amount that reflects the consideration to which an entity expects to be entitled in exchange for transferring goods or services to a customer. It requires entities to exercise judgement, taking into consideration all of the relevant facts and circumstances when applying each step of the model to contracts with their customers. The standard also specifies the accounting for the incremental costs of obtaining a contract and the costs directly related to fulfilling a contract.
The application of the new standard did not impact the Company’s revenue recognition for contracts not completed at the date of initial application. The revenue recognition accounting policy as disclosed within the 2018 annual financial report is consistent with the requirements of AASB 15. The adoption of the standard does impact items other than revenue which are detailed below.
The adoption of AASB 15 did not have a material impact on Other Comprehensive Income or the Company’s cash flows in the period.
The effect of adopting AASB 15 as at 1 July 2018 was, as follows:
In thousands of AUDIncrease/
(decrease)
Current assets
Other current assets - contract assets (i) 951
Total current assets 951
Non‑current assets
Trade and other receivables (ii) (7,915)
Other non-current assets - contract assets (i) 590
Total non‑current assets (7,325)
Total assets (6,374)
Current liabilities
Deferred tax liabilities (i) 311
Deferred revenue (ii) (7,915)
Total current liabilities (7,604)
Total liabilities (7,604)
Net assets 1,230
Equity
Retained Earnings 1,230
Total Equity attributable to members of Integrated Research 1,230
For
per
sona
l use
onl
y
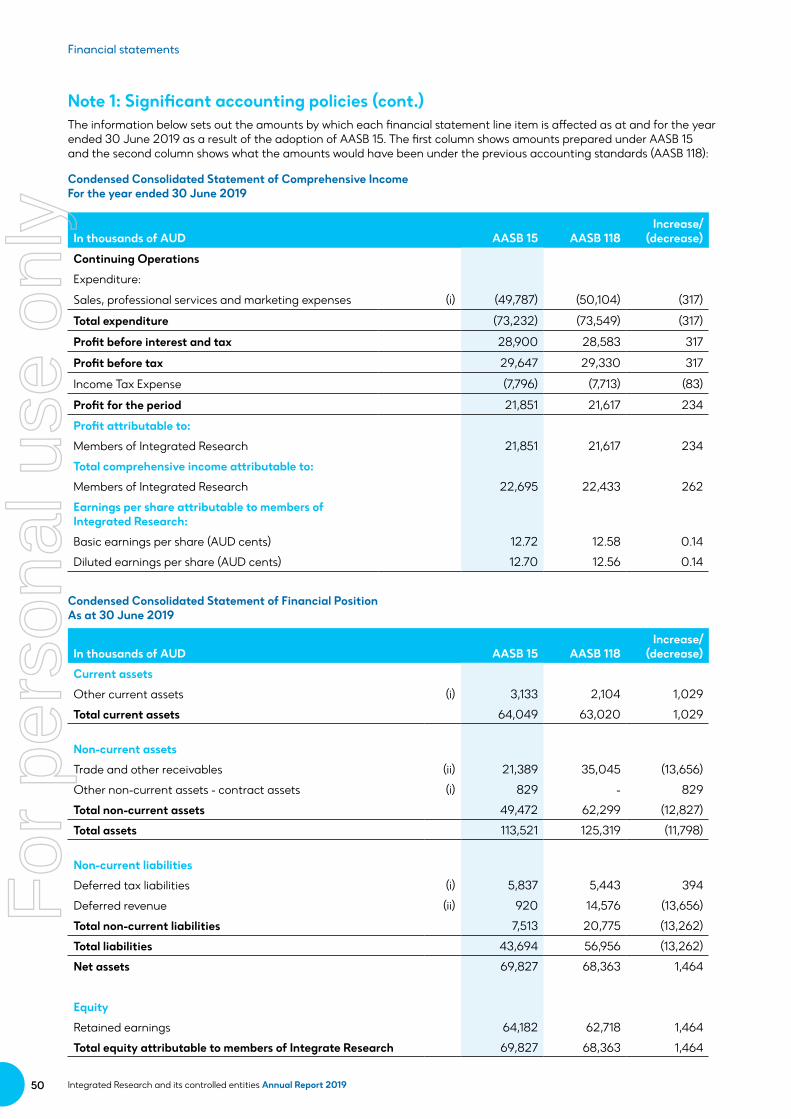
Integrated Research and its controlled entities Annual Report 201950
Financial statements
Note 1: Significant accounting policies (cont.)The information below sets out the amounts by which each financial statement line item is affected as at and for the year ended 30 June 2019 as a result of the adoption of AASB 15. The first column shows amounts prepared under AASB 15 and the second column shows what the amounts would have been under the previous accounting standards (AASB 118):
Condensed Consolidated Statement of Comprehensive Income For the year ended 30 June 2019
In thousands of AUD AASB 15 AASB 118Increase/
(decrease)
Continuing Operations
Expenditure:
Sales, professional services and marketing expenses (i) (49,787) (50,104) (317)
Total expenditure (73,232) (73,549) (317)
Profit before interest and tax 28,900 28,583 317
Profit before tax 29,647 29,330 317
Income Tax Expense (7,796) (7,713) (83)
Profit for the period 21,851 21,617 234
Profit attributable to:
Members of Integrated Research 21,851 21,617 234
Total comprehensive income attributable to:
Members of Integrated Research 22,695 22,433 262
Earnings per share attributable to members of Integrated Research:
Basic earnings per share (AUD cents) 12.72 12.58 0.14
Diluted earnings per share (AUD cents) 12.70 12.56 0.14
Condensed Consolidated Statement of Financial Position As at 30 June 2019
In thousands of AUD AASB 15 AASB 118Increase/
(decrease)
Current assets
Other current assets (i) 3,133 2,104 1,029
Total current assets 64,049 63,020 1,029
Non‑current assets
Trade and other receivables (ii) 21,389 35,045 (13,656)
Other non-current assets - contract assets (i) 829 - 829
Total non‑current assets 49,472 62,299 (12,827)
Total assets 113,521 125,319 (11,798)
Non‑current liabilities
Deferred tax liabilities (i) 5,837 5,443 394
Deferred revenue (ii) 920 14,576 (13,656)
Total non‑current liabilities 7,513 20,775 (13,262)
Total liabilities 43,694 56,956 (13,262)
Net assets 69,827 68,363 1,464
Equity
Retained earnings 64,182 62,718 1,464
Total equity attributable to members of Integrate Research 69,827 68,363 1,464
For
per
sona
l use
onl
y

Integrated Research and its controlled entities Annual Report 2019 51
Note 1: Significant accounting policies (cont.)The nature of the adjustments as at 1 July 2018 and the reasons for the changes in the statement of financial position as at 30 June 2019 and the statement of comprehensive income for the year ended 30 June 2019 are described below:
i) Accounting for costs to fulfil a contract
The Company remunerates employees who actively participate in the sales process with commissions calculated based on revenues where they have been involved in the successful contract execution. This typically includes revenues that will be recognised in subsequent financial reporting periods. Under the accounting policy applied prior to 1 July 2018, commissions related to sales are recognised as an expense on contract execution, which is the point at which a constructive obligation arises for the Company. Under AASB 15, these costs have been recognised as an asset on contract execution with the amortisation period being consistent with the period over which the associated revenue will be recognised on a straight-line basis.
As at 1 July 2018 there were $1,541,000 in commissions costs relating to on-going contracts with customers for which revenue was yet to be recognised. These amounts were capitalised as costs to fulfil a contract on adoption of AASB 15 with a corresponding increase to retained earnings. In addition, deferred tax liabilities were recognised, at the local regional tax rates, of $311,000. For the year ended 30 June 2019 the net impact of the capitalisation and amortisation of costs to fulfil a contract for the current and previous periods (to the extent the contracts were not completed on adoption of AASB 15) was an increase of profit for the period of $215,000.
ii) Accounting for contract assets and contract liabilities
On adoption of AASB 15, a contract asset (including trade and other receivables) is only recognised where the Company has an unconditional right of payment in accordance
with AASB 15, which is determined by the Company as having both a contractual right to invoice and receive payment as well as having satisfied or expecting to satisfy the performance obligation within twelve months. Where the company has recognised a trade receivable and services are being provided currently or will be provided within twelve months, a contract liability is recognised. Where the Company has satisfied a performance obligation but does not have an unconditional right of payment, a contract asset is recognised.
The contractually committed consideration for performance obligations which are not expected to be satisfied within twelve months are not recognised as a trade receivable or contract asset by the Company. Correspondingly, a contract liability is not recognised for performance obligations which will not be satisfied within twelve months. This specifically applies to maintenance fees and testing solutions services where the Company, as part of a contract, has a multiyear non-cancellable contractual commitment, but does not yet meet the requirements to recognise an asset or liability under AASB 15.
As at 30 June 2019, the above resulted in the decrease in both trade and other receivables and deferred revenue of $13,656,000.
iii) Accounting for SaaS (“Software as a Service”) fees
The Company has expanded its products into hosted services with the migration of IT environments into the cloud. As a small quantum of revenue was recognised in the prior comparative period, amounts were classified under revenues from maintenance fees. With the expansion of customer adoption and products, SaaS fees have been restated to facilitate disclosure requirements under AASB 15 relating to disaggregated revenues.
The Company considers that the term contracts relating to products hosted on the Company’s cloud environment represents a right of access to its licenced intellectual property for the duration of the term of the contract. As a result, under AASB 15, revenue from SaaS fees (where licences are hosted on
the Company’s cloud environment) will be recognised rateably throughout the subscription term.
AASB 9 ‘Financial Instruments’
The standard is applicable to the year ended 30 June 2019. AASB 9 replaces the requirements of AASB 139 Financial Instruments: Recognition and Measurement and bring together the classification, measurement, impairment and hedge accounting requirements for financial instruments.
AASB 9 was adopted retrospectively, with the exception of hedge accounting, which was adopted prospectively. There is no impact on adoption of AASB 9 on the opening balance sheet at 1 July 2018. The adoption of the standard resulted in the changes in the accounting policies described below.
iv) Hedge accounting
At the date of the initial application, all of the Company’s existing hedging relationships were eligible to be treated as continuing hedging relationships. Consistent with prior periods, the Company has continued to designate the change in fair value of the entire forward contract in the Company’s cash flow hedge relationships and, as such, the adoption of the hedge accounting requirements of AASB 9 had no significant impact on the Company’s financial statements.
v) Trade receivables and contract assets
The Company has applied the simplified approach to measuring the expected credit losses, which uses a lifetime expected loss allowance for all trade receivables and contract assets.
To measure the expected credit losses the Company has stratified trade receivables and contract assets based on the days past due and established a provision matrix based on the group historical credit loss experience adjusted for forward looking factors.
Trade receivables and contract assets are written off when there is no reasonable expectation of recovery.
For
per
sona
l use
onl
y

Integrated Research and its controlled entities Annual Report 201952
Financial statements
Note 1: Significant accounting policies (cont.)
Standards and Interpretations issued not yet effectiveAt the date of authorisation of the financial report, a number of standards and Interpretations were in issue but not yet effective.
Initial application of the following Standards is not expected to materially affect any of the amounts recognised in the financial statements, but may change the disclosures made in relation to the consolidated entity’s financial statements:
Standard/Interpretation
Effective for annual reporting
periods beginning on or after
Expected to be initially applied in the financial year
ending
AASB 2018-1 Amendments to Australian Accounting Standards - Annual Improvements 2015-2017 Cycle 1 Jan 2019 30 June 2020
AASB Interpretation 23 Uncertainty over Income Tax Treatments, and relevant amending standards 1 Jan 2019 30 June 2020
Conceptual Framework for Financial Reporting 1 Jan 2020 30 June 2021
AASB 2018-6 Amendments to Australian Accounting Standards - Definition of a business 1 Jan 2020 30 June 2021
AASB 2018-7 Amendments to Australian Accounting Standards - Definition of Material 1 Jan 2020 30 June 2021
Initial application of the following Standards is likely to impact the amounts recognised in the future financial statements
AASB16 ‘Leases’
The standard is applicable to the financial year ending 30 June 2020 and has superseded all lease requirements under Australian Accounting Standards. The Company will apply the modified retrospective method in adopting the new standard, and therefore not apply the standard to contracts that were not previously identified as containing a lease applying AASB 117 and AASB Interpretation 4.
The Company will elect to use the exemptions proposed by the standard on lease contracts for which the lease terms ends within 12 months as of the date of initial application, and lease contracts for which the underlying asset is of low value (under US $5,000). AASB 16 sets out the principles for the recognition, measurement, presentation and disclosure of leases and requires lessees to account for all leases under a single on-balance sheet model similar to the accounting for finance leases under AASB 117. The Company will be also required to remeasure the lease liability upon the occurrence of certain events (e.g., a change in the lease term, a change in future lease payments resulting from a change in an index or rate used to determine those payments). Due to the adoption of AASB 16, the Company’s operating profit will improve, while its interest expense will increase. This is due to the change in the accounting for expenses of leases that were classified as operating leases under AASB 117.
The Company has assessed the impact of adopting AASB 16 and the indicative transition adjustments for the 30 June 2020 financial year to be a gross increase to assets and liabilities by between $2.1 million and S2.4 million, inclusive of an increase to deferred tax liabilities.
Under the current lease accounting standard AASB 117, leases expense is recognised on a straight-line basis, resulting in the recognition of lease liabilities, which are on transition to AASB 16 credited to the right-of-use assets.
For
per
sona
l use
onl
y

Integrated Research and its controlled entities Annual Report 2019 53
Note 1: Significant accounting policies (cont.)
C. Basis of consolidationSubsidiaries are entities controlled by the Company. Control is achieved when the Company is exposed, or has rights, to variable returns from its involvement with the investee and has the ability to affect those returns through its power over the investee. Specifically, the Company controls an investee if and only if the Company has power over the investee (i.e. existing rights that give it the current ability to direct the relevant activities of the investee). Exposure, or rights, to variable returns from its involvement with the investee, and the ability to use its power over the investee to affect its returns.
When the Company has less than a majority of the voting or similar rights of an investee, the Company considers all relevant facts and circumstances in assessing whether it has power over an investee including: the contractual arrangement with the other vote holders of the investee; rights arising from other contractual arrangements and the Company’s voting rights and potential voting rights.
The Company re-assesses whether or not it controls an investee if facts and circumstances indicate that there are changes to one or more of the three elements of control. Consolidation of a subsidiary begins when the Company obtains control over the subsidiary and ceases when the Company loses control of the subsidiary. Assets, liabilities, income and expenses of a subsidiary acquired or disposed of during the year are included in the statement of comprehensive income from the date the Company gains control until the date the Company ceases to control the subsidiary.
Profit or loss and each component of other comprehensive income (OCI) are attributed to the equity holders of the parent of the Company and to the non-controlling interests, even if this results in the non-controlling interests having a deficit balance. When necessary, adjustments are made to the financial statements of
subsidiaries to bring their accounting policies into line with the Company’s accounting policies. All intra-group assets and liabilities, equity, income, expenses and cash flows relating to transactions between members of the Company are eliminated in full on consolidation.
A change in the ownership interest of a subsidiary, without a loss of control, is accounted for as an equity transaction. If the Company loses control over a subsidiary, it: de-recognises the assets (including goodwill) and liabilities of the subsidiary; de-recognises the carrying amount of any non-controlling interests; de-recognises the cumulative translation differences recorded in equity; recognises the fair value of the consideration received; recognises the fair value of any investment retained; recognises any surplus or deficit in profit or loss; reclassifies the parent’s share of components previously recognised in OCI to profit or loss or retained earnings, as appropriate, as would be required if the Company had directly disposed of the related assets or liabilities.
D. Foreign currencyIn preparing the financial statements of the individual entities transactions in foreign currencies are translated at the foreign exchange rate ruling at the date of the transaction. Monetary assets and liabilities denominated in foreign currencies at the year-end date are translated to Australian dollars at the foreign exchange rate ruling at that date. Foreign exchange differences arising on translation are recognised in profit or loss. Non-monetary assets and liabilities that are measured in terms of historical cost in a foreign currency are translated using the exchange rate at the date of the transaction. Non-monetary assets and liabilities denominated in foreign currencies that are stated at fair value are translated to Australian dollars at foreign exchange rates ruling at the dates the fair value was determined.
On consolidation, the assets and liabilities of foreign operations, including goodwill and fair value adjustments arising on consolidation
are translated to Australian dollars at foreign exchange rates ruling at the year end date. The revenues and expenses of foreign operations, are translated to Australian dollars at rates approximating the foreign exchange rates ruling at the dates of the transactions. Foreign exchange differences arising on retranslation are recognised directly in other comprehensive income and accumulated in the translation reserve.
E. Fair value measurementFair value is the price that would be received to sell an asset or paid to transfer a liability in an orderly transaction between market participants at the measurement date. The fair value measurement is based on the presumption that the transaction to sell the asset or transfer the liability takes place either:
i) in the principal market for the assets or liability; or
ii) in the absence of a principal market, in the most advantageous market for the asset or liability.
The principal or the most advantageous market must be accessible by the Company.
The fair value of an asset or a liability is measured using the assumptions that market participants would use when pricing the asset or liability, assuming that market participants act in their economic best interest.
A fair value measurement of a non-financial asset takes into account a market participant’s ability to generate economic benefits by using the asset in its highest and best use or by selling it to another market participant that would use the asset in its highest and best use.
The Company uses valuation techniques that are appropriate in the circumstances and for which sufficient data are available to measure fair value, maximising the use of relevant observable inputs and minimising the use of unobservable inputs.
For
per
sona
l use
onl
y

Integrated Research and its controlled entities Annual Report 201954
Financial statements
Note 1: Significant accounting policies (cont.)All assets and liabilities for which fair value is measured or disclosed in the financial statements are categorised within the fair value hierarchy, described as follows, based on the lowest level input that is significant to the fair value measurement as whole:
• Level 1 - Quoted (unadjusted) market prices in active markets for identical assets or liabilities.
• Level 2 - Valuation techniques for which the lowest level input that is significant to the fair value measurement is directly or indirectly observable.
• Level 3 - Valuation techniques for which the lowest level input that is significant to the fair value measurement is unobservable.
For assets and liabilities that are recognised in the financial statements at fair value on a recurring basis, the Company determines whether transfers have occurred between levels in the hierarchy by re-assessing categorisation (based on the lowest level input that is significant to the fair value measurement as a whole) at the end of each reporting period.
F. Derivative financial instrumentsThe consolidated entity uses derivative financial instruments to hedge its exposure to foreign exchange risks arising from operational activities. In accordance with its treasury policy, the consolidated entity does not hold or issue derivative financial instruments for trading purposes.
Derivative financial instruments are recognised initially at fair value. Subsequent to initial recognition, derivative financial instruments are stated at fair value. The gain or loss on remeasurement to fair value is recognised immediately in profit or loss. However, where derivatives qualify for hedge accounting, recognition of any resultant gain or loss depends on the nature of the item being hedged.
The fair value of forward exchange contracts is their quoted market price at the year end date, being
the present value of the quoted forward price.
G. Hedging On entering into a hedging relationship, the consolidated entity normally designates and documents the hedge relationship and risk management objective and strategy for undertaking the hedge. The documentation includes identification of the hedging instrument, the hedged item or transaction, the nature of the risk being hedged and how the entity will assess the hedging instrument’s effectiveness in offsetting the exposure to changes in the item’s fair value or cash flows attributable to the hedged risk. Such hedges are expected to be highly effective in offsetting changes in fair value or cash flows and are assessed on an ongoing basis to determine that they actually have been highly effective throughout the financial reporting periods for which they are designated.
For cash flow hedges, the associated cumulative gain or loss is removed from equity and recognised in profit or loss in the same period or periods during which the hedged forecast transaction affects profit or loss. The ineffective part of any gain or loss is recognised immediately in the profit or loss.
H. Property, plant and equipmentItems of property, plant and equipment are stated at cost or deemed cost less accumulated depreciation and impairment losses (see accounting policy (l)). The cost of acquired assets includes (i) the initial estimate at the time of installation and during the period of use, when relevant, of the costs of dismantling and removing the items and restoring the site on which they are located, and (ii) changes in the measurement of existing liabilities recognised for these costs resulting from changes in the timing or outflow of resources required to settle the obligation or from changes in the discount rate.
Where parts of an item of property, plant and equipment have different useful lives, they are accounted for as separate items of property, plant and equipment.
Depreciation is provided on property, plant and equipment. Depreciation is calculated on a straight line basis so as to write off the net cost of each asset over its expected useful life to its estimated residual value. Leasehold improvements are depreciated over the period of the lease or estimated useful life, whichever is the shorter, using the straight line method. The estimated useful lives, residual values and depreciation method are reviewed annually, with the effect of any changes recognised on a prospective basis.
The following useful lives are used in the calculation of depreciation:
• Leasehold improvements 6 to 10 years
• Plant and equipment 4 to 8 years
I. Intangible assetsResearch and development
Expenditure on research activities, undertaken with the prospect of gaining new scientific or technical knowledge and understanding, is recognised in profit or loss as incurred.
Expenditure on development activities, whereby research findings are applied to a plan or design for the production of new or substantially improved products and processes, is capitalised if the product or process is technically and commercially feasible and the consolidated entity has sufficient resources to complete development.
The useful lives of the capitalised assets are assessed as finite. The expenditure capitalised includes the cost of materials, direct labour and an appropriate proportion of overheads. Other development expenditure is recognised in profit or loss as an expense as incurred.
Capitalised development expenditure is stated at cost less accumulated amortisation and impairment losses (see accounting policy (L)).
Amortisation is charged to profit or loss on a straight-line basis over the estimated useful life, but no more than three years.
For
per
sona
l use
onl
y

Integrated Research and its controlled entities Annual Report 2019 55
Note 1: Significant accounting policies (cont.)Intellectual property
Intellectual property acquired from third parties is amortised over its estimated useful life, but no more than three years.
Computer software
Computer software is stated at cost and amortised on a straight-line basis over a two and a half to three year period.
Customer Relationships
Customer relationships are initially measured at fair value and amortised over the estimated useful life, but no more than five years.
J. Trade and other receivablesTrade and other receivables are stated at their amortised cost less expected credit losses. To measure the expected credit losses the utilises the simplified approach in calculating the expected credit loss and recognises a loss allowance based on a lifetime expected credit losses at each reporting date. The Company has established a provision matrix calculated based on the group historical credit loss experience adjusted for forward looking factors.
Trade receivables are written off when there is no reasonable expectation of recovery.
For the trade receivables with extended payment terms beyond twelve months, the receivable is initially recognised at fair value calculated by applying a discount to the contracted cash flows. The discount rate applied is based upon the corporate borrowing rate that would apply to the type of customer, taking into account the customers’ credit worthiness based on its size and jurisdiction.
K. Cash and cash equivalentsCash and cash equivalents comprises cash balances and call deposits with an original maturity of three months or less.
L. ImpairmentThe carrying amounts of the consolidated entity’s assets are reviewed at each reporting date to determine whether there is any indication of impairment. If any such indication exists, the asset’s recoverable amount is estimated. Refer to Note 1 (U) for Goodwill impairment considerations.
For intangible assets that are not yet available for use, the recoverable amount is estimated at each year end date.
An impairment loss is recognised whenever the carrying amount of an asset or its cash generating unit exceeds its recoverable amount. Impairment losses are recognised in profit or loss unless the asset has previously been revalued, in which case the impairment loss is recognised as a reversal to the extent of that previous revaluation with any excess recognised through profit or loss.
The recoverable amount of other assets is the greater of their fair value less costs to sell and value in use.
In assessing value in use, the estimated future cash flows are discounted to their present value using a pre-tax discount rate that reflects current market assessments of the time value of money and their risk specific to the asset. For an asset that does not generate largely independent cash inflows, the recoverable amount is determined for the cash-generating unit to which the asset belongs.
M. Employee benefitsSuperannuation
Obligations for contributions to defined contribution pension plans are recognised as an expense in profit or loss as incurred. There are no defined benefit plans in operation.
Long‑term service benefits
The consolidated entity’s net obligation in respect of long-term service benefits, other than pension plans, is the amount of future benefit that employees have earned in return for their service in the current and prior periods. The obligation is calculated using expected future
increases in wage and salary rates including related on-costs and expected settlement dates, and is discounted using the rates attached to the high quality corporate bond rate at the year end date which have maturity dates approximating to the terms of the consolidated entity’s obligations.
Share‑based payment transactions
The performance rights programmes allow the consolidated entity’s employees to acquire shares of the Company. The fair value of performance rights granted are recognised as an employee expense with a corresponding increase in equity. The fair value is measured at grant date and spread over the period during which the employees become unconditionally entitled to the performance rights. The fair value of the instrument granted is measured using a Black-Scholes methodology, taking into account the terms and conditions upon which the options were granted. The amount recognised as an expense is adjusted to reflect the actual number of share options or performance rights that are expected to vest.
Wages, salaries, annual leave, and non‑monetary benefits
Liabilities for employee benefits for wages, salaries and annual leave represent present obligations resulting from employees’ services provided to the year end date, calculated at undiscounted amounts based on remuneration wage and salary rates that the consolidated entity expects to pay as at the year end date.
N. ProvisionsA provision is recognised in the statement of financial position when the consolidated entity has a present legal or constructive obligation as a result of a past event, and it is probable that an outflow of economic benefits will be required to settle the obligation. Provisions are determined by discounting the expected future cash flows at a pre-tax rate that reflects current market assessments of the time value of money and, where appropriate, the risks specific to the liability.
For
per
sona
l use
onl
y

Integrated Research and its controlled entities Annual Report 201956
Financial statements
Note 1: Significant accounting policies (cont.)Employee benefits
Provisions for employee benefits include liabilities for annual leave and long service leave and are measured at the amounts expected to be paid when the liabilities are settled.
Make good
The make good provision is for leases undertaken by the Company. For each provision raised a corresponding asset has been recognised and is amortised over the shorter of the term of the lease or the useful life of the asset.
O. Trade and other payablesTrade and other payables are stated at their amortised cost.
P. RevenueRevenue from contracts with customers is recognised either at a point in time (licence fees) or over time (maintenance, SaaS, testing solutions and professional services fees), regardless of when payment is received. Amounts disclosed as revenue are net of agency commissions and discounts. Where the Company bundles the products or services, the transaction price is allocated to each performance obligation based on the proportionate stand-alone selling prices.
Licence fees are recognised on delivery of the licence key, where the Company’s contracts with customers provide the right to use the Company’s intellectual property. As such, the Company’s performance obligation is satisfied at the point in time which the customer receives the licence key.
Maintenance fees are recognised on a monthly basis over the term of the service agreement, which may range between one to five years. Services provided to customers under maintenance contracts include technical support and supply of software upgrades.
SaaS fees are recognised on a monthly basis over the term of the service agreement which may range between one to five years.
The Company’s contracts with customers provide a right of access to the Company’s intellectual property (hosted on the Company’s cloud environment) for the duration of the term of the contract.
Testing solutions services revenues are recognised either rateably over a service period or as services are rendered. Testing services relate to the provision of services to performing testing of customer environments.
Professional services (formerly referred to as consulting) are revenues recognised as the services are rendered, typically in accordance with the achievement of contract milestones or hours expended. Professional services include implementation and configuration services for licenced software.
Unsatisfied performance obligations are disclosed as deferred revenue on the consolidated statement of financial position. Where the Company has a multiyear non-cancellable contractual commitment but does not expect to satisfy the performance obligation within twelve months, no deferred revenue or trade receivable is recognised.
The Company typically provides multi-year payment terms to customers ranging between one to five years. For such contracts with customers, the transaction price is discounted using a rate that would be reflected in a separate financing transaction between the Company and the customer. This amount is recognised rateably as finance income over the payment period.
Directly related contract costs in obtaining the customer contracts are expensed unless they are incremental to obtaining the contract and the Company expects to recover those costs. These costs are recognised as contract assets and amortised over the life of the contract they relate to. The incremental costs in obtaining customer contracts for the Company relate to specified commissions paid to employees which meet the criteria of directly related contract costs.
No revenue is recognised if there are significant uncertainties regarding the recovery of the transaction price, the costs incurred or to be incurred cannot be measured reliably or there is a risk of return.
Q. ExpensesOperating lease payments
Payments made under operating leases are recognised in profit or loss on a straight-line basis over the term of the lease. Lease incentives received are recognised in profit or loss as an integral part of the total lease expense and spread over the lease term.
R. Financing incomeFinancing income comprises interest receivable on funds invested, the financing component of the sale of licences and interest payable on borrowings.
S. Income taxIncome tax on the profit or loss for the periods presented comprises current and deferred tax. Income tax is recognised in profit or loss except to the extent that it relates to items recognised directly in equity, in which case it is recognised in equity.
Current tax is the expected tax payable on the taxable income for the year, using tax rates enacted or substantively enacted at the year end date, and any adjustment to tax payable in respect of previous years.
Deferred tax is recognised on temporary differences between the carrying amounts of assets and liabilities for financial reporting purposes and the amounts used for taxation purposes. The amount of deferred tax provided is based on the expected manner of realisation or settlement of the carrying amount of assets and liabilities, using tax rates enacted or substantively enacted at the year end date.
A deferred tax asset is recognised only to the extent that it is probable that future taxable profits will be available against which the asset can be utilised. Deferred tax assets are reduced to the extent that it is no longer probable that the related tax benefit will be realised.
Additional dividend franking deficit tax that arises from the distribution of dividends are recognised at the same time as the liability to pay the related dividend.
For
per
sona
l use
onl
y

Integrated Research and its controlled entities Annual Report 2019 57
Note 1: Significant accounting policies (cont.)
T. Goods and Services TaxRevenue, expenses and assets are recognised net of the amount of goods and services tax (GST), or similar taxes, except where the amount of GST incurred is not recoverable from the taxation authority. In these circumstances, the GST is recognised as part of the cost of acquisition of the asset or as part of the expense.
Receivables and payables are stated with the amount of GST included. The net amount of GST recoverable or payable is included as a current asset or liability in the statement of financial position.
Cash flows are included in the statement of cash flows on a gross basis. The GST components of cash flows arising from investing and financing activities, which are recoverable or payable are classified as operating cash flows.
U. Business combination and goodwillBusiness combinations are accounted for using the acquisition method. The cost of an acquisition is measured as the aggregate of the consideration transferred at acquisition date measured at fair value. Any contingent consideration to be transferred by the acquirer will be recognised at fair value at the acquisition date. Changes in the fair value of the contingent consideration are recognised in the Statement of Comprehensive Income.
Goodwill is initially measured at cost, being the excess of the aggregate of the consideration transferred over the net identifiable assets acquired and liabilities assumed. Goodwill is tested annually for impairment. Acquisition-related costs are expensed as incurred and included in administrative expenses.
V. Significant accounting judgements, estimates and assumptionsThe carrying amounts of certain assets and liabilities are often determined based on estimates and assumptions of future events. The key estimates and assumptions that have a significant risk of causing a material adjustment to the carrying amounts of certain assets and liabilities within the next annual reporting period are:
Intangible assets ‑ Development
An intangible asset arising from development expenditure on an internal project is recognised only when the consolidated entity can demonstrate the technical feasibility of completing the intangible asset so that it will be available for use or sale, its intention to complete and its ability to use or sell the asset, how the asset will generate future economic benefits, the availability of resources to complete the development and the ability to measure reliably the expenditure attributable to the intangible asset during its development. Following the initial recognition of the development expenditure, the cost model is applied requiring the asset to be carried at cost less any accumulated amortisation and accumulated impairment losses. Any expenditure so capitalised is amortised over the period of expected benefits from the related project commencing from the commercial release of the project. The carrying value of an intangible asset arising from development expenditure is tested for impairment annually when the asset is not yet available for use or more frequently when an indication of impairment arises during the reporting period.
Intangible assets ‑ Goodwill
Goodwill acquired from business acquisitions is initially measured at cost. Goodwill is tested annually for impairment or earlier if changes in circumstances indicate a potential impairment, the impairment policy is explained in note 1(L). The impairment testing requires judgements over future cashflow streams and assumptions used in the calculations.
Share based payment transactions
The consolidated entity measures the cost of equity-settled transactions with employees by reference to the fair value of the equity instruments at the date at which they are granted. The fair value is determined by using a Black-Scholes methodology and applying management determined probability factors relating to non-market vesting conditions.
Provision for expected credit losses of trade and other receivables
The company uses a provision matrix to calculate the expected credit loss for trade and other receivables. The provision rates are based on the days overdue and differ by geography. The provision matrix is based on the historical default experience for the Company and adjusted for forward-looking information and includes the use of macroeconomic information where appropriate. The determination of the provision rates is considered a significant estimate as it is sensitive to change in circumstances and of forecast of economic conditions. The expected credit loss also may not be representative of the customers’ actual default in the future.
For
per
sona
l use
onl
y

Integrated Research and its controlled entities Annual Report 201958
Financial statements
Note 2. Segment reportingThe Chief Operating Decision Maker (CODM), being the Chief Executive Officer, reviews a variety of information on the performance of Prognosis across the group for the purpose of resource allocation. The CODM monitors profit at a group level for the Prognosis group.
The principal geographical regions are The Americas - Operating from the United States with responsibility for the countries in North, Central and South America, Europe - operating from the United Kingdom and Germany with responsibility for the countries in Europe, Asia Pacific - operating from Australia and Singapore with responsibility for the countries in the rest of the world and Corporate Australia - with responsibility for research and development and corporate head office functions of the Company. Inter-segment pricing is determined on an arm’s length basis.
Segment profit represents the profit earned by each segment without allocation of investment revenue and income tax expense.
Information regarding these geographic segments is presented below. The accounting policies of the reportable segments are the same as the Group’s accounting policies.
Americas Europe Asia PacificCorporate Australia1 Eliminations Consolidated
In thousands of AUD 2019 2018 2019 2018 2019 2018 2019 2018 2019 2018 2019 2018
Sales to customers outside the consolidated entity
69,362 64,176 16,885 13,740 15,052 13,189 (479) 70 - - 100,820 91,175
Inter-segment revenue - - - - - - 52,629 46,615 (52,629) (46,615) - -
Total segment revenue 69,362 64,176 16,885 13,740 15,052 13,189 52,150 46,685 (52,629) (46,516) 100,820 91,175
Total revenue 100,820 91,175
Segment results (before finance income and tax)
2,075 1,925 420 342 441 379 25,964 23,202 - - 28,900 25,848
Results from operating activities 28,900 25,848
Financing income 747 423
Income tax expense (7,796) (7,091)
Profit for the year 21,851 19,180
Capital additions2 234 273 88 105 121 81 700 1,104 - - 1,143 1,563
Depreciation and amortisation expenditure
426 443 94 90 70 44 10,745 10,005 - - 11,335 10,582
Americas (USD)
Europe (GBP)
In local currency3 2019 2018 2019 2018
Sales to customers outside the consolidated entity
49,696 49,519 9,360 7,849
Inter-segment sales - - - -
Total segment revenue 49,696 49,519 9,360 7,849
Segment results 1,491 1,485 234 196
1 Corporate Australia includes both the research and development, hedging and corporate head office functions of Integrated Research Limited.
2 Excludes internal development costs capitalised but includes third party assets acquired. Additions also include assets acquired through the purchase of businesses.
3 Segment results represented in local currencies.
For
per
sona
l use
onl
y
Integrated Research and its controlled entities Annual Report 2019 59
Note 3. Revenue from contracts with customersInformation regarding the disaggregation of the Company’s revenues from contracts with customers is presented below.
Consolidated
In thousands of AUD 2019 2018
Timing of Revenue Recognition:
At a point in time 62,774 52,591
Over time 38,046 38,584
Total Revenue from contracts with customers 100,820 91,175
Type of product Group
Unified communications 51,043 54,865
Infrastructure 26,343 20,568
Payments 16,047 8,375
Professional services 7,387 7,367
Total Revenue 100,820 91,175
The transaction price allocated to the remaining performance obligations (unsatisfied or partially unsatisfied) as at 30 June 2019 is $13,656,000 and is expected to be recognised as revenue in two to five years. This amount relates to contracts with customers where the Company has a multi-year non-cancellable contractual commitment but does not expect to satisfy the performance obligation within twelve months, and no deferred revenue or trade receivable is recognised.
Note 4. ExpenditureTotal expenditure includes:
Consolidated
In thousands of AUD 2019 2018
Employee benefits expense:
Defined contribution plans 2,644 2,414
Equity settled share-based payments 111 950
Other employee benefits 50,268 46,556
53,023 49,920
Depreciation and amortisation 11,335 10,582
Bad and doubtful debt expense 264 350
Operating lease rental expenses 1,954 2,102
For
per
sona
l use
onl
y
Integrated Research and its controlled entities Annual Report 201960
Financial statements
Note 5. Other gains and (losses)
Consolidated
In thousands of AUD Note 2019 2018
Writeback of deferred consideration for acquisition ‑ 1,496
Loss on sale of financial assets 23 (324) (738)
Currency exchange gains/(losses) 1,636 802
1,312 1,560
The prior year write-back reflects the fair value of the deferred consideration based on the prior year actual results. The deferred consideration was based upon IQ Services achieving EBITDA milestones over the three years between 1 July 2015 and 30 June 2018. There were catch-up mechanisms over the three year period with the potential final payment ranging between $nil and $3.5 million which were not met.
Note 6. Finance income
Consolidated
In thousands of AUD 2019 2018
Interest income 799 518
Interest on borrowings (52) (95)
747 423
For
per
sona
l use
onl
y

Integrated Research and its controlled entities Annual Report 2019 61
Note 7. Auditors’ remuneration
Consolidated
In AUD 2019 2018
Remuneration for audit and review of the financial reports of the Company or any entity in the consolidated entity:
Audit and review of financial reports
Auditors of the Company 259,995 275,080
Other auditors ‑ -
Remuneration for other services by the auditors of the Company or any entity in the consolidated entity:
‑ -
Taxation services:
Auditors of the Company 163,602 114,451
Note 8. Income tax expense Recognised in profit for the year
Consolidated
In thousands of AUD Note 2019 2018
Current tax expense:
Current year 9,043 8,636
Prior year adjustments (290) (244)
8,753 8,392
Deferred tax expense:
Origination and reversal of temporary differences 15 (957) (1,301)
Total income tax expense in profit and loss 7,796 7,091
Numerical reconciliation between income tax expense and profit before tax
Consolidated
In thousands of AUD 2019 2018
Profit before tax 29,647 26,271
Income tax using the domestic corporate tax rate of 30% 8,894 7,881
Increase in income tax expense due to:
Non-deductible expenses 60 303
Effect of tax rates in foreign jurisdictions 83 321
Other 154 214
Decrease in income tax expense due to:
R&D tax incentive (1,105) (901)
Write-back of deferred consideration for acquisition ‑ (483)
Prior year adjustments (290) (244)
Income tax expense 7,796 7,091
For
per
sona
l use
onl
y
Integrated Research and its controlled entities Annual Report 201962
Financial statements
Note 9. Earnings per shareThe calculation of basic and diluted earnings per share at 30 June 2019 was based on the profit attributable to ordinary shareholders of $21,851,000 (2018: 19,180,000); a weighted number of ordinary shares outstanding during the year ended 30 June 2019 of 171,794,468 (2018: 171,436,022); and a weighted number of ordinary shares (diluted) outstanding during the year ended 30 June 2019 of 172,108,542 (2018: 172,067,466), calculated as follows:
Consolidated
In thousands of AUD 2019 2018
Profit for the year 21,851 19,180
Weighted average number of shares used as the denominator Consolidated
Number 2019 2018
Number for basic earnings per share:
Ordinary shares 171,794,468 171,436,022
Effect of employee share plans on issue 314,074 631,444
Number for diluted earnings per share 172,108,542 172,067,466
Basic earnings per share (AUD cents) 12.72 11.19
Diluted earnings per share (AUD cents) 12.70 11.15
Note 10. Cash and cash equivalents
Consolidated
In thousands of AUD 2019 2018
Cash at bank and on hand 9,316 11,238
For
per
sona
l use
onl
y

Integrated Research and its controlled entities Annual Report 2019 63
Note 11. Trade and other receivables
Current Consolidated
In thousands of AUD 2019 2018
Trade debtors 52,534 45,374
Less: Allowance for expected credit losses (1,417) (1,346)
51,117 44,028
GST receivable 261 158
51,378 44,186
Non‑current Consolidated
In thousands of AUD 2019 2018
Trade debtors 21,389 26,892
The Company provides customers of good credit worthiness extended payment plans over the committed term of the licence contract ranging between one to five years. For customers not on extended payment plans the credit period on sales range from 30 to 90 days.
Ageing of past due but not impaired: Consolidated
In thousands of AUD Note 2019 2018
Past due 30 days 3,195 2,292
Past due 60 days 2,329 1,594
Past due 90 days 3,595 903
Total 23 9,119 4,789
The movement in the allowance for expected credit losses in respect of trade receivables is detailed below:
Consolidated
In thousands of AUD 2019 2018
Balance at beginning of year 1,346 1,454
Amounts written off during the year (193) (458)
(Decrease)/increase in provision 264 350
Balance end of year 1,417 1,346
The Company has used the following criteria to assess the allowance loss for expected credit losses shown above:
• historical default experience;
• macroeconomic factors specific to the geography of the customer;
• an individual account by account specific risk assessment based on past credit history; and
• any prior knowledge of debtor insolvency or other credit risk.
Included in the Company’s trade receivable balance are debtors which are 90 days past due at the reporting date which the Company has not provided for as there has been no significant change in credit quality and the consolidated entity believes that the amounts are still recoverable. The Company does not hold any collateral over these balances.F
or p
erso
nal u
se o
nly

Integrated Research and its controlled entities Annual Report 201964
Financial statements
Note 12. Other assets
Current Consolidated
In thousands of AUD 2019 2018
Other prepayments 2,104 1,783
Contract assets 1,029 -
Fair value of hedge asset - forward foreign exchange contracts ‑ 9
3,133 1,792
Non‑current Consolidated
In thousands of AUD 2019 2018
Contract assets 829 -
829 -
Note 13. Other financial assets
Consolidated
In thousands of AUD 2019 2018
Deposits 236 255
The carrying amount of other financial assets is a reasonable approximation of their fair value.
Note 14. Property, plant and equipment
Plant and Equipment Consolidated
In thousands of AUD 2019 2018
At cost 6,277 5,325
Accumulated depreciation (4,397) (3,672)
1,880 1,653
Leasehold Improvements Consolidated
In thousands of AUD 2019 2018
At cost 3,442 3,292
Accumulated depreciation (2,691) (2,398)
751 894
Total property, plant and equipment Consolidated
In thousands of AUD 2019 2018
At cost 9,719 8,617
Accumulated depreciation (7,088) (6,070)
Total written down amount 2,631 2,547
For
per
sona
l use
onl
y

Integrated Research and its controlled entities Annual Report 2019 65
Note 14. Property, plant and equipment (cont.)
Plant and Equipment Consolidated
In thousands of AUD 2019 2018
Carrying amount at start of year 1,653 1,304
Additions 872 896
Effects of foreign currency exchange 30 22
Depreciation expense (675) (569)
Carrying amount at end of year 1,880 1,653
Leasehold Improvements Consolidated
In thousands of AUD 2019 2018
Carrying amount at start of year 894 569
Additions 206 629
Effects of foreign currency exchange (71) 10
Depreciation expense (278) (314)
Carrying amount at end of year 751 894
Note 15. Deferred tax assets and liabilities Deferred tax assets and liabilities are attributable to the following:
Consolidated Assets Liabilities Net
In thousands of AUD 2019 2018 2019 2018 2019 2018
Intangible assets ‑ - 5,799 5,454 (5,799) (5,454)
Trade and other payables 268 619 ‑ - 268 619
Employee benefits 1,095 1,140 365 - 730 1,140
Provisions 420 170 ‑ - 420 170
Other current liabilities 628 206 ‑ - 628 206
Unrealised foreign exchange gain ‑ - 798 275 (798) (275)
Deferred tax assets/(liabilities) 2,411 2,135 6,962 5,729 (4,551) (3,594)
Set off of deferred tax asset (1,125) (1,448) (1,125) (1,448) ‑ -
Net deferred tax assets/(liabilities) 1,286 687 5,837 4,281 (4,551) (3,594)
For
per
sona
l use
onl
y

Integrated Research and its controlled entities Annual Report 201966
Financial statements
Note 15: Deferred tax assets and liabilities (cont.)Movement in temporary differences during the year:
For year ended 30 June 2019 Consolidated
In thousands of AUDBalance 1 July 18
Recognised in income
Recognised in equity
Balance 30 June 19
Intangible assets (5,454) (345) ‑ (5,799)
Trade and other payables 619 (351) ‑ 268
Employee benefits 1,140 (721) 311 730
Provisions 170 250 ‑ 420
Other current liabilities 206 422 ‑ 628
Unrealised foreign exchange gain (275) (523) ‑ (798)
(3,594) (1,268) 311 (4,551)
For year ended 30 June 2018 Consolidated
In thousands of AUDBalance 1 July 17
Recognised in income
Recognised in equity
Balance 30 June 18
Intangible assets (4,746) (708) - (5,454)
Trade and other payables 321 298 - 619
Employee benefits 1,260 (120) - 1,140
Provisions 553 (383) - 170
Other current liabilities 77 129 - 206
Unrealised foreign exchange gain - (275) - (275)
Unrealised foreign exchange loss 242 (242) - -
(2,293) (1,301) - (3,594)
For
per
sona
l use
onl
y

Integrated Research and its controlled entities Annual Report 2019 67
Note 16. Intangible assetsThe balance of capitalised intangible assets comprises:
Cost Consolidated
In thousands of AUDSoftware
developmentThird party
software GoodwillCustomer
Relationship Total
Balance at 1 July 2017 28,808 1,378 3,203 780 34,169
Fully amortised & offset - - - - -
Internally developed 11,524 - - - 11,524
Purchased - 38 - - 38
Effects of foreign currency exchange - 8 131 32 171
Balance at 30 June 2018 40,332 1,424 3,334 812 45,902
Balance at 1 July 2018 40,332 1,424 3,334 812 45,902
Fully amortised & offset (11,429) (26) ‑ ‑ (11,455)
Internally developed 11,275 ‑ ‑ ‑ 11,275
Purchased ‑ 65 ‑ ‑ 65
Effects of foreign currency exchange ‑ 10 190 47 247
Balance at 30 June 2019 40,178 1,473 3,524 859 46,034
Amortisation Consolidated
In thousands of AUDSoftware
developmentThird party
software GoodwillCustomer
Relationship Total
Balance at 1 July 2017 12,705 1,218 - 312 14,235
Fully amortised & offset - - - - -
Amortisation for year 9,448 98 - 155 9,701
Effects of foreign currency exchange - 8 - 20 28
Balance at 30 June 2018 22,153 1,324 - 487 23,964
Balance at 1 July 2018 22,153 1,324 ‑ 487 23,964
Fully amortised & offset (11,429) (26) ‑ ‑ (11,455)
Amortisation for year 10,215 ‑ ‑ 167 10,382
Effects of foreign currency exchange ‑ 10 ‑ 32 42
Balance at 30 June 2019 20,939 1,308 ‑ 686 22,933
Carrying amounts Consolidated
In thousands of AUDSoftware
developmentThird party
software GoodwillCustomer
Relationship Total
Balance at 30 June 2018 18,179 100 3,334 325 21,938
Balance at 30 June 2019 19,239 165 3,524 173 23,101For
per
sona
l use
onl
y

Integrated Research and its controlled entities Annual Report 201968
Financial statements
Note 17. Goodwill Goodwill arose on the acquisition of IQ Services business in the year ending 30 June 2016. Management has identified the Group as the cash generating unit (the Prognosis CGU) to which goodwill is allocated for impairment testing. Management performs its annual impairment testing at least annually. The carrying value of goodwill at 30 June 2019 is $3,524,000 (2018: $3,334,000). A reconciliation of the movement in goodwill is included in Note 16.
The recoverable amount of the Prognosis CGU has been determined using a value in use approach. The value in use has been based on the following key assumptions:
1. Cash flow forecasts
The cash flow forecasts are based upon a Board approved 2019 budget and management projections for the subsequent four years of the Prognosis CGU.
2. Discount rate
Discount rate of 11% (2018: 11%) applied for value in use calculation is based on the post-tax weighted average cost of capital applicable to the Prognosis CGU.
3. Terminal value
The terminal growth rate after the five year projection period has been calculated using a growth rate of 3% (2018: 3%) which is determined by Management based on their assessment of expected long term annual growth for the software industry.
The value in use does not indicate any impairment is required at 30 June 2019.
Management believe that a reasonable change in any of the above key assumptions would not cause the carrying values to exceed their recoverable amounts.
Note 18. Trade and other payables
Consolidated
In thousands of AUD 2019 2018
Trade and other creditors 9,797 10,140
The average credit period on trade and other payables is 30 days.
Note 19. Employee benefits
Consolidated
In thousands of AUD 2019 2018
Current
Liability for annual leave 2,178 2,143
Liability for long service leave 1,019 942
3,197 3,085
Non‑current
Liability for long service leave 201 242
Pension plans
Employees of the consolidated entity accumulate pension benefits through statutory contributions by the entities in the consolidated entity as required by the laws of the jurisdictions in which they operate, supplemented by individual contributions.
For
per
sona
l use
onl
y

Integrated Research and its controlled entities Annual Report 2019 69
Note 19. Employee benefits (cont.)Share based payments
Performance Rights
On 21 November 2011, the consolidated entity established the Integrated Research Performance Rights and Options Plan (IRPROP). The plan enables the Company to offer performance rights to eligible employees to obtain shares in Integrated Research at no cost contingent upon performance conditions being met. The performance conditions include either a service period with performance components or a service period with a net after tax profit hurdle. The performance rights are automatically exercised into shares upon the performance conditions being met. The following performance rights were granted during the period:
Grant Date Number of Rights Earliest Vesting Date Expiry date
Sep-18 120,000 Aug 2021 Sep 2021
Dec-18 194,750 Oct 2021 Nov 2021
Jan-19 89,988 Feb 2022 Mar 2022
Feb-19 40,000 Feb 2021 Mar 2021
The fair value of the performance rights including assumptions used are as follows:
Grant date Sep 2018 Dec 2018 Jan 2019 Feb 2019
Fair value at measurement date $2.265 $1.532 $2.286 $2.284
Share price $2.45 $1.71 $2.49 $2.42
Exercise price nil nil nil nil
Expected volatility 50% 50% 50% 50%
Contractual life (expressed in days) 1,082 1,022 1,110 731
Expected dividends 2.65% 3.81% 2.81% 2.89%
Risk-free interest rate (based on 3 year treasury bonds) 1.5% 1.5% 1.5% 1.5%
Model Used Black Scholes Black Scholes Black Scholes Black Scholes
The fair values of services received in return for performance rights granted to employees is measured by reference to the fair value of share options granted.
During the year ended 30 June 2019, the consolidated entity recognised an expense through profit of $111,000 related to the fair value of performance rights (2018: $950,000).
The following table provides the movement in performance rights during the year:
In thousands of performance rights 2019 2018
Outstanding at the beginning of the year 1,000 1,801
Forfeited during the year (474) (511)
Exercised during the year (180) (1,100)
Granted during the year 445 810
Outstanding at the end of the year 791 1,000
Exercisable at the end of the year (vested) ‑ -For
per
sona
l use
onl
y
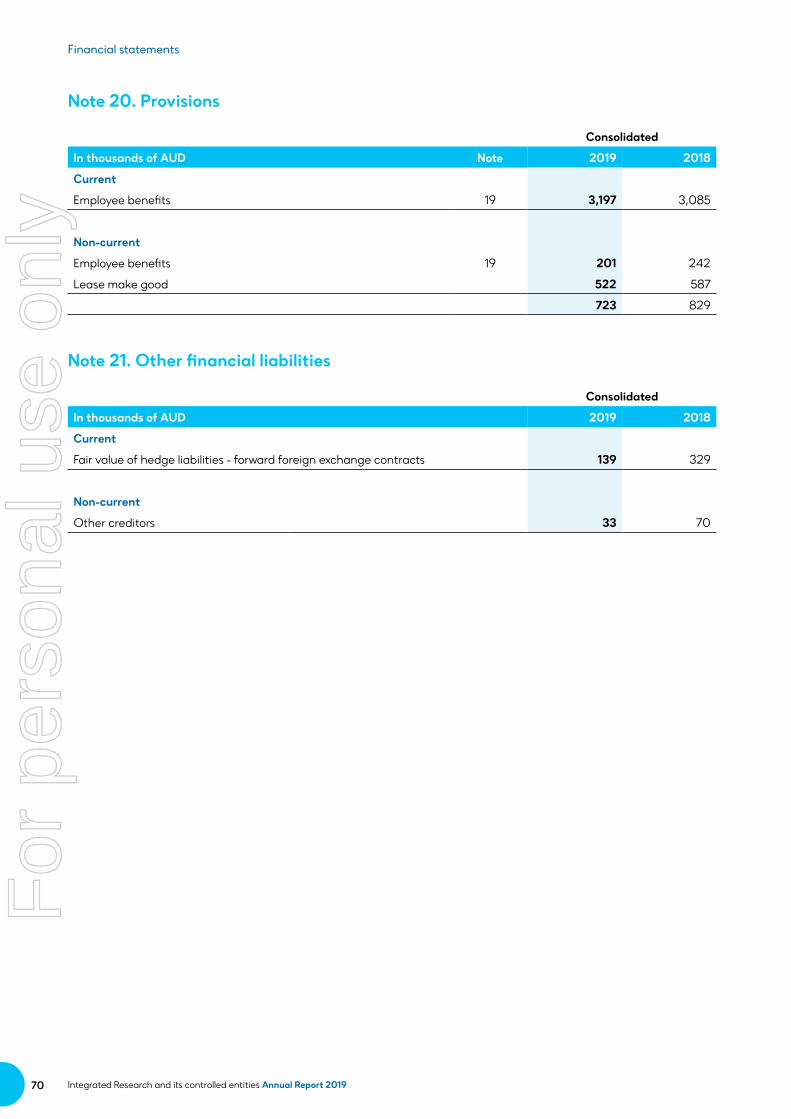
Integrated Research and its controlled entities Annual Report 201970
Financial statements
Note 20. Provisions
Consolidated
In thousands of AUD Note 2019 2018
Current
Employee benefits 19 3,197 3,085
Non‑current
Employee benefits 19 201 242
Lease make good 522 587
723 829
Note 21. Other financial liabilities
Consolidated
In thousands of AUD 2019 2018
Current
Fair value of hedge liabilities - forward foreign exchange contracts 139 329
Non‑current
Other creditors 33 70
For
per
sona
l use
onl
y

Integrated Research and its controlled entities Annual Report 2019 71
Note 22. Capital and reserves
Share capital Ordinary shares
In thousands of shares 2019 2018
On issue 1 July 171,681 170,581
Issued against employee performance right exercised 180 1,100
On issue 30 June 171,861 171,681
The company does not have authorised capital or par value in respect of its issued shares.
The holders of ordinary shares are entitled to receive dividends as declared from time to time and are entitled to one vote per share at meetings of the Company. All shares rank equally with regard to the Company’s residual assets.
Hedging reserve
The hedging reserve comprises the effective portion of the cumulative net change in the fair value of cash flow hedging instruments related to hedged transactions that have not yet occurred.
Translation reserve
The translation reserve comprises all foreign exchange differences arising from the translation of the financial statements of foreign operations where their functional currency is different to the presentation currency of the consolidated entity, as well as from the translation of liabilities that hedge the consolidated entity’s net investment in a foreign subsidiary.
Employee benefit reserve
The employee benefit reserve arises on the grant of either share options or performance rights to employees under the Integrated Research Performance Rights and Option Plan (established November 2011) or the Employee Share Option Plan (established October 2000). Refer to note 19 for further details.
For
per
sona
l use
onl
y

Integrated Research and its controlled entities Annual Report 201972
Financial statements
Note 22. Capital and reserves (cont.)Dividends
Dividends recognised in the current year by the company are:
In thousands of AUDCents
per share Total amountFranked/
unfrankedDate of
payment
2019
Final 2018 3.5 6,012 100% franked 16 Oct 2018
Interim 2019 3.5 6,015 100% franked 16 Apr 2019
Total amount 12,027
2018
Final 2017 3.5 5,987 100% franked 26 Sep 17
Interim 2018 3.0 5,150 100% franked 10 Apr 18
Total amount 11,137
After the end of the financial year, the following dividend was proposed by the directors. The financial effect of this dividend has not been brought to account in the financial statements for the year ended 30 June 2019 and will be recognised in subsequent financial statements:
In thousands of AUDCents
per share Total amountFranked/
unfrankedDate of
payment
Final 2019 3.75 6,445 100% franked 15 Oct 2019
The final dividend declared of 3.75 cents together with the interim dividend paid in April 2019 of 3.5 cents takes total dividends for the 2019 financial year to 7.25 cents.
Franking account disclosure: Company
In thousands of AUD 2019 2018
Adjusted franking account balance 8,254 7,260
Impact on franking account balance of dividends not recognised (2,762) (2,575)
For
per
sona
l use
onl
y

Integrated Research and its controlled entities Annual Report 2019 73
Note 23. Financial instruments
Capital risk managementThe consolidated entity manages its capital to ensure that controlled entities will be able to continue as a going concern while maximising the return to stakeholders through the optimisation of treasury management.
The capital structure of the consolidated entity consists of cash and cash equivalents and equity attributable to equity holders of the company, comprising issued capital, reserves, and retained earnings as disclosed in Notes 10 and 22 respectively.
Borrowing facility The Company has available a $10 million multicurrency revolving cash advance facility that is undrawn at 30 June 2019. The primary purpose of the facility is to fund working capital requirements.
The facility is secured by a General Security Agreement with a deed of cross guarantee including the parent entity, Integrated Research UK Limited, and Integrated Research Inc. The facility is also subject to certain debt covenants including a leverage ratio, interest cover ratio and capitalisation ratio. The Company met all the covenant requirements during the year. Interest is variable, linked to Bank Bill Swap Bid Rate (BBSY), plus a margin.
Bank guarantee facilityThe Company has a $900,000 bank guarantee facility. The primary purpose of the facility is to provide bank guarantees to the Company’s landlord pursuant to contractual lease arrangements. At 30 June 2018 and 2019, the total value of bank guarantees provided was $819,000. The facility terminates on 31 December 2019.
Significant accounting policiesDetails of the significant accounting policies and methods adopted, including the criteria for recognition, the basis of measurement and the basis on which income and expenses are recognised, in respect of each class of financial asset, financial liability and equity instrument are disclosed in Note 1 to the financial statements.
Financial risk management objectivesThe Board of Directors has overall responsibility for the establishment and oversight of the consolidated entity’s financial management framework. The Board has an established Audit and Risk Committee, which is responsible for developing and monitoring the consolidated entity’s financial management policies. The Committee provides regular reports to the Board of Directors on its activities.
The Audit and Risk Committee oversees how Management monitors compliance with risk management policies and procedures and reviews the adequacy of the risk management framework in relation to the risks.
The main risks arising from the consolidated entity’s financial instruments are currency risk, credit risk, liquidity risk and cash flow interest rate risk.
The consolidated entity seeks to minimise the effects of these risks, where deemed appropriate, by using derivative financial instruments to hedge these risk exposures. The use of financial derivatives is governed by the consolidated entity’s policies on foreign exchange risk, credit risk, the use of financial derivatives and non-derivative financial instruments, and the investment of excess liquidity. The consolidated entity does not enter into or trade financial instruments, including derivative financial instruments, for speculative purposes.
Market riskThe consolidated entity’s activities expose it primarily to the financial risks of changes in foreign currency exchange rates and cash flow interest rate risks. The consolidated entity enters into foreign exchange forward contracts to hedge the exchange rate risk arising from transactions not recorded in an entity’s functional currency.F
or p
erso
nal u
se o
nly

Integrated Research and its controlled entities Annual Report 201974
Financial statements
Note 23. Financial instruments (cont.)
Foreign currency risk managementThe consolidated entity undertakes certain transactions denominated in foreign currencies, hence exposures to exchange rate fluctuations arise. Exchange rate exposures are managed within approved policy parameters utilising forward foreign exchange contracts.
The carrying amount of the consolidated entity’s foreign currency denominated monetary assets and monetary liabilities at the reporting date that are denominated in a currency that is different to the functional currency of the respective entities undertaking the transactions is as follows:
Consolidated
Liabilities Assets
In thousands of AUD 2019 2018 2019 2018
US Dollar 1,467 1,258 7,879 6,047
Euro ‑ - 3,339 1,396
Foreign currency sensitivityAt 30 June 2019, if the US Dollar and Euro weakened or strengthened against the Australian dollar by the percentage shown, with all other variables held constant, net profit for the year would increase (decrease) by:
Consolidated
Net profit Retained earnings
In thousands of AUD 2019 2018 2019 2018
US Dollar Impact 712 532 712 532
Euro Impact 371 155 371 155
Change in currency (i) - 10% decrease
US Dollar Impact (583) (435) (583) (435)
Euro Impact (304) (127) (304) (127)
Change in currency (i) - 10% increase
(i) This has been based on the change in the exchange rate against the Australian dollar in the financial years ended 30 June 2019 and 30 June 2018.
The sensitivity analysis has been based on the sensitivity rates used when reporting foreign currency risk internally to key management personnel and represents management’s assessment of the possible change in foreign exchange rates based on historical volatility.
In management’s opinion, the sensitivity analysis is not fully representative of the inherent foreign exchange risk as the year end exposure does not necessarily reflect the exposure during the course of the year. The consolidated entity includes certain subsidiaries whose functional currencies are different to the consolidated entity presentation currency. The main operating entities outside of Australia are based in the United States, the United Kingdom, Germany and Singapore. As stated in the consolidated entity’s accounting policies per Note 1, on consolidation the assets and liabilities of these entities are translated into Australian dollars at exchange rates prevailing at the year end date. The income and expenses of these entities is translated at the average exchange rates for the year. Exchange differences arising are classified as equity and are transferred to a foreign exchange translation reserve. The consolidated entity’s future reported profits could therefore be impacted by changes in rates of exchange between the Australian Dollar and United States Dollar, UK Sterling, Euro and Singapore Dollar each.
For
per
sona
l use
onl
y

Integrated Research and its controlled entities Annual Report 2019 75
Note 23. Financial instruments (cont.)
Forward foreign exchange contractsThe consolidated entity is exposed to foreign currency risk on sales and purchases that are denominated in a currency other than the AUD. The currencies giving rise to this risk are primarily United States Dollar, UK Sterling and the Euro.
The consolidated entity uses forward exchange contracts to hedge its foreign currency risk. The forward exchange contracts have maturities of less than two years after the year end date.
The consolidated entity classifies its forward exchange contracts hedging forecasted transactions as cash flow hedges and measures them at fair value. The following table details the forward foreign currency contracts outstanding as at reporting date:
Average Exchange Rate Foreign Currency Contract Value Fair Value
Outstanding contracts 2019 2018
2019FC’000
2018FC’000
2019A$’000
2018A$’000
2019A$’000
2018A$’000
Consolidated
Sell US Dollar
Less than 3 months 0.71 0.77 3,250 2,800 4,546 3,623 (82) (166)
3 to 6 months 0.72 0.77 1,750 2,000 2,444 2,619 (42) (86)
6 to 9 months 0.71 0.77 2,250 1,250 3,184 1,629 (7) (60)
9 to 12 months 0.71 0.74 1,000 1,250 1,415 1,687 (1) -
Sell Euros
Less than 3 months 0.62 0.64 250 150 405 235 (2) (3)
3 to 6 months 0.61 0.62 50 50 82 81 (1) 1
6 to 9 months 0.61 0.62 50 100 82 161 ‑ 1
9 to 12 months ‑ - ‑ - ‑ - ‑ -
Sell Sterling
Less than 3 months 0.56 0.58 100 70 179 120 (3) (5)
3 to 6 months 0.55 0.57 50 50 90 87 ‑ (3)
6 to 9 months 0.55 0.56 100 100 181 180 (1) 1
9 to 12 months ‑ - ‑ - ‑ - ‑ -
(139) (320)
These hedge assets and liabilities are classified as a level 2 fair value measurement, being derived from inputs provided from financial institutions, rather than quoted prices that are observable for the asset either directly (i.e. as prices) or indirectly (i.e. derived from prices). The fair value measurement of the over the counter forward contact would not qualify as Level 1 as there is not a quoted price for the actual contract, even though data used to value the contract may be derived entirely from active foreign-exchange and interest-rate market.
Credit risk managementCredit risk refers to the risk that a counterparty will default on its contractual obligations resulting in financial loss to the consolidated entity. The consolidated entity has adopted a policy of only dealing with creditworthy counterparties and obtaining sufficient collateral where appropriate, as a means of mitigating the risk of financial loss from defaults.
Trade receivables consist of a large number of customers, spread across diverse industries and geographical areas. The largest single counterparty balance with any one customer at 30 June 2019 was $5.3 million (2018: $4.5 million). Ongoing credit evaluation is performed on the financial condition of accounts. Subsequent to 30 June 2019, the Company has collected $2.7 million in overdue trade receivables.
For
per
sona
l use
onl
y

Integrated Research and its controlled entities Annual Report 201976
Financial statements
Note 23. Financial instruments (cont.)The Company continued its program to sell selected account receivable balances to a third party without recourse. The purpose of the program is to manage credit risk and improve working capital. During the year ended 30 June 2019 a total of $5.6 million (2018: $14.4 million) debtors were sold at a cost of $324,000 (2018: $738,000). The Company continues to bear maintenance support obligations to the end customers which are carried as a liability in the deferred revenue account of the Company’s balance sheet of $2.7 million (2018: $3.0 million).
The credit risk on liquid funds and derivative financial instruments is limited because the counterparties are banks with high credit ratings assigned by international credit-rating agencies.
Liquidity risk managementUltimate responsibility for liquidity risk management rests with the board of directors, who have built an appropriate liquidity risk management framework for the management of the consolidated entity’s short, medium and long-term funding and liquidity management requirements.
The consolidated entity manages liquidity risk by maintaining adequate reserves, by continuously monitoring forecast and actual cash flows and matching the maturity profiles of financial assets and liabilities.
All creditor and other payables shown in Note 18 and Note 21 for both 2019 and 2018 carry no interest obligation.
Fair value of financial instrumentsThe carrying value of financial assets and financial liabilities of the consolidated entity is a reasonable approximation of their fair value.
For non-current trade debtors Integrated Research has considered a discount rate to recognise the net present value of the debtors. Level 3 inputs have been considered including corporate borrowing rates, size of the customer and jurisdiction of the customer. A discounted cashflow model was used to derive the fair value. The range of discount rates was between 3.5% to 5.5%. The carrying value of non-current trade debtors for 2018 and 2019 of the consolidated entity was a reasonable approximation of their fair value.
Note 24. Operating leases Non-cancellable operating lease rental commitments is for office space with contracted payments as follows:
Consolidated
In thousands of AUD 2019 2018
Less than one year 1,721 2,001
Between one and five years 638 1,674
Greater than five years ‑ -
2,359 3,675
Note 25. Consolidated entities
Country of incorporation Ownership interest
2019 2018
Parent entity:
Integrated Research Limited Australia
Subsidiaries of Integrated Research Limited:
Integrated Research Inc USA 100% 100%
Integrated Research Singapore Pte Limited Singapore 100% 100%
Integrated Research UK Limited UK 100% 100%
Subsidiaries of Integrated Research UK Limited:
Integrated Research Germany GmbH Germany 100% 100%
For
per
sona
l use
onl
y

Integrated Research and its controlled entities Annual Report 2019 77
Note 26. Reconciliation of cash flows from operating activities
Consolidated
In thousands of AUD 2019 2018
Profit for the year 21,851 19,180
Depreciation and amortisation 11,335 10,582
Provision for expected credit loss 71 (108)
Interest received (799) (518)
Interest paid 52 95
Share-based payments expense 111 950
Net exchange differences (21) 883
Change in operating assets and liabilities:
(Increase)/decrease in trade debtors (1,618) (11,889)
(Increase)/decrease in future income tax benefit 216 579
(Increase)/decrease in other operating assets (2,151) (16)
Increase/(decrease) in trade and other payables (343) 520
Increase/(decrease) in other operating liabilities (9,911) 2,234
Increase/(decrease) in provision for income taxes payable (348) (2,316)
Increase/(decrease) in provision for deferred income taxes 1,556 841
Increase/(decrease) in other provisions 6 425
Impact of new accounting standards - AASB 15 1,230 -
Net cash from operating activities 21,237 21,442
Note 27. Key management personnel disclosuresKey management personnel compensation
The key management personnel compensation are as follows:
Consolidated
In AUD 2019 2018
Short-term benefits 2,953,412 3,400,669
Post-employment benefits 130,018 27,992
Long term benefit 28,520 150,592
Equity compensation benefits (212,364) 460,409
Termination benefits 66,548 -
2,966,134 4,039,662
Apart from the details disclosed in this note, no director has entered into a material contract with the consolidated entity since the end of the previous financial year and there were no material contracts involving directors’ interests existing at year-end.
Note 28. Related parties At 30 June 2019 Mr Steve Killelea, the Chairman (retired 1 November 2018) of the Company, owned either directly or indirectly 39.7% of the Company (2018: 39.7%).
The related entity of Mr Killelea provided consulting services totaling $55,000 in the year ended 30 June 2019.
For
per
sona
l use
onl
y

Integrated Research and its controlled entities Annual Report 201978
Financial statements
Note 29. Parent entity disclosures
Parent Entity
In thousands of AUD 2019 2018
Financial Position
Assets
Current assets 49,710 40,730
Non-current assets 19,731 20,553
Total Assets 69,441 61,283
Liabilities
Current Liabilities 9,028 9,505
Non-current liabilities 6,034 5,845
Total Liabilities 15,062 15,350
Net Assets 54,379 45,933
Equity
Issued Capital 1,667 1,667
Employee benefits Reserve 3,536 3,445
Hedging reserve (51) (146)
Retained Earnings 49,227 40,964
Total Equity 54,379 45,933
Financial Performance
Profit for the year 20,168 17,660
Other comprehensive income 95 (176)
Total comprehensive income 20,263 17,484
Investments in subsidiaries are included at cost.
Note 30. Subsequent events Dividends
For dividends declared after 30 June 2019 see Note 22 in the financial statements. The financial effect of dividends declared and paid after 30 June 2019 have not been brought to account in the financial statements for the year ended 30 June 2019 and will be recognised in subsequent financial reports.
Performance rights
The Company has issued an additional 40,000 performance rights on 9 August 2019 vesting on 31 August 2022 in relation to Key Management Personnel. The financial effect of performance rights issued after 30 June 2019 have not been brought to account in the financial statements for the year ended 30 June 2019 and will be recognised in subsequent financial reports.F
or p
erso
nal u
se o
nly

Integrated Research and its controlled entities Annual Report 2019 79
Directors’ declarationIn accordance with a resolution of the directors of Integrated Research Limited, we state that:
1. In the opinion of the directors:
a) the financial statements and notes of Integrated Research Limited for the financial year ended 30 June 2019 are in accordance with the Corporations Act 2001, including:
i) giving a true and fair view of the consolidated entity’s financial position as at 30 June 2019 and of its performance for the year ended on that date; and
ii) complying with Accounting Standards and the Corporations Regulations 2001;
b) the financial statements and notes also comply with International Financial Reporting Standards as disclosed in Note 1; and
c) there are reasonable grounds to believe that the Company will be able to pay its debts as and when they become due and payable.
2. This declaration has been made after receiving the declarations required to be made to the directors by the chief executive officer and chief financial officer in accordance with section 295A of the Corporations Act 2001 for the financial year ended 30 June 2019.
This declaration is made in accordance with a resolution of the Directors.
Dated at North Sydney this 22nd day of August 2019.
Paul BrandlingChairman
Garry DinnieDirector
Directors’ declarationF
or p
erso
nal u
se o
nly

Integrated Research and its controlled entities Annual Report 201980
For
per
sona
l use
onl
y

Integrated Research and its controlled entities Annual Report 2019 81
For
per
sona
l use
onl
y

Integrated Research and its controlled entities Annual Report 201982
For
per
sona
l use
onl
y

Integrated Research and its controlled entities Annual Report 2019 83
For
per
sona
l use
onl
y

Integrated Research and its controlled entities Annual Report 201984
For
per
sona
l use
onl
y

Integrated Research and its controlled entities Annual Report 2019 85
25 to 33
For
per
sona
l use
onl
y
Integrated Research and its controlled entities Annual Report 201986
For
per
sona
l use
onl
y

Integrated Research and its controlled entities Annual Report 2019 87
ASX additional information
Shareholder informationAnalysis of numbers of equity security holders by size of holding as at September 2019
Class of equity security
Ordinary shares
Shares OptionsPerformance
Rights
1 -1,000 1,556 - -
1,001 - 5,000 2,974 - 21
5,001 - 10,000 1,271 - 28
10,001 - 100,000 1,451 - 20
100,001 and over 79 - 1
7,331 - 70
Fully paid ordinary shares (total)Twenty largest security holders of quoted equity securities as of 9 September 2019.
Rank Name Units % of Units
1. MR STEPHEN JOHN KILLELEA 67,855,619 39.48
2. HSBC CUSTODY NOMINEES (AUSTRALIA) LIMITED 10,456,836 6.08
3. J P MORGAN NOMINEES AUSTRALIA PTY LIMITED 9,294,211 5.41
4. CITICORP NOMINEES PTY LIMITED 3,908,667 2.27
5. MR ANDREW RHYS RUTHERFORD 3,074,210 1.79
6. MR NICHOLAS BARRY DEBENHAM <NICHOLAS DEBENHAM FAM A/C> 1,663,761 0.97
7. NATIONAL NOMINEES LIMITED 1,231,535 0.72
8. BNP PARIBAS NOMINEES PTY LTD <IB AU NOMS RETAILCLIENT DRP> 1,156,047 0.67
9. CUSTODIAL SERVICES LIMITED <BENEFICIARIES HOLDING A/C> 712,136 0.41
10. BNP PARIBAS NOMS PTY LTD <DRP> 690,122 0.40
11. BNP PARIBAS NOMINEES PTY LTD HUB24 CUSTODIAL SERV LTD DRP 632,085 0.37
12. MR GARY RONALD POOLE + MRS LEIGH MARGARET POOLE <POOLE SUPER FUND A/C> 571,085 0.33
13. NETWEALTH INVESTMENTS LIMITED <WRAP SERVICES A/C> 528,276 0.31
14. MR ROBIN RAVENSCROFT BARTTELOT 520,000 0.30
15. GINGA PTY LTD <T G KLINGER SUPER FUND A/C> 520,000 0.30
16. MR GARY RONALD POOLE + MRS LEIGH MARGARET POOLE <POOLE FAMILY A/C> 470,583 0.27
17. ECAPITAL NOMINEES PTY LIMITED <ACCUMULATION A/C> 413,775 0.24
18. SANTOS L HELPER PTY LTD <THE VAN PAASSEN FAMILY A/C> 403,087 0.23
19. HSBC CUSTODY NOMINEES (AUSTRALIA) LIMITED - A/C 2 379,536 0.22
20. FERGFAM NOMINEES PTY LTD <FERGUSSON & WRIGHT S/F A/C> 375,263 0.22
Totals: Top 20 holders of FULLY PAID ORDINARY SHARES (TOTAL) 104,856,834 61.01
Total Remaining Holders Balance 67,003,919
Total Number of ordinary shares on issue 171,860,753
For
per
sona
l use
onl
y
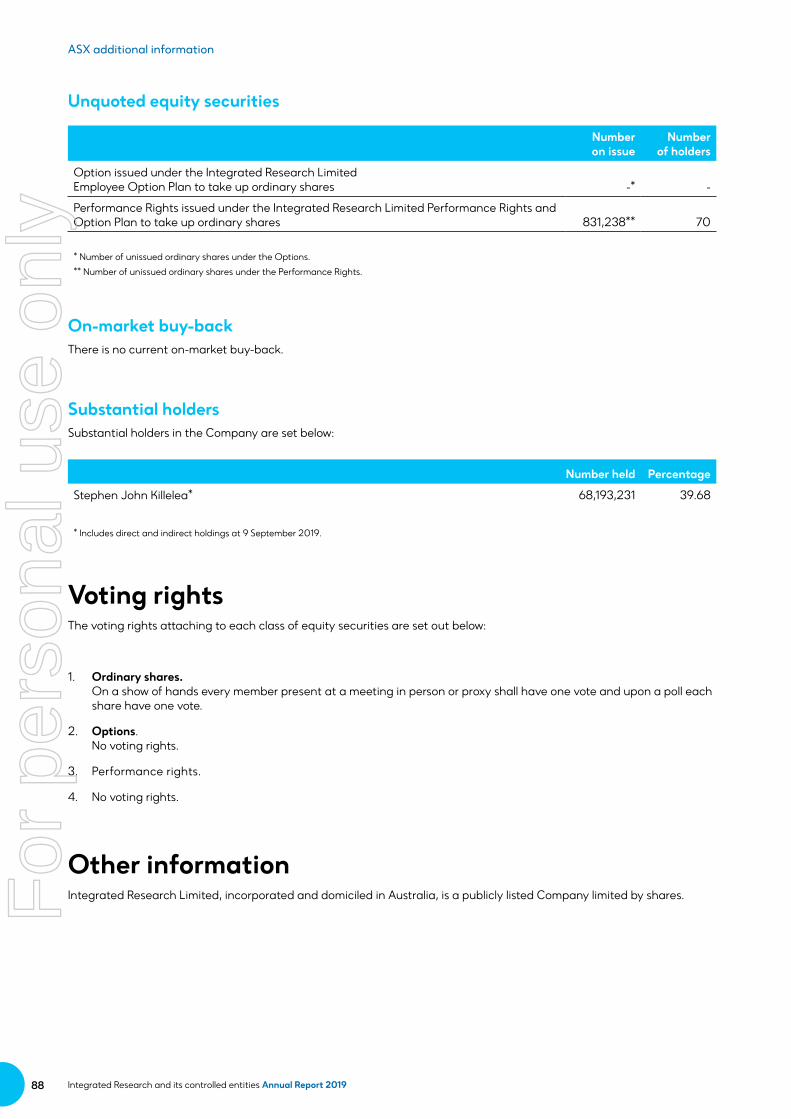
Integrated Research and its controlled entities Annual Report 201988
ASX additional information
Unquoted equity securities
Number on issue
Number of holders
Option issued under the Integrated Research Limited Employee Option Plan to take up ordinary shares -* -
Performance Rights issued under the Integrated Research Limited Performance Rights and Option Plan to take up ordinary shares
831,238** 70
* Number of unissued ordinary shares under the Options.
** Number of unissued ordinary shares under the Performance Rights.
On‑market buy‑back There is no current on-market buy-back.
Substantial holdersSubstantial holders in the Company are set below:
Number held Percentage
Stephen John Killelea* 68,193,231 39.68
* Includes direct and indirect holdings at 9 September 2019.
Voting rightsThe voting rights attaching to each class of equity securities are set out below:
1. Ordinary shares. On a show of hands every member present at a meeting in person or proxy shall have one vote and upon a poll each share have one vote.
2. Options. No voting rights.
3. Performance rights.
4. No voting rights.
Other informationIntegrated Research Limited, incorporated and domiciled in Australia, is a publicly listed Company limited by shares.F
or p
erso
nal u
se o
nly

Corporatedirectory
Directors
Paul BrandlingIndependent Non-Executive Director & Chairman
Nick AbrahamsNon-Executive Director
Garry DinnieIndependent Non-Executive Director
Peter LloydIndependent Non-Executive Director
Anne MyersIndependent Non-Executive Director
Company SecretaryDavid Purdue
Registered O� ceLevel 9, 100 Paci� c HighwayNorth Sydney NSW 2060T. +61 (2) 9966 1066
Share RegistryComputershare
SolicitorsAshurstLevel 11, 5 Martin PlaceSydney NSW 2000
BankersNational Australia BankWestpac Banking CorporationHSBC Bank Australia
Securities Exchange ListingAustralian Securities ExchangeCode: IRI
Country of IncorporationIntegrated Research Limited,incorporated and domiciled inAustralia, is a publicly listedcompany limited by shares.
Notice of Annual General MeetingThe Annual General Meeting ofIntegrated Research Limited will beheld on:
Wednesday 20 November 2019Museum of SydneyCnr. Phillip & Bridge Streets, Sydneyat 10:00am
4975 Designed and Produced by RDA Creative www.rda.com.auThis Annual Report is printed on Impress DM Matt. Impress DM is a FSC Certi� ed paper which is made from elemental chlorine free pulp derived from well-managed forests. It is manufactured by an EMAS and ISO 14001 certi� ed mill.
For
per
sona
l use
onl
y

ir.com
Asia Paci� c/Middle East/AfricaIntegrated Research LimitedLevel 9, 100 Paci� c HighwayNorth Sydney NSW 2060AustraliaT. +61 (2) 9966 1066E. [email protected]
United Kingdom & IrelandIntegrated Research UK LtdThe Atrium, Hare� eld RoadUxbridge, MiddlesexUB8 1PHUnited KingdomT. +44 (0) 189 581 7800E. [email protected]
Americas - West CoastIntegrated Research, Inc.6312 S. Fiddlers Green Circle, Suite 500NDenver, CO 80111, USAT: +1 (303) 390 8700F: +1 (303) 390 877E. [email protected]
SingaporeIntegrated Research (Singapore) Pte. Ltd.Unit 14-03, Palais Renaissance390 Orchard RoadSingapore 238871T. +65 6813 0851E. [email protected]
GermanyIntegrated Research Germany GmbHHamborner Str. 5340472 Düsseldorf, GermanyT. +49 (89) 97 007 132E. [email protected]
Americas - East CoastIntegrated Research, Inc.12950 Worldgate Dr, Suite 720Herndon, VA 20170, USAT: +1 (303) 390 8700F: +1 (303) 390 8777E. [email protected]
Americas - Mid WestIntegrated Research, Inc.6601 Lyndale Ave. S., Suite 330Rich� eld, Minnesota, MN 55423, USAT. +1 (612) 243 6700 F. +1 (303) 390 8777E. [email protected]
Integrated Research A
nnual Report 2019
ABN 76 003 588 449
Integrated ResearchAnnual Report 2019
For
per
sona
l use
onl
y