for personal use only exchanges - asx2016/02/18 · sales, consulting & marketing expenses...
TRANSCRIPT

Integrated Research Limited (IRI)FY2016 Half Year Financial ResultsFebruary, 2016ABN: 76 003 588 449
1Global Commerce Depends on IR
9 of the top 10 US banks
6 of the 10 biggest telcos
4 of the world’s 10
largest companies
4 out of 10 biggest oil and gas
companies
5 of the 10 biggest stock
exchanges
For
per
sona
l use
onl
y

Financial Results
Recurring Revenue Growth• Revenue base continues to build
• Less non-recurring perpetual business
• Heartbeat Testing: new recurring revenue stream
Results in Constant Currency
Key Highlights
• Total Revenue up 18% to $39.4m
• New Licence Sales down 1% to $19.5m
• Net Profit After Tax down 18% to $6.2m
• Total Revenue up 1%
• New Licence Sales down 15%
Revenue up 25%
Skype for Business & Cloud adoption growing
UC Growth
Product Development Prognosis 10.5 released in December
Prognosis 11 due for release mid-year 2016
Revenue up 44% to £3.4 million
Strategic investment in sales development
Strengthening partnership arrangements
Effective date: 1 July
Revenue contribution of $2.7 million
Integration plans complete
Meaningful contribution in FY2017
IQ Services Acquisition
European Performance
2
For
per
sona
l use
onl
y

Financial Results
3
For
per
sona
l use
onl
y

Financial Results
• Revenue up 18% with currency tailwind
• Licence fees flat due to large deal lumpiness
• Costs up due to annualised impact of FY15 2H investments
• Cost base includes impact of acquisition
4
December 2015
A$000’s
December 2014
A$000’s
% change
Licence fees 19,527 19,724 (1%)
Maintenance fees 13,652 11,277 21%
Testing solutions revenue 2,681 - n/a
Consulting fees 3,513 2,491 41%
Total revenue 39,373 33,492 18%
R&D expenses - net 7,094 6,206 14%
Sales, consulting & marketing expenses 21,625 15,771 37%
General & Administrative expenses 2,673 2,533 6%
Total expenses 31,392 24,510 28%
Profit before tax 8,435 10,071 (16%)
Profit after tax 6,205 7,548 (18%)
05,000
10,00015,00020,00025,00030,00035,00040,000
2006 2007 2008 2009 2010 2011 2012 2013 2014 2015 2016
First Half Revenue $'000
AUD USD
For
per
sona
l use
onl
y

Balance Sheet
5
December 2015
A$000’s
June 2015
A$000’s
Cash at bank 7,965 15,323
Current Receivables 31,306 25,012
Intangible assets 22,145 17,020
Current deferred revenue 19,613 18,698
Deferred consideration for acquisition (current & non current) 3,891 -
Net assets 36,138 36,132
2016 2015 2014
Basic earnings per share 3.65¢ 4.46¢ 2.68¢
Dividends per share 3.0¢ 3.5¢ 2.5¢
Franking percentage 55% 35% 30%
Return on equity 17% 22% 15%
Half Year Shareholder Returns
0.0
1.0
2.0
3.0
4.0
2006 2007 2008 2009 2010 2011 2012 2013 2014 2015 2016
Dividends (cents)
Interim
For
per
sona
l use
onl
y

0
5,000
10,000
15,000
20,000
25,000
2006 2007 2008 2009 2010 2011 2012 2013 2014 2015 2016
First Half Unified Communications Revenue $'000
AUD USD
Product Line Performance
• Strong underlying sales momentum
• Four large deals in prior half vs one in current half
• Strong pipeline underpinning second half
• Consulting services continues strong performance
6
Revenue by Product Line ($A)
Dec 2015A$000’s
Dec 2014A$000’s
% change
Unified Communications 21,337 17,009 25%
Infrastructure 11,485 11,488 0%
Payments 3,038 2,504 21%
Consulting Services 3,513 2,491 41%
Total Revenue 39,373 33,492 18%
10year CAGR 24%
For
per
sona
l use
onl
y
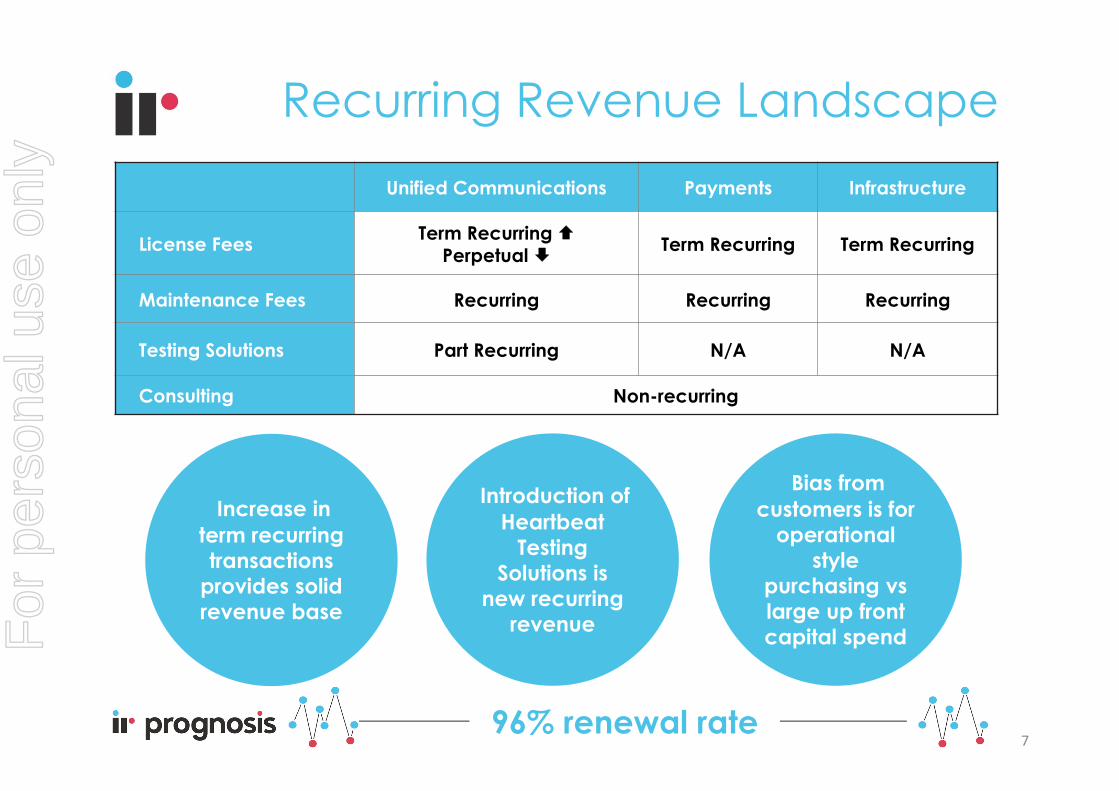
Recurring Revenue Landscape
7
Unified Communications Payments Infrastructure
License Fees Term Recurring Perpetual Term Recurring Term Recurring
Maintenance Fees Recurring Recurring Recurring
Testing Solutions Part Recurring N/A N/A
Consulting Non-recurring
Introduction of Heartbeat
Testing Solutions is
new recurring revenue
Bias from customers is for
operational style
purchasing vs large up front capital spend
Increase in term recurring transactions
provides solid revenue base
96% renewal rate
For
per
sona
l use
onl
y
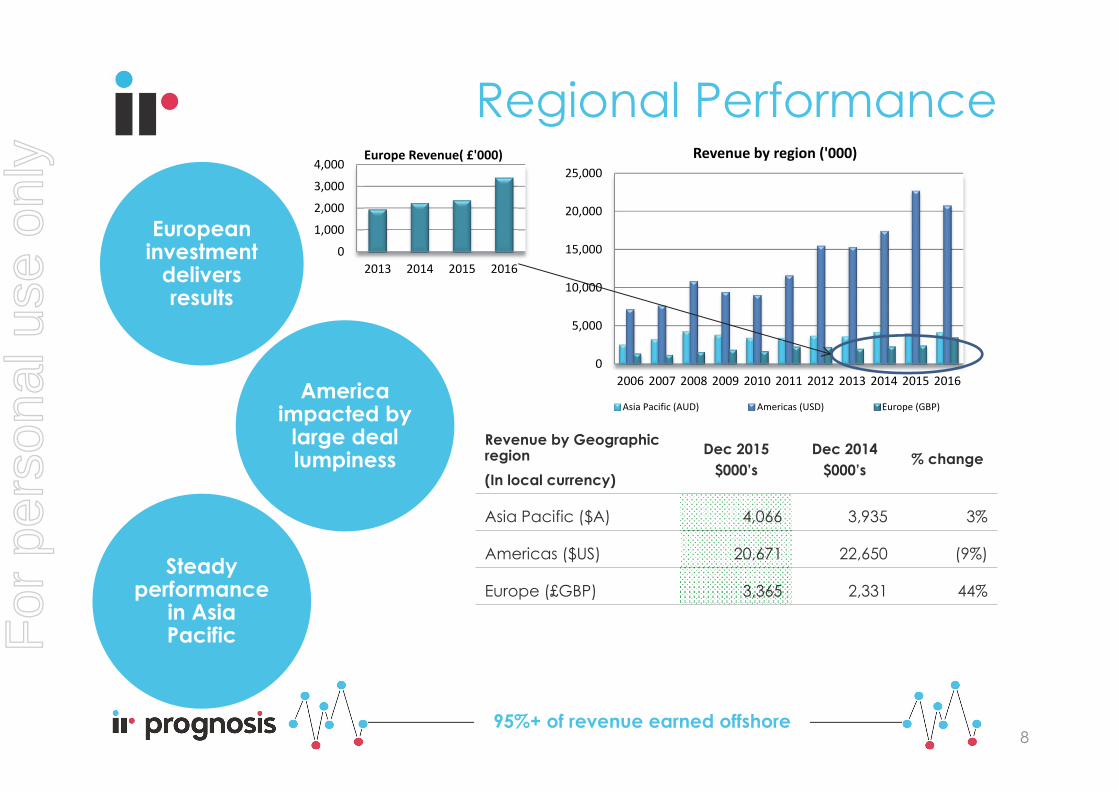
Regional Performance
European investment
delivers results
America impacted by
large deal lumpiness
895%+ of revenue earned offshore
Revenue by Geographic region (In local currency)
Dec 2015$000’s
Dec 2014$000’s
% change
Asia Pacific ($A) 4,066 3,935 3%
Americas ($US) 20,671 22,650 (9%)
Europe (£GBP) 3,365 2,331 44%
0
5,000
10,000
15,000
20,000
25,000
2006 2007 2008 2009 2010 2011 2012 2013 2014 2015 2016
Revenue by region ('000)
Asia Pacific (AUD) Americas (USD) Europe (GBP)
0
1,000
2,000
3,000
4,000
2013 2014 2015 2016
Europe Revenue( £'000)
Steady performance
in Asia PacificFor
per
sona
l use
onl
y

Growth Strategy Update
9
For
per
sona
l use
onl
y

IRIR is the leading global
provider of performance management solutions for Unified Communications,
Payments and IT Infrastructure
CapabilitiesPrognosis provides availability & performance management, diagnostics and actionable business insight for mission critical systems
WHO WE ARE
WHATWE DO
Value PropositionPrognosis increases
technology performance, minimizes outages, reduces cost, optimizes operations,
delivers business critical insight and ensures user and customer
satisfaction
Competitive Advantage Prognosis is real-time, scalable, extensible
& flexible Prognosis supports multiple platforms,
vendors and applications IR has 1,000+ enterprise customers globally IR has 120+ of the Fortune 500 customers IR has a world-class R&D capability
WHY WE SUCCEED
WHY CUSTOMERS
BUY 10
For
per
sona
l use
onl
y

Market & Technology Leadership
11
The Company: IR• Global, publically listed, profitable and growing
• Over 1,000 enterprise customers worldwide
• 120+ Fortune 500 customers
• 83% of the ‘Leaders’ in the
Gartner Communications Outsourcing Magic Quadrant
• Microsoft Gold Communications Partner
The Solution: Prognosis• UC & CC Market Leader 13+ million managed endpoints
• Avaya Sponsored & Recommended solution
• Microsoft SDN API 2.1.1 certified on Skype for Business
• Cisco Certified Management Solution
• 4 of the top 5 Payment transaction acquirers worldwide
• 4 of the top 5 Payment card schemes worldwide
• 100s of millions of Payments transactions monitored dailyFor
per
sona
l use
onl
y
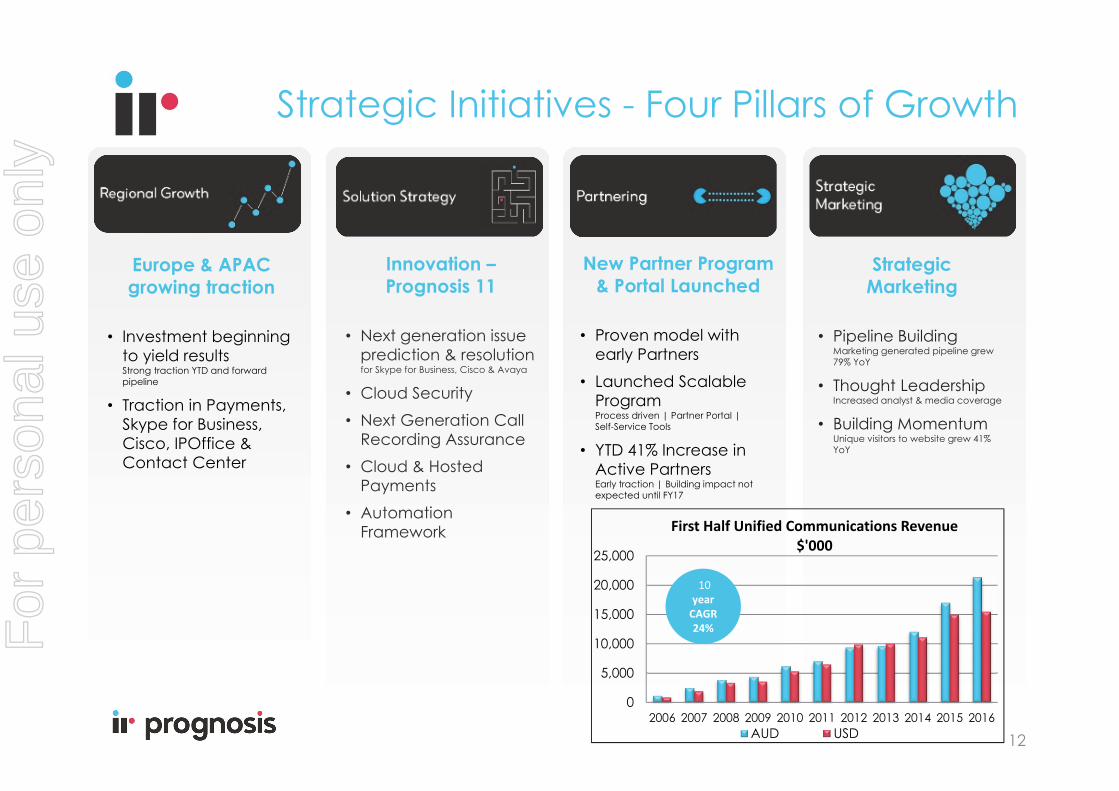
Strategic Initiatives - Four Pillars of Growth
12
Europe & APAC growing traction
• Investment beginning to yield resultsStrong traction YTD and forward pipeline
• Traction in Payments, Skype for Business, Cisco, IPOffice & Contact Center
Innovation –Prognosis 11
• Next generation issue prediction & resolution for Skype for Business, Cisco & Avaya
• Cloud Security• Next Generation Call
Recording Assurance• Cloud & Hosted
Payments• Automation
Framework
New Partner Program & Portal Launched
• Proven model with early Partners
• Launched Scalable ProgramProcess driven | Partner Portal | Self-Service Tools
• YTD 41% Increase in Active PartnersEarly traction | Building impact not expected until FY17
Strategic Marketing
• Pipeline Building Marketing generated pipeline grew 79% YoY
• Thought LeadershipIncreased analyst & media coverage
• Building MomentumUnique visitors to website grew 41% YoY
0
5,000
10,000
15,000
20,000
25,000
2006 2007 2008 2009 2010 2011 2012 2013 2014 2015 2016
First Half Unified Communications Revenue $'000
AUD USD
10year CAGR 24%F
or p
erso
nal u
se o
nly

Prognosis 11 Release mid 2016Selected Highlights
13
Enhanced security for cloud service providers and GovernmentSupport new key security standards allowing Prognosis to be used in US Federal Government Cloud projects.
Skype for Business, Cisco & Avaya Allow administrators to predict and prevent issues. Advanced troubleshooting of business problems, quickly get to root cause and apply prescribed solutions.
Call Recording Assurance Media Validation Major extensions and enhancements to existing solutions that help large financial institutions manage regulatory compliance, reduce costs and avoid significant fines.
Cloud & Hosted Payments Enabling monitoring and management of the next generation of hosted and cloud Payments environments.
Automation Next release of the Prognosis automation framework allowing users to automate Prognosis and system administration functions.
In this example : Prognosis proactively identifies an issue,
prescribes a solution and offers to automatically fix it.
For
per
sona
l use
onl
y
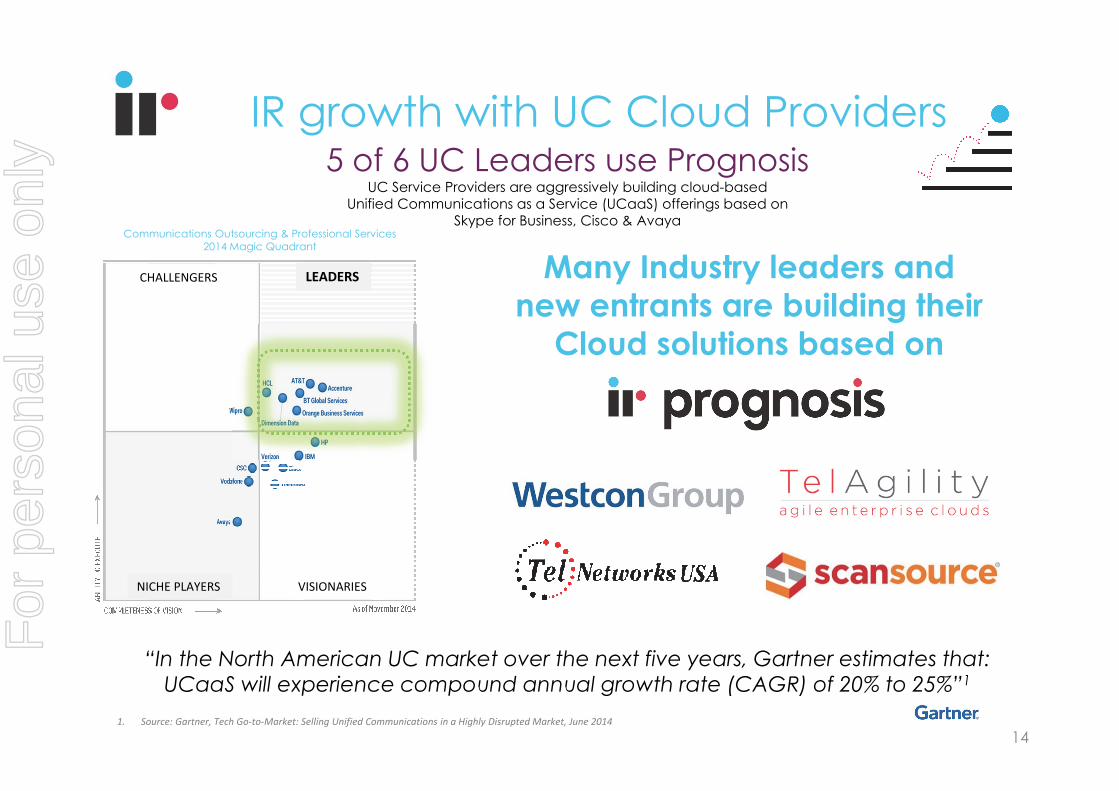
5 of 6 UC Leaders use PrognosisUC Service Providers are aggressively building cloud-based
Unified Communications as a Service (UCaaS) offerings based on Skype for Business, Cisco & Avaya
Many Industry leaders and new entrants are building their
Cloud solutions based on
IR growth with UC Cloud Providers
1. Source: Gartner, Tech Go‐to‐Market: Selling Unified Communications in a Highly Disrupted Market, June 2014
NICHE PLAYERS
Communications Outsourcing & Professional Services 2014 Magic Quadrant
LEADERSCHALLENGERS
VISIONARIES
14
“In the North American UC market over the next five years, Gartner estimates that: UCaaS will experience compound annual growth rate (CAGR) of 20% to 25%”1
For
per
sona
l use
onl
y

New Customers
15
For
per
sona
l use
onl
y

IQ Services Acquisition Update
16
Next Generation Version Release
• Prognosis – HeartBeat Integration released with Prognosis version 10.5
• New architecture release allowing scalability of Testing solutions and services via cloud around the globe. Heartbeat Released September 2015 StressTest Mid 2016
Acquisition Status Summary
• Effective 1 July 2015
• Corporate Integration Project substantially complete
• Solution Integration Phase 1 completed
• Joint Execution underway, meaningful impact in FY2017
• Overall progress as expected
• Major Cross Sell & Competitive wins
• Pipeline increasing with a strong H2 outlookFor
per
sona
l use
onl
y

Key SummaryFinancial Results
Recurring Revenue Growth• Revenue base continues to build
• Less non-recurring perpetual business
• Heartbeat Testing: new recurring stream
Results in Constant Currency
• Total Revenue up 18% to $39.4m
• New Licence Sales down 1% to $19.5m
• Net Profit After Tax down 18% to $6.2m
• Total Revenue up 1%
• New Licence Sales down 15%
Revenue up 25%
Skype for Business & Cloud adoption growing
UC Growth
Product Development Prognosis 10.5 released in December
Prognosis 11 due for release mid-year 2016
Revenue up 44% to £3.4 million
Strategic investment in sales development
Strengthening partnership arrangements
Effective date: 1 July
Revenue contribution of $2.7 million
Integration plans complete
Meaningful contribution in FY2017
IQ Services acquisition
European Performance
For
per
sona
l use
onl
y

Thank you. Questions?
18
For
per
sona
l use
onl
y