for personal use only - asxfor personal use only perth kalgoorlie regulatory update –direct action...
TRANSCRIPT

Leaders in Remote and Clean Energy
Energy Developments (ASX: ENE)
ASX Investor Series Presentation
10 November 2014
Greg Pritchard
Managing Director
For
per
sona
l use
onl
y

Disclaimer
2
Important Notice and Disclaimer
This presentation:
• Is not a recommendation to buy, sell, hold, borrow against, mortgage or deal in connection with Energy
Developments Limited ABN 84 053 410 263 (EDL) shares/securities in any way
• Is limited in scope and covers only part of EDL’s operations
• May contain forward looking statements, all of which are predictions only, and are subject to inherent risks,
changes and uncertainties, including factors and risks specific to the industry in which EDL operates, as well
as Government policy, general economic conditions, prevailing exchange rates and interest rates and
conditions in the financial markets. Actual events or results may differ materially from the events or results
anticipated, expressed or implied in any forward looking statement
Some the views expressed in this presentation contain information that has been derived from publicly available
sources that have not been independently verified. No representation or warranty is made as to the accuracy,
completeness or reliability of the information. This presentation should not be relied upon as a recommendation
or forecast by EDL.
EDL and its directors and employees disclaim any liability for any loss arising from the use of this presentation or
any information in it for any purpose and in any context to the maximum extent permitted by law.
For
per
sona
l use
onl
y

Key Highlights
Capability
Blue chip
customers
Incumbency
Scale
Diversification
Strong
profitability
Growth
– 904 MW of generation assets; #1 market positions
– 84 projects across 3 continents; > 80% contracted; 50% take or pay
– Commitment to Zero Harm; Centralised O&M and asset management
4
3
5
– BHPB; Anglo American; AngloGold Ashanti; Glencore; MMG
– Horizon Power; Territory Generation
2
1
– Long life assets; long dated contracts; track record of recontracting
– 154 MW added in FY14 6
– FY14: EBITDA $182m; NOCF $136m; Fully franked div. 28cps
– FY15: EBITDA guidance of $192m to $202m
7Well
capitalised– Corporate refinancing in October 2014
– Reduced borrowing cost; extension of tenor; over-subscribed bank group
8
3
For
per
sona
l use
onl
y

Continued trend of earnings and capacity growth
Significant Growth and Diversification Continues
FY13 Revenue: $403m
Projects: 80
Scale: 800 MW
Dividend: 11cps
FY03 Revenue: $117m
Projects: 54
Scale: 389 MW
Dividend: Nil
Anglo American
Glencore
Territory Generation
FY14 Revenue: $423m
Projects: 84
Scale: 900 MW
Dividend: 28cps
4
For
per
sona
l use
onl
y

EDL – Market Leaders in Distributed Power
>900MW distributed power generation
• Remote Energy ~390MW
• Waste Coal Mine Gas ~250MW
• Landfill Gas ~260MW
Scale
Diversified
Long life assets
Long dated contracts
Blue chip counterparties
Capability
Growth
Well capitalised
Strong profitability
5
For
per
sona
l use
onl
y

Distributed Power Summary
Advantages of distributed power
• Widely available, smaller, more efficient and less costly
• Overcomes capital constraints of larger projects and transmission/distribution lines
• Built and become operational faster and with less risk than large power plants
• Increased reliability generating power close to customer
• Digital control systems - can be controlled from a smartphone
• Incrementally added to meet growing energy needs
• Greater gas abundance creates opportunities for gas-fired distributed power systems
Opportunities for EDL
• Diesel displacement
–Hybrid renewables
–Virtual pipelines (e.g. West Kimberley; Yulara) using LNG and CNG
• Network support
• Intermediate Electrification e.g. upstream LNG
Distributed power driven by same forces that are propelling the broader decentralization movement
Source: General Electric 2014
Distributed Power Technology Continuum
6
For
per
sona
l use
onl
y

WCMG Macro Environment
Macro – Metallurgical Coal
• Demand: Underpinned by steel production – with global production expected to grow at CAGR of 2.5% - 3.0% p.a.
• Supply: Australia provides >50% global supply and expected to remain dominant supplier of seaborne met coal globally
EDL Current WCMG portfolio
• Market Leader with 254MW across 9 projects
• WCMG generation/ abatement is core business
• 4 Global miners as core long term customers
• Exclusive feasibility study with fifth
Further Opportunities for Growth
• Methane abatement services to miners
• Value proposition attractive to miners
• Value add-ons: network support, islanding, direct sales, upstream services all enhance EDL offering
Source: BHP Oct 2014
7
For
per
sona
l use
onl
y

Long Dated Contracts with Blue Chip Counterparties
– 5 10 15
Clean Energy (515 MW)
Remote Energy (389 MW)
Contracted years remaining Asset life
2030+
2030+
Weighted average contractual years and asset lifeAsset capacity (MW) Blue Chip Counterparties
8
For
per
sona
l use
onl
y

Our Capability – Safety and People
Safety
Target Zero Harm
Industry-leading safety performance
LTIFR at 30 September is nil
Zero LTIs in past 20 months (in excess of 1.6 million hours worked)
TRIFR (total reportable injury frequency rate: LTIs + MTIs) at 31 July is 1.0. 1 MTI in Nov 2013
Highly experienced team with a strong track record of safely managing and growing the business
People
Strategies in place to attract and retain key talent
Improved MW / FTE from 1.7 in FY12 to 2.2 in FY14
0
20,000
40,000
60,000
80,000
100,000
120,000
0
1
2
3
4
5
6
7
8
9
10Workhours TRIFR
LTIFR Significant Incidents
9
For
per
sona
l use
onl
y
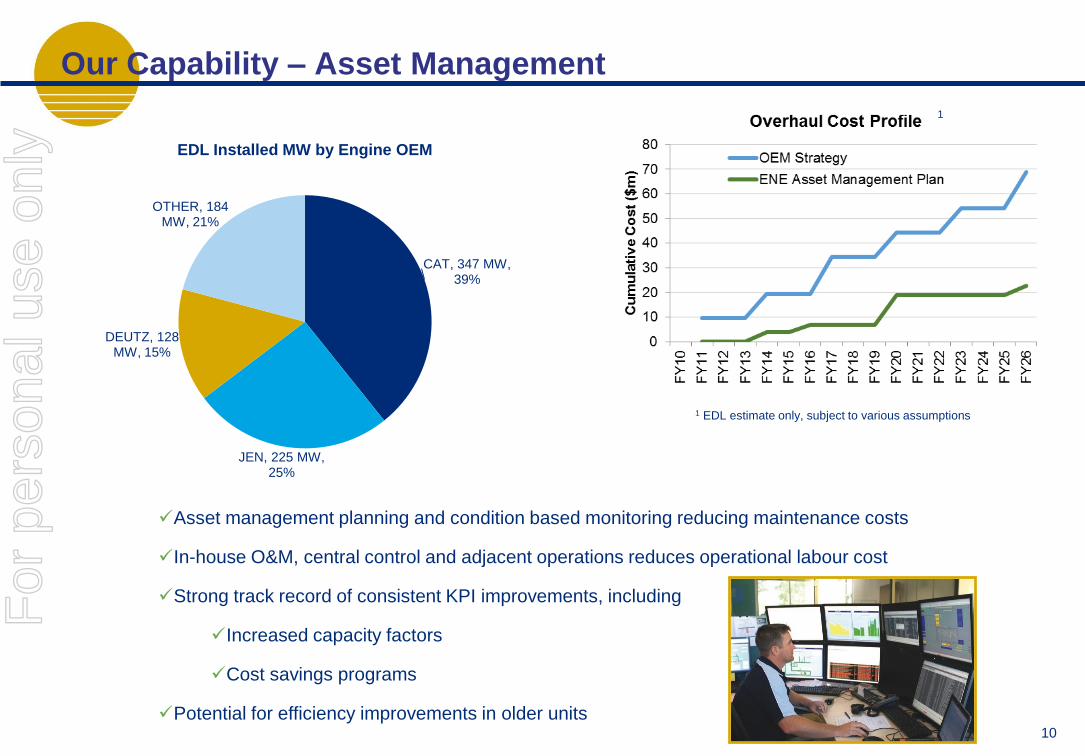
Our Capability – Asset Management
10
Asset management planning and condition based monitoring reducing maintenance costs
In-house O&M, central control and adjacent operations reduces operational labour cost
Strong track record of consistent KPI improvements, including
Increased capacity factors
Cost savings programs
Potential for efficiency improvements in older units
1
1 EDL estimate only, subject to various assumptions
CAT, 347 MW, 39%
JEN, 225 MW, 25%
DEUTZ, 128 MW, 15%
OTHER, 184 MW, 21%
EDL Installed MW by Engine OEM
For
per
sona
l use
onl
y

Our Capability - Refinancing
• Lender feedback was positive with facilities
oversubscribed
• New syndicate: NAB, ANZ, Westpac, UOB,
Mizuho, SMBC, ICBC, BTMU, GE and funds
managed by Hastings
Outcomes
• Extension of term, revolver and working capital
tranches over 5 and 8 year maturities to 2019 and
2022
• Reduction in average interest margin and
commitment fees: savings > $8m per annum
• Extension of AUD interest rate swaps to 8 years
Refinancing of Corporate Banking Facilities completed in October
-
100
200
300
400
500
Jun-15 Jun-16 Jun-17 Jun-18 Jun-19 Jun-20 Jun-21 Jun-22
A$
m
Previous Debt Maturity Profile
Syndicated Facility Revolver CAT Finance WKPP CEFC ECA
0
100
200
300
400
500
Jun-15 Jun-16 Jun-17 Jun-18 Jun-19 Jun-20 Jun-21 Jun-22
A$
m
New Debt Maturity Profile
Syndicated Facility Revolver WKPP CEFC ECA
11
For
per
sona
l use
onl
y

Executed Growth – $500m successfully invested since FY10
EDL continues to deliver accretive growth projects in a challenging market
McArthur River – in partnership with Glencore
• Supporting Glencore’s McArthur River mine expansion
– Doubling capacity and increasing mine life to 2038
• EDL gas power station since 1995
• 20 year Power Purchase Agreement for 68MW
– 53MW Wärtsilä expansion
• COD in January 2014
• Supporting Anglo’s commitment to reducing carbon
emissions and gas extraction costs
• 45MW WCMG power project since 2008
• 18MW expansion underpinned by:
– 25 year WCMG supply extension with Anglo
– Network support agreement with Powerlink
• COD July 2014
Moranbah North – in partnership with Anglo American
12
For
per
sona
l use
onl
y

Rationale
• 43MW WCMG bolt on ($25m)
• New customers: Glencore and Vale
• Long dated mine lives
• Significant synergies
Integration & Synergies
• Alignment of OHSE and SPIRIT values
• Operating performance increased >50%
• Removed O&M and corporate overhead
• Results to date materially higher than
investment case
• Consolidation benefits - German Creek
and Oaky are 7km apart
• Potential for expansion at acquired sites
FY14 Growth – Envirogen Acquisition
13
• Glencore Xstrata managed mine
• Expected mine life to 2046
• 21MW
• Vale operated mine
• 11.7MW
Oaky Creek
Integra (Glennies Creek)
• Glencore Xstrata
• Expected mine life to 2028
• 7.3MW
Tahmoor
• Glencore Xstrata; mine closed 2001
• 3.1MW
Teralba
For
per
sona
l use
onl
y

FY14 Growth – Upstream LNG
14
Rationale
• Attractive economics with accelerated EBITDA expected
from initial sale/ leaseback
• Asset redeployment into EDL business post lease
– Reduces capital costs for future projects
– EPC relocation terms locked in at acquisition
• Extends clean energy footprint closely adjacent to
WCMG assets
Reedy Creek, QLD
Key Terms
1. Purchase of 21MW for ~$21m in April 2014
– Initial 12-18 month rental agreement with Clarke
Energy Australia for upstream LNG
electrification
– COD Dec 2014
2. Purchase of 30MW for ~$22m in June 2014
– Initial 12-18 month rental agreement with Clarke
Energy Australia for upstream LNG
electrification
– Commenced 1 July 2014
3. Potential for
– Extension of initial lease agreements
– Subsequent utilisation in EDL WCMG or other
growth projects For
per
sona
l use
onl
y

Sunrise Dam extension and expansion
15
FY15 Growth Projects underway – Sunrise Dam & Coober Pedy
• Supporting Anglo Gold Ashanti’s Sunrise Dam mine
• 28MW gas and diesel power station since 1997
• Extension of current agreement by 10 years to 2025
• Expansion of 6MW replacing 2MW of diesel with 8MW of
high efficiency gas generators
Coober Pedy Hybrid Renewable Project
• $18.5m funding agreement with ARENA signed in July 2014
• Support to upgrade and expand existing 3.9MW diesel
power station
– 2MW solar
– 3MW of wind generation
• Project to be underpinned by 20year PPA
• Target to achieve 70% diesel displacement of 20 year PPA
• Significant opportunities for diesel displacement in remote
locations
Source: Hydro Tasmania
Adelaide
Coober PedySunrise Dam
Perth Kalgoorlie
For
per
sona
l use
onl
y
Regulatory Update – Direct Action & RET
16
• EDL has long history of working with Governments
• Bi-partisan support for a 5% reduction in Australia’s emissions by 2020
• Private sector certainty: managed through grandfathering in the event of policy change
EDL expects to benefit from continuing regulatory support for cleaner energy and emissions reduction policies
Direct Action – Emissions Reduction Fund (ERF)
• Parliamentary support to legislate Direct Action
achieved; has now passed the Senate
• ERF a $2.5 billion fund – EDL will be able to monetise
ACCUs through reverse auction process
• EDL expected to generate ACCUs from:
• Grandfathering of existing CFI projects into ERF
• New WCMG expansions/greenfield projects
• Ongoing consultation with Government/Regulator on
detailed design
• Commencement expected early 2HFY15
Renewable Energy Target (RET)
• Currently legislated until 2030 – 45,000GWh to be supplied
from renewable sources by 2020
• Report of Expert Panel released in August 2014
recommendations, either:
• No new large scale renewables into RET, but existing
participants continue; or
• RET target is frozen and grows only with demand
• Current eligible EDL projects would remain under either
recommendation.
For
per
sona
l use
onl
y

Summary
17
1. Market leaders in distributed generation
2. Differentiated and diversified business in a dynamic energy market
3. Proven capability to deliver and operate bespoke distributed power solutions for our
customers, safely and on time/ budget
4. Long life assets and contracts with blue chip counterparties
5. Deep pool of growth options
6. Strong profitability with growing dividends and well capitalised
For
per
sona
l use
onl
y