for personal use only - home - australian securities … · 2013-03-28 · for personal use only....
TRANSCRIPT

SCIGEN LTD AND ITS SUBSIDIARIES (Registration No. 199805796R)
REPORT OF THE DIRECTORS
AND FINANCIAL STATEMENTS
YEAR ENDED DECEMBER 31, 2012
For
per
sona
l use
onl
y
SCIGEN LTD AND ITS SUBSIDIARIES
REPORT OF THE DIRECTORS AND FINANCIAL STATEMENTS
C O N T E N T S
PAGE
Corporate directory 1 - 2
Report of the directors 3 - 19
Statement of directors 20
Corporate governance statement 21 - 33
Independent auditors’ report 34 - 36
Statements of financial position 37 - 38
Consolidated statement of comprehensive income 39 - 40
Statements of changes in equity 41 - 42
Consolidated statement of cash flows 43 - 44
Notes to the financial statements 45 - 108
EQCR-MGR/3019054-4024478-FS/NPH/AMCM/ATWQ/ZA/WSI
For
per
sona
l use
onl
y

1
SCIGEN LTD AND ITS SUBSIDIARIES CORPORATE DIRECTORY Directors Executive Chairman and Chief Executive Director
Slawomir Ziegert Executive Chairman and Chief Executive Officer Executive Directors Adam Tomasz Polonek Chief Financial Officer Member, Audit Committee Jenny Low Senior Vice President & Corporate Secretary Non-Executive Directors Kenneth Gross Non-Executive Director Chairman, Audit Committee Mateusz Patryk Kosecki Non-Executive Director Amol Jashvant Shah Non-Executive Director Adam Wilczega Non-Executive Director Member, Audit Committee Marcin Dukaczewski Non-Executive Director Joanna Szymanska-Bulska Non-Executive Director Secretaries Lai Leng Wong Jenny Low Senior Vice President & Corporate Secretary
For
per
sona
l use
onl
y

2
Principal registered office in Singapore 152 Beach Road, #26-07/08 Gateway East, Singapore 189721 Principal registered office in Australia Suite 1, 13B Narabang Way, Belrose, NSW 2085, Australia Share and debenture registers Computershare Investor Services Pty Limited Level 5, 115 Grenfell Street, Adelaide, South Australia, 5000, Australia Ph: 1300 556 161 (within Australia) Ph: (61) 3 9615 5970 (outside Australia) Fax: (61) 8 8236 2305 Website: www.computershare.com Auditors Deloitte & Touche LLP 6 Shenton Way Tower Two #32-00 Singapore 068809 Partner-in-charge: Ng Peck Hoon (appointed on June 30, 2010) Solicitors Allen & Gledhill Norton Rose Bankers DBS Bank Ltd Kookmin Bank Ltd Citibank Korea ANZ Bank Ltd Westpac Banking Corporation HDFC Bank Ltd Agricultural Bank of China Stock exchange listings SciGen Ltd (the “Company” or “SciGen”) is a public company
incorporated in Singapore. Shares are held by Chess Depository Nominees in Australia and are publicly traded on the Australian Stock Exchange in the form of CHESS Units of Foreign Securities (CUFS) on a 1 CUF for 1 fully paid ordinary share basis.
Website address www.scigenltd.com Currency The annual report is prepared in United States dollars.
For
per
sona
l use
onl
y

3
SCIGEN LTD AND ITS SUBSIDIARIES
REPORT OF THE DIRECTORS
The directors present their report together with the audited consolidated financial statements of the Group and
statement of financial position and statement of changes in equity of the Company for the financial year ended
December 31, 2012.
Directors
The directors in office at the date of this report are as follows:
Mr. Slawomir Ziegert
Mr. Adam Tomasz Polonek
Ms. Jenny Low
Mr. Kenneth Gross
Mr. Adam Wilczega
Ms. Joanna Szymanska-Bulska
Mr. Marcin Dukaczewski
Mr. Mateusz Patryk Kosecki
Mr. Amol Jashvant Shah
Principal activities
During the year, the principal activities of the Group and the Company consisted of:
a. Business development to expand product portfolio and to penetrate into new markets;
b. Sales and marketing activities;
c. Health registration of the products; and
d. Establishment of a manufacturing facility for the insulin.
Dividends
Due to the capital requirements of the Company, the directors have not declared a dividend for the financial
year ended December 31, 2012. No dividends have been paid, declared or proposed since the end of the
Company’s preceding financial year.
For
per
sona
l use
onl
y
4
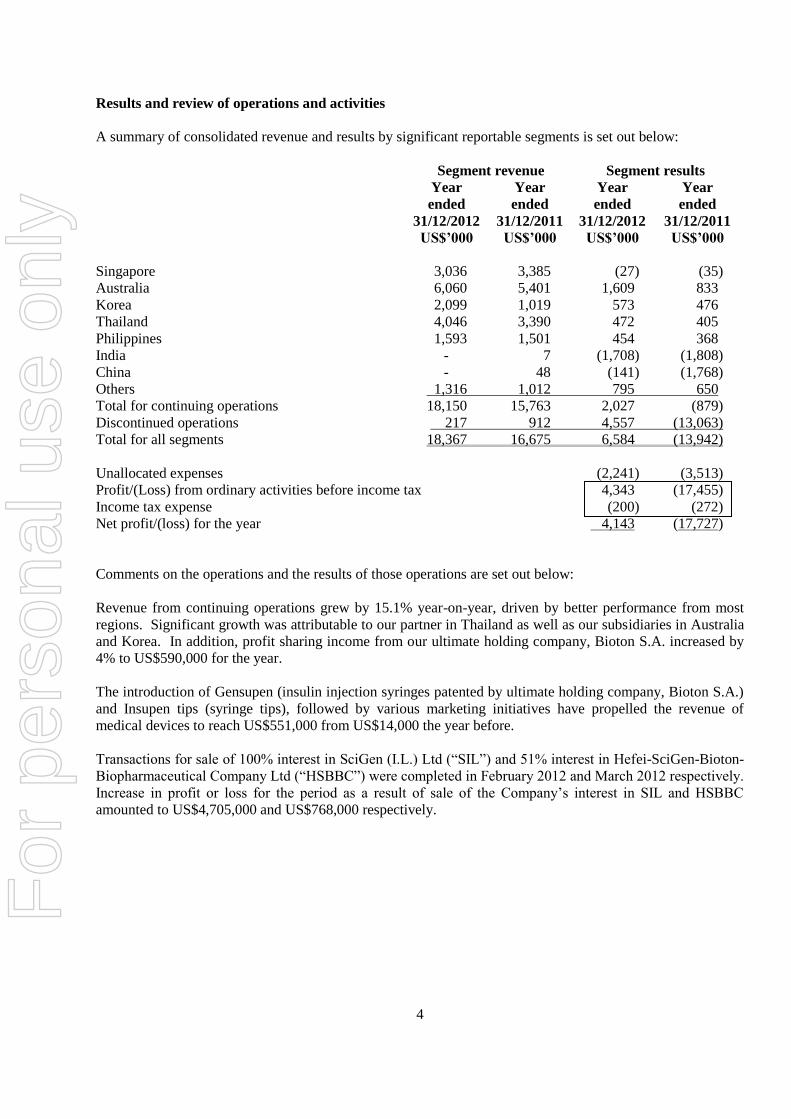
Results and review of operations and activities
A summary of consolidated revenue and results by significant reportable segments is set out below:
Segment revenue Segment results
Year Year Year Year
ended ended ended ended
31/12/2012 31/12/2011 31/12/2012 31/12/2011
US$’000 US$’000 US$’000 US$’000
Singapore 3,036 3,385 (27) (35)
Australia 6,060 5,401 1,609 833
Korea 2,099 1,019 573 476
Thailand 4,046 3,390 472 405
Philippines 1,593 1,501 454 368
India - 7 (1,708) (1,808)
China - 48 (141) (1,768)
Others 1,316 1,012 795 650
Total for continuing operations 18,150 15,763 2,027 (879)
Discontinued operations 217 912 4,557 (13,063)
Total for all segments 18,367 16,675 6,584 (13,942)
Unallocated expenses (2,241) (3,513)
Profit/(Loss) from ordinary activities before income tax 4,343 (17,455)
Income tax expense (200) (272)
Net profit/(loss) for the year 4,143 (17,727)
Comments on the operations and the results of those operations are set out below:
Revenue from continuing operations grew by 15.1% year-on-year, driven by better performance from most
regions. Significant growth was attributable to our partner in Thailand as well as our subsidiaries in Australia
and Korea. In addition, profit sharing income from our ultimate holding company, Bioton S.A. increased by
4% to US$590,000 for the year.
The introduction of Gensupen (insulin injection syringes patented by ultimate holding company, Bioton S.A.)
and Insupen tips (syringe tips), followed by various marketing initiatives have propelled the revenue of
medical devices to reach US$551,000 from US$14,000 the year before.
Transactions for sale of 100% interest in SciGen (I.L.) Ltd (“SIL”) and 51% interest in Hefei-SciGen-Bioton-
Biopharmaceutical Company Ltd (“HSBBC”) were completed in February 2012 and March 2012 respectively.
Increase in profit or loss for the period as a result of sale of the Company’s interest in SIL and HSBBC
amounted to US$4,705,000 and US$768,000 respectively.
For
per
sona
l use
onl
y

5
This comprises of the following:
(a) Reversal to profit or loss of translation reserve of disposed entities amounting to US$4,557,000 and
US$725,000 were in respect of SIL and HSBBC respectively, driven by currency fluctuation and
foreign exchange rates at the specific dates when the transaction was closed; and
(b) Other gain on sale of the subsidiaries amounting to US$148,000 and US$43,000 in respect of SIL and
HSBBC, respectively.
The incremental profit from ordinary activities after tax of US$4,250,000 year-on-year was primarily driven
by :
• Higher revenue, surpassing preceding year by US$2,387,000 which consequentially resulted in
escalation of income by US$966,000 for commercial business units;
• Nil impairment for the current year compared to impairment loss of US$2,173,000 in preceding year;
and
• Gain on disposal of HSBBC amounting to US$768,000 during the year.
Net profit for the year attributable to members was US$4,669,000 and mainly pertains to credit to profit and
loss of gain as a result of disposal of SIL and HSBBC.
The Company’s activities are focused on registration, marketing and sales of biopharmaceutical products,
particularly on recombinant Human Insulin (SciLinTM
) and Human Growth Hormone (SciTropin ATM
). Sales
of SciLinTM
and SciTropin ATM
for the year remain robust, expanding at a rate of 22%.
Earnings (Loss) per share
Group
Year ended Year ended
31/12/2012 31/12/2011
US cents US cents
Basic earnings (loss) per share 0.845 (3.082)
Arrangements to enable directors to acquire benefits by means of the acquisition of shares and
debentures
Neither at the end of the financial year nor at any time during the financial year did there subsist any
arrangement whose object is to enable the directors of the company to acquire benefits by means of the
acquisition of shares or debentures in the company or any other body corporate, except for the item mentioned
below.
For
per
sona
l use
onl
y

6
Directors’ interests in shares and debentures
The directors of the Company holding office at the end of the financial year had no interest in the share capital
and debenture of the Company and related corporations as recorded in the register of directors’ shareholding
kept by the Company under Section 164 of the Singapore Companies Act except as follows:
Holdings in which
Holdings registered the director is deemed
in the name of the director to have an interest
Name of directors
and companies in At beginning At end At beginning At end
which interests are held of the year of the year of the year of the year
Convertible debentures
Subsidiary company
SciGen BioPharma Private Ltd
Amol Jashvant Shah - - 3,050,000 -
Shares
Subsidiary company
SciGen BioPharma Private Ltd
Amol Jashvant Shah - - - 5,998,800
Directors’ receipt and entitlement to contractual benefits
Since the beginning of the financial year, no director has received or become entitled to receive a benefit which
is required to be disclosed under Section 201(8) of the Singapore Companies Act, by reason of a contract made
by the company or a related corporation with the director or with a firm of which he is a member, or with a
company in which he has a substantial financial interest except for salaries, bonuses and other benefits as
disclosed in the financial statements. Certain directors received remuneration from related corporations in their
capacity as directors and/or executives of those related corporations.
For
per
sona
l use
onl
y
7
Share options (a) Options to take up unissued shares
During the financial year, no option to take up unissued shares of the company or any corporation in the Group was granted.
(b) Options exercised During the financial year, there were no shares of the company or any corporation in the Group issued by
virtue of the exercise of an option to take up unissued shares. (c) Unissued shares under option
At the end of the financial year, there were no unissued shares of the company or any corporation in the Group under option.
Significant changes in the state of affairs
Significant changes in the state of affairs of the Group and the Company during the financial year were as
follows:
a. Disposal of the Company’s interest in its manufacturing facility in Israel and Sci-B-VacTM
Licence
On February 14, 2012, the Board of Directors closed the transaction on sale of the Company’s 100%
interest in SIL and the assignment of licensing rights for the manufacture and sale of Sci-B-VacTM
to FDS
Pharma LLP for a cash consideration of US$2,000,000 and a royalty income of 5% on future global sales.
The sale of the investment will allow the Group to focus on its core product of recombinant human insulin,
produced by the ultimate holding company in Poland, Bioton S.A. (“Bioton”). The disposal of SIL shall
decrease the operating overheads of the Group in the immediate term.
The proceeds of US$500,000 was received by the transaction date, with remaining US$1,500,000 deferred
to the following financial year, in accordance with the terms of the agreement.
For
per
sona
l use
onl
y

8
b. Disposal of the Company’s interest in its manufacturing facility in China
On March 13, 2012, the Board concluded an Equity Interest Transfer Agreement for sale of the
Company’s interest (51%) in HSBBC to Mr. Xichen Gao for a cash consideration of US$3,460,000.
The sale will allow the Group to focus on sales of recombinant human insulin under the trademark
SciLinTM
through the long-term distribution arrangement established in China with Bayer HealthCare.
The Group has the assurance that increased production capacity of human insulin in Bioton’s facility is
able to meet the growing demand of the China market. The sale of HSBBC shall decrease operating costs
of the Group in the short-term.
c. Disposal of the Company’s 49.99% interest in its subsidiary in India
On March 15, 2010, an investor had entered into an investment agreement (“Investment Agreement”) with
the Company and SciGen BioPharma (a wholly owned subsidiary in India) to acquire 49.99% interest in
SciGen BioPharma upon the satisfaction of payment of a total consideration of US$8,000,000 by the
investor.
In second quarter 2012, following full satisfaction of the consideration and conditions as set out under the
Investment Agreement, the convertible debenture and loan of the investor were extinguished by way of
issuance of new shares by SciGen BioPharma and transfer of part of existing shares held by the Company
which, in aggregate represents 49.99% of interest in equity of SciGen BioPharma. The Company retains
50.01% shareholdings in SciGen BioPharma and retains control of the subsidiary based on the terms stated
in the shareholders’ agreement.
d. Recombinant human insulin licence for additional territories
On January 16, 2012, the Board announced that the Company has renegotiated the terms of its licensing
agreement with Ferring S.A. and Bio-Technology General (Israel) Ltd. for the manufacture and sale of
recombinant human insulin, resulting in an expansion of marketing rights.
Following the re-negotiation, the Company will have access to 40 countries ; 21 countries on exclusive
basis and 19 countries on a semi-exclusive basis.
The scope of the transaction is as follows:
• Company will maintain exclusive rights to 9 countries
• Company will obtain additional 12 countries on an exclusive basis
• Company will obtain additional 8 countries on a semi-exclusive basis
• Company will obtain 50% of royalties receivable by Ferring from 11 countries for which the
licence is converted from exclusive to semi-exclusive condition
This is a significant commercial transaction as it will enable the Company to enter into the growing
recombinant human insulin markets in the Middle East and Africa.
For
per
sona
l use
onl
y

9
Matters subsequent to the end of the financial year
In the opinion of the directors, no item, transaction or event of a material and unusual nature has arisen in the
interval between the end of the financial year and the date of this report which would substantially affect the
results of the Group and of the Company for the financial year in which this report is made.
Likely developments and expected results of operations
Likely developments in the operations of the Group and the Company at the date of this report include:
(a) Following the sale of its manufacturing facilities in Israel and China, the Group will focus its resources
on commercial activities within Asia Pacific region. Liaising closely with Bioton, the team is
committed to sourcing new business partnerships in emerging markets.
(b) The Group is working closely with other related companies of Bioton in exploring opportunities of
introducing new products into existing markets. It is the Group’s objective to bring value to
stakeholders through expansion of its product portfolio.
(c) The Group expects to complete the construction and validation of its manufacturing facility in India by
year 2013. The facility, when completed, will be manufacturing recombinant human insulin and
potentially other biotechnological products in accordance with European and American standards.
Further information on likely developments in the operations of the Group and the Company and the expected
results of operations have not been included in this report, because the directors are of the opinion that such
information is commercially sensitive.
Going concern
The management is responsible for preparation of financial statements that give a true and fair view in
accordance with provisions of the Singapore Companies Act and Singapore Financial Reporting Standards. The
directors of the Company consider that the going concern assumption in the preparation of the financial
statements is appropriate as the Group and the Company will have sufficient funding to carry out its operating
and investment activities based on the financial support given by the ultimate holding company.
For
per
sona
l use
onl
y

10
Information on directors
Director Experience
Mr. Slawomir Ziegert
(Age 47)
Mr. Slawomir Ziegert, is a medical doctor, graduate of the Medical
University in Gdańsk. He has been connected with the pharmaceutical
industry for over sixteen years, working in Poland and abroad for such
concerns as Eli Lilly, Egis Group (a part of Servier Group) and Ipsen. He has
enormous business experience covering different sectors of the
pharmaceutical industry, including biotechnology, in particular business
development within the scope of endocrinology and treatment of diabetes.
From 1993 to 2004 he worked in the Polish branch of Eli Lilly, one of the
world’s leading pharmaceutical concerns and manufacturers of recombinant
human insulin and insulin analogues, where he was responsible for the
development of diabetes business, relations with the diabetes environment
and governmental affairs.
In 1998 to 2000, he was also Eli Lilly's Country Manager in Slovakia,
supervising, among others, the development of sale of insulins and
antibiotics. In 2004 to 2005 he was CEO of Egis Pharmaceuticals (a part of
Servier Group) where he was responsible for the Baltic States area. In 2006
to 2009 he was CEO of Ipsen Poland. Working for Ipsen Poland, he was
responsible for introduction of somatostatin analogue and IgF1 to the Polish
market and for improvement of efficiency of marketing and sales activities.
He is fluent in English, Russian, German and Slovak.
Since November 9, 2009 he has been holding the position of the President of
the Managing Board of Bioton S.A. and is CEO of the Company.
Adam Tomasz
Polonek (Age 36)
Mr Adam Polonek is a graduate of the Economic Faculty at Academy of
Economics in Poland. Mr. Polonek joined Bioton S.A. in 2006 as Deputy
Finance Director and since April 2009 as the Finance Director.
Mr. Polonek was appointed to the position of Chief Financial Officer of
SciGen Ltd in January 2012 and holds finance-related positions in other
subsidiaries of SciGen and the Bioton Group.
Mr. Polonek’s professional experience includes successful career in one of
the leading investment bank in CEE Europe, CAIB Financial Advisers, which
is part of the leading banking Group Unicredit in Europe. During Mr.
Polonek’s career, he was involved in several Corporate Finance transactions
and he has vast experience in stock exchange markets.
For
per
sona
l use
onl
y

11
Director Experience
Ms. Jenny Low (Age 61)
Ms. Jenny Low is the Senior Vice President & Corporate Secretary of the Company. Ms. Low, who has been with the company for over 20 years, is the longest service staff member and has been involved in many areas of the Company’s operations, including the listing of the Company in ASX. Prior to her appointment as the Senior Vice President in October 2006, Ms. Low was the Chief Financial Officer of the Company. Ms. Low, a Chartered Accountant, held senior accountancy positions in various companies in both Malaysia and Singapore. With over 30 years of accounting experience, Ms. Low is well versed with accounting practices and tax laws of the Asia-Pacific region. Before joining SciGen in September 1991, Ms. Low was with Abacus Distribution Systems Pte Ltd, a company owned jointly by the major airline companies in Asia.
Mr. Kenneth Gross (Age 83)
Mr. Kenneth Gross co-founded Goldmark Plastic Compounds in 1957. The Company has since become a major distributor of plastic raw materials within the United States. In addition, Mr. Gross holds a number of directorships in various companies involved in chemical, metals, engineering resins and lubricating oils.
Joanna Szymańska- Bulska (Age 49)
Ms. Joanna Szymańska-Bulska is the Member of the Management Board and the Foreign Markets Director of Bioton S.A.. She has over 17 years of experience in pharmaceutical industry and distribution. During her career, Ms. Szymańska-Bulska held several management and senior management positions in Ciba Geigy, Novartis, Phoenix Pharma Aktiengesellschaft, Phoenix Pharma PL (“PPL”), mainly in the field of sales and marketing. For one year, she was appointed to the position of the Advisor of the Polish Minister of Health. She has also served as Member of the Polish Pharmacy Chamber and Member of the Supervisory Board of the PKPP Pharmacy and Chemistry Chamber. Before joining Bioton S.A., Ms. Szymańska-Bulska was a Chairman of the international Management Board and CEO of PPL for six years where she had overall responsibility for PPL.
Mr. Adam Wilczega (Age 58)
Mr. Adam Wilczega is a graduate of Warsaw School of Economics, where he obtained the title of MSc in economics. Moreover, in 1991 he completed managers training in Japan. His professional career started in 1979 at PTHZ Varimex in Warsaw where he worked as a section manager until 1984. In 1984 to 1989 he was employed as a director of Technical and Trade Information Centre in Cairo, Egypt. Then, in the period 1989 to 1991 he held the position of the Director of PTHZ Varimex in Warsaw. In 1991 to 1996 he was the president of the managing board of Future Trading Co. Sp. z o.o. (limited liability company) in Warsaw. He has been working in Bioton S.A. since 1996, when he became director for foreign co-operation and a Member of the Managing Board. Since 1998 he has been the president of the managing board of Bioton Trade Sp. z o.o. He is a member of the board of directors of SciGen Ltd. From 1997 till January 15, 2009, he was holding the post of the President of the Managing Board of Bioton S.A.. Since January 15, 2009 he has been Vice President of the Managing Board and since March 2009, he has been holding the post of Director for Foreign Markets of the Company.
For
per
sona
l use
onl
y

12
Director Experience
Marcin Dukaczewski (Age 34)
Mr. Marcin Dukaczewski was trained in International Political and Economical
Relations at the Warsaw University. Mr. Dukaczewski holds the position of
Vice President of the Management Board of Prokom Investments – a Polish
private-equity fund being the strategic investor in Bioton S.A..
Mr. Dukaczewski is also a member of the Supervisory Board of public listed
companies listed on the Warsaw Stock Exchange : Bioton (biotechnology),
Petrolinvest (oil & gas exploration) and Polnord (real estate development). Mr.
Dukaczewski is also a member of the Supervisory Board of Biolek (veterinary
products), Silurian (shale gas exploration) and a member of the Board of
Directors of Biolek, Inc in Canada.
Mateusz Patryk
Kosecki (Age 38)
Mr. Mateusz Kosecki is a graduate of the Executive MBA Program of
European University, Montreux, Switzerland. Mr Kosecki is the Foreign
Markets Director of Bioton S.A. and is responsible for the operations of the
company on overseas market. Mr. Kosecki is also the Vice President of Biolek
Sp z.o.o., a member of Bioton Group. Biolek develops innovative and
specialized feed additives for animals and innovative food supplements for
human use. Mr. Kosecki possesses extensive experience in international
business. From 1995 to 1996 he worked as the Marketing Manager in Lenex
Company in Sofia, Bulgaria. From 1997 to 2001 he was Head of Foreign
Corporate Governance and Operations of Ciech S.A., the biggest Polish
chemical holding company. He has been connected with pharmaceutical
industry for 10 years. From 2002 to 2006, as the Country Manager for Russia
of the Polish pharmaceutical company Ciech Polfa, and from 2006 to 2009 as
Regional Director for Eastern Europe in Bioton S.A.
Amol Jashvant Shah
(Age 47)
Mr. Amol Shah is the managing director of MJ Biopharm Pvt. Ltd., an Indian
based company possessing a modern facility in Mumbai for manufacturing of
life saving products including Insulin. He focuses on overall supervision of the
company and the development of strategic business alliances. From 1990 to
1995 he worked as a Director at Anglo Gulf Limited in Dubai where he was
responsible for setting up of a new facility for manufacture of pesticides in
Jebel Ali, Dubai and managing of new business collaboration with
multinational companies.
Information on Company Secretaries
Ms. Jenny Low was appointed to the position of company secretary in August 2003. Ms. Jenny Low
previously held the role of Chief Financial Officer of the Company for 17 years.
Lai Leng Wong has been the Company Secretary of the Company since 2002.
For
per
sona
l use
onl
y

13
Meetings of directors
The numbers of meetings of the Company's Board of directors and of each board committee held during the
financial year ended December 31, 2012, and the numbers of meetings attended by each director were:
Full meetings Meetings of committees
of directors Directors Audit Remuneration
A B A B A B
Mr. Slawomir Ziegert 3 3 - - - -
Mr. Adam Tomasz Polonek 3 3 3 3 - -
Mr. Kenneth Gross 3 3 3 3 - -
Mr. Adam Wilczega 1 3 1 3 - -
Mr. Mateusz Patryk Kosecki - 3 - - - -
Ms. Jenny Low 3 3 - - - -
Ms. Joanna Szymańska-Bulska - 3 - - - -
Mr. Marcin Dukaczewski 1 3 - - - -
Mr. Amol Jashvant Shah 1 3 - - - -
A = Number of meetings attended
B = Number of meetings held during the time the director held office or was a member of the
committee during the year
Key management personnels’ emoluments
The Remuneration Committee, comprising the following directors:
- Mr. Marcin Dukaczewski
- Mr. Adam Tomasz Polonek
The Remuneration Committee should comprise entirely of non-executive directors and be chaired by an
independent director. Whilst this is a departure from the recommendation, the Board believes that the new
Committee has the knowledge and experience on remunerations in the biopharmaceutical industry. During
the year, the remuneration committee did not meet.
The Remuneration Committee advises the Board on remuneration policies and practices generally, and makes
specific recommendations on remuneration packages and other terms of employment for the Chief Executive
Officer (who is also the Executive Chairman) and remuneration for non-executive directors. In reviewing
remuneration levels, the Board takes into account financial performance in addition to other goals related to
business development and operational issues.
For
per
sona
l use
onl
y

14
Executive remuneration and other terms of employment are reviewed annually by the Chief Executive Officer
having regard to performance against goals set at the start of the year, relevant comparative information and
independent expert advice. As well as base salary, remuneration packages include superannuation,
performance-related bonuses and fringe benefits.
Remuneration packages are set at levels that are intended to attract and retain executives capable of managing
the Group and the Company’s operations.
Remuneration of non-executive directors is determined by the Board within the maximum amount approved
by the shareholders from time to time. No options were issued and bonuses are not payable to non-executive
directors. No remuneration have been paid to the remuneration committee.
Details of remunerations
Details of the remunerations of the directors and the key management personnel of the Company and the
Group are set out in the following tables. During the year, the directors did not receive remunerations from
the Company, except for those as disclosed in the tables below.
The key management personnel of the Company include the directors as per pages 10 to 12 above and the
following executive officers, which also includes the following highest paid executives of the entity:
Marcus Poh - Regional Marketing Manager
Yvonne Lim - Group Financial Controller
Liza Domingo - Country Manager – Philippines
Hedy Ong - Finance and Logistics Manager
Li Minyi - Accounts Executive
The key management personnel of the Group are the directors of SciGen Ltd (see pages 10 to 12 above) and
those executives that are involved in the decision making of the Company and the Group. This includes these
Group executives who received the highest remuneration for the financial year ended December 31, 2012.
The executives are:
Jean-Claude Balducci - Country Manager - Australia & New Zealand
Sharon Walters - Business Development Executive
Marcus Poh - Regional Marketing Manager
Chander Shehkar Sharma - Business Development Executive
Edward Thomas - Business Development Executive
For
per
sona
l use
onl
y

15
Key management personnel of SciGen Ltd
Year ended December 31, 2012
Short-term employee benefits
Post-employment
benefits
Termination
benefits
Name
Cash
salary
and fees
Cash
bonus
Non-
monetary
benefits
Super-
annuation
Retirement
and
insurance
benefits
Amount
Total
US$ US$ US$ US$ US$ US$ US$
Non-executive directors
Mr. Kenneth Gross 31,084 - - - - - 31,084
Sub-total non-executive
directors
31,084
-
-
-
-
-
31,084
Executive director
Ms. Jenny Low 250,201 16,506 5,934 4,690 - - 277,331
Other key management
personnel
Mr. Marcus Poh 117,848 23,497 1,883 10,998 - - 154,226
Ms. Yvonne Lim 104,906 8,743 1,615 7,163 - - 122,427
Ms. Liza Domingo 80,324 7,165 1,385 37 - - 88,911
Ms. Hedy Ong 66,777 5,497 1,076 5,383 - - 78,733
Ms. Li Minyi 41,413 3,368 1,436 7,108 - - 53,325
Total 692,553 64,776 13,329 35,379 - - 806,037
For
per
sona
l use
onl
y

16
Year ended December 31, 2011
Short-term employee benefits
Post-employment
benefits
Termination
benefits
Name
Cash
salary
and fees
Cash
bonus
Non-
monetary
benefits
Super-
annuation
Retirement
and
insurance
benefits
Amount
Total
US$ US$ US$ US$ US$ US$ US$
Non-executive directors
Mr. Kenneth Gross 30,959 - - - - - 30,959
Dr. Marian Gorecki 5,000 - - - - - 5,000
Sub-total non-executive
directors
35,959
-
-
-
-
-
35,959
Executive director
Ms. Jenny Low 238,726 30,493 10,450 4,963 - - 284,632
Other key management
personnel
Mr. Marcus Poh 112,369 21,318 10,343 9,876 - - 153,906
Ms. Yvonne Lim 100,415 15,199 3,778 3,609 - - 123,001
Ms. Liza Domingo 75,007 18,018 3,571 36 - - 96,632
Ms. Hedy Ong 63,137 10,156 5,264 4,731 - - 83,288
Ms. Li Minyi 38,684 6,222 7,418 7,013 - - 59,337
Total 664,297 101,406 40,824 30,228 - - 836,755
For
per
sona
l use
onl
y

17
Key management personnel of the Group
Year ended December 31, 2012
Short-term employee benefits
Post-employment
benefits
Termination
benefits
Name
Cash
salary
and fees
Cash
bonus
Non-
monetary
benefits
Super-
annuation
Retirement
and
insurance
benefits
Amount
Total
US$ US$ US$ US$ US$ US$ US$
Non-executive directors
Mr. Kenneth Gross 31,084 - - - - - 31,084
Mr. Tim Holden 7,722 - - - - - 7,722
Sub-total non-executive
directors
38,806
-
-
-
-
-
38,806
Executive directors
Ms. Jenny Low 250,201 16,506 5,934 4,690 - - 277,331
Mr. Henry Dong-Ha Pyun 131,600 17,909 3,973 1,836 - - 155,318
Mr. Amol Jashvant Shah 134,928 - 843 4,595 - - 140,366
Other key management
personnel
Mr. Jean-Claude Balducci 257,878 1,852 - 23,376 - - 283,106
Ms. Sharon Walters 87,241 35,251 - 34,453 - - 156,945
Mr. Marcus Poh 117,848 23,497 1,883 10,998 - - 154,226
Mr. Chander Shekhar Sharma 117,757 17,866 - 12,206 - - 147,829
Mr. Edward Thomas 110,553 21,766 - 11,909 - - 144,228
Total 1,246,812 134,647 12,633 104,063 - - 1,498,155
For
per
sona
l use
onl
y

18
Year ended December 31, 2011
Short-term employee benefits
Post-employment
benefits
Termination
benefits
Name
Cash
salary
and fees
Cash
bonus
Non-
monetary
benefits
Super-
annuation
Retirement
and
insurance
benefits
Amount
Total
US$ US$ US$ US$ US$ US$ US$
Non-executive directors
Mr. Kenneth Gross
30,959
-
-
-
-
-
30,959
Dr. Marian Gorecki 5,000 - - - - - 5,000
Mr. Tim Holden 8,266 - - - - - 8,266
Sub-total non-executive
directors
44,225
-
-
-
-
-
44,225
Executive directors
Ms. Jenny Low 238,726 30,493 10,450 4,963 - - 284,632
Mr. Henry Dong-Ha Pyun 116,051 5,526 3,323 1,799 - - 126,699
Mr. Amol Jashvant Shah 115,833 - - 9,846 - - 125,679
Other key management
personnel
Mr. Jean-Claude Balducci 268,904 12,963 - 25,368 - - 307,235
Ms. Sharon Walters 70,833 59,835 - 58,994 - - 189,662
Mr. Chander Shekhar Sharma 121,723 28,424 - 13,462 - - 163,609
Mr. Edward Thomas 113,922 28,848 - 12,799 - - 155,569
Ms. Tova Katz 103,087 - 25,046 26,052 - - 154,185
Total 1,193,304 166,089 38,819 153,283 - - 1,551,495
Insurance of officers During 2012, the Company paid a premium of US$46,165 (2011 : US$46,165) to insure the directors and officers of the Company and its controlled entities, and the managers of each of the divisions of the Group and the Company. The liabilities insured are legal costs that may be incurred in defending civil or criminal proceedings that may be brought against the officers in their capacity as officers of entities in the Group and the Company, and any other payments arising from liabilities incurred by the officers in connection with such proceedings, other than where such liabilities arise out of conduct involving a wilful breach of duty by the officers or the improper use by the officers of their position or of information to gain advantage for themselves or someone else or to cause detriment to the Company. It is not possible to apportion the premium between amounts relating to the insurance against legal costs and those relating to other liabilities. The Audit Committee has recommended to the directors the nomination of Deloitte & Touche LLP for re-appointment as external auditors of the Group at the forthcoming AGM of the Company.
For
per
sona
l use
onl
y

19
Auditors
The auditors, Deloitte & Touche LLP, have expressed their willingness to accept re-appointment.
ON BEHALF OF THE DIRECTORS
...........................................................
Slawomir Ziegert
Chairman, Chief Executive Officer & Director
...........................................................
Adam Polonek
Chief Financial Officer & Director
Singapore
March 26, 2013
For
per
sona
l use
onl
y

20
SCIGEN LTD AND ITS SUBSIDIARIES
STATEMENT OF DIRECTORS
In the opinion of the directors, the consolidated financial statements of the Group and the statement of
financial position and statement of changes in equity of the Company set out on pages 37 to 108 are drawn up
so as to give a true and fair view of the state of affairs of the Group and of the Company as at
December 31, 2012 and of the results, changes in equity and cash flows of the Group and changes in equity of
the Company for the financial year then ended and at the date of this statement, with the continued financial
support from its ultimate holding Company, there are reasonable grounds to believe that the company will be
able to pay its debts when they fall due.
ON BEHALF OF BOARD OF DIRECTORS
...........................................................
Slawomir Ziegert
Chairman, Chief Executive Officer & Director
...........................................................
Adam Polonek
Chief Financial Officer & Director
Singapore
March 26, 2013
For
per
sona
l use
onl
y

21
SCIGEN LTD AND ITS SUBSIDIARIES
CORPORATE GOVERNANCE STATEMENT
SciGen Ltd (the “Company” or “SciGen”) and the Board are committed to achieving and demonstrating the
highest standards of corporate governance. The Company’s corporate governance framework is largely
consistent with the Best Practice recommendations released by the Australian Stock Exchange Corporate
Governance Council when taking into account the size and scope of the company. The Company and its
controlled entities together are referred to as the Group in this statement.
A summary of the compliance status of the Group under the broad Principle headings as defined in the
Guidelines is shown below.
Principle 1
Lay solid foundations for management and oversight
1.1 Establish the functions reserved to the Board and those delegated to Senior Executives
The relationship between the Board and senior executives is important to the Group’s long-term
success. Day to day management of the Group’s affairs and the implementation of the corporate
strategy and policy initiatives are formally delegated by the Board to the Chief Executive Officer
(“CEO”) and senior executives. Responsibilities are delineated by formal authority delegation.
The directors are responsible to the shareholders for the performance of the Company in both the short
and longer term and seek to balance sometimes competing objectives in the best interests of the Group
as a whole. Their focus is to enhance the interests of shareholders and other key stakeholders and to
ensure the Group is properly managed.
Roles of the Chairman and CEO
The Chairman is responsible for leading the Board, ensuring that Board activities are organised and
efficiently conducted and for ensuring the directors are properly briefed for meetings. The CEO is
responsible for implementing Group strategies and policies.
For
per
sona
l use
onl
y

22
Role of the Board
(a) The directors are responsible for the direction and supervision of SciGen’s business and for its
overall corporate governance. This includes ensuring that internal controls and reporting
procedures are adequate and effective. The directors recognise the need to maintain the highest
standards of behaviour, ethics and accountability.
(b) The primary functions of the Board include:
(1) formulating and approving objectives, strategies and long-term plans for SciGen's continued
development and operation, in conjunction with management;
(2) appointing and removing the chief executive officer;
(3) where appropriate, approving the appointment and the removal of senior executives;
(4) monitoring the implementation of these objectives, strategies and long-term plans to ensure
SciGen, to the best of its ability, delivers shareholder value;
(5) approval and monitoring the progress of major capital expenditure, acquisitions and
disposals;
(6) monitoring SciGen’s overall performance and financial results, including adopting annual
budgets and approving SciGen’s financial statements;
(7) ensuring that adequate systems of internal control exist and are appropriately monitored for
compliance;
(8) selecting and reviewing the performance of the CEO and reviewing the performance of
senior operating management;
(9) ensuring significant business risks are identified and appropriately managed;
(10) ensuring that SciGen meets the statutory, regulatory and reporting requirements of the ASX
and requirements under Australia and Singapore corporations law;
(11) ensuring that SciGen, its directors, officers, employees and associates are aware of and
comply with all relevant laws and regulations;
(12) reporting to shareholders on performance;
(13) deciding the payment of dividends to shareholders; and
(14) reviewing, ratifying and monitoring systems of risk management and internal control, codes
of conduct, and legal compliance.
For
per
sona
l use
onl
y

23
(c) The Board consists of the Chairman and CEO, two executive directors, and six other non-
executive directors. The term of directors’ appointments is governed by SciGen’s Constitution. At
least one third of directors must retire and seek re-election at each Annual General Meeting of
SciGen. Mr. Kenneth Gross having attained the age of 70 years, is required to seek
re-election annually, under the provision of the Singapore Companies Act.
(d) The Board has established an Audit Committee and a Remuneration Committee. From time to
time, the Board may determine to establish specific purpose sub-committees to deal with specific
issues.
1.2 Process for evaluating the performance of senior executives
The evaluation of the performance of senior executives by way of annual appraisals are conducted
annually with the respective supervisors and reported to the CEO.
Principle 2
Structure the Board to add value
ASX recommends having a board of an effective composition, size and commitment to adequately discharge
its responsibilities and duties. The Company had addressed these recommendations as noted below:
A majority of the Board should be independent directors
Board members
Details of the members of the Board, their experience, expertise, qualifications are set out in the directors’
report in pages 10 to 12. At the date of this report, the Board comprises nine (9) directors, three (3) being
executive directors and six (6) being non-executive directors. Of the six (6) non-executive directors,
one (1) of whom is deemed independent under the principles set out in the Guidelines.
Directors’ independence
The Board does not comprise of a majority of independent directors. The non-independent directors have the
relevant expertise in the corporate finance, manufacture and world-wide sales and marketing of the product.
Whilst this is a departure from the recommendation, the Board believes that the composition of the Board
currently brings the right mix of complementary skills, experience and representation for the Company and its
shareholders at this point in its life. The Board has also resolved that the mere fact that a director has been in
office for a period greater than ten (10) years does not change that director’s status as an independent.
The independent director as of the date of this report is:
Mr. Kenneth Gross F
or p
erso
nal u
se o
nly
24
Independent professional advice
Directors and Board committees have the right, in connection with their duties and responsibilities, to seek
independent professional advice at the Company's expense. Prior written approval of the Chairman is
required, but this will not be unreasonably withheld. Matters requiring professional independent advice are
tabled and discussed at board meetings.
Commitment
The number of meetings of the Company’s Board of directors and of each board committee held during the
year ended December 31, 2012, and the number of meetings attended by each director is disclosed on
page 13. It is the Company’s practice to allow its executive directors to accept appointments outside the
company with prior written approval of the Chairman.
Conflict of interests
Entities connected with Mr. Slawomir Ziegert, Mr. Adam Polonek, Mr. Adam Wilczega, Mr. Marcin
Dukaczewski, Ms. Joanna Szymanska-Bulska, Mr. Mateusz Kosecki and Mr. Amol Shah had business
dealings with the Group and the Company during the year, as described in notes 5 and 6 to the financial
statements. In accordance with the Board charter, the directors concerned declare their interests in those
dealings to the Company and take no part in decisions relating to them or the preceding discussions.
Performance assessment
It is intended that the Board may undertake an annual self-assessment of its collective performance. The
process may be facilitated by an independent third party. In addition, each board committee may undertake an
annual self assessment on the performance of the committee and achievement of committee objectives.
The Chairman intends when possible to annually assess the performance of individual directors and meet
privately with each director and senior executives to discuss this assessment. The Chairman’s performance
may be reviewed by the Board.
Each year’s budget provides for training and education of staff, both internally and externally.
2.1 The Chair should be an independent director
Mr. Slawomir Ziegert, Chairman of the Board is not an independent director under the principles set out
in the Guidelines. Whilst this is a departure from the recommendation, the appointment of
Mr. Ziegert, who is the Chief Executive Officer of Bioton S.A., holder of 95.57% of the Company, is
vital at this point in time as Mr. Ziegert is well positioned to take an active and effective role to oversee
and expedite the restructure, formulate objectives, strategies and long-term plans of the Company.
For
per
sona
l use
onl
y

25
2.2 The roles of the Chair and Chief Executive Officer should not be exercised by the same individual
The Chairman of the Company is Mr. Slawomir Ziegert, the Chief Executive Officer. Whilst this is a
departure from the recommendation, the Board believes that given the current size of the Company and
its history, the Board considers that this function is efficiently achieved with the appointment of the
Chief Executive.
2.3 The Board should establish a Nomination Committee
The Company does not have a formally constituted Nomination Committee given the early stage of the
Company’s development and the complete nature of the Board composition currently. The Board is of
the opinion that there would be no efficiencies to be gained in establishing a separate Nomination
Committee. The function of reviewing the competencies of directors, appoint and re-appointment of
directors, review of board succession and evaluation of the performances of the board and committees is
undertaken by the full Board. At such time when the company is well established, a Nomination
Committee will be formed and the Board restructured.
2.4 Process for evaluating the performance of the Board, its Committees and individual directors
The Chairman of the Board is responsible for evaluating Board and individual directors’ performance
annually.
Induction and education
Induction procedures have not been required as all recently appointed directors have been involved with
the industry and or with the Company prior to their appointment as directors.
Access to information
The Board is provided access to all documents and information it needs in order to discharge its
responsibilities effectively. As directed by the Board, senior executives furnish the board with monthly,
quarterly and ad hoc reports on the operations.
The Board and the Company Secretary
The Company Secretary supports the Board by monitoring the Board policy and ensuring that the
procedures are followed. The Company Secretary coordinates the completion and despatch of board
agenda. The Company Secretary also advises the Board on corporate governance matters.
For
per
sona
l use
onl
y

26
Principle 3
Promote ethical and responsible decision-making
ASX recommends that the company should actively promote ethical and responsible decision-making. The
Company had addressed these recommendations as noted below:
3.1 Establish and Disclosure of a Code of Conduct
The Company has developed a Code of Conduct (the “Code”) which has been reviewed by the Board
and will apply to all directors and employees. The Code will be regularly reviewed and updated as
necessary to ensure it reflects the highest standards of behaviour and professionalism and the practices
necessary to maintain confidence in the Group’s integrity.
In summary, the Code requires that at all times, all Company personnel act with the utmost integrity,
objectivity and in compliance with the letter and the spirit of the law and company policies.
The Company is in the process of reviewing the current policies of the Code of Conduct to include the
reporting and investigation of unethical practices. Although the process is not included in the current
Code of Conduct, to date, all reports of unethical practices received have been taken seriously by the
Board and investigated and action taken if required.
3.2 Diversity Policy
In accordance with the ASX Recommendations, the company has established a Diversity Policy. The
Company recognises that a talented and diverse workforce at all levels of the Company is a key
competitive advantage and that experienced, skilled and diversified employees are an important
contributor to the Company’s success.
The Company promotes an inclusive workplace where employee differences like gender, age, culture,
disability and lifestyle choice are valued. The unique skills, perpectives and experience that our
employees possess promotes greater creativity and innovation that better reflects and serves the needs
of our diverse customer base ultimately driving improved business performance. The Company
recognises that encouraging workplace diversity is not just the socially responsible course of action but
is also a source of competitive advantage for the Group.
The Group is committed to improving the gender diversity throughout the business with a particular
focus on what can be achieved to improve the number of females in senior leadership roles. The
company’s current objective in relation to gender diversity is to monitor and maintain the percentage of
females in senior leadership positions at a level of at least 40%.
The proportion of female employees to male employees within the Group as of December 31, 2012 was
32% female and 68% male. 42% of senior leadership positions are held by females and 22% of
SciGen’s directors are female (16.7% of non-executive directors).
The Company utilizes a range of inputs to inform its strategy and also assess its performance in this area
such as employee opinion surveys, targeted focus groups, monitoring a host of employee data as well as
external benchmarking.
For
per
sona
l use
onl
y

27
3.3 Policy concerning trading in the Company’s securities
Trading in Company securities is regulated by the Securities and Futures Act and the ASX Listing
Rules. The Board makes all directors, officers and employees aware on the appointment that it is
prohibited to trade in the Company’s securities whilst that director, officer or employee is in the
possession of price sensitive information.
For details of shares held by directors and officers please refer to the Directors’ Report on page 6.
Directors are required to report to the Company Secretary any movements in their holdings of Company
securities, which are reported to ASX in the required timeframe prescribed by the ASX Listing Rules.
The Share Trading Policy can be found on the Company website.
Principle 4
Safeguard integrity in financial reporting
ASX recommends that the Company should have a structure to independently verify and safeguard the
integrity of their financial reporting. The Company had addressed these recommendations as noted below:
4.1 The Board should establish an Audit Committee
The Board has established an Audit Committee to assist in the execution of its duties and to allow
detailed consideration of complex issues. Matters determined by the Audit Committee are submitted to
the Board as recommendations for board decision, as required unless the Board has delegated the
authority for a decision to the appropriate committee.
Minutes of Audit Committee meetings are tabled at subsequent board meetings.
4.2 Structure of the Audit Committee
The Audit Committee comprises 3 members:
Mr. Kenneth Gross (Chairman) (Independent director)
Mr. Adam Wilczega (Non-independent director)
Mr. Adam Polonek (Non-independent director)
The Chairman of the Audit Committee is an independent director. Details of these directors’
qualification, expertise, experience and attendance at Audit Committee meetings are set out in the
directors’ report on pages 10 to 12.
For
per
sona
l use
onl
y

28
4.3 Charter
The Audit Committee meets at least 2 times in a year.
The CEO, Chief Financial Officer (“CFO”) and external auditors are invited to attend Audit Committee
Meetings at the discretion of the Audit Committee. Time is allocated for the Audit Committee to meet
with the external auditors without management being present.
The responsibilities of the Audit Committee are to:
(a) assist the Board to discharge fiduciary responsibilities with regard to the Company's accounting,
control and reporting practices by monitoring the internal control environment and management
over corporate assets;
(b) review internal controls and any changes thereto approved and submitted by the Company's CFO;
(c) provide assurance regarding the quality and reliability of financial information used by the Board
to enable the Board to maintain confidence in the financial reports;
(d) oversee the activities of the external audit staff of the Company and to review the Company's risk
management policies, internal control processes, financials, operating results and accounting
policies;
(e) review and recommend to the Board the adoption of the Company's annual financial statements;
and
(f) liaise with and review the performance of the external auditor, who may be invited to attend Audit
Committee meetings to discuss financial matters and business risk.
External auditors
The Company’s and Audit Committee’s policy is to appoint external auditors who clearly demonstrate quality
and independence. The performance of the external auditor is reviewed annually, taking into consideration
assessment of performance and existing value. Deloitte & Touche LLP were appointed as the external
auditors in June 2010.
During the financial year, the external auditors did not render any non-audit services to the Group. It is the
policy of the external auditors to provide an annual declaration of their independence to the Audit Committee.
For
per
sona
l use
onl
y

29
Principle 5
Make timely and balanced disclosure
ASX recommends that the Company should promote timely and balanced disclosure of all material matters
concerning the Company. The Company had addressed these recommendations as noted below:
5.1 Establish written policies to ensure compliance with ASX Listing Rule
Disclosure requirement
All announcements made are reviewed and approved by the Board prior to the release to the market.
The CEO, CFO and Senior Vice President & Corporate Secretary have been nominated as the persons
responsible for communications with the Australian Stock Exchange (“ASX”). This role includes
responsibility for ensuring compliance with the continuous disclosure requirements in the ASX listing
rules and overseeing and co-ordinating information disclosure to the ASX, analysts, brokers,
shareholders, the media and the public.
The Corporate Secretary advises the Board on ASX Listing Rules and Guidance Recommendations
matters.
The Company complies with written policies and procedures of the ASX on information disclosure that
focus on continuous disclosure of any information concerning the Company and its controlled entities
that a reasonable person would expect to have a material effect on the price of the Company’s securities.
All information disclosed to the ASX is posted on the Company’s website as soon as it is disclosed to
the ASX. When analysts are briefed on aspects of the Group’s operations, the material used in the
presentation is released to the ASX and posted on the Company’s website.
All shareholders receives a copy of the Company’s annual report unless they have indicated otherwise.
In addition, the Company seeks to provide opportunities for shareholders to participate through
electronic means. All recent announcements of the Company, media briefings, details of the
Company’s meetings, press releases and financial reports are available on the Company’s website
www.scigenltd.com.
The website also includes a feedback mechanism and an option for shareholders to register their
e-mail address for e-mail updates of the Company’s matters.
For
per
sona
l use
onl
y

30
Principle 6
Respect the rights of shareholders
ASX recommends that the Company should respect the rights of shareholders and facilitate the effective
exercise of those rights. The Company had addressed these recommendations as noted below:
6.1 Communications Policy
The Company has developed a website which contains sections dealing specifically with investor
information.
All ASX and other important announcements are published on the website simultaneously with their
release into the public domain.
Shareholders can also e-mail the Company and receive updates or answers to specific questions where
appropriate.
In terms of external audit, a formal invitation has been extended by the Board to the audit partner at
Deloitte & Touche LLP to attend the Annual General Meeting of the Company and through the
Chairman, will be available to answer questions relating to the conduct of the audit.
Principle 7
Recognise and manage risk
ASX recommends that the Company establish a sound system of risk oversight and management and internal
control. The Company had addressed these recommendations as noted below:
7.1 Policies for oversight and management of material business risks
The Company is committed to the management of risks to protect its employees, assets, earnings,
markets, reputation and the environment.
The Board has implemented risk management procedures throughout the Company that aim to identify
the sources of risk and loss, quantify the impact of these sources and control and reduce the risk through
practical and cost effective control measures. This will continue to be reviewed and enhanced.
In addition, the Company uses risk-financing techniques, including insurance, to reduce the financial
impact of any uncontrollable or catastrophic losses.
The Audit Committee of the Board currently accepts the role and responsibility of over-seeing the
control of financial risk. The committee ensures that adequate internal controls and risk-financing
measures (such as insurance) are in place. These measures provide some protection against financial
events.
For
per
sona
l use
onl
y

31
In terms of more general risk management, managers in each country where the Company employs staff
are responsible for conforming to local occupational health and safety requirements. Given the
relatively small size of the Company and its geographic diversity it is not considered useful to constitute
a formal Risk Management Committee at this point.
Further risk policy development will be undertaken in consultation with the Audit Committee and the
Board as appropriate.
7.2 Risk Management and internal control system
Risk assessment and management
The Board is responsible for ensuring there are adequate policies in relation to risk oversight and
management, and internal control systems. In summary, the Company’s policies are designed to ensure
strategic, operational, legal, reputation and financial risks are identified, assessed, addressed and
monitored to enable achievement of the Group’s business objectives.
Considerable importance is placed on maintaining a strong control environment. There is an
organisation structure with clearly drawn lines of accountability and delegation of authority. Adherence
to the code of conduct is required at all times and the Board actively promotes a culture of quality and
integrity.
Internal Audit
Given the present size of the Company, the Board does not employ an internal auditor.
7.3 Assurances from CEO and CFO
Corporate reporting
The CEO and CFO have made the following certifications in writing to the Board:
that the Company’s financial reports are complete and present a true and fair view, in all material
respects, of the financial condition and operational results of the Group and Company and are in
accordance with relevant accounting standards, except for the matters qualified in the auditors’ report;
and
that the above statements are founded on a sound system of risk management and internal compliance
and control and which implement the policies adopted and that the Company’s risk management and
internal compliance and control is operating efficiently and effectively in all material aspects.
For
per
sona
l use
onl
y

32
Principle 8
Remunerate fairly and responsibly
ASX recommends that the Company should ensure that the level and composition of remuneration is
sufficient and reasonable and that its relationship to performance is clear. The Company had addressed these
recommendations as noted below:
8.1 Remuneration Committee
The Remuneration Committee currently consists of the following directors:
Mr. Marcin Dukaczewski
Mr. Adam Tomasz Polonek
The Remuneration Committee should comprise entirely of non-executive directors and be chaired by an
independent director. Whilst this is a departure from the recommendation, the Board believes that the
new Committee have the knowledge and experience on remunerations in the biopharmaceutical
industry.
Until now, the Remuneration Committee was responsible mainly for the review and recommendation of
the remuneration of the CEO. Given the size of the Company and the only function of the Remuneration
Committee, there is no formal charter for the role and responsibilities, composition, structure,
membership requirements and the manner in which the committee is to operate. The Remuneration
Committee is in the process of reviewing the scope of the Remuneration Committee and will be
preparing a formal Charter and when adopted, it will be made available on the Company’s website.
Matters determined by the Remuneration Committee are submitted to the Board as recommendations for
board decision, as required unless the Board has delegated the authority for a decision to the appropriate
committee.
Details of these directors’ qualifications, experience and attendance at Remuneration Committee
meetings are set out in the directors’ report on pages 10 to 12. During the year, the Remuneration
Committee did not meet.
The Remuneration Committee advises the Board on remuneration policies and practices generally, and
makes specific recommendations on remuneration packages and other terms of employment for
executive and non-executive directors.
Further information on directors’ remuneration is set out in the directors’ report on pages 15 to 18 and
Note 6 to the financial statements.
For
per
sona
l use
onl
y

33
8.2 Distinguish the structure of non-executive director’s remuneration from that of executives
Current remuneration packages of executive directors and senior executives include a balance between
fixed and incentive pay. The incentives are payable upon achievement of certain short term and long
term objectives. Non-executive directors, if paid, receive a fixed fee.
The twelve months report of the Company contains detailed information of the remuneration of
directors and senior executives. This information includes references to share option allocations, if any.
The Remuneration Committee and the Board will review the term of any proposed scheme for the
retirement benefits, other than the statutory superannuation, for non-executive directors.
For
per
sona
l use
onl
y
For
per
sona
l use
onl
y

For
per
sona
l use
onl
y

For
per
sona
l use
onl
y

37
SCIGEN LTD AND ITS SUBSIDIARIES
STATEMENTS OF FINANCIAL POSITION
December 31, 2012
Group Company
Note 2012 2011 2010 2012 2011 2010
US$’000 US$’000 US$’000 US$’000 US$’000 US$’000
(Restated) (Restated) (Restated) (Restated)
ASSETS
Current assets
Cash and cash equivalents 7 1,799 1,997 3,926 479 566 932
Trade and other receivables 8 9,914 5,665 4,330 10,069 5,836 2,396
Inventories 9 1,829 1,958 1,079 378 299 189
13,542 9,620 9,335 10,926 6,701 3,517
Assets classified as
held-for-sale 10 - 11,312 10,800 - 5,460 11,652
Total current assets 13,542 20,932 20,135 10,926 12,161 15,169
Non-current assets
Property, plant and equipment 11 15,400 12,880 22,792 58 61 84
Intangible assets 12 13,116 13,605 14,266 12,964 13,404 13,884
Lease prepayment 13 377 384 826 - - -
Long term prepayment 14 3,000 3,000 3,000 3,000 3,000 3,000
Deferred tax assets 15 7,140 7,319 7,540 7,140 7,140 7,366
Subsidiaries 16 - - - 3,202 21,017 30,771
Total non-current assets 39,033 37,188 48,424 26,364 44,622 55,105
Total assets 52,575 58,120 68,559 37,290 56,783 70,274
LIABILITIES AND
CAPITAL DEFICIENCY
Current liabilities
Trade and other payables 17 21,745 23,077 21,461 18,166 20,788 16,703
Bank loans 18 - 1 - - - -
Loans from an outside party 18 - 6,136 - - 3,000 -
21,745 29,214 21,461 18,166 23,788 16,703
Liabilities directly associated
with assets classified
as held-for-sale 10 - 2,512 800 - - -
Total current liabilities 21,745 31,726 22,261 18,166 23,788 16,703
For
per
sona
l use
onl
y

38
SCIGEN LTD AND ITS SUBSIDIARIES
STATEMENTS OF FINANCIAL POSITION
December 31, 2012
Group Company
Note 2012 2011 2010 2012 2011 2010
US$’000 US$’000 US$’000 US$’000 US$’000 US$’000
(Restated) (Restated) (Restated) (Restated)
LIABILITIES AND
CAPITAL DEFICIENCY
Non-current liabilities
Other payables 17 9,465 8,358 7,370 9,465 8,358 7,370
Bank loans 18 - - 11 - - -
Loan from ultimate holding
company 18 74,527 74,527 73,727 74,527 74,527 73,727
Loans from an outside party 18 - - 3,743 - - 3,000
Total non-current liabilities 83,992 82,885 84,851 83,992 82,885 84,097
Capital, reserves and
non-controlling interests Share capital 19 42,530 42,530 42,530 42,530 42,530 42,530
Capital reserve 20 551 - - - - -
Translation reserves 20 (4,237) 961 1,313 - - -
Accumulated losses (98,655) (103,324) (86,304) (107,398) (92,420) (73,056)
Equity attributable to owners
of the company (59,811) (59,833) (42,461) (64,868) (49,890) (30,526)
Non-controlling interests 6,649 3,342 3,908 - - -
Net capital deficiency (53,162) (56,491) (38,553) (64,868) (49,890) (30,526)
Total liabilities, net of
capital deficiency 52,575 58,120 68,559 37,290 56,783 70,274
See accompanying notes to financial statements.
For
per
sona
l use
onl
y

39
SCIGEN LTD AND ITS SUBSIDIARIES
CONSOLIDATED STATEMENT OF COMPREHENSIVE INCOME
Year ended December 31, 2012
Group
Note 2012 2011
US$’000 US$’000
Continuing Operations
Revenue 21 18,150 15,763
Other income 122 41
Changes in inventories of finished goods (257) 886
Purchases (7,786) (7,638)
Employee benefits expense 23 (4,465) (4,485)
Depreciation of property, plant and equipment 11 (135) (691)
Amortisation of lease prepayment 13 (4) (17)
Amortisation of intangible assets 12 (498) (505)
Impairment loss on assets held-for-sale 10 - (1,981)
Impairment loss on intangible assets 12 - (192)
Write-off of intangible assets 12 (17) (43)
Loss on disposal of property, plant and equipment 23 (3) (1)
Gain on sale of subsidiary 28 768 -
Other operating expenses 22 (4,913) (5,868)
Waiver of loan and payables from ultimate holding company 5 - 1,571
Finance income 24 49 37
Finance expense 24 (1,225) (1,269)
Loss before income tax (214) (4,392)
Income tax expense 25 (200) (272)
Loss from continuing operations (414) (4,664)
Discontinued Operations Profit/(Loss) from discontinued operations 26 4,557 (13,063)
Profit/(Loss) for the year 23 4,143 (17,727)
Other comprehensive income
Exchange differences on translating foreign operations (190) (211)
Exchange differences reclassified to profit or loss,
on disposal of subsidiaries (5,282) -
Other comprehensive income for the year (5,472) (211)
Total comprehensive loss for the year (1,329) (17,938)
For
per
sona
l use
onl
y

40
SCIGEN LTD AND ITS SUBSIDIARIES
CONSOLIDATED STATEMENT OF COMPREHENSIVE INCOME
Year ended December 31, 2012
Group
Note 2012 2011
US$’000 US$’000
Profit/(Loss) for the year attributable to:
Equity holders of the Company 4,669 (17,020)
Non-controlling interests (526) (707)
Profit/(Loss) for the year 4,143 (17,727)
Total comprehensive loss attributable to:
Equity holders of the Company (529) (17,372)
Non-controlling interests (800) (566)
Total comprehensive loss for the year (1,329) (17,938)
Earnings/(Loss) per share
From continuing and discontinued operations:
Basic earnings/(loss) per share (cents) 27 0.845 (3.082)
From continuing operations:
Basic earnings/(loss) per share (cents) 27 0.020 (0.716)
Note: There is no tax effect on the component indicated in the other comprehensive income.
See accompanying notes to financial statements.
For
per
sona
l use
onl
y

41
SCIGEN LTD AND ITS SUBSIDIARIES
STATEMENTS OF CHANGES IN EQUITY
Year ended December 31, 2012
Attributable
to equity Non- Share Capital Translation Accumulated holders of controlling capital reserve reserves losses the company interests Total US$’000 US$’000 US$’000 US$’000 US$’000 US$’000 US$’000 Group
At January 1, 2011 (restated) 42,530 - 1,313 (86,304) (42,461) 3,908 (38,553) Total comprehensive loss for the year - - (352) (17,020) (17,372) (566) (17,938) At December 31, 2011 (restated) 42,530 - 961 (103,324) (59,833) 3,342 (56,491)
Total comprehensive loss for the year - - (5,198) 4,669 (529) (800) (1,329) Disposal of subsidiary - - - - - (3,342) (3,342) Transactions arising from disposal of interest in a subsidiary (Note 20b) - 551 - - 551 7,449 8,000
At December 31, 2012 42,530 551 (4,237) (98,655) (59,811) 6,649 (53,162) See accompanying notes to financial statements. F
or p
erso
nal u
se o
nly

42
SCIGEN LTD AND ITS SUBSIDIARIES
STATEMENTS OF CHANGES IN EQUITY
Year ended December 31, 2012
Share Accumulated
capital losses Net
US$’000 US$’000 US$’000
Company
At January 1, 2011 (restated) 42,530 (73,056) (30,526)
Total comprehensive loss for the year - (19,364) (19,364)
At December 31, 2011 (restated) 42,530 (92,420) (49,890)
Total comprehensive loss for the year - (14,978) (14,978)
At December 31, 2012 42,530 (107,398) (64,868)
See accompanying notes to financial statements.
For
per
sona
l use
onl
y

43
SCIGEN LTD AND ITS SUBSIDIARIES
CONSOLIDATED STATEMENT OF CASH FLOWS
Year ended December 31, 2012
2012 2011
US$’000 US$’000
Operating activities
Profit/(Loss) before income tax 4,343 (17,455)
Adjustments for:
Depreciation of property, plant and equipment 135 691
Amortisation of lease prepayment 4 17
Amortisation of intangible assets 498 505
Loss on disposal of property, plant and equipment 3 1
Gain on disposal of asset held-for-sale (4,705) -
Gain on sale of subsidiary (768) -
Allowance for doubtful debts 1 1
Intangible assets written-off 17 43
Waiver of loan and payables from ultimate holding company - (1,571)
Interest income (49) (37)
Interest expenses 1,196 1,195
Impairment loss on property, plant and equipment - 6,213
Impairment loss on intangible assets - 2,065
Write-down of inventories 12 950
Net foreign exchange losses 29 2,439
Operating cash flow before movement in working capital 716 (4,943)
Inventories 129 207
Trade and other receivables 712 (2,253)
Trade and other payables (Note A) (1,006) 222
Cash generated from/(used in) operations 551 (6,767)
Income taxes paid (5) (50)
Net cash flows from/(used in) operating activities 546 (6,817)
For
per
sona
l use
onl
y

44
SCIGEN LTD AND ITS SUBSIDIARIES
CONSOLIDATED STATEMENT OF CASH FLOWS
Year ended December 31, 2012
2012 2011
US$’000 US$’000
Investing activities
Interest received 49 37
Purchase of property, plant and equipment (2,749) (2,265)
Purchase of intangible assets (22) (73)
Proceeds from disposal of property, plant and equipment 8 3
Proceeds from disposal of asset held-for-sale (Note A) 150 350
Net cash flows used in investing activities (2,564) (1,948)
Financing activities
Interest paid (91) (207)
Repayment of bank loans (2) (9)
Loans from ultimate holding company - 1,501
Loan from an outside party (Note B) 1,950 5,393
Net cash flows from financing activities 1,857 6,678
Net decrease in cash and cash equivalents (161) (2,087)
Cash and cash equivalents at beginning of the year 1,997 3,926
Effect of exchange rate fluctuations on cash held (37) 158
Cash and cash equivalents at end of the year 1,799 1,997
Note A :
(Non-cash transaction for operating and investing activities)
Partial proceeds from disposal of asset held for sale amounting to US$350,000 was paid to Bioton S.A.
(ultimate holding company) by the purchaser. Subsequently, the Company’s trade debts owing to Bioton S.A.
was reduced by the same amount.
Note B :
(Non-cash transaction for financing activities)
In addition to the information disclosed in Note 18 to the consolidated financial statements, a loan was raised
during the period amounting to US$1,950,000. In second quarter 2012, the loan obtained during the period
amounting US$1,950,000 plus the loan payable as at 31 December 2011 was converted to equity of a
subsidiary.
See accompanying notes to financial statements.
For
per
sona
l use
onl
y

45
SCIGEN LTD AND ITS SUBSIDIARIES
NOTES TO FINANCIAL STATEMENTS
December 31, 2012
1 GENERAL
The Company (Registration Number. 199805796R) is incorporated in the Republic of Singapore with its
principal place of business and registered office is located at 152 Beach Road, #26-07/08 Gateway East,
Singapore 189721.
The Company is listed on the Australian Stock Exchange. The consolidated financial statements are
presented in United States dollars, which is the Company’s functional currency and rounded to the
nearest thousand ($’000), unless stated otherwise.
The principal activities of the Group and the Company are those relating to the manufacture and
distribution of biopharmaceutical products under exclusive licensing arrangements.
The consolidated financial statements of the Group and statement of financial position and statement of
changes in equity of the Company for the year ended December 31, 2012 were authorised for issued by the
Board of Directors on March 26, 2013.
2 SUMMARY OF SIGNIFICANT ACCOUNTING POLICIES
BASIS OF ACCOUNTING - The financial statements have been prepared in accordance with the
historical cost basis, except as disclosed in the accounting policies below, and are drawn up in accordance
with the provisions of the Singapore Companies Act and Singapore Financial Reporting Standards
(“FRS”).
ADOPTION OF NEW AND REVISED STANDARDS - In the current financial year, the Group has
adopted all the new and revised FRSs and Interpretations of FRSs (“INT FRSs”) that are relevant to its
operations and effective for annual periods beginning on or after January 1, 2012. The adoption of
these new/revised FRSs and INT FRSs does not result in changes to the Group and the Company’s
accounting policies and has no material effect on the amounts reported for the current or prior years.
For
per
sona
l use
onl
y

46
At the date of authorisation of these financial statements, the following new/revised FRSs and
amendments to FRSs that are relevant to the Group and the Company were issued but not effective:
Amendments to FRS 1 Presentation of Financial Statements - Amendments relating to
Presentation of Items of Other Comprehensive Income
FRS 27 (Revised) Separate Financial Statements
FRS 110 Consolidated Financial Statements
FRS 112 Disclosure of Interests in Other Entities
FRS 113 Fair Value Measurement
Amendments to FRS 32 Financial Instruments: Presentation and FRS 107 Financial Instruments:
Disclosure – Offsetting Financial Assets and Financial Liabilities
Annual Improvements to FRS 2012
Consequential amendments were also made to various standards as a result of these new/revised
standards.
The management anticipates that the adoption of the above FRSs and amendments to FRS in future
periods will not have a material impact on the financial statements of the Group and of the Company in
the period of their initial adoption except for the following:
Amendments to FRS 1 Presentation of Financial Statements - Amendments relating to Presentation of
Items of Other Comprehensive Income (“OCI”)
The amendment on Other Comprehensive Income (“OCI”) presentation will require the Group to
present in separate groupings, OCI items that might be recycled i.e., reclassified to profit or loss (e.g.,
those arising from cash flow hedging, foreign currency translation) and those items that would not be
recycled (e.g. revaluation gains on property, plant and equipment under the revaluation model). The tax
effects recognised for the OCI items would also be captured in the respective grouping, although there is
a choice to present OCI items before tax or net of tax.
Changes arising from these amendments to FRS 1 will take effect from financial years beginning on or
after July 1, 2012, with full retrospective application.
The Group is currently estimating the effects of amendments to FRS 1 in the period of initial adoption.
For
per
sona
l use
onl
y

47
FRS 110 Consolidated Financial Statements and FRS 27 Separate Financial Statements
FRS 110 replaces the control assessment criteria and consolidation requirements currently in FRS 27
and INT FRS 12 Consolidation – Special Purpose Entities.
FRS 110 defines the principle of control and establishes control as the basis for determining which
entities are consolidated in the consolidated financial statements. It also provides more extensive
application guidance on assessing control based on voting rights or other contractual rights. Under FRS
110, control assessment will be based on whether an investor has (i) power over the investee;
(ii) exposure, or rights, to variable returns from its involvement with the investee; and (iii) the ability to
use its power over the investee to affect the amount of the returns. FRS 27 remains as a standard
applicable only to separate financial statements.
FRS 110 will take effect from financial years beginning on or after January 1, 2014, with full
retrospective application.
The Group is currently estimating the effects of FRS 110 in the period of initial adoption.
FRS 112 Disclosure of Interests in Other Entities
FRS 112 requires an entity to provide more extensive disclosures regarding the nature of and risks
associated with its interest in subsidiaries, associates, joint arrangements and unconsolidated structured
entities.
FRS 112 will take effect from financial years beginning on or after January 1, 2014, and the Group is
currently estimating extent of additional disclosures needed.
FRS 113 Fair Value Measurement
FRS 113 is a single new Standard that applies to both financial and non-financial items. It replaces the
guidance on fair value measurement and related disclosures in other Standards, with the exception of
measurement dealt with under FRS 102 Share-based Payment, FRS 17 Leases, net realisable value in
FRS 2 Inventories and value-in-use in FRS 36 Impairment of Assets.
FRS 113 provides a common fair value definition and hierarchy applicable to the fair value
measurement of assets, liabilities, and an entity’s own equity instruments within its scope, but does not
change the requirements in other Standards regarding which items should be measured or disclosed at
fair value.
FRS 113 will be effective prospectively from annual periods beginning on or after January 1, 2013.
Comparative information is not required for periods before initial application.
The Group is currently estimating the effects of FRS 113 in the period of initial adoption.
For
per
sona
l use
onl
y
48
Amendments to FRS 32 Financial Instruments: Presentation and
FRS 107 Financial Instruments: Disclosure – Offsetting Financial Assets and Financial Liabilities
The amendments to FRS 32 clarify existing application issues relating to the offsetting requirements.
Specifically, the amendments clarify the meaning of ‘currently has a legal enforceable right of set-off’
and ‘simultaneous realisation and settlement’.
The amendments to FRS 107 require entities to disclose information about rights of set-off and related
arrangements (such as collateral posting requirements) for financial instruments under an enforceable
master netting agreement or similar arrangement.
The amendments to FRS 107 are required for annual periods beginning on or after January 1, 2013 and
interim periods within those annual periods. The disclosures should be provided retrospectively for all
comparative periods. However, the amendments to FRS 32 are effective for annual periods beginning
on or after January 1, 2014, with retrospective application required.
The management anticipates that the application of amendments to FRS 107 will result in more
extensive disclosures on offsetting financial assets and financial liabilities. However, the management
is still evaluating the impact of the amendments to FRS 32 on the financial assets and liabilities that
have been set-off on the statement of financial position.
Annual Improvements to FRS 2012
The Annual Improvements include a number of amendments to various FRSs. The amendments are
effective for annual periods beginning on or after January 1, 2013. The amendments include:
Amendments to FRS 16 Property, Plant and Equipment; and
Amendments to FRS 32 Financial Instruments: Presentation
Amendments to FRS 16 clarify that spare parts, stand-by equipment and servicing equipment should be
classified as property, plant and equipment when they meet the definition of property, plant and
equipment in FRS 16 and as inventory if otherwise. The management does not anticipate that the
amendments to FRS 16 will have a significant effect on the financial statements.
Amendments to FRS 32 results in consistency between FRS 32 and FRS 12 Income Taxes. Income tax
relating to distributions to holders of an equity instrument and to transaction costs of an equity
transaction should be accounted for in accordance with FRS 12 Income Taxes.
BASIS OF CONSOLIDATION - The consolidated financial statements incorporate the financial
statements of the Company and entities controlled by the Company (its subsidiaries). Control is
achieved where the Company has the power to govern the financial and operating policies of an entity
so as to obtain benefits from its activities.
The results of subsidiaries acquired or disposed of during the year are included in the consolidated
statement of comprehensive income from the effective date of acquisition and up to the effective date of
disposal, as appropriate.
For
per
sona
l use
onl
y

49
Where necessary, adjustments are made to the financial statements of subsidiaries to bring their
accounting policies in line with those used by other members of the Group.
All intra-group transactions, balances, income and expenses are eliminated in full on consolidation.
Non-controlling interests in subsidiaries are identified separately from the Group’s equity therein. The
interest of non-controlling shareholders that are present ownership interests and entitle their holders to a
proportionate share of the entity's net assets in the event of liquidation may be initially measured (at date
of original business combination) either at fair value or at the non-controlling interests’ proportionate
share of the fair value of the acquiree’s identifiable net assets. The choice of measurement basis is made
on an acquisition-by-acquisition basis. Other types of non-controlling interests are measured at fair
value or, when applicable, on the basis specified in another FRS. Subsequent to acquisition, the carrying
amount of non-controlling interests is the amount of those interests at initial recognition plus the non-
controlling interests’ share of subsequent changes in equity.
Total comprehensive income is attributed to non-controlling interests even if this results in the non-
controlling interests having a deficit balance.
Changes in the Group’s interest in a subsidiary that do not result in a loss of control are accounted for as
equity transactions. The carrying amounts of the Group’s interests and the non-controlling interests are
adjusted to reflect the changes in their relative interests in the subsidiary. Any difference between the
amount by which the non-controlling interests are adjusted and the fair value of the consideration paid
or received is recognised directly in equity and attributed to owners of the Company.
When the Group loses control of a subsidiary, the profit or loss on disposal is calculated as the
difference between (i) the aggregate of the fair value of the consideration received and the fair value of
any retained interest and (ii) the previous carrying amount of the assets (including goodwill), and
liabilities of the subsidiary and any non-controlling interests. Amounts previously recognised in other
comprehensive income in relation to the subsidiary are accounted for (i.e. reclassified to profit or loss or
transferred directly to retained earnings) in the same manner as would be required if the relevant assets
or liabilities were disposed of. The fair value of any investment retained in the former subsidiary at the
date when control is lost is regarded as the fair value on initial recognition for subsequent accounting
under FRS 39 Financial Instruments: Recognition and Measurement or, when applicable, the cost on
initial recognition of an investment in an associate or jointly controlled entity.
In the Company’s financial statements, investments in subsidiaries are carried at cost less any
impairment in net recoverable value that has been recognised in profit or loss.
BUSINESS COMBINATIONS - Acquisitions of subsidiaries and businesses are accounted for using the
acquisition method. The consideration for each acquisition is measured at the aggregate of the
acquisition date fair values of assets given, liabilities incurred by the Group to the former owners of the
acquiree, and equity interests issued by the Group in exchange for control of the acquiree. Acquisition-
related costs are recognised in profit or loss as incurred. The acquiree’s identifiable assets, liabilities and
contingent liabilities that meet the conditions for recognition under FRS 103 are recognised at their fair
values at the acquisition date except that:
For
per
sona
l use
onl
y

50
Deferred tax assets or liabilities and liabilities or assets related to employee benefit arrangements are
recognised and measured in accordance with FRS 12 Income Taxes and FRS 19 Employee Benefits
respectively;
Liabilities or equity instruments related to share-based payment transactions of the acquiree or the
replacement of an acquiree’s share-based payment awards transactions with share-based payment
awards transactions of the acquirer in accordance with the method in FRS 102 Share-based Payment
at the acquisition date; and
Assets (or disposal groups) that are classified as held for sale in accordance with FRS 105 Non-
current Assets Held for Sale and Discontinued Operations are measured in accordance with that
Standard.
If the initial accounting for a business combination is incomplete by the end of the reporting period in
which the combination occurs, the group reports provisional amounts for the items for which the
accounting is incomplete. Those provisional amounts are adjusted during the measurement period (see
below), or additional assets or liabilities are recognised, to reflect new information obtained about facts
and circumstances that existed as of the acquisition date that, if known, would have affected the
amounts recognised as of that date.
The measurement period is the period from the date of acquisition to the date the group obtains
complete information about facts and circumstances that existed as of the acquisition date – and is
subject to a maximum of one year from acquisition date.
The accounting policy for initial measurement of non-controlling interests is described above.
The policy described above is applied to all business combinations that take place on or after
January 1, 2010.
FINANCIAL INSTRUMENTS - Financial assets and financial liabilities are recognised on the Group’s
statement of financial position when the Group becomes a party to the contractual provisions of the
instrument.
Effective interest method
The effective interest method is a method of calculating the amortised cost of a financial instrument and
of allocating interest income or expense over the relevant period. The effective interest rate is the rate
that exactly discounts estimated future cash receipts or payments (including all fees on points paid or
received that form an integral part of the effective interest rate, transaction costs and other premiums or
discounts) through the expected life of the financial instrument, or where appropriate, a shorter period.
Income and expense is recognised on an effective interest basis for debt instrument other than those
financial instruments “at fair value through profit or loss”.
For
per
sona
l use
onl
y

51
Financial assets
Loans and receivables
Trade receivables, loans and other receivables that have fixed or determinable payments that are not
quoted in an active market are classified as “loans and receivables”. Loans and receivables are initially
measured at fair value and subsequently measured at amortised cost using the effective interest method
less impairment. Interest is recognised by applying the effective interest method, except for short-term
receivables when the recognition of interest would be immaterial.
Impairment of financial assets
Financial assets are assessed for indicators of impairment at the end of each reporting period. Financial
assets are impaired where there is objective evidence that, as a result of one or more events that
occurred after the initial recognition of the financial asset, the estimated future cash flows of the
financial assets have been impacted.
For financial assets carried at amortised cost, the amount of the impairment is the difference between
the asset’s carrying amount and the present value of estimated future cash flows, discounted at the
original effective interest rate.
The carrying amount of the financial asset is reduced by the impairment loss directly for all financial
assets with the exception of trade and other receivables where the carrying amount is reduced through
the use of an allowance account. When a trade or other receivable is uncollectible, it is written off
against the allowance account. Subsequent recoveries of amounts previously written off are credited
against the allowance account. Changes in the carrying amount of the allowance account are recognised
in profit or loss.
Derecognition of financial assets
The Group derecognises a financial asset only when the contractual rights to the cash flow from the
asset expire or it transfers the financial asset and substantially all of the risks and rewards of ownership
of the asset to another entity. If the Group neither transfers nor retains substantially all the risks and
rewards of ownership and continues to control the transferred asset, the Group recognises its retained
interest in the asset and an associated liability for amounts it may have to pay. If the Group retains
substantially all the risks and rewards of ownership of a transferred financial asset, the Group continues
to recognise the financial asset and also recognises a collateralised borrowing from such proceeds
received.
Financial liabilities and equity instruments
Classification as debt or equity
Financial liabilities and equity instruments issued by the Group are classified according to the substance
of the contractual arrangements entered into and the definitions of a financial liability and an equity
instrument.
For
per
sona
l use
onl
y

52
Equity instruments An equity instrument is any contract that evidences a residual interest in the assets of the Group after
deducting all of its liabilities. Equity instruments are recorded at the proceeds received, net of direct issue costs.
Trade and other payables
Trade and other payables are initially measured at fair value, net of transaction costs, and are subsequently measured at amortised cost, using the effective interest method, with interest expense recognised on an effective yield basis, except for short-term payable when the recognition of interest would be immaterial.
Interest-bearing bank loans are initially measured at fair value, and are subsequently measured at
amortised cost, using the effective interest rate method. Any difference between the proceeds (net of transaction costs) and the settlement or redemption of borrowings is recognised over the term of the borrowings in accordance with the Group’s accounting policy.
Loans from an outside party
Loans from an outside party include compound instruments, consisting of a liability component and an
equity component. The component parts of compound instruments are classified separately as financial liabilities and equity in accordance with the substance of the contractual arrangement. At the date of issue, the fair value of the liability component is estimated using the prevailing market interest rate for a similar non-convertible instrument. This amount is recorded as a liability on an amortised cost basis
until extinguished upon conversion or at the instrument’s maturity date. The equity component is determined by deducting the amount of the liability component from the fair value of the compound instrument as a whole. This is recognised and included in equity, net of income tax effects, and is not subsequently remeasured.
Derecognition of financial liabilities The Group derecognises financial liabilities when, and only when, the Group’s obligations are
discharged, cancelled or they expire.
LEASES - Leases are classified as finance leases whenever the terms of the lease transfer substantially all the risks and rewards of ownership to the lessee. All other leases are classified as operating leases.
The Group as lessor
Rental income from operating leases is recognised on a straight-line basis over the term of the relevant lease unless another systematic basis is more representative of the time pattern in which the benefit derived from the leased asset is diminished. Initial direct costs incurred in negotiating and arranging an operating lease are added to the carrying amount of the leased asset and recognised on a straight-line basis over the lease term on the same basis as the lease income.
For
per
sona
l use
onl
y
53
The Group as lessee
Rentals payable under operating leases are charged to profit or loss on a straight-line basis over the term
of the relevant lease unless another systematic basis is more representative of the time pattern in which
economic benefits from the leased asset are consumed. Contingent rentals arising under operating
leases are recognised as an expense in the period in which they are incurred.
In the event that lease incentives are received to enter into operating leases, such incentives are
recognised as a liability. The aggregate benefit of incentives is recognised as a reduction of rental
expense on a straight-line basis, except where another systematic basis is more representative of the
time pattern in which economic benefits from the leased asset are consumed.
NON-CURRENT ASSETS HELD-FOR-SALE - Non-current assets and disposal groups are classified as
held-for-sale if their carrying amount will be recovered principally through a sale transaction rather than
through continuing use. This condition is regarded as met only when the sale is highly probable and the
asset (or disposal group) is available for immediate sale in its present condition. Management must be
committed to the sale, which should be expected to qualify for recognition as a completed sale within one
year from the date of classification.
When the Group is committed to a sale plan involving loss of control of a subsidiary, all of the assets and
liabilities of that subsidiary are classified as held-for-sale when the criteria described above are met,
regardless of whether the Group will retain a non-controlling interest in its former subsidiary after the sale.
Non-current assets (and disposal groups) classified as held-for-sale are measured at the lower of their
previous carrying amount and fair value less costs to sell.
INVENTORIES - Inventories are stated at the lower of cost and net realisable value. Cost comprises
direct materials and, where applicable, direct labour costs and those overheads that have been incurred in
bringing the inventories to their present location and condition. Cost is calculated using the weighted
average method. Net realisable value represents the estimated selling price less all estimated costs of
completion and costs to be incurred in marketing, selling and distribution.
PROPERTY, PLANT AND EQUIPMENT - Property, plant and equipment are stated at cost less
accumulated depreciation and any accumulated impairment losses.
Depreciation is charged so as to write off the cost of assets over their estimated useful lives using the
straight-line method on the following bases:
Leasehold building - (2011 : 40 years)
Plant and machinery - 5 years
Office furniture and fittings - 5 to 10 years
Office equipment - 3 to 5 years
Motor vehicle - 5 years
For
per
sona
l use
onl
y

54
Properties in the course of construction for production, supply or administrative purposes, or for
purposes not yet determined, are carried at cost, less any recognised impairment loss. Cost includes
professional fees and, for qualifying assets, borrowing costs capitalised in accordance with the Group’s
accounting policy. Depreciation of these assets, on the same basis as other property assets, commences
when the assets are ready for their intended use.
The estimated useful lives, residual values and depreciation method are reviewed at each year end, with
the effect of any changes in estimate accounted for on a prospective basis.
The gain or loss arising on disposal or retirement of an item of property, plant and equipment is
determined as the difference between the sales proceeds and the carrying amount of the asset and is
recognised in profit or loss.
INTANGIBLE ASSETS -
Intangible assets acquired separately
Intangible assets acquired separately are reported at cost less accumulated amortisation (where they
have finite useful lives) and accumulated impairment losses. Intangible assets with finite useful lives
are amortised on a straight-line basis over their estimated useful lives. The estimated useful life and
amortisation method are reviewed at the end of each annual reporting period, with the effect of any
changes in estimate being accounted for on a prospective basis. Intangible assets with indefinite useful
lives are not amortised. Each period, the useful lives of such assets are reviewed to determine whether
events and circumstances continue to support an indefinite useful life assessment for the asset. Such
assets are tested for impairment in accordance with the policy below.
Internally-generated intangible assets - research and development costs
Expenditure on research activities is recognised as an expense in the period in which it is incurred.
An internally-generated intangible asset arising from development (or from the development phase of an
internal project) is recognised if, and only if, all of the following have been demonstrated:
• the technical feasibility of completing the intangible asset so that it will be available for use or
sale;
• the intention to complete the intangible asset and use or sell it;
• the ability to use or sell the intangible asset;
• how the intangible asset will generate probable future economic benefits;
• the availability of adequate technical, financial and other resources to complete the development
and to use or sell the intangible asset; and
• the ability to measure reliably the expenditure attributable to the intangible asset during its
development.
For
per
sona
l use
onl
y

55
The amount initially recognised for internally-generated intangible assets is the sum of the expenditure
incurred from the date when the intangible asset first meets the recognition criteria listed above. Where
no internally-generated intangible asset can be recognised, development costs is charged to profit or loss
in the period in which it is incurred.
Subsequent to initial recognition, internally-generated intangible assets are reported at cost less
accumulated amortisation and accumulated impairment losses, on the same basis as intangible assets
acquired separately.
IMPAIRMENT OF TANGIBLE AND INTANGIBLE ASSETS - At the end of each reporting period, the
Group reviews the carrying amounts of its tangible and intangible assets to determine whether there is any
indication that those assets have suffered an impairment loss. If any such indication exists, the recoverable
amount of the asset is estimated in order to determine the extent of the impairment loss
(if any). When it is not possible to estimate the recoverable amount of an individual asset, the Group
estimates the recoverable amount of the cash generating unit to which it belongs.
Recoverable amount is the higher of fair value less costs to sell and value in use. In assessing value in use,
the estimated future cash flows are discounted to their present value using pre-tax discount rate that
reflects current market assessments of the time value of money and the risks specific to the asset for which
the estimates of future cash flows have not been adjusted.
If the recoverable amount of an asset is estimated to be less than its carrying amount, the carrying amount
of the asset is reduced to its recoverable amount. An impairment loss is recognised immediately in profit
or loss, unless the relevant asset is carried at a revalued amount, in which case the impairment loss is
treated as revaluation decrease.
Where an impairment loss subsequently reverses, the carrying amount of the asset is increased to the
revised estimate of its recoverable amount, but so that the increased carrying amount does not exceed the
carrying amount that would have been determined had no impairment loss been recognised for the asset in
prior years. A reversal of an impairment loss is recognised as income immediately in profit or loss, unless
the relevant asset is carried at a revalued amount, in which case the reversal of the impairment loss is
treated as a revaluation increase.
PROVISIONS - Provisions are recognised when the Group has a present obligation (legal or
constructive) as a result of a past event, it is probable that the Group will be required to settle the
obligation, and a reliable estimate can be made of the amount of the obligation.
The amount recognised as a provision is the best estimate of the consideration required to settle the
present obligation at the end of the reporting period, taking into account the risks and uncertainties
surrounding the obligation. Where a provision is measured using the cash flows estimated to settle the
present obligation, its carrying amount is the present value of those cash flows.
When some or all of the economic benefits required to settle a provision are expected to be recovered
from a third party, the receivable is recognised as an asset if it is virtually certain that reimbursement
will be received and the amount of the receivable can be measured reliably.
For
per
sona
l use
onl
y

56
REVENUE RECOGNITION - Revenue is measured at the fair value of the consideration received or
receivable. Revenue is reduced for rebates and other similar allowances.
Sale of goods
Revenue from the sale of goods is recognised when all the following conditions are satisfied:
• the Group has transferred to the buyer the significant risks and rewards of ownership of the goods;
• the Group retains neither continuing managerial involvement to the degree usually associated with
ownership nor effective control over the goods sold;
• the amount of revenue can be measured reliably;
• it is probable that the economic benefits associated with the transaction will flow to the entity; and
• the costs incurred or to be incurred in respect of the transaction can be measured reliably.
Interest income
Interest income is accrued on a time basis, by reference to the principal outstanding and at the effective
interest rate applicable.
Dividend income
Dividend income from investments is recognised when the shareholders’ rights to receive payment have
been established.
Profit sharing
Profit sharing revenue is recognised on an accrual basis in accordance with the substance of the relevant
agreement. Profit sharing agreements are based on sales and other measures, recognised by reference to
the underlying arrangement. Profit share are for the use of the Group’s intangible assets.
Rental income
The Group’s policy for recognition of revenue from operating leases is described above.
For
per
sona
l use
onl
y

57
BORROWING COSTS - Borrowing costs directly attributable to the acquisition, construction or
production of qualifying assets, which are assets that necessarily take a substantial period of time to get
ready for their intended use or sale, are added to the cost of those assets, until such time as the assets are
substantially ready for their intended use or sale. Investment income earned on the temporary investment
of specific borrowings pending their expenditure on qualifying assets is deducted from the borrowing
costs eligible for capitalisation.
All other borrowing costs are recognised in profit or loss in the period in which they are incurred
RETIREMENT BENEFIT COSTS - Payments to defined contribution retirement benefit plans are
charged as an expense when employees have rendered the services entitling them to the contributions.
Payments made to state-managed retirement benefit schemes, such as the Singapore Central Provident
Fund and state schemes where the Group’s operations are located, are dealt with as payments to defined
contribution plans where the company’s obligation under the plans are equivalent to those arising in a
defined contribution retirement benefit plan.
EMPLOYEE LEAVE ENTITLEMENT - Employee entitlements to annual leave are recognised when
they accrue to employees. A provision is made for the estimated liability for annual leave as a result of
services rendered by employees up to the end of the reporting period.
INCOME TAX - Income tax expense represents the sum of the tax currently payable and deferred tax.
The tax currently payable is based on taxable profit for the year. Taxable profit differs from profit as
reported in the statement of comprehensive income because it excludes items of income or expense that
are taxable or deductible in other years and it further excludes items that are not taxable or tax
deductible. The Group’s liability for current tax is calculated using tax rates (and tax laws) that have
been enacted or substantively enacted by the end of the reporting period.
Deferred tax is recognised on differences between the carrying amounts of assets and liabilities in the
financial statements and the corresponding tax bases used in the computation of taxable profit, and is
accounted for using the balance sheet liability method. Deferred tax liabilities are generally recognised
for all taxable temporary differences and deferred tax assets are recognised to the extent that it is
probable that taxable profits will be available against which deductible temporary differences can be
utilised. Such assets and liabilities are not recognised if the temporary difference arises from goodwill
or from the initial recognition (other than in a business combination) of other assets and liabilities in a
transaction that affects neither the taxable profit nor the accounting profit.
Deferred tax liabilities are recognised on taxable temporary differences arising on investments in
subsidiaries and associates, and interests in joint ventures, except where the Group is able to control the
reversal of the temporary difference and it is probable that the temporary difference will not reverse in
the foreseeable future. Deferred tax assets arising from deductible temporary differences associated
with such investments and interests are only recognised to the extent that it is probable that there will be
sufficient taxable profits against which to utilise the benefits of the temporary differences and they are
expected to reverse in the foreseeable future.
For
per
sona
l use
onl
y

58
The carrying amount of deferred tax assets is reviewed at the end of each reporting period and reduced
to the extent that it is no longer probable that sufficient taxable profits will be available to allow all or
part of the asset to be recovered.
Deferred tax is calculated at the tax rates that are expected to apply in the period when the liability is
settled or the asset realised based on the tax rates (and tax laws) that have been enacted or substantively
enacted by the end of the reporting period. The measurement of deferred tax liabilities and assets
reflects the tax consequences that would follow from the manner in which the Group expects, at the end
of the reporting period, to recover or settle the carrying amount of its assets and liabilities.
Deferred tax assets and liabilities are offset when there is a legally enforceable right to set off current
tax assets against current tax liabilities and when they relate to income taxes levied by the same taxation
authority and the Group intends to settle its current tax assets and liabilities on a net basis.
Current and deferred tax is recognised as an expense or income in profit or loss.
DISCONTINUED OPERATIONS A component of a Group comprises operations and cash flows that
can be clearly distinguished, operationally and for financial reporting purposes, from the rest of the
entity within the Group. In other words, a component Group will have been a cash-generating unit or a
group of cash-generating units while being held for use.
A discontinued operation is a component of an entity that either has been disposed of, or is classified as
held for sale, and (a) represents a separate major line of business or geographical area of operations, (b)
is part of a single co-ordinated plan to dispose of a separate major line of business or geographical area
of operations or (c) is a subsidiary acquired exclusively with a view to resale.
FOREIGN CURRENCY TRANSACTIONS AND TRANSLATION - The financial statements of each
group entity are measured and presented in the currency of the primary economic environment in which
the company operates (its functional currency). The consolidated financial statements of the Group and
the statement of financial position of the Company are presented in United States dollars, which is the
functional currency of the Company and presentation currency for the consolidated financial statements.
In preparing the financial statements of the individual entities, transactions in currencies other than the
entity’s functional currency are recorded at the rate of exchange prevailing on the date of the transaction.
At the end of the reporting period, monetary items denominated in foreign currencies are retranslated at
the rates prevailing at the end of the reporting period. Non-monetary items carried at fair value that are
denominated in foreign currencies are retranslated at the rates prevailing on the date when the fair value
was determined. Non-monetary items that are measured in terms of historical cost in a foreign currency
are not retranslated.
Exchange differences arising on the settlement of monetary items, and on retranslation of monetary
items are included in profit or loss for the period. Exchange differences arising on the retranslation of
non-monetary items carried at fair value are included in profit or loss for the period except for
differences arising on the retranslation of non-monetary items in respect of which gains and losses are
recognised other comprehensive income. For such non-monetary items, any exchange component of
that gain or loss is also recognised in other comprehensive income.
For
per
sona
l use
onl
y

59
Exchange differences on foreign currency borrowings relating to assets under construction for future
productive use, are included in the cost of those assets when they are regarded as an adjustment to
interest costs on those foreign currency borrowings.
For the purpose of presenting consolidated financial statements, the assets and liabilities of the Group’s
foreign operations (including comparatives) are expressed in United States dollars using exchange rates
prevailing at the end of the reporting period. Income and expense items (including comparatives) are
translated at the average exchange rates for the period, unless exchange rates fluctuated significantly
during that period, in which case the exchange rates at the dates of the transactions are used. Exchange
differences arising, if any, are recognised in other comprehensive income and accumulated in a separate
component of equity under the header of foreign currency translation reserve.
On the disposal of a foreign operation (i.e. a disposal of the Group’s entire interest in a foreign
operation, or a disposal involving loss of control over a subsidiary that includes a foreign operation, loss
of joint control over a jointly controlled entity that includes a foreign operation, or loss of significant
influence over an associate that includes a foreign operation), all of the accumulated exchange
differences in respect of that operation attributable to the Group are reclassified to profit or loss. Any
exchange differences that have previously been attributed to non-controlling interests are derecognised,
but they are not reclassified to profit or loss.
In the case of a partial disposal (i.e. no loss of control) of a subsidiary that includes a foreign operation,
the proportionate share of accumulated exchange differences are re-attributed to non-controlling
interests and are not recognised in profit or loss. For all other partial disposals (i.e. of associates or
jointly controlled entities not involving a change of accounting basis), the proportionate share of the
accumulated exchange differences is reclassified to profit or loss.
On consolidation, exchange differences arising from the translation of the net investment in foreign
entities (including monetary items that, in substance, form part of the net investment in foreign entities),
and of borrowings and other currency instruments designated as hedges of such investments, are
recognised in other comprehensive income and accumulated in a separate component of equity under
the header of translation reserve.
3 CRITICAL ACCOUNTING JUDGEMENTS AND KEY SOURCES
OF ESTIMATION UNCERTAINTY
In application of the Group’s accounting policies, which are described in Note 2, management is
required to make judgments, estimates and assumptions about the carrying amounts of assets and
liabilities that are not readily apparent from other sources. The estimates and associated assumptions
are based on historical experience and other factors that are considered to be relevant. Actual results
may differ from these estimates.
The estimates and underlying assumptions are reviewed on an ongoing basis. Revisions to accounting
estimates are recognised in the period in which the estimates is revised if the revision affects only that
period, or in the period of the revision and future periods if the revision affects both current and future
periods.
For
per
sona
l use
onl
y

60
Critical judgements in applying the Group’s accounting policies
Management did not make judgements that will have significant effect on the amounts recognised in the
financial statements apart from those involving estimations which are dealt with below and in other
notes to the financial statements.
Key sources of estimation uncertainty
The key assumptions concerning the future, and other key sources of estimation uncertainty at the end
of the reporting period, that have a significant risk of causing a material adjustment to the carrying
amounts of assets and liabilities within the next financial year, are disclosed below.
(a) Impairment of property, plant and equipment
The Group has substantial investments in property, plant and equipment for its manufacturing
facility in India.
Impairment loss is recognised when events and circumstances indicate that the Group and the
Company’s assets may be impaired and the carrying amounts of the assets exceed their
recoverable amounts.
The recoverable amounts of property, plant and equipment subject to impairment review at the
end of the reporting period were estimated based on value in use.
The assumptions in estimating the recoverable amounts are in line with management’s
understanding of the current economic conditions, and the business environment in the
pharmaceutical industry and countries in which the Group operates. The following are the details
of assessment for the recoverable amounts of the property, plant and equipment in India.
For the year ended December 31, 2012, the management conducted additional sensitivity analysis
in order to estimate the recoverable amount of the non-current assets relating to operations in India
and compared to the one done at the end of year 2011, where the base case for the assessment used
by management remain similar to the one done at the year-end 2011. The major assumptions used
in this sensitivity analysis for the year ended December 31, 2012, and influencing the future cash
flows, are as follows:
• Commercial production commences in 2014, one year after the expected
commissioning of the manufacturing facility by the main contractor in 2013
(2011 : commercial production would commence in 2013).
• Sales volumes are derived only from the 5 countries where the Group has existing
market presence for the sale of insulin (2011 : sales volumes are derived in
5 countries). The Group strategy assumptions’ regarding entering new markets either
through the regional distributors or local ones remain with no change to the
sensitivity analysis for the year ended December 31, 2012 and are the main
assumption regarding decision on conducting the investment in SciGen BioPharma
Private Ltd (“SciGen BioPharma”) and increase the capacity of Active
Pharmaceutical Ingredient production of recombinant human insulin.
For
per
sona
l use
onl
y

61
• Terminal value was not assumed at the end of the project and the cash flow projections based on cash flow over the period of 20 years (2011 : 20 years). Sales from the 11th year were conservatively maintained at the same level of volume and selling price.
• The calculation of the value in use was based on the publicly available and third party
data like demographics data of United Nations Statistics Division or diabetes prevalence data of International Diabetes Federation, IDF Diabetes Atlas as well as management assumptions. The market model is based on the development of the number of patients per each market which are derived from data on population, diabetes prevalence, patients diagnosed and treated, plus share of treated with human and analogs insulin. The market value is based on the market volume of units sold as well as its price per unit. The assumed sales per market is based on the assumed market shares in each year and every market at the level which take into account current presence of the insulin product on the market, competitive environment, targeted market share and competitive strength of the potential distributor which can be a big pharma company or local distributor.
• Cash flows were projected based on actual operating results and the financial budgets
for the period of the estimated useful life of the respective licences of
10-20 years from the date of registration.
• Cash flow forecasts were estimated based on management’s assessment of the
external information on the estimated size of markets in the various countries.
• Management believes that this forecast period was justified due to the long-term
nature of the biopharmaceutical industry. As the licenced products are biosimilar
products, management believes that these licenced products would be able to generate
revenue and future cash flows for a period of up to 20 years.
• Product prices were assumed to be constant based on management’s current estimate
of the prices, which was based on an analysis of the market price trends in the
industry.
• All assumptions are in line with management’s understanding of the current
economic conditions, and the business environment in the pharmaceutical industry
and countries in which the Group operates.
• Discount rates of 12.2% (2011 : 12.2%) per annum were applied in determining the
recoverable amounts of the licences. In addition to the risk free rate of return,
management has considered additional risk factors such as market risk, execution risk
and industry risk. The weighted average cost of capital (“WACC”) was assumed at
12.2%.
Based on the above data and assumptions, which were used to determine the estimated
recoverable amount of the property, plant and equipment in India, the management assessment
confirms the non-impairment of property, plant and equipment in India during the year ended
December 31, 2012.
For
per
sona
l use
onl
y

62
Detailed sensitivity analysis has been carried out and management is confident that the carrying
amount of the non-current assets will be recovered in full. The management closely monitored,
and adjustments will be made in future periods, if future market activity indicates that such
adjustments are appropriate. Should the volume of units sold by the Group decrease by 5%,
impairment loss will increase by US$68,000 for the Group and US$1,300,000 for the Company.
As at December 31, 2012, the carrying amount of the property, plant and equipment of a
subsidiary in India amounting to US$15,154,000 (2011 : US$12,579,000).
The carrying amounts of the Group and the Company’s property, plant and equipment are
disclosed in Note 11 to the financial statements.
(b) Impairment of intangible assets
The Group has substantial investments in intangible assets, which mainly comprise of licences
and the related development costs.
Impairment loss is recognised when events and circumstances indicate that the Group and the
Company’s intangible assets may be impaired and the carrying amounts of the intangible assets
exceed their recoverable amounts.
The recoverable amounts of the licences and development costs were estimated based on its value
in use for all products. Value in use was determined by discounting the future cash flows
generated from the continuing use of the intangible assets.
(i) During the year, management considered the recoverability of the Company’s licence
relating to right to use design plans to construct large scale production facilities with
carrying amount of US$8,280,000 (2011 : US$8,280,000) (Note 12). Detailed sensitivity
analysis has been carried out and management is confident that the carrying amount of the
asset will be recovered in full. The assumptions used to estimate the recoverable amount
are disclosed in Note 3(a) to the financial statements.
(ii) The management has estimated the recoverable amount of the licences and related
development costs for SciLinTM
with carrying amount of US$4,210,000
(2011 : US$4,550,000) (Note 12). The recoverable amount was estimated based on
its value in use which includes discounting future cash flows generated from the continuing
use of the licences and related development costs. The Company signed three
(2011 : three) profit sharing agreements with its ultimate holding company, whereby the
Company will receive a share of the revenues from the use of the SciLinTM
licence and
development costs in the countries wherein the Group has the licence and rights to
distribute the product. The Company expected profit from its ultimate holding company for
contracts with fixed annual sale for the next fifteen years with projected fee for the use of
SciLinTM
licence and development cost which confirms the non-impairment of the licences
and related development costs for SciLinTM
.
The carrying amounts of the Group and the Company’s intangible assets are disclosed in
Note 12 to the financial statements.
For
per
sona
l use
onl
y

63
(c) Impairment of subsidiaries
The Company maintains impairment losses at a level considered adequate to provide for potential
non-recoverability of investment in subsidiaries. The level of allowance is evaluated by the
Company on the basis of factors that affect the recoverability of the investments. These factors
include, but are not limited to, the activities and financial position of the entities and market
factors. The Company reviews and identifies balances that are to be impaired on a continuous
basis.
The assumptions used to estimate the recoverable amounts of the investment in a subsidiary in
India are similar to those disclosed in Note 3(a) to the financial statements. The management has
estimated the recoverable amount of the investment in a subsidiary in India with carrying amount
of US$3,202,000 (2011 : US$21,000,000) using value in use approach as disclosed in Note 3(a) to
the financial statements.
The management reviewed the recoverable amount of its investment in a subsidiary in China. The
subsidiary remained inactive. During the year, the management provided full impairment loss of
US$110,000 (2011 : US$300,000).
The impairment losses for the year ended December 31, 2012 amounting to US$7,350,000
(2011 : US$16,844,000) comprised of impairment loss for investment in subsidiary in India and
China of US$7,240,000 and US$110,000 respectively (2011 : US$3,430,000, US$10,175,000 and
US$3,239,000 impairment losses for investment in subsidiaries in India, Israel and China
respectively).
The carrying amounts of the investments in subsidiaries are disclosed in Note 16 to the financial
statements.
(d) Useful lives of property, plant and equipment
The carrying amount of the property, plant and equipment is depreciated on a straight-line basis
over the remaining useful life of each property, plant and equipment. Management reviews and
revises the estimates of the remaining useful life and residual values (if any) of the property, plant
and equipment at the end of each reporting period based on their age and condition at that
time. Changes in the way the property, plant and equipment are used and other factors (such as
market or technological factors) could impact the useful life and residual values of the property,
plant and equipment, therefore future depreciation charges could be revised. Any changes in the
useful life and residual values of the property, plant and equipment would impact the depreciation
charges and consequently affect the Group’s and the Company’s results. During the year, there
were no changes in useful lives of the Group’s property, plant and equipment.
(e) Assessment of recoverability of long-term prepayment
In assessing the recoverability of long-term prepayment to an outside party with carrying amount
of US$3,000,000 (2011 : US$3,000,000) as disclosed in Note 14 to the financial statements, the
management used the same assumptions as disclosed in Note 3(a).
For
per
sona
l use
onl
y

64
(f) Assessment of recoverability of debts The assessment of the recoverability of debts of the Group and the Company is based on the on-
going evaluation of collectability and ageing analysis of outstanding debts and on management’s estimate of the ultimate realisation of these debts, including credit worthiness and the past collection history of each debtor. Management has evaluated the recovery of these debts based on each estimate and is confident that the allowance for doubtful debts, where necessary is adequate.
As disclosed in Note 4(iii) to the financial statements, included in other receivables are
the proceeds receivable for the disposal of subsidiaries amounting to US$4,960,000 (2011 : US$Nil). Management has evaluated the recovery of these other receivables based on the terms of the contract and credit quality of the parties taking into account of the financial position and past experience with the parties as well as proposed arrangement with the holding company as the holding company will assume the credit risk and offset the balance against the existing loan payable from the company.
The carrying amounts of trade and other receivables at the end of the reporting period are
disclosed in Note 8 to the financial statements. (g) Allowance for inventories Management reviews the inventory age listing on a periodic basis to identify aged inventory. This
review involves comparison of the carrying amount of the inventory items with the respective net realisable values. The purpose is to ascertain whether an allowance is required to be made in the financial statements for any obsolete and slow-moving items. In addition, physical counts on all inventories are carried out on a periodic basis in order to determine whether an allowance is required to be made in respect of any obsolete and defective inventories identified. Management is satisfied that adequate allowance for obsolete and slow-moving inventories has been made in the financial statements.
The carrying amount of inventories is disclosed in Note 9 to the financial statements. (h) Share application costs in a subsidiary A subsidiary in India received several remittances from the Company and an investor. Foreign
Exchange Management Act (“FEMA”) issued by Reserve Bank of India (“RBI”) requires allotment of shares or debenture on the funds received from the Company and an investor.
The following are the non-compliances on the FEMA: i. Non-declaration to the RBI on the receipt of funds from the Company on issue of equity
shares amounting to US$17,600,000 (INR953.11 million); ii. Non-issue of shares against funds remitted into India by the Company within the prescribed
period of 180 days from the date of receipts of such funds totalling US$18,300,000 (INR995.52 million). These shares have now been issued in the current financial year; and
iii. Non-issue of convertible debenture against funds remitted into India by an investor, within
the prescribed period of 180 days from the respective dates of receipt of such funds totalling US$1,460,000 (INR79.08 million). These have now been issued in the current financial year.
For
per
sona
l use
onl
y

65
Following the closing of the transaction, all the above declarations and issuance of shares
mentioned in the points (i) to (iii) above towards RBI were conducted in the course of first half of
2012. In order to comply with the provision of RBI, the subsidiary in India has filed the relevant
forms with RBI for the allotment of shares during the year. In view of the late submission of the
share application forms, the subsidiary in India is liable to a penalty, payable to RBI. Based on
the prevailing practices and matters dealt with by RBI, the management estimated the penalty at
5% of the sum involved, estimate based on Independent Expert Report. An accrual of
US$904,000 (2011 : US$860,000) in respect of the penalty is recognised in the trade and other
payables of the Group at the end of the reporting period. Management is of the view that the
amount recognised in the financial statements of the Group as at the end
of the reporting period is adequate and based on best estimate to settle the obligation to RBI,
if any.
(i) Deferred tax assets valuation
The Group and the Company carrying amount of deferred tax assets amounts to US$7,140,000
(2011 : US$7,319,000) and US$7,140,000 (2011 : US$7,140,000) respectively. The deferred tax
assets are recognised for unused tax losses and some temporary tax differences to the extent that it
is probable that taxable profit will be available against which the losses can be utilised.
Management judgement is required to determine the amount of deferred tax assets that can be
recognised based upon the likely timing and level of future taxable profits together with future tax
planning strategies. The Company has expected profits from the ultimate holding company for
contracts for the use of SciLinTM
licence and development costs which in the view of the
management supports the recognition of deferred tax assets as appropriate.
4 FINANCIAL INSTRUMENTS, FINANCIAL RISKS AND CAPITAL RISKS MANAGEMENT
(a) Categories of financial instruments
The following table sets out the financial instruments as at the end of the reporting period:
Group Company
2012 2011 2012 2011
US$’000 US$’000 US$’000 US$’000
(Restated) (Restated)
Financial assets
Loans and receivables (including
cash and cash equivalents) 10,148 5,161 10,362 6,233
Financial liabilities
Amortised cost 105,737 112,099 102,158 106,673
For
per
sona
l use
onl
y

66
(b) Financial risk management policies and objectives
Risk management is integral to the whole business of the Group. The Group has a system of
controls in place to create an acceptable balance between the cost of risks occurring and the cost
of managing the risks. The management continually monitors the Group’s risk management
process to ensure that an appropriate balance between risk and control is achieved. Risk
management policies and systems are reviewed regularly to reflect changes in market conditions
and the Group’s activities.
The Audit Committee oversees how management monitors compliance with the Group’s risk
management policies and procedures and reviews the adequacy of the risk management
framework in relation to the risks faced by the Group. The Group’s activities expose it to a
variety of financial risks, including the effects of changes in foreign currency exchange rates and
interest rates. The Group does not hold or issue derivative financial instruments for speculative
purposes.
There has been no change to the Group’s exposure to these financial risks or the manner in which
it manages and measures the risk.
(i) Foreign exchange risk management
The Group transacts business in various foreign currencies and therefore is exposed to
foreign exchange risk. The Group manages its exchange risk by monitoring the movements
in exchange rate regularly. The Group does not enter into any forward contracts to hedge
its exposure to movement in exchange rate.
At the end of the reporting period, the carrying amounts of monetary assets and monetary
liabilities denominated in currencies other than the respective group entities’ functional
currency are as follows: Group Company
Assets Liabilities Assets Liabilities
2012 2011 2012 2011 2012 2011 2012 2011 US$’000 US$’000 US$’000 US $’000 US$’000 US$’000 US$’000 US$’000
United States dollars - - 1,057 3,136 - - - - Singapore dollar 260 272 261 601 260 272 261 601
Australian dollar 25 24 17 4 25 24 17 4
Euro 37 - 53 23 37 - 14 11
Philippine peso - - 24 - - - 24 -
Foreign currency sensitivity
The sensitivity rate used when reporting foreign currency risk to key management personnel
is 10%, which is the change in foreign exchange rate that management deems reasonably
possible which will affect outstanding foreign currency denominated monetary items at year
end.
For
per
sona
l use
onl
y

67
If the relevant foreign currency strengthens by 10% against the functional currency of the
each group entity, loss before tax will (increase) decrease by:
Group Company
2012 2011 2012 2011
US$’000 US$’000 US$’000 US$’000
United States dollars (106) (314) - -
Singapore dollar - (33) - (33)
Australian dollar 1 2 1 2
Euro (2) (2) 2 (1)
Philippines peso (2) - (2) -
If the relevant foreign currency weakens by 10% against the functional currency of the
company, there would be an equal and opposite impact on the profit or loss.
(ii) Interest rate risk management
Interest rate risk refers to the risk experienced by the Group as a result of the fluctuation in
interest rate.
The Group’s exposure to changes in interest rates relates primarily to its interest-bearing
financial liabilities. Interest rate risk is managed by the Group on an on-going basis with
the primary objective of limiting the extent to which net interest expense could be affected
by an adverse movement in interest rates.
Summary quantitative data of the Group’s and the Company’s interest-bearing financial
instruments can be found in section (iv) of the Note.
Interest rate risk
The Group has substantial borrowings with variable interest rates and is therefore exposed
to interest rate risk. This arises primarily from borrowings denominated in United States
dollars. The Group does not use derivative financial instruments to hedge its interest rates.
Sensitivity analysis
At the reporting date, the Group and the Company has a floating rate loan from the ultimate
holding company of US$74,527,000 (2011 : US$74,527,000). A change of
100 basis points (“bp”) in interest rates at the reporting date would (increase)/decrease loss
by the amounts shown below. This analysis assumes that all other variables remain
constant.
For
per
sona
l use
onl
y

68
Profit or loss 100 bp 100 bp increase decrease US$’000 US$’000
Group and Company
2012 Variable rate loans from ultimate holding company (745) 745
2011 Variable rate loans from ultimate holding company (745) 745
(iii) Credit risk management Credit risk refers to the risk that counterparty will default on its contractual obligations
resulting in financial loss to the Group. It is the Group’s policy to transact with creditworthy counterparties. Therefore, the Group
does not expect to incur material credit losses on its financial assets or other financial instruments.
Concentration of credit risk exist when changes in economic, industry or geographical
factors similarly affect the group of counterparties whose aggregate credit exposure is significant in relation to the Group’s total credit exposure.
The Group has a credit policy in place which establishes credit limits for customers and
monitors their balances on an ongoing basis. Credit evaluations are performed on all customers requiring credit over a certain amount. If the customers are independently rated, these ratings are used. Otherwise, the credit quality of customers is assessed after taking into account its financial position and past experience with the customers. The Group does not require collateral in respect of trade and other receivables.
The Group establishes an allowance for impairment that represents its estimate of losses in
respect of trade and other receivables. The main components of this allowance is a specific loss component that relates to individually significant exposures, and a collective loss component established for groups of similar assets in respect of losses that have been incurred but not yet identified. The collective loss allowance is determined based on historical data of payment statistics for similar financial assets.
The allowance account in respect of trade and other receivables is used to record
impairment losses unless the Group is satisfied that no recovery of the amount owing is possible. At that point, the financial asset is considered irrecoverable and the amount charged to the allowance account is written off against the carrying amount of the impaired financial asset.
Except for a customer in Thailand with trade receivables as at December 31, 2012 of
US$733,000 (2011 : US$1,044,000), trade receivables consist of a large number of customers, spread across diverse industries and geographical areas.
Other receivables consist of proceed receivable for the disposal of subsidiaries amounting to
US$4,960,000 (2011 : US$Nil) and are recoverable from two counterparties. Subsequent to year end, based on mutual agreement between the Company and its ultimate holding company, the Company has assigned its rights on the proceed from disposal of a subsidiary amounting to US$3,460,000 (Note 8) to its ultimate holding company, in return, the ultimate holding company agreed to offset US$3,460,000 from the outstanding trade payable of the Company to its ultimate holding company (Note 17).
For
per
sona
l use
onl
y

69
Management continuously monitor recoverability of debts. Management is of the view that there is no concentration of credit risk apart from the one counterparty for the disposal of SIL and a customer in Thailand. Further details of credit risks on trade and other receivables are disclosed in Note 8.
Cash and fixed deposits are held with reputable financial institutions. (iv) Liquidity risk management The Group and the Company maintains sufficient cash and cash equivalents and internally
generated cash flows to finance their activities. As at December 31, 2012, the Group and the Company has available cash and cash equivalents totalling to US$1,799,000 (2011 : US$1,997,000) and US$479,000 (2011 : US$566,000), respectively, to finance its operations.
The Group had a net profit of US$4,143,000 (2011 : loss of US$17,727,000) for the year ended December 31, 2012, out of which profit of US$4,557,000 (2011 : loss of US$13,063,000) was attributable to discontinued operations and, as of that date, the Group had net current liabilities of US$8,203,000 (2011 : US$10,794,000) and a net capital deficiency of US$53,162,000 (2011 : US$56,491,000). The Group and the Company are dependent on the ultimate holding company, for continued financial support to enable the Group and the Company to operate as going concerns and to discharge the obligations as and when they fall due. The management is satisfied that financial support will be available when required. No additional loans were provided by the ultimate holding company during the year (2011 : addition of US$1,501,000). The ultimate holding company has also undertaken to provide financial support and that it will not demand for settlement of the loans granted to the Company of US$74,527,000 (2011 : US$74,527,000), within the next twelve months, which are due for repayment on December 31, 2015. Accordingly, the financial statements of the Group have been prepared assuming that the Group and the Company will continue as going concerns.
The Group and the Company’s financial assets and financial liabilities are substantially
short-term in nature, except for loans and borrowings as disclosed in Note 18 to the financial statements.
Liquidity and interest risk analyses Non-derivative financial liabilities The following tables detail the remaining contractual maturity for non-derivative financial
liabilities. The tables have been drawn up based on the undiscounted cash flows of financial liabilities based on the earliest date on which the Group and the Company can be required to pay. The table includes both interest and principal cash flows. The adjustment column represents the possible future cash flows attributable to the instrument included in the maturity analysis which is not included in the carrying amount of the financial liability on the statement of financial position.
For
per
sona
l use
onl
y
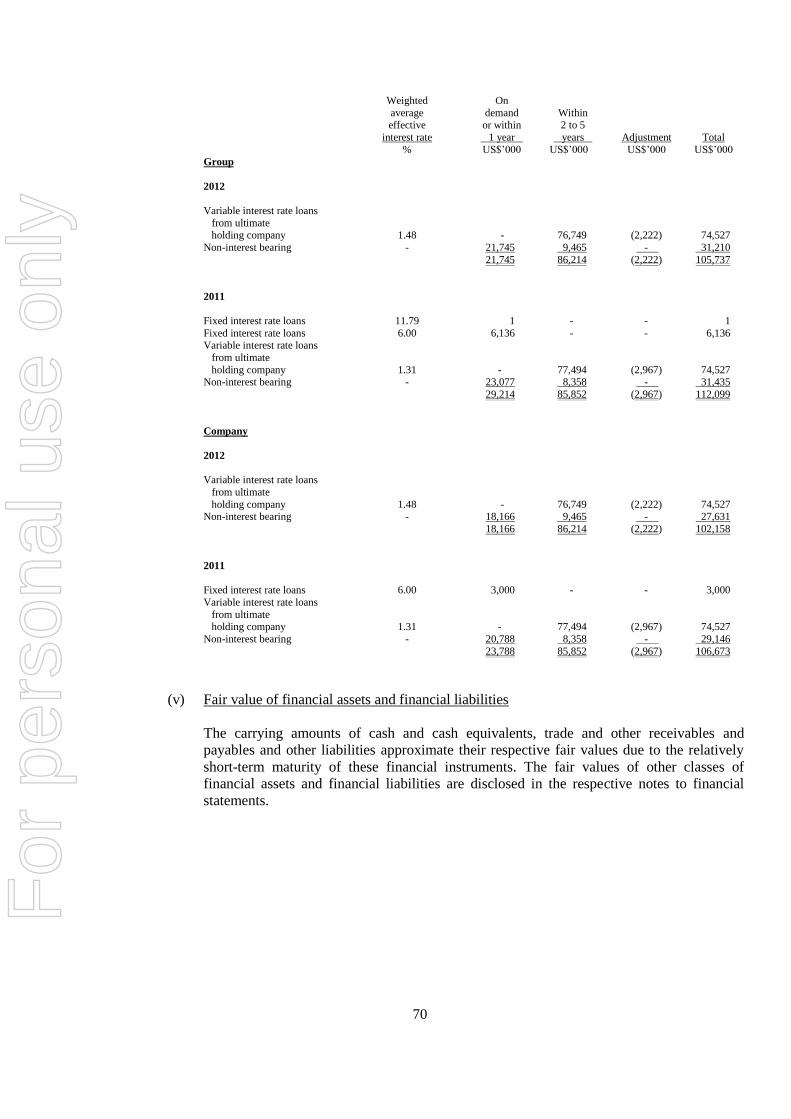
70
Weighted On
average demand Within effective or within 2 to 5
interest rate 1 year years Adjustment Total
% US$’000 US$’000 US$’000 US$’000
Group
2012
Variable interest rate loans
from ultimate holding company 1.48 - 76,749 (2,222) 74,527
Non-interest bearing - 21,745 9,465 - 31,210
21,745 86,214 (2,222) 105,737
2011
Fixed interest rate loans 11.79 1 - - 1
Fixed interest rate loans 6.00 6,136 - - 6,136 Variable interest rate loans
from ultimate
holding company 1.31 - 77,494 (2,967) 74,527 Non-interest bearing - 23,077 8,358 - 31,435
29,214 85,852 (2,967) 112,099
Company
2012
Variable interest rate loans
from ultimate
holding company 1.48 - 76,749 (2,222) 74,527 Non-interest bearing - 18,166 9,465 - 27,631
18,166 86,214 (2,222) 102,158
2011
Fixed interest rate loans 6.00 3,000 - - 3,000
Variable interest rate loans
from ultimate holding company 1.31 - 77,494 (2,967) 74,527
Non-interest bearing - 20,788 8,358 - 29,146
23,788 85,852 (2,967) 106,673
(v) Fair value of financial assets and financial liabilities
The carrying amounts of cash and cash equivalents, trade and other receivables and
payables and other liabilities approximate their respective fair values due to the relatively
short-term maturity of these financial instruments. The fair values of other classes of
financial assets and financial liabilities are disclosed in the respective notes to financial
statements.
For
per
sona
l use
onl
y
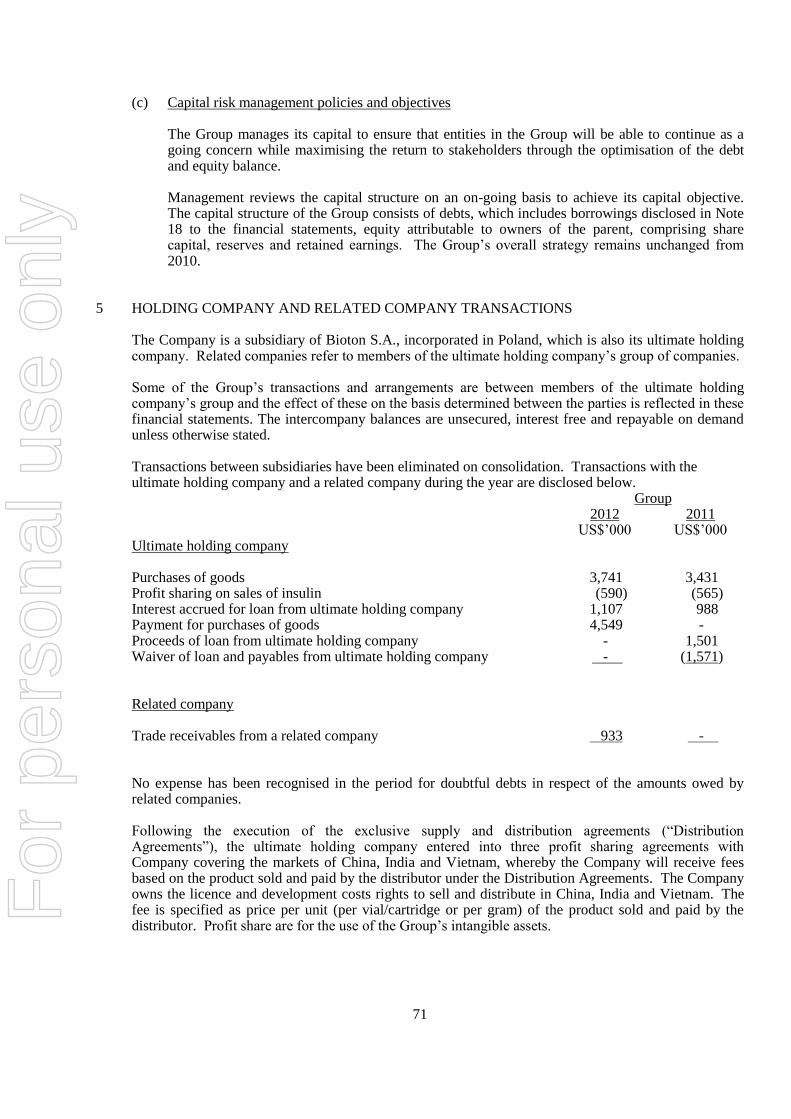
71
(c) Capital risk management policies and objectives The Group manages its capital to ensure that entities in the Group will be able to continue as a
going concern while maximising the return to stakeholders through the optimisation of the debt and equity balance.
Management reviews the capital structure on an on-going basis to achieve its capital objective.
The capital structure of the Group consists of debts, which includes borrowings disclosed in Note 18 to the financial statements, equity attributable to owners of the parent, comprising share capital, reserves and retained earnings. The Group’s overall strategy remains unchanged from 2010.
5 HOLDING COMPANY AND RELATED COMPANY TRANSACTIONS The Company is a subsidiary of Bioton S.A., incorporated in Poland, which is also its ultimate holding
company. Related companies refer to members of the ultimate holding company’s group of companies. Some of the Group’s transactions and arrangements are between members of the ultimate holding
company’s group and the effect of these on the basis determined between the parties is reflected in these financial statements. The intercompany balances are unsecured, interest free and repayable on demand unless otherwise stated.
Transactions between subsidiaries have been eliminated on consolidation. Transactions with the ultimate holding company and a related company during the year are disclosed below.
Group 2012 2011 US$’000 US$’000 Ultimate holding company Purchases of goods 3,741 3,431 Profit sharing on sales of insulin (590) (565) Interest accrued for loan from ultimate holding company 1,107 988 Payment for purchases of goods 4,549 - Proceeds of loan from ultimate holding company - 1,501 Waiver of loan and payables from ultimate holding company - (1,571) Related company Trade receivables from a related company 933 - No expense has been recognised in the period for doubtful debts in respect of the amounts owed by
related companies. Following the execution of the exclusive supply and distribution agreements (“Distribution
Agreements”), the ultimate holding company entered into three profit sharing agreements with Company covering the markets of China, India and Vietnam, whereby the Company will receive fees based on the product sold and paid by the distributor under the Distribution Agreements. The Company owns the licence and development costs rights to sell and distribute in China, India and Vietnam. The fee is specified as price per unit (per vial/cartridge or per gram) of the product sold and paid by the distributor. Profit share are for the use of the Group’s intangible assets.
For
per
sona
l use
onl
y
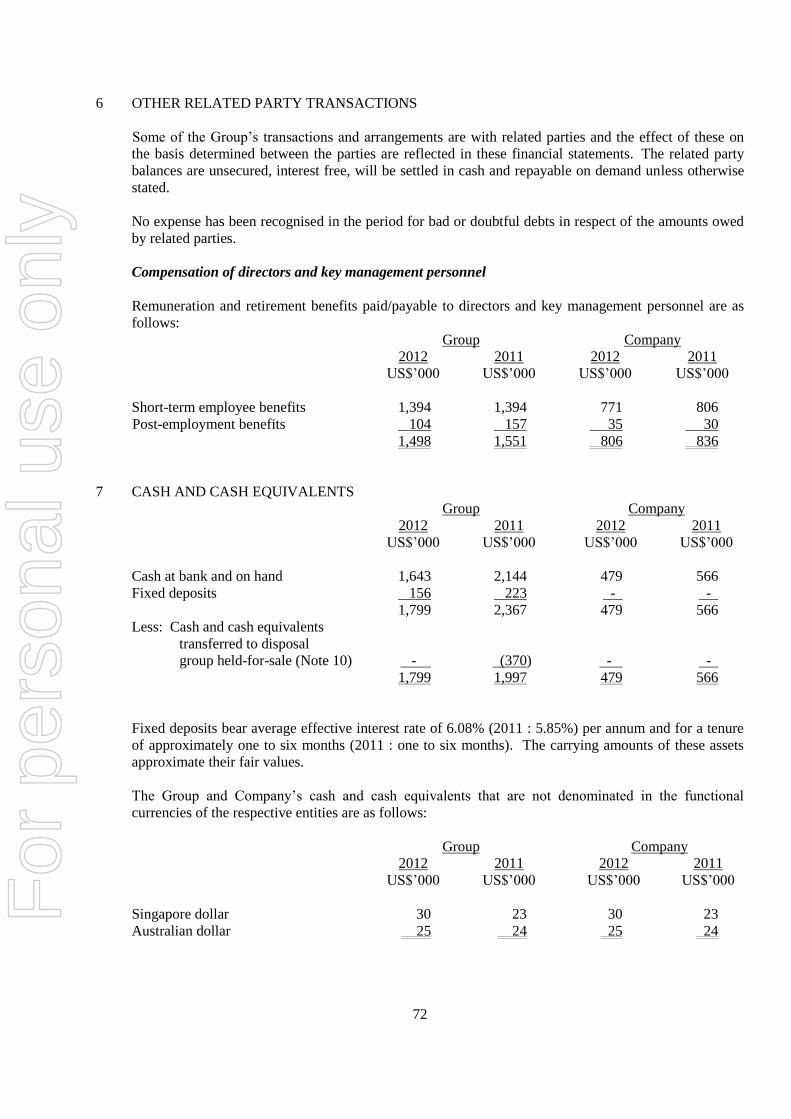
72
6 OTHER RELATED PARTY TRANSACTIONS
Some of the Group’s transactions and arrangements are with related parties and the effect of these on
the basis determined between the parties are reflected in these financial statements. The related party
balances are unsecured, interest free, will be settled in cash and repayable on demand unless otherwise
stated.
No expense has been recognised in the period for bad or doubtful debts in respect of the amounts owed
by related parties.
Compensation of directors and key management personnel
Remuneration and retirement benefits paid/payable to directors and key management personnel are as
follows:
Group Company
2012 2011 2012 2011
US$’000 US$’000 US$’000 US$’000
Short-term employee benefits 1,394 1,394 771 806
Post-employment benefits 104 157 35 30
1,498 1,551 806 836
7 CASH AND CASH EQUIVALENTS
Group Company
2012 2011 2012 2011
US$’000 US$’000 US$’000 US$’000
Cash at bank and on hand 1,643 2,144 479 566
Fixed deposits 156 223 - -
1,799 2,367 479 566
Less: Cash and cash equivalents
transferred to disposal
group held-for-sale (Note 10) - (370) - -
1,799 1,997 479 566
Fixed deposits bear average effective interest rate of 6.08% (2011 : 5.85%) per annum and for a tenure
of approximately one to six months (2011 : one to six months). The carrying amounts of these assets
approximate their fair values.
The Group and Company’s cash and cash equivalents that are not denominated in the functional
currencies of the respective entities are as follows:
Group Company
2012 2011 2012 2011
US$’000 US$’000 US$’000 US$’000
Singapore dollar 30 23 30 23
Australian dollar 25 24 25 24
For
per
sona
l use
onl
y

73
8 TRADE AND OTHER RECEIVABLES
Group Company
2012 2011 2012 2011
US$’000 US$’000 US$’000 US$’000
Trade receivables 3,093 3,267 1,661 1,781
Allowance for doubtful debts (276) (275) (271) (271)
2,817 2,992 1,390 1,510
Amounts due from subsidiaries -
trade (Note 5) - - 2,662 3,668
Amounts due from subsidiaries -
non-trade (Note 5) - - 444 105
Deposits 229 265 112 113
Other receivables 4,969 727 4,969 19
Staff advances 6 1 2 -
Amounts due from ultimate holding
company (non-trade) 328 252 304 252
8,349 4,237 9,884 5,667
Prepayments 1,325 1,439 186 169
Advances to suppliers 240 1,062 - -
9,914 6,738 10,069 5,836
Less: Trade and other receivables
transferred to non-current assets
held-for-sale (Note 10) - (1,073) - -
9,914 5,665 10,069 5,836
The trade and other receivables are unsecured, interest-free and are repayable on demand. Included in
other receivables are the proceeds receivable for the disposal of subsidiaries amounting to
US$4,960,000 (2011 : US$Nil) are not impaired as there has not been a significant change in credit
quality and the amounts are considered recoverable.
The average credit period on sales of goods is 60 days (2011 : 60 days). No interest is charged on the
trade and other receivables. Allowances for doubtful debts are recognised against trade and other
receivables based on estimated irrecoverable amounts from the sale of goods, determined by reference
to past default experience.
In determining the recoverability of a trade or other receivable the Group considers any change in the
credit quality of the trade or other receivable from the date credit was initially granted up to the end of
the reporting period. The Group’s primary exposure to credit risk arises through its trade receivables.
Concentration of credit risk relating to trade and other receivables is limited due to the Group’s many
varied customers. These customers are internationally dispersed, engaged in a wide spectrum of
pharmaceutical product distribution activities and sell in a variety of end markets. The Group’s
historical experience in the collection of accounts receivable falls within the credit period. Due to these
factors, management believes that no additional credit risk beyond the amounts provided for collection
losses is inherent in the Group and the Company’s trade receivables.
For
per
sona
l use
onl
y

74
The maximum exposure to credit risk for trade receivables due from third parties at the reporting date
(by geographical region) is:
Group Company
2012 2011 2012 2011
US$’000 US$’000 US$’000 US$’000
Thailand 733 1,044 733 1,044
Philippines 331 343 331 343
Australia 928 1,065 - -
Korea 498 417 - -
Others 327 123 327 123
2,817 2,992 1,390 1,510
The Group’s most significant customer accounts for US$733,000 (2011 : US$1,044,000) of the trade
receivables carrying amount as at December 31, 2012.
The table below is an analysis of trade receivables as at December 31:
Group Company
2012 2011 2012 2011
US$’000 US$’000 US$’000 US$’000
Not past due and not impaired 2,553 2,364 1,262 1,389
Past due but not impaired (i) 264 628 128 121
2,817 2,992 1,390 1,510
Impaired receivables - collectively
assessed (ii) 276 275 271 271
Less: Allowance for impairment (276) (275) (271) (271)
- - - -
Total trade receivables, net 2,817 2,992 1,390 1,510
(i) Aging of receivables that are past due but not impaired:
Group Company
2012 2011 2012 2011
US$’000 US$’000 US$’000 US$’000
Past due for 0 to 30 days 181 190 128 121
Past due for 31 to 120 days 83 438 - -
264 628 128 121
These amounts are stated before any deduction for impairment losses.
For
per
sona
l use
onl
y

75
(ii) Movement in the allowance for doubtful debts:
Group Company
2012 2011 2012 2011
US$’000 US$’000 US$’000 US$’000
Outside parties:
Balance at beginning of the year 275 274 271 271
Increase in allowance recognised
in profit or loss (Note 23) 1 1 - -
Balance at end of the year 276 275 271 271
Subsidiaries (trade and non-trade):
Balance at beginning of the year - - - 1,540
Decrease in allowance
recognised in profit or loss - - - (1,540)
Balance at end of the year - - - -
The table below is an analysis of other receivables as at December 31:
Group Company
2012 2011 2012 2011
US$’000 US$’000 US$’000 US$’000
Not past due and not impaired 1,509 727 1,509 19
Past due but not impaired (i) 3,460 - 3,460 -
Total other receivables 4,969 727 4,969 19
(i) Aging of receivables that are past due but not impaired:
Group Company
2012 2011 2012 2011
US$’000 US$’000 US$’000 US$’000
6 months to 12 months 3,460 - 3,460 -
The Group and the Company’s trade and other receivables that are not denominated in the functional
currencies of the respective entities are as follows:
Group Company
2012 2011 2012 2011
US$’000 US$’000 US$’000 US$’000
Singapore dollar 230 249 230 249
Euro 37 - 37 -
For
per
sona
l use
onl
y

76
9 INVENTORIES
Group Company
2012 2011 2012 2011
US$’000 US$’000 US$’000 US$’000
Finished goods 1,841 2,058 390 299
Less: Inventories transferred to non-
current assets held-for-sale
(Note 10) - (100) - -
1,841 1,958 390 299
Allowance for inventories (12) - (12) -
1,829 1,958 378 299
Movement in the allowance for inventories:
Group Company
2012 2011 2012 2011
US$’000 US$’000 US$’000 US$’000
Finished goods:
Increase in allowance recognised
in profit or loss (Note 23) and
balance at end of the year 12 - 12 -
10 ASSETS CLASSIFIED AS HELD-FOR-SALE
The assets held-for-sale in the preceding year relates to net assets of two subsidiaries, SciGen (I.L.) Ltd
(“SIL”) and Hefei-SciGen-Bioton-Biopharmaceutical Company Ltd (“HSBBC”), including the Sci-B-
VacTM
licences and related development costs of the Company (collectively known as “Assets classified
as held-for-sale”).
As disclosed below, the disposal of assets classified as held-for-sale was completed during the year.
Increase in profit or loss for the period as a result of sale of the Company’s interest in SIL and HSBBC
amounted to US$4,705,000 and US$768,000 respectively.
As at December 31, 2011, management measured the recoverable amount of the assets classified as
held-for-sale based on the fair value less costs to sell. The fair value is based on the consideration
agreed in the Sale and Purchase Agreements with the respective buyers of the assets classified as held-
for-sale less the costs to sell.
SIL
As at December 31, 2011, the Group has included net assets of disposal groups classified as held-for-
sale and the Company has included non-current assets included as held-for-sale amounting to
US$2,000,000 and US$2,000,000 respectively. On February 14, 2012, the Board closed the transaction
on sale of the Company’s interest (100%) in SIL and the assignment of all licensing rights for the
manufacture and sale of Sci-B-VacTM
to FDS Pharma LLP for a consideration of US$2 million (Note
26) and a royalty income of 5% on future global sales. The operations of SIL are included in the
discontinued operations for segment reporting purposes (Note 29).
For
per
sona
l use
onl
y

77
HSBBC
As at December 31, 2011, the Group has included the carrying amount of the net assets of HSBBC as
held-for-sale amounting to US$6,800,000 and the Company has included the carrying amount of the
investment in HSBBC amounting to US$3,460,000 as held-for-sale. This disposal group is not a
discontinued operation as this does not represent a separate major line of business and accordingly, the
results of HSBBC was not classified as part of discontinued operations in the consolidated statement of
comprehensive income. On March 13, 2012, the Board announced that the Company has closed the
transaction on the sale of the Company’s interest (51%) of the equity of HSBBC, following the
approvals from the relevant People’s Republic of China (“PRC”) authorities. The operations of HSBBC
are included in China for segment reporting purposes (Note 29).
(a) The total assets, net of impairment loss, of the disposal groups classified as held-for-sale are as
follows:
Group Company
Note 2012 2011 2012 2011
US$’000 US$’000 US$’000 US$’000
Investment in SIL 16 - - - 250
Investment in HSBBC 16 - - - 3,460
Property, plant and equipment 11 - 7,655 - -
Intangible assets - 1,750 - 1,750
Lease prepayment 13 - 364 - -
Inventories 9 - 100 - -
Trade and other receivables 8 - 1,073 - -
Cash and cash equivalents 7 - 370 - -
Total assets classified as
held-for-sale - 11,312 - 5,460
(b) The total liabilities of the disposal groups classified as held-for-sale are as follows:
Group Company
Note 2012 2011 2012 2011
US$’000 US$’000 US$’000 US$’000
Trade and other payables 17 - 2,512 - -
For
per
sona
l use
onl
y

78
(c) The impairment losses recognised in profit or loss in relation to assets held-for-sale:
Group Company
2012 2011 2012 2011
US$’000 US$’000 US$’000 US$’000
Impairment loss on
investment in SIL - - - 10,175
Impairment loss on investment
in HSBBC - - - 2,940
Impairment loss
on property, plant and equipment (1)
- 4,232 - -
Impairment loss on inventories (1)
-
950 - -
Impairment loss on property, plant and
equipment of HSBBC (2)
- 1,981 - -
Impairment loss on
Sci-B-VacTM
and development costs (1)
- 1,873 - 1,823
- 9,036 - 14,938
(1)
Included as part of “loss on discontinued operations” in profit or loss for period ended
December 31, 2011 as disclosed in Note 26 to the financial statements.
(2)
Included as part of “impairment loss on assets held-for-sale” as comparative in profit or loss.
(d) Included in trade and other receivables (Note 8) are outstanding balance for the sale of HSBBC
amounting to US$3,460,000 (2011 : US$Nil) and outstanding balance for the sale of SIL
amounting to US$1,500,000 (2011 : US$Nil).
For
per
sona
l use
onl
y

79
11 PROPERTY, PLANT AND EQUIPMENT Office
Plant furniture
Leasehold and and Office Motor Construction buildings machinery fittings equipment vehicles in progress Total
US$’000 US$’000 US$’000 US$’000 US$’000 US$’000 US$’000
Group
Cost:
At January 1, 2011 7,305 1,080 432 465 182 18,391 27,855 Additions - 1,708 32 60 8 457 2,265
Disposals - (2) - - (5) - (7)
Transfer to non-current assets held-for-sale (Note 10) (7,580) (1,883) (23) (77) (125) (805) (10,493)
Translation differences 275 (140) (16) (16) (3) (2,669) (2,569)
At December 31, 2011 - 763 425 432 57 15,374 17,051 Additions - 2 3 34 - 2,710 2,749
Disposals - - - (20) (19) - (39)
Translation differences - (5) 2 6 2 (108) (103) At December 31, 2012 - 760 430 452 40 17,976 19,658
Accumulated depreciation: At January 1, 2011 229 758 145 309 93 - 1,534
Depreciation charge
for the year 355 183 47 75 31 - 691 Disposals - (1) - - (2) - (3)
Transfer to non-current
assets held-for-sale (Note 10) (600) (128) (9) (24) (96) - (857) Translation differences 16 (128) (8) (15) (4) - (139)
At December 31, 2011 - 684 175 345 22 - 1,226
Depreciation charge for the year - 34 43 51 7 - 135
Disposals - - - (20) (8) - (28)
Translation differences - (6) 1 5 - - 1 At December 31, 2012 - 712 219 381 21 - 1,334
Accumulated impairment losses: At January 1, 2011 - - - - - 3,529 3,529
Impairment losses (Note 10) 1,592 389 - - - - 1,981 Transfer to non-current
assets held-for-sale (Note 10) (1,592) (389) - - - - (1,981)
Translation differences - - - - - (584) (584) At December 31, 2011 - - - - - 2,945 2,945
Translation differences - - - - - (20) (20)
At December 31, 2012 - - - - - 2,925 2,925
Carrying amount:
At December 31, 2011 - 79 250 87 35 12,429 12,880
At December 31, 2012 - 48 211 71 19 15,051 15,400
For
per
sona
l use
onl
y

80
Office
Plant furniture
and and Office
machinery fittings equipment Total
US$’000 US$’000 US$’000 US$’000
Company
Cost:
At January 1, 2011 and
December 31, 2011 18 107 100 225
Additions - - 20 20
Disposals - - (20) (20)
At December 31, 2012 18 107 100 225
Accumulated depreciation:
At January 1, 2011 18 51 72 141
Depreciation for the year - 11 12 23
At December 31, 2011 18 62 84 164
Depreciation for the year - 11 12 23
Disposals - - (20) (20)
At December 31, 2012 18 73 76 167
Carrying amount:
At December 31, 2011 - 45 16 61
At December 31, 2012 - 34 24 58
For
per
sona
l use
onl
y

81
12 INTANGIBLE ASSETS
Computer Development
Licences software costs Total
US$’000 US$’000 US$’000 US$’000
Group
Cost:
At January 1, 2011 13,666 74 1,511 15,251
Additions - - 73 73
Write-offs - - (43) (43)
Transfer to non-current assets
held-for-sale (Note 10) - (6) - (6)
Translation differences - - (34) (34)
At December 31, 2011 13,666 68 1,507 15,241
Additions - 7 14 21
Write-offs - - (17) (17)
Translation differences - - 6 6
At December 31, 2012 13,666 75 1,510 15,251
Amortisation:
At January 1, 2011 496 68 421 985
Amortisation charge for the year 340 5 160 505
Transfer to non-current assets
held-for-sale (Note 10) - (5) - (5)
Translation differences - - (41) (41)
At December 31, 2011 836 68 540 1,444
Amortisation charge for the year 340 - 158 498
Translation differences - - (1) (1)
At December 31, 2012 1,176 68 697 1,941
Impairment losses:
At January 1, 2011 - - - -
Impairment losses - - 192 192
At December 31, 2011 - - 192 192
Impairment losses - - 2 2
At December 31, 2012 - - 194 194
Carrying amount:
At December 31, 2011 12,830 - 775 13,605
At December 31, 2012 12,490 7 619 13,116
For
per
sona
l use
onl
y

82
Computer Development
Licences software costs Total
US$’000 US$’000 US$’000 US$’000
Company
Cost:
At January 1, 2011 13,666 68 875 14,609
Additions - - 13 13
Write-off - - (34) (34)
At December 31, 2011 13,666 68 854 14,588
Additions - 7 14 21
At December 31, 2012 13,666 75 868 14,609
Amortisation:
At January 1, 2011 496 66 163 725
Amortisation charge for the year 340 2 117 459
At December 31, 2011 836 68 280 1,184
Amortisation charge for the year 340 - 121 461
At December 31, 2012 1,176 68 401 1,645
Carrying amount:
At December 31, 2011 12,830 - 574 13,404
At December 31, 2012 12,490 7 467 12,964
Included in the above development costs of the Group and the Company are clinical trial and regulatory
compliance costs.
In December 31, 2012, development costs of the Group amounting to US$17,000 relating to Strataderm
and Stratamed were written-off as the management does not expect to launch the products in Korea
(2011 : US$43,000 were written-off as the management does not expect to launch insulin and breast
implants in Malaysia and Australia respectively). In December 31, 2012, no development costs of the
Company was written off (2011 : US$34,000 relating to insulin development costs in Malaysia).
The intangible assets included above have finite useful lives, over which the assets are amortised. The
amortisation period for development costs incurred is on average 5 to 15 years. Computer software is
amortised over their estimated useful lives of 3 years, and licences is amortised over an average of 10 to
20 years. The remaining useful life of the intangible assets on average is 13 years.
The amortisation expense has been included in the line item “Amortisation of intangible assets” in the
profit or loss.
For
per
sona
l use
onl
y

83
Type of licences in respect of biologics
Cost Cost
2012 2011
US$’000 US$’000 Duration of licences
Rights to market and distribute (i):
- SciLinTM
5,386 5,386 10 to 20 years from the date of first
approval for sales in specified group
countries or from the date of
repayment.
Right to use design plans to construct
large scale production facilities (ii):
- SciLinTM
8,280 8,280 10 to 20 years from the completion
of construction of the facilities.
13,666 13,666
(i) Some of the licences to market and distribute require the Company to obtain the relevant
regulatory approvals in countries specified in the agreements within a specified period of time,
failing which the licence agreements can be terminated. The countries are largely within the Asia
Pacific region.
(ii) The licence with the right to use technology requires the Company to erect and operate a facility
or use a Contract Manufacturer Organisation with a minimal production capacity.
13 LEASE PREPAYMENT
Group Company
2012 2011 2012 2011
US$’000 US$’000 US$’000 US$’000
Cost:
At January 1 391 1,011 - -
Transfer to non-current assets
held-for–sale (Note 10) - (565) - -
Translation difference (3) (55) - -
At December 31 388 391 - -
Amortisation:
At January 1 7 185 - -
Amortisation charge for the year 4 17 - -
Transfer to non-current assets
held-for-sale (Note 10) - (201) - -
Translation difference - 6 - -
At December 31 11 7 - -
Carrying amount 377 384 - -
For
per
sona
l use
onl
y

84
14 LONG TERM PREPAYMENT
Group Company
2012 2011 2012 2011
US$’000 US$’000 US$’000 US$’000
Prepayment to contractor 3,000 3,000 3,000 3,000
The Company paid a third party contractor to acquire the rights to enhanced design plans relating to
construction of large scale production facilities for a sum of US$3,000,000. The sum was paid in
advance for the work.
15 DEFERRED TAX ASSETS
The following are the deferred tax recognised by the Group and the Company and the movement
thereon:
Others
temporary
Tax losses differences Total
US$’000 US$’000 US$’000
Group
At January 1, 2011 7,276 264 7,540
Credit/(Charge) to profit or loss
for the year (Note 25) 13 (234) (221)
At December 31, 2011 7,289 30 7,319
Adjustments (Note 25) 159 - 159
Charge to profit or loss
for the year (Note 25) (314) (30) (344)
Translation differences 6 - -
At December 31, 2012 7,140 - 7,140
Company
At January 1, 2011 7,102 264 7,366
Credit/(Charge) to profit or loss for the year 8 (234) (226)
At December 31, 2011 7,110 30 7,140
Adjustments 159 - 159
Charge to profit or loss for the year (129) (30) (159)
At December 31, 2012 7,140 - 7,140
Subject to the agreement by the tax authorities, at the end of the reporting period, the Group and
the Company has unutilised tax losses of approximately US$45,165,000 and US$42,000,000
(2011 : US$53,336,000 and US$41,337,000) respectively, available for offsetting against future taxable
income, subject to agreement by the relevant tax authorities and compliance with the tax regulations
(such as retention of majority shareholders as defined) in which the Group and the Company operates.
Tax losses of the Company do not expire under the current tax regulations.
For
per
sona
l use
onl
y

85
Deferred tax benefits on these unutilised tax losses for the Group and the Company, amounting to
approximately US$7,140,000 and US$7,140,000 (2011 : unutilised tax losses US$7,289,000 and
US$7,110,000) respectively, have been recognised by the Group and the Company as the management
is of the view that it is probable that future taxable profit will be available against which certain
subsidiaries of the Group and the Company can utilise the benefits.
16 SUBSIDIARIES
Company
2012 2011
US$’000 US$’000
Unquoted equity shares, at cost 15,698 9,605
Less: Allowance for impairment loss (12,496) (4,655)
3,202 4,950
Loans to subsidiaries - 52,772
Less: Allowance for impairment loss - (32,995)
- 19,777
Transfer to assets held-for-sale (Note 10) - (3,710)
3,202 21,017
Movement in the unquoted equity shares:
Company
2012 2011
US$’000 US$’000
Balance at beginning of the year 9,605 8,091
Increase in unquoted equity shares (1)
110 90
Transfer from loan to subsidiaries (2)
22,820 1,424
Disposal of 49.99% interest in subsidiary (2)
(10,437) -
Disposal of subsidiary (4)
(6,400) -
Balance at end of the year 15,698 9,605
Movement in the loans to subsidiaries:
Company
2012 2011
US$’000 US$’000
Balance at beginning of the year 52,772 51,565
Increase in loans to subsidiaries - 2,631
Transfer to unquoted equity shares (2)
(22,820) (1,424)
Transfer to other receivables from subsidiary (3)
(137) -
Disposal of subsidiary (5)
(29,815) -
Balance at end of the year - 52,772
For
per
sona
l use
onl
y

86
(1) Relate to unquoted equity shares in SciGen (Beijing) Biotechnology Co. Ltd.
(2) Relate to SciGen BioPharma where loan to subsidiary was converted to unquoted equity shares and
thereafter, disposal of 49.99% of Company interest was effected during the year. Loss on disposal
of 49.99% Company interest amounted to US$7,437,000, recognised in Company profit and loss for
the year.
(3) Receivable from SciGen BioPharma.
(4) Disposal of HSBBC in March 2012.
(5) Disposal of SIL in February 2012.
Movement in the impairment loss on unquoted equity shares:
Company
2012 2011
US$’000 US$’000
Balance at beginning of the year 4,655 1,416
Increase in impairment loss recognised in profit or loss (6)
7,350 3,239
Transfer from loan to subsidiaries (7)
3,430 -
Disposal of subsidiary (8)
(2,939) -
Balance at end of the year 12,496 4,655
Movement in the impairment loss on loans to subsidiaries:
Company
2012 2011
US$’000 US$’000
Balance at beginning of the year 32,995 19,390
Increase in impairment loss recognised in profit or loss - 13,605
Transfer to unquoted equity shares (7)
(3,430) -
Disposal of subsidiary (9)
(29,565) -
Balance at end of the year - 32,995
(6) Relate to impairment loss on unquoted equity shares in SciGen Biopharma and SciGen (Beijing)
Biotechnology Co. Ltd. The recoverable amount of investments are determined based on
management estimates disclosed in Note 3(c).
(7) Relate to loan to subsidiary which was converted to unquoted equity shares during the year.
(8) Disposal of HSBBC in March 2012.
(9) Disposal of SIL in February 2012.
For
per
sona
l use
onl
y

87
Loans to subsidiaries which form part of the Company’s net investments in subsidiaries, are interest-
free, unsecured and settlement is neither planned nor likely to occur in the foreseeable future. As the
amounts are a part of Company’s net investment in subsidiaries, they are stated at cost, less impairment
loss. Proportion of
Country of ownership
of incorporation interest and
Name of subsidiary and operations voting power held Principal activities
2012 2011
% %
SciGen (Australia) Pty Ltd (1) Australia 100 100 Sales and distribution
SciGen Korea Ltd (1) Republic of Korea 100 100 Sales and distribution
SciGen (I.L.) Ltd (4) State of Israel - 100 Manufacturing, sales
and distribution
Hefei-SciGen-Bioton People’s Republic of China - 51 Manufacturing, sales
Biopharmaceutical and distribution
Company Ltd (3)
SciGen BioPharma Private Ltd (2) Republic of India 50.01 100 Manufacturing, sales
and distribution
SciGen (Beijing) Biotechnology Co. People’s Republic of China 100 100 Regulatory activities
Ltd (1)
(1)
Not required to be audited in accordance with the laws of country of incorporation, but audited for
Group consolidation purposes only by Deloitte & Touche LLP.
(2)
Audited by overseas practices of Deloitte & Touche Tohmatsu Limited for Group consolidation
purposes only. The Company retains 50.01% shareholdings in subsidiary. It controls more than
half of the voting power of those shares, it has power to appoint and remove the majority board of
directors and control of the subsidiary is by board. As a result, SciGen BioPharma Private Ltd is
controlled by the Company and is consolidated in these financial statements.
(3)
Classified as held-for-sale as at December 31, 2011. As disclosed in Notes 10 and 28 to the
financial statements, during the current financial year the company has lost control over the
subsidiary.
(4)
Classified as held-for-sale as at December 31, 2011. As disclosed in Notes 10 and 26 to the
financial statements, during the current financial year the company has lost control over the
subsidiary.
For
per
sona
l use
onl
y

88
17 TRADE AND OTHER PAYABLES
Group Company
2012 2011 2012 2011
US$’000 US$’000 US$’000 US$’000
(Restated) (Restated)
Accrued interest payable to ultimate
holding company (Note 5) 9,465 8,358 9,465 8,358
Trade payables to outside parties 680 887 283 362
Amounts due to ultimate holding
company - trade (Note 5) 14,415 15,699 14,415 15,699
Amounts due to a subsidiary - non-trade
(Note 5) - - 173 170
Amounts due to ultimate holding company
- non-trade (Note 5) 2,991 2,991 2,991 2,991
Amounts due to a related company (Note 5) 933 - - -
Other payables 325 2,298 33 429
Accrued employee benefits 151 194 109 102
Accrued operating expenses 2,250 3,170 162 685
Deposit from purchaser of assets
held-for-sale - 350 - 350
31,210 33,947 27,631 29,146
Less: Amount due for settlement after
12 months (9,465) (8,358) (9,465) (8,358)
Less: Trade and other payables
transferred to disposal group
held-for-sale (Note 10) - (2,512) - -
Amount due for settlement within
12 months 21,745 23,077 18,166 20,788
The average credit period on purchase of goods is 60 days (2011 : 60 days). No interest is charged on
trade and other payables.
The non-current accrued interest payable to ultimate holding company comprises the loan interest
payable to the ultimate holding company which is due for repayment on December 31, 2015. The non-
current accrued interest payable is stated at amortised cost. The effective interest rate is 1.48% (2011 :
1.31%) per annum.
The Group and Company’s trade and other payables that are not denominated in the functional
currencies of the respective entities are as follows:
Group Company
2012 2011 2012 2011
US$’000 US$’000 US$’000 US$’000
United States dollars 1,057 - - -
Singapore dollar 261 811 261 811
Australian dollar 17 4 17 4
Euro 53 23 14 11
Philippine peso 24 - 24 -
For
per
sona
l use
onl
y

89
18 LOANS AND BORROWINGS
Group Company
2012 2011 2012 2011
US$’000 US$’000 US$’000 US$’000
Loans from ultimate holding
company (Note 5) 74,527 74,527 74,527 74,527
Secured bank loans - 1 - -
Loans from an outside party - 6,136 - 3,000
Total 74,527 80,664 74,527 77,527
Less: Amount due for settlement after
12 months (74,527) (74,527) (74,527) (74,527) Amount due for settlement within
12 months - 6,137 - 3,000
The loans from ultimate holding company were made on normal commercial terms and conditions and
bear interest of LIBOR 3 months + 1% (2011 : LIBOR 3 months + 1%) per annum. The loans and
interests are due for repayment on December 31, 2015.
Loans from an outside party
On March 15, 2010, the Company announced that an outside party (“outside party”) had entered into an
investment agreement (“Investment Agreement”) with the Company and SciGen BioPharma
(a wholly owned subsidiary in India) to acquire 49.99% interest in SciGen BioPharma upon the
satisfaction of payment of a total consideration of US$8,000,000 by the outside party. The
consideration was denominated in United States dollar with the functional currency of the SciGen
BioPharma being in India Rupee (INR).
As of December 31, 2011, receipts from the outside party amounted to US$6,136,000 comprising of
US$3,136,000 convertible debenture and US$3,000,000 loan payable. The convertible debenture shall
be convertible into shares of the SciGen BioPharma subject to the completion of conditions as stated in
the Investment Agreement by March 31, 2012. The convertible debenture and loan shall mature on
March 31, 2012 at principal amount plus interest of 6% per annum. Conversion option can be exercised
by the outside party on March 31, 2012 or upon the complete settlement of total consideration of
US$8,000,000, whichever is earlier.
During the second quarter of 2012, with the full satisfaction of the consideration and conditions as set
out under the Investment Agreement, the outside party exercised the option to convert the debenture
into equity of SciGen BioPharma. Accordingly, the convertible debenture and loan were extinguished
by way of issuance of new shares by SciGen BioPharma and transfer of part of existing shares held by
the Company which, in aggregate represents 49.99% of interest in equity of SciGen BioPharma. The
Company retains 50.01% shareholdings in SciGen BioPharma and retains control of the subsidiary
based on the terms stated in the shareholders’ agreement.
For
per
sona
l use
onl
y

90
The weighted average effective interest rates per annum relating to borrowings at the reporting dates for
the Group and the Company are as follows:
Group Company
2012 2011 2012 2011
% % % %
Secured bank loans - 11.79 - -
Loans from ultimate holding company 1.48 1.31 1.48 1.31
Loans from an outside party - 6.00 - 6.00
Management estimates the fair value of the Group and the Company’s borrowings, by discounting their
future cash flows at the market rate to be as follows:
Group Company
2012 2011 2012 2011
US$’000 US$’000 US$’000 US$’000
Secured bank loans - 1 - -
Loans from ultimate holding company 76,749 77,494 76,749 77,494
Loans from an outside party - 6,136 - 3,000
The Group loans and borrowings that are not denominated in the functional currencies of the respective
entities are as follows:
Group Company
2012 2011 2012 2011
US$’000 US$’000 US$’000 US$’000
United States dollar - 3,136 - -
19 SHARE CAPITAL
Group and Company
2012 2011 2012 2011
Number of ordinary shares US$’000 US$’000
(’000) (’000)
Issued and fully paid up:
At beginning and end of year 552,270 552,270 42,530 42,530
The Company has one class of ordinary shares which carry one vote per share, has no par value and
carries a right to dividend as and when declared by the company.
For
per
sona
l use
onl
y

91
20 RESERVES
(a) Translation Reserves
Group Company
2012 2011 2012 2011
US$’000 US$’000 US$’000 US$’000
Foreign currency
translation reserve (4,237) 961 - -
The foreign currency translation reserve comprises foreign exchange differences arising from the
translation of the financial statements of foreign operations whose functional currencies are
different from the functional currency of the Company, and the exchange differences on foreign
currency loans to subsidiaries, which form part of the Group’s net investment in foreign
operations.
(b) Capital Reserve
The capital reserve represents effects of changes in ownership interest in SciGen BioPharma
when there is no loss of control (refer to Note 18). The difference between the amount by which
the change in non-controlling interest and the fair value of the consideration received is
recognised directly in equity and attributed to owners of the company.
Group
2012 2011
US$’000 US$’000
Proceeds on changes in ownership interest in subsidiary 8,000 -
Non-controlling interest (7,449) -
Difference recognised in capital reserve 551 -
21 REVENUE
Group
2012 2011
US$’000 US$’000
Sales of goods 17,560 15,198
Profit sharing on sales of insulin 590 565
18,150 15,763
For
per
sona
l use
onl
y

92
22 OTHER OPERATING EXPENSES
Group
2012 2011
US$’000 US$’000
Advertising and promotional expenses 1,290 1,663
Professional and consultancy fees 476 878
Travel and entertainment expenses 295 381
Insurance premium 287 293
Rental expenses 349 357
Regulatory and clinical research expenses 206 139
Administrative and communication expenses 973 612
Statutory compliance fee 126 175
Storage and distribution expenses 811 604
Property tax and license fees - 69
Others 100 697
4,913 5,868
23 (PROFIT) LOSS FOR THE YEAR
The following items have been included in arriving at (profit) loss from operating activities after income
tax:
Group
2012 2011
US$’000 US$’000
Allowance for doubtful debts 1 1
Allowance for inventories 12 -
Loss on disposal of property, plant and equipment 3 1
Gain on disposal of subsidiary
relating to discontinued operations (Note 26) (4,705) -
Gain on disposal of subsidiary (Note 28) (768) -
Operating lease expenses 329 357
Auditors’ remuneration 126 175
Cost of inventories recognised as expense 8,043 6,752
Employee benefits expense (including directors’ remuneration)
Contributions to defined contribution plans, included in staff costs 113 82
Salaries and other benefits 4,352 4,403
4,465 4,485
For
per
sona
l use
onl
y

93
24 FINANCE INCOME AND EXPENSE
Group
2012 2011
US$’000 US$’000
Interest income received/receivable from:
- banks 49 37
Interest expense paid/payable to:
- banks (85) (106)
- third party (4) (85)
- ultimate holding company (Note 5) (1,107) (988)
(1,196) (1,189)
Unrealised exchange loss (29) (80)
Finance expenses (1,225) (1,269)
25 INCOME TAX EXPENSE
Group
2012 2011
US$’000 US$’000
Current year 15 51
Deferred tax
- Adjustment to prior year (Note 15) (159) -
- Deferred tax expense – current year (Note 15) 344 221
Total income tax expense 200 272
Domestic income tax calculated at 17% (2011 : 17%) of the assessable profit for the year. Taxation for
other jurisdiction is calculated at the rate prevailing in the respective jurisdictions.
Group
2012 2011
US$’000 US$’000
Profit/(Loss) before income tax 4,343 (17,455)
Income tax expense/(benefit) calculated at 17% (2011 : 17%) 738 (2,967)
Effect of revenue that is exempt from taxation (949) (428)
Effect of expenses that are not deductible in determining
taxable profit 312 3,928
Effect of unused tax losses not recognised
as deferred tax assets 562 1,235
Effect of utilisation of previously unrecognised tax losses (96) -
Effect of different tax rates of subsidiaries operating
in other jurisdictions (49) (1,190)
Effect of previously unrecognised and unused tax losses now
recognised as deferred tax assets (159) -
Others (159) (306)
Income tax expense recognised in profit or loss 200 272
For
per
sona
l use
onl
y
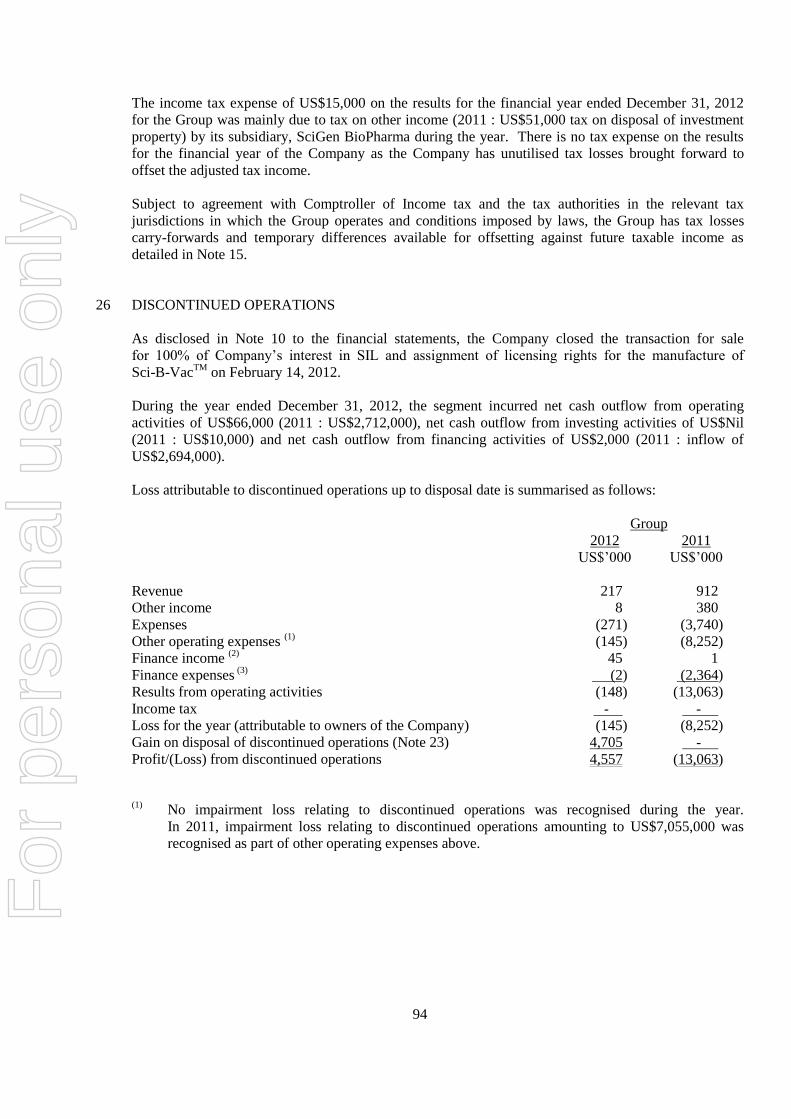
94
The income tax expense of US$15,000 on the results for the financial year ended December 31, 2012
for the Group was mainly due to tax on other income (2011 : US$51,000 tax on disposal of investment
property) by its subsidiary, SciGen BioPharma during the year. There is no tax expense on the results
for the financial year of the Company as the Company has unutilised tax losses brought forward to
offset the adjusted tax income.
Subject to agreement with Comptroller of Income tax and the tax authorities in the relevant tax
jurisdictions in which the Group operates and conditions imposed by laws, the Group has tax losses
carry-forwards and temporary differences available for offsetting against future taxable income as
detailed in Note 15.
26 DISCONTINUED OPERATIONS
As disclosed in Note 10 to the financial statements, the Company closed the transaction for sale
for 100% of Company’s interest in SIL and assignment of licensing rights for the manufacture of
Sci-B-VacTM
on February 14, 2012.
During the year ended December 31, 2012, the segment incurred net cash outflow from operating
activities of US$66,000 (2011 : US$2,712,000), net cash outflow from investing activities of US$Nil
(2011 : US$10,000) and net cash outflow from financing activities of US$2,000 (2011 : inflow of
US$2,694,000).
Loss attributable to discontinued operations up to disposal date is summarised as follows:
Group
2012 2011
US$’000 US$’000
Revenue 217 912
Other income 8 380
Expenses (271) (3,740)
Other operating expenses (1)
(145) (8,252)
Finance income (2)
45 1
Finance expenses (3)
(2) (2,364)
Results from operating activities (148) (13,063)
Income tax - -
Loss for the year (attributable to owners of the Company) (145) (8,252)
Gain on disposal of discontinued operations (Note 23) 4,705 -
Profit/(Loss) from discontinued operations 4,557 (13,063)
(1)
No impairment loss relating to discontinued operations was recognised during the year.
In 2011, impairment loss relating to discontinued operations amounting to US$7,055,000 was
recognised as part of other operating expenses above.
For
per
sona
l use
onl
y

95
Group
2012 2011
US$’000 US$’000
(2)
Finance income
Interest income receivable from :
- banks - 1
Unrealised exchange income 45 -
Finance expenses 45 1
Group
2012 2011
US$’000 US$’000 (3)
Finance expenses
Interest expense paid/payable to:
- banks (2) (6)
Unrealised exchange loss - (2,358)
Finance expenses (2) (2,364)
At the date of the disposal of SIL, the book values of Group’s net assets over which control was lost are
as follows:
US$’000
Non-current asset
Property, plant and equipment 11
Current asset
Inventories 31
Trade receivables 597
Cash and cash equivalents 273
Total current assets 901
Current liabilities
Trade payables 810
Net assets derecognised 102
Total consideration:
US$'000
Satisfied by cash in current reporting period,
and net cash inflow arising on disposal 150
Satisfied by reduction of trade debts to ultimate holding company 350
To be satisfied by cash 1,500
Total consideration 2,000
For
per
sona
l use
onl
y
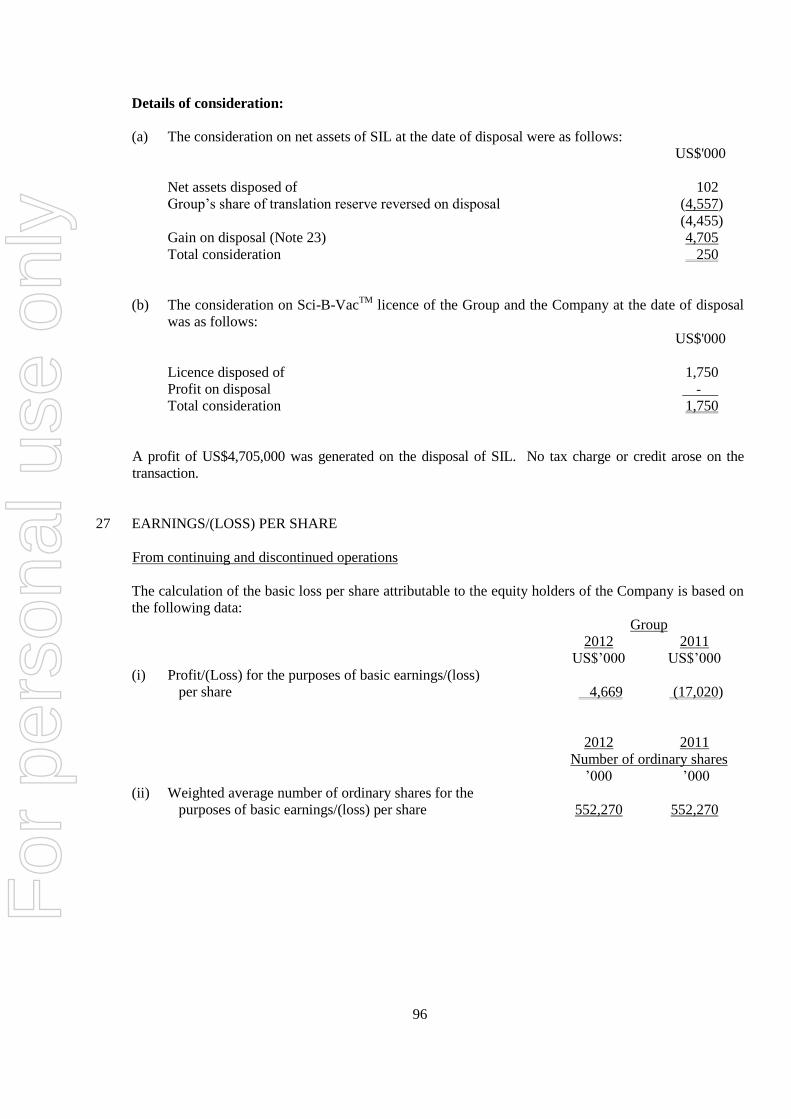
96
Details of consideration:
(a) The consideration on net assets of SIL at the date of disposal were as follows:
US$'000
Net assets disposed of 102
Group’s share of translation reserve reversed on disposal (4,557)
(4,455)
Gain on disposal (Note 23) 4,705
Total consideration 250
(b) The consideration on Sci-B-VacTM
licence of the Group and the Company at the date of disposal
was as follows:
US$'000
Licence disposed of 1,750
Profit on disposal -
Total consideration 1,750
A profit of US$4,705,000 was generated on the disposal of SIL. No tax charge or credit arose on the
transaction.
27 EARNINGS/(LOSS) PER SHARE
From continuing and discontinued operations
The calculation of the basic loss per share attributable to the equity holders of the Company is based on
the following data:
Group
2012 2011
US$’000 US$’000
(i) Profit/(Loss) for the purposes of basic earnings/(loss)
per share 4,669 (17,020)
2012 2011
Number of ordinary shares
’000 ’000
(ii) Weighted average number of ordinary shares for the
purposes of basic earnings/(loss) per share 552,270 552,270
For
per
sona
l use
onl
y
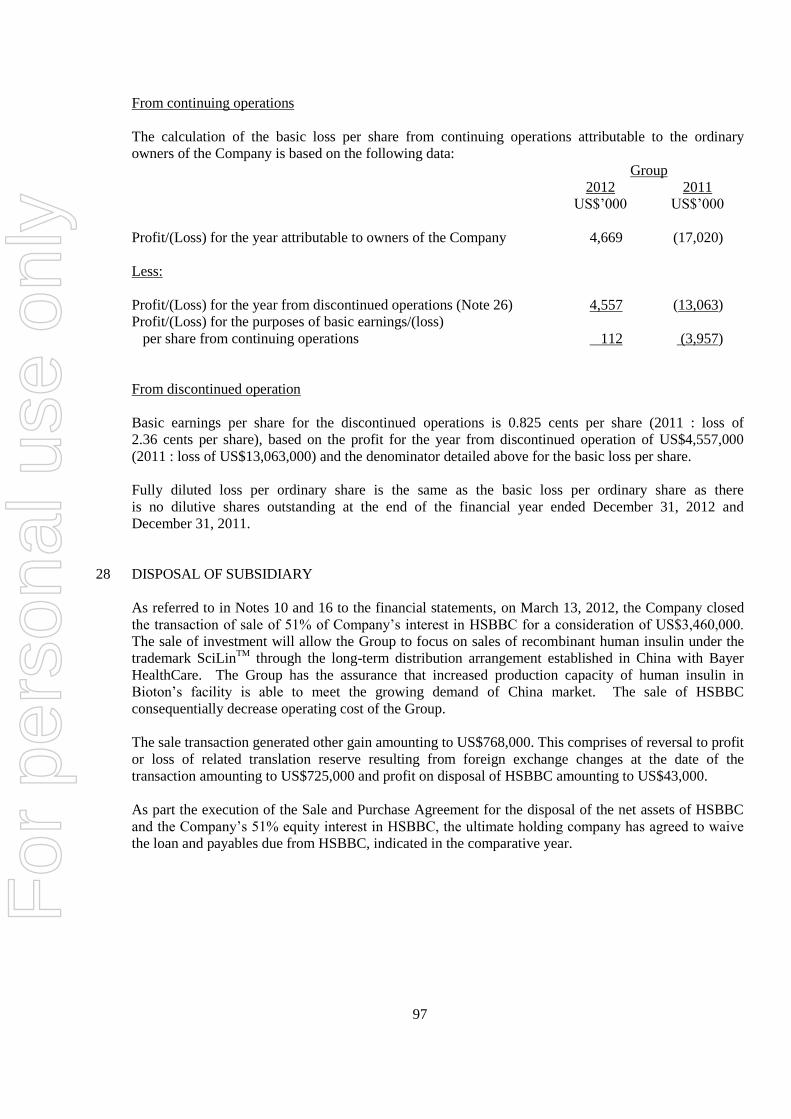
97
From continuing operations
The calculation of the basic loss per share from continuing operations attributable to the ordinary
owners of the Company is based on the following data:
Group
2012 2011
US$’000 US$’000
Profit/(Loss) for the year attributable to owners of the Company 4,669 (17,020)
Less:
Profit/(Loss) for the year from discontinued operations (Note 26) 4,557 (13,063)
Profit/(Loss) for the purposes of basic earnings/(loss)
per share from continuing operations 112 (3,957)
From discontinued operation
Basic earnings per share for the discontinued operations is 0.825 cents per share (2011 : loss of
2.36 cents per share), based on the profit for the year from discontinued operation of US$4,557,000
(2011 : loss of US$13,063,000) and the denominator detailed above for the basic loss per share.
Fully diluted loss per ordinary share is the same as the basic loss per ordinary share as there
is no dilutive shares outstanding at the end of the financial year ended December 31, 2012 and
December 31, 2011.
28 DISPOSAL OF SUBSIDIARY
As referred to in Notes 10 and 16 to the financial statements, on March 13, 2012, the Company closed
the transaction of sale of 51% of Company’s interest in HSBBC for a consideration of US$3,460,000.
The sale of investment will allow the Group to focus on sales of recombinant human insulin under the
trademark SciLinTM
through the long-term distribution arrangement established in China with Bayer
HealthCare. The Group has the assurance that increased production capacity of human insulin in
Bioton’s facility is able to meet the growing demand of China market. The sale of HSBBC
consequentially decrease operating cost of the Group.
The sale transaction generated other gain amounting to US$768,000. This comprises of reversal to profit
or loss of related translation reserve resulting from foreign exchange changes at the date of the
transaction amounting to US$725,000 and profit on disposal of HSBBC amounting to US$43,000.
As part the execution of the Sale and Purchase Agreement for the disposal of the net assets of HSBBC
and the Company’s 51% equity interest in HSBBC, the ultimate holding company has agreed to waive
the loan and payables due from HSBBC, indicated in the comparative year.
For
per
sona
l use
onl
y

98
At the date of the disposal of HSBBC, the book values of net assets over which control was lost are as
follows:
US$’000
Non-current assets
Property, plant and equipment 7,741
Intangible assets 367
Total non-current assets 8,108
Current assets
Inventories 10
Trade receivables 668
Cash and cash equivalents 2
Total current assets 680
Current liabilities
Trade payables 2,070
Net assets derecognised 6,718
Consideration received:
To be satisfied by cash (Note 8) 3,460
The details of the consideration on Group’s share on the net assets of HSBBC at the date of disposal
were as follows:
US$'000
Group’s share on net assets disposed of 3,417
Group’s share of translation reserve reversed on disposal (725)
2,692
Gain on disposal 768
Total consideration 3,460
A gain of US$768,000 was generated on the disposal of HSBBC and disclosed in the consolidated
statement of comprehensive income as part of continuing operations as “Gain on sale of subsidiary”. No
tax charge or credit arose on the transaction.
For
per
sona
l use
onl
y

99
29 SEGMENT INFORMATION
Segment information is presented in respect of the Group’s reportable segments. The reportable
segment presentation is based on the Group’s management and internal reporting structure, used for its
strategic decision-making purposes. Intersegment pricing is determined on mutually agreed terms.
The Group determines and presents operating segments based on the information that internally is
provided to the Chief Executive Officer (“CEO”), who is the Group’s chief operating decision maker.
An operating segment is a component of the Group that engages in business activities from which it
may earn revenues and incur expenses, including revenues and expenses that relate to transactions with
any of the Group’s other components. An operating segment’s operating results are reviewed regularly
by the CEO to make decisions about resources to be allocated to the segment and assess its
performance, and for which discrete financial information is available.
The accounting policies of the reportable segments are the same as the Group’s accounting policies
described in Note 2.
Segment results, assets and liabilities include items directly attributable to a segment as well as those
that can be allocated on a reasonable basis. Unallocated items comprise mainly investments (other than
the investment property) and related revenue, loans and expenses, corporate assets and head office
expenses.
Segment capital expenditure is the total cost incurred during the year to acquire property, plant and
equipment, and intangible assets.
The Group’s reportable segments are as follows:
Singapore The home country of the parent entity which is also the main operating entity. The areas of operation
are principally corporate office functions and sales and marketing.
Australia Includes sales and marketing activities.
India Includes sales, marketing and manufacturing activities.
Korea Includes sales and marketing activities.
Thailand Includes sales and marketing activities.
For
per
sona
l use
onl
y

100
Israel Includes sales, marketing and manufacturing activities.
The segment is classified as discontinued operations for the years ended December 31, 2011 and 2012.
Philippines Includes sales and marketing activities.
China Includes regulatory activities (2011 : sales, marketing and manufacturing activities).
Others Include operations carried on in Indonesia, Pakistan, Vietnam, Hong Kong and Malaysia and profit
sharing on sale of Insulin. None of these segments meets any of the quantitative thresholds for
determining reportable segments in 2012 or 2011.
Major customers Revenue from two distributors, namely from Thailand and Philippines, represent approximately
US$5,639,000 (2011 : US$4,891,000 from Thailand and Philippines) of the Group’s total revenue.
For
per
sona
l use
onl
y

101
Information regarding the Group’s reportable segments is presented below.
Continuing Discontinued
Singapore Australia India Korea Thailand Philippines China Others Unallocated operations operations Total
US$’000 US$’000 US$’000 US$’000 US$’000 US$’000 US$’000 US$’000 US$’000 US$’000 US$’000 US$’000
For year ended December 31, 2012
Revenue
Sales to external customers 26 8,124 - 3,045 4,046 1,593 - 1,316 - 18,150 217 18,367
Inter-segment sales 3,010 (2,064) - (946) - - - - - - - -
Total sales revenue 3,036 6,060 - 2,099 4,046 1,593 - 1,316 - 18,150 217 18,367
Results EBITDA (27) 1,774 (1,566) 485 472 455 (137) 795 (652) 1,599 4,514 6,113
Depreciation & amortisation - (96) (54) (1) - (1) (2) - (483) (637) - (637)
Interest expense - (84) (117) 84 - - (2) - (1,106) (1,225) (2) (1,227)
Interest income - 15 29 5 - - - - - 49 45 94
(27) 1,609 (1,708) 573 472 454 (141) 795 (2,241) (214) 4,557
Profit from operating activities before income tax 4,343
Income tax expense (200)
Profit for the year 4,143 Non-controlling interest 526
Profit attributable to equity holders 4,669
Singapore Australia India Korea Thailand Philippines China Israel Others Unallocated Total
US$’000 US$’000 US$’000 US$’000 US$’000 US$’000 US$’000 US$’000 US$’000 US$’000 US$’000
As at December 31, 2012
Segment Assets
Total non-current assets - 330 15,531 3 - 3 5 - - 16,021 31,893
Deferred tax assets - - - - - - - - - 7,140 7,140 Total current assets 4 3,137 1,346 1,262 733 613 27 - 343 6,077 13,542
Segment assets 4 3,467 16,877 1,265 733 616 32 - 343 29,238 52,575
Segment liabilities
Segment liabilities - (357) (3,231) (163) - (80) - - (16) (101,890) (105,737)
* EBITDA – Earnings before interest, Taxation, Depreciation and Amortisation
For
per
sona
l use
onl
y

102
Singapore Australia India Korea Thailand Philippines China Israel Others Unallocated Total
US$’000 US$’000 US$’000 US$’000 US$’000 US$’000 US$’000 US$’000 US$’000 US$’000 US$’000
For year ended December 31, 2012
Other segment information
Capital expenditure on property,
plant and equipment (“PPE”)/
intangible assets (“IA”) - 16 2,714 - - - - - - 41 2,771
Material non-cash items Write-off of IA - - - (17) - - - - - - (17)
Write-off of inventories - - - - - (12) - - - - (12)
For
per
sona
l use
onl
y

103
Continuing Discontinued
Singapore Australia India Korea Thailand Philippines China Others Unallocated operations operations Total
US$’000 US$’000 US$’000 US$’000 US$’000 US$’000 US$’000 US$’000 US$’000 US$’000 US$’000 US$’000
For year ended December 31, 2011
Revenue
Sales to external customers 7 7,278 7 2,520 3,390 1,501 48 1,012 - 15,763 912 16,675 Inter-segment sales 3,378 (1,877) - (1,501) - - - - - - - -
Total sales revenue 3,385 5,401 7 1,019 3,390 1,501 48 1,012 - 15,763 912 16,675
Results EBITDA (35) 991 (1,070) 431 405 370 (1,313) 650 (2,376) (1,947) (10,700) (12,647)
Depreciation & amortisation - (92) (94) (7) - (1) (538) - (481) (1,213) - (1,213)
Interest expense - (84) (661) 51 - (1) 82 - (656) (1,269) (2,364) (3,633)
Interest income - 18 17 1 - - 1 - - 37 1 38
(35) 833 (1,808) 476 405 368 (1,768) 650 (3,513) (4,392) (13,063)
Loss from operating activities
before income tax (17,455)
Income tax expense (272)
Loss for the year (17,727)
Non-controlling interest 707
Loss attributable to equity holders (17,020)
Singapore Australia India Korea Thailand Philippines China Israel Others Unallocated Total
US$’000 US$’000 US$’000 US$’000 US$’000 US$’000 US$’000 US$’000 US$’000 US$’000 US$’000
As at December 31, 2011
Segment Assets
Total non-current assets - 404 12,963 30 - 2 7 - - 16,463 29,869
Deferred tax assets - 179 - - - - - - - 7,140 7,319
Total current assets 2 2,652 2,448 1,630 1,044 560 8,729 846 128 2,893 20,932
Segment assets 2 3,235 15,411 1,660 1,044 562 8,736 846 128 26,496 58,120
Segment liabilities
Segment liabilities - (426) (5,031) (140) - (157) (1,916) (596) (2) (106,343) (114,611)
* EBITDA – Earnings before interest, Taxation, Depreciation and Amortisation
For
per
sona
l use
onl
y

104
Singapore Australia India Korea Thailand Philippines China Israel Others Unallocated Total
US$’000 US$’000 US$’000 US$’000 US$’000 US$’000 US$’000 US$’000 US$’000 US$’000 US$’000
For year ended December 31, 2011
Other segment information
Capital expenditure on property,
plant and equipment (“PPE”)/ intangible assets (“IA”) - 127 1,577 17 - - 604 - - 13 2,338
Material non-cash items Impairment loss on PPE - - - - - - (1,981) (4,232) - - (6,213)
Impairment loss on IA - - - - - - (192) (1,873) - - (2,065)
Write-off of IA - (9) - - - - - - - (34) (43)
Write-off of inventories - - - - - - - (950) - - (950)
For
per
sona
l use
onl
y

105
30 COMMITMENTS
Commitments not reflected in the financial statements at the reporting date are as follows:
(a) Operating lease commitments
The Group as lessee
Group
2012 2011
US$’000 US$’000
Minimum lease payments under operating leases
recognised as an expense in the year 329 357
The Group leases a number of offices under operating leases. The leases typically run for an initial
period of 1 to 5 years with an option to renew the lease after that date. Lease payments are usually
revised when the leases are renewed to reflect market rentals.
At December 31, 2012, the Group and the Company have commitments for future minimum lease
payments under non-cancellable operating leases as follows:
Group Company
2012 2011 2012 2011
US$’000 US$’000 US$’000 US$’000
Within 1 year 177 357 90 190
After 1 year but within 5 years 26 170 16 105
204 527 106 295
(b) Capital commitments
Group Company
2012 2011 2012 2011
US$’000 US$’000 US$’000 US$’000
Capital expenditure contracted
but not provided for in the
financial statements is as follows:
Acquisition of property,
plant and equipment 76 6,200 - -
For
per
sona
l use
onl
y

106
31 EVENTS AFTER THE REPORTING PERIOD
Subsequent to year end, based on mutual agreement between the Company and its ultimate holding company, the Company has assigned its rights on the proceeds from disposal of a subsidiary amounting to US$3,460,000 (Note 8) to its ultimate holding company, in return, the ultimate holding company agreed to offset US$3,460,000 from the outstanding trade payable of the Company to its ultimate holding company (Note 17).
32 RETROSPECTIVE RESTATEMENT OF ERROR
Certain restatements have been made to the prior year’s financial statements to enhance comparability
with the current year’s financial statements following the correction of errors in relation to the reversal
of liability accrued for validation test in year 2006 for US$250,000 as the Company and the Group is
not liable for.
As a result, certain line items have been amended in the Consolidated Statement of Financial Position
and Consolidated Statement of Changes in Equity, the Company’s Statement of Financial Position, the
Company’s Statement of Changes in Equity and the related notes to the financial statements.
Comparative figures have been adjusted to conform to the current year’s presentation.
The items in statement of financial position of the Group and of the Company as at December 31, 2011
and 2010 were restated as follows:
Group
2010 2010
Previously After
reported restatement
US$’000 US$’000
Trade and other payables 21,711 21,461
Accumulated losses (86,554) (86,304)
Company
2010 2010
Previously After
reported restatement
US$’000 US$’000
Trade and other payables 16,953 16,703
Accumulated losses (73,306) (73,056)
Group
2011 2011
Previously After
reported restatement
US$’000 US$’000
Trade and other payables 23,327 23,077
Accumulated losses (103,574) (103,324)
For
per
sona
l use
onl
y

107
Company 2011 2011 Previously After reported restatement US$’000 US$’000 Trade and other payables 21,038 20,788 Accumulated losses (92,670) (92,420)
The items in statement of changes in equity of the Group and of the Company as at December 31, 2011 and 2010 were restated as follows:
Group 2010 2010 Previously After reported restatement US$’000 US$’000 Accumulated losses (86,554) (86,304) Total attributable to equity holders (42,711) (42,461) Total equity (38,803) (38,553) Company 2010 2010 Previously After reported restatement US$’000 US$’000 Accumulated losses (73,306) (73,056) Total attributable to equity holders/Total equity (30,776) (30,526) Group 2011 2011 Previously After reported restatement US$’000 US$’000 Accumulated losses (103,574) (103,324) Total attributable to equity holders (60,083) (59,833) Total equity (56,741) (56,491) Company 2011 2011 Previously After reported restatement US$’000 US$’000 Accumulated losses (92,670) (92,420) Total attributable to equity holders/Total equity (50,140) (49,890)
Accordingly, there is no impact on financial year 2011 loss for the year and earnings per share.
For
per
sona
l use
onl
y

108
33 BASES FOR QUALIFIED REPORT IN 2011
The independent auditors’ report for the year ended December 31, 2011 was qualified. The qualification
that has impact into the current period’s comparative statements is discussed in the following below.
The Group has included net assets of disposal group classified as held-for-sale and the Company has
included non-current assets classified as held-for-sale as at December 31, 2011 with carrying amount of
US$2,000,000 and US$2,000,000 (2010 : US$10,000,000 and US$11,652,000), respectively. Singapore
Financial Reporting Standard (“FRS”) 105 Non-current Assets Held-for-Sale requires an entity to
measure a disposal group and non-current assets classified as held-for-sale at lower of its carrying
amount and fair value less costs to sell. For the year ended December 31, 2011, the management has
provided impairment loss for the Group amounting to US$7,055,000 on the net assets of SciGen (I.L.)
Ltd (“SIL”) and for the Company amounting to US$11,998,000 on the non-current assets classified as
held-for-sale based on fair value less costs to sell. We were unable to obtain sufficient appropriate audit
evidence to enable us to conclude whether the impairment loss for the year ended December 31, 2011
should be accounted for as an adjustment to impairment loss recorded for the year ended December 31,
2010 or December 31, 2011.
For
per
sona
l use
onl
y

Shareholder information
The shareholder information set out below was applicable as at February 28, 2013.
On-market buy-back
There is no current on-market buy-back.
Distribution of equity securities
Analysis of numbers of equity securities by size of holding:
Ordinary shares
No. of Shares
No. of
shareholders
1 - 1,000 59,990 118
1,001 - 5,000 242,649 96
5,001 - 10,000 437,821 57
10,001 - 100,000 7,448,136 206
100,001 and over 544,081,724 58
552,270,320 535
There were 292 holders of less than a marketable parcel of ordinary shares.
For
per
sona
l use
onl
y

Equity security holders
The names of the twenty largest holders of quoted equity securities are listed below:
Ordinary shares
Number
held
Percentage
of issued
shares
1 BIOTON S.A. 527,786,735 95.57%
2 JP MORGAN NOMINEES AUSTRALIA LIMITED
<CASH INCOME A/C> 2,053,860 0.37%
3 HSBC CUSTODY NOMINEES (AUSTRALIA) LIMITED 1,178,208 0.21%
4 MR BERNARD STAUNTON <THE STAUNTON
SUPER A/C> 1,116,138 0.20%
5 CITICORP NOMINEES PTY LIMITED 674,575 0.12%
6 DR ANDREW TAN 597,455 0.11%
7 BEDEL & SOWA CORP PTY LTD 500,000 0.09%
8 DANKAB PTY LTD <DANKAB P/L SUPER
FUND A/C> 499,410 0.09%
9 MR CHARLES BRUCE LEIBOWITZ 476,486 0.09%
1
0 R MALA PTY LTD <SUPERFUND A/C>
450,000 0.08%
1
1 TRUGANINI PTY LTD
449,538 0.08%
1
2 MR RAYMOND JOHN GASKELL
408,500 0.07%
1
3 MR PAUL ANTHONY OCKELFORD
374,943 0.07%
1
4 MR DAVID ALEXANDER ARCHIBALD
300,000 0.05%
1
5 MR RONALD JAMES WITNEY
285,000 0.05%
1
6
NAVIGATOR AUSTRALIA LTD <MLC INVESTMENT
SETT A/C> 253,332 0.05%
1
7
MR ARTHUR MORRIS & MRS RAEWYN MORRIS &
MR CHRIS HOCQUARD <THE NILOC A/C> 225,000 0.04%
1
8 MR MARK CHAPMAN
224,399 0.04%
1
9 MR ANTHONY RONALD BIERRE
214,943 0.04%
2
0
MR BRUCE KENNETH LOCKETT & MR ROGER
MICHAEL KENNEDY & MR CYNRIC REX TEMPE-
CAMP <MRS ELAINE TEMPE-CAMP A/C> 209,225 0.04%
538,277,747 97.47%
For
per
sona
l use
onl
y

Substantial shareholders
Substantial holder in the Company is set out below:
Number
held
Percentage
of issued
shares
Ordinary shares:
Bioton S.A. 527,786,735 95.57%
Voting rights
The voting rights attached to each class of equity securities are set out below:
(a) Voting shares
On a show of hands every member present at a meeting in person or by proxy shall have one vote
and upon a poll each share shall have one vote.
(b) Options
No voting rights.
For
per
sona
l use
onl
y