for personal use only - home - australian securities … · balance sheet through the generation of...
TRANSCRIPT
AUUSTAL L
IMITED
2015 ANNUUAL REPPORT
For
per
sona
l use
onl
y

HIEF EXECUTIVE OFFICER’S REPORT
1 | AUSTAL LIMITED ANNUAL REPORT 2015
Contents
Contents ..................................................................................................................................................................... 1
Index to the notes to the financial statements ............................................................................................................ 2
Chairman’s report ...................................................................................................................................................... 3
Chief Executive Officer’s report ................................................................................................................................. 5
Review of operations ................................................................................................................................................. 7
Directors’ report ......................................................................................................................................................... 9
Remuneration Report ............................................................................................................................................... 15
Auditor independence and non-audit services ......................................................................................................... 33
Consolidated statement of profit or loss and other comprehensive income for the year ended 30 June 2015 ....... 34
Consolidated statement of financial position as at 30 June 2015 ............................................................................ 35
Consolidated statement of changes in equity for the year ended 30 June 2015 ..................................................... 36
Consolidated statement of cash flows for the year ended 30 June 2015 ................................................................ 37
Notes to the financial statements ............................................................................................................................. 38
Directors’ declaration ............................................................................................................................................... 96
Independent audit report to the members of Austal Limited .................................................................................... 97
Shareholder information ........................................................................................................................................... 99
Corporate governance statement ............................................................................................................................ 99
Corporate Directory ................................................................................................................................................ 100
GHAGHA-1 – ONE OF TWO 45M FAST CREW BOATS BUILT FOR ABU DHABI NATIONAL OIL COMPANY (ADNOC)
For
per
sona
l use
onl
y

HIEF EXECU
2 | AUSTAL
Index to
Basis of prep
Note 1Note 2
Current year
Note 3Note 4Note 5Note 6Note 7Note 8Note 9
Capital struc
Note 1Note 1Note 1Note 1
Working cap
Note 1Note 1Note 1Note 1
Infrastructur
Note 1Note 1Note 2
Other liabiliti
Note 2
Financial ris
Note 2Note 2Note 2
Unrecognise
Note 2Note 2
The Group,
Note 2Note 2Note 2Note 3Note 3
UTIVE OFFICE
L LIMITED ANN
the notes
paration .......
1. Corpor 2. Basis o
r performance
3. Operat 4. Revenu 5. Other i 6. Earning 7. Reconc 8. Dividen 9. Income
cture .............
10. Cash a 11. Interes 12. Contrib 13. Govern
pital ..............
14. Trade a 15. Constru 16. Invento 17. Trade a
re & other ass
18. Propert 19. Intangi 20. Collate
ies ...............
21. Provisio
k manageme
22. Fair va 23. Financ 24. Derivat
ed items .......
25. Commi 26. Events
management
27. Parent 28. Related 29. Key ma 30. Share b 31. Parent
ER’S REPOR
UAL REPORT 2
s to the f
.....................
rate Informatioof preparation
e ...................
ing segments ue .................ncome and exgs per share .ciliation of net nds paid and pe and other tax
.....................
and cash equivt bearing loan
buted equity annment grants r
.....................
and other receuction contracories and workand other pay
sets ...............
ty, plant and eble assets .....
eral ................
.....................
ons ...............
ent .................
lue measuremial risk managtive financial in
.....................
itments and coafter the bala
t and related
interests in sud party disclosanagement pebased paymenentity ...........
RT
2015
financial s
.....................
on .........................................
.....................
...........................................xpenses ...............................profit after tax
proposed .......xes ................
.....................
valents ...........s and borrowind reserves ...relating to ass
.....................
eivables .........cts in progressk in progress ..ables .............
.....................
equipment ..................................................
.....................
......................
.....................
ments .............gement ...........nstruments an
.....................
ontingencies ..ance date .......
parties .........
ubsidiaries .....sure ...............ersonnel compnts .......................................
statemen
....................
......................
......................
....................
......................
......................
......................
......................x to net cash f............................................
....................
......................ings .....................................sets ................
....................
......................s ................................................................
....................
......................
......................
......................
....................
......................
....................
......................
......................nd hedging ....
....................
......................
......................
....................
......................
......................pensation ...................................................
nts
.....................
.....................
.....................
.....................
.....................
.....................
.....................
.....................flows from ope..........................................
.....................
.....................
.....................
.....................
.....................
.....................
.....................
.....................
.....................
.....................
.....................
.....................
.....................
.....................
.....................
.....................
.....................
.....................
.....................
.....................
.....................
.....................
.....................
.....................
.....................
.....................
.....................
.....................
.....................
.....................
......................
......................
.....................
......................
......................
......................
......................erations .....................................................
.....................
......................
......................
......................
......................
.....................
......................
......................
......................
......................
.....................
......................
......................
......................
.....................
......................
.....................
......................
......................
......................
.....................
......................
......................
.....................
......................
......................
......................
......................
......................
....................
......................
......................
....................
......................
......................
......................
......................
......................
......................
......................
....................
......................
......................
......................
......................
....................
......................
......................
......................
......................
....................
......................
......................
......................
....................
......................
....................
......................
......................
......................
....................
......................
......................
....................
......................
......................
......................
......................
......................
................ 38
................. 38
................. 38
................ 45
................. 45
................. 49
................. 50
................. 52
................. 53
................. 54
................. 55
................ 59
................. 59
................. 60
................. 62
................. 64
................ 65
................. 65
................. 67
................. 67
................. 68
................ 69
................. 69
................. 72
................. 75
................ 76
................. 76
................ 78
................. 78
................. 82
................. 86
................ 88
................. 88
................. 88
................ 89
................. 89
................. 89
................. 89
................. 90
................. 95
8
8 8
5
5 9 0 2 3 4 5
9
9 0 2 4
5
5 7 7 8
9
9 2 5
6
6
8
8 2 6
8
8 8
9
9 9 9 0 5
For
per
sona
l use
onl
y

HIEF EXECUTIVE OFFICER’S REPORT
3 | AUSTAL LIMITED ANNUAL REPORT 2015
Chairman’s report It is my pleasure to present the 2015 Annual Report to you on behalf of the Board of Austal Limited.
The past 12 months represented another year of embedding sustainable operational improvements from FY2014 and further strengthening of the balance sheet through the generation of cash and repayment of debt.
Highlights from the year are as follows:
$1.4 billion Group Revenue exceeded initial guidance of $1.2 billion and subsequent guidance of $1.35 billion.
Concluded the sale of the 102 metre stock trimaran to Condor ferries and used part of the proceeds to repay debt.
Maintained a strong focus on cash generation which was also used to repay debt.
Littoral Combat Ship (LCS) 6 completed acceptance trials with the US Navy and delivery occurred post balance date. LCS 6 is the first LCS that Austal has built as prime contractor.
Confirmed funding for the final two Littoral Combat Ships under the original contract with the US Navy.
The US Navy added an option for an additional LCS (LCS 26) under the existing contract.
Secured new shipbuilding contracts with an undisclosed Asian operator and Caspian Marine Services from Azerbaijan.
Increased the EBIT contribution and EBIT margin of the Service and Sustainment business in the USA.
The Chief Executive Officer, Andrew Bellamy, will provide more detail in his report on the operational achievements for the year, and the strategic direction and outlook for Austal.
Financial results
Austal reported a net profit after tax of $53.156 million in FY2015, compared to $31.859 million in FY2014. FY2015 earnings before interest, tax, depreciation and amortisation were (EBITDA) $109.069 million for the year compared to $79.338 million in FY2014.
The improvement in earnings was driven by stronger shipbuilding margins in Australia and one off non-cash foreign exchange gains relating to inter-company loans. These loans have now been converted to equity.
Revenue for the year grew by 26 per cent from $1,122.863 million in FY2014 to $1,414.888 million.
US operations were the largest contributor to revenue, delivering $1,119.703 million (FY2014: $933.615 million) and $58.429 million in earnings before interest and tax (EBIT) (FY2014: $61.682 million) as Austal continued to perform work on its major LCS and Joint High Speed Vessels (JHSV) contracts for the US Navy.
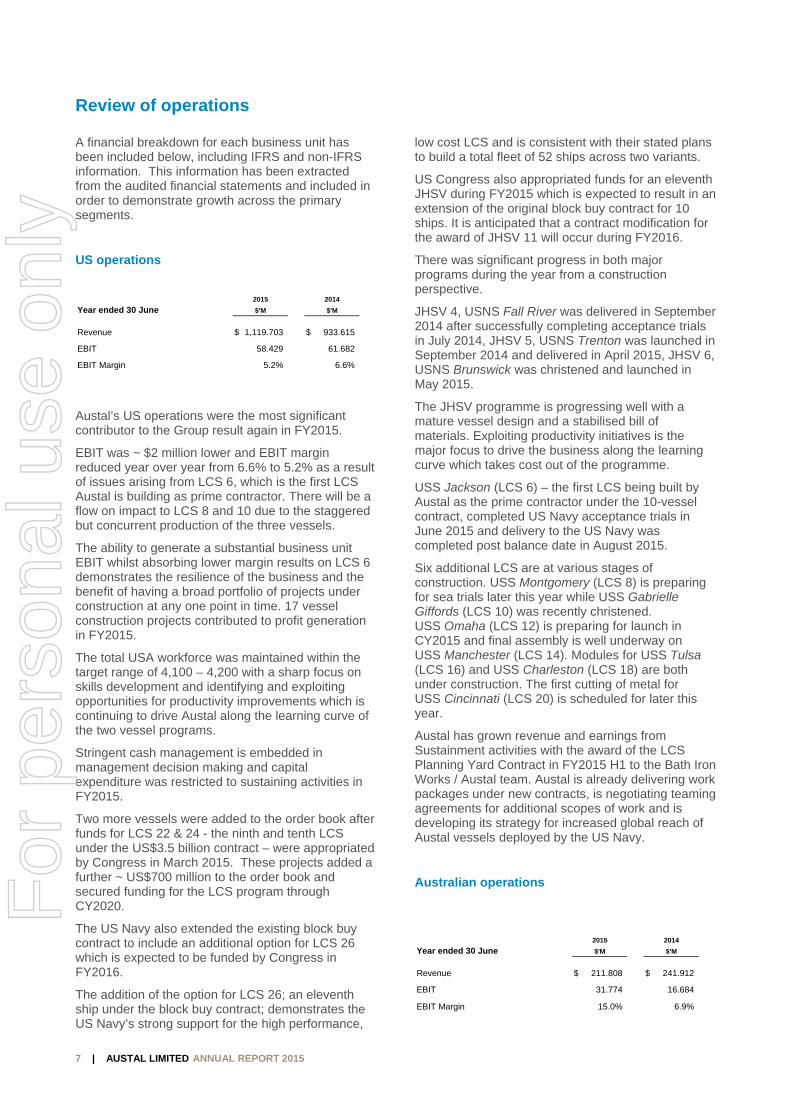
Australian operations delivered another improvement in results as construction of the Cape Class Patrol Boat fleet nears completion with $211.808 million in revenue (FY2014: $241.912 million) and $31.774 million EBIT (FY2014: $16.684 million).
Philippines Operation reported a $0.992 million EBIT (FY2014: $2.703 million).
Group net debt was reduced to $6.094 million (FY2014: $71.496 million) after generating operating cash flow of $110.434 million.
Financial summary
*Excludes other income
EBIT and EBITDA are non-IFRS measures. The information is unaudited but is extracted from the audited financial statements. EBIT is used to understand segment performance and EBITDA is used by management to understand cash flows within the group.
2015 2014
Year ended 30 June $’000 $’000
Revenue* 1,414,888$ 1,122,863$
EBITDA 109,069$ 79,338$
Depreciation (22,736)$ (21,593)$ Amortisation (1,530) (2,180)
EBIT 84,803$ 55,565$ Net Interest (Expense) / Income (4,110) (8,421)
Operating Profit Before Tax 80,693$ 47,144$
Tax (Expense)/Benefit (27,537)$ (15,285)$
Operating Profit After Tax 53,156$ 31,859$
% EBIT/Revenue 6.0% 4.9%Basic Earnings Per Share ($ per share) 0.16$ 0.09$ Net Assets 512,399$ 433,232$ Return on Invested Capital (%) 10.8% 9.1%
For
per
sona
l use
onl
y
HIEF EXECUTIVE OFFICER’S REPORT
4 | AUSTAL LIMITED ANNUAL REPORT 2015
Board and Executive management
Jim McDowell joined the Board as an Independent Director in December 2014 and brings extensive defence industry experience to the team.
The Executive management team has remained stable and focussed on executing strategic initiatives.
Strategy and governance
The Board has continued its active engagement in reviewing the development of Group strategy proposed by Executive management.
The annual review of the Group’s risk management framework was conducted with involvement by the Audit and Risk committee and Remuneration and Nomination committee to ensure that the necessary controls and governance are in place, fit for purpose and amended as required.
Austal has demonstrated success in leveraging its intellectual property in high speed ferries and defence vessels to penetrate adjacent markets, with the recent contracts for high speed crew transfer vessels into UAE and Azerbaijan exemplifying the initiative.
People
Finally I would like to thank and acknowledge our employees for their consistent loyalty and hard work during the year that has made our achievements possible. I extend my thanks to shareholders for your ongoing support of Austal. It is immensely pleasing to continue to deliver improved operational and financial performance to drive shareholder value.
John Rothwell AO Chairman
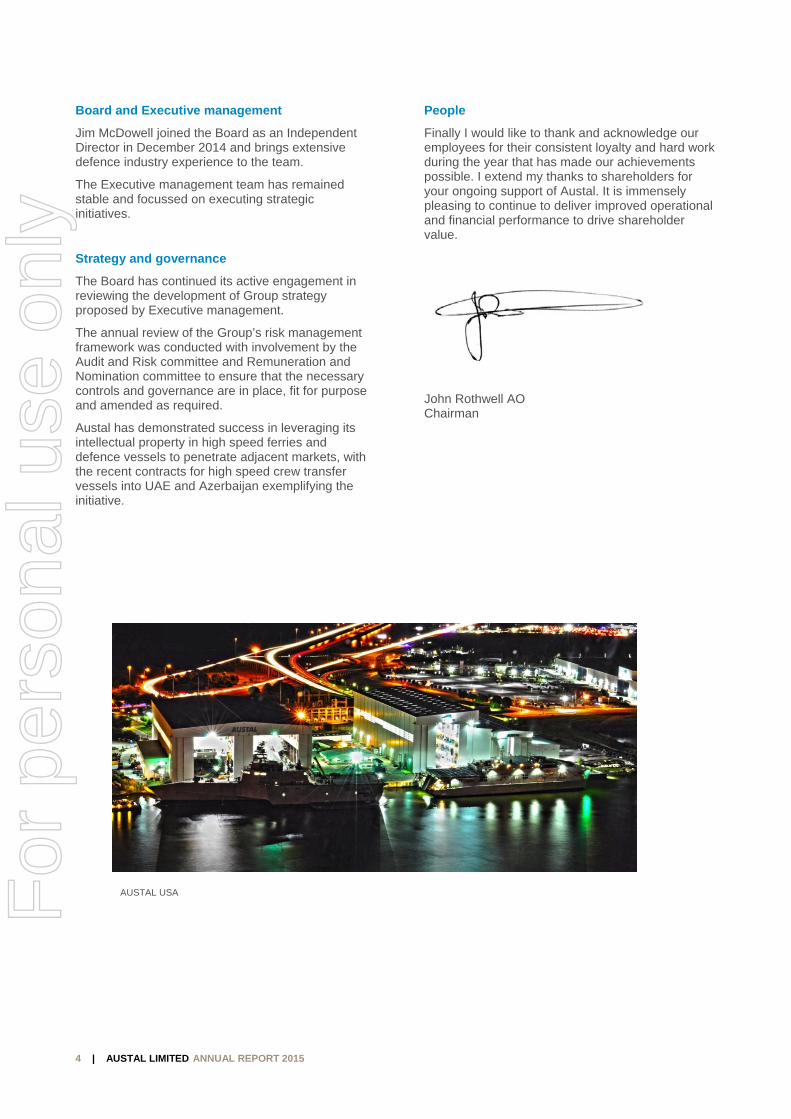
AUSTAL USA For
per
sona
l use
onl
y

5 | AUSTAL LIMITED ANNUAL REPORT 2015
Chief Executive Officer’s report Record Revenue and Profit
Austal delivered record NPAT of $53.156 million from record revenue of $1.4 billion in FY2015, which was underpinned by significant profit generation in the USA and Australia segments.
A major milestone was achieved in the USA with LCS 6 completing acceptance trials in June and delivery to the US Navy being completed post balance date in August 2015.
LCS 6 is the first of the LCS that Austal has delivered as prime contractor to the US Navy.
Completion of LCS 6 was more difficult than planned, which will also impact LCS 8 and 10, and this has been reflected in a reduction in USA EBIT margin in FY2015. Substantial knowledge has been garnered from the completion of LCS 6 that will deliver improved performance in the construction of future ships.
Strong generation of cash has further strengthened the balance sheet and supported the return to dividends (1 cent interim dividend and a final dividend of 3 cents, bringing the year to a total of 4 cents) after a three year hiatus.
Strategy
The strong profit is testament to sustained focus on the core strategy.
Balance sheet gearing was reduced year on year with a substantial reduction in net debt from $71.496 million to $6.094 million. This was achieved through strong operational cash generation and the sale of the 102 m trimaran ferry to Condor Ferries in the UK.
The USA is a core market for Austal and the US Navy’s commitment to the LCS program is articulated by the shipbuilding plan for a total fleet of 52 LCS (to be renamed fast frigate after LCS 32) and is being realised with the appropriation of funds for LCS 22 & 24 by US Congress and a contract extension to include an eleventh ship (LCS 26) which is expected to be funded in FY2016.
The confirmation of LCS 22 & 24 added ~ US$700 million to the order book which secures work through CY2020.
The USA segment has achieved significant milestones in the development of a substantial vessel sustainment business with maintenance planning and execution contracts awarded and $1,119.703 million of revenue being generated in FY2015.
Efficient and hence productive completion of the Cape Class Patrol Boat fleet for the Australian Border Force demonstrates the benefits that can
flow from continuous shipbuilding activities. This perfectly aligns with the Federal Government’s recent Shipbuilding Policy announcement (August 2015) to transition into a continuous surface shipbuilding procurement pattern with > $40 billion of new shipbuilding projects scheduled over the next decade.
Austal’s growth has been underpinned by the core skill of its people to innovate and to apply new technologies in the commercial world to generate an economic return.
This skill is a critical enabler to our strategy of expanding into new or adjacent products and customer markets.
The benefits of this strategy are already being realised and are exemplified by projects such as the High Speed Support Vessel (HSSV) contract for the Royal Navy of Oman, and the award of contracts to three customers for high speed crew transfer vessels for the oil and gas industry.
Technology transfer to the Philippines Operation and integration of the Philippines into the supply chain for the Group has increased the competitiveness of the Group.
Prudent cash management is embedded in decision making to ensure a balanced approach to operational activities, investment in future growth and capital management. This will enhance Austal’s ability to deliver on the record amount of work in progress and strategic objectives.
Strategic objectives for the year ahead are productivity enhancements and cost reduction initiatives across the Group, growing the Sustainment business and growth in the Australian market.
People
Our Values of Excellence, Customer, Integrity and Teamwork are unchanged and continue to be the basis for many tangible and sustainable business successes throughout the year.
There has been an increased focus on Human Resources Strategy with succession planning reviewed and developed across the top 3 tiers of management and critical skill areas, and capability development and recruitment to deepen the talent pool. This has presented a new round of opportunities for many employees to grow and the organisation is stronger and more sustainable as a result.
There will be focus on increased female participation in the workplace as a core diversity initiative in the year ahead.
For
per
sona
l use
onl
y

6 | AUSTAL
I thank all ofstakeholdersexcellence, c
Outlook
The order bo30 June 201CY2020.
The longevitprograms in orders, awarCongressionaward of confleet sustaininvestment iincrease theplatforms to
The Australipolicy annoushipbuilding shipbuilding Offshore Patfrigate progrrepresent suAustralia.
Austal’s demdomestic ansuccessful pNavy prograapproximatethe Group inOffshore Patreplacement
The lower Acompetitivenreducing themarkets.
A weaker AUrepatriation oPhilippines b
The Middle Econtinue to p
Austal maintcommercial several saleAustal has capplying cleainnovate ourin the Philipppositioned toeventuate.
L LIMITED ANN
f our employes for their harcommitment
ook stands at5 which sust
ty of the LCS the USA is c
rd of contractnal funding fontracts in futument capabiln research an
e capability of meet future r
an Federal Guncement to scapability thrprocurementtrol Vessel coram to replaceubstantial opp
monstrated ped export mar
prime contracams (LCS & Jely 15% of then good stead trol Vessel ant programs.
ustralian dollaness of the Aue cost of Aust
UD also improof earnings frbusiness units
East is a thirdpursue severa
tains a watchferry market s leads in est
committed a man fuel technr product offepines means o seize upon
UAL REPORT 2
ees and otherrd work, devoand loyalty.
t $3.1 billion aains work thr
and JHSV shclear with cont extensions,
or the confirmaure years, inveity, and US Nnd developmef both the LCSrequirements
Government’s sustain Austrarough continut and acceleraontract, and fe the ANZACportunities for
edigree in penrkets and evotor for two maHSV) that wi
e US Navy fleto compete fond ANZAC fle
ar has increaustralian busiralian conten
oves the tranrom the USA s.
d core marketal credible ini
ing brief on thin Europe antablished marmodest investologies to fur
ering. The lowthat Austal isopportunities
2015
r otion to
at ough
hipbuilding firmation of
ation / estment in
Navy ent to S and JHSV .
recent alian
uous ation of the uture
C fleet, r Austal in
netrating lution into a ajor US ll represent
eet, place or the eet
sed the iness by t in export
slation and and
t and we itiatives.
he d Asia with rkets. tment to rther
w cost base s well s if they
Austal is pumarkets, wlow Australcompetitive
The strengtoperationalgreater cascapital mangrowth initia
Andrew BeManaging D
Aremiti Ferry
LCS 6 – USS J
ursuing manyhich reflects aian dollar pla
e position.
th of the orde improvemen
sh generationnagement, invatives and ret
llamy Director and C
2 – built in the Ph
JACKSON
y opportunitiea healthy out
aces the Grou
er book and thnts will translan which enablvestment in sturns to share
Chief Executi
hilippines
s in core tlook and the up in a highly
he sustained ate into e prudent
strategic eholders.
ive Officer
For
per
sona
l use
onl
y
7 | AUSTAL LIMITED ANNUAL REPORT 2015
Review of operations A financial breakdown for each business unit has been included below, including IFRS and non-IFRS information. This information has been extracted from the audited financial statements and included in order to demonstrate growth across the primary segments.
US operations
Austal’s US operations were the most significant contributor to the Group result again in FY2015.
EBIT was ~ $2 million lower and EBIT margin reduced year over year from 6.6% to 5.2% as a result of issues arising from LCS 6, which is the first LCS Austal is building as prime contractor. There will be a flow on impact to LCS 8 and 10 due to the staggered but concurrent production of the three vessels.
The ability to generate a substantial business unit EBIT whilst absorbing lower margin results on LCS 6 demonstrates the resilience of the business and the benefit of having a broad portfolio of projects under construction at any one point in time. 17 vessel construction projects contributed to profit generation in FY2015.
The total USA workforce was maintained within the target range of 4,100 – 4,200 with a sharp focus on skills development and identifying and exploiting opportunities for productivity improvements which is continuing to drive Austal along the learning curve of the two vessel programs.
Stringent cash management is embedded in management decision making and capital expenditure was restricted to sustaining activities in FY2015.
Two more vessels were added to the order book after funds for LCS 22 & 24 - the ninth and tenth LCS under the US$3.5 billion contract – were appropriated by Congress in March 2015. These projects added a further ~ US$700 million to the order book and secured funding for the LCS program through CY2020.
The US Navy also extended the existing block buy contract to include an additional option for LCS 26 which is expected to be funded by Congress in FY2016.
The addition of the option for LCS 26; an eleventh ship under the block buy contract; demonstrates the US Navy’s strong support for the high performance,
low cost LCS and is consistent with their stated plans to build a total fleet of 52 ships across two variants.
US Congress also appropriated funds for an eleventh JHSV during FY2015 which is expected to result in an extension of the original block buy contract for 10 ships. It is anticipated that a contract modification for the award of JHSV 11 will occur during FY2016.
There was significant progress in both major programs during the year from a construction perspective.
JHSV 4, USNS Fall River was delivered in September 2014 after successfully completing acceptance trials in July 2014, JHSV 5, USNS Trenton was launched in September 2014 and delivered in April 2015, JHSV 6, USNS Brunswick was christened and launched in May 2015.
The JHSV programme is progressing well with a mature vessel design and a stabilised bill of materials. Exploiting productivity initiatives is the major focus to drive the business along the learning curve which takes cost out of the programme.
USS Jackson (LCS 6) – the first LCS being built by Austal as the prime contractor under the 10-vessel contract, completed US Navy acceptance trials in June 2015 and delivery to the US Navy was completed post balance date in August 2015.
Six additional LCS are at various stages of construction. USS Montgomery (LCS 8) is preparing for sea trials later this year while USS Gabrielle Giffords (LCS 10) was recently christened. USS Omaha (LCS 12) is preparing for launch in CY2015 and final assembly is well underway on USS Manchester (LCS 14). Modules for USS Tulsa (LCS 16) and USS Charleston (LCS 18) are both under construction. The first cutting of metal for USS Cincinnati (LCS 20) is scheduled for later this year.
Austal has grown revenue and earnings from Sustainment activities with the award of the LCS Planning Yard Contract in FY2015 H1 to the Bath Iron Works / Austal team. Austal is already delivering work packages under new contracts, is negotiating teaming agreements for additional scopes of work and is developing its strategy for increased global reach of Austal vessels deployed by the US Navy.
Australian operations
2015 2014
Year ended 30 June $'M $'M
Revenue 1,119.703$ 933.615$
EBIT 58.429 61.682
EBIT Margin 5.2% 6.6%
2015 2014
Year ended 30 June $'M $'M
Revenue 211.808$ 241.912$
EBIT 31.774 16.684
EBIT Margin 15.0% 6.9%
For
per
sona
l use
onl
y

8 | AUSTAL LIMITED ANNUAL REPORT 2015
Austal’s Australian operations delivered another significant increase in EBIT and EBIT margin in FY2015.
This result was again driven by efficient construction of the $330 million Cape Class Patrol Boat (CCPB) fleet in the Henderson shipyard for Australian Border Force. The efficiencies extracted over the four year construction period demonstrate the benefits from continuous shipbuilding with a mature vessel design.
CCPB 3 – 6 were all delivered to the Australian Border Force during FY2015. CCPB 7 was delivered subsequent to balance date and the final vessel is due to be delivered in August 2015.
CCPB 1 and 2 returned to the Henderson shipyard for their first major dockings since delivery to the customer in FY2013 and FY2014 respectively, as part of the 5 years in service support contract for the entire CCPB fleet.
Design and construction of the two 72 metre High Speed Support Vessels (HSSV) for the Royal Navy of Oman continued to advance and will sustain construction activity into late CY2016.
Austal entered into a contract with Caspian Marine Services from Azerbaijan to construct a 70 metre fast crew boat to service oil and gas exploration and production platforms operated by the State Oil Company of Azerbaijan and British Petroleum (BP).
The 30 knot, 150 passenger catamaran will be jointly built in Austal’s Philippines and Henderson shipyards with delivery expected in Australia in CY2016. The project will support deeper integration of supply chain and production activities between the two shipyards.
Philippines operations
The Philippines Operations completed the customisation of the 102 m trimaran ferry that was sold to Condor ferries in August 2014, completed construction of a 26 metre wind farm vessel which was delivered to the United Kingdom in the second quarter of FY2015 and substantially constructed two high speed crew transfer vessels for an oil and gas customer in the United Arab Emirates. Both vessels were contractually delivered to the customer post balance date.
The award of another two high speed crew transfer vessels added ~ US$25 million to the Philippines order book and provides contracted work through FY2016.
The award of four orders for high speed crew transfer vessels across the last two financial years demonstrates further diversification of Austal’s
customer markets and application of intellectual property to new products.
Philippines Operations continued to support Sustainment activities by providing personnel to undertake docking of Austal vessels in Europe.
The Philippines Operations are playing a pivotal role in cost optimisation of manufacturing activities within the Group by supplying sub-assemblies and components to Australia.
Components were manufactured and shipped from the Philippines to Australia during FY2015 and this approach is now a core element of the construction strategy for current vessel orders.
Austal is pursuing several credible leads with existing high speed vessel operators in Europe for large vehicle passenger ferries with a focus on green energy systems. The Philippines Operations is well established to exploit these market opportunities if they are realised.
Safety performance
Austal’s perpetual focus and leadership on safe people, safe practices and safe work environments is effective in promoting a culture that raises awareness of individual responsibility for safety and health and it instils safety as an accepted workplace practice and the way we do business.
Our goal of Zero Harm means no injuries to anyone, ever and whilst the target is aspirational, it remains a target to strive for.
The Shipbuilders Council of America (SCA) recognised Austal USA’s ongoing commitment to safety with an Award for Improvement in Safety for CY2014 recognising a year on year reduction in the total recordable incident rate of 10% or more.
The SCA is a US national trade association that represents 41 companies that own and operate over 120 shipyards across the USA.Austal reports safety performance in accordance with AS1885.1.
2015 2014
Year ended 30 June $'M $'M
Revenue 38.743$ 33.767$
EBIT 0.992 2.703
EBIT Margin 2.6% 8.0%
107.0
60.1 65.8
38.9
17.8 14.3 16.0 19.7 21.7 14.1
FY06 FY07 FY08 FY09 FY10 FY11 FY12 FY13 FY14 FY15Medical Treatment Injury Frequency Rate
(per million hours worked)
6.35 5.38
6.05 5.90
2.20 2.30 2.30
3.92 3.90
2.10
FY06 FY07 FY08 FY09 FY10 FY11 FY12 FY13 FY14 FY15
Lost Time Injury Frequency Rate(per million hours worked)
For
per
sona
l use
onl
y

9 | AUSTAL LIMITED ANNUAL REPORT 2015
Directors’ report
The Board of Directors of Austal Limited submit their report for the year ended 30 June 2015.
Directors
The names and details of the Company’s Directors in office during the financial year and until the date of this report are as follows. Directors were in office for this entire period unless otherwise stated.
John Rothwell AO – Non-Executive Chairman
With 40 years of experience in boat and shipbuilding, John has played a major role in the development of the Australian aluminium shipbuilding industry. He is the architect responsible for the establishment of Austal and was the Founding Managing Director. John identified markets for high speed ferries throughout Asia which resulted in Austal’s rapid growth. In 1998 he saw the potential for US Defence contracts for high speed aluminium naval ships and he led the formation of a new shipyard in Mobile, Alabama.
John was appointed an Officer of the Order of Australia (AO) in January 2004 for services to the Australian shipbuilding industry, and for significant contributions to vocational education and training. He was named “Australian Entrepreneur of the Year” by Ernst and Young in 2002 and he was awarded the WA Citizen of the Year in the category of Industry and Commerce in 1999.
John stepped down as Executive Chairman and Chief Executive Officer on 22 August 2008 to continue as Non-Executive Chairman after managing the Company for 20 years.
Dario Amara – Independent Director
Dario is a construction and engineering executive with extensive industry experience and networks gained over 33 plus years in the Australian and international markets, spanning the infrastructure, industrial and property sectors.
He has successfully operated as a CEO for over 16 years with John Holland Asia Limited, GRDMINPROC Limited (now of part AMEC plc), Emerson Stewart Group Limited which he founded and listed on the ASX within 30 months of launching and more recently as CEO of the POSCO-BGC E&C Joint Venture, an initiative to capture billion dollar plus resources projects.
Concurrent with his executive leadership roles he has successfully served as a Project Director or as Project Board Chairman on large and complex projects delivered by a variety of commercial models.
In addition Dario has served on several arts and cultural boards as Chairman on a pro bono basis for over 22 years and currently serves on the Murdoch University Art Collection Board.
He is a Civil Engineer with a Bachelor of Engineering (Distinction), a Fellow of the Institution of Engineers Australia, a Chartered Professional Engineer, on the National Professional Engineers Register and a Registered Building Practitioner and Contractor (Western Australia.)
Dario resigned as a Director on the 30 October 2014.
For
per
sona
l use
onl
y

10 | AUSTAL LIMITED ANNUAL REPORT 2015
Jim McDowell – Independent Director
Jim brings a strong, relevant industry background to Austal, with more than 30 years of experience in the defence and aerospace sectors. He was most recently Chief Executive Officer at BAE Systems Saudi Arabia operations. Prior to this, Jim was Chief Executive Officer at BAE Systems Australia where he oversaw a significant expansion of its operations.
Jim joined BAE Systems in 1996 and held senior management positions prior to his CEO roles. Before commencing at BAE Systems, Jim worked for 18 years at aerospace company Bombardier Shorts in legal, commercial, and marketing positions.
Jim left BAE Systems Saudi Arabia in 2013 to return to Australia. He has taken a strong interest in the continuing education sector, and is currently Chairman of the Australian Nuclear Science and Technology Organisation. Jim is a Non-Executive Director at Codan Limited. Jim is Chancellor elect of the University of South Australia.
Jim holds a Bachelor of Laws from the University of Warwick in England.
David Singleton – Independent Director
David brings a wealth of highly relevant business expertise and experience to Austal in both the defence and manufacturing and product support sectors.
David has held numerous senior roles with BAE Systems (formerly British Aerospace), which is one of the world’s largest defence companies. He served as Group Head of Strategy and Mergers & Acquisitions in London from 1997 to 1998 and again in 2003. In the intervening years, David was BAE’s Managing Director of Asset Management before spending three years in Rome as the Chief Executive Officer of Alenia Marconi Systems (AMS).
AMS was a European leader of naval warfare and air defence systems, C4I, ground and naval radars, naval command and control training systems and long term naval support.
David started his career with the UK Ministry of Defence and worked in research, development and manufacturing as well as senior management roles in Royal Ordnance which by then was part of BAE. He has also served as a member of the National Defence Industries Council in the UK, and as a Board member and Vice President (Defence) of Intellect, a leading trade association for the UK technology industry.
David is the CEO and Managing Director of Perth-based mineral exploration company Poseidon Nickel Limited. Prior to this role, he served as CEO and Managing Director of Clough Limited between 2003 and 2007. David is also a Non-Executive Director of Quickstep Holdings.
David was appointed to the Board of Directors of Austal Limited on 21 December 2011.
For
per
sona
l use
onl
y

11 | AUSTAL LIMITED ANNUAL REPORT 2015
Giles Everist – Independent Director
Giles has a breadth of experience with project and service based businesses gained over more than 25 years, working internationally in Australia, UK and Africa, largely in the resources, engineering and construction industries.
Giles was appointed as Non-Executive Director in November 2013. Giles is a qualified chartered accountant and was formerly the Chief Financial Officer and Company Secretary of Monadelphous Group Limited between 2003 and 2009. He has held senior financial executive roles with Rio Tinto in the United Kingdom and Australia, as well as major US design engineering Group Fluor Corp during his career.
Giles is currently a Non-Executive Director of Decmil Group Limited, LogiCamms Ltd and Macmahon Holdings Limited.
Andrew Bellamy BSc (Hons) Material Science, MA (Marketing) – Chief Executive Officer
Mr Bellamy commenced as CEO in February 2011 and has been instrumental in Austal’s emergence as a global defence prime contractor. Mr Bellamy is responsible for the Group’s worldwide operations and is a member of the Board of Austal Limited and the Board of Austal USA.
As CEO, Mr Bellamy has overseen the successful expansion of Austal’s largest shipyard in Mobile, Alabama, and developed and implemented strategies to ensure the efficient delivery of the Group’s multi-billion defence contracts for the US Navy – the Littoral Combat Ship and Joint High Speed Vessels.
Under Mr Bellamy’s leadership, Austal has successfully transitioned its Henderson, Western Australia shipyard away from commercial vessels to defence vessels, which has included the award of contracts such as the Cape Class Patrol Boat program for the Australian Government and high speed defence vessels for a naval customer in the Middle-East. He has also overseen the growth of Austal’s commercial vessel shipyard in the Philippines into a profitable operation and the positioning of Austal’s global service footprint.
Separately, Mr Bellamy has taken steps to strengthen Austal’s balance sheet, including a reduction in the Group’s debt and a focus on capital management across the business. This has provided Austal with the capacity to successfully and profitably deliver on its existing vessel programs and the ability to win additional work.
Mr Bellamy joined Austal in September 2008 as Head of Global Sales and Marketing. In this role, Mr Bellamy had responsibility for the Sales and Marketing function across all Austal’s international businesses, including the strategically significant US operations. In 2010, Mr Bellamy was appointed Chief Operating Officer of Austal’s Australian businesses and oversaw the growth and expansion of Austal’s international network of locations at a time of significant turbulence in global markets.
Previously, Mr Bellamy held senior positions within the Oil and Gas industry with Honeywell and ICI in North America, Europe, Middle East and Asia.
Mr Bellamy holds a BSc (Hons) in Materials Science from the University of Sunderland and an MA (Marketing) from the University of Lincoln and Humberside.
For
per
sona
l use
onl
y

12 | AUSTAL LIMITED ANNUAL REPORT 2015
Interests in the shares and options of the company and related bodies corporate
The interests of the Directors in the shares of Austal Limited at the date of this report were as follows:
^This represents options granted from the Employee Option Share Plan (ESOP) (refer to Note 30 of the financial statements). There were no additional ordinary shares issued or options granted to Directors and exercised between the balance date and the date of this report.
^^This represents performance rights granted from the Long Term Incentive Plan (LTIP) (refer to Note 30 of the financial statements).
Principal activities
The principal activities during the year of entities within the consolidated entity were the design, manufacture and support of high performance aluminium vessels. These activities are unchanged from the previous year.
Results
The net profit after tax of the consolidated entity for the financial year was $53.156 million after income tax (FY2014: $31.859 million).
Review of operations
A review of the operations and financial position of the consolidated entity is outlined in the Review of Operations on page 7.
Dividends
A dividend of 1 cent per share was paid after the FY2015 half year results (FY2014 Half year: Nil) and a further dividend of 3 cents per share has been proposed for FY2015 (FY2014: Nil).
Significant events after the balance date
A fully franked dividend of 3 cents per share (FY2014: Nil) has been proposed.
Likely developments and future results
A general discussion of the Group outlook is included in the Chairman’s Report on page 3 and the Review of Operations on page 7.
Significant changes in the state of the affairs
There were no significant changes to structure or operations of the Group during the financial year.
NumberDirector Ordinary Shares Options^ Performance Rights^^
John Rothwell 32,200,745 - -
Andrew Bellamy 478,474 280,000 666,703
Dario Amara - - -
David Singleton 28,600 - -
Giles Everist 20,000 - -
Jim McDowell - - -
For
per
sona
l use
onl
y

13 | AUSTAL LIMITED ANNUAL REPORT 2015
Environmental regulation and performance
The Group has a policy of at least complying with, but in most cases exceeding, environmental performance requirements. No environmental breaches have been notified by any Government Agency during the year ended 30 June 2015.
Share options and performance rights
There were 9,392,329 un-issued ordinary shares under options and 1,049,022 un-vested performance rights at the date of this report. Refer to Note 30 for further details of the options outstanding. There were no options exercised or performance rights that had vested during the year.
Indemnification and insurance of Directors and officers
An indemnity agreement has been entered into between the parent entity and each of the Directors named in this report. Under the agreement, the company has agreed to indemnify those Directors against any claim to the extent allowed by the law, for any expenses or costs which may arise as a result of work performed in their respective capacities.
The parent entity has paid premiums during the financial year in respect of a contract insuring the Directors and officers of the Group in respect of liability resulting from these indemnities. The terms of the insurance arrangements and premiums payable are subject to a confidentiality clause.
Indemnification of auditors
The parent entity has agreed to indemnify its auditors, Ernst & Young, to the extent permitted by law, as part of the terms of its audit engagement agreement against claims by third parties arising from the audit (for an unspecified amount). No payment has been made to indemnify Ernst & Young during or since the financial year.
Directors’ meetings
The number of meetings of Directors (including meetings of committees of Directors) held during the year and the number of meetings attended by each Director was as follows:
Meeting
Nomination &
Austal Limited Audit & Risk Remuneration
Board Committee Committee
Number of meetings held 6 4 3
Number of meetings attended:
John Rothwell 6 - 3
Andrew Bellamy 6 - -
Dario Amara 1 2 1 -
David Singleton 6 3 3
Giles Everist 6 4 3
Jim McDowell 2 3 2 -
1. Dario Amara retired as a director of the Company (and Chairman of the Audit & Risk Committee) on 30 October 2014. Giles Everist replaced him as
Chairman of the Audit & Risk Committee.
2. Jim McDowell was appointed as a director on 31 December 2014 and has attended all Board meetings since his appointment. He joined the
Audit & Risk Committee in February 2015 and has attended all Audit & Risk Committee meetings since his appointment.For
per
sona
l use
onl
y
14 | AUSTAL LIMITED ANNUAL REPORT 2015
Committee membership
The Company has an Audit and Risk Committee and a Nomination and Remuneration Committee of the Board of Directors.
Members acting on the committees of the Board during the year were:
Audit and Risk Nomination and Remuneration
Dario Amara 2 David Singleton 1 Giles Everist 1 Giles Everist David Singleton John Rothwell Jim McDowell 1. Designates the Chairman of the committee. 2. Designates resigned during the year Rounding
The amounts contained in this report and in the financial report have been rounded to the nearest $1,000 (where rounding is applicable) under the option available to the Company under ASIC Class Order 98/0100. The Company is an entity to which the Class Order applies.
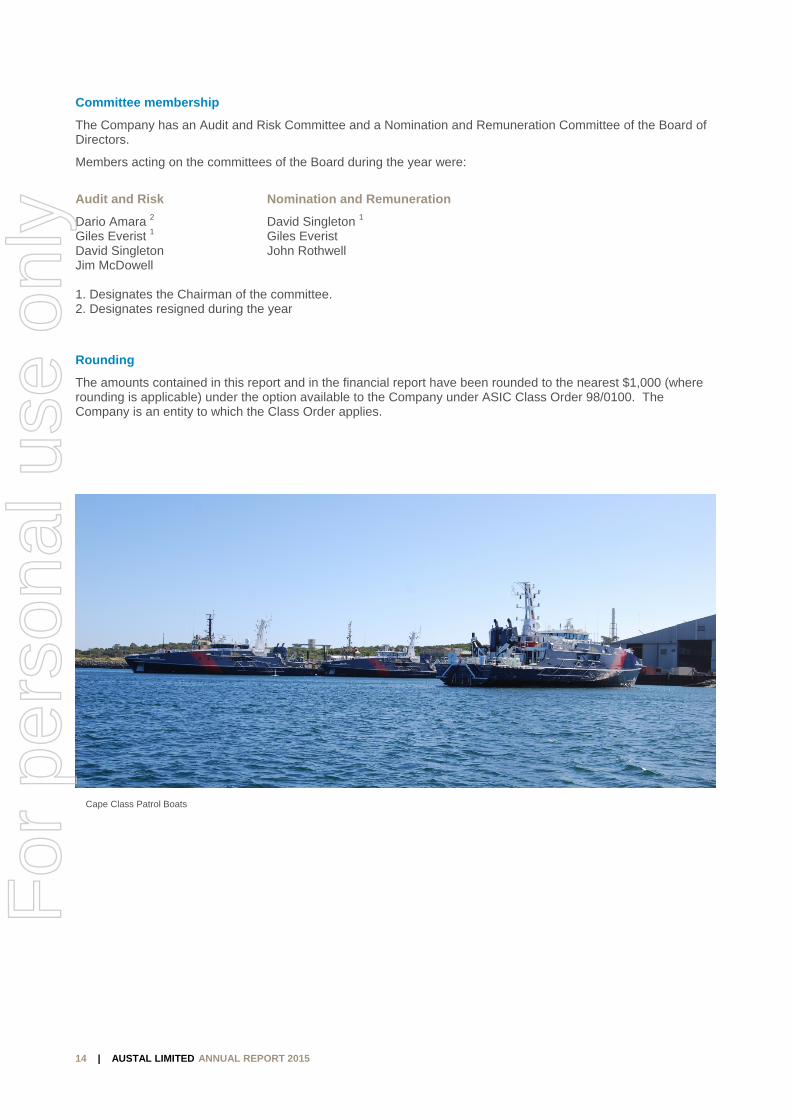
Cape Class Patrol Boats
For
per
sona
l use
onl
y
15 | AUSTA
Remune This RemunCompany anregulations. The Remune
1. Mess
2. Perso
3. Remu
I. II. III. IV.
4. Execu
I. II. III. IV.
5. Non-E
I. II. III. IV.
6. Remu
7. Equity
I. II. III. IV. V. VI. VII.
8. Group
9. Other
I. II. III. IV. V.
AL LIMITED ANN
eration Re
eration Repond the Group This informat
eration Repo
age from the
ons covered b
uneration gov
Nomination Share TradinExecutive RRemuneratio
utive KMP rem
Structure ....Base RemunShort Term Long Term I
Executive Dir
Application .RemuneratioFees ...........No terminati
uneration of K
y instruments
FY2012 OptFY2014 PerFY2015 PerFY2016 PerShare rightsOptions andShareholdin
p Performanc
r related matt
Board compDetails of coLoans to KMOther transaUse of Indep
NUAL REPORT
eport
ort for the yeain accordanc
tion has been
rt is presente
Nomination &
by this report
vernance fram
& Remunerating Policy ......
Remuneration Con Framework
muneration p
.....................neration KMP Incentive (STIncentive (LTI)
rector remune
.....................on structure .......................ion benefits ...
KMP ..............
s held by KMP
tions vesting drformance Rigrformance Rigrformance Rigs granted durind rights holdinggs .................
ce ..................
ters ...............
position ..........ontractual provMP .................actions with KMpendent Remu
2015
ar ended 30 Jce with the ren audited as r
ed under the f
& Remunerat
....................
mework and s
ion Committee......................Consultant Enk ....................
policy ............
...........................................
I) Plan Policy .) Plan Policy ..
eration ..........
......................
......................
......................
......................
.....................
P ..................
during the perihts Vesting ....hts Grant .......hts Grant .......ng the period .gs ........................................
.....................
.....................
......................visions for KM......................MP ................uneration Con
une 2015 outequirements orequired by se
following sect
tion Committe
....................
strategy ........
e Charter ............................ngagement Po......................
....................
......................
......................
......................
......................
....................
......................
......................
......................
......................
....................
....................
iod .....................................................................................................................................................
....................
....................
......................MP ..................
......................
......................nsultants ........
tlines the remof the Corporaection 308(3C
tions:
ee (NRC) ......
.....................
.....................
.....................
.....................olicy ....................................
.....................
.....................
.....................
.....................
.....................
.....................
.....................
.....................
.....................
.....................
.....................
.....................
.....................
.....................
.....................
.....................
.....................
.....................
.....................
.....................
.....................
.....................
.....................
.....................
.....................
.....................
muneration arrations Act 200C) of the Act.
.....................
.....................
.....................
......................
......................
......................
......................
.....................
......................
......................
......................
......................
.....................
......................
......................
......................
......................
.....................
.....................
......................
......................
......................
......................
......................
......................
......................
.....................
.....................
......................
......................
......................
......................
......................
rangements o01 (the Act) a
....................
....................
....................
......................
......................
......................
......................
....................
......................
......................
......................
......................
....................
......................
......................
......................
......................
....................
....................
......................
......................
......................
......................
......................
......................
......................
....................
....................
......................
......................
......................
......................
......................
of the and its
................ 16
................ 17
................ 18
................. 18
................. 18
................. 18
................. 19
................ 19
................. 19
................. 20
................. 22
................. 23
................ 25
................. 25
................. 25
................. 25
................. 25
................ 26
................ 27
................. 27
................. 27
................. 28
................. 29
................. 30
................. 30
................. 30
................ 31
................ 31
................. 31
................. 31
................. 31
................. 32
................. 32
6
7
8
8 8 8 9
9
9 0 2 3
5
5 5 5 5
6
7
7 7 8 9 0 0 0
2 2
For
per
sona
l use
onl
y

16 | AUSTA
1. Messag
Dear Shareh
Austal has e(KMP) remucompleted inphased out.
The NRC halast financialoutcomes frothat all of theorder to carrand major inalso commisfrom last yea
The NRC reand in one oused its conin the fast fetime deliverevessels on tithe only foreis commentein demandinequally high
The focus foof global roleto judge basthe Australiathis group, wincentive eleensures thatfor the longe
The remuneand are beinimplementedthe impact th
The CommitCommittee wArabia and pbusiness. Tboth now anbusiness, hacontribution
The Board aefforts of thestakeholderslooks forwar
Yours sincer
David Single
Chairman, N
AL LIMITED ANN
ge from the
holder,
embarked uponeration gove
n FY2016, alt
as been focusl year. The foom the impleese are propery out this actnstitutional invssioned detaiar.
cognises thatof the most tesiderable inte
erry and work er of vessels ime and to sp
eign owned deed on at lengtng markets wi
quality indivi
or Austal is to es and sharese pay againsan market haswe have also ement of pay t a focus on aer term succe
eration report ng implementd and the Comhis is having o
ttee is also rewelcomes Jimprior to that w
The appointmend in the futuras a unique, dbeyond that w
appreciates the Board to revs and engagerd to the conti
rely,
eton
Nomination an
NUAL REPORT
Nomination
on a two yearernance, policthough it may
ssed on revieocus has beementation of erly aligned totivity, the Comvestors followled analysis f
t Austal is a schnically dem
ellectual propboat industryto the Austrapecification. Tesigner and cth in this repoth highly sopduals who ar
ensure that eholder expec
st a peer grous few peers todeemed it apis calibrated
achieving streess of the com
describes theed during themmittee’s atteon the compa
esponsible form McDowell towas the CEO oent recognisere. The Commdetailed and ewhich would
he continued view and impe with their vieinued suppor
nd Remunera
2015
& Remunera
r journey to fucies and prac
y take somew
wing a numben primarily onthe Long Tero positive shammittee has tawing the publicfrom an Indep
sophisticated manding induserty predominy in to the wolian federal gThese capabconstructor ofort. The signihisticated cus
re selected, s
executive paytations increa
up of industriao Austal. Whppropriate to mat the 75th pe
etching short tmpany is main
e progressivee FY2016 yeaention will focany performa
r nominationso the Board. of BAE Systees the continumittee continuessential insigbe deemed a
and strong surove remunerews, as well art of sharehold
ation Committ
ation Comm
ully review, rectices. This p
what longer fo
ber of areas on executive arm Incentive (areholder outcaken inputs fcation of last pendent Rem
business thastries in the wnantly in alum
orldwide Defegovernment pbilities have crf frontline andificance of thistomers and
supported and
y and incentivasingly set byal and servicehilst we have move towardsercentile of thterm targets ntained.
e changes thaar. We now bcus on the tarance.
s which includJim was mos
ems, Australiaued and increues to suppoght into the bas normal.
upport of sharation governas noting the ders for the R
tee
ittee (NRC)
ecalibrate andprocess begar all the chan
f policy impleand non-exec(LTI) and Shocomes using from several pyear’s remun
muneration Ex
at operates froworld. The cominium multi hnce industry. roducing, moreated the plad support vess is that the Atherefore its
d remunerate
ve schemes ty a comparisoe sector compset a base pas a structure e peer groupis achieved w
at have been believe that mrgets being se
de for the Boast recently thea which includeased emphasrt the compan
business and
areholders at tnance and pra
excellent perRemuneration
d align key man in FY2015, ges to be evi
ementation in utive remuneort Term Inceclear and cha
parties, includneration reporpert which fu
om Australia aompany, in thhulled vessels Austal has b
ost recently, thatform on whisels for the UAustal busineleadership md accordingly
read a fine linon to the broapanies of a simay guideline awhere the lon. We believe
whilst ensuring
reviewed durmuch of the stret and measu
ard and the Ce CEO of BAEdes its shipbusis of Defencny Chairman continues to
the 2014 AGMactices, and torformance of
n Report reso
anagement p and is expecident as old p
the companyeration, reviewntive plans aallenging objeding from prort. The Comm
urther built on
across a globhe last few yes, to build on been a reliablhe new Capeich Austal hasUS Navy, a mess now operaust be drawn
y.
ne between thader market. milar size, acat the 50th perng and short
e that this strug that critical
ring the last fiructural chanured for its ex
Chairman. ThE Systems inuilding and suce in Austal’s who, as a foumake a signi
M. Given the o consult withthe Companylution at the 2
personnel cted to be practices are
y during the wing nd ensuring ectives. In xy advisers mittee has the inputs
bal footprint ars, has its position
le and on e Class s become
matter which ates globally, from
he demands Our policy is
ccepting that rcentile of term
ucture positioning
inancial year ge has been
xecutives and
his year the n Saudi upport business under of the ficant
significant h y, the Board 2015 AGM.
d
For
per
sona
l use
onl
y

17 | AUSTAL LIMITED ANNUAL REPORT 2015
Remuneration report (audited)
2. Persons covered by this report This report covers all Key Management Personnel (KMP) as defined in the Accounting Standards, including all Directors, as well as those Executives who have specific responsibility for planning, directing, and controlling material activities of the Group.
The KMP for the year ended 30 June 2015 were as follows:
Executive Directors
Mr Andrew Bellamy Chief Executive Officer and Managing Director since February 2011
Executives with no Director duties
Mr Greg Jason Group Chief Financial Officer since January 2013
Mr Brian Leathers Chief Financial Officer USA since February 2008
Mr Craig Perciavalle President USA since November 2012
Mr Joselito Turano President Philippines since December 2012
The following person ceased to be executive KMP of Austal during FY2015:
Mr Graham Backhouse President Australia until April 2015
Non-Executive Directors
Mr John Rothwell Chairman since 1998
Member of the Nomination & Remuneration Committee since December 1998
Mr David Singleton Independent non-executive director since December 2011
Chairman of the Nomination & Remuneration Committee since September 2012
Member of the Audit & Risk Committee since February 2012
Mr Giles Everist Independent non-executive director since November 2013
Chairman of the Audit & Risk Committee since October 2014
Member of the Nomination & Remuneration Committee since February 2014
Mr Jim McDowell Independent non-executive director since December 2014
Member of the Audit & Risk Committee since February 2015
The following person ceased to be a non-executive director during FY2015:
Mr Dario Amara Independent, non-executive director until October 2014
For
per
sona
l use
onl
y

18 | AUSTAL LIMITED ANNUAL REPORT 2015
3. Remuneration governance framework and strategy
I. Nomination & Remuneration Committee Charter
The role and responsibilities of the committee are outlined in the Austal Nomination & Remuneration Committee Charter (the Charter), which is available on the Austal Website.
The role of the Nomination & Remuneration Committee is to ensure that appropriate remuneration policies are in place which are designed to meet the needs of the Company and to enhance corporate and individual performance.
The Committee also oversees the implementation of the policies in setting remuneration and performance objectives related to the STI and LTI plans.
The remit of the Nomination & Remuneration Committee also includes succession planning and a significant development in this area has been led by the CEO and overseen by the Board.
The Committee has overseen a significant renewal of the Board as the company enters into a new phase of its development with two new non-executive Directors appointed over the last 19 months.
Under the Charter, the Nomination & Remuneration Committee is to be composed of at least three members with the majority being independent directors.
II. Share Trading Policy
The Share Trading Policy of Austal is available on the Austal website. It contains the standard references to insider trading restrictions that are a legal requirement under the Corporations Act, as well as conditions associated with good corporate governance. To this end the policy specifies “Closed Periods” during which “Restricted Persons” must not trade in the securities of the Company, unless written permission is provided by the Board following an assessment of the circumstances.
All equity based remuneration awards which have vested are subject to the Group’s Share Trading Policy.
III. Executive Remuneration Consultant Engagement Policy
Austal has adopted an executive remuneration consultant (ERC) engagement policy which is intended to manage the interactions between the Company and ERCs. This is intended to ensure independence of advice and ensure that the Nomination & Remuneration Committee has clarity regarding the extent of any interactions between management and the ERC. This policy enables the Board to state with confidence that advice received has been independent. The Policy states that ERCs are to be approved and engaged by the Board before any advice is received and that such advice may only be provided to a non-executive director. Any interactions between management and the ERC must be approved and overseen by the Nomination & Remuneration Committee, this includes the collection of factual internal records (e.g. superannuation paid or allowances and benefits etc.).
For
per
sona
l use
onl
y

19 | AUSTAL LIMITED ANNUAL REPORT 2015
IV. Remuneration Framework
Austal is committed to responsible remuneration practices. The need to reward the Company’s employees fairly and competitively based on performance needs to be balanced with the requirement to do so within the context of principled behaviour and action, particular in the area of safety, risk, compliance and control.
Remuneration should contribute to the Group’s achievements in a way that supports the Group’s culture and goals. The Remuneration Policy Framework set out below summarises the key features of the Group’s remuneration approach.
4. Executive KMP remuneration policy
I. Structure
The following outlines the policy that applies to executive KMP and executive directors:
Total Remuneration Packages (TRP) should be composed of:
Base Package (inclusive of superannuation, allowances, benefits and any applicable fringe benefits tax (FBT) as well as any salary sacrifice arrangements)
Short term incentive (STI) which provides a reward for performance against annual objectives
Long term incentive (LTI) which provides an equity-based reward for performance against indicators of shareholder benefit or value creation, over a three year period
Internal TRP relativities and external market factors should be considered
TRPs should be structured with reference to market practices and the particular circumstances of the Company where appropriate.
Our Vision:
Maintain a responsible, performance-based Remuneration Policy that is aligned with the long-term interests of our shareholders.
Our Goal:
Strike the right balance between meeting shareholders' expectations, paying our employees competitively, and responding appropriately to the regulatory environment.
Our Approach:
Governance Individual Remuneration Individual Remuneration Remuneration StructureDetermination and Instruments
Principles: Principles: Principles: Principles:
Clearly defined and documented governance procedure
Independent Remuneration Committee
Independent Remuneration Consultant
Annual assessment of Remuneration Policy
Reward Group annual performance measured relative to its planned key performance indicators
Business performance aligned
Recognize and reward teamwork and development of the culture of the organisation
Award and differentiate based on individual performance and contributions.
Total Remuneration based approach
Facilitate competitiveness by paying competitive remuneration levels for comparable roles and experience, subject to performance
Promote meritocracy by recognizing individual performance, with a particular emphasis on contribution, ethics and safety
Equal remuneration opportunity
Provide the appropriate balance of fixed and variable remuneration consistent with the position and role in the Group
Significant portion of variable remuneration deferred and aligned with the long-term performance of the Group
Promote ethical behaviour and do not create incentives to expose the Group to inappropriate risk
For
per
sona
l use
onl
y

20 | AUSTAL LIMITED ANNUAL REPORT 2015
II. Base Remuneration KMP
Base Packages should be set with reference to the market practice of ASX listed companies at the P50* level.
TRPs at Target bonus levels (being the Base Package plus incentive awards intended to be paid for targeted levels of performance) should be set in the P50 to P75 range of the relevant market practice to create a strong incentive to achieve targeted objectives in both the short and long term.
Remuneration will be managed within a range to allow for the recognition of individual differences such as individual experience, knowledge or competency with which they fulfil a role (a range of +/- 20% is generally targeted in line with common market practices).
The Base Packages of the KMP executives fall within or below the P50 +/- 20% policy range. Adjustments to some individuals will be made over a 2 year period to bring them into line in some cases where remuneration of the KMP falls below the target.
* The term P50 refers to the median where 50% of the comparator group are above the level and 50% are below.
i. Base Remuneration – CEO
The structure of Base Remuneration for the CEO has been changed during FY2015.
The previous structure provided for the following base remuneration for the CEO:
Fixed cash remuneration Fixed share based remuneration equal to 30% of the Fixed cash remuneration payable
twice per annum based on the volume weighted average closing price of ASB shares in each 6 month period.
The Board resolved to amend the previous structure with effect from 1 January 2015 to simplify the Fixed remuneration structure. These changes reflect general market practice and more effectively align the CEO’s remuneration with stakeholder comments received last year.
A new base remuneration consisting solely of cash was set post year end for the period 1 January 2015 to 30 June 2015 which is equal to the previous Fixed cash remuneration plus the cash equivalent of the Fixed share based remuneration. This structure will be maintained in the FY2016 financial year.
ii. Peer group benchmarking
Austal has undertaken a detailed benchmarking of its remuneration levels and structure throughout the KMP comparing to a relevant benchmark group with the assistance of its ERC:
The benchmark group is composed of 20 companies (listed below) with 10 companies larger and 10 companies smaller than Austal’s market capitalisation
The group is limited to the Industrial & Service Sector (excludes, energy, resources, materials and financials which tend to have different remuneration structures to the Industrial & Service sector)
The group is limited to companies with approximately one half to double the market capitalisation of the Austal (noting that the Australian listed market is small making it challenging to select a relevant group of companies that are similarly sized)
Companies that are most comparable in terms of industry sector and market shall be preferentially included
For
per
sona
l use
onl
y

21 | AUSTAL LIMITED ANNUAL REPORT 2015
iii. Peer group list of companies
The results of the FY2015 peer group analysis for CEO remuneration as presented by Austal’s ERC is depicted in the table below and compared to that actually paid to the Austal CEO.
The Remuneration and Nomination Committee formed the following conclusions from the assessment of Base Packages undertaken in FY2015:
The CEO's Base Package (inclusive of salary sacrificed equity) fell within the Company's policy range of P50 +/- 20%, based on the benchmark described above.
No change will be made to the CEO's Base Package in FY2016 on the basis that the base remuneration is at the upper end of the P50 + 20%.
Company Industry Group
McMillan Shakespeare Limited Industrials
Monadelphous Group Limited Industrials
APN News and Media Limited Consumer
Transfield Services Limited Industrials
GWA Group Limited Industrials
iSentia Group Limited Information Technology
Bega Cheese Limited Consumer
Amcom Telecommunications Limited Telecommunication Services
ERM Power Limited Utilities
Vocus Communications Limited Telecommunication Services
Credit Corp Group Limited Industrials
Tassal Group Limited Consumer Discretionary
NEXTDC Limited Information Technology
Tox Free Solutions Limited Industrials
UGL Limited Industrials
Bradken Limited Industrials
Skilled Group Limited Industrials
Programmed Maintenance Services Ltd Industrials
Collection House Limited Industrials
Ruralco Holdings Limited Consumer Discretionary
Peer Group Results
Component Percentile Austal CEO
25 50 75 FY2015
Base Remuneration 628,000$ 906,000$ 1,316,000$ 1,051,347$
Total Remuneration Package 1,259,000$ 1,654,000$ 2,102,000$ 1,492,451$
For
per
sona
l use
onl
y

22 | AUSTAL LIMITED ANNUAL REPORT 2015
III. Short Term Incentive (STI) Plan Policy
The short term incentive policy of the Company dictates that an annual component of the KMP executives’ remuneration will be aligned to the individual and Company performance. The principles of the plan are that
STI should be aligned with clear and measurable targets which are set at the start of the financial year. Targets will be aligned with the achievement of the company’s business plan.
The STI should be paid in cash.
The STI should have a weighting in the remuneration mix that is no greater than the LTI to ensure an adequate balance in focus between short and long term objectives.
STI payments will be made at the end of the financial year and after the full year accounts have been approved by the Board.
The Board undertook a review of the Austal STI policy during FY2015 through the Remuneration and Nomination Committee by requesting a benchmarking review to be undertaken by its ERC. The report recommended that the STI scheme should become a bigger component of both the CEO’s and KMPs’ annual remuneration but that performance targets at the threshold payout level should become more challenging. These recommendations were based on rigorous benchmarking against similar companies and were adopted by the Board and are outlined in this report below.
i. Purpose
The purpose of the STI Plan is to incentivise Senior Executives to deliver and outperform key performance indicators (KPIs) and annual business plans. This is intended to lead to sustainable superior returns for shareholders and to modulate the cost of employing Senior Executives, such that the cost of employment reflects the performance of the company.
ii. Measurement Period
The measurement period for STI awards is aligned with the financial year of the Group.
iii. Key Performance Indicators
KPIs are customised for each KMP and reflect the nature of their roles, whilst creating shared objectives where appropriate.
Weightings are applied to the KPIs selected for each participant to reflect the relative importance of each KPI.
KPIs set for the CEO in FY2015 were as follows:
Relative Performance STI
Key Performance Indicator Weight Achieved Estimated
FY2015 Group EBIT 23.3% 100.0% 23.3%
FY2015 Group Net Cash Flow 23.3% 100.0% 23.3%
FY2015 Group New Vessel Orders 23.3% 100.0% 23.3%
Group Strategy Development & Execution 20.0% 66.7% 13.3%
Implementation of Business Improvement Initiatives 10.0% 66.7% 6.7%
Total 100.0% 90.0% 90.0%
For
per
sona
l use
onl
y

23 | AUSTAL LIMITED ANNUAL REPORT 2015
iv. Target and maximum award
Target and maximum awards are applied to base remuneration. The Board retains discretion in the application of the STI scheme to ensure that outcomes match overall Group achievement and can defer payments where it believes this to be appropriate.
IV. Long Term Incentive (LTI) Plan Policy
The long term incentive plan policy of the Company is that an annual component of remuneration of executives should be at-risk and based on equity in the Company. This is intended to ensure that executives hold a stake in the Company and to align their interests with those of shareholders.
The board undertook a review of the LTI plan following its initial 2 years of operation and implemented a number of changes. The purpose was to ensure that the scheme continued to drive long term executive performance as well as meet normal industry practice. Notable changes were made to award levels which are depicted in section ix on page 24 and the Total Shareholder Return (TSR) measure has been changed from an absolute TSR to an indexed TSR (iTSR) following market feedback as described in section v on page 23 and amended weighting of performance measures from TSR 30% / ROIC 70% to iTSR 40% / ROIC 60%. i. Purpose
The purpose of the LTI Plan is to incentivise Senior Executives to deliver Group performance that will lead to sustainable superior returns for shareholders and to modulate the cost of employing Senior Executives.
ii. Form of incentive
The LTI should be based on Performance Rights that vest based on an assessment of performance against objectives. No dividends are payable or accrued on Performance Rights which are unvested.
iii. Measurement period
The Company instituted a transitional arrangement for the LTI scheme for FY2014 and FY2015 performance rights grants which was explained in the FY2014 Annual Report.
The standard measurement period from FY2016 onwards will be three years.
iv. Measures of long term performance
The Company will use two long term performance measures:
TSR which the Board believes best reflects internal measures of performance ROIC which the Board believes best reflects external measures of performance
v. Total Shareholder Return Measure (TSR)
The Board believes that TSR is the measure that has the strongest alignment with shareholders. It is recognised however that absolute TSR is influenced by overall economic movements, and therefore future grants of LTI will be offered to executives that vest based on indexed TSR (iTSR).
iTSR determines the shareholders returns of Austal relative to the market rather than capturing the absolute performance of the Group.
FY2015 FY2016Position Incumbent Target Maximum Estimated1 Forfeited Target Maximum
CEO Mr Andrew Bellamy 33% 50% 45% 5% 50% 100%
Group Chief Financial Officer Mr Greg Jason 20% 30% 27% 3% 30% 60%
President USA Mr Craig Perciavalle 40% 60% 5% 55% 30% 60%
Chief Financial Officer USA Mr Brian Leathers 30% 45% 4% 41% 30% 60%
President Australia Mr Graham Backhouse 2 20% 30% 30% 0% N/A N/A
President Philippines Mr Joselito Turano 20% 30% 8% 22% 15% 30%
1. The final STI for FY2015 will be paid to KMP in FY2016.2. Mr Graham Backhouse resigned on 21 April 2015
For
per
sona
l use
onl
y

24 | AUSTAL LIMITED ANNUAL REPORT 2015
A relative peer group TSR was considered however it was not possible to identify a comparator group of companies that was statistically robust enough to be meaningful. The Board was concerned that this would undermine the link between executive performance and reward outcomes and therefore decided to adopt the iTSR measure.
iTSR will apply to future grants of LTI from FY2016 based on a comparison of Austal’s TSR against the S&P All Ordinaries Accumulation index “XAOAI”.
vi. Return on Invested Capital Measure (ROIC)
Senior Executives are faced with significant and long term business development and project based challenges. Therefore, the LTI is also linked to the achievement of ROIC growth objectives that will lead to value creation for shareholders. This measure is considered the best measure of long term performance from an internal perspective by recognising the long term nature of investment in fixed assets necessary in a shipbuilding business.
ROIC is calculated by dividing the Net operating profit after tax by Net Assets (excluding Cash, Debt, Derivatives and Tax Accounts).
Actual ROIC results are compared against internal targets set by the Board.
vii. Vesting of Performance Rights
The Performance Rights for each employee vest at the end of the measurement period, subject to meeting the performance hurdles.
viii. Holding period
A one year holding period applies to shares that are awarded as a result of Performance Rights vesting.
ix. Target and maximum award
Target and maximum awards are applied to base remuneration.
FY2015 Grant Vesting FY2016 Grant VestingPosition Incumbent Target Maximum Target Maximum
CEO Mr Andrew Bellamy 25.0% 50.0% 50.0% 100.0%
Group Chief Financial Officer Mr Greg Jason 17.5% 35.0% 35.0% 70.0%
President USA Mr Craig Perciavalle 17.5% 35.0% 35.0% 70.0%
Chief Financial Officer USA Mr Brian Leathers 17.5% 35.0% 20.0% 40.0%
President Australia Mr Graham Backhouse 1 17.5% 35.0% N/A N/A
President Philippines Mr Joselito Turano 17.5% 35.0% 20.0% 40.0%
1. Mr Graham Backhouse resigned on 21 April 2015
For
per
sona
l use
onl
y

25 | AUSTAL LIMITED ANNUAL REPORT 2015
5. Non-Executive Director remuneration
I. Application
The Non-executive Director Remuneration Policy applies to non-executive directors (NEDs) of the Company in their capacity as directors and as members of committees.
II. Remuneration structure
Remuneration is composed of:
Board fees Committee fees Superannuation Other benefits (if appropriate)
III. Fees
i. Fee cap
Remuneration will be managed within the aggregate fee limit (AFL) or fee pool approved by shareholders of the Company which is currently $3,000,000.
ii. Chairman
Remuneration for the current Chairman of the Board reflects his continued high level of contribution to the company and the Board. The fee level is reviewed every year and has been reduced from $300,000 to $250,000 per annum effective from 1 February 2015.
iii. Non-executive director fees
Board fees paid for membership of the Board, inclusive of superannuation and exclusive of committee fees will be set with reference to the 50th percentile of the market of comparable ASX listed companies (as previously described for executive remuneration).
iv. Committee fees
Committee fees recognise additional contributions to the work of the Board by members of committees. They are similarly referenced to the benchmark group as above.
IV. No termination benefits
Termination benefits are not paid to NEDs by the Company.
For
per
sona
l use
onl
y
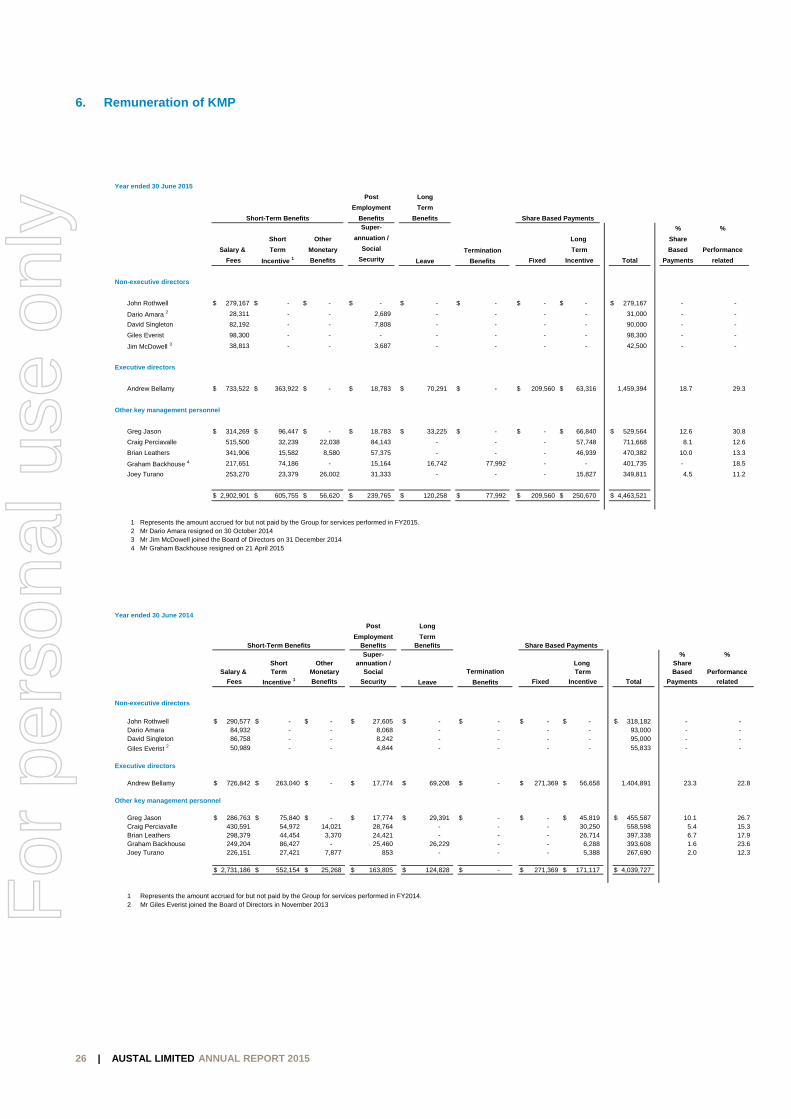
26 | AUSTAL LIMITED ANNUAL REPORT 2015
6. Remuneration of KMP
Year ended 30 June 2015
Post Long
Employment Term
Short-Term Benefits Benefits Benefits Share Based PaymentsSuper- % %
Short Other annuation / Long Share
Salary & Term Monetary Social Termination Term Based Performance
Fees Incentive 1 Benefits Security Leave Benefits Fixed Incentive Total Payments related
Non-executive directors
John Rothwell 279,167$ - $ - $ - $ - $ - $ - $ - $ 279,167$ - -
Dario Amara 2 28,311 - - 2,689 - - - - 31,000 - -
David Singleton 82,192 - - 7,808 - - - - 90,000 - -
Giles Everist 98,300 - - - - - - - 98,300 - -
Jim McDowell 3 38,813 - - 3,687 - - - - 42,500 - -
Executive directors
Andrew Bellamy 733,522$ 363,922$ - $ 18,783$ 70,291$ - $ 209,560$ 63,316$ 1,459,394 18.7 29.3
Other key management personnel
Greg Jason 314,269$ 96,447$ - $ 18,783$ 33,225$ - $ - $ 66,840$ 529,564$ 12.6 30.8
Craig Perciavalle 515,500 32,239 22,038 84,143 - - - 57,748 711,668 8.1 12.6
Brian Leathers 341,906 15,582 8,580 57,375 - - - 46,939 470,382 10.0 13.3
Graham Backhouse 4 217,651 74,186 - 15,164 16,742 77,992 - - 401,735 - 18.5
Joey Turano 253,270 23,379 26,002 31,333 - - - 15,827 349,811 4.5 11.2
2,902,901$ 605,755$ 56,620$ 239,765$ 120,258$ 77,992$ 209,560$ 250,670$ 4,463,521$
1 Represents the amount accrued for but not paid by the Group for services performed in FY2015. 2 Mr Dario Amara resigned on 30 October 20143 Mr Jim McDowell joined the Board of Directors on 31 December 20144 Mr Graham Backhouse resigned on 21 April 2015
Year ended 30 June 2014
Post Long
Employment TermShort-Term Benefits Benefits Benefits Share Based Payments
Super- % %Short Other annuation / Long Share
Salary & Term Monetary Social Termination Term Based Performance
Fees Incentive 1 Benefits Security Leave Benefits Fixed Incentive Total Payments related
Non-executive directors
John Rothwell 290,577$ - $ - $ 27,605$ - $ - $ - $ - $ 318,182$ - - Dario Amara 84,932 - - 8,068 - - - - 93,000 - - David Singleton 86,758 - - 8,242 - - - - 95,000 - -
Giles Everist 2 50,989 - - 4,844 - - - - 55,833 - -
Executive directors
Andrew Bellamy 726,842$ 263,040$ - $ 17,774$ 69,208$ - $ 271,369$ 56,658$ 1,404,891 23.3 22.8
Other key management personnel
Greg Jason 286,763$ 75,840$ - $ 17,774$ 29,391$ - $ - $ 45,819$ 455,587$ 10.1 26.7 Craig Perciavalle 430,591 54,972 14,021 28,764 - - - 30,250 558,598 5.4 15.3 Brian Leathers 298,379 44,454 3,370 24,421 - - - 26,714 397,338 6.7 17.9 Graham Backhouse 249,204 86,427 - 25,460 26,229 - - 6,288 393,608 1.6 23.6 Joey Turano 226,151 27,421 7,877 853 - - - 5,388 267,690 2.0 12.3
2,731,186$ 552,154$ 25,268$ 163,805$ 124,828$ - $ 271,369$ 171,117$ 4,039,727$
1 Represents the amount accrued for but not paid by the Group for services performed in FY2014. 2 Mr Giles Everist joined the Board of Directors in November 2013F
or p
erso
nal u
se o
nly

27 | AUSTAL LIMITED ANNUAL REPORT 2015
7. Equity instruments held by KMP
I. FY2012 Options vesting during the period
i. FY2012 Options Grant
280,000 options were granted to KMP in FY2012, who were still employed by Austal at 30 June 2015.
Further information on the options is set out in Note 30
ii. Options vesting
KMP Options from the FY2012 grant that vested in FY2015 are detailed below.
II. FY2014 Performance Rights Vesting
i. FY2014 Performance Rights Grant
789,085 performance rights were granted to KMP in FY2014, who were still employed by Austal at 30 June 2015.
ii. Measurement Periods
There were two measurement periods for the performance rights granted in FY2014 as outlined in the LTI transition plan that was depicted in the FY2014 Annual Report:
1 July 2013 – 30 June 2015 for 50% of the Performance Rights 1 July 2013 – 30 June 2016 for 50% of the Performance Rights
iii. FY2014 Grant Performance Criteria
The ROIC and TSR performance criteria relating to the FY2014 grant of performance rights to KMP are detailed below.
Fair valueAward Options Grant per option Vesting No. vested No. forfeited
Name year granted date at award date date during year during year
Greg Jason 2012 140,000 20 Dec 2011 0.618$ 20 Dec 2014 140,000 - Craig Perciavalle 2012 70,000 20 Dec 2011 0.618 20 Dec 2014 70,000 - Brian Leathers 2012 70,000 20 Dec 2011 0.618 20 Dec 2014 70,000 -
Measure Weight Threshold Vesting % Performance
Austal 30% <= 15% 0% At or below Threshold
Absolute TSR Pro-rata
(CAGR) 15% < TSR < 25% 50% Target
Pro-rata
>= 25% 100% Stretch or Above
ROIC 70% 6.0% 0% At or below Threshold
Pro-rata
8.0% 50% Target
Pro-rata
10.0% 100% Stretch or Above
Total 100%
For
per
sona
l use
onl
y

28 | AUSTAL LIMITED ANNUAL REPORT 2015
iv. Vesting of Performance Rights from the FY2014 Grant
The actual TSR performance for the first measurement period from 1 July 2013 – 30 June 2015 vesting of performance has been calculated to be 167%.
The actual ROIC performance for the first measurement period from 1 July 2013 – 30 June 2015 vesting of performance will be calculated using the FY2015 audited accounts. The estimated ROIC performance in the first measurement period from 1 July 2013 – 30 June 2015 is 10.0%.
The estimated number of performance rights from the first measurement period for the FY2014 grant that will vest and lapse as a result of the actual Group performance is detailed below. The final number of performance rights that will vest and lapse will be calculated using the FY2015 audited accounts. Auditor sign off of the accounts occurs after the accounts are prepared and approved by the Board of directors, hence the actual calculation cannot be prepared before the Auditor sign off occurs.
III. FY2015 Performance Rights Grant
i. FY2015 Performance Rights Grant
Performance rights granted to KMP in FY2015 are depicted in the table below.
Measurement Period 1
Rights Maximum
Granted Vesting Estimated Vesting
% Rights ROIC TSR Total
Actual Result 10.0% 167%
Award 100% 100% 100%
Weight 70% 30% 100%
Vesting % 70% 30% 100%
Employee
Andrew Bellamy CEO 287,313 50% 143,656 100,559 43,096 143,655
Greg Jason CFO 125,345 50% 62,672 43,870 18,801 62,671
Craig Perciavalle President USA 168,675 50% 84,337 59,035 25,301 84,336
Brian Leather CFO USA 114,235 50% 57,117 39,981 17,135 57,116
Joselito Turano President Philippines 93,517 50% 46,758 32,730 14,027 46,757
Total 789,085 50% 394,540 276,175 118,360 394,535
1. Graham Backhouse forfeited 108,130 Performance rights upon his resignation in April 2015.
Performance Fair value per Value of
Grant rights performance awards at
Name date granted right grant date
Andrew Bellamy 30 Oct 2014 379,390 0.46$ 176,383$
Greg Jason 21 Oct 2014 109,288 0.43 47,371
Craig Perciavalle 21 Oct 2014 142,692 0.43 61,850
Brian Leathers 21 Oct 2014 99,885 0.43 43,295
Graham Backhouse 1 21 Oct 2014 104,027 0.43 45,090
Joey Turano 21 Oct 2014 73,130 0.43 31,698
Total 908,412 405,687$
1. Graham Backhouse forfeited 104,027 Performance rights upon his resignation in April 2015.For
per
sona
l use
onl
y

29 | AUSTAL LIMITED ANNUAL REPORT 2015
ii. Measurement Periods
There are two measurement periods for the performance rights granted in FY2015 as outlined in the LTI transition plan that was depicted in the FY2014 Annual Report:
1 July 2014 – 30 June 2016 for 25% of the Performance Rights 1 July 2014 – 30 June 2017 for 75% of the Performance Rights
Performance rights can vest in two tranches at the completion of each of the two measurement periods.
iii. FY2015 Grant Performance Criteria
The ROIC and TSR performance criteria relating to the FY2015 grant of performance rights to KMP are detailed below.
IV. FY2016 Performance Rights Grant
i. FY2016 Grant Performance Criteria
The ROIC and iTSR performance criteria relating to the prospective FY2016 grant of performance rights to KMP are detailed below.
Measure Weight Threshold Vesting % Performance
Austal 30% <= 15% 0% At or below Threshold
Absolute TSR Pro-rata
(CAGR) 15% < TSR < 25% 50% Target
Pro-rata
>= 25% 100% Stretch or Above
ROIC 70% 6.9% 0% At or below Threshold
Pro-rata
7.8% 50% Target
Pro-rata
8.8% 100% Stretch or Above
Total 100%
Measure Weight Threshold1 Vesting % Performance
Indexed TSR 40% <= 100% 0% At or below Threshold
Pro-rata
100% < iTSR < 200% 50% Target
Pro-rata
>= 200% 100% Stretch or Above
ROIC 60% 8.0% 0% At or below Threshold
Pro-rata
10.0% 50% Target
Pro-rata
12.0% 100% Stretch or Above
Total 100%
1. 100% is equal to the average TSR of companies included in the XAOAI Index as defined above.For
per
sona
l use
onl
y

30 | AUSTAL LIMITED ANNUAL REPORT 2015
V. Share rights granted during the period
Details of share rights provided as fixed remuneration to key management personnel are shown below.
Further information is set out in Note 30.
VI. Options and rights holdings
VII. Shareholdings
None of the shares held by key management personnel are held nominally.
Fair valueName Period earned Grant date Granted per share Fair value
Andrew Bellamy FY2015 H1 30 Oct 2014 92,602 1.30$ 120,383$ Andrew Bellamy FY2015 H2 30 Oct 2014 68,598 1.30 89,177
Total 161,200 209,560$
Options and rights holdings
Balance at Granted as Balance at Vested and
30 June 2014 Remuneration Forfeited Exercised 30 June 2015 Exercisable Unvested
30 June 2015
Directors
Andrew Bellamy
Options 280,000 - - - 280,000 280,000 -
Share Rights 227,634 161,200 - (320,236) 68,598 68,598 -
Performance Rights 287,313 379,390 - - 666,703 - 666,703
Executives
Greg Jason
Options 437,500 - - - 437,500 437,500 -
Performance Rights 125,345 109,288 - - 234,633 - 234,633
Craig Perciavalle
Options 250,000 - - - 250,000 250,000 -
Performance Rights 168,675 142,692 - - 311,367 - 311,367
Brian Leathers
Options 239,000 - - - 239,000 239,000 -
Performance Rights 114,235 99,885 - - 214,120 - 214,120
Graham Backhouse 1
Options - - - - - - -
Performance Rights 108,130 104,027 (212,157) - - - -
Joey Turano
Options - - - - - - -
Performance Rights 93,517 73,130 - - 166,647 - 166,647
FY2015 Movements
Share Performance
Balance at Rights Options rights Balance at
30 June 2015 30 June 2014 Exercised exercised vested Disposed Net Movement 30 June 2015
Non - Executive Directors
John Rothwell 32,200,745 - - - - - 32,200,745
Dario Amara 2
50,000 - - - (50,000) (50,000) -
David Singleton 28,600 - - - - - 28,600
Giles Everist 50,000 - - - (30,000) (30,000) 20,000
Executives
Andrew Bellamy 566,928 320,236 - - (408,690) (88,454) 478,474
Greg Jason - - - - - - -
Craig Perciavalle - - - - - - -
Brian Leathers - - - - - - -
Graham Backhouse 1 - - - - - - -
Joey Turano - - - - - - -
Total 32,896,273 320,236 - - (488,690) (168,454) 32,727,819
1 Mr Graham Backhouse resigned on 21 April 2015
2 Mr Dario Amara sold his share on the 11 May 2015 and resigned on 30 October 2014
For
per
sona
l use
onl
y
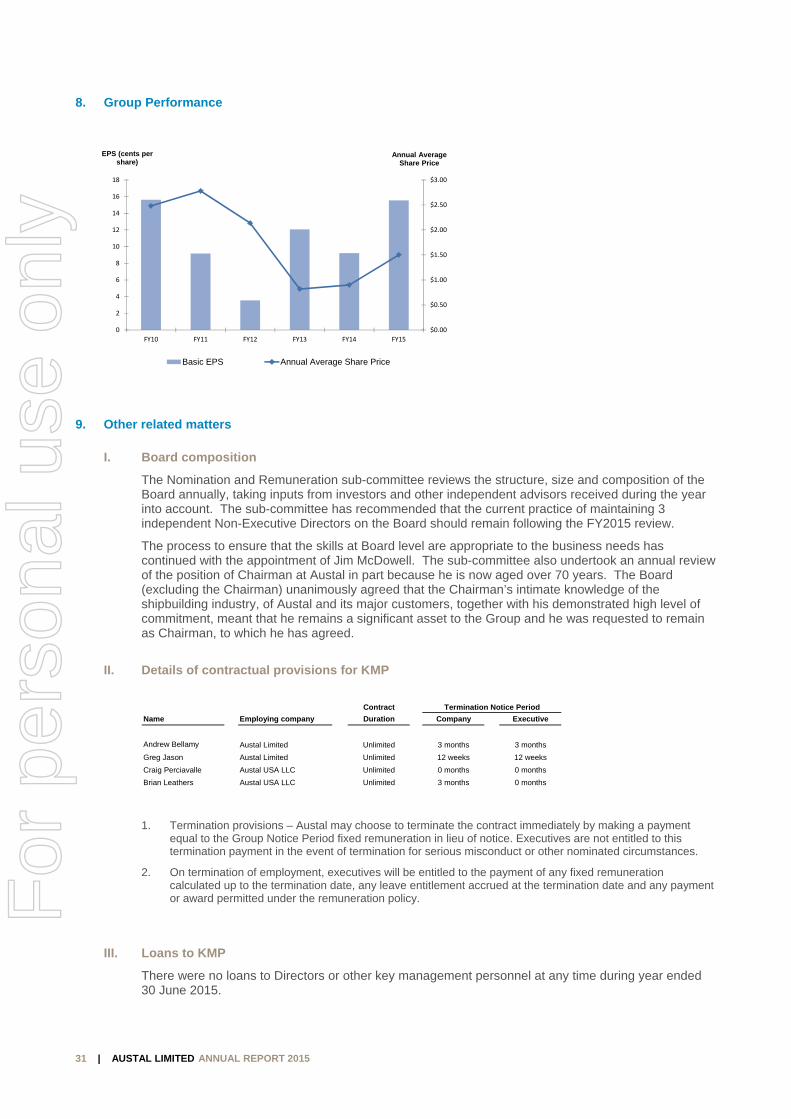
31 | AUSTAL LIMITED ANNUAL REPORT 2015
8. Group Performance
9. Other related matters
I. Board composition
The Nomination and Remuneration sub-committee reviews the structure, size and composition of the Board annually, taking inputs from investors and other independent advisors received during the year into account. The sub-committee has recommended that the current practice of maintaining 3 independent Non-Executive Directors on the Board should remain following the FY2015 review.
The process to ensure that the skills at Board level are appropriate to the business needs has continued with the appointment of Jim McDowell. The sub-committee also undertook an annual review of the position of Chairman at Austal in part because he is now aged over 70 years. The Board (excluding the Chairman) unanimously agreed that the Chairman’s intimate knowledge of the shipbuilding industry, of Austal and its major customers, together with his demonstrated high level of commitment, meant that he remains a significant asset to the Group and he was requested to remain as Chairman, to which he has agreed.
II. Details of contractual provisions for KMP
1. Termination provisions – Austal may choose to terminate the contract immediately by making a payment equal to the Group Notice Period fixed remuneration in lieu of notice. Executives are not entitled to this termination payment in the event of termination for serious misconduct or other nominated circumstances.
2. On termination of employment, executives will be entitled to the payment of any fixed remuneration calculated up to the termination date, any leave entitlement accrued at the termination date and any payment or award permitted under the remuneration policy.
III. Loans to KMP
There were no loans to Directors or other key management personnel at any time during year ended 30 June 2015.
$0.00
$0.50
$1.00
$1.50
$2.00
$2.50
$3.00
0
2
4
6
8
10
12
14
16
18
FY10 FY11 FY12 FY13 FY14 FY15
Annual Average Share Price
EPS (cents per share)
Basic EPS Annual Average Share Price
Contract Termination Notice Period
Name Employing company Duration Company Executive
Andrew Bellamy Austal Limited Unlimited 3 months 3 months
Greg Jason Austal Limited Unlimited 12 weeks 12 weeks
Craig Perciavalle Austal USA LLC Unlimited 0 months 0 months
Brian Leathers Austal USA LLC Unlimited 3 months 0 months
For
per
sona
l use
onl
y
32 | AUSTAL LIMITED ANNUAL REPORT 2015
IV. Other transactions with KMP
There were no transactions involving key management personnel other than compensation and transactions concerning shares, performance rights and options as discussed in other sections of the Remuneration Report.
V. Use of Independent Remuneration Consultants
The Company established policies and procedures governing engagements with external remuneration consultants to ensure that KMP remuneration recommendations were free from undue influence from the KMP to whom they relate.
The NRC engaged Godfrey Remuneration Group Pty Limited as a remuneration consultant for the year ended 30 June 2015 to provide recommendations in relation to KMP remuneration.
KMP Remuneration $34,000 +GST
Review of long term incentive plan, procedures, rules etc. in light of regulatory changes and assistance with drafting the Remuneration Report and advice regarding stakeholder engagement on remuneration matters.
$12,000 + GST
End of Remuneration Report
For
per
sona
l use
onl
y

33 | AUSTA
Auditor i The Director
Auditor’s I
In relation to oknowledge andany applicable
Ernst & Young Robert A KirkbPartner 25 August 201
Non-audit s
Non-audit seDirectors areindependencservice prov
Signed in ac
John RothweChairman 25 August 2
A member firm of Ernst Liability limited by a sch
AL LIMITED ANN
independ
rs received th
Independen
our audit of the d belief, there he code of profes
by
15
services
ervices provide satisfied thace for auditor
vided means t
ccordance wit
ell
015
& Young Global Limited heme approved under Pro
Erns11 MPertGPO
NUAL REPORT
dence and
he following d
nce Declara
financial reporhave been no cossional conduct
ded by the enat the provisiors imposed bythat auditor in
th a resolution
ofessional Standards Leg
st & Young Mounts Bay Road th WA 6000 AustraO Box M939 Perth W
2015
d non-aud
eclaration fro
ation to the
t of Austal Limiontraventions ot.
ntity’s auditor,on of non-audy the Corporandependence
n of Directors
gislation
alia WA 6843
dit servic
om the audito
e Directors
ited for the finaof the auditor in
, Ernst & Youdit services isations Act 200e was not com
s.
And Exe
Tel: +6Fax: +ey.com
ces
or of Austal Li
of Austal L
ancial year endendependence re
ng, during thes compatible w01. The natur
mpromised.
drew Bellamyecutive Direct
61 8 9429 2222 +61 8 9429 2436 m/au
mited.
Limited
ed 30 June 2015equirements of t
e year, are diwith the genere and scope
y tor and Chief
5, to the best o the Corporation
isclosed in Noeral standard
of each type
Executive Of
of my ons Act 2001 or
ote 5. The of of non-audit
fficer
For
per
sona
l use
onl
y

34 | AUSTAL LIMITED ANNUAL REPORT 2015
Consolidated statement of profit or loss and other comprehensive income for the year ended 30 June 2015
2015 2014
Notes ’000 ’000
Continuing operations
Revenue 4 1,414,888$ 1,122,863$
Cost of sales (1,296,909) (1,028,599)
Gross Profit 117,979$ 94,264$
Other Income and expenses 5 31,504$ 21,913$
Administration expenses (49,124) (51,895)
Marketing expenses (14,674) (8,396)
Finance costs 5 (4,992) (8,742)
Profit before income tax 80,693$ 47,144$
Income tax benefit / (expense) 9 (27,537)$ (15,285)$
Profit after tax 53,156$ 31,859$
Profit attributable to:
Owners of the parent 53,225$ 31,548$
Non-controlling interests (69) 311
Total 53,156$ 31,859$
Other comprehensive income
Amounts that may subsequently be reclassified to profit and loss:
Cash flow hedges
- Gain / (loss) on cash flow hedges taken to equity (31,886)$ 17,231$
- (Gain) / loss recycled out of equity (9,183) (20,705)
- Income tax benefit / (expense) 12,622 865
- Net (28,447)$ (2,609)$
Foreign currency translations
- Gain / (loss) taken to equity 57,922$ (4,075)$
- Income tax benefit / (expense) (1,851) 217
- Net 56,071$ (3,858)$
Other comprehensive income for the period, net of tax 27,624$ (6,467)$
Total comprehensive income for the year 80,780$ 25,392$
Total comprehensive income attributable to:
Owners of the parent 80,849$ 25,081$
Non-controlling interests (69) 311
Total 80,780$ 25,392$
Earnings per share ($ per share)
- basic for profit for the year attributable to ordinary equity holders of the parent 6 0.16$ 0.09$
- diluted for profit for the year attributable to ordinary equity holders of the parent 6 0.15 0.09
The consolidated statement of profit or loss and other comprehensive income should be read in conjunction with the accompanying notes.
For
per
sona
l use
onl
y

35 | AUSTAL LIMITED ANNUAL REPORT 2015
Consolidated statement of financial position as at 30 June 2015
2015 2014
Notes ’000 ’000
Assets
Current Assets
Cash and cash equivalents 10 138,413$ 74,428$
Restricted cash 10 10,055 9,532
Trade and other receivables 14 104,342 95,753
Inventories 16 339,703 328,142
Prepayments 6,321 4,054
Derivatives 23 & 24 106 2,701
Total 598,940$ 514,610$
Non - Current Assets
Collateral 20 3,600$ 2,917$
Trade and other receivables 14 157 1,020
Prepayments 1,925 1,968
Derivatives 23 & 24 9 5,787
Property, plant and equipment 18 442,522 366,500
Intangible assets and goodwill 19 9,637 9,473
Deferred tax assets 9 14,089 9,022
Total 471,939$ 396,687$
Total Assets 1,070,879$ 911,297$
Liabilities
Current Liabilities
Trade and other payables 17 (223,497)$ (183,570)$
Derivatives 23 & 24 (21,337) (1,972)
Interest-bearing loans and borrowings 11 (146,904) (13,192)
Provisions 21 (33,830) (33,704)
Government grants 13 (3,244) (3,550)
Income tax payable 9 (7,493) (10,980)
Progress payments received in advance 15 (26,177) (29,062)
Total (462,482)$ (276,030)$
Non - Current Liabilities
Derivatives 23 & 24 (14,737)$ (2,229)$
Interest-bearing loans and borrowings 11 (7,658) (142,264)
Provisions 21 (1,139) (1,023)
Government grants 13 (63,722) (49,892)
Deferred tax liabilities 9 (8,742) (6,627)
Total (95,998)$ (202,035)$
Total Liabilities (558,480)$ (478,065)$
Net Assets 512,399$ 433,232$
Equity
Contributed equity 12 112,523$ 111,598$
Reserves 55,846 27,292
Retained earnings 343,798 294,041
Equity attributable to owners of the parent 512,167$ 432,931$
Non - controlling interests 232$ 301$
Total Equity 512,399$ 433,232$
The consolidated statement of financial position should be read in conjunction with the accompanying notes.
For
per
sona
l use
onl
y

REPORT TO THE MEMBERS OF AUSTAL LIMITED
36 | AUSTAL LIMITED ANNUAL REPORT 2015
Consolidated statement of changes in equity for the year ended 30 June 2015
.
Foreign
Currency Employee Cash flow Common Asset Non
Issued Reserved Retained Translation Benefits Hedge Control Revaluation Controlling Total
Capital Shares 1 Earnings Reserve Reserve Reserve Reserve Reserve Total Interest Equity
’000 ’000 ’000 ’000 ’000 ’000 ’000 ’000 ’000 ’000 ’000
Equity at 1 July 2013 120,940$ (9,612)$ 258,560$ 8,455$ 6,211$ 11,077$ (15,925)$ 27,491$ 407,197$ (10)$ 407,187$
Comprehensive Income
Profit for the year - $ - $ 31,548$ - $ - $ - $ - $ - $ 31,548$ 311$ 31,859$
Other Comprehensive Income - - - (3,858) - (2,609) - - (6,467) - (6,467)
Total - $ - $ 31,548$ (3,858)$ - $ (2,609)$ - $ - $ 25,081$ 311$ 25,392$
Transfers between reserves - $ - $ 3,933$ 3,008$ (1,508)$ 301$ - $ (5,734)$ - $ - $ - $
Other equity transactions
Shares issued 270$ - $ - $ - $ - $ - $ - $ - $ 270$ - $ 270$
Cost of share-based payments - - - - 383 - - - 383 - 383
Total 270$ - $ - $ - $ 383$ - $ - $ - $ 653$ - $ 653$
Equity at 1 July 2014 121,210$ (9,612)$ 294,041$ 7,605$ 5,086$ 8,769$ (15,925)$ 21,757$ 432,931$ 301$ 433,232$
Comprehensive Income
Profit for the year - $ - $ 53,225$ - $ - $ - $ - $ - $ 53,225$ (69)$ 53,156$
Other Comprehensive Income - - - 56,071 - (28,447) - - 27,624 - 27,624
Total - $ - $ 53,225$ 56,071$ - $ (28,447)$ - $ - $ 80,849$ (69)$ 80,780$
Other equity transactions
Shares issued 543$ 382$ - $ - $ (443)$ - $ - $ - $ 482$ - $ 482$
Dividends - - (3,468) - - - - - (3,468) - (3,468)
Cost of share-based payments - - - - 1,373 - - - 1,373 - 1,373
Total 543$ 382$ (3,468)$ - $ 930$ - $ - $ - $ (1,613)$ - $ (1,613)$
Equity at 30 June 2015 121,753$ (9,230)$ 343,798$ 63,676$ 6,016$ (19,678)$ (15,925)$ 21,757$ 512,167$ 232$ 512,399$
1. Reserved shares are in relation to the Austal Group Management Share Plan
The consolidated statement of changes in equity should be read in conjunction with the accompanying notes.
For
per
sona
l use
onl
y

REPORT TO THE MEMBERS OF AUSTAL LIMITED
37 | AUSTAL LIMITED ANNUAL REPORT 2015
Consolidated statement of cash flows for the year ended 30 June 2015
2015 2014
Notes ’000 ’000
Cash flows from operating activities
Receipts from customers 1,420,738$ 1,112,844$
Payments to suppliers and employees (1,287,677) (1,046,868)
Interest received 4 882 321
Interest paid 5 (4,992) (8,742)
Income tax received / (paid) (18,517) (15,927)
Net cash from / (used in) operating activities 7 110,434$ 41,628$
Cash flows from investing activities
Receipts of infrastructure government grants 4,986$ 4,506$
Proceeds from sale of property, plant and equipment 2,355 24,611
Purchase of property, plant and equipment (28,126) (11,884)
Purchase of intangible assets (1,053) (1,263)
Proceeds from sale of intangible assets - 3,002
Net cash from / (used in) investing activities (21,838)$ 18,972$
Cash flows from financing activities
Repayment of borrowings (40,575)$ (114,238)$
Loans received 9,449 24,917
Equity dividends paid (3,468) -
Net cash from / (used in) financing activities (34,594)$ (89,321)$
Net increase / (decrease) in cash and cash equivalents 54,002$ (28,721)$
Cash and cash equivalents
Cash and cash equivalents at beginning of year 83,960$ 107,703$
Net foreign exchange differences 10,506 4,978
Net increase / (decrease) in cash and cash equivalents 54,002 (28,721)
Cash and cash equivalents at end of year 10 148,468$ 83,960$
The consolidated statement of cash flows should be read in conjunction with the accompanying notes.
For
per
sona
l use
onl
y
38 | AUSTA
Notes to Basis of
Note 1.
The financiaauthorised fo
Austal Limitetraded on th
The principaperformance
Note 2.
i. Introd
The firequir
The fiinstru
The fidollar98 / 0
The fiLimite
ii. Repo
The nsumm
Curre
This sand c
Capit
This sborrow
Work
This spayab
Infras
This s
Other
This s
AL LIMITED ANN
o the finan
f preparat
Corporate
al report of theor issue in ac
ed is a limitede Australian s
al activities of e aluminium v
Basis of pr
duction
inancial reporrements of th
inancial reporuments and la
inancial reporrs ($’000) unle0100. The Gr
inancial repored is a for pro
orting structu
notes to the cmarised as fol
ent year perf
section focuscash generatio
tal structure
section focuswings, contrib
king capital
section focusbles, construc
structure & o
section focus
r liabilities
section focus
REPOR
NUAL REPORT
ncial stat
tion
Information
e Austal Limitccordance wit
d liability comstock exchan
the Group duvessels. Thes
reparation
rt is a generae Corporation
rt has also beand and build
rt is presenteess otherwiseroup is an ent
rt presents thofit entity.
ure
onsolidated fllows:
formance
es on the reson, and the re
es on the lonbuted equity a
es on shorterction contract
other assets
es on propert
es on provisio
RT TO THE M
2015
ements
ted Group of th a resolution
pany incorpoge.
uring the yease activities a
al-purpose finans Act 2001 a
een prepared ings that have
d in Australiae stated undetity to which t
he figures of th
financial state
sults and perfoeturn of cash
g term fundinand reserves
r term workingts in progress
ty, plant & eq
ons such as e
MEMBERS O
Companies (n of the Direc
orated and do
r were the dere unchanged
ancial report,and Australia
on a historice been meas
an dollars ander the option athe class orde
he consolidat
ements have
formance of th to sharehold
ng of the Grous and governm
g capital concs, inventories
quipment as w
employee be
OF AUSTAL L
the Group) foctors on 25 Au
omiciled in Au
esign, manufad from the pre
which has bn Accounting
cal cost basis,sured at fair v
d all values aravailable to ther applies.
ted entity only
been divided
he Group, incders via divide
up including cment grants.
cepts such asincluding wo
well as intang
nefits and fut
LIMITED
or the year enugust 2015.
stralia whose
acture and suevious year.
een prepared Standards.
, except for dealue.
re rounded tohe Group und
y, unless othe
into 8 main s
cluding profitaends.
cash, interest
s trade and ork in progress
ible assets of
ure warranty
nded 30 June
e shares are p
upport of high
d in accordan
erivative fina
o the nearest der ASIC Clas
erwise stated
sections whic
ability, earnin
t bearing loan
other receivabs.
f the Group.
costs.
e 2015 was
publicly
ce with the
ncial
thousand ss Order
d. Austal
ch are
gs per share
ns and
bles and
For
per
sona
l use
onl
y
REPORT TO THE MEMBERS OF AUSTAL LIMITED
39 | AUSTAL LIMITED ANNUAL REPORT 2015
Financial risk management
This section focuses on the Groups approach to financial risk management, fair value measurements and foreign exchange hedging and the associated derivative financial instruments.
Unrecognised items
This section focuses on commitments and contingencies that are not recognised in the financial statements and events occurring after the balance date.
The Group, management and related parties
This section focuses on the corporate structure of the Group, parent entity data, key management personnel compensation and related party transactions.
iii. Basis of consolidation
The consolidated financial statements comprise the financial statements of Austal Limited and its subsidiaries (the Group) for the year ended 30 June 2015.
Subsidiaries are all of those entities over which the Group has power over the investee, exposure or rights to variable returns from its involvement with its investee and the ability to use its power over the investee to affect its returns. The existence and effect of potential voting rights that are currently exercisable or convertible are considered when assessing whether a Group controls another entity.
Financial statements of foreign controlled entities presented in accordance with overseas accounting principles are adjusted to comply with Group policy and generally accepted accounting principles in Australia for consolidation purposes. All intercompany balances, transactions, unrealised gains and losses resulting from intra-Group transactions and dividends have been eliminated in full in preparing the consolidated financial statements.
Subsidiaries are fully consolidated from the date on which control is obtained by the Group and cease to be consolidated from the date on which control is transferred out of the Group.
Investments in subsidiaries held by Austal Limited are accounted for at cost in the separate financial statements of the parent entity less any impairment charges. Dividends received from subsidiaries are recorded as a component of other revenues in the statement of comprehensive income of the parent entity, and do not impact the recorded cost of the investment. The parent will assess whether any indicators of impairment of the carrying value of the investment in the subsidiary exist upon receipt of dividend payments from subsidiaries. An impairment loss is recognised to the extent that the carrying value of the investment exceeds its recoverable amount where such indicators exist.
iv. Foreign currency transactions and translation
Both the functional and presentation currency of Austal Limited and its Australian subsidiaries are Australian dollars (AUD). The Company determines the functional currency for each entity within the Group and items included in the financial statements of each entity are measured using that functional currency.
Transactions in foreign currencies are initially recorded in the functional currency by applying the exchange rates ruling at the date of the transaction. Monetary assets and liabilities denominated in foreign currencies are retranslated at the rate of exchange ruling at the balance date. All exchange differences arising from the above procedures are taken to the statement of comprehensive income.
The functional currency of the USA and the Philippines Operations is United States dollars (USD).
The assets and liabilities of the overseas subsidiaries are translated into the presentation currency of Austal Limited at the rate of exchange ruling at the reporting date and the statement of comprehensive income is translated at the average exchange rates for the period. The exchange differences arising on the translation are taken directly to a separate component of equity. The deferred cumulative amount recognised in equity relating to that particular foreign operation is recognised in the statement of comprehensive income on disposal of a foreign entity.
v. Statement of compliance
The financial report complies with Australian Accounting Standards and International Financial Reporting Standards (IFRS), as issued by the International Accounting Standards Board.
For
per
sona
l use
onl
y

REPORT TO THE MEMBERS OF AUSTAL LIMITED
40 | AUSTAL LIMITED ANNUAL REPORT 2015
vi. New and amended standards adopted by the Group
The accounting policies adopted are consistent with those of the previous financial year except for changes in accounting policies due to implementation of new and amended standards adopted by the Group as discussed below.
The adoption of these standards did not have any effect on the financial position or performance of the Group.
The Group has applied all new and amended accounting standards and interpretations effective from 1 July 2014:
AASB 2012-3 AASB 2012-3 Amendments to Australian Accounting Standards - Offsetting Financial Assets and Financial Liabilities adds application guidance to AASB 132 Financial Instruments: Presentation to address inconsistencies identified in applying some of the offsetting criteria of AASB 132, including clarifying the meaning of "currently has a legally enforceable right of set-off" and that some gross settlement systems may be considered equivalent to net settlement.
Interpretation 21 Levies - This Interpretation confirms that a liability to pay a levy is only recognised when the activity that triggers the payment occurs. Applying the going concern assumption does not create a constructive obligation.
AASB 2013-3 Amendments to AASB 136 – Recoverable Amount Disclosures for Non-Financial Assets. AASB 2013-3 amends the disclosure requirements in AASB 136 Impairment of Assets. The amendments include the requirement to disclose additional information about the fair value measurement when the recoverable amount of impaired assets is based on fair value less costs of disposal.
AASB 2013-4 Amendments to Australian Accounting Standards – Novation of Derivatives and Continuation of Hedge Accounting [AASB 139]. AASB 2013-4 amends AASB 139 to permit the continuation of hedge accounting in specified circumstances where a derivative, which has been designated as a hedging instrument, is novated from one counterparty to a central counterparty as a consequence of laws or regulations.
AASB 1031 Materiality. The revised AASB 1031 is an interim standard that cross-references to other Standards and the Framework (issued December 2013) that contain guidance on materiality.
AASB 2014-1 Part C issued in June 2014 makes amendments to eight Australian Accounting Standards to delete their references to AASB 1031. The amendments are effective from 1 July 2014*.
AASB 2013-9 Amendments to Australian Accounting Standards – Conceptual Framework, Materiality and Financial Instruments. The Standard contains three main parts and makes amendments to a number Standards and Interpretations.
Part A of AASB 2013-9 makes consequential amendments arising from the issuance of AASB CF 2013-1.
Part B makes amendments to particular Australian Accounting Standards to delete references to AASB 1031 and also makes minor editorial amendments to various other standards.
AASB 2014-1 Part A -Annual Improvements 2010–2012 Cycle AASB 2014-1 Part A: This standard sets out amendments to Australian Accounting Standards arising from the issuance by the International Accounting Standards Board (IASB) of International Financial Reporting Standards (IFRSs) Annual Improvements to IFRSs 2010–2012 Cycle and Annual Improvements to IFRSs 2011–2013 Cycle.
Annual Improvements to IFRSs 2010–2012 Cycle addresses the following items:
AASB 2 - Clarifies the definition of 'vesting conditions' and 'market condition' and introduces the definition of 'performance condition' and 'service condition'.
AASB 3 - Clarifies the classification requirements for contingent consideration in a business combination by removing all references to AASB 137.
AASB 8 - Requires entities to disclose factors used to identify the entity's reportable segments when operating segments have been aggregated. An entity is also required to provide a reconciliation of total reportable segments' asset to the entity's total assets.
AASB 116 & AASB 138 - Clarifies that the determination of accumulated depreciation does not depend on the selection of the valuation technique and that it is calculated as the difference between the gross and net carrying amounts.
For
per
sona
l use
onl
y

REPORT TO THE MEMBERS OF AUSTAL LIMITED
41 | AUSTAL LIMITED ANNUAL REPORT 2015
AASB 124 - Defines a management entity providing KMP services as a related party of the reporting entity. The amendments added an exemption from the detailed disclosure requirements in paragraph 17 of AASB 124 for KMP services provided by a management entity. Payments made to a management entity in respect of KMP services should be separately disclosed.
Amendments to Australian Accounting Standards - Part B AASB 2014-Part B makes amendments in relation to the requirements for contributions from employees or third parties that are set out in the formal terms of the benefit plan and linked to service.
Defined Benefit Plans: Employee Contributions (Amendments to AASB 119) The amendments clarify that if the amount of the contributions is independent of the number of years of service, an entity is permitted to recognise such contributions as a reduction in the service cost in the period in which the related service is rendered, instead of attributing the contributions to the periods of service.
Amendments to AASB 1053 – Transition to and between Tiers, and related Tier 2 Disclosure Requirements [AASB 1053] The Standard makes amendments to AASB 1053 Application of Tiers of Australian Accounting Standards to:
clarify that AASB 1053 relates only to general purpose financial statements;
make AASB 1053 consistent with the availability of the AASB 108 Accounting Policies, Changes in Accounting Estimates and Errors option in AASB 1 First-time Adoption of Australian Accounting Standards;
clarify certain circumstances in which an entity applying Tier 2 reporting requirements can apply the AASB 108 option in AASB 1; permit an entity applying Tier 2 reporting requirements for the first time to do so directly using the requirements in AASB 108 (rather that applying AASB 1) when, and only when, the entity had not applied, or only selectively applied, applicable recognition and measurement requirements in its most recent previous annual special purpose financial statements; and
specify certain disclosure requirements when an entity resumes the application of Tier 2 reporting requirements.
vii. Pronouncements issued and not effective
A number of Australian Accounting Standards and Interpretations have been issued or amended but are not yet effective. A full assessment of the impact of all the new or amended Accounting Standards and interpretations issued but not effective has not yet been completed.
The pronouncements relevant to the Group which have not been adopted by the Group are as follows:
AASB 9: Financial Instruments:
AASB 9 (December 2014) is a new Principal standard which replaces AASB 139. This new Principal version supersedes AASB 9 issued in December 2009 (as amended) and AASB 9 (issued in December 2010) and includes a model for classification and measurement, a single, forward-looking ‘expected loss’ impairment model and a substantially-reformed approach to hedge accounting.
AASB 9 is effective for annual periods beginning on or after 1 January 2018. However, the Standard is available for early application. The own credit changes can be early applied in isolation without otherwise changing the accounting for financial instruments.
The final version of AASB 9 introduces a new expected-loss impairment model that will require more timely recognition of expected credit losses. Specifically, the new Standard requires entities to account for expected credit losses from when financial instruments are first recognised and to recognise full lifetime expected losses on a more timely basis.
Amendments to AASB 9 (December 2009 & 2010 editions and AASB 2013-9) issued in December 2013 included the new hedge accounting requirements, including changes to hedge effectiveness testing, treatment of hedging costs, risk components that can be hedged and disclosures.
For
per
sona
l use
onl
y

REPORT TO THE MEMBERS OF AUSTAL LIMITED
42 | AUSTAL LIMITED ANNUAL REPORT 2015
AASB 9 includes requirements for a simpler approach for classification and measurement of financial assets compared with the requirements of AASB 139.
The main changes are described below.
a) Financial assets that are debt instruments will be classified based on (1) the objective of the entity's business model for managing the financial assets; (2) the characteristics of the contractual cash flows.
b) Allows an irrevocable election on initial recognition to present gains and losses on investments in equity instruments that are not held for trading in other comprehensive income. Dividends in respect of these investments that are a return on investment can be recognised in profit or loss and there is no impairment or recycling on disposal of the instrument.
c) Financial assets can be designated and measured at fair value through profit or loss at initial recognition if doing so eliminates or significantly reduces a measurement or recognition inconsistency that would arise from measuring assets or liabilities, or recognising the gains and losses on them, on different bases.
d) Where the fair value option is used for financial liabilities the change in fair value is to be accounted for as follows:
The change attributable to changes in credit risk are presented in other comprehensive income (OCI)
The remaining change is presented in profit or loss
AASB 9 also removes the volatility in profit or loss that was caused by changes in the credit risk of liabilities elected to be measured at fair value. This change in accounting means that gains caused by the deterioration of an entity’s own credit risk on such liabilities are no longer recognised in profit or loss.
Consequential amendments were also made to other standards as a result of AASB 9, introduced by AASB 2009-11 and superseded by AASB 2010-7, AASB 2010-10 and AASB 2014-1 – Part E.
AASB 2014-7 incorporates the consequential amendments arising from the issuance of AASB 9 in Dec 2014.
AASB 2014-8 limits the application of the existing versions of AASB 9 (AASB 9 (December 2009) and AASB 9 (December 2010)) from 1 February 2015 and applies to annual reporting periods beginning on after 1 January 2015.
AASB 2014-3 Amendments to Australian Accounting Standards – Accounting for Acquisitions of Interests in Joint Operations [AASB 1 & AASB 11] (effective 1 July 2016):
AASB 2014-3 amends AASB 11 to provide guidance on the accounting for acquisitions of interests in joint operations in which the activity constitutes a business. The amendments require:
(a) the acquirer of an interest in a joint operation in which the activity constitutes a business, as defined in AASB 3 Business Combinations, to apply all of the principles on business combinations accounting in AASB 3 and other Australian Accounting Standards except for those principles that conflict with the guidance in AASB 11; and
(b) the acquirer to disclose the information required by AASB 3 and other Australian Accounting Standards for business combinations.
This Standard also makes an editorial correction to AASB 11.
AASB 2014-4 Clarification of Acceptable Methods of Depreciation and Amortisation (Amendments to AASB 116 and AASB 138) (effective date 1 July 2016):
AASB 116 and AASB 138 both establish the principle for the basis of depreciation and amortisation as being the expected pattern of consumption of the future economic benefits of an asset.
The IASB has clarified that the use of revenue-based methods to calculate the depreciation of an asset is not appropriate because revenue generated by an activity that includes the use of an asset generally reflects factors other than the consumption of the economic benefits embodied in the asset.
For
per
sona
l use
onl
y
REPORT TO THE MEMBERS OF AUSTAL LIMITED
43 | AUSTAL LIMITED ANNUAL REPORT 2015
The amendment also clarified that revenue is generally presumed to be an inappropriate basis for measuring the consumption of the economic benefits embodied in an intangible asset. This presumption, however, can be rebutted in certain limited circumstances.
AASB 15 Revenue from Contracts with Customers (effective date 1 July 2017):
In May 2014, the IASB issued IFRS 15 Revenue from Contracts with Customers, which replaces IAS 11 Construction Contracts, IAS 18 Revenue and related Interpretations (IFRIC 13 Customer Loyalty Programmes, IFRIC 15 Agreements for the Construction of Real Estate, IFRIC 18 Transfers of Assets from Customers and SIC-31 Revenue—Barter Transactions Involving Advertising Services).
The core principle of IFRS 15 is that an entity recognises revenue to depict the transfer of promised goods or services to customers in an amount that reflects the consideration to which the entity expects to be entitled in exchange for those goods or services. An entity recognises revenue in accordance with that core principle by applying the following steps:
(a) Step 1: Identify the contract(s) with a customer
(b) Step 2: Identify the performance obligations in the contract
(c) Step 3: Determine the transaction price
(d) Step 4: Allocate the transaction price to the performance obligations in the contract
(e) Step 5: Recognise revenue when (or as) the entity satisfies a performance obligation
Early application of this standard is permitted.
AASB 2014-5 incorporates the consequential amendments to a number Australian Accounting Standards (including Interpretations) arising from the issuance of AASB 15.
AASB 2014-9 Amendments to Australian Accounting Standards – Equity Method in Separate Financial Statements:
AASB 2014-9 amends AASB 127 Separate Financial Statements, and consequentially amends AASB 1 First-time Adoption of Australian Accounting Standards and AASB 128 Investments in Associates and Joint Ventures, to allow entities to use the equity method of accounting for investments in subsidiaries, joint ventures and associates in their separate financial statements.
AASB 2014-9 also makes editorial corrections to AASB 127.
AASB 2014-9 applies to annual reporting periods beginning on or after 1 January 2016. Early adoption permitted.
AASB 2014-10 Amendments to Australian Accounting Standards – Sale or Contribution of Assets between an Investor and its Associate or Joint Venture:
AASB 2014-10 amends AASB 10 Consolidated Financial Statements and AASB 128 to address an inconsistency between the requirements in AASB 10 and those in AASB 128 (August 2011), in dealing with the sale or contribution of assets between an investor and its associate or joint venture.
The amendments require:
(a) a full gain or loss to be recognised when a transaction involves a business (whether it is housed in a subsidiary or not); and
(b) a partial gain or loss to be recognised when a transaction involves assets that do not constitute a business, even if these assets are housed in a subsidiary.
AASB 2014-10 also makes an editorial correction to AASB 10.
AASB 2014-10 applies to annual reporting periods beginning on or after 1 January 2016. Early adoption permitted.
For
per
sona
l use
onl
y

REPORT TO THE MEMBERS OF AUSTAL LIMITED
44 | AUSTAL LIMITED ANNUAL REPORT 2015
AASB 2015-1 Amendments to Australian Accounting Standards – Annual Improvements to Australian Accounting Standards 2012–2014 Cycle (effective date 1 July 2016):
The subjects of the principal amendments to the Standards are set out below:
AASB 5 Non-current Assets Held for Sale and Discontinued Operations:
Changes in methods of disposal – where an entity reclassifies an asset (or disposal group) directly from being held for distribution to being held for sale (or vice versa), an entity shall not follow the guidance in paragraphs 27–29 to account for this change.
AASB 7 Financial Instruments: Disclosures
Servicing contracts - clarifies how an entity should apply the guidance in paragraph 42C of AASB 7 to a servicing contract to decide whether a servicing contract is ‘continuing involvement’ for the purposes of applying the disclosure requirements in paragraphs 42E–42H of AASB 7.
Applicability of the amendments to AASB 7 to condensed interim financial statements - clarify that the additional disclosure required by the amendments to AASB 7 Disclosure–Offsetting Financial Assets and Financial Liabilities is not specifically required for all interim periods. However, the additional disclosure is required to be given in condensed interim financial statements that are prepared in accordance with AASB 134 Interim Financial Reporting when its inclusion would be required by the requirements of AASB 134.
AASB 119 Employee Benefits
Discount rate: regional market issue - clarifies that the high quality corporate bonds used to estimate the discount rate for post-employment benefit obligations should be denominated in the same currency as the liability. Further it clarifies that the depth of the market for high quality corporate bonds should be assessed at the currency level.
AASB 134 Interim Financial Reporting
Disclosure of information ‘elsewhere in the interim financial report’ - amends AASB 134 to clarify the meaning of disclosure of information ‘elsewhere in the interim financial report’ and to require the inclusion of a cross-reference from the interim financial statements to the location of this information.
AASB 2015-2 Amendments to Australian Accounting Standards – Disclosure Initiative: Amendments to AASB 101 (effective date 1 January 2016)
The Standard makes amendments to AASB 101 Presentation of Financial Statements arising from the IASB’s Disclosure Initiative project. The amendments are designed to further encourage companies to apply professional judgment in determining what information to disclose in the financial statements. For example, the amendments make clear that materiality applies to the whole of financial statements and that the inclusion of immaterial information can inhibit the usefulness of financial disclosures. The amendments also clarify that companies should use professional judgment in determining where and in what order information is presented in the financial disclosures.
AASB 2015-3 Amendments to Australian Accounting Standards arising from the Withdrawal of AASB 1031 Materiality (effective date 1 July 2015)
The Standard completes the AASB’s project to remove Australian guidance on materiality from Australian Accounting Standards.
For
per
sona
l use
onl
y

45 | AUSTA
Current y
Note 3.
Year ended 30 Jun
Revenues
External cust
Inter-segmen
Finance inco
Total
Segment result
EBIT
Finance inco
Finance expe
Total
Depreciation
Balance sheet
Segment ass
Segment liab
Year ended 30 Jun
Revenues
External cust
Inter-segmen
Finance inco
Total
Segment result
EBIT
Finance inco
Finance expe
Total
Depreciation
Balance sheet
Segment ass
Segment liab
Inter-segment re
AL LIMITED ANN
year perf
Operating s
ne 2015
tomers
nt
me
t
me
enses
and amortisation
sets
bilities
ne 2014
tomers
nt
me
t
me
enses
and amortisation
sets
bilities
evenues, investments,
REPOR
NUAL REPORT
formance
segments
Australia
’000
191,373$ $
20,435
-
211,808$ $
31,774$ $
-
-
31,774$ $
(1,057)$ $
130,101$ $
(78,731)
Australia
’000
153,886$ $
88,026
-
241,912$ $
16,684$ $
-
-
16,684$ $
(1,606)$ $
192,119$ $
(174,198)
, receivables and paya
RT TO THE M
2015
e
USA Philipp
’000 ’000
1,119,703 30$
- 8
-
1,119,703 38$
58,429 $
-
-
58,429 $
(18,692) ($
818,670 42$
(438,942) (2
USA Philipp
’000 ’000
933,615 32$
-
-
933,615 33$
61,682 2$
-
-
61,682 2$
(17,937) $
662,948 22$
(456,424) (15
ables are eliminated o
MEMBERS O
pines Unallocated
0 ’000
0,584 72,189$
8,159 -
- 882
8,743 73,071$
992 (4,106$
- 882
- (4,992
992 (8,216$
1,449) (3,068$
2,376 108,960$
1,435) (58,322
pines Unallocated
0 ’000
2,758 2,609$
1,009 -
- 321
3,767 2,930$
2,703 (27,211$
- 321
- (8,742
2,703 (35,632$
(972) (3,258$
2,261 151,467$
5,263) (43,809
on consolidation.
OF AUSTAL L
Elimination /
Adjustments
’000
9 157$
(28,594)
2 -
(28,437)$
6) (2,286)$
2 -
2) -
6) (2,286)$
8) - $
0 (29,228)$
2) 38,950
Elimination /
Adjustments
’000
9 (326)$
(89,035)
-
0 (89,361)$
) 1,707$
-
2) -
2) 1,707$
8) - $
7 (117,498)$
9) 211,629
LIMITED
Total
’000
1,414,006$
-
882
1,414,888$
84,803$
882
(4,992)
80,693$
(24,266)$
1,070,879$
(558,480)
Total
’000
1,122,542$
-
321
1,122,863$
55,565$
321
(8,742)
47,144$
(23,773)$
911,297$
(478,065)
For
per
sona
l use
onl
y

REPORT TO THE MEMBERS OF AUSTAL LIMITED
46 | AUSTAL LIMITED ANNUAL REPORT 2015
One customer in the USA segment generated revenue of $1,119.703 million during FY2015 (FY2014: $933.615 million) and one customer in the Australia segment generated revenue of $97.485 million during FY2015 (FY2014: $100.814 million).
2015 2014
’000 ’000
Analysis of Unallocated
Revenue
Construction and service 8,606$ - $
Sale of stock vessel H270 61,500 -
Charter vessel revenue 2,083 2,419
Finance income 882 321
Other - 190
Total 73,071$ 2,930$
Segment result
Profit / (loss) on foreign exchange 13,461$ (1,888)$
Net profit / (loss) on sale of shipyard - 3,582
Write down of inventory - (13,361)
Corporate overheads (10,654) (8,618)
Sales & marketing costs (7,156) (7,312)
Charter vessel profit 243 386
Finance income 882 321
Finance expenses (4,992) (8,742)
Total (8,216)$ (35,632)$
Segment assets
Cash and restricted cash 48,312$ 26,777$
Property, plant and equipment 44,057 45,914
Inventories 181 59,159
Derivatives 741 8,388
Deferred tax assets 14,162 9,293
Other 1,507 1,936
Total 108,960$ 151,467$
Segment liabilities
Deferred tax liabilities and income tax payable (16,210)$ (17,203)$
Interest bearing loans - (12,062)
Derivatives (36,074) (4,201)
Intercompany payables - 282
Deferred Income - (6,490)
Creditors & provisions (6,038) (4,135)
Total (58,322)$ (43,809)$
2015 2014
$’000 $’000
Revenue from external customers by geographical location of customers
North America 1,141,457$ 938,618$
Europe 69,701 20,150
Asia - 15,034
Australia 112,375 124,842
Middle East 85,251 -
Other 5,222 23,898
Total 1,414,006$ 1,122,542$
For
per
sona
l use
onl
y

REPORT TO THE MEMBERS OF AUSTAL LIMITED
47 | AUSTAL LIMITED ANNUAL REPORT 2015
i. Identification of reportable segments
The Group is organised into three business segments for management purposes based on the location of the production facilities, related sales regions and types of activity.
The Chief Executive Officer who is the Chief Operating Decision Maker (CODM) monitors the performance of the business segments separately for the purpose of making decisions about the allocation of resources and assessing performance. Segment performance is evaluated based on operating profit or loss. Finance costs, finance income and income tax are managed on a Group basis.
ii. Reportable segments
The Group’s reportable segments are USA, Philippines and Australia:
Australia
The Australia business manufactures high performance aluminium defence vessels for markets worldwide, excluding the USA and provides training and on-going support and maintenance for high performance vessels and includes the chartering of a vessel to the US Navy’s Military Sealift Command. USA
The USA manufactures high performance aluminium defence vessels for the US Navy and provides training and on-going support and maintenance of these performance vessels for the US Navy.
Philippines
The Philippines business manufactures high performance aluminium commercial vessels for global markets excluding the USA. The Philippines segment also provides support to other segments not just manufacturing for external buyers.
iii. Aggregation of segments
No operating segments are aggregated.
iv. Accounting policies and inter-segment transactions
The accounting policies used for reporting segments internally are the same as those utilised for reporting the accounts of the Group.
Inter-entity sales are recognised based on an arm’s length pricing structure.
2015 2014
$’000 $’000
Non-current assets, other than financial instruments,
prepayments and deferred tax assets
Geographical location
North America 375,450$ 300,842$
Asia 22,237 17,744
Europe 13,296 15,187
Australia 41,175 42,200
Total 452,158$ 375,973$
Composition
Property, plant and equipment 442,521$ 366,500$
Intangible assets 9,637 9,473
Total 452,158$ 375,973$
For
per
sona
l use
onl
y
REPORT TO THE MEMBERS OF AUSTAL LIMITED
48 | AUSTAL LIMITED ANNUAL REPORT 2015
v. Unallocated
The following items and associated assets and liabilities are not allocated to operating segments as they are not considered part of the core operations of any segment:
Cost of Group services Corporate overheads Finance revenue and costs Taxation Assets held for sale Derivatives Commercial vessel charter contracts
The Group sold Hull 270, a 102 metre trimaran ferry to Condor Ferries during the period. The vessel was sold for $61.500 million and is presented in the Unallocated segment. The vessel was included in Unallocated segment assets at 30 June 2014.
For
per
sona
l use
onl
y

49 | AUSTA
Note 4.
i. Reco
Revethat itreliab Cons
Constis calc
Contrthe comeas
The ethereaadjusrecog Chart
Chartthe rig
Intere
Revecalcuusingthroug
ii. Signi
Cons
The arequirperce
Contrthe stmethorecogconst
Manareven
The pcosts
Revenue
Construction c
Charter revenu
Interest from o
Total
AL LIMITED ANN
Revenue
ognition and
nue is recognt is probable t
bly. The follow
struction and
truction and sculated based
ract costs areosts incurred sured reliably
estimated totaafter for the pted in the eve
gnised for the
ter revenue
ter revenue isght to revenu
est income
nue is recognlating the am the effectivegh the expec
ificant accou
struction con
assessment ores certain es
entage of com
ract revenue atage of compod”) when the
gnised to the etruction contra
agement havenue recognise
percentage ofto complete
contract revenue
ue
other unrelated partie
REPOR
NUAL REPORT
measureme
nised and methat the econwing specific
d service con
service contrad on actual co
e recognised awhere it is prduring the te
al contract copurposes of reent of a changremaining lif
s operating ree is achieved
nised as interortised cost o
e interest rateted life of the
unting judge
ntract revenu
of constructionstimates to be
mpletion.
and contract letion of the ce outcome of extent of conact cannot be
e made estimed in the Cons
f completion ithe contract a
s
RT TO THE M
2015
nt
easured at fairomic benefitsrecognition c
ntract revenu
act revenue isosts incurred
as an expensrobable that trm of the con
sts are determecognising coge to the cosfe of the contr
entals received.
rest accrues uof a financial , which is the financial ass
ments and e
ue and expec
n contract reve made of tota
costs are reccontract activia constructiotract costs inc
e estimated re
ates in this asolidated Sta
s calculated oand profit is r
$
$
MEMBERS O
r value of thes will flow to tcriteria must a
ue
s brought to a as a proport
se as incurredthe costs will ntract.
mined prior toonstruction cot of completioract based up
ed on charter
using the effeasset and all
e rate that exaset to the net
estimates
cted constru
venue in accoal contract re
cognised as reity at the bala
on contract cacurred that aeliably.
rea, which if atement of Co
on actual cosrecognised fro
2015
’000
1,390,326 $
23,680
882
1,414,888 $
OF AUSTAL L
e consideratiohe Group and
also be met b
account baseion of estimat
d and revenuebe recovered
o commencemontract revenuon during the pon the adjus
of vessels an
ective interestocating the in
actly discountcarrying amo
uction profits
ordance with venues, total
evenue and eance sheet daan be estimatre likely to be
ultimately inaomprehensive
sts over the som commenc
2014
’000
1,105,089
17,453
321
1,122,863
LIMITED
on received ord that the revefore revenue
d on percentated total cont
e is recognised and the con
ment and re-eue. Constructlife of the conted value.
nd is recognis
t method. Thnterest incomts estimated fount of the fin
s at completi
the Group’s acontract cos
expenses resate (“percentaed reliably. C
e recoverable
accurate will ime Income of F
um of actual cement of the
r receivable tvenue can be e is recognise
tage of compltract costs.
ed only to thetract outcome
evaluated evetion contract ntract and rev
sed when the
his is a methome over the re
future cash reancial asset.
ion.
accounting posts and the cu
spectively by rage-of-compl
Contract reven when the ou
mpact the levFY2015 and b
costs plus pre project.
o the extent measured ed:
etion which
e extent of e cannot be
ery month revenue is venue is
control over
d of levant period
eceipts
olicies urrent
reference to etion nue is tcome of a
vel of beyond.
rojected
For
per
sona
l use
onl
y

50 | AUSTA
Note 5.
Other income and
Government in
Training reimb
(Loss) / gain o
Gain on dispos
Net foreign exc
Sale of scrap
Rental income
Other income
Total
Finance costs
Interest paid to
Total
Depreciation and
Depreciation e
Amortisation
Total
Employee benefits
Wages and sa
Superannuatio
Share based p
Workers’ comp
Annual leave e
Long service le
Total
Employee ben
Auditor's remuner
Amounts recei
An audit or rev
Total
Amounts recei
An audit or rev
Other services
Total
AL LIMITED ANN
Other inco
d expenses
nfrastructure grants
bursement grants
on disposal of propert
sal of intangible asse
change gains
e
o unrelated parties
amortisation
excluding impairment
s
alaries
on
payments
pensation costs
expense
eave expense
efits listed above inc
ration
ived or due and recei
view of the financial r
ived or due and recei
view of the financial r
s in relation to the ent
REPOR
NUAL REPORT
me and expe
ty, plant and equipme
ets
cludes expenses that
ivable by Ernst & You
report of the entity an
ivable by related prac
report of the entity an
tity and any other ent
RT TO THE M
2015
enses
ent
are disclosed in cost
ung Australia for:
d any other entity in t
ctices of Ernst & You
d any other entity in t
tity in the Group
MEMBERS O
t of sales
the Group
ng for:
the Group
OF AUSTAL LLIMITED
2015
’000
3,373$
7,915
(371)
-
12,994
5,167
-
2,426
31,504$
(4,992)$
(4,992)$
(22,736)$
(1,530)
(24,266)$
(337,501)$
(4,822)
(1,373)
(10,085)
(14,553)
(45)
(368,379)$
2015
$
(293,409)$
(293,409)$
(550,900)$
-
(550,900)$
2014
’000
3,643$
8,079
3,582
903
(495
3,802
198
2,20
21,913$
(8,742$
(8,742$
(21,593$
(2,180
(23,773$
(284,218$
(3,840
(383
(7,640
(8,294
(239
(304,614$
2014
$
(317,270$
(317,270$
(320,220$
(1,302
(321,522$
3
9
2
3
5)
2
8
1
3
2)
2)
3)
0)
3)
8)
0)
3)
0)
4)
9)
4)
0)
0)
0)
2)
2)
For
per
sona
l use
onl
y

REPORT TO THE MEMBERS OF AUSTAL LIMITED
51 | AUSTAL LIMITED ANNUAL REPORT 2015
i. Recognition & measurement
The following recognition and measurement criteria must be met before the following specific items are recognised in profit or loss:
Government grants relating to expense items
Government grants are recognised when there is reasonable assurance that the grant will be received and all attaching conditions will be complied with.
A grant is recognised as income when it relates to an expense item. The grant income is recognised over the periods necessary to match the grant to the costs that it is intended to compensate.
Impairment of assets
No impairment charge was recognised by the Group during the period. Refer to Note 19 for details regarding impairment testing of goodwill and intangible assets with indefinite useful lives.
Finance costs
Finance costs directly attributable to the acquisition, construction or production of a qualifying asset (i.e. an asset that necessarily takes a substantial period of time to get ready for its intended use or sale) are capitalised as part of the cost of that asset. All other finance costs are expensed in the period they occur.
Finance costs include interest payments, amortisation of capitalised loan origination costs and other costs that an entity incurs in connection with the borrowing of funds.
Depreciation and amortisation
Refer to accounting policies for depreciation disclosed in Note 18, and to accounting policies related to amortisation of intangible assets in Note 19.
Employee benefits
Refer to accounting policies for employee benefits in Note 21.
Leases
The determination of whether an arrangement is or contains a lease is based on the substance of the arrangement and requires an assessment of whether the fulfilment of the arrangement is dependent on the use of a specific asset or assets and the arrangement conveys a right to use the asset.
Operating lease payments are recognised as an expense in the statement of comprehensive income on a straight-line basis over the lease term.
Sale of goods and scrap
Revenue is recognised when the significant risks and rewards of ownership of the goods have passed to the buyer. Risk and rewards of ownership are considered passed to the buyer at the time of delivery of the goods to the customer.
ii. Foreign exchange gains & losses included in profit and loss
Foreign exchange gains and losses included in profit and loss includes:
Fair value adjustments on non-derivative financial assets such as foreign currency denominated loans. Fair value adjustments on foreign currency hedge instruments designated as fair value hedges. Foreign currency gains and losses on cash flow hedges that were deemed to be ineffective during the
accounting period.
For
per
sona
l use
onl
y

52 | AUSTA
Note 6.
i. Meas
Basicequityyear.
Diluteholdethe wpoten
ii. Inform
Optio
OptioOptiodilutedeterm
5,870earnincould
Perfo
Perfocalcurightsperfor
Therereport
Net profit after tax
Net profit attribu
Weighted average
Weighted avera
Effect of dilution
Options
Performan
Weighted avera
Earnings per shar
Basic earnings
Diluted earnings
AL LIMITED ANN
Earnings p
surement
c earnings pery holders of th
ed earnings pers of the pareweighted averantial ordinary s
mation conc
ons
ns granted ton Plan are cod earnings pemination of b
0,500 options ngs per share potentially d
ormance righ
rmance rightslation of dilute
s are not inclurmance rights
e have been nting date and
x
utable to ordinary equ
e number of ordinary
age number of ordina
n
ce Rights
age number of ordina
re
per share
s per share
REPOR
NUAL REPORT
per share
r share amouhe parent by
per share amoent by the weage number oshares into o
cerning the c
o employees onsidered to ber share to thasic earnings
granted undee because theilute basic ea
hts
s granted to eed earnings p
uded in the des is provided
no other transd the date of c
uity holders of the pa
y shares
ary shares (excluding
ary shares (excluding
RT TO THE M
2015
unts are calcuthe weighted
ounts are calcighted averagof ordinary shrdinary share
classification
under the Aube potential o
he extent that s per share. D
er the aforemey are not conarnings per sh
executives unper share as tetermination oin Note 30.
sactions involcompletion of
rent from continuing
reserved shares) for
reserved shares) ad
MEMBERS O
ulated by dividd average num
culated by divge number ofhares that woes.
n of securitie
stal Group Mordinary share
they are diluDetails relatin
mentioned plansidered to bhare in the fut
nder the Grouthe conditionof basic earni
lving ordinaryf these financ
operations
r basic earnings per s
justed for the effect o
OF AUSTAL L
ding net profitmber of ordina
viding the netf ordinary shauld be issued
es
Management Ses and have btive. The optig to the optio
ns are not incbe dilutive. (FYture.
up’s Long Ters would haveings per shar
y shares or pocial statement
share
of dilution
LIMITED
t for the year ary shares ou
profit attributares outstandd on the conv
Share Plan anbeen includedons have not
ons are set ou
cluded in the Y2014: 9,097
rm Incentive Pe been met at e. Further inf
otential ordinas.
$’000
Number
Number
Number
Number
$ / share
$ / share
attributable tutstanding du
table to ordinding during thversion of all t
nd Employeed in the detert been includeut in Note 30.
calculation o7,740). These
Plan are inclut balance sheformation abo
ary shares be
2015
53,225$
342,383,958
310,571
1,831,326
344,525,855
0.16$
0.15$
o ordinary uring the
ary equity e year plus the dilutive
Share rmination of ed in the
f diluted e options
uded in the eet date. The out the
etween the
2014
31,548$
342,042,581
294,589
399,105
342,736,275
0.09$
0.09$
For
per
sona
l use
onl
y

53 | AUSTA
Note 7.
Net profit after tax
Adjustments for:
Depreciation an
Net (gain) / loss
Net (gain) / loss
Share based pa
Net exchange d
Government gra
Total
Changes in assets
(Decrease) / inc
Income tax (c
Workers’ com
Warranty
Employee ben
Other provisio
(Increase) / dec
(Increase) / dec
(Increase) / dec
(Increase) / dec
(Decrease) / inc
(Decrease) / inc
(Decrease) / inc
(Decrease) / inc
Total
Net cash (outflow
AL LIMITED ANN
Reconciliat
x
nd amortisation
s on disposal of prope
s on disposal of intan
ayments
differences
ants income
s and liabilities:
crease in provisions f
current and deferred)
mpensation insurance
nefits
ons
crease in trade & othe
crease in inventories
crease in prepayment
crease in other financ
crease in trade and o
crease in progress pa
crease in derivative a
crease in governmen
) / inflow from opera
REPOR
NUAL REPORT
tion of net p
erty, plant and equipm
gible assets
for:
e
er receivables
ts
cial assets
other payables
ayments in advance
assets & liabilities
t grants
ating activities
RT TO THE M
2015
rofit after tax
ment
MEMBERS O
x to net cash
OF AUSTAL L
h flows from
2015
’000
53,156$
24,266$
457
-
1,373
(15,067)
(4,986)
6,043$
5,753$
6,225
(1,863)
(1,015)
(3,105)
4,483
(11,561)
(2,224)
-
56,506
(2,885)
(393)
1,314
51,235$
110,434$
LIMITED
operations
2014
’000
31,859$
23,776$
(3,582)
(903)
383
254
-
19,928$
(7,905)$
(1,222)
65
2,530
3,092
5,970
(58,646)
2,703
4,141
49,757
7,272
(17,916)
-
(10,159)$
41,628$
For
per
sona
l use
onl
y

54 | AUSTA
Note 8.
i. Divid
ii. Frank
Dividen
Decl
Prop
Opening
Fran
Fran
Move
Closing
AL LIMITED ANN
Dividends
dends on ord
king credit b
ds on Ordinary Sha
ared and paid during
posed and not recogn
g Balance
king credits that aros
king credits distribute
ement
g Balance
REPOR
NUAL REPORT
paid and pro
dinary shares
balance
ares
g the year (Fully frank
nised as a liability (Fu
se from the payment
ed
RT TO THE M
2015
oposed
s
ked dividend (1 cents
ully franked dividend (
of income tax instalm
MEMBERS O
per share))
(3 cents per share))
ments during the year
OF AUSTAL L
201
’00
$
(1$
201
’00
$
r $
$
$
LIMITED
5 201
0 ’00
(3,468) $
10,408) $
5 201
0 ’00
933 $
6,425 $
(1,487)
4,938 $
5,871 $
14
00
-
-
14
00
583
350
-
350
933
For
per
sona
l use
onl
y

55 | AUSTA
Note 9.
i. Incom
Major co
Consoli
Curr
C
A
T
Defe
R
A
T
Tota
Other C
Curr
C
Tota
Other eq
Curr
C
D
Tota
A recon
Acco
Inco
A
O
B
U
U
U
A
O
T
Inco
AL LIMITED ANN
Income and
me tax expen
omponents of tax ex
idated Profit & Loss
rent Income Tax
Current income tax ch
Adjustments in respec
Total
erred Income Tax
Relating to origination
Adjustments in respec
Total
al income tax (expen
Comprehensive Inco
rent and deferred inc
Current and deferred g
al (expense) / benefit
quity items
rent and deferred inc
Capital raising costs
Deferred gains on rev
al (expense) / benefit
nciliation between ta
ounting profit / (loss
ome tax at the Group
Adjustment for Austal
Other foreign tax rate
Branch (profit) / loss
US section 199 dome
Utilisation of research
Unrealised foreign exc
Adjustments in respec
Other non-assessable
Total Adjustments
ome tax (expense) / b
REPOR
NUAL REPORT
d other taxes
nse
xpense for the years
s
harge
ct of current income ta
n and reversal of temp
ct of deferred income
nse) / benefit
me (OCI)
come tax related ite
gains and losses on f
t charged to OCI
come tax related ite
valuation of property,
t charged to other e
ax expense and the
s) before income tax
p’s statutory income
USA statutory incom
differences
stic manufacturing de
and development an
change losses on inte
ct of current and defe
e or non-deductible ite
benefit reported in t
RT TO THE M
2015
s
s ended 30 June 201
ax of the previous ye
porary differences
tax of the previous y
ems charged or cred
foreign currency cont
ems charged or cred
plant and equipment
equity
product of accounti
x from continuing op
e tax rate of 30% (20
me tax rate of 36.9% (
eduction
nd other tax offsets an
ercompany loans
erred income tax of th
ems
he statement of com
MEMBERS O
15 and 2014 are:
ar
year
dited directly to OCI
tracts and consolidati
dited directly to othe
ing profit before inc
perations
014: 30%)
2014: 36.9%)
nd credits
e previous year
mprehensive income
OF AUSTAL L
ion adjustments
er equity items
ome tax multiplied b
e
LIMITED
2015
’000
(22,912)$
4,047
(18,865)$
(3,916)$
(4,756)
(8,672)$
(27,537)$
10,771$
10,771$
- $
-
- $
by the Group’s appl
80,693$
(24,208)$
(2,876)$
(462)
2
351
227
(83)
(709)
220
(3,329)$
(27,537)$
2014
’000
(13,224)$
7,863
(5,361)$
(1,549)$
(8,375)
(9,924)$
(15,285)$
1,082$
1,082$
- $
-
- $
icable income tax ra
47,144$
(14,142)$
(2,289)$
1,145
(865)
1,313
543
306
(513)
(783)
(1,143)$
(15,285)$
ate is as follows:
For
per
sona
l use
onl
y

REPORT TO THE MEMBERS OF AUSTAL LIMITED
56 | AUSTAL LIMITED ANNUAL REPORT 2015
ii. Analysis of temporary differences
iii. Recognition and measurement
Current tax assets and liabilities for the current and prior periods are measured at the amount expected to be recovered from or paid to the taxation authorities. The tax rates and tax laws used to compute the amount are those that are enacted or substantively enacted by the balance date.
Deferred income tax is provided on all temporary differences at the balance date between the tax bases of assets and liabilities and their carrying amounts for financial reporting purposes.
Deferred income tax liabilities are recognised for all taxable temporary differences except:
when the deferred income tax liability arises from the initial recognition of goodwill or of an asset or liability in a transaction that is not a business combination and, at the time of the transaction, affects neither the accounting profit nor taxable profit or loss; or
Statement of Financial Position Consolidated Profit & Loss
2015 2014 2015 2014
’000 ’000 ’000 ’000
Deferred income tax - USA
Deferred tax assets
Trade & other receivables 585$ 477$ - $ (150)$
Payables 7,418 17,205 12,393 8,518
Provisions 3,317 5,014 2,568 (865)
Grant liabilities 21,150 18,374 1,264 2,027
Losses available for offset against future taxable income - 5,092 5,655 3,771
Research and development tax credits - 19 23 3,879
Work Opportunity tax credits 1,558 - (1,410) 413
Charitable donations 40 33 - -
Inventories 168 - (168) -
Total 34,236$ 46,214$ 20,325$ 17,593$
Deferred tax liabilities
Property, plant and equipment (42,978)$ (36,916)$ (2,113)$ (2,291)$
Inventories - (276) (276) (1,571)
Total (42,978)$ (37,192)$ (2,389)$ (3,862)$
Deferred tax assets / (liabilities) - Net (8,742)$ 9,022$ 17,936$ 13,731$
Deferred income tax - Australia
Deferred tax assets
Trade & other receivables 1,774$ 3,827$ 2,055$ (581)$
Payables 800 284 (515) (176)
Provisions 3,918 4,859 938 (915)
Deferred gains and losses on foreign currency contracts 10,609 - - 2,306
Undeducted s.40-880 costs 358 539 176 (83)
Losses available for offset against future taxable income 231 218 (13) (218)
Research and development and other tax offsets - - - 204
Total 17,690$ 9,727$ 2,641$ 537$
Deferred tax liabilities
Property, plant and equipment (3,350)$ (3,404)$ (53)$ (318)$
Inventories - (11,655) (11,660) (3,644)
Deferred gains and losses on foreign currency contracts (251) (1,295) (192) (382)
Total (3,601)$ (16,354)$ (11,905)$ (4,344)$
Deferred tax assets / (liabilities) - Net 14,089$ (6,627)$ (9,264)$ (3,807)$
Deferred tax expense / (income) booked to Consolidated Profit & Loss 8,672$ 9,924$
For
per
sona
l use
onl
y
REPORT TO THE MEMBERS OF AUSTAL LIMITED
57 | AUSTAL LIMITED ANNUAL REPORT 2015
when the taxable temporary differences associated with investments in subsidiaries, associates or interests in joint ventures, and the timing of the reversal of the temporary differences can be controlled and it is probable that the temporary differences will not reverse in the foreseeable future.
deferred income tax assets are recognised for all deductible temporary differences, carry-forward of unused tax assets and unused tax losses, to the extent that it is probable that taxable profit will be available against which the deductible temporary differences, and the carry-forward of unused tax assets and unused tax losses can be utilised except:
when the deferred income tax asset relating to the deductible temporary difference arises from the initial recognition of an asset or liability in a transaction that is not a business combination and, at the time of the transaction, affects neither the accounting profit nor taxable profit or loss; or
when the deductible temporary differences is associated with investments in subsidiaries, associates and interests in joint ventures in which case a deferred tax asset is only recognised to the extent that it is probable that the temporary differences will reverse in the foreseeable future and taxable profit will be available against which the temporary
The carrying amount of deferred income tax assets is reviewed at each balance date and reduced to the extent that it is no longer probable that sufficient taxable profit will be available to allow all or part of the deferred income tax asset to be utilised.
Unrecognised deferred income tax assets are reassessed at each balance date and are recognised to the extent that it has become probable that future taxable profit will allow the deferred tax asset to be recovered.
Deferred income tax assets and liabilities are measured at the tax rates that are expected to apply to the year when the asset is realised or the liability is settled, based on tax rates (and tax laws) that have been enacted or substantively enacted at the balance date.
Income taxes relating to items recognised directly in equity are recognised in equity and not in the statement of comprehensive income.
Deferred tax assets and deferred tax liabilities are offset only if a legally enforceable right exists to set off current tax assets against current tax liabilities and the deferred tax assets and liabilities relate to the same taxable entity and the same taxation authority.
iv. Tax consolidation
Austal Limited (‘the Company’) is the head entity in a tax-consolidated Group comprising the Company and its 100% owned Australian resident subsidiaries. The implementation date of the tax consolidated system for the tax-consolidated Group was 1 July 2002. Members of the Group have entered into a tax sharing arrangement in order to allocate income tax expense to the wholly owned subsidiaries on a pro-rata basis. The agreement provides for the allocation of income tax liabilities between the entities should the head entity default on its tax payment obligations. The possibility of default was assessed to be remote at the balance date.
v. Tax effect by members of the tax consolidated Group
The current and deferred tax amounts for the tax-consolidated Group are allocated among the entities in the Group using a stand-alone taxpayer approach whereby each entity in the tax-consolidated Group measures its current and deferred taxes as if it continued to be a separately taxable entity in its own right. Deferred tax assets and deferred tax liabilities are measured by reference to the carrying amounts of the assets and liabilities in each entity’s statement of financial position and their tax values applying under tax consolidation.
Any current tax liabilities (or assets) and deferred tax assets arising from unused tax losses assumed by the head entity from the subsidiaries in the tax consolidated Group are recognised in conjunction with any tax funding arrangement amounts (refer below).
The Group recognises deferred tax assets arising from unused tax losses of the tax-consolidated Group to the extent that it is probable that future taxable profits of the tax-consolidated Group will be available against which the asset can be utilised.
Any subsequent period adjustments to deferred tax assets arising from unused tax losses assumed from subsidiaries are recognised by the head entity only.
For
per
sona
l use
onl
y

REPORT TO THE MEMBERS OF AUSTAL LIMITED
58 | AUSTAL LIMITED ANNUAL REPORT 2015
The members of the tax-consolidated Group have entered into a tax funding arrangement which sets out the funding obligations of members of the tax-consolidated Group in respect of tax amounts. The tax funding arrangements require payments to / from the head entity equal to the current tax liability (asset) assumed by the head entity and any tax-loss deferred tax asset assumed by the head entity.
No amounts have been recognised as tax consolidation contribution/distribution adjustments in preparing the accounts for the parent company for the current year.
vi. Significant accounting judgements and estimates
Deferred tax assets are recognised for deductible temporary differences as management considers that it is probable that future taxable profits will be available to utilise those temporary differences.
Uncertainties exist with respect to the interpretation of complex tax regulations, changes in tax laws, and the amount and timing of future taxable income. Given the wide range of international business relationships and the long-term nature and complexity of existing contractual agreements, differences arising between the actual results and the assumptions made, or future changes to such assumptions, could necessitate future adjustments to tax income and expense already recorded. The Group establishes provisions, based on reasonable estimates, for possible consequences of audits by the tax authorities of the respective counties in which it operates. The amount of such provisions is based on various factors, such as experience of previous tax audits and differing interpretations of tax regulations by the taxable entity and the responsible tax authority. Such differences in interpretation may arise for a wide variety of issues depending on the conditions prevailing in the respective domicile of the Group companies.
Deferred tax assets are recognised for unused tax losses to the extent that it is probable that taxable profit will be available against which the losses can be utilised. Significant management judgement is required to determine the amount of deferred tax assets that can be recognised, based upon the likely timing and the level of future taxable profits together with future tax planning strategies.
vii. Other taxes
Revenues, expenses and assets are recognised net of the amount of GST except:
when the GST incurred on a purchase of goods and services is not recoverable from the taxation authority, in which case the GST is recognised as part of the cost of acquisition of the asset or as part of the expense item as applicable; and
receivables and payables, which are stated with the amount of GST included.
The net amount of GST recoverable from, or payable to, the taxation authority is included as part of receivables or payables in the statement of financial position.
Cash flows are included in the statement of cash flows on a gross profit basis and the GST component of cash flows arising from investing and financing activities, which is recoverable from, or payable to, the taxation authority, are classified as operating cash flows.
Commitments and contingencies are disclosed net of the amount of GST recoverable from, or payable to, the taxation authority.
For
per
sona
l use
onl
y

59 | AUSTA
Capital s
Note 10.
i. Reco
Cash short-
Cash guara
Current
Cash at bank a
Restricted cash
Total Cash per Ca
1. Unutilised Go Z
AL LIMITED ANN
structure
Cash and c
ognition and
and short-te-term deposit
and cash eqantee for the p
nd in hand
h 1
ash Flow Statement
Zone Bond funds may
REPOR
NUAL REPORT
cash equival
measureme
rm deposits its with an orig
uivalents conpurposes of t
y only be spent on tho
RT TO THE M
2015
ents
nt
n the statemeginal maturity
nsist of cash ahe Cash Flow
$
$
ose capital works pro
MEMBERS O
ent of financiay of three mon
and cash equw Statement.
2015
’000
138,413 $
10,055
148,468 $
ojects that were speci
OF AUSTAL L
al position conths or less.
uivalents as d
2014
’000
74,428
9,532
83,960
ifically identified in th
LIMITED
mprise cash a
efined above
e documentation issu
at bank and i
e, net of cash
ued to investors.
n hand and
held as a
For
per
sona
l use
onl
y

60 | AUSTA
Note 11.
1. The Bank loa2. The Go Zone
Bonds maturrate of appro
3. The Finance rate of 1.7%
i. Reco
All loaattribuamort
Gainsderec
ii. Go Zo
The Gby thewere maturFY20
Go Zoof 0.0syndihave was 2
AustaUS$1
Austaterm oor befto tha
Austalettersappoiexpec
Current
Revolving Cred
Finance Lease
Bank Loan (un
Go Zone Bond
Total
Non - Current
Go Zone Bond
Finance Lease
Total
Total
AL LIMITED ANN
Interest be
an was payable by e Bonds of US$111re on 1 May 2041 woximately 2.8% in FY
leases are used toin FY2015.
ognition and
ans and borroutable transatised cost usi
s and losses acognised.
one Bonds
Gulf Opportune US Federalaffected by Hrity to invest i13.
one Bonds ar043% in FY20cate with a mbeen disclos
2.30%.
al has redeem11.740 millio
al has the optof the indebtefore 31 Dece
at date.
al is in the pros of credit secinted and a tected to occur
dit Facility
es (3)
secured) (1)
s (2)
s (2)
es (3)
REPOR
NUAL REPORT
aring loans
instalments until O.740 million are va
whilst the Letters of Y2015.
o fund mobile equip
measureme
owings are inction costs. Inng the effecti
are recognise
nity Zone Bon Government
Hurricane Katn the develop
re tax-exemp015. GZB bon
maturity date oed as current
med (repaid) aon at 30 June
ion of redeemedness with amber 2015 o
ocess of re-fincuring the GZerm sheet hasearly in FY20
RT TO THE M
2015
and borrowi
ctober 2014, with ariable rate demand Credit mature on 3
ment and a plot of
nt
itially recogninterest-bearinive interest m
ed in the state
nds (Go Zonet to incentivistrina in 2005. pment of ship
t municipal bondholders areof 31 Decembt at the report
a cumulative 2015.
ming the outsta 30 day noticr may extend
nancing the SZB by a minims been signed016.
2015
’000
- $
(1,7
-
(145,1
(146,9$
- $
(7,6
(7,6$
(154,5$
MEMBERS O
ngs
an average variable bonds that are wra
31 December 2015.
land in Austal USA
ised at the fang loans and
method.
ement of com
e Bonds or GZe private inveAustal qualif
pbuilding infra
onds in the Ue secured by lber 2015 andting date. The
amount of ~
tanding GZB ce to bondhold the debt by o
Syndicated Famum term of td. Full docum
2014
’000
(12,0$
91) -
(1,1
13) -
04) (13,1$
(142,2$
58) -
58) (142,2$
62) (155,4$
OF AUSTAL L
e interest rate of 4.3apped by Letters of The Bonds are pa
A. The leases have
ir value of theborrowings a
mprehensive i
ZB) are a formestment in inffied to borrowastructure in A
United States letters of cred hence all liabe average cos
US$112 millio
balance, in wlders. Austal obtaining an
acility with thethree years. A
mentation is b
000)
92)
92)
264)
264)
456)
LIMITED
3% in FY2015. f Credit that are proyable in US dollars
a term of 5 years a
e consideratioare subseque
ncome when
m of indebtedfrastructure in
w US$225.000Austal USA b
and attracteddit issued by Abilities relatinst of the lette
on of GZB fun
whole or in pamay choose textension to t
e intention of A mandated leeing prepared
ovided under the SFs with an average e
and incurred interes
on received leently measure
the liabilities
dness that wan geographica0 million with between FY20
d an average Austal’s bankg to the SFA rs of credit in
nds and owes
art, at any timto redeem ththe letters of
extending / reead arrangerd and financi
FA. The Go Zone ffective interest
st at an average
ess directly ed at
s are
as authorised al areas that a 30 year
008 &
coupon rate king agreement FY2015
s
e during the ese bonds atcredit prior
enewing the r has been al close is
t For
per
sona
l use
onl
y

REPORT TO THE MEMBERS OF AUSTAL LIMITED
61 | AUSTAL LIMITED ANNUAL REPORT 2015
iii. Banking facilities
1. The Revolving Credit Facility is provided under a Syndicated Facility Agreement (SFA) which was executed on 19 July 2013. The maturity of the
SFA is 31 December 2015. Funds borrowed under the Revolving Credit Facility in FY2015 incurred an average variable interest rate of 4.5%. 2. The Finance leases are used to fund mobile equipment and a plot of land in Austal USA. The leases have a term of 5 years and incurred interest at
an average rate of 1.7% in FY2015 3. The Bank loan was payable by instalments until October 2014, with an average variable interest rate of 4.3% in FY2015 4. The Go Zone Bonds of US$111.740 million are variable rate demand bonds that are wrapped by Letters of Credit that are provided under the SFA.
The Go Zone Bonds mature on 1 May 2041 whilst the Letters of Credit mature on 31 December 2015. The Bonds are payable in US dollars with an average effective interest rate of approximately 2.8% in FY2015.
5. The Contingent Instrument Facility is used to support letters of credit (excluding the letters of credit supporting the Go Zone Bonds), performance bonds and other financial and non-financial guarantees (refer to Note 25).
iv. Fair value of borrowings
The fair values of all classes of borrowings are not materially different to their carrying amounts since the interest payable on those borrowings is either close to current market rates or the borrowings are of a short-term nature.
2015 2014
’000 ’000
Facilities used at reporting date
Revolving Credit Facility (1) - $ (12,000)$ Finance Leases (2) (9,449) - Bank Loan (unsecured) (3) - (1,192) Go Zone Bonds (4) (145,113) (142,264) Contingent Instrument Facility (5) (79,965) (41,605)
Total (234,527)$ (197,061)$
Facilities unused at reporting date
Revolving Credit Facility (1) (50,000)$ (38,000)$ Finance Leases (2) (3,220) - Bank Loan (unsecured) (3) - - Go Zone Bonds (4) - - Contingent Instrument Facility (5) (20,035) (58,395)
Total (73,255)$ (96,395)$
Total Facilities Available
Revolving Credit Facility (1) (50,000)$ (50,000)$ Finance Leases (2) (12,669) - Bank Loan (unsecured) (3) - (1,192) Go Zone Bonds (4) (145,113) (142,264) Contingent Instrument Facility (5) (100,000) (100,000)
Total (307,782)$ (293,456)$
For
per
sona
l use
onl
y

62 | AUSTA
Note 12.
i. Reco
Ordin
Ordinor opt
Ordin
Fully
Rese
Own ePlan astateminstru
Refer
ii. Move
The mMr An
Mr AnH1 shweighfor 92share
Ordinary Shares o
1 July
Shares issued d
30 June
Reserved Shares
1 July
Movement in Re
30 June
Net
Ordinary
1 Jul
CEO
Divid
30 Ju
AL LIMITED ANN
Contribute
ognition and
nary shares
nary shares artions are show
nary shares ha
paid ordinary
rved shares
equity instrumare classifiedment of comp
uments.
r to Note 30 fo
ements in ord
movement in ndrew Bellam
ndrew Bellamhares were ishted average 2,602 shares.es were issue
n Issue
during the year
eserved shares
y Shares on Issue
y
O - Mr Andrew Bellamy
dend reinvestment pla
une
REPOR
NUAL REPORT
d equity and
measureme
re classified awn in equity a
ave no par va
y shares carry
ments which ad as reserved prehensive inc
or more inform
dinary share
ordinary sharmy’s contract o
my’s FY2014 esued on 2 Feprice (VWAP A dividend re
ed under the D
y
n
RT TO THE M
2015
d reserves
nt
as equity. Incas a deductio
alue and the c
y one vote pe
are issued anshares and a
come on the
mation in rela
e capital
res during yeaof employmen
employment cebruary 2015.P) on which theinvestment pDRP during F
201
346,54
3
346,92
(4,35
33
(4,0
342,90
MEMBERS O
cremental coson, net of tax,
company doe
er share and c
nd held by a tare deducted purchase, sa
ation to the Au
ar ended 30 Jnt as well as
contract shar. (Refer to thehe shares weplan (DRP) w
FY2015 at a p
Shares
15 201
44,933 346,17
78,518 37
23,451 346,54
50,601) (4,35
35,062
15,539) (4,35
07,912 342,19
OF AUSTAL L
sts directly at from the pro
es not have a
carry the right
trustee under from equity.
ale, issue or c
ustal Group M
June 2015 is a Dividend R
es were issuee Remuneratire issued was
was introduceprice of $1.72
14
73,195 $
71,738 $
44,933 $
50,601) $
- $
50,601) $
94,332 $
LIMITED
ttributable to tceeds of the
limited amou
t to dividends
Austal Group No gain or lo
cancellation o
Management
comprised ofReinvestment
ed on 17 Novon Report ons $1.04 for 22d during FY2per share.
’000
2015
121,210 $
543 $
121,753 $
(9,612) $
382 $
(9,230) $
112,523 $
2015
346,544,933
320,236
58,282
346,923,451
the issue of nnew shares o
unt of authori
s.
p Managemeoss is recogn
of the Group’s
Share Plan.
f shares issueplan.
vember 2014 n page 15). T27,634 share
2015. 58,282
2014
120,940
270
121,210
(9,612)
-
(9,612)
111,598
Shares
2014
3 346,173,195
6 371,738
2 -
1 346,544,933
new shares or options.
sed capital.
ent Share ised in the
s own equity
ed as part of
and FY2015 he volume s and $1.31 additional
5
8
3
For
per
sona
l use
onl
y

REPORT TO THE MEMBERS OF AUSTAL LIMITED
63 | AUSTAL LIMITED ANNUAL REPORT 2015
iii. Nature & purpose of reserves
Foreign currency translation reserve (FCTR)
This reserve is used to record exchange differences arising from the translation of the financial statements of foreign subsidiaries. Employee benefits reserve
This reserve is used to record the value of equity benefits provided to employees and Directors as part of their remuneration. Refer to Note 30 for further details of share based payment plans for the Group.
Cash flow hedge reserve
This reserve records the portion of the gain or loss on a hedging instrument in a cash flow hedge that is determined to be an effective hedge. Common control reserve
This reserve represents the premium paid on the acquisition of the minority interest in a controlled entity. Asset revaluation reserve
This reserve is used to record increases in the fair value of land and buildings.
For
per
sona
l use
onl
y
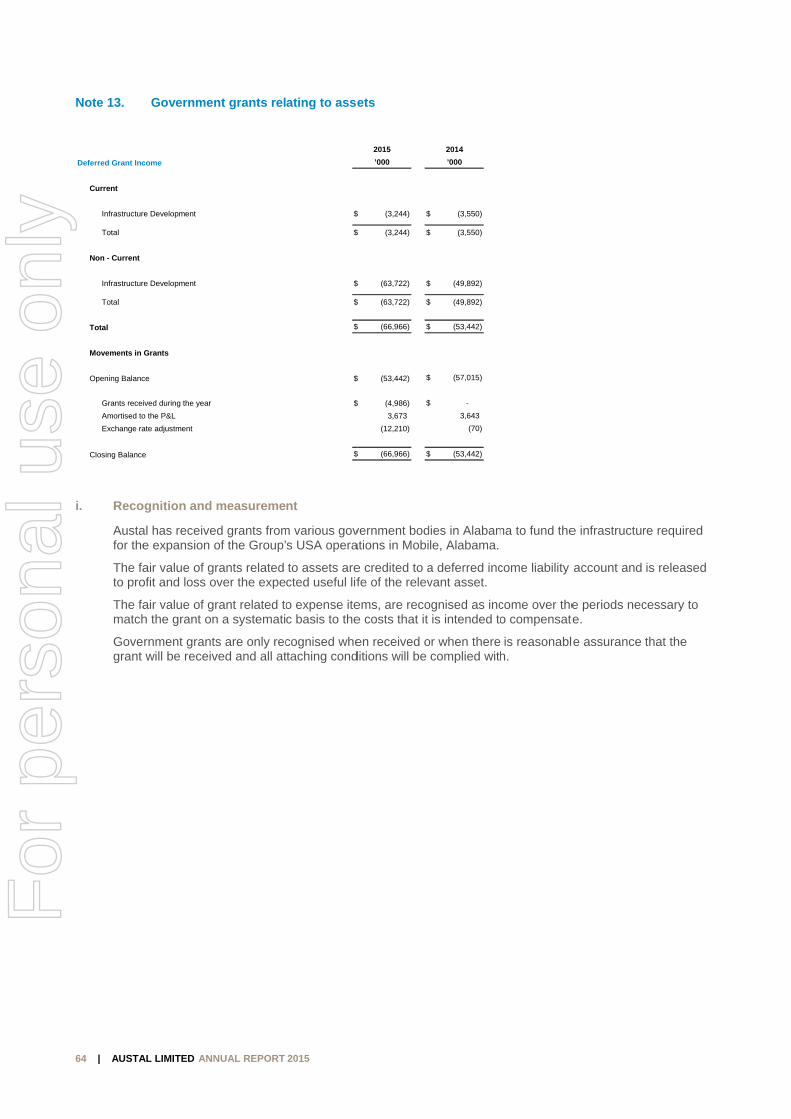
64 | AUSTA
Note 13.
i. Reco
Austafor the
The fato pro
The famatch
Govegrant
Deferred Grant Inc
Current
Infrastructur
Total
Non - Current
Infrastructur
Total
Total
Movements in
Opening Balanc
Grants rece
Amortised to
Exchange ra
Closing Balance
AL LIMITED ANN
Governmen
ognition and
al has receivee expansion o
air value of gofit and loss o
air value of gh the grant on
rnment grantwill be receiv
come
re Development
re Development
Grants
ce
ived during the year
o the P&L
ate adjustment
e
REPOR
NUAL REPORT
nt grants rel
measureme
ed grants fromof the Group’
rants related over the expe
rant related ton a systemati
ts are only recved and all at
RT TO THE M
2015
ating to asse
nt
m various govs USA opera
to assets arected useful lif
o expense itec basis to the
cognised whettaching cond
$
$
$
$
$
$
$
$
MEMBERS O
ets
vernment bodations in Mobi
e credited to afe of the relev
ems, are recoe costs that it
en received oditions will be
2015
’000
(3,244)$ $
(3,244)$ $
(63,722)$ $
(63,722)$ $
(66,966)$ $
(53,442)$ $
(4,986)$ $
3,673
(12,210)
(66,966)$ $
OF AUSTAL L
dies in Alabamle, Alabama.
a deferred incvant asset.
ognised as incis intended to
or when therecomplied with
2014
’000
(3,550)$
(3,550)$
(49,892)$
(49,892)$
(53,442)$
(57,015)$
- $
3,643
(70)
(53,442)$
LIMITED
ma to fund the
come liability
come over theo compensate
is reasonablh.
e infrastructur
account and
e periods necte.
e assurance
re required
is released
cessary to
that the
For
per
sona
l use
onl
y

65 | AUSTA
Working
Note 14.
i. Reco
Tradeamouthere when
ii. Impa
Individdirectthat aimpaithere
Recethere
Impaiamou
Current
Trade amounts
Allowance for d
Total
Non - Current
Trade amounts
Total
Total
AL LIMITED ANN
g capital
Trade and
ognition and
e receivables unt less an all
is objective e identified.
ired trade re
dual receivabtly. The other an impairmenrment lossesis evidence o
significant f
probability t
default or d
ivables for whis no expecta
irment lossesunts previousl
owing by unrelated e
doubtful debts
owing by unrelated e
REPOR
NUAL REPORT
other receiv
measureme
which are wiowance for a
evidence that
eceivables
bles which arereceivables a
t has been in are recognisof impairment
inancial diffic
that the debto
elinquency in
hich an impaiation of recov
s are recognisly written off a
entities
entities
RT TO THE M
2015
ables
nt
thin the normany uncollectibt the Group w
e known to beare assessedcurred but no
sed in a separt if any of the
ulties of the d
or will enter ba
n payments (m
irment provisivering additio
sed in profit oare credited a
MEMBERS O
mal credit termble amounts.
will not be able
e uncollectibld collectively tot yet been idrate impairme following ind
debtor
ankruptcy or
more than 90
ion was recognal cash.
or loss within oagainst other
$
$
$
$
$
OF AUSTAL L
ms are recogn An allowance to collect th
e are written to determine
dentified. For tent allowance
dicators are p
financial reor
days overdu
gnised are wr
other expensexpenses.
2015
’000
104,431 $
(89)
104,342 $
157 $
157 $
104,499 $
LIMITED
nised and carce for doubtfue debts. Bad
off by reducinwhether therthese receivae account. Thresent:
rganisation, a
e).
ritten off agai
es. Subseque
2014
’000
95,842
(89)
95,753
1,020
1,020
96,773
rried at originaul debts is mad debts are w
ng the carryinre is objectiveables the estihe Group con
and
inst the provis
ent recoverie
al invoice ade when
written off
ng amount e evidence mated siders that
sion when
es of
For
per
sona
l use
onl
y
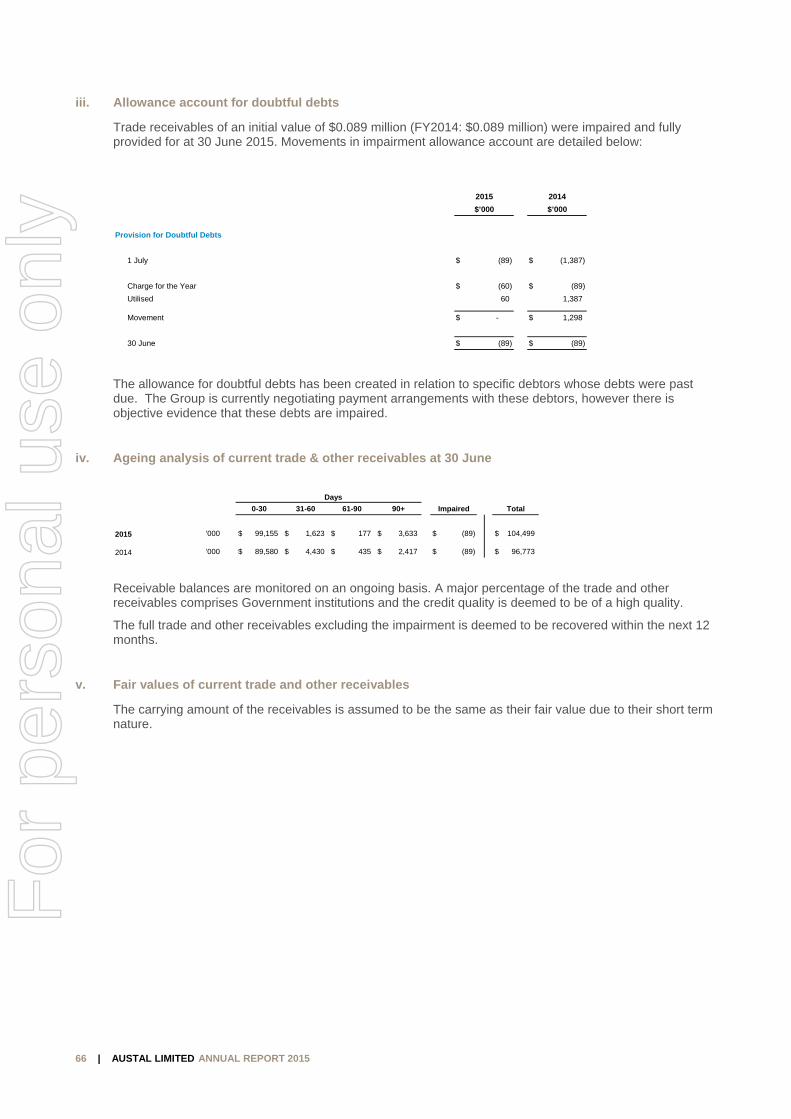
REPORT TO THE MEMBERS OF AUSTAL LIMITED
66 | AUSTAL LIMITED ANNUAL REPORT 2015
iii. Allowance account for doubtful debts
Trade receivables of an initial value of $0.089 million (FY2014: $0.089 million) were impaired and fully provided for at 30 June 2015. Movements in impairment allowance account are detailed below:
The allowance for doubtful debts has been created in relation to specific debtors whose debts were past due. The Group is currently negotiating payment arrangements with these debtors, however there is objective evidence that these debts are impaired.
iv. Ageing analysis of current trade & other receivables at 30 June
Receivable balances are monitored on an ongoing basis. A major percentage of the trade and other receivables comprises Government institutions and the credit quality is deemed to be of a high quality.
The full trade and other receivables excluding the impairment is deemed to be recovered within the next 12 months.
v. Fair values of current trade and other receivables
The carrying amount of the receivables is assumed to be the same as their fair value due to their short term nature.
2015 2014
$’000 $’000
Provision for Doubtful Debts
1 July (89)$ (1,387)$
Charge for the Year (60)$ (89)$
Utilised 60 1,387
Movement - $ 1,298$
30 June (89)$ (89)$
Days
0-30 31-60 61-90 90+ Impaired Total
2015 ’000 99,155$ 1,623$ 177$ 3,633$ (89)$ 104,499$
2014 ’000 89,580$ 4,430$ 435$ 2,417$ (89)$ 96,773$
For
per
sona
l use
onl
y

67 | AUSTA
Note 15.
i. Reco
Constany ppercedate a
ii. Signi
Refer
Note 16.
i. Reco
Stockprodu
Work in Progress
Construction re
less Progress p
Total due from c
Progress Paymen
Construction re
less Progress p
Total due to cus
Total due from / (t
Inventories
Work in progres
Other stock
Total
AL LIMITED ANN
Constructi
ognition and
truction work provision for aentage of comas a proportio
ificant accou
r to Note 4 for
Inventories
ognition and
k and finisheduction overhe
venue recognised to
payments received &
customers
ts Received in Adva
venue recognised to
payments received &
stomers
to) customers
ss
REPOR
NUAL REPORT
on contracts
measureme
in progress ianticipated futmpletion basison of estimate
unting judge
r details of es
s and work in
measureme
d goods are vads. Cost of s
date
receivable
ance
date
receivable
RT TO THE M
2015
s in progress
nt
s valued at cture losses ans. Percentageed total contra
ments and e
stimates made
n progress
nt
alued at the lstock is deter
$
$
$
$
$
Not
15
MEMBERS O
s
contract cost ind progress b
e of completioact costs.
estimates
e regarding c
lower of cost rmined on the
2015
’000
5,636,779 $
(5,299,051)
337,728 $
266,437 $
(292,614)
(26,177) $
311,551 $
2015
tes ’000
5 33$
33$
OF AUSTAL L
ncurred to dabillings. Conson is determin
construction c
and net realise weighted av
2014
’000
3,603,494
(3,275,969)
327,525
204,322
(233,384)
(29,062)
298,463
5 2014
0 ’000
7,728 32$
1,975
9,703 32$
LIMITED
ate, plus profistruction profitned by referen
contracts.
sable value, wverage cost b
4
0
7,525
617
8,142
it recognised ts are recognnce to actual
where costs ibasis.
to date, less nised on the
costs to
nclude
For
per
sona
l use
onl
y
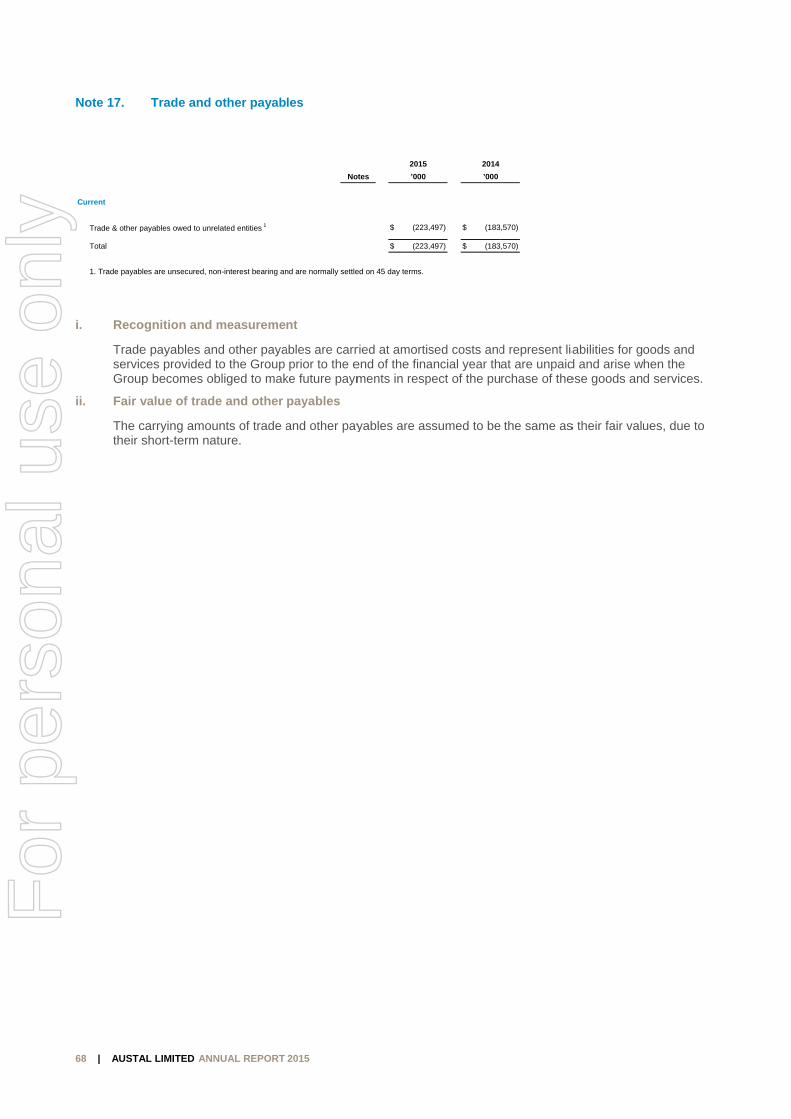
68 | AUSTA
Note 17.
i. Reco
TradeservicGroup
ii. Fair v
The ctheir s
Current
Trade & other p
Total
1. Trade payabl
AL LIMITED ANN
Trade and
ognition and
e payables ances provided p becomes ob
value of trad
carrying amoushort-term na
payables owed to unre
les are unsecured, no
REPOR
NUAL REPORT
other payab
measureme
nd other payato the Group bliged to mak
e and other
unts of trade aature.
elated entities 1
on-interest bearing an
RT TO THE M
2015
les
nt
ables are carrprior to the e
ke future paym
payables
and other pay
No
nd are normally settle
MEMBERS O
ried at amortisend of the finaments in resp
yables are as
2015
otes ’000
(223,$
(223,$
ed on 45 day terms.
OF AUSTAL L
sed costs andancial year thpect of the pu
ssumed to be
2014
’000
,497) (183$
,497) (183$
LIMITED
d represent liaat are unpaidrchase of the
the same as
,570)
,570)
abilities for god and arise wese goods an
s their fair valu
oods and hen the d services.
ues, due to
For
per
sona
l use
onl
y

69 | AUSTA
Infrastru
Note 18.
i. Net c
ii. Reco
Balance
Gros
at fai
at co
Accu
Net C
Balance
Gros
at fai
at co
Accu
Net C
Balance
Addit
Trans
Dispo
Depr
Exch
Total
Balance
Addit
Trans
Dispo
Depr
Exch
Total
Balance
AL LIMITED ANN
ucture & o
Property, p
carrying amo
onciliation of
e 1 July 2014
s carrying amount
r value
ost
umulated Depreciation
Carrying Amount
e 30 June 2015
s carrying amount
r Value
ost
umulated Depreciation
Carrying Amount
e 1 July 2013
tions
sfer in / (out)
osals
reciation charge for th
hange Adjustment
l
e 1 July 2014
tions
sfer in / (out)
osals
reciation charge for th
hange Adjustment
l
e 30 June 2015
REPOR
NUAL REPORT
other ass
plant and equ
ount
f movement f
n & Impairment
n & Impairment
he year
he year
RT TO THE M
2015
ets
uipment
for the year
MEMBERS O
Freehold
Land &
Buildings
’000
316,78$
16,40
(29,37
303,81$
389,02$
13,83
(45,17
357,69$
Freehold
Land &
Buildings
’000
323,87$
2,26$
7,93
(16,76
(8,70
(4,78
(20,05$
303,81$
4,95$
(1,15
(2,13
(9,46
61,67
53,87$
357,69$
OF AUSTAL L
d
Plant &
s Equipment
’000
86 - $ $
04 122,974
70) (61,114)
19 61,859$ $
26 - $ $
38 155,590
73) (82,461)
90 73,128$ $
d
Plant &
s Equipment
’000
78 71,894$ $
69 5,230$ $
30 (205)
66) (1,611)
07) (12,886)
85) (563)
59) (10,035)$ $
19 61,859$ $
55 12,816$ $
54) 2,118
39) (658)
65) (13,271)
74 10,264
71 11,269$ $
90 73,128$ $
LIMITED
Capital
WIP T
’000 ’0
- 3$
822 1
- (
822 3$
- 3$
11,704 1
- (1
11,704 4$
Capital
WIP T
’000 ’0
4,145 3$
4,385 $
(7,725)
- (
- (
17
(3,323) ($
822 3$
10,355 $
(964)
(15)
- (
1,506
10,882 $
11,704 4$
otal
000
316,786
40,200
(90,486)
366,500
389,025
81,132
27,635)
442,522
otal
000
399,917
11,884
-
(18,377)
(21,593)
(5,331)
(33,417)
366,500
28,126
-
(2,812)
(22,736)
73,444
76,022
442,522
For
per
sona
l use
onl
y

REPORT TO THE MEMBERS OF AUSTAL LIMITED
70 | AUSTAL LIMITED ANNUAL REPORT 2015
iii. Recognition and measurement
Plant and equipment is stated at cost less accumulated depreciation and any accumulated impairment losses.
Land and buildings are measured at fair value less accumulated depreciation on buildings and any impairment losses recognised after the date of revaluation. Valuations are performed frequently to ensure that the fair value of a revalued asset does not differ materially from its carrying value.
The carrying amount would be as follows if land and buildings were measured using the cost model.
Any revaluation surplus is recorded in other comprehensive income and hence credited to the asset revaluation reserve in equity, except to the extent that it reverses a revaluation decrease of the same asset previously recognised in the statement of comprehensive income, in which case, the increase is recognised in the profit and loss.
A revaluation deficit is recognised in the statement of comprehensive income except to the extent that it offsets an existing surplus on the same asset recognised in the asset revaluation reserve.
Accumulated depreciation as at the revaluation date is eliminated against the gross carrying amount of the asset and the net amount is restated to the revalued amount of the asset. Upon disposal, any revaluation reserve relating to the particular asset being sold is transferred to retained earnings.
iv. Depreciation
Depreciation is calculated on a straight-line or diminishing value basis over the estimated useful life of the asset.
The following useful lives have been adopted as follows:
Buildings – over 20 to 40 years
Plant and equipment – over 2 to 10 years
The assets’ residual values, useful lives and amortisation methods are reviewed, and adjusted at the end of each financial year if appropriate.
v. Impairment
The carrying values of plant and equipment are reviewed for impairment at each reporting date, with recoverable amount being estimated when events or changes in circumstances indicate the carrying value of the asset may be impaired.
The recoverable amount of plant and equipment is the higher of fair value less costs to sell and value in use. The estimated future cash flows are discounted to their present value using a pre-tax discount rate that reflects current market assessments of the time value of money and the risks specific to the asset in assessing value in use.
For an asset that does not generate largely independent cash inflows, recoverable amount is determined for the cash-generating unit to which the asset belongs, unless the asset’s value in use can be estimated to be close to its fair value.
An impairment exists when the carrying value of an asset or a cash-generating unit exceeds its estimated recoverable amount. The asset or cash-generating unit is then written down to its recoverable amount.
Impairment losses on plant and equipment are recognised in the statement of comprehensive income.
The asset or cash-generating unit that suffered an impairment is tested for possible reversal of the impairment whenever events or changes in circumstances indicate that the impairment may have reversed.
2015 2014
Land & Buildings valued using cost model ’000 ’000
Cost 379,023$ 297,012$
Accumulated Depreciation & Impairment (57,933) (40,311)
Net Carrying Amount 321,090$ 256,701$
For
per
sona
l use
onl
y
REPORT TO THE MEMBERS OF AUSTAL LIMITED
71 | AUSTAL LIMITED ANNUAL REPORT 2015
vi. De-recognition and disposal
An item of property, plant and equipment is derecognised upon disposal or when no further future economic benefits are expected from its use.
Any gain or loss arising on de-recognition of the asset (calculated as the difference between the net disposal proceeds and the carrying amount of the asset) is included in the profit and loss in the year the asset is derecognised.
vii. Key judgements and accounting estimates
Impairment of non-financial assets
The Group assesses, at each reporting date, whether there is an indication that an asset may be impaired. As part of the assessment, the Group considered impairment triggers including observable indications, significant market, technological, economic or legal changes that have occurred, significant decreases in market interest rates or market rates of return, the market capitalisation of the Group compared to the net assets of the Group, evidence that any major asset or process is obsolete or damaged and other evidence from internal reporting. There were no impairment triggers which were identified and therefore no specific impairment test was required for assets excluding goodwill.
Goodwill is tested annually for impairment regardless of whether impairment triggers are identified. The key assumptions used to determine the recoverable amount for the Australia cash-generating unit (CGU) are disclosed and further explained in Note 19.
viii. Key judgements and accounting estimates
Estimation of useful lives of assets
The estimation of the useful lives of assets has been based on historical experience. In addition, the condition of the assets is assessed at least once per year and considered against the remaining useful life. Adjustments to useful life are made when considered necessary. Revaluation of land and buildings
Information about the valuation of land and buildings is provided in Note 22.
For
per
sona
l use
onl
y

72 | AUSTA
Note 19.
i. Reco
Intangany aassetprofit
The ufinite that thintangexpecassetin accstatemasset
A sum
Rese
Reseaas an
t
i
h
t
t
Balance 1 July 201
Additions
Amortisation for
Disposals
Exchange Adjus
Total
Balance 30 June 2
Balance 1 July 201
Cost
Accumulated Am
Net Carrying Am
Balance 30 June 2
Cost
Accumulated Am
Net Carrying Am
AL LIMITED ANN
Intangible
ognition and
gible assets aaccumulated ats, excluding cor loss in the
useful lives oflives are amohe intangible gible asset wicted useful lift are accountecounting estimment of compt.
mmary of the
arch and de
arch costs arn intangible as
the technical
its intention to
how the asse
the availabilit
the ability to m
14
r the year
stment
2015
14
mortisation & Impairm
mount
2015
mortisation & Impairm
mount
REPOR
NUAL REPORT
assets
measureme
acquired sepaamortisation acapitalised de
e year in whic
f intangible asortised over thasset may beith a finite usefe or the expeed for by chamate. The amprehensive inc
policies appl
velopment c
re expensed asset when the
feasibility of c
o complete an
et will generat
y of resource
measure relia
ment
ment
RT TO THE M
2015
nt
arately are iniand any accuevelopment c
ch the expend
ssets are asshe useful life e impaired. Teful life are re
ected pattern nging the am
mortisation excome in the e
ied to the Gro
costs
as incurred. De Group can d
completing th
nd its ability t
te future econ
es to complete
ably the expe
$
$
$
$
$
$
$
$
MEMBERS O
itially measurumulated impcosts, are not diture is incurr
essed to be eand assesse
The amortisateviewed at leaof consumpti
mortisation perxpense on intexpense cate
oup’s intangib
Development demonstrate:
he intangible
to use or sell
nomic benefit
e the asset
nditure during
Computer
Software G
’000
3,010$ $
1,053$ $
(1,530)
-
641
164$ $
3,174$ $
13,195$ $
(10,185)
3,010$ $
15,767$ $
(12,593)
3,174$ $
OF AUSTAL L
red at cost anairment lossecapitalised a
red.
either finite ored for impairmtion period anast once per ion of future eriod or methotangible assetgory consiste
ble assets is a
expenditure
asset so that
the asset
s
g developme
oodwill T
’000
6,463 $
- $
-
-
-
- $
6,463 $
6,463 $
-
6,463 $
6,463 $
-
6,463 $
LIMITED
nd subsequenes. Internally and expenditu
r indefinite. Inment whenevend the amortisfinancial year
economic benod, as appropts with finite l
ent with the fu
as follows:
on an individ
it will be ava
nt
Total
’000
9,473
1,053
(1,530)
-
641
164
9,637
19,658
(10,185)
9,473
22,230
(12,593)
9,637
ntly carried aty generated inure is charged
ntangible asser there is an sation methor. Changes inefits embodipriate, which isives is recog
unction of the
ual project is
ailable for use
t cost less ntangible d against
sets with indication d for an n the ed in the s a change nised in the
e intangible
recognised
e or sale
For
per
sona
l use
onl
y

REPORT TO THE MEMBERS OF AUSTAL LIMITED
73 | AUSTAL LIMITED ANNUAL REPORT 2015
The asset is carried at cost less any accumulated amortisation and accumulated impairment losses following initial recognition of the development expenditure as an asset. Amortisation of the asset begins when development is complete and the asset is available for use. It is amortised over the period of expected future benefit. Amortisation is recorded in costs of sales. The asset is tested for impairment annually during the period of development. Other intangibles
Other intangible assets are initially measured at cost and amortised on a straight-line basis over the estimated useful life of the asset. Impairment testing is conducted annually.
The following useful lives have been adopted as follows:
Computer software – straight-line over 2.5 years
Development costs – straight line over 5 years
Goodwill
Goodwill is initially measured at cost, being the excess of the aggregate of the consideration transferred and the amount recognised for non-controlling interest over the net identifiable assets acquired and liabilities assumed in a business combination.
Goodwill is measured at cost less any accumulated impairment losses after initial recognition. Goodwill acquired in a business combination is allocated to each of the Group’s cash-generating units that are expected to benefit from the combination from the acquisition date for the purpose of impairment testing, irrespective of whether other assets or liabilities acquired are assigned to those units.
Impairment is determined for goodwill by assessing the recoverable amount of each CGU (or Group of CGUs) to which the goodwill relates. An impairment loss is recognised when the recoverable amount of the CGU is less than its carrying amount. Impairment losses relating to goodwill cannot be reversed in future periods.
Goodwill allocated to a cash-generating unit that has a partial disposal of the operation within that unit is included in the carrying amount of the operation when determining the gain or loss on disposal. Goodwill disposed in these circumstances is measured based on the relative values of the disposed operation and the portion of the cash-generating unit retained.
ii. Impairment testing of goodwill and intangible assets with indefinite useful lives
Goodwill acquired through business combinations has been allocated to the Australia segment (refer to Note 3 for details).
The Group tests whether goodwill is recoverable on an annual basis. The recoverable amount of Austal Australia CGU has been determined based on a value in use calculation using cash flow projections from financial budgets approved by senior management covering a five-year period. It was concluded that the recoverable amount is greater than the carrying amount. Management has concluded that no impairment charge is required as a result of this analysis.
For
per
sona
l use
onl
y

REPORT TO THE MEMBERS OF AUSTAL LIMITED
74 | AUSTAL LIMITED ANNUAL REPORT 2015
iii. Significant accounting judgement and estimates
Recoverable amount of the Australia CGU
The recoverable amount of the Australia CGU is determined based on value in use calculations using five year cash projections from financial budgets that are approved by senior management. The following table sets out the key assumptions:
Management determined budgeted gross margin based on past performance and its expectation for the future. The growth rate beyond the budgeted period is consistent with the long term average growth rate of the ship building industry. The discount rate used reflects specific risks relating to the Australian ship building industry.
iv. Sensitivity to changes in assumptions
The estimated recoverable amount of the Austal Australia CGU is significantly greater than the carrying value of the assets within the CGU. No reasonably foreseeable changes in any of the key assumptions are likely to result in an impairment loss.
Budget period gross margins 1 Growth rate beyond budget period 2 Discount rate 3
2015 2014 2015 2014 2015 2014
Australia 17-20% 10-15% 0.0% 5.0% 13.0% 15.0%
1. Budgeted gross margin2. Weighted average growth rate used to extrapolate cash flows beyond the budget period3. The Group has applied post-tax discount rates to discount the forecast future attributable post-tax cash flows in performing the value-in-use calculations
for the Australia CGU. The equivalent pre-tax discount rates are disclosed above.
For
per
sona
l use
onl
y
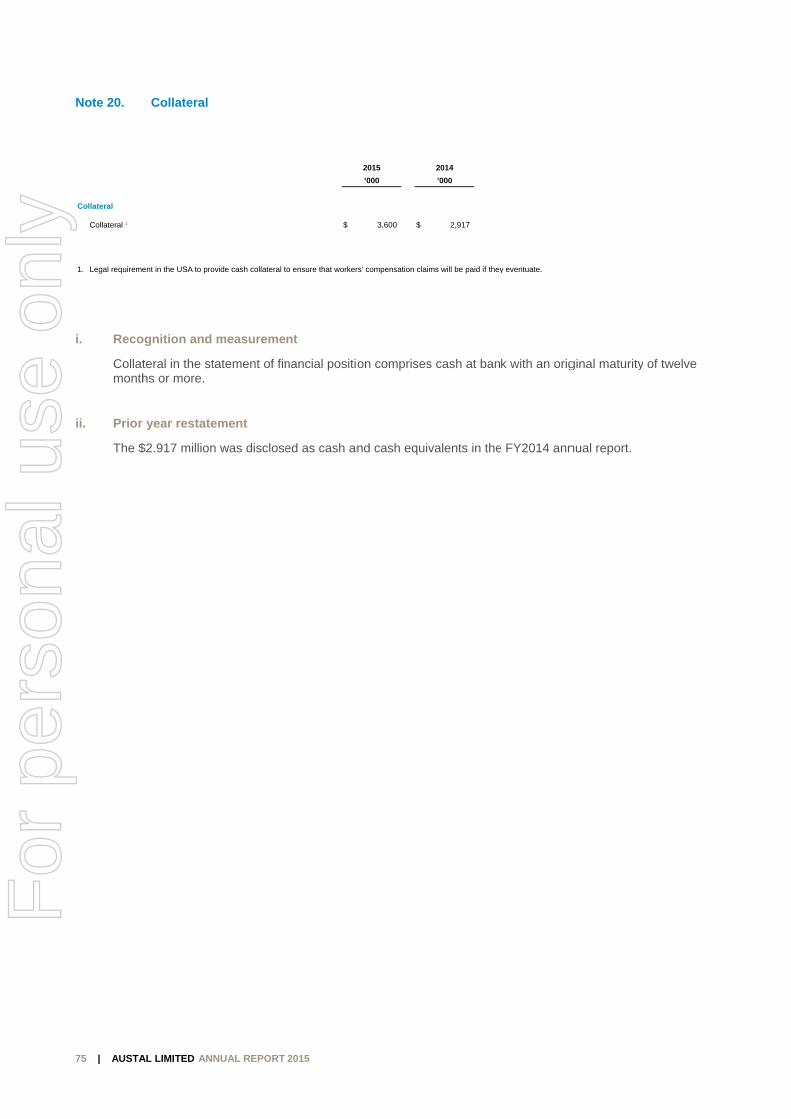
75 | AUSTA
Note 20.
i. Reco
Collatmonth
ii. Prior
The $
Collateral
Collateral 1
1. Legal requireme
AL LIMITED ANN
Collateral
ognition and
teral in the sths or more.
year restate
$2.917 million
ent in the USA to pro
REPOR
NUAL REPORT
measureme
atement of fin
ement
n was disclose
vide cash collateral t
RT TO THE M
2015
nt
nancial positio
ed as cash an
$
o ensure that worker
MEMBERS O
on comprises
nd cash equiv
2015
’000
3,600 $
rs' compensation claim
OF AUSTAL L
s cash at ban
valents in the
2014
’000
2,917
ms will be paid if they
LIMITED
k with an orig
e FY2014 ann
y eventuate.
ginal maturity
nual report.
of twelve
For
per
sona
l use
onl
y

76 | AUSTA
Other lia
Note 21.
i. Reco
Provispast ethe ob
Proviseffect
The inis use
ii. Inform
Wage
Liabilbe whemplothe lia
Provisions at 30 Ju
Arising during th
Utilised
Unused amount
Effects of foreig
Movement
Provisions at 30 Ju
2014
Current
Non-Current
Total
2015
Current
Non-Current
Total
AL LIMITED ANN
abilities
Provisions
ognition and
sions are recevent, it is probligation and
sions are disct of the time v
ncrease in theed.
mation abou
es, salaries,
ities for wageholly settled woyees’ serviceabilities are se
une 2014
he year
s reversed
n exchange
une 2015
REPOR
NUAL REPORT
s
measureme
ognised wheobable that aa reliable est
counted usingvalue of mone
e provision d
ut individual
vested sick
es and salariewithin 12 mones up to the rettled.
Employee
Benefits
’000
(13,72$
(59,20$
56,62
68
2,90
1,01$
(12,70$
Employee
Benefits
’000
(12,70$
(1,02
(13,72$
(11,56$
(1,13
(12,70$
RT TO THE M
2015
nt
n the Group hn outflow of rtimate can be
g a current prey is material
ue to the pas
provisions a
leave, work
es, including nnths of the repreporting date
Workers'
Compensation
’000
23) (8,144)$ $
04) (14,604)$ $
27 19,799
88 942
04 (12,362)
5 (6,225)$ $
08) (14,369)$ $
Workers'
Compensation
’000
00) (8,144)$ $
23) -
23) (8,144)$ $
69) (14,369)$ $
39) -
08) (14,369)$ $
MEMBERS O
has a presentresources eme made of the
re-tax rate tha.
ssage of time
and significa
safe bonus
non-monetaryporting date ae. They are m
Warranty Ot
’000 ’0
(6,575) $
(4,924) ($
4,829
2,010
(52)
1,863 $
(4,712) $
Warranty Ot
’000 ’0
(6,575) $
-
(6,575) $
(4,712) $
-
(4,712) $
OF AUSTAL L
t obligation (lmbodying econe amount of th
at reflects the
is recognised
ant accountin
and other sh
y benefits andare recognisemeasured at t
ther To
000 ’0
(6,285) ($
132,368) (2$
129,403 2
710
5,360
3,105 $
(3,180) ($
ther To
000 ’0
(6,285) ($
-
(6,285) ($
(3,180) ($
-
(3,180) ($
LIMITED
egal or constnomic benefithe obligation.
e risks specific
d as a finance
ng estimates
hort term ben
d accumulatind in other paythe amounts e
otal
00
(34,727)
11,100)
10,658
4,350
(4,150)
(242)
(34,969)
otal
00
(33,704)
(1,023)
(34,727)
(33,830)
(1,139)
(34,969)
tructive) as a ts will be requ
c to the liabili
e cost when d
s
nefits
ng sick leave yables in resexpected to b
result of a uired to settle
ity if the
discounting
expected to pect of be paid when
e
n
For
per
sona
l use
onl
y

REPORT TO THE MEMBERS OF AUSTAL LIMITED
77 | AUSTAL LIMITED ANNUAL REPORT 2015
Long service and annual leave
The Group does not expect its long service leave and annual leave benefits provision to be settled wholly within 12 months of each reporting date. The Group recognises a liability for long service measured as the present value of expected future payments to be made in respect of services provided by employees up to the reporting date using the projected unit credit method. Consideration is given to expected future wage and salary levels, experience of employee departures, and periods of service. Expected future payments are discounted using market yields at the reporting date on high quality corporate bonds with terms to maturity and currencies that match, as closely as possible, the estimated future cash outflows.
Dividends
A provision for dividends is not recognised as a liability unless the dividends are declared, determined or publicly recommended on or before the reporting date. A dividend of 1 cent per share was issued for the half year 31 December 2014 and a dividend of 3 cents is proposed and not recognised as a liability for the year ended 30 June 2015 (FY2014: nil).
Warranties
Provision for warranty is made upon delivery of the vessels based on the estimated future costs of warranty repairs on vessels.
Workers’ compensation insurance
A provision for Workers’ compensation insurance is recognised for the expected costs of current claims and claims incurred but not reported at the balance date.
Other
Other includes a provision for refitting a military vessel that is chartered to the US Military Sealift Command, to return the vessel to a passenger ferry specification. This is consistent with the comparative period.
LCS 2 – USS INDEPENDENCE
For
per
sona
l use
onl
y

78 | AUSTA
Financia
Note 22.
i. Finan
The G
The GThe mof fina
The fain the
Financia
2015
C
R
T
F
T
2014
C
R
T
F
T
Financia
2015
T
F
I
T
2014
T
F
I
T
AL LIMITED ANN
al risk ma
Fair value m
ncial assets
Group holds t
Group’s exposmaximum expancial asset m
air value of ae table above.
al Assets
5
Cash and cash equiva
Restricted cash
Trade & other receivab
Forward exchange con
Total
4
Cash and cash equiva
Restricted cash
Trade & other receivab
Forward exchange con
Total
al Liabilities
5
Trade & other payable
Forward exchange con
nterest bearing borrow
Total
4
Trade & other payable
Forward exchange con
nterest bearing borrow
Total
REPOR
NUAL REPORT
anagemen
measuremen
and financia
he following f
sure to variouposure to credmentioned ab
ssets and liab.
alents
bles
ntracts
alents
bles
ntracts
es
ntracts
wings
es
ntracts
wings
RT TO THE M
2015
nt
nts
al liabilities
financial instr
us risks assocdit risk at the bove.
bilities held a
Notes
10
10
14
23
10
10
14
23
Notes
17
23
11
17
23
11
MEMBERS O
ruments:
ciated with thend of the re
t amortised c
Derivatives used
for hedging
at fair value
’000
- $ $
-
-
115
115$ $
- $ $
-
-
8,488
8,488$ $
Derivatives used
for hedging
at fair value
’000
- $ $
(36,074)
-
(36,074)$ $
- $ $
(4,201)
-
(4,201)$ $
OF AUSTAL L
he financial inseporting perio
cost is describ
Assets at
amortised
cost
’000
138,413$
10,055
104,499
-
252,967$
74,428$
9,532
96,773
-
180,733$
Assets at
amortised
cost
’000
(223,497)$
-
(154,562)
(378,059)$
(183,570)$
-
(155,456)
(339,026)$
LIMITED
struments is dd is the carry
bed in the ass
Total
’000
138,413$
10,055
104,499
115
253,082$
74,428$
9,532
96,773
8,488
189,221$
Total
’000
(223,497)$
(36,074)
(154,562)
(414,133)$
(183,570)$
(4,201)
(155,456)
(343,227)$
discussed in ying amount o
sociated note
Note 23. of each class
e referenced
For
per
sona
l use
onl
y

REPORT TO THE MEMBERS OF AUSTAL LIMITED
79 | AUSTAL LIMITED ANNUAL REPORT 2015
Recognised fair value measurements - fair value hierarchy
This section explains the judgements and estimates made in determining the fair values of the financial instruments that are recognised and measured at fair value in the financial statements. The Group has classified its financial instruments into the three levels prescribed under the accounting standards to provide an indication about the reliability of the inputs used in determining fair value. An explanation of each level follows underneath the table.
There were no transfers between any of the levels for recurring fair value measurements during the year.
Level 1: The fair value of financial instruments traded in active markets (such as publicly traded derivatives, and trading and available-for-sale securities) is based on quoted market prices at the end of the reporting period. The quoted market price used for financial assets held by the Group is the current bid price. These instruments are included in level 1.
Level 2: The fair value of financial instruments that are not traded in an active market (for example, over-the-counter derivatives) is determined using valuation techniques which maximise the use of observable market data and rely as little as possible on entity-specific estimates. The instrument is included in level 2 if all significant inputs required to fair value an instrument are observable.
The Group enters into derivative financial instruments with various counterparties, principally financial institutions with investment grade credit ratings. Foreign exchange forward contracts are valued using valuation techniques, which employs the use of market observable inputs. The most frequently applied valuation techniques include forward pricing and swap models, using present value calculations. The models incorporate various inputs including the credit quality of counterparties, foreign exchange spot and forward rates, yield curves of the respective currencies, currency basis spreads between the respective currencies, interest rate curves and forward rate curves of the underlying commodity. All derivative contracts are fully cash collateralised, thereby eliminating both counterparty and the Group’s own non-performance risk. The fair value of derivative asset positions at 30 June 2015 is net of a credit valuation adjustment attributable to derivative counterparty default risk. The changes in counterparty credit risk had no material effect on the hedge effectiveness assessment for derivatives designated in hedge relationships and other financial instruments recognised at fair value.
Recurring fair value measurementLevel 1 Level 2 Level 3 Total
Balance 30 June 2015 Notes ’000 ’000 ’000 ’000
Financial assets
Derivatives used for hedging 23 - $ 115$ - $ 115$
Financial liabilities
Derivatives used for hedging 23 - $ (36,074)$ - $ (36,074)$
Balance 30 June 2014
Financial assets
Derivatives used for hedging 23 - $ 8,488$ - $ 8,488$
Financial liabilities
Derivatives used for hedging 23 - $ (4,201)$ - $ (4,201)$
For
per
sona
l use
onl
y

REPORT TO THE MEMBERS OF AUSTAL LIMITED
80 | AUSTAL LIMITED ANNUAL REPORT 2015
Level 3: The instrument is included in level 3 if one or more of the significant inputs is not based on observable market data.
Valuation techniques used to determine fair values Specific valuation techniques used to value financial instruments include:
the use of quoted market prices or dealer quotes for similar instruments
the fair value of forward foreign exchange contracts is determined using forward exchange rates at the balance sheet date
the fair value of the remaining financial instruments is determined using discounted cash flow analysis.
The Group determines whether transfers have occurred between Levels in the hierarchy by re-assessing categorisation (based on the lowest level input that is significant to the fair value measurement as a whole) at the end of each reporting period for financial instruments that are recognised at fair value on a recurring basis.
All of the resulting fair value estimates are included in level 2.
ii. Impairment – Financial Assets
A financial asset is assessed at each reporting date to determine whether there is any objective evidence that it is impaired. A financial asset is considered to be impaired if objective evidence indicates that one or more events have had a negative effect on the estimated future cash flows of that asset.
An impairment loss in respect of a financial asset which is measured at amortised cost is calculated as the difference between its carrying amount, and the present value of the estimated future cash flows, discounted at the original effective interest rate.
Individually significant financial assets are tested for impairment on an individual basis. The remaining financial assets are assessed collectively in Groups that share similar credit risk characteristics.
All impairment losses are recognised in profit or loss. An impairment loss is reversed if the reversal can be related objectively to an event occurring after the impairment loss was recognised. The reversal is recognised in profit or loss for financial assets measured at amortised cost.
Impairment testing of trade receivables is described in Note 14.
iii. Non-financial assets and liabilities
Recognised fair value measurements - fair value hierarchy
This section explains the judgements and estimates made in determining the fair values of the non-financial instruments that are recognised and measured at fair value in the financial statements. The Group has classified its assets and liabilities measured at fair value into the three levels prescribed under the accounting standards to provide an indication about the reliability of the inputs used in determining fair value.
There were no transfers between any of the levels for recurring fair value measurements during the year.
Level 1 Level 2 Level 3 Total
Balance 30 June 2015 Notes ’000 ’000 ’000 ’000
Land & buildings 18 - $ - $ 357,690$ 357,690$
Balance 30 June 2014
Land & buildings 18 - $ - $ 303,819$ 303,819$
For
per
sona
l use
onl
y

REPORT TO THE MEMBERS OF AUSTAL LIMITED
81 | AUSTAL LIMITED ANNUAL REPORT 2015
Valuation techniques used to determine fair values
The Group engages independent accredited valuation specialists on a periodic basis to determine the fair values of these assets. The Group reviews market indicators in the interim periods to ensure that the carrying value of revalued property is not materially different from fair value.
For the revaluation of Land & Buildings in June 2012, the Group changed its accounting policy for the measurement of land and buildings to the revaluation model. The Group engaged CB Richard Ellis and Knight Frank to determine the fair value of its land and buildings for USA and Australia respectively. Both firms are accredited independent valuers.
The last independent revaluation was performed on 29 June 2012.
Valuation inputs and relationships to fair value
The following table summarises the quantitative information about the significant unobservable inputs used in recurring level 3 fair value measurements.
iv. Impairment – non-financial assets
Significant accounting judgements
The Group assesses impairment of all assets at each reporting date by evaluating conditions specific to the Group and to the particular asset that may lead to impairment. These include product and manufacturing performance, technology, economic and political environments and future product expectations. The recoverable amount of an asset is determined if an impairment trigger exists. The recoverable amount of the asset is the higher of fair value less costs to sell and value in use. The estimated future cash flows are discounted to their present value using a pre-tax discount rate that reflects current market assessments of the time value of money and the risks specific to the asset in assessing value in use.
The recoverable amount is determined for the cash-generating unit to which an asset belongs for an asset that does not generate largely independent cash inflows, unless the asset’s value in use can be estimated to be close to its fair value.
Impairment exists when the carrying value of an asset or a cash-general unit exceeds its estimated recoverable amount. The asset or cash-generating unit is then written down to its recoverable amount.
Impairment testing of property, plant and equipment, goodwill and other intangible assets is described in Note 18 and Note 19 respectively.
Fair value at Range of inputs Relationship of 30-Jun-15 Unobservable (probability- unobservable inputs
Description '000 inputs weighted average) to fair value
Land - Mobile US$11,000 Selection of land with US$1.69 - US$2.04 Higher value of similar land similar approximate (US$1.70) per ft2 increases estimated fair valueutility
Buildings - Mobile US$304,242 Consumed economic 2.22% Greater consumption of benefit/ obsolescence economic benefit or increased of asset obsolescence lowers fair value.
Cost per square foot US$100 - $211 ($185) Higher cost per ft2
floor area (ft2) per ft2 increases fair value.
Land - Henderson A$8,800 Selection of land with $200-220 ($210) per m2 Higher value of similar land
similar approximate increases estimated fair valueutility
Buildings - Henderson A$22,900 Consumed economic 2.50% Greater consumption of benefit/ obsolescence economic benefit or increased of asset obsolescence lowers fair value.
Cost per square meter $500 - $1,750 ($998) Higher cost per m2 increases floor area (m2) per m2 fair value.
For
per
sona
l use
onl
y

82 | AUSTA
Note 23.
This note exfinancial percontext.
Objectives
Ultimate resreviews and currency, cre
Details of theof measuremasset, financ
Market risk
i. Capit
The Gconfidthe Gdeterm
The Gand dnot lim
Therepolicie
Neithethan n
ii. Intere
The Gand in
The Gexistin
The Gend o
Risk
Market risk - in
Market risk - in
Market risk - fo
Credit risk
Liquidity
AL LIMITED ANN
Financial r
xplains the Grrformance. Cu
and policy
ponsibility foragrees polic
edit allowanc
e significant ament and the cial liabilities a
tal managem
Group’s policydence to sust
Group defines mines the lev
Group monitodetailed budgemit the Group
e were no chaes and proce
er the Group normal bankin
est rate risk
Group’s exposnvestment in
Group constang positions a
Group had theof the reportin
nterest rate
nterest rate
oreign currency
REPOR
NUAL REPORT
isk managem
roup’s exposuurrent year pr
r identificationies for manages, and future
accounting pobasis on whicand equity ins
ment
y is to maintatain future devas total shar
vel of dividend
ors statement eting process
p’s growth opp
anges in the Gedures are est
nor any of itsng requireme
exposure
sure to markecash funds.
ntly analysesand alternativ
e following vang period.
Exposure aris
Long-term bor
Cash
Future commerecognised findenominated i
Cash, short teand derivative
Borrowings, trafinancial instru
RT TO THE M
2015
ment
ure to financiarofit and loss
n and control ging each of te cash flow fo
olicies and mch income anstrument are
in a strong anvelopment of eholders’ equds to shareho
of financial pses. The grosportunities an
Group’s approtablished with
s subsidiariesents.
et interest rat
s its interest rave financing s
ariable rate bo
sing from
rrowings at varia
ercial transactionancial assets anin functional curr
erm deposits, trad financial instrum
ade payables anuments
MEMBERS O
al risks and hinformation h
of financial rthe risks idenorecast projec
ethods adoptnd expenses disclosed in
nd flexible caf the businessuity attributabolders.
position strengss gearing rand is in line w
oach to capith regular mon
s are subject t
tes relates pri
ate exposurestructures.
orrowings and
ble rates
ns, nd liabilities not rency
de receivables ments
nd derivative
OF AUSTAL L
how these riskhas been incl
isks rests witntified below, ctions.
ted, includingare recognisethe relevant n
apital base to s. The Groupble to membe
gth and flexibtio is monitor
with peers and
al managemenitoring and re
to externally
imarily to the
. Considerat
d interest rate
Monitoring
Sensitivity
Sensitivity
Cash flow Sensitivity
Ageing anaratings
Rolling cas
LIMITED
ks could affecuded where r
h the Board oincluding hed
the criteria foed, in respectnotes to the f
provide invesp monitors thers of Austal L
bility using cased and maint
d industry nor
ent during theeporting.
imposed cap
Group’s long
ion is given to
e swap contra
g
analysis
analysis
forecast,analysis
alysis, credit
sh flow forecasts
ct the Group’srelevant to ad
of Directors. dging cover o
for recognitiont of each clasfinancial state
stor, creditor e return on caLimited. The
sh flow forecatained at a levrms.
e year. Risk m
ital requireme
g-term debt ob
o potential re
acts outstand
Managemen
Interest rate
Interest rate
Forward forecontracts, Fooptions
Monitoring cr
s Availability olines and bor
s future dd further
The Board of foreign
n, the basis ss of financialements.
and market apital, which Board
ast analysis vel that does
management
ents, other
bligations
enewals of
ding at the
nt
swaps
swaps
eign exchange orward currency
redit allowances
f committed credrrowing facilities
t
d
For
per
sona
l use
onl
y

REPORT TO THE MEMBERS OF AUSTAL LIMITED
83 | AUSTAL LIMITED ANNUAL REPORT 2015
Profit or loss is sensitive to higher / lower interest income from cash and cash equivalents and interest expenses on borrowings as a result of changes in interest rates. There would be no material impact on other components of equity as a result of changes in interest rates. The sensitivity analysis below shows the impact on post tax profit had a 1 percentage point movement in interest rates occurred. 1 percentage point was deemed to be a reasonable level of volatility based on FY2015 observations.
iii. Interest rate risk strategies, policies and procedures
The cash, debt, bank covenants and interest cover ratio of the Group are forecasted and monitored on a monthly basis in order to forecast and monitor the interest rate risk. A variable interest rate is maintained because repayments are carried out as soon as practicable, where a fixed interest rate is less flexible. The interest rate movement is currently immaterial.
iv. Foreign currency risk
Refer to Note 24 for Derivatives.
The Group is exposed to currency risk on sales, purchases or components for construction that are denominated in a currency other than the respective functional currencies of the Group entities, primarily Australian Dollars (AUD) for the Australian operation and US Dollars (USD) for the US operation. The currencies in which these transactions primarily are denominated are AUD, USD and EUR.
The Group’s objective in relation to foreign currency risk is to minimise the risk of a variation in the rate of exchange used to convert foreign currency revenues and expenses and assets or liabilities to the functional currency of each cash generating unit.
The Group attempts to limit the exposure to adverse movement in exchange rates in the following ways:
negotiation of contracts to adjust for adverse exchange rate movements
use of natural hedging techniques
using financial instruments (refer to Note 24).
Sales contracts are negotiated based at the current market rate on the contract signing date. The Group seeks to mitigate significant foreign currency exposures in contract tenders by incorporating rise and fall clauses for exchange rate movements between the date of price calculation to the date the contract becomes effective.
2015 2014
Financial Assets ’000 ’000
Cash and cash equivalents
Australian variable rate interest 54,909$ 35,325$ US variable rate interest 93,559 48,635
Total 148,468$ 83,960$
Financial Liabilities
Interest bearing loans and borrowings
Australian variable rate interest - $ (13,192)$ US variable rate interest (154,562) (142,264)
Total (154,562)$ (155,456)$
Net Exposure (6,094)$ (71,496)$
2015 2014
’000 ’000
Post tax gain / (loss)
+1% (100 basis points) (198)$ (686)$
-1% (100 basis points) 198 686
For
per
sona
l use
onl
y

REPORT TO THE MEMBERS OF AUSTAL LIMITED
84 | AUSTAL LIMITED ANNUAL REPORT 2015
Known foreign exchange transaction exposures, which result from normal operational business activities, are hedged utilising financial instruments.
Tax profit and equity would have been affected as illustrated in the table below had the AUD, USD and EUR moved relative to one another at balance date with all other variables held constant:
Derivative financial instruments such as forward currency contracts and currency options are utilised to eliminate foreign currency exposures. Timing gaps are mitigated using foreign currency accounts or financial instruments such as swaps.
It is the Group’s policy to negotiate the terms of the hedge derivatives to match the terms of the hedged item to maximise hedge effectiveness.
Trading is specifically prohibited. The financial impact of the derivative instrument is incorporated into the cost of goods acquired or the sales proceeds. General hedges are not undertaken.
Foreign currency contracts designated as cash flow hedges to mitigate the movements in foreign exchange rates are outlined in Note 24.
v. Credit risk
The Group trades only with recognised, creditworthy third parties. It is the Group’s policy that all customers who wish to trade on credit terms are subject to credit verification procedures, which are conducted internally. The Group, while exposed to credit related losses in the event of non-performance by counterparties to financial instruments, does not expect counterparties to fail to meet their obligations given their credit ratings.
The Group minimises concentrations of credit risk and the risk of default of counterparties in relation to cash and cash equivalents and financial instruments by spreading them amongst a number of financial institutions.
It is the Group’s policy to minimise the risk that the principle amount will not be recovered and the risk that funds will not be available when required whilst at the same time obtaining the maximum return relative to the risk. It is the Group’s policy to restrict its investment of surplus cash funds to financial institutions with a Standard and Poor credit rating of at least A-2, and for a period not exceeding 180 days to manage this risk. The Group undertakes investments in short term deposits, term deposits or negotiable certificates of deposit in order to achieve this objective.
Vessel sales contracts are structured to ensure that the Group will be paid on delivery of the vessel through the following measures:
obtaining progress payments from the client to cover the cost of the construction; or
obtaining a letter of credit from a credible bank to cover payment of the contract; or
obtaining a minimum payment of 20% of the contract price and a letter from the bank or financial institution providing finance to the customer that funding has been arranged for the balance of the purchase price.
Post tax profit higher / (lower) Equity higher / (lower)
2015 2014 2015 2014
Judgement of reasonable possible movements ’000 ’000 ’000 ’000
USD / AUD
+10% (854)$ (4,727)$ 3,679$ 17,106$
-10% 854 4,727 (5,011) (17,106)
EUR / AUD
+10% 1$ 2$ 868$ (1,769)$
-10% (1) (2) (1,061) 1,769
EUR / USD
+10% - $ 4,515$ 5,420$ 4,515$
-10% - (4,515) (5,420) (4,515)
For
per
sona
l use
onl
y

REPORT TO THE MEMBERS OF AUSTAL LIMITED
85 | AUSTAL LIMITED ANNUAL REPORT 2015
The Group’s exposure to counter party credit default risk arising from the other financial assets of the Group, which comprise cash and cash equivalents and certain derivative instruments, is equal to the carrying amount of these instruments. The maximum exposure to credit risk at the reporting date is disclosed in Note 10 and Note 24.
Cash and term deposits are predominantly held with two tier one Australian financial institutions, which are considered to be low concentrations of credit risk.
vi. Liquidity risk
The liquidity position of the Group is managed to ensure sufficient liquid funds are available to meet financial commitments in a timely and cost-effective manner.
It is the Group’s policy to continually review the Group’s liquidity position including cash flow forecasts to determine the forecast liquidity position and maintain appropriate liquidity levels. Austal is in the process of finalising a new syndicated banking facility. The Syndicated Facility Agreement (SFA) matures 31 December 2015 and hence all liabilities relating to the SFA agreement have been disclosed as current at the reporting date.
The contractual maturities of financial liabilities, including interest payments are as follows:
The Group had $50.000 million (FY2014: $38.000 million) of unused credit facilities available for its immediate use at balance date (refer to Note 11). The Group also has a total of $138.413 million (FY2014: $74.427 million) in cash and cash equivalents, which it is able to use to meet its liquidity needs.
Contractual
Carrying Years to maturity Cash
Amount 0 - 1 1 - 2 2 - 5 > 5 Flows
Balance 30 June 2015 ’000 ’000 ’000 ’000 ’000 ’000
Derivative financial assets / (liabilities)
Outflow (251,112)$ (160,799)$ (76,004)$ (21,362)$ - $ (258,165)$
Inflow 215,243 139,341 63,872 17,957 - 221,170
Net derivative financial assets / (liabilities) (35,869)$ (21,458)$ (12,132)$ (3,405)$ - $ (36,995)$
Non Derivative financial liabilities
Trade & other payables (223,497)$ (223,497)$ - $ - $ - $ (223,497)$
Go Zone Bond facility (i) (145,113) (145,525) - - - (145,525)
Finance lease (9,449) (1,785) (3,597) (3,297) - (8,679)
Total (378,059)$ (370,807)$ (3,597)$ (3,297)$ - $ (377,701)$
(i) Go Zone Bonds are classified with 0 to 1 year to maturity because the letters of credit wrapping the bonds mature on 31 December 2015.
Contractual
Carrying Years to maturity Cash
Amount 0 - 1 1 - 2 2 - 5 > 5 Flows
Balance 30 June 2014 ’000 ’000 ’000 ’000 ’000 ’000
Derivative financial assets / (liabilities)
Outflow (377,752)$ (154,468)$ (161,766)$ (81,962)$ (172)$ (398,368)$
Inflow 381,863 155,193 165,183 82,129 172 402,677
Net derivative financial assets / (liabilities) 4,111$ 725$ 3,417$ 167$ - $ 4,309$
Non Derivative financial liabilities
Trade & other payables (183,570)$ (183,570)$ - $ - $ - $ (183,570)$
Bank loan (unsecured) (1,192) (1,217) - - - (1,217)
Go Zone Bond facility (142,264) - (150,171) - - (150,171)
Revolving credit facility (12,000) (12,019) - - - (12,019)
Total (339,026)$ (196,806)$ (150,171)$ - $ - $ (346,977)$ For
per
sona
l use
onl
y

86 | AUSTA
Note 24.
The Group iseach other a
The Group uto hedge its receipts andreceived and
i. Reco
Derivainto apositiv
Any gand loother
The facontra
The Gbeen are di
ii. Hedg
For th
fl
cpc
The Ghedgeincep
The dnatureoffsetrisk.
Such and athe fin
iii. Fair v
Fair vliabilitsuch loss. hedgestatem
The Gor exedesigintereas sofor ch
AL LIMITED ANN
Derivative
s exposed to arising from re
uses derivativrisks associa
d payments and made.
ognition and
ative financiaand are subseve and as liab
gains or losseoss, except focomprehens
air value of foacts with simi
Group’s derivacalculated usirectly or indir
ge designatio
he purposes o
fair value hedliability or an
cash flow hedparticular riskcommitments
Group formalle accounting tion of a hedg
documentatioe of the risk btting the expo
hedges are eare assessed nancial report
value hedge
value hedges ty or an unrecan asset, liabThe carrying
ed, the derivament of comp
Group discontercised, the hnation. Any a
est method is on as an adju
hanges in its f
REPOR
NUAL REPORT
financial ins
the risk of adeceipts from e
ve financial inated with forend they are ti
measureme
al instrumentsequently remebilities when
es arising fromor those that qsive income.
orward currenilar maturity p
atives are catsing valuationrectly based o
on
of hedge acco
dges when theunrecognised
dges when thk associated ws.
y designatesand the risk
ge relationsh
n includes idebeing hedgedosure to chan
expected to bon an ongointing periods f
accounting
are hedges ocognised firmbility or firm cog amount of aative is remeaprehensive inc
tinues fair vahedge no longadjustment toused is amor
ustment existfair value attr
RT TO THE M
2015
struments an
dverse movemexport sales a
struments suign currency med to matur
nt
s are stated aeasured at faithe fair value
m changes in qualify as cas
ncy contracts profiles. Cred
tegorised in len techniques won market ob
ounting, hedg
ey hedge thed firm commit
ey hedge expwith a recogn
and documemanagementip.
entification ofd and how theges in the he
be highly effecng basis to defor which they
of the Group’sm commitment
ommitment th hedged item
asured to fair come.
lue hedge acger meets theo the carryingrtised to the sts and shall bibutable to th
MEMBERS O
nd hedging
ments in the Aand the purch
uch as forwardfluctuations. re when the r
at fair value onir value. Der
e is negative.
the fair valuesh flow hedge
is calculatedit risk has be
evel 2 of the where the inp
bservable data
ges are class
e exposure to tment other th
posure to varnised asset or
ents the hedgt objective an
f the hedging e entity will asedged item’s f
ctive in achieetermine that y were design
s exposure tot other than fohat is attributa
m is adjusted fvalue and ga
ccounting if the criteria for hg amount of astatement of cegin no later e risk being h
OF AUSTAL L
Australian Dohase of comp
d exchange cThese contra
receipts and p
n the date onivatives are c
e of derivativees, which are
by referenceen included in
valuation hieputs that havea.
ified as:
changes in than foreign c
riability in casr liability or fo
e relationshipnd strategy for
instrument, tssess the hedfair value or c
ving offsettinthey actually
nated.
o changes in oreign exchanable to a partfor gains and ains and losse
e hedging inshedge accoun hedged financomprehensivthan when th
hedged.
LIMITED
ollar, US Dollaponents for co
contracts andacts are matcpayments are
which a derivcarried as ass
es are taken ttaken to cas
e to current fon foreign curr
rarchy, becaue a significan
he fair value ourrency risk;
h flows that isreign exchan
p to which ther undertaking
the hedged itedging instrumecash flows att
g changes in y have been h
the fair valuenge rate risk,icular risk andlosses attribu
es from both
strument expinting or the Gncial instrumeve income. Ahe hedged ite
ar and Euro ronstruction.
d forward currched to highlye scheduled t
vative contrasets when the
to the statemsh flow hedge
orward excharency contrac
use their fair vnt effect on the
of a recognisor
s attributablenge risks on fi
e Group wisheg the hedge a
em or transacent’s effectivetributable to th
fair value or highly effectiv
e of a recognis or an identifid could affecutable to the are taken to t
ires or is soldGroup revokesent for which Amortisation mem ceases to
relative to
rency options y probable o be
ct is entered e fair value is
ent of profit e reserve in
nge rates for cts.
value has e valuation
sed asset or
either to a rm
es to apply t the
ction, the eness in he hedged
cash flows ve throughout
sed asset or ied portion oft profit or risk being the
d, terminated s the the effective
may begin be adjusted
t
f
For
per
sona
l use
onl
y

REPORT TO THE MEMBERS OF AUSTAL LIMITED
87 | AUSTAL LIMITED ANNUAL REPORT 2015
iv. Cash flow hedge accounting
Cash flow hedges are hedges of the Group’s exposure to variability in cash flows that is attributable to a particular risk associated with a recognised asset or liability or a highly probable forecast transaction and the foreign exchange risks on firm commitments and that could affect profit or loss. The effective portion of the gain or loss on the hedging instrument is recognised directly in other comprehensive income, while the ineffective portion is recognised in the profit and loss.
Amounts taken to other comprehensive income are transferred to the profit and loss when the hedged transaction affects profit or loss, such as when hedged income or expenses are recognised or when a committed and future sale or the asset is consumed. The amounts taken to equity are transferred to the initial carrying amount of the non-financial asset or liability when the hedged item is the cost of a non-financial asset or liability.
Amounts previously recognised in equity are transferred to the profit and loss if the forecast transaction is no longer expected to occur. Amounts previously recognised in equity will remain in equity until the forecast transaction occurs if the hedging instrument expires or is sold, terminated or exercised without replacement or rollover, or if its designation as a hedge is revoked.
v. Summary of forward foreign exchange contracts
The following table summarises the AUD value of the significant forward foreign exchange agreements and forward currency options by currency. Foreign currency amounts are translated at rates current at the reporting date. The ‘buy’ amounts represent the Australian dollar equivalent of commitments to purchase foreign currencies, and the ‘sell’ amount represents the Australian dollar equivalent of commitments to sell foreign currencies.
vi. Offsetting financial instruments
The Group presents its assets and liabilities on a gross basis. Derivative financial instruments entered into by the Group are subject to enforceable master netting arrangements such as International Swaps and Derivatives Associations (ISDA) master netting agreement. All outstanding transactions under an ISDA agreement are terminated in certain circumstances, for example, when a credit event such as a default occurs. The termination value is assessed and only a single net amount is payable in settlement of all transactions. The amounts set out in the table above represent the derivative financial assets and liabilities of the group that are subject to the above arrangements and are presented on a gross basis.
2015 2014
Average Average Average Average
Forward Buy Forward Sell Forward Buy Forward Sell
Rate '000 Rate '000 Rate '000 Rate '000
USD / AUD
less than 3 months 0.8398 2,843$ 0.8286 (607)$ 0.9603 897$ 1.0012 (249)$
3 - 12 months 0.8847 85,792 0.7720 (1,008) 0.9167 80,868 0.9599 (3,436)
> 12 months 0.8661 29,081 0.7644 (262) 0.8775 131,794 0.9713 (86)
Total 117,716$ (1,877)$ 213,559$ (3,771)$
EUR / AUD
less than 3 months 0.7343 477$ 0.6664 (424)$ 0.6608 1,809$ - - $
3 - 12 months 0.6904 445 0.6111 (10,850) 0.7403 203 0.6400 (1,382)
> 12 months - - 0.5933 (5,069) 0.7343 477 0.6089 (22,285)
Total 922$ (16,343)$ 2,489$ (23,667)$
USD / EUR
less than 3 months - - $ 1.2313 (1,138)$ - - $ 1.3322 (782)$
3 - 12 months - - 1.3407 (30,913) - - 1.3709 (59,448)
> 12 months - - 1.3772 (45,486) - - 1.3941 (85,849)
Total - $ (77,537)$ - $ (146,079)$
GBP / AUD
less than 3 months - - $ 0.5223 (74)$ - - $ 0.6222 (36)$
3-12 months 0.5263 1,820 0.5563 (165) 0.5640 1,637 0.6126 (115)
> 12 months 0.5533 1,580 0.5056 (77) 0.5511 3,265 0.5548 (552)
Total 3,400$ (316)$ 4,902$ (703)$
For
per
sona
l use
onl
y

88 | AUSTA
Unrecog
Note 25.
i. Comm
The Gcontradisclothose
ii. Other
The p
Austais in rthe paintend
Note 26.
A fully franke
Operatin
Futu
With
After
Tota
Capital
With
After
Tota
Capital
Mob
Tota
Guarant
Bank
(i)
AL LIMITED ANN
gnised ite
Commitme
mitments
Group entitiesacts. No mateosed (if any) ie financial liab
r contingent
parent compa
al received norespect of conarties specificds to defend t
Events afte
ed dividend o
ng lease commitme
ure minimum rentals
hin one year
r one year but not mo
l
leases
hin one year
r one year but not mo
l
commitments
ile Equipment - USA
l
tees
k performance guaran
The bank performafloating charges ov
REPOR
NUAL REPORT
ems
ents and con
s may have perial losses as the Directo
bilities.
t liabilities ex
any has guara
otice of Arbitransequential dcally excludesthe claim.
er the balanc
of 3 cents per
ents
s payable under non
ore than five years
ore than five years
ntees (i)
ance guarantees arver cash, receivable
RT TO THE M
2015
tingencies
otential finanre anticipatedrs’ best estim
xcluded from
anteed the pe
ation proceedamages arisis consequent
ce date
share (FY20
n-cancellable leases
re secured by a morts, work in progress
MEMBERS O
cial liabilities d in respect o
mate of amoun
m the above
erformance of
dings initiateding from a watial damages
014: Nil) has b
s as at 30 June are a
tgage over the land and plant and equip
OF AUSTAL L
that could arof any of thosents that would
include:
f certain contr
d by a commearranty defectin relation to
been propose
as follows
$
$
$
$
$
$
and buildings and pment.
LIMITED
ise from histoe contingencid be payable
ract obligation
ercial customet. The shipbuwarranty def
ed.
2015
’000
(2,153) $
(478)
(2,631) $
(1,792) $
(7,658)
(9,450) $
(2,088) $
(2,088) $
(79,965) $
orical commeies. The fair vby the Group
ns of a subsid
er in FY2013uilding contrafects. The co
2014
’000
(1,395)
(1,744)
(3,139)
-
-
-
(72)
(72)
(41,605)
ercial value p to settle
diary.
. The claim ct between
ompany
For
per
sona
l use
onl
y

89 | AUSTA
The Grou
Note 27.
The consolidin the followi
*100% owned by A
Note 28.
It is Group p
No related pKey Manage
Note 29.
Detailed rem
Company
Austal Cyprus Ltd
Austal Egypt LLC
Austal Holdings Inc
Austal Hull 130 Cha
Austal Muscat LLC
Austal Philippines P
Austal Service Darw
Austal Service Pty
Austal Ships Pty Lt
Austal Systems Pty
Austal UK Ltd
Austal USA LLC
Hydraulink (NT) Pty
Austal Middle East
KM Engineering (N
Oceanfast Luxury Y
Oceanfast Pty Ltd
Seastate Pty Ltd
Short-term employe
Post-employment b
Termination benefi
Long term benefits
Share-based paym
Total
AL LIMITED ANN
up, mana
Parent inte
dated financiaing table.
Austal Service Darw
Related pa
policy that all t
party transactement Person
Key manag
muneration dis
c
artering LLC
C
Pty Ltd
win Pty Ltd
Ltd
td
y Ltd
y Ltd*
Pty Ltd
NT) Pty Ltd*
Yachts Pty Ltd
ee benefits
benefits
ts
ment
REPOR
NUAL REPORT
agement a
erests in sub
al statements
win Pty Ltd, which
rty disclosu
transactions w
ions occurrednnel and the m
gement pers
sclosures are
RT TO THE M
2015
and relate
bsidiaries
s include the f
itself is 80% owned
re
with related p
d with the conmatters disclo
onnel compe
e provided in t
MEMBERS O
ed parties
financial state
d by Austal Service
parties are co
nsolidated enosed in this re
ensation
the Remuner
Country of
Incorporation
Cyprus
Egypt
USA
USA
Oman
Australia
Australia
Australia
Australia
Australia
United Kingd
USA
Australia
Australia
Australia
Australia
Australia
Australia
2015
’000
3,5$
2
1
4
4,4$
OF AUSTAL L
s
ements of Aus
Pty Ltd.
onducted on c
tity other thaneport.
ration Report
Eq
n 2015
1
1
1
1
1
1
1
1
1
om 1
1
1
1
1
1
2014
’000
566 3,$
240
78 -
120
460
464 4,$
LIMITED
stal Limited a
commercial te
n the remune
commencing
quity Interest
5 2014
00% 100%
00% 100%
00% 100%
00% 100%
00% 100%
00% 100%
80% 80%
00% 100%
00% 100%
00% 100%
00% 100%
00% 100%
80% 80%
00% 100%
80% 80%
00% 100%
00% 100%
00% 100%
309
164
-
125
442
040
and the subsid
erms and con
eration of Dire
g on page 15.
diaries listed
ditions.
ectors and
For
per
sona
l use
onl
y
90 | AUSTA
Note 30.
i. Long
The loexecuexecu
The bwas toindusbelowchang
Purpo
The pto sus
Form
The Lobjec
Meas
The Cexpla
The s
Meas
The C
Perfo
The gROICratherPerfoa pres
The p Retur
Seniochallelead tperfor
ROICDebt,
Actua
AL LIMITED ANN
Share base
g Term Incen
ong term inceutives should utives hold a
board also uno ensure thattry practice.
w in this sectioged from an a
ose
purpose of thestainable sup
m of incentive
LTI should bectives
surement per
Company instined in the FY
standard mea
sures of long
Company will
TSR which
ROIC which
ormance hur
granting of peC and TSR tarr than businermance rightsscribed perio
performance h
rn on Investe
or Executives enges, therefoto value creatrmance from
C is calculated Derivatives a
al ROIC resul
REPOR
NUAL REPORT
ed payments
tive Plan
entive plan pobe at-risk anstake in the C
dertook a revt the scheme A number of
on. In additioabsolute TSR
e LTI Plan is perior returns
e
e based on Pe
riod
tituted a transY2014 Annua
asurement pe
g term perfor
use two long
the board be
h the board b
rdles
erformance rigrgets set perio
ess unit perfors will not vestd determined
hurdles for rig
ed Capital (R
are faced wiore the LTI shtion for sharean internal p
d by dividing tand Tax Acco
ts are compa
RT TO THE M
2015
s
olicy of the Cod based on e
Company and
view of the LTcontinued to changes wer
on, following sR to a relative
to incentivisefor sharehold
erformance R
sitional arrangal Report.
riod from FY2
rmance
g term perform
lieves best re
elieves best r
ghts is tied exodically by thrmance in ordt unless these
d by the Board
ghts granted i
ROIC) measu
th significant hould also beholders. Thiserspective by
the Net operaounts).
ared against in
MEMBERS O
ompany is thaequity in the Cd to align thei
TI scheme fol drive long tere implementsignificant maTSR or iTSR
e Senior Execders and to m
Rights that ves
gement for th
2016 onward
mance measu
eflects interna
reflects exter
xclusively to ohe Board. Theder to maximie hurdles, ared.
in FY2014 an
ure
and long terme linked to thes measure is y the Board a
ating profit aft
nternal target
OF AUSTAL L
at an annual Company. Thr interests wit
lowing its initerm executiveed most nota
arket feedbacR.
cutives to delimodulate the c
st based on a
e LTI scheme
s will be three
ures:
al measures o
nal measures
overall Groupe targets will bise alignmente met. Perfor
nd FY2015 ar
m business de achievemen
considered tnd by major s
ter tax exclus
ts.
LIMITED
component ohis is intendedth those of sh
ial 2 years of e performanceably to the awck, the TSR aw
ver Group pecost of employ
an assessmen
e for FY2014
e years.
of performanc
s of performa
p performancebe based on Gt with sharehormance hurdl
re as follows:
evelopment ant of ROIC grohe best measstakeholders.
ive / Net Ass
of remuneratiod to ensure thhareholders.
f operation. Te as well as m
ward levels asward measur
erformance thying Senior E
nt of performa
and FY2015
ce
ance
e, measured Group perforolder interestes will be me
and project bowth objectivsure of long t.
sets (excludin
on of hat
he purpose meet normal shown re has been
hat will lead Executives.
ance against
5 which was
against mance, s;
easured over
ased es that will erm
g Cash, For
per
sona
l use
onl
y
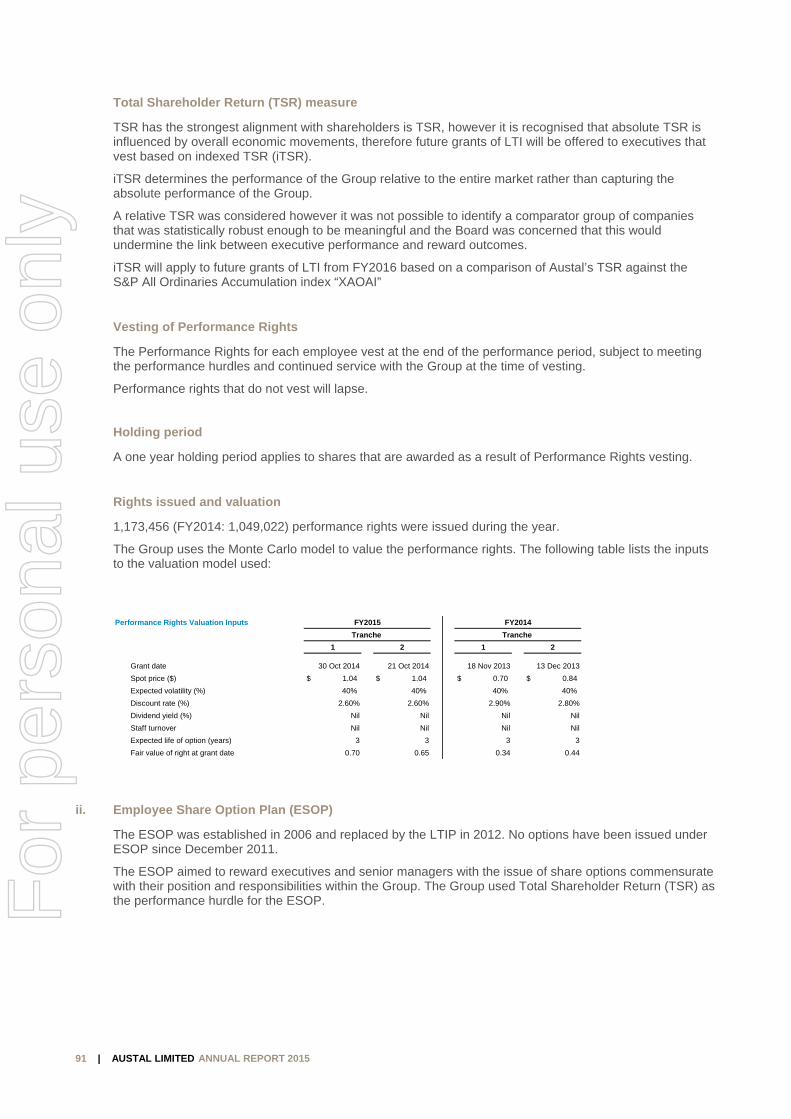
REPORT TO THE MEMBERS OF AUSTAL LIMITED
91 | AUSTAL LIMITED ANNUAL REPORT 2015
Total Shareholder Return (TSR) measure
TSR has the strongest alignment with shareholders is TSR, however it is recognised that absolute TSR is influenced by overall economic movements, therefore future grants of LTI will be offered to executives that vest based on indexed TSR (iTSR).
iTSR determines the performance of the Group relative to the entire market rather than capturing the absolute performance of the Group.
A relative TSR was considered however it was not possible to identify a comparator group of companies that was statistically robust enough to be meaningful and the Board was concerned that this would undermine the link between executive performance and reward outcomes.
iTSR will apply to future grants of LTI from FY2016 based on a comparison of Austal’s TSR against the S&P All Ordinaries Accumulation index “XAOAI”
Vesting of Performance Rights
The Performance Rights for each employee vest at the end of the performance period, subject to meeting the performance hurdles and continued service with the Group at the time of vesting.
Performance rights that do not vest will lapse.
Holding period
A one year holding period applies to shares that are awarded as a result of Performance Rights vesting.
Rights issued and valuation
1,173,456 (FY2014: 1,049,022) performance rights were issued during the year.
The Group uses the Monte Carlo model to value the performance rights. The following table lists the inputs to the valuation model used:
ii. Employee Share Option Plan (ESOP)
The ESOP was established in 2006 and replaced by the LTIP in 2012. No options have been issued under ESOP since December 2011.
The ESOP aimed to reward executives and senior managers with the issue of share options commensurate with their position and responsibilities within the Group. The Group used Total Shareholder Return (TSR) as the performance hurdle for the ESOP.
Performance Rights Valuation Inputs FY2015 FY2014
Tranche Tranche
1 2 1 2
Grant date 30 Oct 2014 21 Oct 2014 18 Nov 2013 13 Dec 2013
Spot price ($) 1.04$ 1.04$ 0.70$ 0.84$
Expected volatility (%) 40% 40% 40% 40%
Discount rate (%) 2.60% 2.60% 2.90% 2.80%
Dividend yield (%) Nil Nil Nil Nil
Staff turnover Nil Nil Nil Nil
Expected life of option (years) 3 3 3 3
Fair value of right at grant date 0.70 0.65 0.34 0.44
For
per
sona
l use
onl
y

REPORT TO THE MEMBERS OF AUSTAL LIMITED
92 | AUSTAL LIMITED ANNUAL REPORT 2015
Summaries of options granted under ESOP
The following table illustrates the movement in share option holdings and weighted average exercise prices (WAEP) during the year:
Share options outstanding at the end of the year have the following expiry dates and exercise prices:
iii. Austal Group Management Share Plans (AGMSP)
The trustee holds a total of 4,015,539 shares at balance date on behalf of the plans represented by:
398,539 shares allocated under Plan 1 and Plan 2 with a weighted average price of $1.33 each, with no contractual life, and
3,617,000 shares that are unallocated.
Plan 1
The Group established the first Austal Group Management Share Plan (Plan 1) in 1998 so that Directors and key managers could participate in owning shares in the Company. The features of the Plan are:
Austal offered loans to participants for up to 100% of the purchase consideration for their shares on a limited recourse basis.
The shares were made available to the participants at market value.
The Board determined the number of shares that were made available to each participant.
The shares are required to be held by a trustee on behalf of the participant. Shares may not be transferred to a participant for at least 12 months. 20% of a participant’s shares will become eligible to be transferred after this period provided that any loan in respect of these shares has been repaid. An additional 20% will become eligible to be transferred to the participant at the end of each 12-month period thereafter on the same terms, so that a participant may hold 100% of the shares at the end of 5 years.
Dividends on shares held under the Plan must be applied to pay interest on the loans. Participants with an interest in shares under the Plan have full voting rights.
Interest on the loans is charged at a fixed rate of 6%, or such other rate as determined by the Board.
The shares must be sold and the loan (if any) repaid upon termination of employment or contract arrangements.
2015 2014Summary of options ESOP Number WAEP Number WAEP
Outstanding at the beginning of the year 6,531,736 2.52$ 7,190,486 2.49$
Exercised during the year - - $ - - $ Forfeited during the year (210,000) 2.15 (658,750) 2.23
Outstanding at the end of the year 6,321,736 2.53$ 6,531,736 2.52$
Exercisable at the end of the year 6,321,736 2,826,736
No. of share options at year endTranche Grant date Expiry Date Outstanding Exercisable
2 13-Sep-07 13-Sep-14 3.60$ 311,236 311,236 3 24-Oct-07 24-Oct-14 3.60 140,000 140,000 4 10-Sep-08 10-Sep-15 2.40 725,500 725,500 5 03-Nov-09 03-Nov-16 2.95 1,505,000 1,505,000 8 27-Sep-10 27-Sep-17 2.34 1,925,000 1,925,000 9 21-Oct-11 21-Oct-18 2.15 1,715,000 1,715,000
Total 6,321,736 6,321,736
Exercise Price
For
per
sona
l use
onl
y
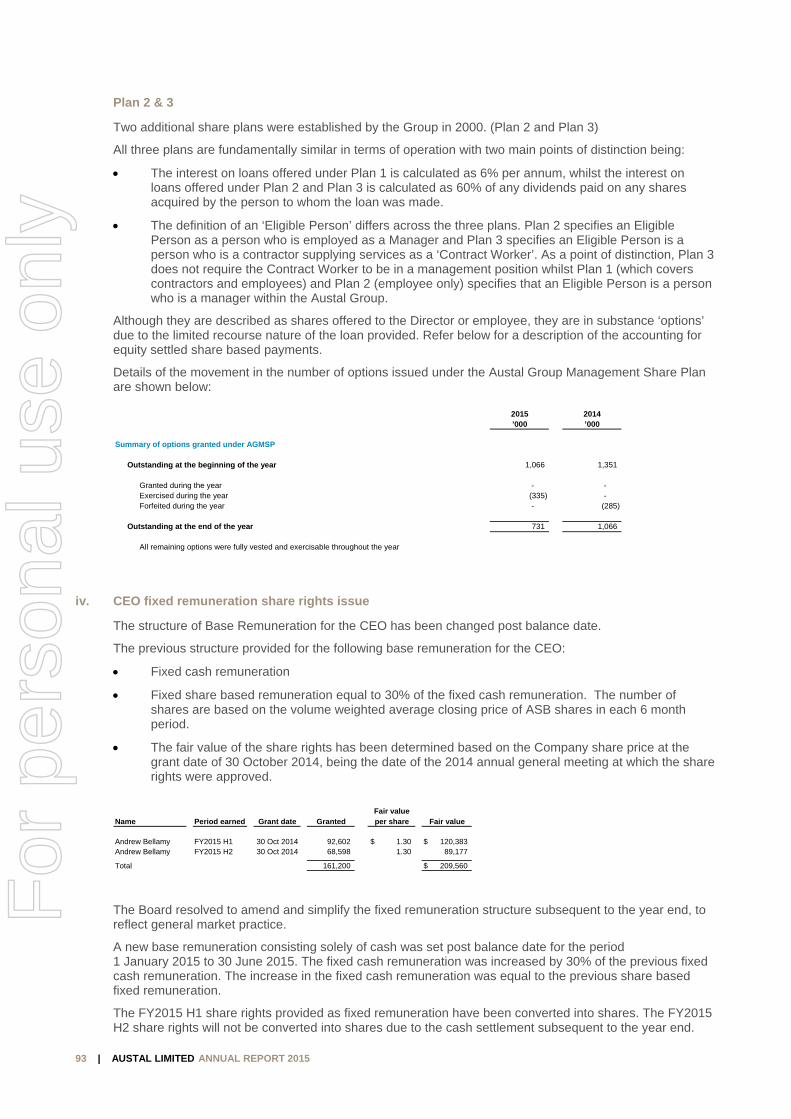
REPORT TO THE MEMBERS OF AUSTAL LIMITED
93 | AUSTAL LIMITED ANNUAL REPORT 2015
Plan 2 & 3
Two additional share plans were established by the Group in 2000. (Plan 2 and Plan 3)
All three plans are fundamentally similar in terms of operation with two main points of distinction being:
The interest on loans offered under Plan 1 is calculated as 6% per annum, whilst the interest on loans offered under Plan 2 and Plan 3 is calculated as 60% of any dividends paid on any shares acquired by the person to whom the loan was made.
The definition of an ‘Eligible Person’ differs across the three plans. Plan 2 specifies an Eligible Person as a person who is employed as a Manager and Plan 3 specifies an Eligible Person is a person who is a contractor supplying services as a ‘Contract Worker’. As a point of distinction, Plan 3 does not require the Contract Worker to be in a management position whilst Plan 1 (which covers contractors and employees) and Plan 2 (employee only) specifies that an Eligible Person is a person who is a manager within the Austal Group.
Although they are described as shares offered to the Director or employee, they are in substance ‘options’ due to the limited recourse nature of the loan provided. Refer below for a description of the accounting for equity settled share based payments.
Details of the movement in the number of options issued under the Austal Group Management Share Plan are shown below:
iv. CEO fixed remuneration share rights issue
The structure of Base Remuneration for the CEO has been changed post balance date.
The previous structure provided for the following base remuneration for the CEO:
Fixed cash remuneration
Fixed share based remuneration equal to 30% of the fixed cash remuneration. The number of shares are based on the volume weighted average closing price of ASB shares in each 6 month period.
The fair value of the share rights has been determined based on the Company share price at the grant date of 30 October 2014, being the date of the 2014 annual general meeting at which the share rights were approved.
The Board resolved to amend and simplify the fixed remuneration structure subsequent to the year end, to reflect general market practice.
A new base remuneration consisting solely of cash was set post balance date for the period 1 January 2015 to 30 June 2015. The fixed cash remuneration was increased by 30% of the previous fixed cash remuneration. The increase in the fixed cash remuneration was equal to the previous share based fixed remuneration.
The FY2015 H1 share rights provided as fixed remuneration have been converted into shares. The FY2015 H2 share rights will not be converted into shares due to the cash settlement subsequent to the year end.
2015 2014’000 ’000
Summary of options granted under AGMSP
Outstanding at the beginning of the year 1,066 1,351
Granted during the year - - Exercised during the year (335) - Forfeited during the year - (285)
Outstanding at the end of the year 731 1,066
All remaining options were fully vested and exercisable throughout the year
Fair valueName Period earned Grant date Granted per share Fair value
Andrew Bellamy FY2015 H1 30 Oct 2014 92,602 1.30$ 120,383$ Andrew Bellamy FY2015 H2 30 Oct 2014 68,598 1.30 89,177
Total 161,200 209,560$
For
per
sona
l use
onl
y

REPORT TO THE MEMBERS OF AUSTAL LIMITED
94 | AUSTAL LIMITED ANNUAL REPORT 2015
v. Recognition and measurement - equity settled transactions
The Group provides benefits to employees (including executive Directors and key management personnel) of the Group in the form of share-based payments, whereby employees render services in exchange for shares or rights over shares (equity-settled transactions).
Equity settled benefits have been provided to senior management and Directors under the following plans in the current and prior years:
The Austal Group Management Share Plan (AGMSP) Employee Share Option Plan (ESOP) The Long Term Incentive Plan (LTI Plan) CEO shares
The cost of these equity-settled transactions with employees is measured by reference to the fair value at the date at which they are granted. The fair value is determined by an external valuer using a Monte Carlo model.
No account is taken of any performance conditions, other than conditions linked to the price of the shares of Austal Limited (market conditions) if applicable in valuing equity-settled transactions. The number of entitlements included in expense recognition is adjusted to an estimate of the ultimate number of entitlements expected to vest where non-market performance conditions must be satisfied.
The cost of equity-settled transactions is recognised, together with a corresponding increase in equity, over the period in which the performance conditions are fulfilled, ending on the date on which the relevant employees become fully entitled to the award (the vesting period).
The cumulative expense recognised for equity-settled transactions at each reporting date until vesting date reflects (i) the extent to which the vesting period has expired and (ii) the number of awards that, in the opinion of the Directors of the Group, will ultimately vest. This opinion is formed based on the best available information at balance date. No adjustment is made for the likelihood of market performance conditions being met because the effect of these conditions is included in the determination of fair value at grant date. The statement of comprehensive income charge or credit for a period represents the movement in cumulative expense recognised as at the beginning and end of that period.
No expense is recognised for awards that do not ultimately vest, except for awards where vesting is conditional upon a market condition.
An expense is recognised as if the terms had not been modified. An expense also is recognised for any modification that increases the total fair value of the share-based payment arrangement, or is otherwise beneficial to the employee, as measured at the date of modification.
An equity settled award that is cancelled is treated as if it had vested on the date of cancellation, and any expense not yet recognised for the award is recognised immediately, however, cancelled awards and new awards are treated as if they were a modification of the original award if a new award is substituted for the cancelled award and designated as a replacement award on the date that it is granted, as described in the previous paragraph.
Shares in the Group held by the AGMSP are classified and disclosed as reserved shares and deducted from equity.
vi. Recognised share-based payment expenses
The expense recognised for share based payments during the year is shown in the table below:
2015 2014
’000 ’000
Share Based Payments Expense
Expense arising from equity-settled share-based payment transactions (1,373)$ (383)$
For
per
sona
l use
onl
y
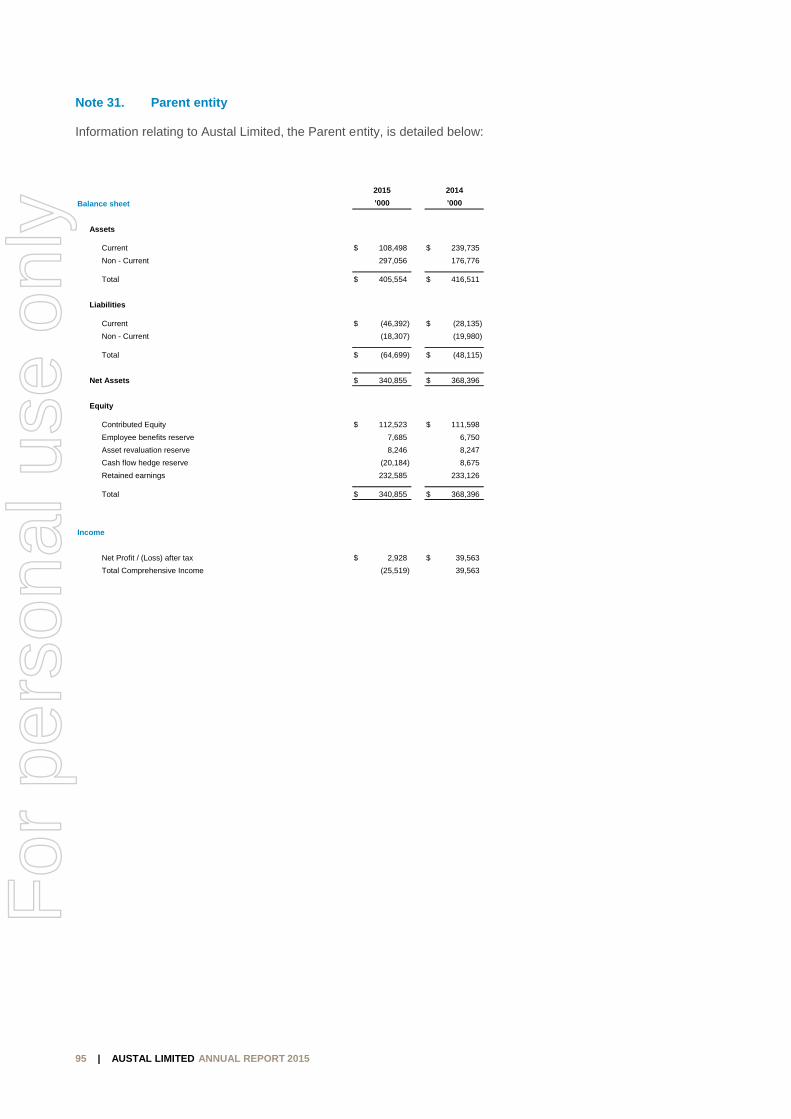
95 | AUSTA
Note 31.
Information r
Balance sheet
Assets
Current
Non - Curren
Total
Liabilities
Current
Non - Curren
Total
Net Assets
Equity
Contributed
Employee b
Asset revalu
Cash flow h
Retained ea
Total
Income
Net Profit / (
Total Compr
AL LIMITED ANN
Parent enti
relating to Au
nt
nt
Equity
enefits reserve
uation reserve
edge reserve
arnings
(Loss) after tax
rehensive Income
REPOR
NUAL REPORT
ity
ustal Limited,
RT TO THE M
2015
the Parent en
$
$
$
$
$
$
$
$
MEMBERS O
ntity, is detail
2015
’000
108,498$ $
297,056
405,554$ $
(46,392)$ $
(18,307)
(64,699)$ $
340,855$ $
112,523$ $
7,685
8,246
(20,184)
232,585
340,855$ $
2,928$ $
(25,519)
OF AUSTAL L
ed below:
2014
’000
239,735$
176,776
416,511$
(28,135)$
(19,980)
(48,115)$
368,396$
111,598$
6,750
8,247
8,675
233,126
368,396$
39,563$
39,563
LIMITED
For
per
sona
l use
onl
y
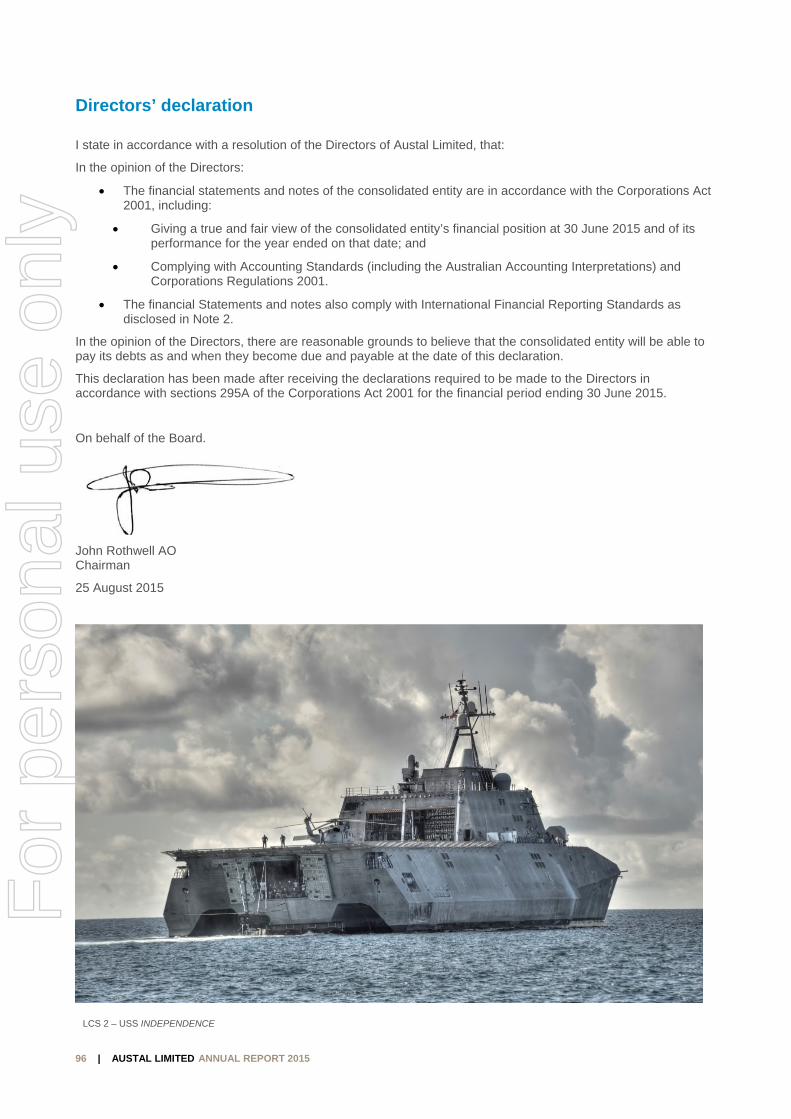
REPORT TO THE MEMBERS OF AUSTAL LIMITED
96 | AUSTAL LIMITED ANNUAL REPORT 2015
Directors’ declaration
I state in accordance with a resolution of the Directors of Austal Limited, that:
In the opinion of the Directors:
The financial statements and notes of the consolidated entity are in accordance with the Corporations Act 2001, including:
Giving a true and fair view of the consolidated entity’s financial position at 30 June 2015 and of its performance for the year ended on that date; and
Complying with Accounting Standards (including the Australian Accounting Interpretations) and Corporations Regulations 2001.
The financial Statements and notes also comply with International Financial Reporting Standards as disclosed in Note 2.
In the opinion of the Directors, there are reasonable grounds to believe that the consolidated entity will be able to pay its debts as and when they become due and payable at the date of this declaration.
This declaration has been made after receiving the declarations required to be made to the Directors in accordance with sections 295A of the Corporations Act 2001 for the financial period ending 30 June 2015.
On behalf of the Board.
John Rothwell AO Chairman
25 August 2015
LCS 2 – USS INDEPENDENCE
For
per
sona
l use
onl
y

REPORT TO THE MEMBERS OF AUSTAL LIMITED
97 | AUSTAL LIMITED ANNUAL REPORT 2015
A member firm of Ernst & Young Global Limited Liability limited by a scheme approved under Professional Standards Legislation
Independent audit report to the members of Austal Limited
Independent audit report to members of Austal Limited
Report on the financial report We have audited the accompanying financial report of Austal Limited, which comprises the consolidated statement of financial position as at 30 June 2015, the consolidated statement of comprehensive income, the consolidated statement of changes in equity and the consolidated statement of cash flows for the year then ended, notes comprising a summary of significant accounting policies and other explanatory information, and the directors' declaration of the consolidated entity comprising the company and the entities it controlled at the year's end or from time to time during the financial year.
Directors' responsibility for the financial report The directors of the company are responsible for the preparation of the financial report that gives a true and fair view in accordance with Australian Accounting Standards and the Corporations Act 2001 and for such internal controls as the directors determine are necessary to enable the preparation of the financial report that is free from material misstatement, whether due to fraud or error. In Note 2, the directors also state, in accordance with Accounting Standard AASB 101 Presentation of Financial Statements, that the financial statements comply with International Financial Reporting Standards.
Auditor's responsibility Our responsibility is to express an opinion on the financial report based on our audit. We conducted our audit in accordance with Australian Auditing Standards. Those standards require that we comply with relevant ethical requirements relating to audit engagements and plan and perform the audit to obtain reasonable assurance about whether the financial report is free from material misstatement.
An audit involves performing procedures to obtain audit evidence about the amounts and disclosures in the financial report. The procedures selected depend on the auditor's judgment, including the assessment of the risks of material misstatement of the financial report, whether due to fraud or error. In making those risk assessments, the auditor considers internal controls relevant to the entity's preparation and fair presentation of the financial report in order to design audit procedures that are appropriate in the circumstances, but not for the purpose of expressing an opinion on the effectiveness of the entity's internal controls. An audit also includes evaluating the appropriateness of accounting policies used and the reasonableness of accounting estimates made by the directors, as well as evaluating the overall presentation of the financial report.
We believe that the audit evidence we have obtained is sufficient and appropriate to provide a basis for our audit opinion.
Independence In conducting our audit we have complied with the independence requirements of the Corporations Act 2001. We have given to the directors of the company a written Auditor’s Independence Declaration, a copy of which is included in the directors’ report.
Ernst & Young 11 Mounts Bay Road Perth WA 6000 Australia GPO Box M939 Perth WA 6843
Tel: +61 8 9429 2222 Fax: +61 8 9429 2436 ey.com/au
For
per
sona
l use
onl
y

98 | AUSTA
A member firm of ErLiability limited by a
Opinion In our opinion
a. the finan
i. givthe
ii. co
b. the finan
Report on thWe have auditcompany are rCorporations Aaccordance wi
Opinion In our opinion,Corporations A
Ernst & Young
Robert A KirkbPartner Perth 25 August 201
AL LIMITED ANN
rnst & Young Global Limita scheme approved unde
:
ncial report of A
ving a true and e year ended on
omplying with A
ncial report also
he remuneratted the Remuneresponsible for Act 2001. Our rith Australian A
, the Remunera Act 2001.
g
by
15
REPOR
NUAL REPORT
ted r Professional Standards
Austal Limited i
fair view of the n that date; and
Australian Acco
o complies with
tion report eration Report i the preparationresponsibility isAuditing Standa
ation Report of A
RT TO THE M
2015
Legislation
s in accordance
consolidated ed
unting Standar
h International F
ncluded in the n and presentats to express an oards.
Austal Limited f
MEMBERS O
e with the Corp
entity's financia
rds and the Corp
Financial Repo
directors' repotion of the Remopinion on the
for the year end
OF AUSTAL L
porations Act 20
al position as at
rporations Regu
orting Standards
ort for the year emuneration Repo
Remuneration R
ded 30 June 20
LIMITED
001, including:
t 30 June 2015
ulations 2001; a
ds as disclosed i
ended 30 June 2ort in accordanReport, based o
15, complies w
and of its perfo
and
in Note 2.
2015. The direcce with sectionon our audit co
with section 300
ormance for
ctors of the 300A of the nducted in
0A of the
For
per
sona
l use
onl
y

SHAREHOLDER INFORMATION
99 | AUSTAL LIMITED ANNUAL REPORT 2015
Shareholder information
The following information was extracted from the Company’s register at 13 August 2015.
Distribution of shares
Twenty largest shareholders
Voting rights
All ordinary shares issued by Austal Limited carry one vote per share without restriction.
Corporate governance statement
The Company has elected to post its Corporate Governance Statement on its website in accordance with ASX Listing Rule 4.10.3. The Corporate Governance Statement can be found at the following URL: www.austal.com/corporategovernance.
Number of Number of % of Total
holders shares issued capital
1 - 1000 1,566 750,375 0.22%
1,001 - 5,000 1,915 5,182,203 1.49%
5,001 - 10,000 700 5,344,876 1.54%
10,001 - 100,000 755 19,735,927 5.69%
100,001 and over 69 315,910,070 91.06%
Total 5,005 346,923,451 100.00%
Number of % of Total Substantial
Rank Shareholder holders issued capital shareholder
1 HSBC Custody Nominees (Australia) Limited 82,088,257 23.66% Yes
2 J P Morgan Nominees Australia Limited 60,697,725 17.50% Yes
3 National Nominees Limited 37,347,233 10.77% Yes
4 Citicorp Nominees Pty Ltd 34,937,510 10.07% Yes
5 Austro Pty Ltd 32,200,745 9.28% Yes
6 RBC Investor Services Australia Nominees Pty Limited 12,779,593 3.68%
7 Onyx (WA) Pty Ltd 8,317,570 2.40%
8 BNP Paribas Noms Pty Ltd 5,807,717 1.67%
9 Mr Vincent Michael O’Sullivan 4,164,000 1.20%
10 Austal Group Management Share Plan Pty Ltd 4,015,818 1.16%
11 Garry Heys & Dorothy Heys 2,844,670 0.82%
12 RBC Investor Services Australia Nominees Pty Limited 2,730,973 0.79%
13 UBS Nominees Pty Ltd 2,644,953 0.76%
14 Mr William Robert Chambers 2,325,650 0.67%
15 Mirrabooka Investments Limited 2,000,000 0.58%
16 Lavinia Shipping Ltd 2,000,000 0.58%
17 Mossisberg Pty Ltd 1,922,000 0.55%
18 Bond Street Custodians Limited 1,594,718 0.46%
19 Navigator Australia Ltd 1,517,257 0.43%
20 Warbont Nominees 1,374,717 0.40%
Total 303,311,106 87.42%
For
per
sona
l use
onl
y

CORPORATE DIRECTORY
100 | AUSTAL LIMITED ANNUAL REPORT 2015
Corporate Directory
Directors
Executive Directors
Andrew Bellamy Non-Executive Directors
Giles Everist Jim McDowell John Rothwell David Singleton Auditors
Ernst & Young
The Ernst & Young Building 11 Mounts Bay Road Perth 6000 Western Australia
Company Secretary
Adrian Strang
Registered office
100 Clarence Beach Road Henderson 6166 Western Australia Telephone: +61 8 9410 1111 Facsimile: +61 8 9410 2564
Share registry
Advanced Share Registry Services
110 Stirling Highway Nedlands 6009 Western Australia Telephone: +61 8 9389 8033 Facsimile: +61 8 9389 7871
JHSV 3 - USNS Millinocket
JHSV 1 - USNS Spearhead
JHSV 2 - USNS Choctaw County
JHSV 4 - USNS Fall River
For
per
sona
l use
onl
y