for personal use only · the group monetizes its games and apps through in-app purchases and...
TRANSCRIPT

ACN 122 921 813
APPENDIX 4E
PRELIMINARY FINANCIAL REPORT
FOR THE YEAR ENDED 31 DECEMBER 2017
This Appendix 4E report is provided to the Australian Securities Exchange (ASX) under ASX Listing Rule 4.3A
For
per
sona
l use
onl
y

2
Appendix 4E Information
Comparative Period Reporting Year
1 January 2016 – 31 December 2016 1 January 2017 – 31 December 2017
Results for announcement to the market
Year 2016 2017 Var ($) Var (%)
Revenue from
Ordinary activities 8,697,633 6,488,559 -2,209,074 -25.4%
Profit (loss) from
ordinary activities
after tax attributable
to members
(7,961,700) (8,266,411) -304,711 +3.8%
Net profit (loss) for
the period
attributable to
members
(7,961,700) (8,266,411) -304,711 +3.8%
No dividend was paid or declared by the Company in the year and up to the date of this report.
The Directors do not recommend that any amount be paid by way of dividend for the financial
year ended 31 December 2017.
Operating revenue for 2017 reached $6.5m, representing a 25.4% decrease when compared
to the previous year. This decrease follows the strategic alignment of the Company and the
sale of non-strategic apps for $1.6m in August 2017. The sales of non-strategic apps resulted
in a write down as a cost of the transaction for some of the sold apps to a portion of the
goodwill attributable to to the original Ticbits business. Cost of revenue from operating
activities decreased accordingly from $3.7m to $2.9m.
Employee benefits expense excluding provision for milestone payments are down 12.5% from
$2.0m to $1.8m following the restructuring plan implemented during the second half of the
year. The Company significantly reduced its headcount from over 110 people at the end of the
first half of the year to less than 70 people at the end of the year. The company intend to
maintain the Employee benefits expenses at the level of the end of 2017 along the year 2018.
Marketing expenses are down 15.3% vs last year from $3.1m to $2.6m and highlights the
strategy to focus the investments on a limited number of projects and apps with high returns
potentials.
For
per
sona
l use
onl
y
3
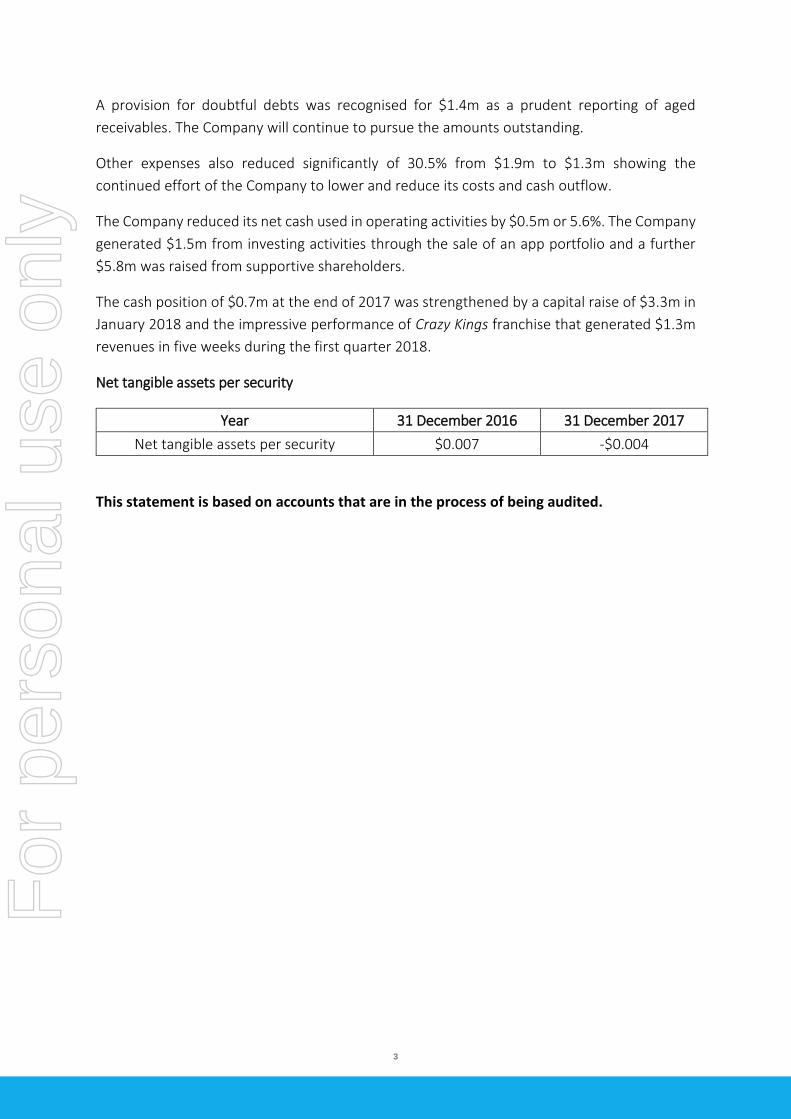
A provision for doubtful debts was recognised for $1.4m as a prudent reporting of aged
receivables. The Company will continue to pursue the amounts outstanding.
Other expenses also reduced significantly of 30.5% from $1.9m to $1.3m showing the
continued effort of the Company to lower and reduce its costs and cash outflow.
The Company reduced its net cash used in operating activities by $0.5m or 5.6%. The Company
generated $1.5m from investing activities through the sale of an app portfolio and a further
$5.8m was raised from supportive shareholders.
The cash position of $0.7m at the end of 2017 was strengthened by a capital raise of $3.3m in
January 2018 and the impressive performance of Crazy Kings franchise that generated $1.3m
revenues in five weeks during the first quarter 2018.
Net tangible assets per security
Year 31 December 2016 31 December 2017
Net tangible assets per security $0.007 -$0.004
This statement is based on accounts that are in the process of being audited.
For
per
sona
l use
onl
y
4
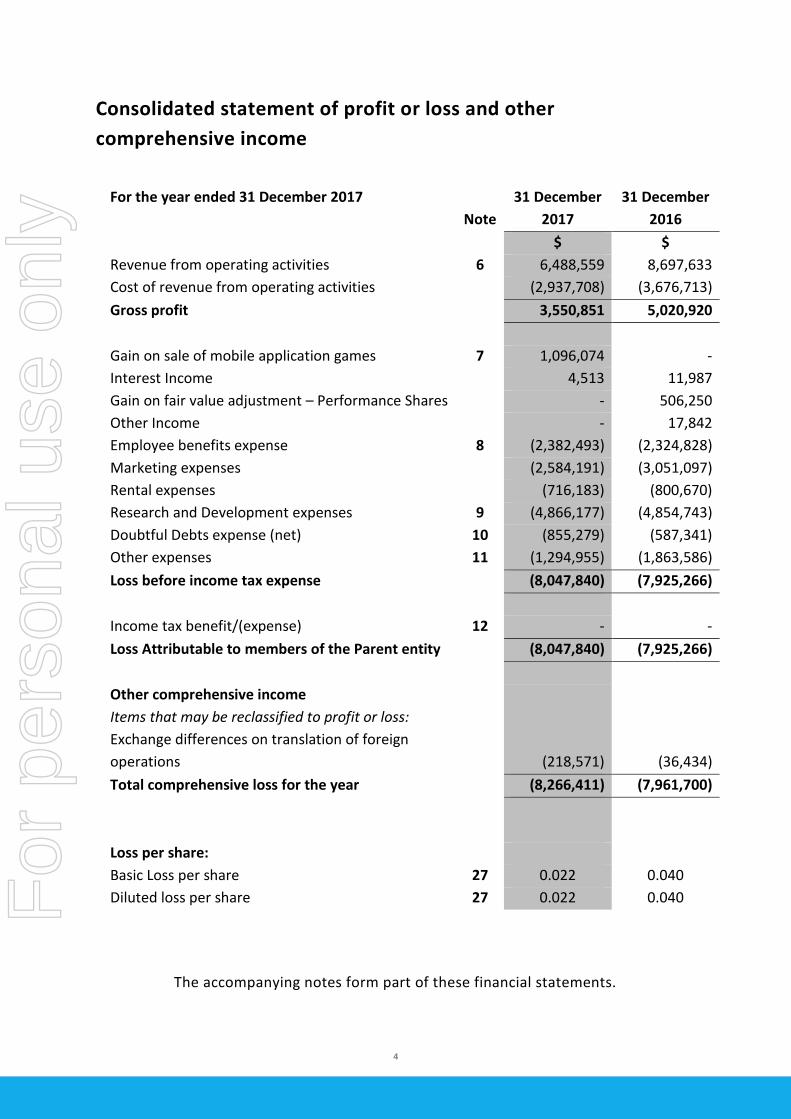
Consolidated statement of profit or loss and other
comprehensive income
For the year ended 31 December 2017
Note
31 December
2017
31 December
2016
$ $
Revenue from operating activities 6 6,488,559 8,697,633
Cost of revenue from operating activities (2,937,708) (3,676,713)
Gross profit 3,550,851 5,020,920
Gain on sale of mobile application games 7 1,096,074 -
Interest Income 4,513 11,987
Gain on fair value adjustment – Performance Shares - 506,250
Other Income - 17,842
Employee benefits expense 8 (2,382,493) (2,324,828)
Marketing expenses (2,584,191) (3,051,097)
Rental expenses (716,183) (800,670)
Research and Development expenses 9 (4,866,177) (4,854,743)
Doubtful Debts expense (net) 10 (855,279) (587,341)
Other expenses 11 (1,294,955) (1,863,586)
Loss before income tax expense (8,047,840) (7,925,266)
Income tax benefit/(expense) 12 - -
Loss Attributable to members of the Parent entity (8,047,840) (7,925,266)
Other comprehensive income
Items that may be reclassified to profit or loss:
Exchange differences on translation of foreign
operations (218,571) (36,434)
Total comprehensive loss for the year (8,266,411) (7,961,700)
Loss per share:
Basic Loss per share 27 0.022 0.040
Diluted loss per share 27 0.022 0.040
The accompanying notes form part of these financial statements.
For
per
sona
l use
onl
y

5
Consolidated statement of financial position
As at 31 December 2017
Note
31 December
2017
31 December
2016
$ $
Current assets:
Cash and cash equivalents 13 687,512 1,526,919
Trade and other receivables 14 1,608,433 2,197,005
Other assets 16 600,770 160,256
Total Current Assets 2,896,715 3,884,180
Non-Current Assets:
Plant and equipment 17 116,970 140,139
Financial assets 15 560 434,083
Goodwill 18 1,140,896 1,724,208
Total Non-Current Assets 1,258,426 2,298,430
Total Assets 4,155,141 6,182,610
Current Liabilities:
Trade and other payables 19 2,555,007 2,465,861
Short-term provisions 20 200,927 122,056
Financial liabilities 21 881,821 292,841
Other liability 22 51,451 -
Total Current Liabilities 3,689,206 2,880,758
Total Liabilities 3,689,206 2,880,758
Net Assets 465,935 3,301,852
Equity:
Issued equity 23 31,121,231 25,690,743
Reserves 24 (379,910) 87,006
Accumulated losses (30,275,386) (22,475,897)
Total Equity 465,935 3,301,852
The accompanying notes form part of these financial statements.
For
per
sona
l use
onl
y
6
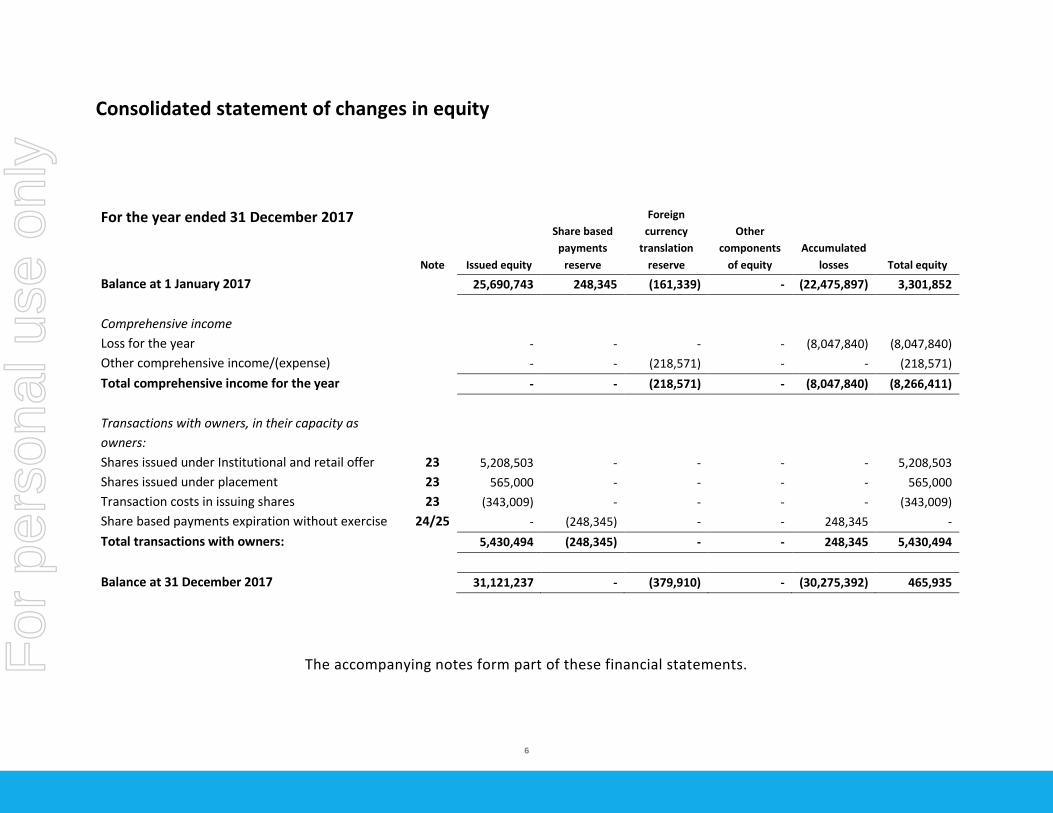
Consolidated statement of changes in equity
For the year ended 31 December 2017
Note Issued equity
Share based
payments
reserve
Foreign
currency
translation
reserve
Other
components
of equity
Accumulated
losses Total equity
Balance at 1 January 2017 25,690,743 248,345 (161,339) - (22,475,897) 3,301,852
Comprehensive income
Loss for the year - - - - (8,047,840) (8,047,840)
Other comprehensive income/(expense) - - (218,571) - - (218,571)
Total comprehensive income for the year - - (218,571) - (8,047,840) (8,266,411)
Transactions with owners, in their capacity as
owners:
Shares issued under Institutional and retail offer 23 5,208,503 - - - - 5,208,503
Shares issued under placement 23 565,000 - - - - 565,000
Transaction costs in issuing shares 23 (343,009) - - - - (343,009)
Share based payments expiration without exercise 24/25 - (248,345) - - 248,345 -
Total transactions with owners: 5,430,494 (248,345) - - 248,345 5,430,494
Balance at 31 December 2017 31,121,237 - (379,910) - (30,275,392) 465,935
The accompanying notes form part of these financial statements.
For
per
sona
l use
onl
y

7
Consolidated statement of changes in equity
For the year ended 31 December 2016
Note
Issued capital
ordinary
Share based
payments
reserve
Foreign
currency
translation
reserve
Other
components
of equity
Accumulated
losses Total equity
Balance at 1 January 2016 16,192,964 248,345 (124,905) (3,917,057) (10,633,574) 1,765,773
Comprehensive income
Loss for the year - - - - (7,925,266) (7,925,266)
Other comprehensive income/(expense) - - (36,434) - - (36,434)
Total comprehensive income for the year - - (36,434) - (7,925,266) (7,961,700)
Transactions with owners, in their capacity as
owners:
Shares issued on conversion of performance shares 2,400,000 - - 3,917,057 (3,917,057) 2,400,000
Shares issued under placement and SPP 7,500,000 - - - - 7,500,000
Transaction costs in issuing shares (402,221) - - - - (402,221)
Total transactions with owners: 9,497,779 - - 3,917,057 (3,917,057) 9,497,779
Balance at 31 December 2016 25,690,743 248,345 (161,339) - (22,475,897) 3,301,852
The accompanying notes form part of these financial statements.
For
per
sona
l use
onl
y

Consolidated statement of cash flows
For the year ended 31 December 2017
Note
31 December
2017
31 December
2016
$ $
Cash flows from operating activities:
Receipts from customers 6,412,190 8,864,820
Interest and other items of similar nature received 4,513 29,829
Payments to suppliers and employees (14,103,800) (17,033,646)
Net cash (used in) operating activities 13 (7,687,097) (8,138,997)
Cash flows from investing activities:
Receipts from sales of Apps 1,554,713 -
Payment for the acquisition of a subsidiary net of cash
acquired
4 - (1,752,813)
Purchase of financial assets 15 (160,920) (228,774)
Purchase of property, plant and equipment (9,147) (145,395)
Net cash (used in) investing activities 1,384,646 (2,126,982)
Cash flows from financing activities
Proceeds from issue of shares 23 5,773,497 7,500,000
Payment of transaction costs for issue of shares 23 (343,009) (402,221)
Net cash provided by financing activities 5,430,488 7,097,779
Net increase/(decrease) in cash and cash equivalents (871,963) (3,168,200)
Exchange rate adjustments 32,556 (240,628)
Cash at the beginning of the year 1,526,919 4,935,747
Cash at the end of the year 13 687,512 1,526,919
The accompanying notes form part of these financial statements.
For
per
sona
l use
onl
y

9
Notes to the consolidated financial statements For the year ended 31 December 2017
1. Corporate information
The consolidated financial statements of Animoca Brands Corporation Limited and its
subsidiaries (collectively, “the Group” and/or “the Company”) for the year ended 31
December 2017 were authorized for preliminary release to the ASX in accordance with a
resolution of the Directors on 27 February 2018.
Animoca Brands Corporation Limited is a for profit company limited by shares, incorporated
and domiciled in Australia, whose shares are publicly traded. The Group’s principal activities
are the development and marketing of a broad portfolio of mobile games and apps (including
orientated to educational learning, including e-books and a book app) apps for smartphones
and tablets all over the world. Mobile games and apps developed and/or published by the
Group are made available for customers on different App stores including Apple’s App Store
and Google’s Google Play. The Group monetizes its games and apps through In-App purchases
and advertising offered to the consumers within games and apps for smartphones and
tablets.
SUMMARY OF SIGNIFICANT ACCOUNTING POLICIES
1.1. Basis of preparation
The financial report is a general-purpose financial report, which has been prepared in
accordance with the requirements of the Corporations Act 2001, Australian Accounting
Standards and other authoritative pronouncements of the Australian Accounting Standards
Board. The financial report has also been prepared on a historical cost basis.
The consolidated financial statements provide comparative information in respect of the
previous period. The financial report is presented in Australian dollars, being the presentation
currency for the Group.
The financial report has been prepared on the basis of a going concern.
1.2. Compliance with International Financial Reporting Standards (IFRS)
The financial report also complies with International Financial Reporting Standards (IFRS) as
issued by the International Accounting Standards Board.
1.3. Accounting Standards and Interpretations issued but not yet effective
Australian Accounting Standards and Interpretations that have recently been issued or
amended that potentially impact the Group but are not yet effective and have not been
For
per
sona
l use
onl
y
10
adopted by the Group for the annual reporting period ended 31 December 2017 are outlined
below:
AASB 9 Financial Instruments
AASB 9 introduces new requirements for the classification and measurement of financial assets and liabilities and includes a forward-looking “expected loss” impairment model and a substantially-changed approach to hedge accounting.
These requirements improve and simplify the approach for classification and measurement of financial assets compared with the requirements of AASB 139. The main changes are:
a. Financial assets that are debt instruments will be classified based on: (i) the objective of
the entity’s business model for managing the financial assets; and (ii) the characteristics of the contractual cash flows.
b. Allows an irrevocable election on initial recognition to present gains and losses on investments in equity instruments that are not held for trading in other comprehensive income (instead of in profit or loss). Dividends in respect of these investments that are a return on investment can be recognized in profit or loss and there is no impairment or recycling on disposal of the instrument.
c. Introduces a “fair value through other comprehensive income” measurement category for particular simple debt instruments.
d. Financial assets can be designated and measured at fair value through profit or loss at initial recognition if doing so eliminates or significantly reduces a measurement or recognition inconsistency that would arise from measuring assets or liabilities, or recognising the gains and losses on them, on different bases.
e. Where the fair value option is used for financial liabilities the change in fair value is to be accounted for as follows:
• the change attributable to changes in credit risk are presented in Other Comprehensive Income (“OCI”)
• the remaining change is presented in profit or loss
If this approach creates or enlarges an accounting mismatch in the profit or loss, the effect of the changes in credit risk are also presented in profit or loss.
Otherwise, the following requirements have generally been carried forward unchanged from AASB 139 into AASB 9:
• classification and measurement of financial liabilities; and
• derecognition requirements for financial assets and liabilities.
For
per
sona
l use
onl
y
11
AASB 9 requirements regarding hedge accounting represent a substantial overhaul of hedge accounting that enable entities to better reflect their risk management activities in the financial statements.
Furthermore, AASB 9 introduces a new impairment model based on expected credit losses. This model makes use of more forward-looking information and applies to all financial instruments that are subject to impairment accounting.
The entity is yet to undertake a detailed assessment of the impact of AASB 9. However, based on the entity’s preliminary assessment, the Standard is not expected to have a material impact on the transactions and balances recognized in the financial statements when it is first adopted for the year ending 31 December 2018.
AASB 15 Revenue from Contracts with Customers
Replaces AASB 118 Revenue, AASB 111 Construction Contracts and some revenue-related interpretations:
• establishes a new revenue recognition model
• changes the basis for deciding whether revenue is to be recognized over time or at a point
in time
• provides new and more detailed guidance on specific topics (e.g. multiple element
arrangements, variable pricing, rights of return, warranties and licensing)
• expands and improves disclosures about revenue
On adoption, this standard will not have a material impact on revenue recognition.
AASB 16 Leases
AASB 16 will replace AASB 17 Leases for financial reporting periods beginning on or after 1
January 2019. Early adoption is permitted for companies that also apply AASB 15 Revenue
from Contracts with Customers.
The key features of the new standard are:
• elimination of classification of leases as either operating leases or finance leases for a
lessee
• the recognition of lease assets and liabilities on the statement of financial position ,
initially measured at present value of unavoidable future lease payments
• recognize depreciation of lease assets and interest on lease liabilities on the statement of
profit or loss and other comprehensive income over the lease term
For
per
sona
l use
onl
y

12
• separation of the total amount of cash paid into a principal portion and interest in the
statement of cashflows
• short-term leases (less than twelve months) and leases of low-value assets (such as
personal computers) are exempt from the requirements
The entity is yet to undertake a detailed assessment of the impact of AASB 16. However,
based on the entity’s preliminary assessment, the Standard is not expected to have a material
impact on the transactions and balances recognized in the financial statements when it is first
adopted for the year ending 31 December 2019.
1.4. Significant accounting policies
(a) Basis of consolidation
The consolidated financial statements comprise the financial statements of the Group and its
subsidiaries as at 31 December 2017. Control is achieved when the Group is exposed, or has
rights, to variable returns from its involvement with the investee and has the ability to affect
those returns through its power over the investee. Specifically, the Group controls an investee
if and only if the Group has:
• Power over the investee (i.e. existing rights that give it the current ability to direct the
relevant activities of the investee),
• Exposure, or rights, to variable returns from its involvement with the investee, and
• The ability to use its power over the investee to affect its returns.
When the Group has less than a majority of the voting or similar rights of an investee, the
Group considers all relevant facts and circumstances in assessing whether it has power over
an investee, including:
• The contractual arrangement with the other vote holders of the investee,
• Rights arising from other contractual arrangements, and
• The Group’s voting rights and potential voting rights.
The Group re-assesses whether or not it controls an investee if facts and circumstances
indicate that there are changes to one or more of the three elements of control. Consolidation
of a subsidiary begins when the Group obtains control over the subsidiary and ceases when
the Group loses control of the subsidiary. Assets, liabilities, income and expenses of a
subsidiary acquired or disposed of during the year are included in the statement of profit and
For
per
sona
l use
onl
y

13
loss from the date the Group gains control until the date the Group ceases to control the
subsidiary.
When necessary, adjustments are made to the financial statements of subsidiaries to bring
their accounting policies into line with the Group’s accounting policies. All intra-group assets
and liabilities, equity, income, expenses and cash flows relating to transactions between
members of the Group are eliminated in full on consolidation.
(b) Current versus non-current classification
The Group presents assets and liabilities in statement of financial position based on
current/non-current classification. An asset as current when it is:
• Expected to be realized or intended to sold or consumed in normal operating cycle;
• Held primarily for the purpose of trading;
• Expected to be realized within twelve months after the reporting period; or
• Cash or cash equivalent unless restricted from being exchanged or used to settle a liability
for at least twelve months after the reporting period.
All other assets are classified as non-current.
A liability is current when:
• It is expected to be settled in normal operating cycle;
• It is held primarily for the purpose of trading;
• It is due to be settled within twelve months after the reporting period; or
• There is no unconditional right to defer the settlement of the liability for at least twelve
months after the reporting period.
The Group classifies all other liabilities as non-current.
(c) Foreign currency translation
The Group’s consolidated financial statements are presented in Australian dollars, which is
also the Parent’s functional currency. The other entities within the Group have a functional
currency of Euros and US Dollars.
For
per
sona
l use
onl
y
14
Transactions and balances
Transactions in foreign currencies are initially recorded by the Group’s entities at their
respective functional currency spot rates at the date the transaction first qualifies for
recognition.
Monetary assets and liabilities denominated in foreign currencies are translated at the
functional currency spot rates of exchange at the reporting date.
Differences arising on settlement or translation of monetary items are recognized in profit or
loss with the exception of monetary items that are designated as part of the hedge of the
Group’s net investment of a foreign operation. These are recognized in other comprehensive
income until the net investment is disposed of, at which time, the cumulative amount is
reclassified to profit or loss. Tax charges and credits attributable to exchange differences on
those monetary items are also recorded in other comprehensive income.
Non-monetary items that are measured in terms of historical cost in a foreign currency are
translated using the exchange rates at the dates of the initial transactions. Non-monetary
items measured at fair value in a foreign currency are translated using the exchange rates at
the date when the fair value is determined. The gain or loss arising on translation of non-
monetary items measured at fair value is treated in line with the recognition of gain or loss
on change in fair value of the item (i.e., translation differences on items whose fair value gain
or loss is recognized in other comprehensive income or profit or loss are also recognized in
other comprehensive income or profit or loss, respectively).
Any goodwill arising on the acquisition of a foreign operation and any fair value adjustments
to the carrying amounts of assets and liabilities arising on the acquisition are treated as assets
and liabilities of the foreign operation and translated at the spot rate of exchange at the
reporting date.
Group companies
On consolidation, the assets and liabilities of foreign operations are translated into dollars at
the rate of exchange prevailing at the reporting date and their statements of profit or loss are
translated at exchange rates prevailing at the dates of the transactions. The exchange
differences arising on translation for consolidation are recognized in other comprehensive
income. On disposal of a foreign operation, the component of other comprehensive income
relating to that particular foreign operation is recognized in profit or loss.
For
per
sona
l use
onl
y
15
(d) Revenue recognition
Revenue is recognized to the extent that it is probable that the economic benefits will flow to
the Group and the revenue can be reliably measured, regardless of when the payment is being
made. Revenue is measured at the fair value of the consideration received or receivable,
taking into account contractually defined terms of payment and excluding taxes or duty.
Sales of applications and In-apps purchase items
The Group receives income from the sale of applications and In-app purchase items via the
smartphone platforms. Revenue is recognized on a per transaction basis upon the successful
download of the applications or in-app purchase items.
Service fee income
Service fee income is recognized in the accounting period in which the services are rendered.
Advertising income
The Group receives income from the rendering of advertising services through the advertising
platforms. Revenue is recognized upon the delivery of the service.
Interest income
For all financial instruments measured at amortized cost and interest-bearing financial assets
classified as available-for-sale, interest income is recorded using the effective interest rate
(EIR). EIR is the rate that exactly discounts the estimated future cash payments or receipts
over the expected life of the financial instrument or a shorter period, where appropriate, to
the net carrying amount of the financial asset or liability. (e) Taxes
Current income tax
Current income tax assets and liabilities are measured at the amount expected to be
recovered from or paid to the taxation authorities. The tax rates and tax laws used to compute
the amount are those that are enacted or substantively enacted at the reporting date in the
countries where the Group operates and generates taxable income.
Current income tax relating to items recognized directly in equity is recognized in equity and
not in the statement of profit or loss. Management periodically evaluates positions taken in
the tax returns with respect to situations in which applicable tax regulations are subject to
interpretation and establishes provisions where appropriate.
For
per
sona
l use
onl
y

16
Deferred tax
Deferred tax is provided using the liability method on temporary differences between the tax
bases of assets and liabilities and their carrying amounts for financial reporting purposes at
the reporting date.
Deferred income tax liabilities are recognized for all taxable temporary differences except:
• when the deferred income tax liability arises from the initial recognition of goodwill or
of an asset or liability in a transaction that is not a business combination and that, at
the time of the transaction, affects neither the accounting profit nor taxable profit or
loss; or
• when the taxable temporary difference is associated with investments in subsidiaries,
associates or interests in joint ventures, and the timing of the reversal of the temporary
difference can be controlled and it is probable that the temporary difference will not
reverse in the foreseeable future.
Deferred income tax assets are recognized for all deductible temporary differences, carry-
forward of unused tax assets and unused tax losses, to the extent that it is probable that
taxable profit will be available against which the deductible temporary differences and the
carry-forward of unused tax credits and unused tax losses can be utilized, except:
• when the deferred income tax asset relating to the deductible temporary difference
arises from the initial recognition of an asset or liability in a transaction that is not a
business combination and, at the time of the transaction, affects neither the accounting
profit nor taxable profit or loss; or
• when the deductible temporary difference is associated with investments in
subsidiaries, associates or interests in joint ventures, in which case a deferred tax asset
is only recognized to the extent that it is probable that the temporary difference will
reverse in the foreseeable future and taxable profit will be available against which the
temporary difference can be utilized.
The carrying amount of deferred income tax assets is reviewed at each reporting date and
reduced to the extent that it is no longer probable that sufficient taxable profit will be
available to allow all or part of the deferred income tax asset to be utilized.
Unrecognized deferred income tax assets are reassessed at each reporting date and are
recognized to the extent that it has become probable that future taxable profit will allow the
deferred tax asset to be recovered.
For
per
sona
l use
onl
y

17
Deferred income tax assets and liabilities are measured at the tax rates that are expected to
apply to the year when the asset is realized or the liability is settled, based on tax rates (and
tax laws) that have been enacted or substantively enacted at the reporting date.
Income taxes relating to items recognized directly in equity are recognized in equity and not
in profit or loss.
Deferred tax assets and deferred tax liabilities are offset only if a legally enforceable right
exists to set off current tax assets against current tax liabilities and the deferred tax assets
and liabilities relate to the same taxable entity and the same taxation authority.
(f) Intangible assets
Costs associated with maintaining computer software programmes are recognized as an
expense as incurred. Development costs that are directly attributable to the design and
testing of identifiable and unique software products controlled by the Group are recognized
as intangible assets when the following criteria are met:
• It is technically feasible to complete the software product so that it will be available for use;
• Management intends to complete the software product and use or sell it;
• There is an ability to use or sell the software product; • It can be demonstrated how the software product will generate probable future
economic benefits;
• Adequate technical, financial and other resources to complete the development and to use or sell the software product are available; and
• The expenditure attributable to the software product during its development can be reliably measured
Directly attributable costs that are capitalized as part of the software product include the
software development employee costs and an appropriate portion of relevant overheads.
Other development expenditures that do not meet these criteria are recognized as an
expense as incurred. Development costs previously recognized as an expense cannot be
recognized as an asset in a subsequent period.
No development expenditure incurred during the years 2017 and 2016 has been recognized
as an intangible asset as no expenditure incurred met the criteria for capitalization as listed
above.
(g) Leases
The determination of whether an arrangement is, or contains, a lease is based on the
substance of the arrangement at the inception date. The arrangement is assessed for whether
For
per
sona
l use
onl
y
18
fulfilment of the arrangement is dependent on the use of a specific asset or assets or the
arrangement conveys a right to use the asset or assets, even if that right is not explicitly
specified in an arrangement.
(h) Borrowing costs
Borrowing costs directly attributable to the acquisition, construction or production of an asset
that necessarily takes a substantial period of time to get ready for its intended use or sale are
capitalized as part of the cost of the asset. All other borrowing costs are expensed in the
period in which they occur. Borrowing costs consist of interest and other costs that an entity
incurs in connection with the borrowing of funds.
(i) Financial Instruments
Recognition and initial measurement
Financial assets and financial liabilities are recognized when the entity becomes a party to the
contractual provisions to the instrument. For financial assets, this is equivalent to the date
that the Group commits itself to either the purchase or sale of the asset (i.e. trade date
accounting is adopted).
Financial instruments are initially measured at fair value plus transaction costs, except where
the instrument is classified "at fair value through profit or loss", in which case transaction
costs are expensed to profit or loss immediately.
Classification and subsequent measurement
Subsequent to the initial transaction at the next financial reporting period, the financial asset
is required to be revalued to reflect a value that is both relevant and faithfully represented.
Under normal circumstances the financial asset would be subject to impairment, however the
Company’s policy requires that the amount allocated to R&D should be expensed through the
profit and loss with only the par value of the financial asset remaining on the balance sheet.
The Group does not designate any interests in subsidiaries, associates or joint venture entities
as being subject to the requirements of Accounting Standards specifically applicable to
financial instruments.
(i) Loans and receivables
Loans and receivables are non-derivative financial assets with fixed or determinable
payments that are not quoted in an active market and are subsequently measured at
amortized cost.
Loans and receivables are included in current assets, where they are expected to mature
within 12 months after the end of the reporting period.
(ii) Classification and subsequent measurement of financial liabilities
For
per
sona
l use
onl
y

19
The Group’s financial liabilities included performance shares, and trade and other payables
during 2016. The Group’s financial liabilities include trade and other trade payables only in
2017.
Financial liabilities are measured at amortized cost using the effective interest method.
All interest-related charges and, if applicable, changes in an instrument’s fair value that are
reported in profit or loss are included within finance costs or finance income.
(i) Financial assets at fair value through profit and loss
Financial assets at fair value through profit or loss include financial assets held for trading and
financial assets designated upon initial recognition as at fair value through profit or loss. Financial assets are classified as held for trading if they are acquired for the purpose of selling in the near term, or it is part of a portfolio of identified financial instruments that are managed together and for which there is evidence of a recent pattern of short-term profit-taking. Derivatives, including separated embedded derivatives are also classified as held for trading unless they are designated as effective hedging instruments or financial guarantee contracts.
Where a contract contains one or more embedded derivatives, the entire hybrid contract may
be designated as a financial asset at fair value through profit or loss, except where the
embedded derivative does not significantly modify the cash flows or it is clear that separation
of the embedded derivative is prohibited.
Financial assets may be designated at initial recognition as at fair value through profit or loss if the following criteria are met:
• the designation eliminates or significantly reduces the inconsistent treatment that would otherwise arise from measuring the assets or recognizing gains or losses on them on a different basis;
• the assets are part of a Company of financial assets which are managed and their performance is evaluated on a fair value basis, in accordance with a documented risk management strategy and information about the Company of financial assets is provided internally on that basis to the key management personnel; or
• the financial asset contains an embedded derivative that would need to be separately recorded.
Subsequent to initial recognition, the financial assets included in this category are measured at fair value with changes in fair value recognized in profit or loss. Fair value is determined by reference to active market transactions or using a valuation technique where no active market exists. Fair value gain or loss does not include any dividend or interest earned on these financial assets.
For
per
sona
l use
onl
y

20
(j) Provisions
Provisions are recognized when the Group has a legal or constructive obligation, as a result
of past events, for which it is probable that an outflow of economic benefits will result and
that outflow can be reliably measured.
Provisions are measured using the best estimate of the amounts required to settle the
obligation at the end of the reporting period.
Annual leave
Annual leave benefits are expected to be wholly settled within 12 months and are recorded
at the nominal amount of leave outstanding at each reporting date.
(k) Cash and Cash Equivalents
Cash and cash equivalents include cash on hand, deposits available on demand with banks,
other short-term highly liquid investments with original maturities of 3 months or less, and
bank overdrafts. Bank overdrafts are reported within short-term borrowings in current
liabilities in the statement of financial position.
(l) Goods and Services Tax (GST)
Revenues, expenses and assets are recognized net of the amount of GST, except where the
amount of GST incurred is not recoverable from the Australian Taxation Office (ATO).
Receivables and payables are stated inclusive of the amount of GST receivable or payable.
The net amount of GST recoverable from, or payable to, the ATO is included with other
receivables or payables in the statement of financial position.
Cash flows are presented on a gross basis. The GST components of cash flows arising from
investing or financing activities which are recoverable from, or payable to, the ATO are
presented as operating cash flows included in receipts from customers or payments to
suppliers.
(m) Property, plant and equipment
IT equipment and other equipment (comprising fittings and furniture) are initially recognized
at acquisition cost, including any costs directly attributable to bringing the assets to the
location and condition necessary for it to be capable of operating in the manner intended by
the Group’s management. IT equipment and other equipment are subsequently measured
using the cost model, cost less subsequent depreciation and impairment losses.
Depreciation is recognized on a straight-line basis to write down the cost less estimated
residual value of IT equipment and other equipment. The following useful lives are applied:
• Leasehold improvements: Over the shorter between the lease terms and 5 years
For
per
sona
l use
onl
y
21
• Office equipment: 5 years
• Furniture and fixtures: 5 years
Gains or losses arising on the disposal of property, plant and equipment are determined as
the difference between the disposal proceeds and the carrying amount of the assets and are
recognized in profit or loss within other income or other expenses.
(n) Impairment of non-financial assets
The Group assesses, at each reporting date, whether there is an indication that an asset may
be impaired. If any indication exists, or when annual impairment testing for an asset is
required, the Group estimates the asset’s recoverable amount. An asset’s recoverable
amount is the higher of an asset’s or cash-generating unit’s (“CGU”) fair value less costs of
disposal and its value in use. Recoverable amount is determined for an individual asset, unless
the asset does not generate cash inflows that are largely independent of those from other
assets or groups of assets. When the carrying amount of an asset or CGU exceeds its
recoverable amount, the asset is considered impaired and is written down to its recoverable
amount.
In assessing value in use, the estimated future cash flows are discounted to their present
value using a pre-tax discount rate that reflects current market assessments of the time value
of money and the risks specific to the asset. In determining fair value less costs of disposal,
recent market transactions are taken into account. If no such transactions can be identified,
an appropriate valuation model is used. These calculations are corroborated by valuation
multiples, quoted share prices for publicly traded companies or other available fair value
indicators.
For assets excluding goodwill, an assessment is made at each reporting date to determine
whether there is an indication that previously recognized impairment losses no longer exist
or have decreased. If such indication exists, the Group estimates the asset’s or CGU’s
recoverable amount. A previously recognized impairment loss is reversed only if there has
been a change in the assumptions used to determine the asset’s recoverable amount since
the last impairment loss was recognized. The reversal is limited so that the carrying amount
of the asset does not exceed its recoverable amount, nor exceed the carrying amount that
would have been determined, net of depreciation, had no impairment loss been recognized
for the asset in prior years. Such reversal is recognized in the statement of profit or loss unless
the asset is carried at a revalued amount, in which case, the reversal is treated as a revaluation
increase.
Goodwill is tested for impairment every semester and when circumstances indicate that the
carrying value may be impaired.
For
per
sona
l use
onl
y
22
Impairment is determined for goodwill by assessing the recoverable amount of each CGU (or
group of CGUs) to which the goodwill relates. When the recoverable amount of the CGU is
less than its carrying amount, an impairment loss is recognized in the statement of profit or
loss. Impairment losses relating to goodwill cannot be reversed in future periods.
Intangible assets with indefinite useful lives are tested for impairment annually at the CGU
level, as appropriate, and when circumstances indicate that the carrying value may be
impaired.
(o) Issued equity
Ordinary shares are classified as equity. Incremental costs directly attributable to the issue of
new shares or options are shown in equity as a deduction, net of tax, from the proceeds.
(p) Earnings per share
Basic earnings per share is calculated as net profit attributable to members of the Parent,
adjusted to exclude any costs of servicing equity (other than dividends), divided by the
weighted average number of ordinary shares, adjusted for any bonus element.
Diluted earnings per share adjusts the figures used in the determination of basic earnings per
share to take into account the weighted average number of shares assumed to have been
issued for no consideration in relation to dilutive potential ordinary shares.
(q) Comparative Figures
When required by Accounting Standards, comparative figures have been adjusted to conform
to changes in presentation for the current financial year.
(r) Going concern basis of accounting
In preparing the financial report, the Directors have made an assessment of the ability of the Group to continue as a going concern. The Group incurred a loss for the year of $8,047,839 and generated a cash outflow of $7,687,097 from operating activities. The Group remains in the development phase of operations. In considering their position, the Directors have had regard to the current cash reserves, the level of forecast cash expenditure and the additional capital raised subsequent to reporting date. The Directors have concluded there are reasonable grounds to believe the Company is a going concern and will be able to continue to pay its debts as and when they become due and payable.
(s) Business combination The Group applies the acquisition method in accounting for business combinations. The
consideration transferred by the Group to obtain control of a subsidiary is calculated as the
For
per
sona
l use
onl
y

23
sum of the acquisition-date fair values of assets transferred, liabilities incurred and the equity
interests issued by the Group, which includes the fair value of any asset or liability arising
from a contingent consideration arrangement. Acquisition costs are expensed as incurred.
The Group recognizes identifiable assets acquired and liabilities assumed in a business
combination regardless of whether they have been previously recognized in the acquiree’s
financial statements prior to the acquisition. Assets acquired and liabilities assumed are
generally measured at their acquisition-date fair values.
Goodwill is stated after separate recognition of identifiable intangible assets. It is calculated
as the excess of the sum of: (a) fair value of consideration transferred, (b) the recognized
amount of any non-controlling interest in the acquire, and (c) acquisition-date fair value of
any existing equity interest in the acquiree, over the acquisition-date fair values of identifiable
net assets. If the fair values of identifiable net assets exceed the sum calculated above, the
excess amount (i.e. gain on a bargain purchase) is recognized in profit or loss immediately.
(t) Critical Accounting Estimates and Judgments
The Directors evaluate estimates and judgments incorporated into the financial statements
based on historical knowledge and best available current information. Estimates assume a
reasonable expectation of future events and are based on current trends and economic data,
obtained both externally and within the Group.
Key estimates Impairment
The Group assesses impairment at the end of each reporting period by evaluating conditions
and events specific to the Company that may be indicative of impairment triggers.
Recoverable amounts of relevant assets are reassessed using value-in-use calculations that
incorporate various key assumptions including growth and discount rates figures.
2. Operating Segments
The Group has identified its operating segments based on internal reports that are reviewed
and used by the Board of Directors in assessing performance and determining the allocation
of resources.
The Group has two (2) operating segments: Europe and Asia. In identifying its operating
segments, management generally follows the Group’s office territories. Both operating
segments develop and market mobile app games.
Europe segment consists of TicBits Oy’s activities. TicBits was acquired on 4 July 2016 (see
note 4). TicBits has its own management team, it engages in business activities from which it
may earn revenue and incur expenses, its operating results are reviewed by the Company
management to make decisions and its discrete financial information is available.
For
per
sona
l use
onl
y

24
Asia segment consists of Animoca Brands Limited’s activities. Animoca Brands Limited is the
historical operating entity of the Company.
Each of these operating segments is managed separately as each of these segments requires
different technologies and resources as well as marketing strategies. All inter-segment
transfers are carried out at arm’s length prices.
The measurement policies the Group uses for segment reporting under AASB 8 are the same
as those used in its financial statements, except that:
• gains from movement in fair value of performance shares are not included in arriving
at the operating profit of the operating segments.
• corporate assets which are not directly attributable to the business activities of any
operating segment are not allocated to a segment. In the financial year under review,
this primarily applies to the Group’s headquarters’ assets.
Segment information before consolidation elimination for the reporting period is as follows:
Europe 31 December
2017
Asia 31 December
2017
Total 31 December
2017
Revenue:
From external customers 835,664 5,652,895 6,488,559
From other segments 930,387 - 930,387
Segment revenues 1,766,051 5,652,895 7,418,946
Segment operating profit/(loss) 718,095 (8,765,934) (8,047,839)
Segment assets 168,698 3,986,443 4,155,141
Segment liabilities (123,724) (3,565,482) (3,689,206)
Europe 31 December
2016
Asia 31 December
2016
Total 31 December
2016
Revenue:
From external customers 153,127 8,544,506 8,697,633
From other segments 688,854 - 688,854
Segment revenues 841,981 8,544,506 9,386,487
Segment operating profit/(loss) 308,015 (8,233,281) (7,925,266)
Segment assets 608,846 5,573,764 6,182,610
Segment liabilities (74,312) (2,806,446) (2,880,758)
For
per
sona
l use
onl
y

25
The total presented for the Group’s operating segments reconcile to the key financial figures as presented in its financial statements as follows:
31 December
2017 31 December
2016
Revenue:
Total reportable segment revenues 7,418,946 9,386,487
From other segments (930,387) (688,854)
Gross revenues 6,488,559 8,697,633
Profit/(loss):
Total reportable segment operating loss (7,641,040) (7,713,745)
Other income not allocated - 515,872
Other expenses not allocated (406,799) (473,402)
Elimination of intersegment profits - (250,438)
Group operating loss (8,047,839) (7,921,713)
Finance costs - (3,553)
Group profit before tax (8,047,839) (7,925,266)
Customers
The Groups has no individual customer concentration risk. The underlying users are located
mainly throughout the Asia Pacific and European regions.
The Group distributes its games globally on platforms including the Apple’s App store,
Google’s Google Play and Amazon’s Amazon Underground, amongst others.
3. Information about Subsidiaries
The consolidated financial statements of Animoca Brands Limited include:
Name Principal Activities
Country of incorporation
% Equity interest
31 December 2017
31 December 2016
Animoca Brands Corporation
Mobile app game maker
British Virgin Islands
100% 100%
Animoca Brands Ltd
Mobile app game maker
Hong Kong 100% 100%
TicBits Oy Mobile app game maker
Finland 100% 100%
Crowd Education Ltd
Mobile app game maker
Hong Kong 100% -
Parent of the Group
The parent entity of the Group is Animoca Brands Corporation Ltd (the “Parent”) and is based
and listed in Australia.
For
per
sona
l use
onl
y
26
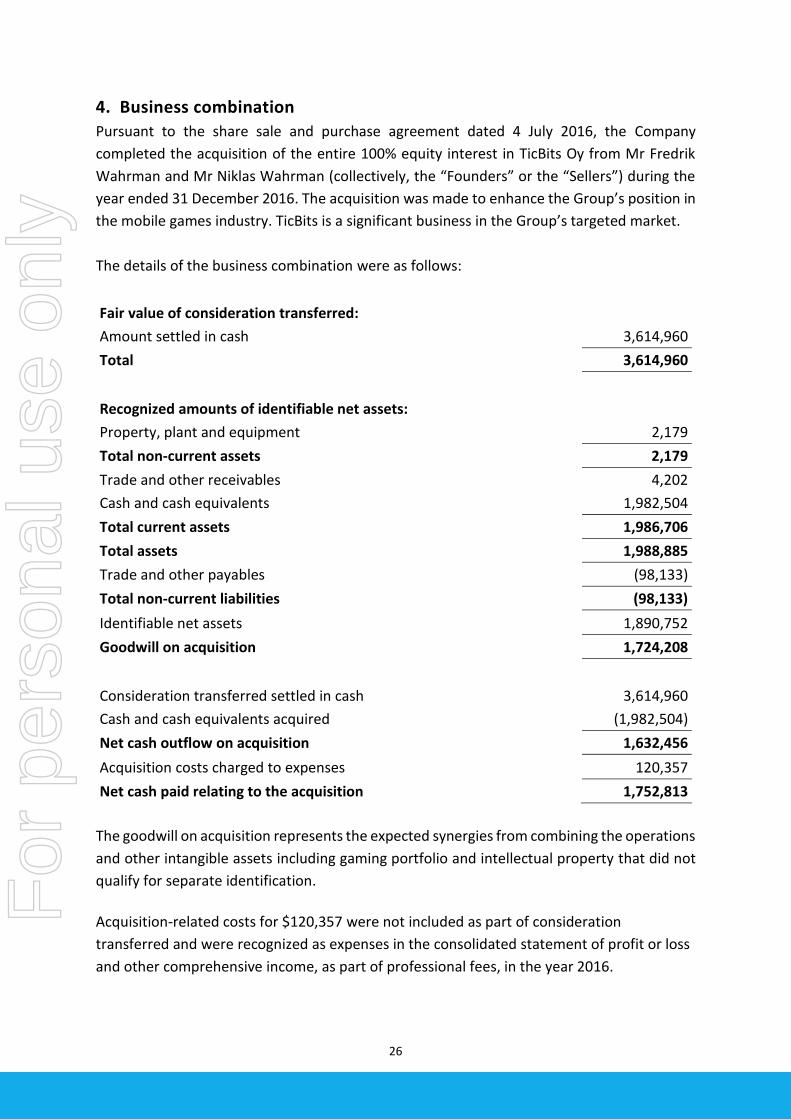
4. Business combination
Pursuant to the share sale and purchase agreement dated 4 July 2016, the Company
completed the acquisition of the entire 100% equity interest in TicBits Oy from Mr Fredrik
Wahrman and Mr Niklas Wahrman (collectively, the “Founders” or the “Sellers”) during the
year ended 31 December 2016. The acquisition was made to enhance the Group’s position in
the mobile games industry. TicBits is a significant business in the Group’s targeted market.
The details of the business combination were as follows:
Fair value of consideration transferred:
Amount settled in cash 3,614,960
Total 3,614,960
Recognized amounts of identifiable net assets:
Property, plant and equipment 2,179
Total non-current assets 2,179
Trade and other receivables 4,202
Cash and cash equivalents 1,982,504
Total current assets 1,986,706
Total assets 1,988,885
Trade and other payables (98,133)
Total non-current liabilities (98,133)
Identifiable net assets 1,890,752
Goodwill on acquisition 1,724,208
Consideration transferred settled in cash 3,614,960
Cash and cash equivalents acquired (1,982,504)
Net cash outflow on acquisition 1,632,456
Acquisition costs charged to expenses 120,357
Net cash paid relating to the acquisition 1,752,813
The goodwill on acquisition represents the expected synergies from combining the operations
and other intangible assets including gaming portfolio and intellectual property that did not
qualify for separate identification.
Acquisition-related costs for $120,357 were not included as part of consideration
transferred and were recognized as expenses in the consolidated statement of profit or loss
and other comprehensive income, as part of professional fees, in the year 2016.
For
per
sona
l use
onl
y

27
TicBits realised a profit of $308,015 for the period from 5 July 2016 to the reporting date. If
TicBits had been acquired on 1 January 2016, revenue of the Group for 2016 would have
been $9.5million, and profit for the 2016 year would have increased by $366,897.
Consideration transferred
The acquisition of TicBits was satisfied by:
• a cash payment of $3,614,960 (EUR2,350,000) which was paid during the year ended 31 December 2016;
• Earn Out Payments; and
• Milestone Payments
The Earn Out Payments and Milestone Payments are contingent consideration arrangements (collectively, the “Contingent Consideration Arrangements”) and are detailed as follows:
• Earn Out Payments Based on the Agreement, the Company is required to pay the Sellers the following payments
upon TicBits reaching the following performance targets (the “Earn Out Payments” and each
an “Earn Out Payment”):
a. if TicBits has achieved net profit after tax of not less than EUR600,000 for the year
ended 31 December 2016, then each Seller shall be entitled to a payment of
EUR165,000;
b. if TicBits has achieved net profit after tax of not less than EUR700,000 for the year
ended 31 December 2017, then each Seller shall be entitled to a payment of
EUR165,000;
c. if TicBits has achieved net profit after tax of not less than EUR800,000 for the year
ended 31 December 2018, then each Seller shall be entitled to a payment of
EUR170,000;
d. if TicBits has achieved a net profit after tax of not less than EUR3,000,000 in any
year ended 31 December 2016, 2017 or 2018, then each Seller shall be entitled to a
payment in the amount of EUR250,000 for each such year where such minimum Net
Income level is achieved in addition to and on top of all the payment amounts stated
in the items (a) to (c) above.
In relation to the financial years 2016 and 2017, if TicBits does not achieve the performance
target set out in (a) or (b) above in any of these financial years (the “Shortfall Year”), the
relevant short fall amount (the “Shortfall”) may be carried forward to the following financial
year; and in the following year, if TicBits achieves a net profit after tax exceeding the
aggregate of (i) the Shortfall and (ii) the relevant net profit after tax required for the Earn Out
For
per
sona
l use
onl
y

28
Payment to be payable for that year, then the Sellers shall be entitled to the Earn Out Payment
for the year which TicBits has achieved the relevant performance target as well as the Earn
Out Payment for the Shortfall Year.
The Company has no obligation to pay any Earn Out Payment to a Seller if: (i) TicBits fails to
achieve the relevant performance target as set out above and the Shortfall is not achieved
before 31 December 2018; or (ii) the Seller ceased to be employed or engaged by TicBits as a
bad leaver at any time prior to 31 December 2018.
The Company may settle the Earn Out Payment either (i) by way of cash payment or (ii)
(subject to the Company obtaining any necessary shareholder approval and/or other
regulatory consents) by way of procuring the Company to issue such number of immediately
transferrable publically tradeable shares of the Company to the Sellers with an aggregate
value equals to the relevant Earn Out Payment.
As at 31 December 2017, no provision for Earn Out Payments have been provided as the
Directors have determined that the performance target in relation to the criteria for 2017
was not met.
• Milestone Payments Based on the Agreement, the Company is required to pay the Sellers the following payments
upon TicBits reaching the following performance targets (together the “Milestone Payments”
and each an “Milestone Payment”):
a. if TicBits publishes one new game (such game being initiated and developed by TicBits) on or before 31 December 2018, then each Seller shall be entitled to a payment in the amount of EUR250,000; and b. if TicBits publishes two or more new games (such games being initiated and developed by TicBits) on or before 31 December 2018, in addition to the payment under the preceding paragraph, each Seller shall be entitled to an additional payment in the amount of EUR250,000. The Company has no obligation to pay any Milestone Payment to a Seller if: (i) TicBits fails to
achieve the relevant performance target as set out above; or (ii) the Seller ceased to be
employed or engaged by TicBits as a bad leaver at any time prior to 31 December 2018.
The Company may settle the Milestone Payment either (i) by way of cash payment or (ii)
(subject to the Company obtaining any necessary shareholder approval and/or other
regulatory consents) by way of procuring the Company to issue such number of immediately
transferrable publicly tradeable shares of the Company to the Sellers with an aggregate value
equals to the relevant Milestone Payment.
For
per
sona
l use
onl
y
29
As at 31 December 2017, the Directors are of the view that it is probable that TicBits will be
able to publish two or more new games on or before 31 December 2018. Accordingly, the
Company recognized an expense of $597,106 for the year ended 31 December 2017 in
relation to the Milestone Payments, with a corresponding adjustment to other financial
liabilities shown under the statement of financial position.
Accounting for the cash consideration and the Contingent Consideration Arrangements
The cash consideration is recognized as part of the investment cost of the acquisition of the
subsidiary. For the Contingent Consideration Arrangements included in the business
combination i.e. Earn Out Payments and Milestone Payments, these are treated as cash-
settled share-based payment transactions as the payments are for post-combination
employee services and they are automatically forfeited on termination of employment on or
before 31 December 2018.
During the year ended 31 December 2017 and as at the end of the reporting period, no Earn
Out Payment or Milestone Payment were paid or payable to the Sellers as the required
performance targets were not met for the financial year.
5. Financial assets and financial liabilities
5.1 Fair value
AASB 7 Financial Instruments ‐ Disclosures requires disclosure of fair value measurements by
level of the following fair value measurement hierarchy:
(a) quoted prices (unadjusted) in active markets for identical assets or liabilities (level 1), and
(b) inputs other than quoted prices included within level 1 that are observable for the asset
or liability, either directly or indirectly (level 2), and
(c) inputs for the asset or liability that are not based on observable market data (unobservable
inputs) (level 3).
All financial instruments were valued using these valuation techniques. There were no
changes in valuation techniques for financial instruments in the year.
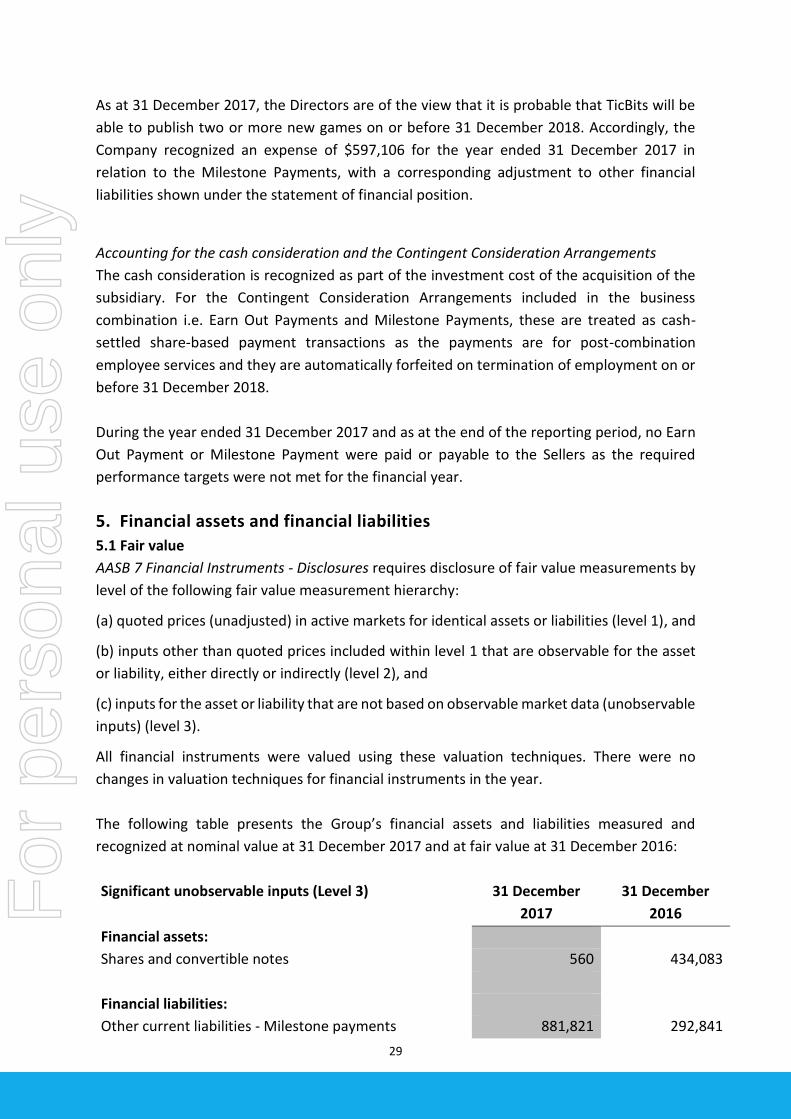
The following table presents the Group’s financial assets and liabilities measured and
recognized at nominal value at 31 December 2017 and at fair value at 31 December 2016:
Significant unobservable inputs (Level 3) 31 December
2017
31 December
2016
Financial assets:
Shares and convertible notes 560 434,083
Financial liabilities:
Other current liabilities - Milestone payments 881,821 292,841
For
per
sona
l use
onl
y

30
Financial assets represent shares and convertible notes in unlisted private companies.
The milestone liability reflects the probability of making additional payments to the former
shareholders of Ticbits OY – refer note 4.
5.2 Financial risk management objectives and policies
The Group’s principal financial liabilities comprise of trade and other payables. The main
purpose of these financial liabilities is to finance the Group’s operations and to support its
operations. The Group’s principal financial assets include trade and other receivables and
cash and short-term deposits that are derived directly from its operations.
The Group is not exposed materially to market risk, credit risk or liquidity risk. The Board takes
ultimate responsibility for managing the financial risks of the Group.
Foreign exchange
Foreign currency risk is the risk that the fair value or future cash flows of an exposure will
fluctuate because of changes in foreign exchange rates. The Group’s exposure to the risk of
changes in foreign exchange rates relates primarily to the Group’s operating activities (when
revenue or expense is denominated in a foreign currency) and the Group’s net investments
in foreign subsidiaries.
The carrying amount of the consolidated entity’s foreign currency denominated financial
assets and financial liabilities before consolidation elimination at the reporting date was as
follows:
Assets Liabilities
US Dollars 4,934,110 18,514,154 Euro 1,567,764 80,792
Trade receivables
The Group has and will have in future financial periods trade receivables due from the App
Store (owned by Apple Inc.) and the Google Play Store (owned by Google Inc.) in relation to
in app purchases in game apps. In this respect, the Group does have a concentration of
receivables with these counterparties. Given the credit worthiness of these parties however,
the Group believes it is not exposed to material to credit risk in relation to receivables.
Capital risk management
The Group manages its capital to ensure that it will be able to continue as a going concern
while maximizing the return to stakeholders.
The capital structure of the Group consists of cash and cash equivalents and equity
attributable to equity holders of the Parent, comprising issued capital, reserves and
accumulated losses as disclosed in notes 23 and 24.
Proceeds from share issues are used to fund the Group’s development and marketing of its
mobile game app portfolio.
For
per
sona
l use
onl
y

31
6. Revenue from Operating Activities
31 December
2017
31 December
2016
In App Purchases revenue 2,821,349 4,266,448
App Advertising revenue 1,629,613 2,516,775
Service revenue 2,037,597 1,914,410
Revenue from operating activities 6,488,559 8,697,633
7. Gain on sale of mobile application games
31 December
2017
31 December
2016
Sale of games 1,554,713 -
Element of TicBits goodwill attributed to sale (458,639) -
Gain on sale of mobile application games 1,096,074 -
The Company sold 14 games to Maple Media. The company received $1,554,713 as partial
consideration of the sale and will receive deferred payments of up to a maximum of $2.2m payable
in 2018 and 2019, subject to revenue hurdles.
13 of the 14 games sold were games acquired following the acquisition of TicBits Oy in 2016. The
acquisition of TicBits Oy resulted in the recognition of goodwill on acquisition. The sale of the
games to Maple Media incurred an element of $458,639 of the goodwill generated on the 2016
acquisition of TicBits Oy.
8. Employee benefits expense 31 December
2017
31 December
2016
Wages, salaries and other remuneration expenses 1,499,206 1,875,044
Provision for milestone payments 597,106 284,715
Retirement benefit expense 126,554 43,406
Other employment costs 159,627 121,663
Employee benefits expense 2,382,493 2,324,828
As at 31 December 2017, the Directors are of the view that it is probable that TicBits will be able
to publish two or more new games on or before 31 December 2018. Accordingly, the Company
recognized an expense of $597,106 for the year ended 31 December 2017 (2016 - $284,715) in
relation to the Milestone Payments.
For
per
sona
l use
onl
y

32
9. Research and Development Expenses
31 December
2017
31 December
2016
Research and development expenses 4,866,177 4,854,743
Research and development expenses 4,866,177 4,854,743
Research and development expenses include amounts expenses that did meet the
recognition criteria to be recognized as an asset at their first reporting.
10. Doubtful Debts Expense
31 December
2017
31 December
2016
Doubtful debts expense 1,409,479 587,341
Recovery of bad debt from 2016 (554,200)
Doubtful debts expense 855,279 587,341
As at 31 December 2017, the Company has determined trade receivables of $1,409,479 as
individually impaired (2016: $587,341). Based on this assessment, an impairment loss of
$1,409,479 has been recognized (2016: $587,341). Refer to note 14.
At each reporting date, the Company reviews receivables for evidence of impairment on both
an individual and collective basis. As at 31 December 2016, the Company has determined
trade receivables of $587,341 (US$425,000) as individually impaired. The impaired trade
receivable was collected in 2017 for $554,200.
11. Other expenses
31 December
2017
31 December
2016
Share registry 48,639 52,004
Travel 183,144 228,873
Insurance 194,174 123,775
Professional fees 559,526 696,745
Withholding Tax Expense 43,182 136,718
Other expenses 266,290 625,471
Other expenses 1,294,955 1,863,586
For
per
sona
l use
onl
y

33
12. Income Tax
31 December
2017
31 December
2016
Accounting (loss) before income tax (8,047,839) (7,925,266)
At Australia’s statutory income tax rate of 30% (2016:
30%)
(2,414,351)
(2,377,580)
Adjust for the tax effect of:
Tax rate differences – Hong Kong 1,086,458 1,069,911
Un-recognized tax assets 1,327,893 1,307,669
Income tax (benefit) - -
As at 31 December 2017, Animoca Brands Ltd (Hong Kong) had estimated unused tax losses
of approximately US$17,237,000 (2016: US$9,189,000), which the Group anticipates may be
able to be offset against future taxable income by the Group. The Parent entity’s tax losses
are not presented as they likely will be forgone due to failing the relevant loss tests in
accordance with Australian Taxation legislation. No deferred tax asset has been recognized in
respect of these unused tax losses due to the unpredictability of future profit stream. These
tax losses do not expire under the current Hong Kong legislation.
13. Cash and cash equivalents
31 December
2017
31 December
2016
Cash in bank and on hand 534,373 1,381,401
Short term deposit 153,139 145,518
Cash and cash equivalents 687,512 1,526,919
Reconciliation of net loss after tax to net cash flows
from operations
31 December
2017
31 December
2016
Accounting loss after income tax (8,047,840) (7,925,266)
Adjustments for:
Non-operating activities:
Net profit on sale of games (1,096,074) -
Non-cash items:
Depreciation of plant and equipment 46,008 30,789
Provision for Milestone Payment 588,980 292,841
Doubtful Debts expense 1,409,479 587,341
Foreign currency losses 454,392 232,799
For
per
sona
l use
onl
y

34
Fair value gain – performance shares - (506,250)
Changes in assets and liabilities:
Increase in trade payables and accruals 140,598 (432,597)
Increase in provisions 78,871 79,933
(Increase) in receivables (820,997) (382,642)
(Increase) in prepayments and deposits (440,514) (115,945)
Net cash (used in) operating activities (7,687,097) (8,138,997)
14. Trade and Other Receivables
31 December
2017
31 December
2016
Trade Receivables from third parties 2,787,677 2,330,473
Less: Provision for impairment of receivables (1,409,479) (587,341)
GST Receivable - (3,362)
Related party receivables1 230,235 457,235
Trade and other receivables 1,608,433 2,197,005
1. Related party receivables are non-interest bearing and are normally settled on 30-60 day
terms. Refer to note 26 for details of these transactions.
At each reporting date, the Company reviews receivables for evidence of impairment on both
an individual and collective basis. As at 31 December 2017, the Company has determined
trade receivables of $1,409,479 as impaired (2016: $587,341). Based on this assessment, an
impairment loss of $1,409,479 has been recognized (2016: $587,341). The impaired trade
receivables were from three major customers. The Company will continue to pursue its
collection process during 2018.
Trade receivables that were past due but not impaired are related to a number of customers
that had a good history of credit with the Company. All trade receivables not impaired are
less than 60 days old except $102,568 from one customer. Based on past credit history,
management believe that no impairment allowance is necessary in respect of these balances
as there has not been a significant change in credit quality and the balances are still
considered to be fully recoverable. The Company does not hold any collateral in respect of
trade receivables past due but not impaired.
For
per
sona
l use
onl
y

35
15. Financial assets
31 December
2017
31 December
2016
Unlisted convertible loan designated at fair value
through profit and loss statement - 345,495
Unlisted equity securities designated at fair value
through profit and loss statement - 88,588
Unlisted equity securities designated at nominal value 560 -
Financial assets 560 434,083
During the year ended 31 December 2015, the Company acquired an unlisted convertible loan with a principal amount of US$150,000 issued by TinyTap Ltd (“TinyTap”) from Moonblink Limited, a company which is owned and controlled by Mr Siu. The consideration paid for the Convertible loan was US$150,000. During the year ended 31 December 2016, the Company has subscribed an unlisted convertible loan with a principal amount of US$100,000 issued by TinyTap with the same terms as the unlisted convertible loan acquired from Moonblink Limited in 2015. As at 31 December 2016, the Company has an aggregate of unlisted convertible loans with principal amounts of US$250,000 in total issued by TinyTap (2015: US$150,000). During the year ended 31 December 2017, the Company has subscribed an additional unlisted convertible loan with a principal amount of US$150,000 issued by TinyTap with the same terms as the unlisted convertible loan acquired from Moonblink Limited in 2015. This loan and the loans subscribed in the previous years added for the Company to have an aggregate of unlisted convertible loans with principal amounts of US$400,000 in total issued by TinyTap at the maturity of the loan on 27 May 2017. At this date, the Convertible Loan converted to 100,500 Series A-1 Preferred shares of NIS 0.01 each and interest on the convertible loan were waived according to the initial agreement. 31 December
2017
31 December
2016
At the beginning of the year 345,495 205,310
Purchased during the year 192,315 140,185
Converted during the year (537,810) -
Unlisted convertible loan designated at fair value
through profit and loss statement - 345,495
For
per
sona
l use
onl
y
36
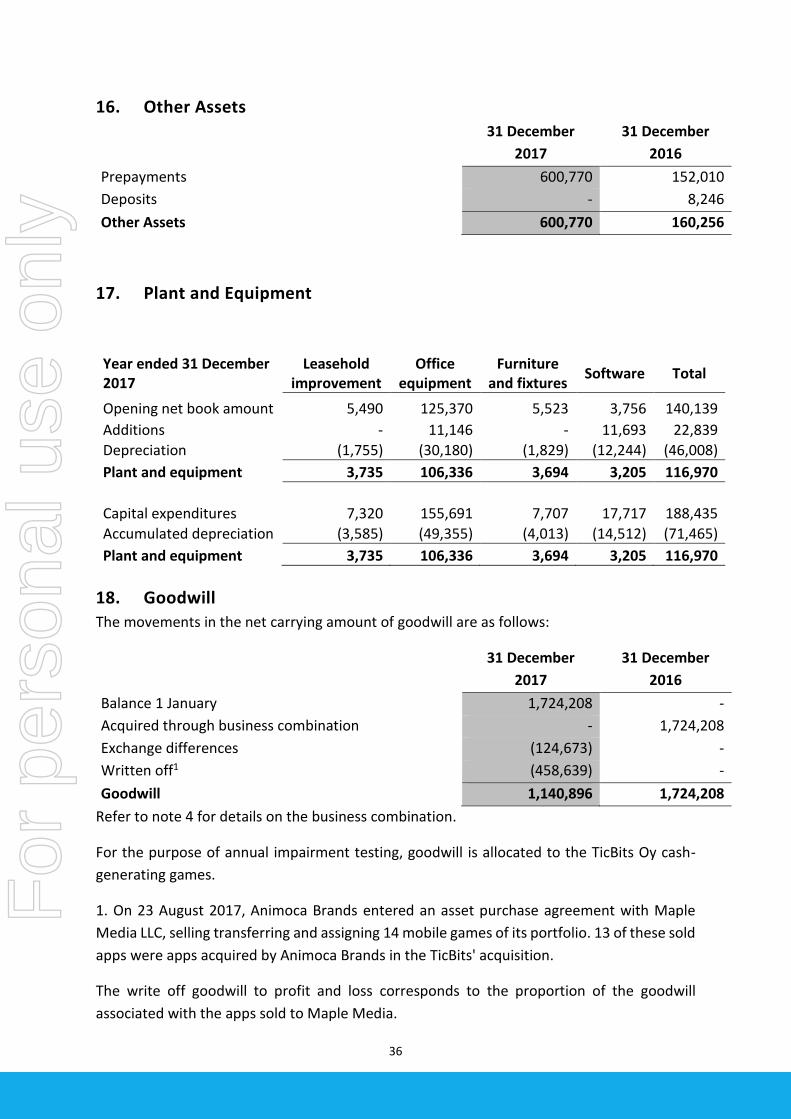
16. Other Assets
31 December
2017
31 December
2016
Prepayments 600,770 152,010
Deposits - 8,246
Other Assets 600,770 160,256
17. Plant and Equipment
Year ended 31 December 2017
Leasehold improvement
Office equipment
Furniture and fixtures
Software Total
Opening net book amount 5,490 125,370 5,523 3,756 140,139
Additions - 11,146 - 11,693 22,839
Depreciation (1,755) (30,180) (1,829) (12,244) (46,008)
Plant and equipment 3,735 106,336 3,694 3,205 116,970
Capital expenditures 7,320 155,691 7,707 17,717 188,435
Accumulated depreciation (3,585) (49,355) (4,013) (14,512) (71,465)
Plant and equipment 3,735 106,336 3,694 3,205 116,970
18. Goodwill
The movements in the net carrying amount of goodwill are as follows:
31 December
2017
31 December
2016
Balance 1 January 1,724,208 -
Acquired through business combination - 1,724,208
Exchange differences (124,673) -
Written off1 (458,639) -
Goodwill 1,140,896 1,724,208
Refer to note 4 for details on the business combination.
For the purpose of annual impairment testing, goodwill is allocated to the TicBits Oy cash-
generating games.
1. On 23 August 2017, Animoca Brands entered an asset purchase agreement with Maple
Media LLC, selling transferring and assigning 14 mobile games of its portfolio. 13 of these sold
apps were apps acquired by Animoca Brands in the TicBits' acquisition.
The write off goodwill to profit and loss corresponds to the proportion of the goodwill
associated with the apps sold to Maple Media.
For
per
sona
l use
onl
y
37
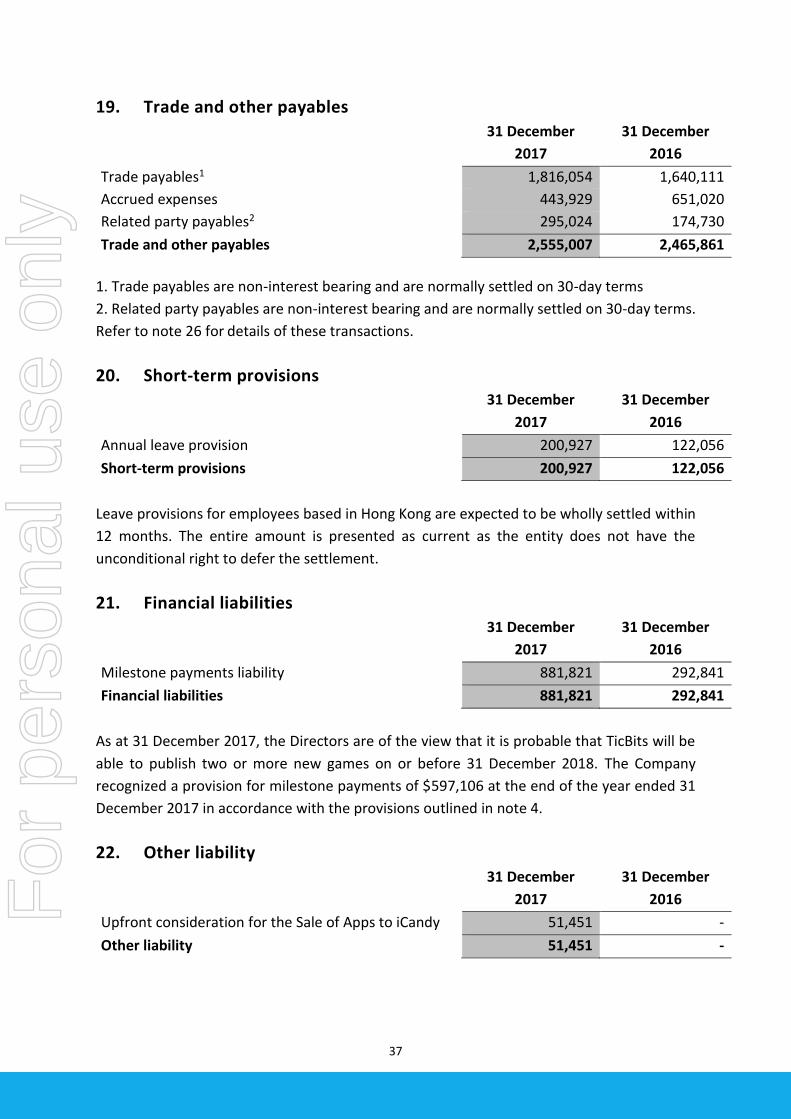
19. Trade and other payables
31 December
2017
31 December
2016
Trade payables1 1,816,054 1,640,111
Accrued expenses 443,929 651,020
Related party payables2 295,024 174,730
Trade and other payables 2,555,007 2,465,861
1. Trade payables are non-interest bearing and are normally settled on 30-day terms
2. Related party payables are non-interest bearing and are normally settled on 30-day terms.
Refer to note 26 for details of these transactions.
20. Short-term provisions 31 December
2017
31 December
2016
Annual leave provision 200,927 122,056
Short-term provisions 200,927 122,056
Leave provisions for employees based in Hong Kong are expected to be wholly settled within
12 months. The entire amount is presented as current as the entity does not have the
unconditional right to defer the settlement.
21. Financial liabilities
31 December
2017
31 December
2016
Milestone payments liability 881,821 292,841
Financial liabilities 881,821 292,841
As at 31 December 2017, the Directors are of the view that it is probable that TicBits will be
able to publish two or more new games on or before 31 December 2018. The Company
recognized a provision for milestone payments of $597,106 at the end of the year ended 31
December 2017 in accordance with the provisions outlined in note 4.
22. Other liability
31 December
2017
31 December
2016
Upfront consideration for the Sale of Apps to iCandy 51,451 -
Other liability 51,451 -
For
per
sona
l use
onl
y
38
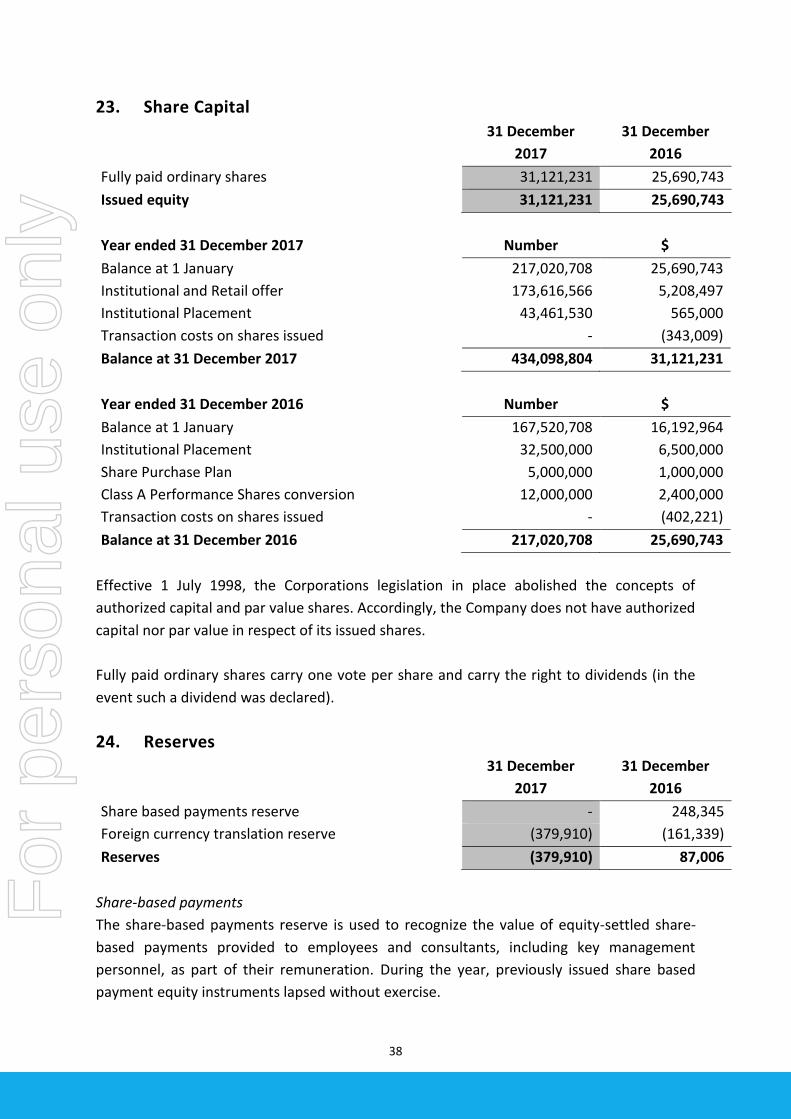
23. Share Capital
31 December
2017
31 December
2016
Fully paid ordinary shares 31,121,231 25,690,743
Issued equity 31,121,231 25,690,743
Year ended 31 December 2017 Number $
Balance at 1 January 217,020,708 25,690,743
Institutional and Retail offer 173,616,566 5,208,497
Institutional Placement 43,461,530 565,000
Transaction costs on shares issued - (343,009)
Balance at 31 December 2017 434,098,804 31,121,231
Year ended 31 December 2016 Number $
Balance at 1 January 167,520,708 16,192,964
Institutional Placement 32,500,000 6,500,000
Share Purchase Plan 5,000,000 1,000,000
Class A Performance Shares conversion 12,000,000 2,400,000
Transaction costs on shares issued - (402,221)
Balance at 31 December 2016 217,020,708 25,690,743
Effective 1 July 1998, the Corporations legislation in place abolished the concepts of
authorized capital and par value shares. Accordingly, the Company does not have authorized
capital nor par value in respect of its issued shares.
Fully paid ordinary shares carry one vote per share and carry the right to dividends (in the
event such a dividend was declared).
24. Reserves
31 December
2017
31 December
2016
Share based payments reserve - 248,345
Foreign currency translation reserve (379,910) (161,339)
Reserves (379,910) 87,006
Share-based payments
The share-based payments reserve is used to recognize the value of equity-settled share-
based payments provided to employees and consultants, including key management
personnel, as part of their remuneration. During the year, previously issued share based
payment equity instruments lapsed without exercise.
For
per
sona
l use
onl
y

39
Foreign currency translation reserve
The foreign currency translation reserve comprises all foreign currency differences arising
from the translation of the financial statements of subsidiaries of Animoca Brands
Corporation Ltd that have a different functional currency than Australian Dollars.
25. Share Based Payments No share based payment was issued in the year ended 31 December 2017. The options were
not exercised on or before 23 January 2018 and hence expired.
26. Related Party Disclosures
Remuneration of Key Management Personnel 31 December
2017
31 December
2016
Short-term employee benefits 231,273 698,293
Share based payments - -
Termination benefits - -
Post-employment benefits 5,660 10,365
Remuneration of Key Management Personnel 236,933 708,658
On 1 August 2014, the Company entered an Office Services and Management Services Agreement with Outblaze Limited, a company in which Mr Siu is a director. This agreement procures that Outblaze Limited provides office services including:
• use of computer workstations, information system, furniture, fixtures, fittings, office equipment and pantry supplies provided at the Premises;
• use of telephones, fax machines, broadband internet connection, photocopiers and printers at the Premises;
• arrangements for reception, pantry and conference rooms for Client’s staff and visitors; and
• other office facilities, amenities, convenience and services as Provider at its discretion considers necessary to provide to Client for its business purposes from time to time.
In consideration of office services, the Company shall pay to Outblaze Limited as and by way of service charges HK$2,300 per workstation per month. During the year ended 31 December 2017, the Company has paid office service fees of $394,099 (2016 - $504,350) to Outblaze Limited pursuant to this agreement. On 1 August 2014, the Company entered a Mobile App Advertising Services Agreement with
Outblaze Ventures Holdings Limited, a wholly owned subsidiary of Appionics Holdings Ltd.
Messrs Kim, Yung and Siu are all directors of Appionics Holdings Ltd. This agreement procures
For
per
sona
l use
onl
y
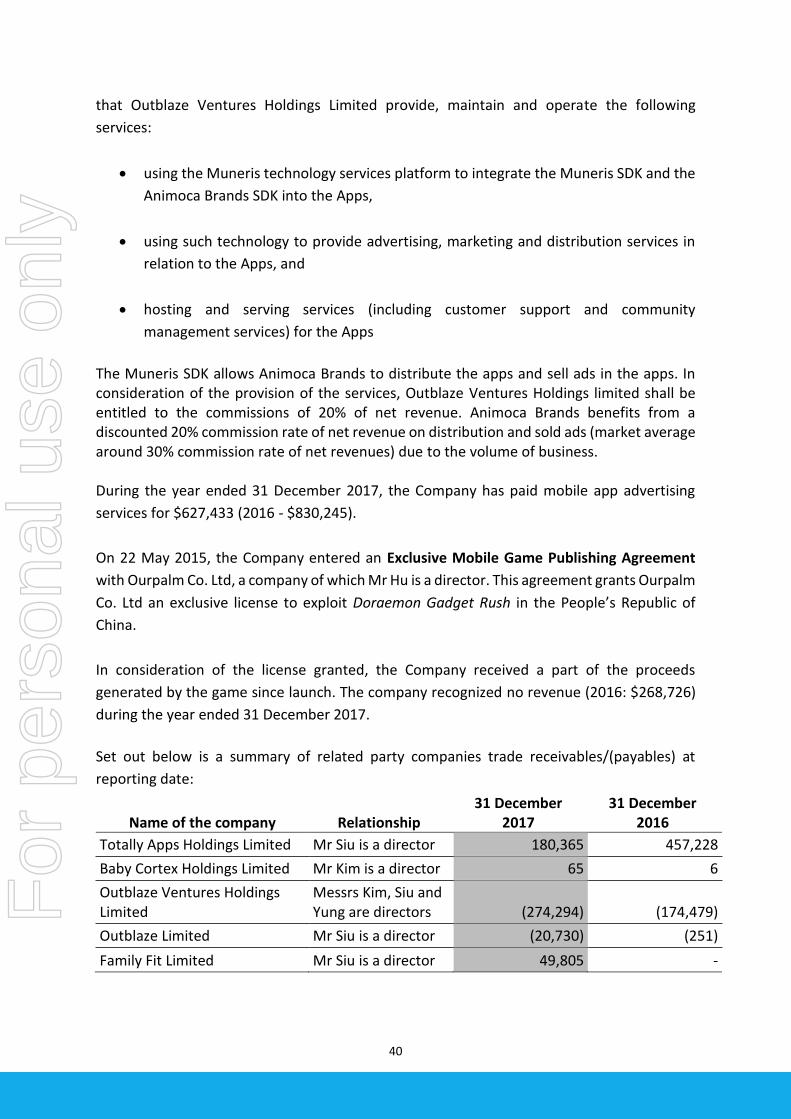
40
that Outblaze Ventures Holdings Limited provide, maintain and operate the following
services:
• using the Muneris technology services platform to integrate the Muneris SDK and the
Animoca Brands SDK into the Apps,
• using such technology to provide advertising, marketing and distribution services in
relation to the Apps, and
• hosting and serving services (including customer support and community
management services) for the Apps
The Muneris SDK allows Animoca Brands to distribute the apps and sell ads in the apps. In consideration of the provision of the services, Outblaze Ventures Holdings limited shall be entitled to the commissions of 20% of net revenue. Animoca Brands benefits from a discounted 20% commission rate of net revenue on distribution and sold ads (market average around 30% commission rate of net revenues) due to the volume of business. During the year ended 31 December 2017, the Company has paid mobile app advertising
services for $627,433 (2016 - $830,245).
On 22 May 2015, the Company entered an Exclusive Mobile Game Publishing Agreement
with Ourpalm Co. Ltd, a company of which Mr Hu is a director. This agreement grants Ourpalm
Co. Ltd an exclusive license to exploit Doraemon Gadget Rush in the People’s Republic of
China.
In consideration of the license granted, the Company received a part of the proceeds
generated by the game since launch. The company recognized no revenue (2016: $268,726)
during the year ended 31 December 2017.
Set out below is a summary of related party companies trade receivables/(payables) at
reporting date:
Name of the company Relationship 31 December
2017 31 December
2016
Totally Apps Holdings Limited Mr Siu is a director 180,365 457,228
Baby Cortex Holdings Limited Mr Kim is a director 65 6
Outblaze Ventures Holdings Limited
Messrs Kim, Siu and Yung are directors (274,294) (174,479)
Outblaze Limited Mr Siu is a director (20,730) (251)
Family Fit Limited Mr Siu is a director 49,805 -
For
per
sona
l use
onl
y

41
In addition to the contracted related party transactions detailed above, receivables and
payables include amounts that are due (receivable) in relation to app revenues collected on
behalf of Animoca Brands and reimbursements of marketing and promotional expenses
(Payables) paid on behalf of the Company.
27. Earnings Per Share Basic earnings per share amounts are calculated by dividing net profit for the year attributable
to ordinary equity holders of the Parent by the weighted average number of ordinary shares
outstanding during the year.
Diluted earnings per share amounts are calculated by dividing the net profit attributable to
ordinary equity holders of the Parent by the weighted average number of ordinary shares
outstanding during the year plus the weighted average number of ordinary shares that would
be issued on the conversion of all the dilutive potential ordinary shares into ordinary shares.
The following reflects the income and share data used in the basic and diluted earnings per
share computations:
31 December
2017
31 December
2016
Net loss attributable to ordinary equity holders of the
Parent entity:
Continuing operation 8,047,839 7,925,266
Weighted average number of ordinary shares for basic
earnings per share 368,484,331 196,535,735
Pursuant to AASB 133 – there is no dilutive securities on issue.
28. Subsequent Events
Post 31 December 2017, the Company launched Crazy Defense Heroes for iOS on 8 January
2018 in Asian territories.
The Company has entered into a binding term sheet to acquire 60% of Fuel Powered for an
upfront consideration of $0.75m. Fuel Powered is a US-based developer of blockchain based
gaming services and provider of a cloud based features-as-a-service platform that
maximises bottom-line results for game publishers through artificial intelligence and
machine learning. Clients of Fuel Powered include SEGA Publishing Europe Limited and
Axiom Zen, the publisher of CryptoKitties.
The Company also entered into an exclusive licensing and distribution agreement with
Axiom Zen to publish CryptoKitties in China. CryptoKitties is the first major video game
based on blockchain technology. CryptoKitties allows players to adopt, raise, and trade
For
per
sona
l use
onl
y

42
virtual cats, and represents one of the earliest attempts to deploy blockchain technology for
recreational purposes.
The Company has also entered into a binding share sale and purchase agreement to acquire
100% of the capital of privately owned Tribeflame Oy (“Tribeflame”) and its subsidiary Benji
Bananas Oy (“Benji Bananas”) for up to €350k ($550k).
In order to address its growth opportunities and operational needs, in January 2018, the
Company raised a total of $3.3m through an oversubscribed placement to sophisticated
investors.
29. Auditors Remuneration
31 December
2017
31 December
2016
Grant Thornton for audit and review services1 128,210 92,710
Other services - -
Total remuneration to auditors 128,210 92,710
1. Grant Thornton Audit Pty Ltd (the Parent entity auditor) utilizes the services of Grant
Thornton Hong Kong for a component of the audit. The amount disclosed includes $62,182
due to Grant Thornton Hong Kong.
30. Parent Entity Information
31 December
2017
31 December
2016
Current assets 697,861 3,551,424
Non-current assets - -
Total assets 697,861 3,551,424
Current liabilities 231,926 249,573
Non-current liabilities - -
Total liabilities 231,926 249,573
Issued capital 31,121,231 25,690,743
Accumulated losses (53,545,072) (45,527,012)
Share option reserve - 248,345
Other components of equity 22,889,776 22,889,776
Total shareholders’ equity 465,935 3,301,852
Profit/(loss) of the Parent entity (406,799) (11,878,868)
Total comprehensive profit/(loss) of the Parent entity (406,799) (11,878,868)
For
per
sona
l use
onl
y

43
The Parent entity has no contingent liability or commitments for expenditure at 31 December
2017. Refer to note 31 for details on contingent liabilities.
31. Commitments
At the reporting date, the total future minimum lease payments payable by the Company
under non-cancellable operating leases in respect of properties is as follows:
31 December
2017
31 December
2016
Commitments <1 year 148,811 376,334
1 year < Commitments < 2 years - 185,610
Total Commitments 148,811 561,944
The Company has leased the office premises in Hong Kong jointly with a related company
under an operating lease. The commitment represents the maximum amount that the
Company is required to pay based on the leased agreement. The lease does not include
contingent rentals.
The Company has leased office premises in Turku, Finland and the commitment represents
the 6 months period rents of the notice period (EUR 3,072/month).
32. Ongoing deal with iCandy
In October 2017, the Company entered a binding term sheet to sell its mobile casual games
portfolio to iCandy Interactive (ASX: ICI), subject to iCandy shareholder approval. Pursuant to the
sale Animoca Brands will sell 318 of its existing 524 mobile game apps to iCandy.
The total sale consideration includes up to $8.0 million in upfront and deferred consideration with
additional upside from earn-out payments. The upfront consideration comprises a $1.0 million
cash payment and $4.0 million payable in iCandy shares, payable within 30 days of the deal closing.
The deferred payments of up to a total $3.0 million are payable in iCandy shares in 2018 and 2019,
subject to revenue hurdles. The earn-out payments allow Animoca Brands to share in the profit of
the games sold for a period of 5 years after closing.
At the end of December 2017, the company had received $51,451 of the upfront consideration.
At the end of February 2018, the company had received a further $198,549 of the upfront
consideration.
The conditions precedents to the sale completion, including the iCandy shareholder approval on
the terms of the transaction, have not been met to date. As a consequence the transaction has not
been recognized at 31 December 2017. There are no asset or liability held for sale in connection
with the proposed transaction in the financial reporting at 31 December 2017.
For
per
sona
l use
onl
y
44
33. Contingent Liabilities
At the date of signing this report, the Company is not aware of any Contingent Asset or
Liability that should be disclosed in accordance with AASB 137.
On 20 December 2016, the Company received a statement of claim for $390,000, interest on
all sums awarded to the plaintiff, costs and any further relief the court deems fit issued by the
District Court of Western Australia by Patersons Securities Limited (“Patersons”). Patersons
was a lead manager engaged under a mandate with respect to a capital raising conducted by
Animoca Brands which was completed on or about 1 December 2015.
Animoca Brands conducted a further capital raising in or around April 2016 with another lead
manager. Patersons is claiming that the mandate obliged Animoca Brands to offer Patersons
the role of lead manager with respect to the capital raising conducted in April 2016.
On 23 May 2017, mediation was conducted. The company and Patersons has reached a
settlement agreement with respect to the matters in dispute.
Net tangible assets per security
Year 31 December 2016 31 December 2017
Net tangible assets per security $0.007 -$0.004
This statement is based on accounts that are in the process of being audited.
For
per
sona
l use
onl
y