for the quarters and nine months ended march 31, 2021 and
TRANSCRIPT

ASCENSION
C ONSOLIDATED I NTERIM F INANCIAL S TATEMENTS AND S UPPLEMENTARY I NFORMATION (U NAUDITED )
For the Quarters and Nine Months Ended March 31, 2021 and 2020

Ascension
Consolidated Interim Financial Statements and Supplementary Information (Unaudited)
For the Quarters and Nine Months Ended March 31, 2021 and 2020
Contents
Consolidated Financial Statements
Consolidated Balance Sheets 3 Consolidated Statements of Operations and Changes in Net Assets 5 Consolidated Statements of Cash Flows 7 Notes to Consolidated Financial Statements 9
Supplementary Information
Schedule of Net Cost of Providing Care of Persons Living in Poverty and Other Community Benefit Programs 46

Ascension
Consolidated Balance Sheets (unaudited) (Dollars in Thousands)
Continued on next page.
3

Ascension
Consolidated Balance Sheets (unaudited) (Dollars in Thousands)
*Consists of variable rate demand bonds with put options that may be exercised at the option of the bondholders, with stated repayment installments through 2047, as well as certain serial mode bonds with scheduled remarketing/mandatory tender dates occurring prior to March 31, 2022. In the event that bonds are not remarketed upon the exercise of put options for the variable bonds or scheduled mandatory tender bonds, management would utilize other sources to access the necessary liquidity. Potential sources include a drawdown on the $600 million lines of credit, issuing commercial paper, and liquidating investments.
The accompanying notes are an integral part of the consolidated financial statements.
4

Ascension
Consolidated Statements of Operations and Changes in Net Assets (unaudited)
(Dollars in Thousands)
Continued on next page.
5

Ascension
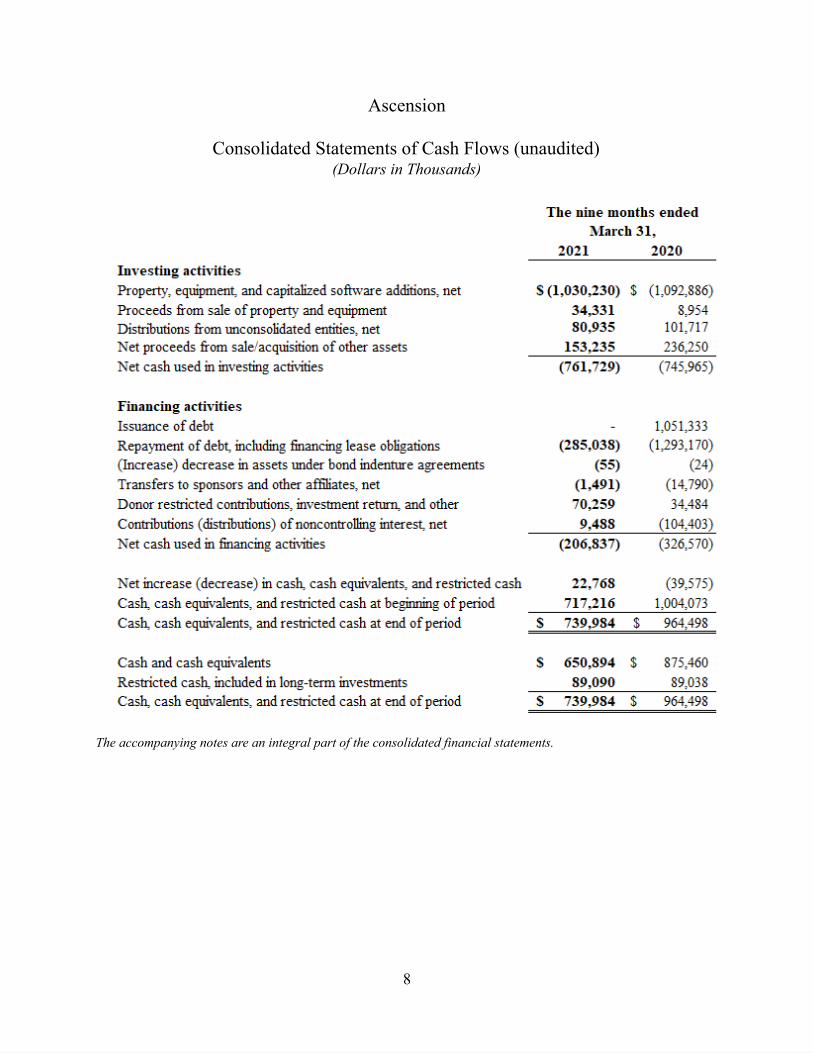
Consolidated Statements of Cash Flows (unaudited) (Dollars in Thousands)
The accompanying notes are an integral part of the consolidated financial statements.
6

Ascension
Consolidated Statements of Cash Flows (unaudited) (Dollars in Thousands)
Continued on next page.
7
Ascension
Consolidated Statements of Cash Flows (unaudited) (Dollars in Thousands)
The accompanying notes are an integral part of the consolidated financial statements.
8

Ascension
Notes to Consolidated Financial Statements (unaudited) (Dollars in Thousands)
1. Organization and Mission
Organizational Structure
Ascension Health Alliance, d/b/a Ascension (Ascension), is a Missouri nonprofit corporation formed on September 13, 2011. Ascension is a Catholic national health system consisting primarily of nonprofit corporations that own and operate local healthcare facilities, or Ministry Markets, located in 19 states and the District of Columbia. Ascension also serves as the direct or indirect member or shareholder of various subsidiaries including, but not limited to:
• Ascension Care Management • AscensionConnect • Ascension Global Mission • Ascension Holdings • Ascension Leadership Academy • Ascension Ministry Service Center • Ascension Technologies • Ascension Capital
o Ascension Investment Management (AIM) o AV Holding Company o Ascension Ventures (AV)
• The Resource Group • Smart Health Solutions
Ascension is also the majority investor in Ascension Alpha Fund, LLC (Alpha Fund) as discussed in the Pooled Investment Fund note. Ascension and its member organizations are hereafter referred to collectively as the System.
Sponsorship
Ascension is sponsored by Ascension Sponsor, a Public Juridic Person. The Participating Entities of Ascension Sponsor are the Daughters of Charity of St. Vincent de Paul, St. Louise Province; the Congregation of St. Joseph; the Congregation of the Sisters of St. Joseph of Carondelet; the Congregation of Alexian Brothers of the Immaculate Conception Province, Inc. – American Province; and the Sisters of the Sorrowful Mother of the Third Order of St. Francis of Assisi – US/Caribbean Province.
9

Ascension
Notes to Consolidated Financial Statements (unaudited) (continued) (Dollars in Thousands)
1. Organization and Mission (continued)
Mission
The System directs its governance and management activities toward strong, vibrant, Catholic Ministries united in service and healing, and dedicates its resources to spiritually centered care which sustains and improves the health of the individuals and communities it serves. In accordance with the System’s mission of service to those persons living in poverty and other vulnerable persons, each Ministry Market accepts patients regardless of their ability to pay. The System uses four categories to identify the resources utilized for the care of persons living in poverty and community benefit programs:
• Traditional charity care includes the cost of services provided to persons who cannot afford healthcare because of inadequate resources and/or who are uninsured or underinsured.
• Unpaid cost of public programs, excluding Medicare, represents the unpaid cost of services provided to persons covered by public programs for persons living in poverty and other vulnerable persons.
• Cost of other programs for persons living in poverty and other persons who are vulnerable.
• Unreimbursed costs of community benefit programs and services for the broader community, not solely for the persons living in poverty, including health promotion and education, health clinics and screenings, and medical research.
Discounts are provided to all uninsured and underinsured patients, including those with the means to pay. Discounts provided to those patients who did not qualify for financial assistance are not included in the cost of providing care of persons living in poverty and other community benefit programs. The cost of providing care to persons living in poverty and other community benefit programs is estimated by reducing charges forgone by a factor derived from the ratio of each entity’s total operating expenses to the entity’s billed charges for patient care. Certain costs such as graduate medical education and certain other activities are excluded from total operating expenses for purposes of this computation.
The amount of traditional charity care provided, determined on the basis of cost, was $369,204 and $546,073 for the nine months ended March 31, 2021 and 2020, respectively. The amount of unpaid cost of public programs, cost of other programs for persons living in poverty and other vulnerable persons, and community benefit cost is reported in the accompanying supplementary information.
10

Ascension
Notes to Consolidated Financial Statements (unaudited) (continued) (Dollars in Thousands)
2. Significant Accounting Policies
Principles of Consolidation
The System consolidates all corporations and other entities for which operating control is exercised by the System or one of its member corporations, and all significant inter-entity transactions have been eliminated in consolidation. Investments in entities where the System does not have operating control are recorded under the equity or cost method of accounting and results of operations are primarily included in other operating revenue.
Use of Estimates
Management has made estimates and assumptions that affect the reported amounts of certain assets, liabilities, revenues, and expenses. Actual results could differ from those estimates.
Fair Value of Financial Instruments
Carrying values of financial instruments classified as current assets and current liabilities approximate fair value. The fair values of financial instruments measured at fair value are disclosed in the Fair Value Measurements note.
New Accounting Standards Adopted
Effective July 1, 2019, the System adopted the FASB ASU 2016-18, Statement of Cash Flows – Restricted Cash , using the full retrospective method of application. The most significant impact of adopting the new standard is to the presentation of the System’s Consolidated Statements of Cash Flows. Changes in cash, cash equivalents, and restricted cash and cash equivalents are presented within the Consolidated Statements of Cash Flows. The prior period Consolidated Statement of Cash Flows presented was adjusted accordingly.
Cash and Cash Equivalents
Cash and cash equivalents consist of cash and interest-bearing deposits with original maturities of three months or less.
Short-Term Investments
Short-term investments consist of investments with original maturities exceeding three months and up to one year.
11

Ascension
Notes to Consolidated Financial Statements (unaudited) (continued) (Dollars in Thousands)
2. Significant Accounting Policies (continued)
Inventories
Inventories, consisting primarily of medical supplies and pharmaceuticals, are stated at the lower of cost or market value using first-in, first-out (FIFO) or a methodology that closely approximates FIFO.
Long-Term Investments and Investment Return
Investments, excluding investments in unconsolidated entities, are measured at fair value, are classified as trading securities, and include pooled short-term investment funds; U.S. government, state, municipal and agency obligations; corporate and foreign fixed income securities; asset-backed securities; and equity securities. Investments also include alternative investments and other investments which are valued based on the net asset value of the investments, as further discussed in the Fair Value Measurements note. As discussed in the Pooled Investment Fund note, the Alpha Fund also holds derivative investments, which are measured at fair value.
Long-term investments include assets limited as to use of $1,505,952 and $1,376,582 at March 31, 2021 and June 30, 2020, respectively, comprised primarily of investments placed in trust and held by captive insurance companies for the payment of self-insured claims. Long-term investments also include donor restricted cash and cash equivalents.
Purchases and sales of investments are accounted for on a trade-date basis. Investment returns consist of dividends, interest, and gains and losses. The cost of substantially all securities sold is based on the FIFO method. Investment returns, excluding returns of self-insurance trust funds, are reported as nonoperating gains (losses) in the Consolidated Statements of Operations and Changes in Net Assets, unless the return is restricted by donor or law. Investment returns of self-insurance trust funds are reported as a separate component of income from operations in the Consolidated Statements of Operations and Changes in Net Assets.
Property and Equipment
Property and equipment are stated at cost or, if donated, at fair market value at the date of the gift. Depreciation is determined on a straight-line basis over the estimated useful lives of the related assets. The range of estimated useful lives used in computing depreciation is as follows: buildings and leasehold improvements, 2 to 40 years; and equipment, 2 to 20 years. Depreciation expense for the three months ended March 31, 2021 and 2020 was approximately $273,000 and $253,000 , respectively. Depreciation expense for the nine months ended March 31, 2021 and 2020 was approximately $820,000 and $771,000 , respectively.
12

Ascension
Notes to Consolidated Financial Statements (unaudited) (continued) (Dollars in Thousands)
2. Significant Accounting Policies (continued)
A summary of property and equipment is as follows:
Several capital projects have remaining construction and related equipment purchase commitments of approximatel y $539,000 as of March 31, 2021.
Intangible Assets
Intangible assets primarily consist of goodwill and capitalized computer software costs, including internally developed software. Costs incurred in the development and installation of internal use software are expensed or capitalized depending on whether they are incurred in the preliminary project stage, application development stage, or post-implementation stage, and the nature of the costs. Intangible assets are included in the Consolidated Balance Sheets as presented in the table that follows.
13

Ascension
Notes to Consolidated Financial Statements (unaudited) (continued) (Dollars in Thousands)
2. Significant Accounting Policies (continued)
Capitalized software costs in the following table include software in progress of $97,580 and $101,763 at March 31, 2021 and June 30, 2020, respectively:
Intangible assets whose lives are indefinite, primarily goodwill, are not amortized and are evaluated for impairment at least annually or when circumstances indicate a possible impairment may exist. Intangible assets with definite lives, primarily capitalized computer software costs, are amortized over their expected useful lives. Amortization expense for these intangible assets for the three months ended March 31, 2021 and 2020 was $54,000 and $56,000, respectively . Amortization expense for these intangible assets for the nine months ended March 31, 2021 and 2020 was $167,000 and $168,000, respectively.
Noncontrolling Interests
The Consolidated Financial Statements include all assets, liabilities, revenues, and expenses of entities that are controlled and consolidated by the System. Noncontrolling interests in the Consolidated Balance Sheets represent the portion of net assets owned by entities outside the System, for those entities in which the System’s ownership interest is less than 100%.
Net Assets
Net Assets Without Donor Restrictions
Net assets without donor restrictions are those whose use by the System has not been limited by donors and are available for general operating use.
14

Ascension
Notes to Consolidated Financial Statements (unaudited) (continued) (Dollars in Thousands)
2. Significant Accounting Policies (continued)
Net Assets With Donor Restrictions
Net assets with donor restrictions include those whose use by the System has been limited by donors for a specific time period or purpose, primarily for patient care, operations, and property and equipment.
This category also includes net assets restricted by donors to be maintained in perpetuity. The income generated from investments is primarily used to purchase equipment and to provide charity care and other health and educational services. Contributions with donor-imposed restrictions that are met in the same reporting period are reported as net assets without donor restrictions. Net assets with donor restrictions consist solely of controlling interests of the System.
Performance Indicator
The performance indicator is the excess of revenues and gains over expenses and losses. Pension and other postretirement liability adjustments, transfers to or from sponsors and other affiliates, net assets released from restrictions for property acquisitions, and changes in unconsolidated entities’ net assets are not included in the performance indicator.
Operating and Nonoperating Activities
The System’s primary mission is to meet the healthcare needs in its communities served through a broad range of general and specialized healthcare services, including inpatient acute care, outpatient services, long-term care, and other healthcare services.
Activities directly associated with the furtherance of this purpose are considered to be operating activities. Other activities that result in gains or losses peripheral to the System’s primary mission are considered to be nonoperating.
15

Ascension
Notes to Consolidated Financial Statements (unaudited) (continued) (Dollars in Thousands)
2. Significant Accounting Policies (continued)
Net Patient Service Revenue and Accounts Receivable
Net patient service revenue relates to contracts with patients and in most cases, involve a third-party payor (Medicare, Medicaid, commercial and other managed care insurance companies) in which the System’s performance obligations are to provide health care services. Net patient service revenues are recorded at expected collectible amounts over the time in which obligations to provide health care services are satisfied. Revenue is accrued to estimate the amount of revenue earned to date for patients who have not been discharged and whose care services are not complete as of the reporting period. Substantially all the System’s performance obligations are satisfied in one year.
The transaction price is determined based on gross charges for services provided, reduced by contractual adjustments provided to third-party payers, discounts provided to uninsured patients in accordance with the System’s charity care policy, and implicit price concessions provided primarily to uninsured patients. Patients who have health care insurance may also have discounts applied related to their copayment or deductible. Implicit price concessions are recorded as a direct reduction to net patient service revenue and are based primarily on historical collection experience.
Estimates of contractual adjustments and discounts are determined by major payor classes for inpatient and outpatient revenues based on contractual agreements, discount policies and historical experience. Management continually reviews the contractual estimation process to consider and incorporate updates to laws and regulations and frequent changes in commercial and managed care contractual terms resulting from contract renegotiations and renewals.
Laws and regulations governing the Medicare and Medicaid programs are complex and subject to interpretation. As a result, there is at least a reasonable possibility that recorded estimates will change by a material amount in the near term. Ad justments to revenue related to prior periods increased net patient service revenue by $114,862 and $86,284 f or the nine months ended March 31, 2021 and 2020, respectively.
Settlements with third-party payers for retroactive revenue adjustments due to audits, reviews or investigations are considered variable consideration and are included in the determination of the estimated transaction price for providing patient care. Such estimates are determined through either a probability-weighted estimate or an estimate of the most likely amount, depending on the circumstances related to a given estimated settlement item.
16

Ascension
Notes to Consolidated Financial Statements (unaudited) (continued) (Dollars in Thousands)
2. Significant Accounting Policies (continued)
These settlements are estimated based on the terms of the payment agreement with the payer, correspondence from the payer and historical settlement activity, including an assessment to ensure that it is probable that a significant reversal in the amount of cumulative revenue recognized will not occur when the uncertainty associated with the retroactive adjustment is subsequently resolved. Estimated settlements are adjusted in future periods as adjustments become known, or as years are settled or are no longer subject to such audits, reviews and investigations.
Net patient service revenue earned for the three months ended March 31, 2021 and 2020, is as follows:
Net patient service revenue earned for the nine months ended March 31, 2021 and 2020, is as follows:
17

Ascension
Notes to Consolidated Financial Statements (unaudited) (continued) (Dollars in Thousands)
2. Significant Accounting Policies (continued)
The System grants credit without collateral to its patients. Net patient service revenues earned by payor and significant concentrations of accounts receivable are as follows:
Deductibles, copayments, and coinsurance under third-party payment programs which are the patient’s responsibility are included within the primary payor category in the preceding table.
The primary collection risks relate to uninsured patient accounts, including patient accounts for which the primary insurance carrier has paid the amounts covered by the applicable agreement, but patient deductibles and copayments remain outstanding.
Implicit price concessions relate primarily to amounts due directly from patients. Estimated implicit price concessions are recorded for all uninsured accounts, regardless of the aging of those accounts. Accounts are written off when all reasonable internal and external collection efforts have been performed.
The estimates for implicit price concessions are based upon management’s assessment of historical write-offs and expected net collections, business and economic conditions, trends in federal, state and private employer health care coverage and other collection indicators. Management relies on the results of detailed reviews of historical write-offs and collections of revenues and accounts receivable as a primary source of information in estimating the collectability of accounts receivable. Management updates the hindsight analysis at least quarterly, using primarily a rolling twelve-month collection history and write-off data. These routine, quarterly changes in estimates have not resulted in material adjustments to the valuations of accounts receivable or period-to-period comparisons of results of operations.
18

Ascension
Notes to Consolidated Financial Statements (unaudited) (continued) (Dollars in Thousands)
2. Significant Accounting Policies (continued)
Other Operating Revenue
Other operating revenues are recorded at amounts the System expects to collect in exchange for providing goods or services not directly associated with patient care and recorded over the time in which obligations to provide goods or services are satisfied.
The amounts recognized reflect consideration due from customers, third party payors, and others. Components of other operating revenue are included in the following table for the three months ended March 31, 2021 and 2020:
19

Ascension
Notes to Consolidated Financial Statements (unaudited) (continued) (Dollars in Thousands)
2. Significant Accounting Policies (continued)
Components of other operating revenue are included in the following table for the nine months ended March 31, 2021 and 2020:
Supplemental care is revenue related to expansion and improvement of care through programs including accountable care organizations, shared savings, and other similar arrangements. Contracted services primarily include revenue from services provided under third party arrangements.
Impairment, Restructuring, and Nonrecurring Losses
Long-lived assets are reviewed for impairment whenever events or business conditions indicate the carrying amount of such assets may not be fully recoverable. Initial assessments of recoverability are based on estimates of undiscounted future net cash flows associated with an asset or group of assets.
Where impairment is indicated, the carrying amount of these long-lived assets is reduced to fair value based on future discounted net cash flows or other estimates of fair value.
I mpairment, restructuring, and nonrecurring losses consist primarily of one-time termination benefits and other restructuring and nonrecurring expenses.
20

Ascension
Notes to Consolidated Financial Statements (unaudited) (continued) (Dollars in Thousands)
2. Significant Accounting Policies (continued)
Amortization
Bond issuance costs, discounts, and premiums are amortized over the term of the bonds using a method approximating the effective interest method.
Capitalized software, including internally developed software, is amortized on a straight-line basis over the expected useful life of the software.
Income Taxes
The member healthcare entities of the System are primarily tax-exempt organizations under Internal Revenue Code Section 501(c)(3) or Section 501(c)(2), and their related income is exempt from federal income tax under Section 501(a). The System accounts for uncertainty in income tax positions by applying a recognition threshold and measurement attribute for financial statement recognition and measurement of a tax position taken or expected to be taken in a tax return. The System has determined that no material unrecognized tax benefits or liabilities exist as of March 31, 2021.
Regulatory Compliance
Ascension periodically undergoes investigations or audits by federal, state and local agencies involving compliance with a variety of laws and regulations. These investigations seek to determine compliance with, among other things, laws and regulations relating to Medicare and Medicaid reimbursement, including billing practice for certain services.
While no assurance can be given concerning the outcome of any current investigation, management believes that adequate reserves have been established, when available information indicates that a loss is probable and the range of loss can be reasonably estimated, and the outcome of any current investigations will not have a material effect on the Consolidated Financial Statements of the System.
Reclassifications
Certain reclassifications were made to the March 31, 2020 Consolidated Financial Statements to conform to the March 31, 2021 presentation.
21

Ascension
Notes to Consolidated Financial Statements (unaudited) (continued) (Dollars in Thousands)
2. Significant Accounting Policies (continued)
Subsequent Events
The System evaluates the impact of subsequent events, which are events that occur after the Consolidated Balance Sheet date, but before the Consolidated Financial Statements are issued, for potential recognition or disclosure in the Consolidated Financial Statements as of the Consolidated Balance Sheet date. For the nine months ended March 31, 2021, the System evaluated subsequent events through May 19, 2021, representing the date on which the Consolidated Financial Statements were issued.
During this period, there were no subsequent events requiring recognition in the Consolidated Financial Statements and no unrecognized subsequent events requiring disclosure.
3. COVID-19 Pandemic and CARES Act Funding
On March 11, 2020, the World Health Organization designated the COVID-19 outbreak as a global pandemic. In response to COVID-19, the Coronavirus Aid, Relief, and Economic Security (CARES) Act, was signed into law on March 27, 2020. The CARES Act authorizes funding to hospitals and other healthcare providers to be distributed through the Public Health and Social Services Emergency Fund (Provider Relief Fund). Payments from the Provider Relief Fund are to be used to prevent, prepare for, and respond to coronavirus, and shall reimburse the recipient for health care related expenses and lost revenues attributable to coronavirus. Additionally, funds are available to reimburse providers for COVID-19 related treatment of uninsured patients.
For the nine months ended March 31, 2021, the System recognized revenue associated with Provider Relief Fund payments of $889,292 , which is included in other operating revenue in the Consolidated Statement of Operations. Management continues to monitor compliance with the terms and conditions of the Provider Relief Fund. If unable to attest to or comply with current or future terms and conditions, the System’s ability to retain some or all of the distributions received may be impacted.
In April 2020, the System requested Medicare advanced payments under the Centers for Medicare and Medicaid Services’ Accelerated and Advanced Payment Program (Program) designed to increase cash flow to Medicare providers and suppliers impacted by COVID-19. The Program allowed eligible health care facilities to request up to six months of advance Medicare payments for acute care hospitals or up to three months of advance Medicare payments for other health care providers. The System received approximately $2,000,000 of advanced payments in April 2020, which are included in current and long-term liabilities in the Consolidated Balance Sheet as of March 31, 2021, based on the Program’s repayment requirements.
22

Ascension
Notes to Consolidated Financial Statements (unaudited) (continued) (Dollars in Thousands)
4. Organizational Changes
Divestitures
During the nine months ended March 31, 2021 and 2020, Ascension, including certain of its wholly owned subsidiaries, completed the sale of, or undertook actions to sell or transfer ownership of, certain assets and liabilities as follows.
Assets Held for Sale / Sold
In January 2021, Ministry Health Care, Inc. (Ministry), a wholly owned subsidiary of Ascension, and Aspirus, Inc. (Aspirus) entered into an agreement whereby Ministry will transition its sole membership interest in seven hospitals and related clinical and other business representing substantially all operations in the Northern and Central Wisconsin markets to Aspirus. Assets and liabilities held for sale at March 31, 2021 are $341,583 and $60,651, respectively, and are included in other current assets and other current liabilities in the Consolidated Balance Sheet. This transition is expected to be finalized after all necessary approvals are obtained.
Effective August 1, 2020, Ascension completed the sale of certain assets and liabilities and substantially all related operations of Ascension St. Clare’s Hospital, Inc. (St. Clare’s), an Ascension Wisconsin subsidiary, as well as interests in two related joint ventures to MCHS Hospitals, Inc. (MCHS), a subsidiary of Marshfield Clinic, Inc. Assets and liabilities held for sale at June 30, 2020 were $91,057 and $2,023, respectively, and were included in other current assets and other current liabilities in the Consolidated Balance Sheet.
Effective October 1, 2019, Ascension completed the sale of certain assets and liabilities and substantially all related operations of St. Vincent’s Medical Center, an Ascension subsidiary located in Bridgeport, Connecticut, to Hartford HealthCare Corporation.
Membership Donation
Effective September 1, 2020, Ascension completed the separation of St. Mary’s Healthcare (St. Mary’s), a wholly owned subsidiary of Ascension located in Amsterdam, New York. The separation was accounted for as a donation of unrestricted net assets of approximately $132,000 included in other nonoperating gains (losses) and restricted net assets of approximately $13,000 included in other net assets with donor restrictions in the Consolidated Statements of Operations and Changes in Net Assets.
23

Ascension
Notes to Consolidated Financial Statements (unaudited) (continued) (Dollars in Thousands)
5. Pooled Investment Fund
At March 31, 2021 and 2020, respectively, a significant portion of the System’s investments consists of its interest in the Alpha Fund, a limited liability company organized in the state of Delaware. Certain System investments, including some held by the Ministry Markets and their consolidated foundations, are managed outside of the Alpha Fund.
The Alpha Fund includes the investment interests of the System and other Alpha Fund members. AIM, a wholly owned subsidiary of the System, serves as the manager and primary investment advisor of the Alpha Fund, overseeing the investment strategies offered to the Alpha Fund’s members. AIM provides expertise in the areas of asset allocation, selection and monitoring of outside investment managers, and risk management. The Alpha Fund is consolidated in the System’s Consolidated Financial Statements.
Ascension and the Alpha Fund invest in certain alternative investment funds which include contractual commitments to provide capital contributions during the investment period, which is typically five years and can extend to the end of the fund term. During these contractual periods, investment managers may require investment in accordance with the terms of the agreement.
Commitments not funded during the investment period will e xpire and remain unfunded. As of March 31, 2021, contractual agreements expire between April 2021 and October 2026.
The remaining unfunded capital commitments total approximately $1,706,000 for 243 individual funds as of March 31, 2021. Due to the uncertainty surroun ding whether the contractual commitments will require funding during the contractual period, future minimum payments to meet these commitments cannot be reasonably estimated. These committed amounts are expected to be primarily satisfied by the liquidation of existing investments in the Alpha Fund.
In the normal course of business, the Alpha Fund enters into derivative contracts (derivatives) for trading purposes following Alpha Fund guidelines. Derivatives in which the Alpha Fund may invest include options, futures contracts, swaps, forward settling mortgage-backed securities, and index-based instruments. Advisers selected by AIM to manage the Alpha Fund’s assets may actively trade futures contracts, options, and foreign currency forward contracts.
AIM may direct these advisers to execute derivative transactions. These transactions are used to hedge against changes in the interest rates, security prices, currency fluctuations, and other market developments to manage risk or for the purposes of earning additional income. Derivatives are either exchange-traded or over the counter contracts. Exchange-traded derivatives are standard contracts traded on a regulated exchange. Over the counter contracts are private contracts negotiated with counterparties.
24

Ascension
Notes to Consolidated Financial Statements (unaudited) (continued) (Dollars in Thousands)
5. Pooled Investment Fund (continued)
See the Fair Value Measurements note for a discussion of how fair value for the Alpha Fund’s derivatives is determined. At March 31, 2021 and June 30, 2020, the gross notional value of Alpha Fund derivatives outstanding was approximately $11,684,0000 and $9,948,000, respectively.
The fair value of Alpha Fund derivatives in an asset position w as $145,861 and $45,395 at March 31, 2021 and June 30, 2020, respectively, while the fair value of Alpha Fund derivatives in a liability position was $80,669 and $97,298 at March 31 , 2021 and June 30, 2020, respectively. These derivatives are included in long-term investments in the Consolidated Balance Sheets.
During the nine months ended March 31, 2020, the Alpha Fund participated in a securities lending program, whereby a portion of the Alpha Fund’s investments were loaned to selected established brokerage firms in return for securities from the brokers as collateral for the investments loaned, usually on a short-term basis. Participation in the securities lending program ceased during the year ended June 30, 2020, and as such, did not have any outstanding loans as of June 30, 2020 or March 31, 2021.
Due from brokers and due to brokers on the Consolidated Balance Sheets represent the Alpha Fund’s positions and amounts due from or to various brokers, primarily for security transactions not yet settled, and cash held by brokers for securities sold, not yet purchased.
25

Ascension
Notes to Consolidated Financial Statements (unaudited) (continued) (Dollars in Thousands)
6. Cash and Investments
The System’s cash and investments are reported in the Consolidated Balance Sheets as presented in the table that follows. Total cash and investments, net, includes both the System’s membership interest in the Alpha Fund and the noncontrolling interests held by other Alpha Fund members. System unrestricted cash and investments, net, represent the System’s cash and investments excluding the noncontrolling interests held by other Alpha Fund members and assets limited as to use.
26

Ascension
Notes to Consolidated Financial Statements (unaudited) (continued) (Dollars in Thousands)
6. Cash and Investments (continued)
The System’s composition of cash and cash equivalents, short-term investments and long-term investments, which include certain assets limited as to use, is summarized as follows.
Investment return recognized by the System for the nine months ended March 31, 2021 and 2020, is summarized in the following table. Total investment return includes the System’s return on certain investments held and managed outside the Alpha Fund and the investment return of the Alpha Fund. System investment return represents the System’s total investment return, net of the investment return earned by the noncontrolling interests of other Alpha Fund members.
Investment return is reduced by external and direct internal investment expenses.
27

Ascension
Notes to Consolidated Financial Statements (unaudited) (continued) (Dollars in Thousands)
7. Financial Assets and Liquidity Resources
As of March 31, 2021 and June 30, 2020, respectively, financial assets and liquidity resources available within one year for general expenditure, such as operating expenses, principal payments on debt, and capital expenditures not financed with debt, are as follows:
As part of the System’s investment policy, highly liquid investments are held to enhance the System’s ability to satisfy liquidity. The System also maintains lines of credit.
8. Fair Value Measurements
The System measures the fair value of assets and liabilities in accordance with FASB ASC 820, Fair Value Measurement . Under ASC 820, fair value is defined as the price that would be received to sell an asset or paid to transfer a liability at the measurement date. Assets and liabilities reported at fair value are classified and disclosed in one of the following four categories:
Level 1 – Quoted prices (unadjusted) that are readily available in active markets/exchanges for identical assets or liabilities.
28
Ascension
Notes to Consolidated Financial Statements (unaudited) (continued) (Dollars in Thousands)
8. Fair Value Measurements (continued)
Level 2 – Pricing inputs other than quoted prices included in Level 1 that are observable for the asset or liability, either directly or indirectly. Level 2 pricing inputs include prices quoted for similar assets and liabilities in active markets/exchanges or prices quoted for identical or similar assets and liabilities in markets that are not active. If the asset or liability has a specified (contractual) term, a Level 2 input must be observable for substantially the full term of the asset or liability.
Level 3 – Significant pricing inputs that are unobservable for the asset or liability, including assets or liabilities for which there is little, if any, market activity for such asset or liability. Inputs to determine the fair value of Level 3 assets and liabilities require management judgment and estimation.
Net Asset Value – Values are based on the calculated net asset value. The calculated net asset values for underlying investments are fair value estimates determined by an external fund manager and other sources based on quoted market prices, operating results, balance sheet stability, growth, and other business and market sector factors.
The System categorizes, for disclosure purposes, assets and liabilities measured at fair value in the Consolidated Financial Statements based upon whether the inputs used to determine their fair values are observable or unobservable. Observable inputs are inputs that are based on market data obtained from sources independent of the reporting entity. Unobservable inputs are inputs that reflect the reporting entity’s own assumptions about pricing the asset or liability based on the best information available in the circumstances.
In certain cases, the inputs used to measure fair value may fall into different levels of the fair value hierarchy. In such cases, an asset’s or liability’s level within the fair value hierarchy is based on the lowest level of input that is significant to the fair value measurement of the asset or liability. The System’s assessment of the significance of a particular input to the fair value measurement in its entirety requires judgment and considers factors specific to the asset or liability.
As of March 31, 2021 and June 30, 2020, the assets and liabilities listed in the fair value hierarchy tables below use the following valuation techniques and inputs:
Cash and Cash Equivalents and Short-Term Investments
Cash and cash equivalents and certain short-term investments include certificates of deposit, whose fair value is based on cost plus accrued interest. Significant observable inputs include security cost, maturity, and relevant short-term interest rates.
29

Ascension
Notes to Consolidated Financial Statements (unaudited) (continued) (Dollars in Thousands)
8. Fair Value Measurements (continued)
Other short-term investments designated as Level 2 investments primarily consist of commercial paper, whose fair value is based on the income approach. Significant observable inputs include security cost, maturity, credit rating, interest rate, and par value.
Pooled Short-Term Investment Fund
The pooled short-term investment fund is a short-term exchange traded money market fund primarily invested in treasury securities.
U. S. Government, State, Municipal, and Agency Obligations
The fair value of investments in U.S. government, state, municipal, and agency obligations is primarily determined using techniques consistent with the income approach. Significant observable inputs include benchmark yields, reported trades, observable broker/dealer quotes, and issuer spreads.
Corporate and Foreign Fixed Income Securities
The fair value of investments in U.S. and international corporate bonds and foreign government bonds is primarily determined using techniques that are consistent with the market approach. Significant observable inputs include benchmark yields, reported trades, observable broker/dealer quotes, issuer spreads, and security-specific characteristics (e.g., such as early redemption options).
Asset-backed Securities
The fair value of U.S. agency, mortgage, and other asset-backed securities is primarily determined using techniques that are consistent with the income approach. Significant observable inputs include prepayment speeds and spreads, benchmark yield curves, volatility measures, and observable broker/dealer quotes.
Equity Securities
The fair value of investments in U.S. and international equity securities is primarily determined using techniques that are consistent with the market and income approaches. The values for underlying investments are based on readily available quoted market prices or represent fair value estimates determined by an external fund manager based on market prices, operating results, balance sheet stability, growth, dividend, dividend yield, and other business and market sector fundamentals.
30

Ascension
Notes to Consolidated Financial Statements (unaudited) (continued) (Dollars in Thousands)
8. Fair Value Measurements (continued)
Alternative Investments and Other Investments
Alternative investments consist of private equity, hedge funds, private equity funds, private credit and energy funds, and real estate partnerships. The fair value of private equity is primarily determined using techniques consistent with both the market and income approaches, based on the System’s estimates and assumptions in the absence of observable market data. The market approach considers comparable company, comparable transaction, and company-specific information, including but not limited to restrictions on disposition, subsequent purchases of the same or similar securities by other investors, pending mergers or acquisitions, and current financial position and operating results. The income approach considers the projected operating performance of the portfolio company.
The fair value of hedge funds, private equity funds, private credit and energy funds, and real estate partnerships is primarily determined using net asset values, which approximate fair value, as determined by an external fund manager based on quoted market prices, operating results, balance sheet stability, growth, and other business and market sector fundamentals.
Other investments include derivative assets and derivative liabilities of the Alpha Fund, whose fair value is primarily determined using techniques consistent with the market approach. Significant observable inputs to valuation models include the time value of money, counterparty credit risk, interest rates, Treasury yields, volatilities, credit spreads, maturity date, recovery rates, and the current market and contractual prices of the underlying financial instruments.
Benefit Plan Assets
The fair value of benefit plan assets is based on original investment into a guaranteed fund, plus guaranteed, annuity contract-based interest rates. Significant unobservable inputs to the guaranteed rate include the fair value and average duration of the portfolio of investments underlying annuity contract, the contract value, and the annualized weighted-average yield to maturity of the underlying investment portfolio.
Interest Rate Swap Assets and Liabilities
The fair value of interest rate swaps is primarily determined using techniques consistent with the income method. Under the income method, fair values are calculated based on present value of expected future cash flows using discount rates appropriate with risks involved.
Significant observable inputs to valuation models include interest rates, Treasury yields, volatilities, credit spreads, maturity, and recovery rates.
31

Ascension
Notes to Consolidated Financial Statements (unaudited) (continued) (Dollars in Thousands)
8. Fair Value Measurements (continued)
Investments Sold, Not Yet Purchased
The fair value of investments sold, not yet purchased is primarily determined using techniques consistent with the income approach. Significant observable inputs to the income approach include data points for benchmark, constant maturity curves, and spreads.
The following table summarizes fair value measurements, by level, at March 31, 2021, for all financial assets and liabilities measured at fair value on a recurring basis in the System’s Consolidated Financial Statements:
32

Ascension
Notes to Consolidated Financial Statements (unaudited) (continued) (Dollars in Thousands)
8. Fair Value Measurements (continued)
For the three months ended March 31, 2021, the changes in the fair value of the assets and liabilities measured using significant unobservable inputs (Level 3) consisted of the following:
The basis for recognizing and valuing transfers into or out of Level 3, in the Level 3 rollforward, is as of the beginning of the period in which the transfers occur.
33

Ascension
Notes to Consolidated Financial Statements (unaudited) (continued) (Dollars in Thousands)
8. Fair Value Measurements (continued)
For the nine months ended March 31, 2021, the changes in the fair value of the assets and liabilities measured using significant unobservable inputs (Level 3) consisted of the following:
The basis for recognizing and valuing transfers into or out of Level 3, in the Level 3 rollforward, is as of the beginning of the period in which the transfers occur.
34

Ascension
Notes to Consolidated Financial Statements (unaudited) (continued) (Dollars in Thousands)
8. Fair Value Measurements (continued)
The following table summarizes fair value measurements, by level, at June 30, 2020, for all financial assets and liabilities measured at fair value on a recurring basis in the System’s Consolidated Financial Statements:
35

Ascension
Notes to Consolidated Financial Statements (unaudited) (continued) (Dollars in Thousands)
8. Fair Value Measurements (continued)
For the three months ended March 31, 2020, the changes in the fair value of the assets and liabilities measured using significant unobservable inputs (Level 3) consisted of the following:
The basis for recognizing and valuing transfers into or out of Level 3, in the Level 3 rollforward, is as of the beginning of the period in which the transfers occur.
36

Ascension
Notes to Consolidated Financial Statements (unaudited) (continued) (Dollars in Thousands)
8. Fair Value Measurements (continued)
For the nine months ended March 31, 2020, the changes in the fair value of the assets and liabilities measured using significant unobservable inputs (Level 3) consisted of the following:
The basis for recognizing and valuing transfers into or out of Level 3, in the Level 3 rollforward, is as of the beginning of the period in which the transfers occur.
37

Ascension
Notes to Consolidated Financial Statements (unaudited) (continued) (Dollars in Thousands)
9. Derivative Instruments
The System uses interest rate swap agreements to manage interest rate risk associated with its outstanding debt. Interest rate swaps with varying characteristics are outstanding under the Master Trust Indenture of the System. These swaps have historically been used to effectively convert interest rates on variable rate bonds to fixed rates and rates on fixed rate bonds to variable rates. At March 31, 2021 and June 30, 2020, the notional values of outstanding interest rate swaps wer e $894,445 and $953,750, respectively.
The System recognizes the fair value of its interest rate swaps in the Consolidated Balance Sheets as assets, recorded in other noncurrent assets, or liabilities, recorded in other noncurrent liabilities, as appropriate. The fair value of interest rate swaps in an asset position was $11,788, and $2,785 at March 31, 2021 and June 30, 2020, respectively. The fair value of interest rate swaps in a liability position was $124,265 and $1 71,787 at March 31, 2021 and June 30, 2020, respectively.
The System’s interest rate swap agreements include collateral requirements for each counterparty under such agreements, based upon specific contractual criteria, subject to master netting arrangements. Collateral requirements are calculated based on the System’s credit ratings. The applicable credit rating is the Senior Credit Group long-term debt credit ratings (Senior Debt Credit Ratings), as obtained from each of two major credit rating agencies. Credit rating and the net liability position of total interest rate swap agreements outstanding with each counterparty determine the amount of collateral to be posted. No collateral was posted as of March 31, 2021 or June 30, 2020.
The System does not account for any of its interest rate swaps as hedges, and accordingly, all changes in the fair value of interest rate swaps are recognized in nonoperating gains (losses) in the Consolidated Statements of Operations and Changes in Net Assets. The System does not offset fair value amounts recognized for derivative instruments.
10. Leases
The System is a party to primarily real estate and medical and information technology equipment leases as a lessee and real estate leases as a lessor. Many leases include rental escalation clauses or renewal options which are factored into the determination of lease payments when appropriate. As most of the System’s operating leases do not provide an implicit rate, the System uses its incremental borrowing rate based upon information available at the lease commencement date in determining the present value of lease payments.
38

Ascension
Notes to Consolidated Financial Statements (unaudited) (continued) (Dollars in Thousands)
10. Leases (continued)
All components of total lease cost are recognized in other operating expenses, excluding interest on finance lease liabilities, which is recognized in interest. The following table provides the total lease cost included in the Consolidated Statement of Operations and Changes in Net Assets:
The weighted average remaining lease terms and the weighted average discount rates at March 31, 2021 and 2020 were as follows:
The following table provides the cash paid for amounts included in the measurement of lease obligations:
39

Ascension
Notes to Consolidated Financial Statements (unaudited) (continued) (Dollars in Thousands)
10. Leases (continued)
The following table reconciles undiscounted future operating and finance lease obligations for each of the next five years and thereafter, as of March 31, 2021, to lease obligations recorded on the Consolidated Balance Sheets at March 31, 2021.
For leases where the System is a lessor, future minimum noncancelable receipts on operating leases for each of the next five years and thereafter, as of March 31, 2021, are as follows:
F or the three months ended March 31, 2021 and 2020, lease income was approximately $19,000 and $21,000, r espectively. F or the nine months ended March 31, 2021 and 2020, lease income was approxim ately $58,000 and $64,000, r espectively.
40

Ascension
Notes to Consolidated Financial Statements (unaudited) (continued) (Dollars in Thousands)
11. Retirement Plans
Certain System entities participate in defined-benefit pension plans (the System Plans), which are noncontributory, defined-benefit pension plans. Benefits are based on each participant’s years of service and compensation. Primarily all of the System Plans’ assets are invested in the Master Pension Trust (the Trust).
The System Plans’ assets primarily consist of short-term investments, equity, fixed income, and alternative investments, consisting of various hedge funds, real estate funds, private equity funds, commodity funds, private credit funds, and certain other private funds.
Contributions to the System Plans are based on actuarially determined amounts sufficient to meet the benefits to be paid to participants. As of December 31, 2019, all System Plans were frozen.
The assets of the System Plans are available to pay the benefits of eligible employees and retirees of all participating entities. In the event entities participating in the System Plans are unable to fulfill their financial obligations under the System Plans, the other participating entities are obligated to do so.
The following table provides the components of net periodic benefit costs for the System plans:
41
Ascension
Notes to Consolidated Financial Statements (unaudited) (continued) (Dollars in Thousands)
12. Contingencies and Commitments
The System is involved in litigation and regulatory investigations arising in the ordinary course of business. In the opinion of management, after consultation with legal counsel, these matters are expected to be resolved without material adverse effect on the System’s Consolidated Balance Sheets.
The System enters into agreements with non-employed physicians that include minimum revenu e guarantees. The terms of the guarantees vary. The maximum amount of future payments that the System could be required to make under these guarantees is approximately $7,000.
The System entered into Master Service Agreements for information technology services provided by third parties. The maximum amount of future payments that the System could be required to make under these agreements is approximately $354,500.
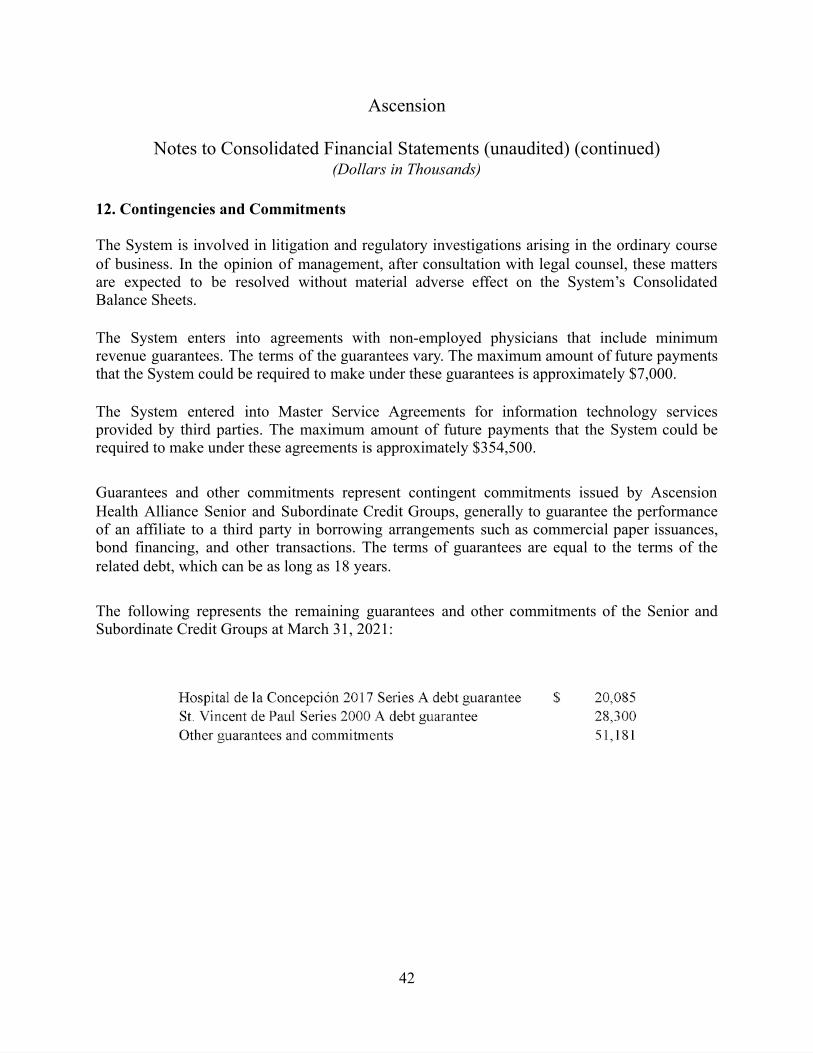
Guarantees and other commitments represent contingent commitments issued by Ascension Health Alliance Senior and Subordinate Credit Groups, generally to guarantee the performance of an affiliate to a third party in borrowing arrangements such as commercial paper issuances, bond financing, and other transactions. The terms of guarantees are equal to the terms of the related debt, which can be as long as 18 years.
Th e following represents the remaining guarantees and other commitments of the Senior and Subordinate Credit Groups at March 31, 2021:
42

Ascension
Notes to Consolidated Financial Statements (unaudited) (continued) (Dollars in Thousands)
13. Functional Expenses
Ascension provides healthcare services, including inpatient, outpatient, ambulatory, long-term care and community-based services. Management support services include administration, finance and accounting, revenue cycle, information technology, public relations, human resources, legal, supply chain, risk management, compliance and other functions. Expenses are allocated to healthcare services and management support services based on the functional department for which they are incurred. Departmental expenses may include various allocations of costs based on direct assignment, expenses or other methods.
Expenses by functional classification for the three months ended March 31, 2021 consist of the following:
Expenses by functional classification for the three months ended March 31, 2020 consist of the following:
43

Ascension
Notes to Consolidated Financial Statements (unaudited) (continued) (Dollars in Thousands)
13. Functional Expenses (continued)
Expenses by functional classification for the nine months ended March 31, 2021 consist of the following:
Expenses by functional classification for the nine months ended March 31, 2020 consist of the following:
44

Supplementary Information

Ascension
Schedule of Net Cost of Providing Care of Persons Living in Poverty and Other Community Benefit Programs
(Dollars in Thousands)
Nine Months Ended March 31, 2021 and 2020
The net cost of providing care to persons living in poverty and other community benefit programs is as follows:
46

Management’s Discussion and Analysis of Financial Condition and Results of Operations for Ascension
For the nine months ended March 31, 2021 and 2020
Introduction to Management’s Discussion and Analysis ⎻⎻⎻⎻⎻⎻⎻⎻⎻⎻⎻⎻⎻⎻⎻⎻⎻⎻⎻⎻⎻⎻⎻⎻⎻⎻
The purpose of Management’s Discussion and Analysis of Financial Condition and Results of Operations (MD&A) is to provide a narrative explanation of the financial position and operations of Ascension (the System). The MD&A includes the following sections: ● Organization and Mission ● Executive Overview ● Organizational Changes ● Novel Coronavirus (COVID-19) ● Select Financial Information
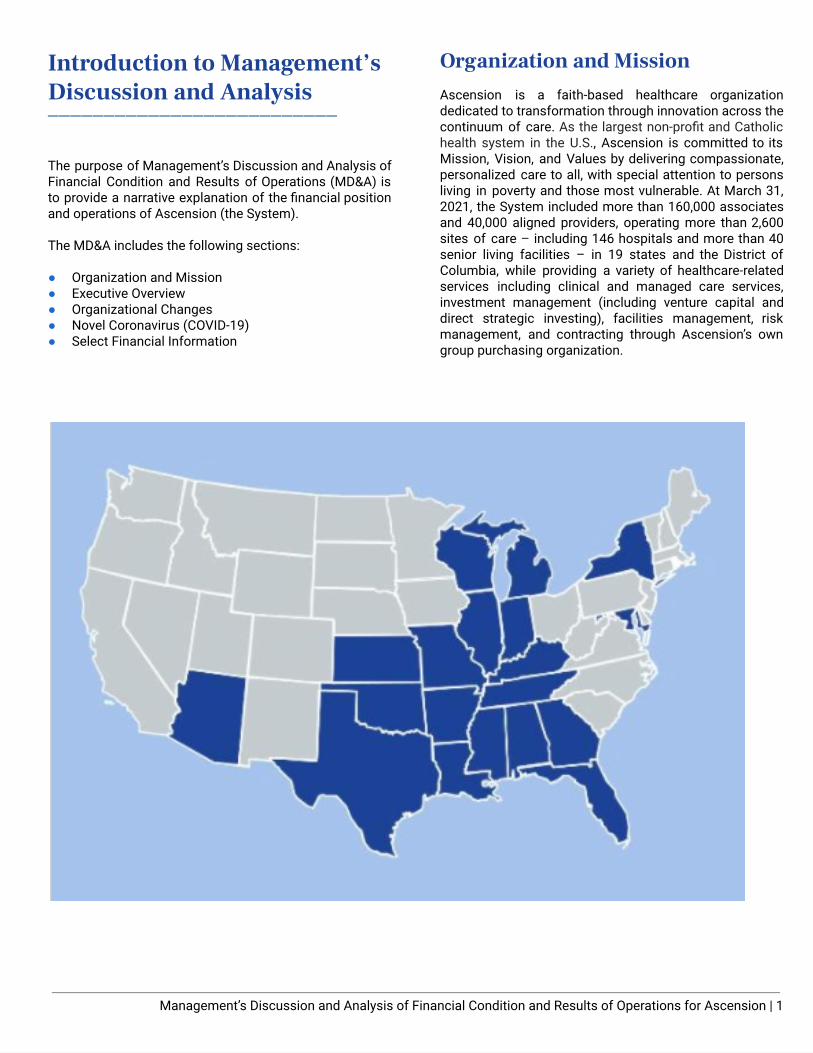
Organization and Mission Ascension is a faith-based healthcare organization dedicated to transformation through innovation across the continuum of care. As the largest non-profit and Catholic health system in the U.S. , Ascension is committed to its Mission, Vision, and Values by delivering compassionate, personalized care to all, with special attention to persons living in poverty and those most vulnerable. At March 31, 2021, the System included more than 160,000 associates and 40,000 aligned providers, operating more than 2,600 sites of care – including 146 hospitals and more than 40 senior living facilities – in 19 states and the District of Columbia, while providing a variety of healthcare-related services including clinical and managed care services, investment management (including venture capital and direct strategic investing), facilities management, risk management, and contracting through Ascension’s own group purchasing organization.
Management’s Discussion and Analysis of Financial Condition and Results of Operations for Ascension | 1

Executive Overview For the nine months ended March 31, 2021, Ascension’s operations and volumes experienced significant volatility as a result of the COVID-19 pandemic. Local COVID-related restrictions resulted in the cancellation or deferral of elective procedures. Such restrictions, along with consumer hesitation continue to have an adverse impact on the System’s overall volumes in the current fiscal year. Government funding and favorable investment performance have contributed to the System’s ability to sustain operations during this unprecedented time, continuing our Mission to provide care for those we serve, particularly those most vulnerable. Ascension is committed to managing discretionary expenses to focus on top priorities of caring for our patients and caregivers.
Organizational Changes
Ascension continues to make strategic and purposeful decisions to improve the health of individuals and communities served, engage with consumers in new ways, and support the shift to expanded ambulatory and telehealth presence. To strengthen hospital operations and gain capabilities for the future, the organization’s changes to its portfolio are as follows.
Effective July 1, 2020, Ascension St. Vincent’s in Birmingham and The University of Alabama at Birmingham Health System (“UABHS”) formed an alliance that will increase access to high-quality, innovative medical care through multiple outlets and health programs.
Effective August 1, 2020, Ascension divested substantially all the assets of St. Clare’s Hospital in Weston, Wisconsin, to Marshfield Clinic Health System.
Effective September 1, 2020, St. Mary’s Healthcare in Amsterdam, New York, separated from the Ascension System and began to operate as an independent, Catholic healthcare organization under the governance of a local Board.
In January 2021, Ministry Health Care, Inc. (Ministry), a wholly owned subsidiary of Ascension, and Aspirus, Inc. (Aspirus) entered into an agreement whereby Ministry will transition its sole membership interest in seven hospitals and related clinical and other business, representing substantially all operations in the Northern and Central Wisconsin markets, to Aspirus. This transition is expected to close after all necessary approvals are obtained.
Novel Coronavirus (COVID-19)
The global novel coronavirus (COVID-19) pandemic has had significant economic and operational impact on the U.S. healthcare industry. Ascension’s patients, employees, business operations and communities served by the System remained adversely impacted for the nine months ended March 31, 2021.
Recurrent surges of COVID-19 cases across the nation during fiscal year 2021 have had a significant impact on Ascension’s volumes and created financial hardship as further discussed below. Governmental relief funds and programs helped to offset the impacts of mandatory and discretionary shutdowns throughout the pandemic. However, healthcare hesitation continues to impact Ascension’s markets to varying degrees, as the System’s operations and volumes remain below pre-pandemic levels for the nine months ended March 31, 2021.
The System received distributions from the CARES Act both during and since the System’s fiscal year ended June 30, 2020. The CARES Act increased funding for the Public Health and Social Services Emergency Fund (Provider Relief Fund) to reimburse eligible healthcare providers for lost revenues or healthcare-related expenses attributable to COVID-19, as well as increased Medicare reimbursement rates for inpatients diagnosed with COVID-19.
Due to uncertainty in the terms and conditions associated with the governmental funding, Ascension was unable to recognize all funds received as of June 30, 2020. During the second quarter of fiscal 2021, the federal government clarified the terms and conditions of the funding from the CARES Act. This clarification resulted in the System’s recognition of substantially all Provider Relief Fund amounts received to date as revenue during the first half of the fiscal year.
While recognition of government funds favorably contributed to the System’s financial performance during this fiscal year, the impact from significant and ongoing patient volume reductions and increased supply and staffing costs have not been fully offset, as further discussed in this document.
Management’s Discussion and Analysis of Financial Condition and Results of Operations for Ascension | 2

Select Financial Information (dollars in millions)
Consolidated Operations The following table reflects selected financial information on a consolidated basis for the nine months ended March 31, 2021 and 2020.
Nine months ended March 31,
On a consolidated basis, operating margin was 3.8% for the nine months ended March 31, 2021, as compared to (1.8%) for the same period in the prior year. Operating EBIDA margin was 9.4% for the nine months ended March 31, 2021, as compared to 4.1% in the same period of the prior year. Increases in margins are significantly impacted by the recognition of government funding intended to offset losses incurred during the pandemic.
Unaudited Pro-Forma Financial Information Despite recognition of Provider Relief Funds, the financial results for the first nine months of this fiscal year do not fully reflect the impact of the pandemic on Ascension’s operations. The following table is an unaudited pro-forma presentation of the System’s financial results for the twelve months ended December 31, 2020 and the three months ended March 31, 2021 to illustrate the impact of the pandemic and the government’s relief efforts on operational performance.
As shown above, the Provider Relief Funds provided an appropriate level of financial assistance, to partially offset the pandemic’s significant adverse financial impact on operations during the pandemic period. As of March 31, 2021, Ascension has calculated the impact of the pandemic to consist of $1.9 billion in lost revenue and pandemic-related expenses. Although the Provider Relief Funds do not fully cover this negative impact, consistent with our mission to serve patients and communities and because of strong stewardship, Ascension was able to absorb the remaining negative financial impact through other operations.
Management’s Discussion and Analysis of Financial Condition and Results of Operations for Ascension | 3
2021 2020
Net Patient Service Revenue $ 18,199 $ 17,989
Other Operating Revenue 2,311 1,258
Operating Expenses 19,808 19,407
Income (loss) from Recurring Operations 702 (160)
Self-Insurance Trust Fund Investment Return 97 (63)
Impairment, Restructuring and Nonrecurring Losses, net (20) (122)
Income (loss) from Operations 779 (345)
Operating Margin 3.8% (1.8%)
Operating EBIDA Margin 9.4% 4.1%
Cost of Providing Care of Persons Living in Poverty and Other Community Benefit Programs 1,768 1,730

Volume Trends
The following table reflects certain patient volume information, on a consolidated basis, for the nine months ended March 31, 2021 and 2020.
Nine months ended March 31,
For the nine months ended March 31, 2021, the System’s volumes remain impacted by the pandemic. Due to ongoing surges of COVID-19 patients and consumer hesitation, equivalent discharges, admissions, emergency room visits, and outpatient visits during the nine months ended March 31, 2021, were less than the prior year by 10.1%, 8.5%, 21.1%, and 6.4%, respectively. However, physician office visits, outpatient visits, including outpatient surgeries during the month of March 2021 exceeded pre-pandemic volumes, as compared to the same period in the prior year.
Physician office and clinic visits for the nine months ended March 31, 2021, decreased 0.5% as compared to the same period in the prior year. On a same facility basis, physician office and clinic visits increased 0.7% for the nine months ended March 31, 2021, as compared to the same period in the prior year.
The pandemic resulted in shifts to care delivery, specifically in virtual provider office (VPO) visits. The System provided over 1.2 million VPO visits during the nine months ended March 31, 2021. Total Operating Revenue
Total operating revenue increased by $1.3 billion or 6.6% during the nine months ended March 31, 2021, as compared to the same period in the prior year.
While net patient service revenue (NPSR) remains impacted by the pandemic, the System experienced an
increase in NPSR of 1.2% for the nine months ended March 31, 2021. Despite recent divestitures, the System’s ongoing operations have shown growth in NPSR of 2.7% for the nine months ended March 31, 2021, as compared to the same period in the prior year.
For the nine months ended March 31, 2021, NPSR per equivalent discharge increased 12.5% compared to the prior year primarily due to increased case mix index.
The System’s case mix index and average length of stay increased 8.6% and 8.9%, respectively, for the nine months ended March 31, 2021, as compared to the same period in the prior year. These increases are primarily due to higher-acuity patients, including COVID-positive patients, seeking care during the pandemic.
Other operating revenue increased by $1.1 billion during the nine months ended March 31, 2021, as compared to the same period in the prior year. Increases are primarily due to recognition of monies received from the Provider Relief Fund and growth within certain service lines, such as pharmacy and lab services. Pharmacy and lab service revenue experienced increases of 12.9% and 16.9%, respectively, for the nine months ended March 31, 2021, as compared to the same period in the prior year. Favorable joint venture performance contributed to an increase in other operating revenue of $34.8 million during the nine months ended March 31, 2021, as compared to the same period in the prior year.
One-time gains of $81.6 million on the sale of two joint ventures and other assets were recorded in other operating revenue during the nine months ended March 31, 2021. Additionally, supplemental care program revenue or the payments received from value-based care contracts increased by 53.1% during the nine months ended March 31, 2021, as compared to the same period in the prior year.
Total Operating Expenses
Total operating expenses increased approximately $401.5 million or 2.1% during the nine months ended March 31, 2021, as compared to the same period in the prior year. Incremental pandemic-related salaries, wages, employee benefits and supply expenses contributed to the System’s overall expense increase, along with other expected increases from normal operations as further discussed below. The System’s focused efforts to manage non-patient-facing expenses such as travel and other variable expenses, while supporting the workforce to care for patients, continues to be a top priority.
The System experienced a 13.5% increase in cost per equivalent discharge during the nine months ended March 31, 2021, primarily due to the increases in direct costs
Management’s Discussion and Analysis of Financial Condition and Results of Operations for Ascension | 4
Volume Trends 2021 2020
Equivalent Discharges 1,146,517 1,274,923
Total Admissions 552,006 603,234
Case Mix Index 1.85 1.70
Emergency Room Visits 1,947,731 2,467,188
Surgery Visits (IP & OP) 445,321 472,990
Physician Office and Clinic Visits 11,693,219 11,757,758
Virtual Provider Office (VPO) Visits 1,209,516 97,949
Urgent Care Visits 298,141 489,362

from the pandemic as previously discussed. Higher patient acuity has led to an increase in the average length of stay, along with increased caregiver compensation and supply costs.
Pandemic-related increases in salaries, wages and employee benefits partially offset the System’s efforts to manage expenses to volumes. Total salaries, wages and benefits increased $304.1 million, or 3.2%, for the nine months ended March 31, 2021, compared to the same period in the prior year. The increase is primarily due to expected wage adjustments, onboarding additional physicians, as well as the previously mentioned increases in salaries and wages, including special pay programs for the extraordinary efforts of Ascension’s workforce.
Additional unexpected costs for contract labor were incurred at premium rates during the nine months ended March 31, 2021, as compared to the same period in the prior year due to staffing shortages amid the pandemic. Contract labor increased $100.3 million during the nine months ended March 31, 2021, as compared to the same period in the prior year.
The System experienced increases in supply expenses of $125.0 million, or 4.3%, during the nine months ended March 31, 2021, as compared to the same period in the prior year. Additional supply costs for treatment of COVID patients of approximately $152.5 million were incurred during the nine months ended March 31, 2021, partially offset by cost reductions as previously discussed. Higher patient acuity seen during the pandemic resulted in the use of more costly pharmaceuticals, COVID-related lab and testing supplies, as well as increased use of personal protective equipment.
Purchased services and professional fees decreased $36.8 million, or 1.1%, as compared to the same period in the prior year primarily due to the previously mentioned focused efforts on expense management.
Non-Operating Income - Investment Return
Substantially all the System’s cash and investments are invested in a broadly diversified portfolio that is managed by Ascension Investment Management (AIM), a wholly owned subsidiary of Ascension. Total net investments under management by AIM, including non-Ascension investors, were $51.0 billion at March 31, 2021.
Ascension’s long-term investment pool, excluding noncontrolling interests and long-term investments held by self-insurance programs of $16.6 billion, experienced significant returns during the nine months ended March 31, 2021 primarily due to the recent unexpected rebound in the investment market. While the return for the nine months ended March 31, 2021 was 19.1% or $4.6 billion,
the losses in the same period of the prior fiscal year were $1.7 billion. Investment market returns are subject to extreme volatility, with System annual investment returns ranging from losses in excess of $400 million to favorable returns exceeding $1.5 billion in the last five years.
In addition to the cash and investments managed by AIM, Ascension holds other strategic investments which have contributed over $1 billion of investment income during the nine months ended March 31, 2021.
Financial Position Ascension’s balance sheet and liquidity levels remain strong with sufficient liquidity to continue to provide care for patients, despite the economic challenges resulting from the pandemic. The following table reflects selected financial information on a consolidated basis.
Financial Assets and Liquidity Resources
The System's cash and investment position remains strong and includes highly liquid investments. Net unrestricted cash and investments were $22.6 billion at March 31, 2021, which is approximately 48.4% of the System’s total assets. The System’s days cash on hand was 330 days as of March 31, 2021, as further discussed below.
Management’s Discussion and Analysis of Financial Condition and Results of Operations for Ascension | 5
3/31/2021 6/30/2020
Current Assets $ 5,837 $ 5,017
Long-Term Investments 25,588 21,273
Property and Equipment 10,963 11,351
Other Assets 4,391 4,247
Total Assets
$ 46,779
$ 41,888
3/31/2021 6/30/2020
Current Liabilities $ 6,699 $ 7,940
Long-Term Liabilities 12,993 12,361
Total Liabilities 19,692 20,301
Net Assets 27,087 21,587
Total Liabilities and Net Assets
$ 46,779
$ 41,888

Additionally, Ascension maintains two lines of credit, totalling $600 million. As of March 31, 2021, there were no outstanding borrowings under either line of credit. Both lines of credit are committed through December 1, 2021. The System also has access to a $1.0 billion taxable commercial paper program.
During the prior fiscal year, Ascension applied for and received approximately $2.0 billion of Medicare Advanced Payments, with repayment to occur based on the terms and conditions of the program. The advanced payments are recorded within long-term investments and current and long-term liabilities on the System’s Consolidated Balance Sheets. Medicare Advanced Payments represent approximately 30 days cash as of both March 31, 2021, and June 30, 2020.
* March 31, 2021, Days Cash on Hand increased as a result of favorable investment return during the first nine months of the fiscal year.
** Net days in AR as of June 30, 2020, were adjusted to “normalize” the significant disruption to volumes during April 2020.
The System’s Master Trust Indenture requires Ascension to maintain an annual debt service coverage ratio of 1.10 and Ascension was well above this covenant at March 31, 2021.
Net days in accounts receivable decreased from 47.8 days at June 30, 2020, to 47.2 days at March 31, 2021.
Care of Persons Living in Poverty and Community Benefit
Ascension provided $1.8 billion in Care of Persons Living in Poverty and Other Community Benefit Programs for the nine months ended March 31, 2021, an increase of 2.2% from the prior year. Through programs, donations, health education, free care and more, the organization's uncompensated care and other community benefits fulfills unmet needs in communities we serve.
The total cost of providing care to persons living in poverty and other community benefit programs increased 2.2% as compared to the same period in the prior year in part due to the donation of St. Mary’s in Amsterdam, NY, partially offset by volume decreases related to the pandemic.
Management’s Discussion and Analysis of Financial Condition and Results of Operations for Ascension | 6
Balance Sheet Ratios
3/31/2021 6/30/2020
Days Cash on Hand* 330 284
Net Days in Accounts Receivable**
47.2 47.8
Cash-to-Debt 305.8% 246.3%
Total Debt to Capitalization
23.7% 29.0%
Debt Service Coverage
8.48 3.34

2021 2020Discharges by Service Type Acute Care 503,761 547,620 Psychiatric Care 32,847 39,171 Rehabilitation Care 8,129 9,164 Skilled Nursing Facility Care and Residential Living 742 1,688 Long Term Acute Care 1,081 1,069 Other L.T. Sub-Acute Care 5,446 4,522
Total Discharges by Service 552,006 603,234
Patient Days by Service Type Acute Care 2,496,404 2,491,814 Psychiatric Care 243,668 265,848 Rehabilitation Care 101,939 107,084 Skilled Nursing Facility Care 781,823 1,096,827 Assisted Living 162,436 200,284 Residential Living 10,367 10,745 Long Term Acute Care 37,492 33,607 Other L.T. Sub-Acute Care 432,706 481,234
Total Patient Days by Service 4,266,835 4,687,443
Newborn Births 58,337 62,511
Newborn Patient Days 101,216 117,024
Outpatient Visits (Includes Surgical and ER Visits) 20,968,971 22,399,713
Surgical Visits - Outpatient 313,766 325,822
Emergency Room (ER) Visits 1,947,731 2,467,188
Full Time Equivalent Employees 134,955 138,109
Total Available Beds 27,478 28,197
Total Available Beds Excluding Bassinets 26,269 27,016
Ascension
Consolidated Statistical InformationFor the Nine Months Ended
March 31,