for the transition period from to verisign, inc
TRANSCRIPT

UNITED STATESSECURITIES AND EXCHANGE COMMISSION
Washington, D.C. 20549____________________
FORM 10-Q ____________________
(Mark One)
☒ QUARTERLY REPORT PURSUANT TO SECTION 13 OR 15(d) OF THE SECURITIES EXCHANGE ACT OF 1934
For the quarterly period ended March 31, 2021 OR
☐ TRANSITION REPORT PURSUANT TO SECTION 13 OR 15(d) OF THE SECURITIES EXCHANGE ACT OF 1934
For the transition period from to Commission File Number: 000-23593
VERISIGN, INC. (Exact name of registrant as specified in its charter)
Delaware 94-3221585(State or other jurisdiction of
incorporation or organization) (I.R.S. Employer
Identification No.)
12061 Bluemont Way, Reston, Virginia 20190
(Address of principal executive offices) (Zip Code)
Registrant’s telephone number, including area code: (703) 948-3200
Securities registered pursuant to Section 12(b) of the Act:
Title of each class Trading Symbol(s) Name of each exchange on which registeredCommon Stock, $0.001 par value per share VRSN Nasdaq Global Select Market
Indicate by check mark whether the registrant (1) has filed all reports required to be filed by Section 13 or 15(d) of the Securities Exchange Act of 1934 during the preceding 12 months (or for such shorter period that the registrant was required to file such reports), and (2) has been subject to such filing requirements for the past 90 days. Yes ☒ No ☐
Indicate by check mark whether the registrant has submitted electronically every Interactive Data File required to be submitted pursuant to Rule 405 of Regulation S-T (§232.405 of this chapter) during the preceding 12 months (or for such shorter period that the registrant was required to submit such files). Yes ☒ No ☐
Indicate by check mark whether the registrant is a large accelerated filer, an accelerated filer, a non-accelerated filer, a smaller reporting company, or an emerging growth company. See the definitions of “large accelerated filer,” “accelerated filer,” “smaller reporting company,” and “emerging growth company” in Rule 12b-2 of the Exchange Act.
Large accelerated filer ☒ Accelerated filer ☐Non-accelerated filer ☐ Smaller reporting company ☐
Emerging growth company ☐If an emerging growth company, indicate by check mark if the registrant has elected not to use the extended transition
period for complying with any new or revised financial accounting standards provided pursuant to Section 13(a) of the Exchange Act. ☐
Indicate by check mark whether the registrant is a shell company (as defined in Rule 12b-2 of the Exchange Act). Yes ☐ No ☒
Indicate the number of shares outstanding of each of the issuer’s classes of common stock, as of the latest practicable date:
Class Shares Outstanding as of April 16, 2021
Common stock, $0.001 par value per share 112,618,804
Table of Contents
TABLE OF CONTENTS
Page
PART I—FINANCIAL INFORMATION Item 1. Financial Statements............................................................................................................................ 3
Condensed Consolidated Balance Sheets as of March 31, 2021 and December 31, 2020............. 3Condensed Consolidated Statements of Comprehensive Income for the Three Months Ended March 31, 2021 and 2020................................................................................................................ 4Condensed Consolidated Statements of Stockholders’ Deficit for the Three Months Ended March 31, 2021 and 2020................................................................................................................ 5Condensed Consolidated Statements of Cash Flows for the Three Months Ended March 31, 2021 and 2020................................................................................................................................. 6Notes to Condensed Consolidated Financial Statements................................................................ 7
Item 2. Management’s Discussion and Analysis of Financial Condition and Results of Operations.............. 11Item 3. Quantitative and Qualitative Disclosures About Market Risk............................................................. 18Item 4. Controls and Procedures...................................................................................................................... 18
PART II—OTHER INFORMATIONItem 1. Legal Proceedings................................................................................................................................ 19Item 1A. Risk Factors......................................................................................................................................... 19Item 2. Unregistered Sales of Equity Securities and Use of Proceeds............................................................. 19Item 6. Exhibits................................................................................................................................................ 20Signatures.................................................................................................................................................................. 21
Table of Contents
2

PART I—FINANCIAL INFORMATION ITEM 1. FINANCIAL STATEMENTS
VERISIGN, INC.CONDENSED CONSOLIDATED BALANCE SHEETS
(In thousands, except par value)(Unaudited)
March 31,2021
December 31,2020
ASSETSCurrent assets:
Cash and cash equivalents................................................................................................... $ 246,811 $ 401,194 Marketable securities........................................................................................................... 934,365 765,713 Other current assets.............................................................................................................. 54,374 51,033
Total current assets....................................................................................................... 1,235,550 1,217,940 Property and equipment, net....................................................................................................... 241,136 245,571 Goodwill..................................................................................................................................... 52,527 52,527 Deferred tax assets...................................................................................................................... 67,577 67,914 Deposits to acquire intangible assets.......................................................................................... 145,000 145,000 Other long-term assets................................................................................................................ 41,108 37,958
Total long-term assets................................................................................................... 547,348 548,970 Total assets................................................................................................................... $ 1,782,898 $ 1,766,910
LIABILITIES AND STOCKHOLDERS’ DEFICITCurrent liabilities:
Accounts payable and accrued liabilities............................................................................. $ 201,463 $ 208,642 Deferred revenues................................................................................................................ 808,754 780,051
Total current liabilities.................................................................................................. 1,010,217 988,693 Long-term deferred revenues...................................................................................................... 290,288 282,838 Senior notes................................................................................................................................. 1,790,712 1,790,083 Long-term tax and other liabilities.............................................................................................. 95,441 95,494
Total long-term liabilities............................................................................................. 2,176,441 2,168,415 Total liabilities.............................................................................................................. 3,186,658 3,157,108
Commitments and contingenciesStockholders’ deficit:
Preferred stock—par value $.001 per share; Authorized shares: 5,000; Issued and outstanding shares: none...................................................................................................... — — Common stock and additional paid-in capital—par value $.001 per share; Authorized shares: 1,000,000; Issued shares: 354,025 at March 31, 2021 and 353,789 at December 31, 2020; Outstanding shares: 112,766 at March 31, 2021 and 113,470 at December 31, 2020..................................................................................................................................... 14,111,235 14,275,160 Accumulated deficit............................................................................................................. (15,512,248) (15,662,602) Accumulated other comprehensive loss.............................................................................. (2,747) (2,756)
Total stockholders’ deficit............................................................................................ (1,403,760) (1,390,198) Total liabilities and stockholders’ deficit..................................................................... $ 1,782,898 $ 1,766,910
See accompanying Notes to Condensed Consolidated Financial Statements.
Table of Contents
3

VERISIGN, INC.CONDENSED CONSOLIDATED STATEMENTS OF COMPREHENSIVE INCOME
(In thousands, except per share data)(Unaudited)
Three Months Ended March 31, 2021 2020Revenues..................................................................................................................................... $ 323,621 $ 312,524 Costs and expenses:
Cost of revenues................................................................................................................... 46,968 45,573 Sales and marketing............................................................................................................. 8,484 6,604 Research and development.................................................................................................. 20,311 17,358 General and administrative.................................................................................................. 37,451 36,725
Total costs and expenses............................................................................................... 113,214 106,260 Operating income........................................................................................................................ 210,407 206,264 Interest expense........................................................................................................................... (22,534) (22,535) Non-operating income, net.......................................................................................................... 444 7,084 Income before income taxes....................................................................................................... 188,317 190,813 Income tax (expense) benefit...................................................................................................... (37,963) 143,303 Net income.................................................................................................................................. 150,354 334,116 Other comprehensive income...................................................................................................... 9 2,263 Comprehensive income............................................................................................................... $ 150,363 $ 336,379
Earnings per share:Basic..................................................................................................................................... $ 1.33 $ 2.87 Diluted................................................................................................................................. $ 1.33 $ 2.86
Shares used to compute earnings per shareBasic..................................................................................................................................... 113,131 116,375 Diluted................................................................................................................................. 113,296 116,730
See accompanying Notes to Condensed Consolidated Financial Statements.
Table of Contents
4

VERISIGN, INC.CONDENSED CONSOLIDATED STATEMENTS OF STOCKHOLDERS’ DEFICIT
(In thousands)(Unaudited)
Three Months Ended March 31,2021 2020
Total stockholders’ deficit, beginning of period......................................................................... $ (1,390,198) $ (1,490,100)
Common stock and additional paid-in capitalBeginning balance................................................................................................................ 14,275,160 14,990,011
Repurchase of common stock.......................................................................................... (185,414) (275,623) Stock-based compensation expense................................................................................ 13,388 11,934 Issuance of common stock under stock plans................................................................. 8,101 8,296
Balance, end of period......................................................................................................... 14,111,235 14,734,618
Accumulated deficitBeginning balance................................................................................................................ (15,662,602) (16,477,490)
Net income...................................................................................................................... 150,354 334,116 Balance, end of period......................................................................................................... (15,512,248) (16,143,374)
Accumulated other comprehensive lossBeginning balance................................................................................................................ (2,756) (2,621)
Other comprehensive income.......................................................................................... 9 2,263 Balance, end of period......................................................................................................... (2,747) (358)
Total stockholders’ deficit, end of period................................................................................... $ (1,403,760) $ (1,409,114)
See accompanying Notes to Condensed Consolidated Financial Statements.
Table of Contents
5
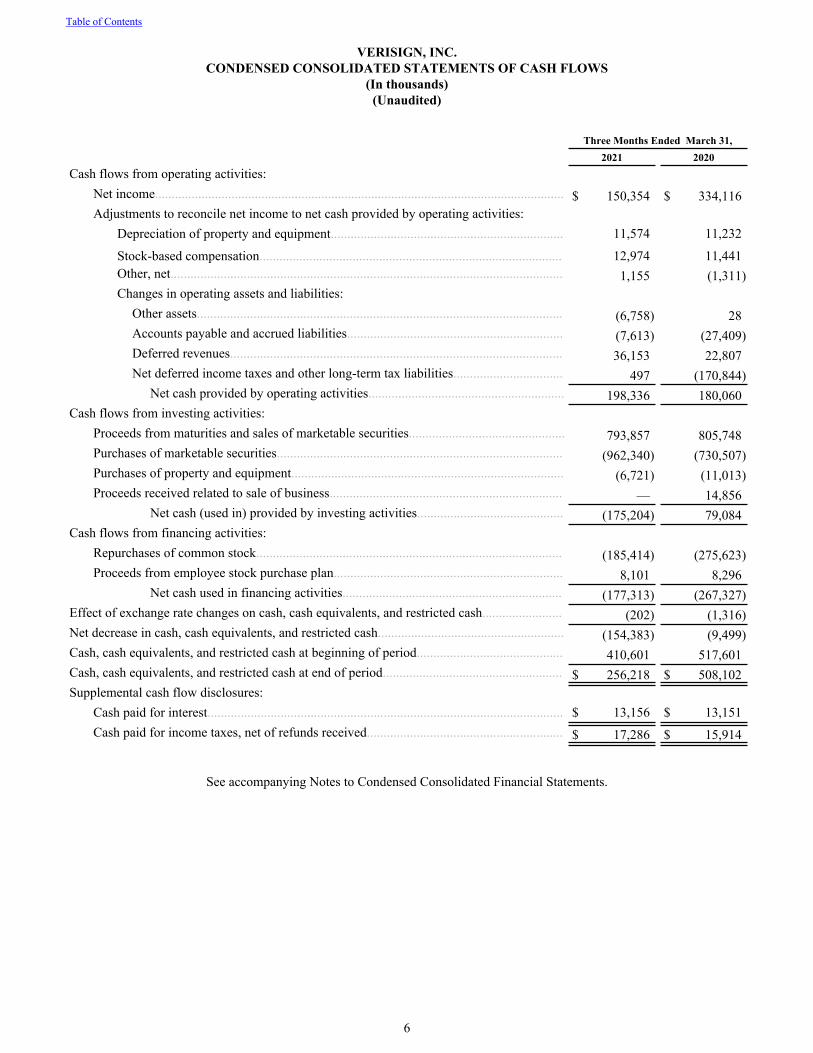
VERISIGN, INC.CONDENSED CONSOLIDATED STATEMENTS OF CASH FLOWS
(In thousands)(Unaudited)
Three Months Ended March 31, 2021 2020Cash flows from operating activities:
Net income........................................................................................................................... $ 150,354 $ 334,116 Adjustments to reconcile net income to net cash provided by operating activities:
Depreciation of property and equipment...................................................................... 11,574 11,232
Stock-based compensation........................................................................................... 12,974 11,441 Other, net...................................................................................................................... 1,155 (1,311) Changes in operating assets and liabilities:
Other assets.............................................................................................................. (6,758) 28 Accounts payable and accrued liabilities................................................................. (7,613) (27,409) Deferred revenues.................................................................................................... 36,153 22,807 Net deferred income taxes and other long-term tax liabilities................................. 497 (170,844)
Net cash provided by operating activities........................................................... 198,336 180,060 Cash flows from investing activities:
Proceeds from maturities and sales of marketable securities............................................... 793,857 805,748 Purchases of marketable securities...................................................................................... (962,340) (730,507) Purchases of property and equipment.................................................................................. (6,721) (11,013) Proceeds received related to sale of business...................................................................... — 14,856
Net cash (used in) provided by investing activities............................................ (175,204) 79,084 Cash flows from financing activities:
Repurchases of common stock............................................................................................ (185,414) (275,623) Proceeds from employee stock purchase plan..................................................................... 8,101 8,296
Net cash used in financing activities.................................................................. (177,313) (267,327) Effect of exchange rate changes on cash, cash equivalents, and restricted cash........................ (202) (1,316) Net decrease in cash, cash equivalents, and restricted cash........................................................ (154,383) (9,499) Cash, cash equivalents, and restricted cash at beginning of period............................................ 410,601 517,601 Cash, cash equivalents, and restricted cash at end of period...................................................... $ 256,218 $ 508,102 Supplemental cash flow disclosures:
Cash paid for interest........................................................................................................... $ 13,156 $ 13,151 Cash paid for income taxes, net of refunds received........................................................... $ 17,286 $ 15,914
See accompanying Notes to Condensed Consolidated Financial Statements.
Table of Contents
6

VERISIGN, INC.NOTES TO CONDENSED CONSOLIDATED FINANCIAL STATEMENTS
(Unaudited)Note 1. Basis of Presentation
Interim Financial StatementsThe accompanying unaudited Condensed Consolidated Financial Statements have been prepared by VeriSign, Inc.
(“Verisign” or the “Company”) in accordance with the instructions to Form 10-Q pursuant to the rules and regulations of the Securities and Exchange Commission (“SEC”) and, therefore, do not include all information and notes normally provided in audited financial statements. In the opinion of management, all adjustments (consisting of normal recurring accruals and other adjustments) considered necessary for a fair presentation have been included. The results of operations for any interim period are not necessarily indicative of, nor comparable to, the results of operations for any other interim period or for a full fiscal year. These unaudited Condensed Consolidated Financial Statements should be read in conjunction with the Consolidated Financial Statements and related notes contained in Verisign’s Annual Report on Form 10-K for the year ended December 31, 2020 (the “2020 Form 10-K”) filed with the SEC on February 19, 2021.
Note 2. Financial Instruments
Cash, Cash Equivalents, and Marketable SecuritiesThe following table summarizes the Company’s cash, cash equivalents, and marketable securities and the fair value
categorization of the financial instruments measured at fair value on a recurring basis:
March 31, December 31,2021 2020
(In thousands)Cash..................................................................................................................................... $ 26,199 $ 28,832 Time deposits....................................................................................................................... 3,760 4,176 Money market funds (Level 1)............................................................................................ 226,259 129,627 Debt securities issued by the U.S. Treasury (Level 1)........................................................ 934,365 1,013,679
Total............................................................................................................................. $ 1,190,583 $ 1,176,314
Cash and cash equivalents................................................................................................... $ 246,811 $ 401,194 Restricted cash (included in Other long-term assets).......................................................... 9,407 9,407
Total Cash, cash equivalents, and restricted cash........................................................ 256,218 410,601 Marketable securities........................................................................................................... 934,365 765,713
Total............................................................................................................................. $ 1,190,583 $ 1,176,314
The fair value of the debt securities held as of March 31, 2021, included less than $0.1 million of gross and net unrealized gains. All of the debt securities held as of March 31, 2021 are scheduled to mature in less than one year.
Fair Value Measurements
The fair value of the Company’s investments in money market funds approximates their face value. Such instruments are included in Cash and cash equivalents. The fair value of the debt securities consisting of U.S. Treasury bills is based on their quoted market prices. Debt securities purchased with original maturities in excess of three months are included in Marketable securities. The fair value of all of these financial instruments are classified as Level 1 in the fair value hierarchy.
The Company’s other financial instruments include cash, accounts receivable, restricted cash, and accounts payable. As of March 31, 2021, the carrying value of these financial instruments approximated their fair value. The fair values of the senior notes due 2023, 2025, and 2027 were $753.1 million, $563.8 million, and $584.3 million, respectively, as of March 31, 2021. The fair values of these debt instruments are based on available market information from public data sources and are classified as Level 2.
Table of Contents
7

Note 3. Selected Balance Sheet ItemsOther Current Assets
Other current assets consist of the following:
March 31, December 31,2021 2020
(In thousands)Prepaid registry fees............................................................................................................ $ 23,532 $ 22,654 Prepaid expenses................................................................................................................. 22,996 17,920 Accounts receivable, net...................................................................................................... 5,135 4,642 Taxes receivable.................................................................................................................. 1,180 3,572 Other.................................................................................................................................... 1,531 2,245
Total other current assets.............................................................................................. $ 54,374 $ 51,033
Other Long-Term Assets
Other long-term assets consist of the following:
March 31, December 31,
2021 2020
(In thousands)
Operating lease right-of-use asset........................................................................................ $ 10,979 $ 11,277 Long-term prepaid expenses................................................................................................ 10,368 7,105 Restricted cash..................................................................................................................... 9,407 9,407 Long-term prepaid registry fees.......................................................................................... 8,231 7,997 Other tax receivable............................................................................................................. 969 969 Other.................................................................................................................................... 1,154 1,203
Total other long-term assets......................................................................................... $ 41,108 $ 37,958
The current and long-term prepaid registry fees in the tables above relate to the fees the Company pays to Internet Corporation for Assigned Names and Numbers (“ICANN”) for each annual increment of .com domain name registrations and renewals which are deferred and amortized over the domain name registration term. The amount of prepaid registry fees as of March 31, 2021 reflects amortization of $9.3 million during the three months ended March 31, 2021 which was recorded in Cost of Revenues.
Accounts Payable and Accrued Liabilities
Accounts payable and accrued liabilities consist of the following:
March 31, December 31,2021 2020
(In thousands)
Accounts payable and accrued expenses............................................................................. $ 11,253 $ 12,340 Customer deposits............................................................................................................... 46,595 53,631 Taxes payable and other tax liabilities................................................................................ 45,227 27,194 Interest payable.................................................................................................................... 33,105 24,408 Accrued employee compensation........................................................................................ 32,789 54,596 Accrued registry fees........................................................................................................... 14,481 13,090 Customer incentives payable............................................................................................... 8,473 12,556 Other accrued liabilities....................................................................................................... 9,540 10,827
Total accounts payable and accrued liabilities............................................................. $ 201,463 $ 208,642
Table of Contents
8

Customer deposits primarily relate to advance payments to cover domain name registration activity by registrars. Taxes payable and other tax liabilities reflect amounts accrued for the income tax provision and payments made during the period. Interest payable varies at each period-end based on the payment due dates for each Senior Note issuance. Accrued employee compensation primarily consists of liabilities for employee leave, salaries, payroll taxes, employee contributions to the employee stock purchase plan, and incentive compensation. Accrued employee incentive compensation as of December 31, 2020, was paid during the three months ended March 31, 2021. Customer incentives payable includes amounts related to rebates and marketing programs payable to registrars. These amounts may vary from period to period due to the timing of payments.
Note 4. Stockholders’ Deficit
Effective February 11, 2021, the Company’s Board of Directors authorized the repurchase of its common stock in the amount of $747.0 million, in addition to the $253.0 million that remained available for repurchases under the share repurchase program, for a total repurchase authorization of up to $1.00 billion under the program. The program has no expiration date. Purchases made under the program could be effected through open market transactions, block purchases, accelerated share repurchase agreements or other negotiated transactions. During the three months ended March 31, 2021, the Company repurchased 0.9 million shares of its common stock at an average stock price of $197.02. The aggregate cost of the repurchases in the three months ended March 31, 2021 was $172.6 million. As of March 31, 2021, there was approximately $910.0 million remaining available for future share repurchases under the share repurchase program.
During the three months ended March 31, 2021, the Company placed 0.1 million shares, at an average stock price of $200.10, and for an aggregate cost of $12.8 million, into treasury stock for purposes related to tax withholding upon vesting of Restricted Stock Units (“RSUs”).
Since inception, the Company has repurchased 241.3 million shares of its common stock for an aggregate cost of $11.17 billion, which is presented as a reduction of Additional paid-in capital.
Note 5. Calculation of Earnings per Share The following table presents the computation of weighted-average shares used in the calculation of basic and diluted
earnings per share:
Three Months Ended March 31, 2021 2020 (In thousands)Weighted-average shares of common stock outstanding.................................................... 113,131 116,375Weighted-average potential shares of common stock outstanding:
Unvested RSUs and ESPP............................................................................................ 165 355Shares used to compute diluted earnings per share............................................................. 113,296 116,730
The calculation of diluted weighted average shares outstanding excludes performance-based RSUs granted by the Company for which the relevant performance criteria have not been achieved. The number of potential shares excluded from the calculation was not significant in any period presented.
Note 6. Revenues
The Company generates revenues in the U.S.; Europe, the Middle East and Africa (“EMEA”); China; and certain other countries, including Canada, Australia, and Japan.
The following table presents our revenues disaggregated by geography, based on the billing addresses of our customers:
Three Months Ended March 31,2021 2020
(In thousands)U.S....................................................................................................................................... $ 207,062 $ 197,503 EMEA.................................................................................................................................. 56,388 52,105 China.................................................................................................................................... 25,432 30,187 Other.................................................................................................................................... 34,739 32,729
Total revenues.............................................................................................................. $ 323,621 $ 312,524
Table of Contents
9
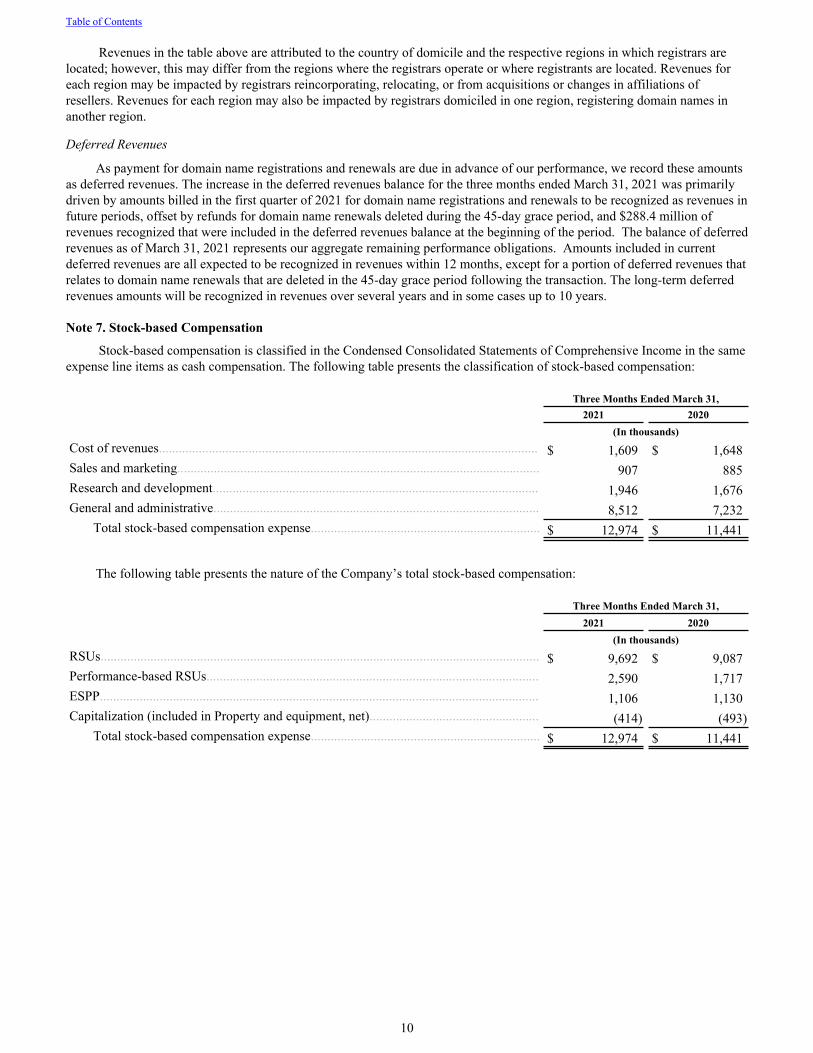
Revenues in the table above are attributed to the country of domicile and the respective regions in which registrars are located; however, this may differ from the regions where the registrars operate or where registrants are located. Revenues for each region may be impacted by registrars reincorporating, relocating, or from acquisitions or changes in affiliations of resellers. Revenues for each region may also be impacted by registrars domiciled in one region, registering domain names in another region.
Deferred Revenues
As payment for domain name registrations and renewals are due in advance of our performance, we record these amounts as deferred revenues. The increase in the deferred revenues balance for the three months ended March 31, 2021 was primarily driven by amounts billed in the first quarter of 2021 for domain name registrations and renewals to be recognized as revenues in future periods, offset by refunds for domain name renewals deleted during the 45-day grace period, and $288.4 million of revenues recognized that were included in the deferred revenues balance at the beginning of the period. The balance of deferred revenues as of March 31, 2021 represents our aggregate remaining performance obligations. Amounts included in current deferred revenues are all expected to be recognized in revenues within 12 months, except for a portion of deferred revenues that relates to domain name renewals that are deleted in the 45-day grace period following the transaction. The long-term deferred revenues amounts will be recognized in revenues over several years and in some cases up to 10 years.
Note 7. Stock-based Compensation
Stock-based compensation is classified in the Condensed Consolidated Statements of Comprehensive Income in the same expense line items as cash compensation. The following table presents the classification of stock-based compensation:
Three Months Ended March 31,
2021 2020 (In thousands)Cost of revenues.................................................................................................................. $ 1,609 $ 1,648 Sales and marketing............................................................................................................. 907 885 Research and development.................................................................................................. 1,946 1,676 General and administrative.................................................................................................. 8,512 7,232
Total stock-based compensation expense..................................................................... $ 12,974 $ 11,441
The following table presents the nature of the Company’s total stock-based compensation:
Three Months Ended March 31,2021 2020
(In thousands)RSUs.................................................................................................................................... $ 9,692 $ 9,087 Performance-based RSUs.................................................................................................... 2,590 1,717 ESPP.................................................................................................................................... 1,106 1,130 Capitalization (included in Property and equipment, net)................................................... (414) (493)
Total stock-based compensation expense..................................................................... $ 12,974 $ 11,441
Table of Contents
10

Note 8. Non-operating Income, Net
The following table presents the components of Non-operating income, net:
Three Months Ended March 31,2021 2020
(In thousands)
Interest income.................................................................................................................... $ 216 $ 4,421 Transition services income.................................................................................................. — 2,100 Other, net............................................................................................................................. 228 563
Total non-operating income, net.................................................................................. $ 444 $ 7,084 The lower interest income during the three months ended March 31, 2021 reflects a decline in interest rates on our
investments in debt securities. The transition services income in 2020 relates to the divested security services business. The transition services agreement ended in February 2020.
Note 9. Income Taxes
The following table presents Income tax expense (benefit) and the effective tax rate:
Three Months Ended March 31, 2021 2020 (Dollars in thousands)
Income tax expense (benefit)............................................................................................... $ 37,963 $ (143,303) Effective tax rate.................................................................................................................. 20 % (75) %
The effective tax rate for the three months ended March 31, 2021 was lower than the statutory federal rate of 21% primarily due to a lower effective tax rate on foreign income, partially offset by state income taxes. The effective tax rate for the three months ended March 31, 2020 was lower than the statutory federal rate of 21% primarily due to the remeasurement of unrecognized tax benefits discussed below, a lower effective tax rate on foreign income, and $11.8 million of excess tax benefits related to stock-based compensation, partially offset by state income taxes.
During the three months ended March 31, 2020, the Company remeasured its previously unrecognized income tax benefits relating to the worthless stock deduction taken in 2013. The remeasurement, which resulted in the recognition of a $167.8 million benefit in the quarter, was based on Internal Revenue Service (“IRS”) written confirmation indicating no examination adjustment would be proposed. Notwithstanding this written confirmation, the Company’s U.S. federal income tax returns remain under examination by the IRS for 2010 through 2014.
ITEM 2. MANAGEMENT’S DISCUSSION AND ANALYSIS OF FINANCIAL CONDITION AND RESULTS OF OPERATIONS
You should read the following discussion in conjunction with the 2020 Form 10-K and the interim unaudited Condensed Consolidated Financial Statements and related notes included in Part I, Item I of this Quarterly Report on Form 10-Q.
This Quarterly Report on Form 10-Q contains forward-looking statements within the meaning of Section 27A of the Securities Act of 1933, as amended, and Section 21E of the Securities Exchange Act of 1934, as amended (the “Exchange Act”). These forward-looking statements are based on current expectations and assumptions and involve risks and uncertainties, including, among other things, statements regarding our expectations about (i) the impact from the effects of the COVID-19 pandemic, (ii) the rate of growth in revenues for the remainder of 2021, (iii) Cost of revenues, Sales and marketing expenses, Research and development expenses, General and administrative expenses, quarterly Interest expense, and quarterly Non-operating income, net, for the remainder of 2021, (iv) our annual effective tax rate for 2021, and (v) the sufficiency of our existing cash, cash equivalents and marketable securities, and funds generated from operations, together with our borrowing capacity under the unsecured revolving credit facility. Forward-looking statements include, among others, those statements including the words “expects,” “anticipates,” “intends,” “believes” and similar language. Our actual results may differ significantly from those projected in the forward-looking statements. Factors that might cause or contribute to such differences include, but are not limited to, those discussed in the section titled “Risk Factors” in Part I, Item 1A of the 2020 Form 10-K. You should also carefully review the risks described in other documents we file from time to time with the Securities and Exchange Commission, including the Quarterly Reports on Form 10-Q or Current Reports on Form 8-K that we file in 2021. You are cautioned not to place undue reliance on the forward-looking statements, which speak only as of the date of this Quarterly Report on Form 10-Q. We undertake no obligation to update publicly or revise such statements, whether as a result of new information, future events, or otherwise, except as required by law.
Table of Contents
11
For purposes of this Quarterly Report on Form 10-Q, the terms “Verisign,” “the Company,” “we,” “us,” and “our” refer to VeriSign, Inc. and its consolidated subsidiaries.
Overview
We are a global provider of domain name registry services and internet infrastructure, enabling internet navigation for many of the world’s most recognized domain names. We enable the security, stability, and resiliency of key internet infrastructure and services, including providing root zone maintainer services, operating two of the 13 global internet root servers, and providing registration services and authoritative resolution for the .com and .net top-level domains (“TLDs”), which support the majority of global e-commerce.
As of March 31, 2021, we had 168.0 million .com and .net registrations in the domain name base. The number of domain names registered is largely driven by continued growth in online advertising, e-commerce, and the number of internet users, which is partially driven by greater availability of internet access, as well as marketing activities carried out by us and our registrars. Growth in the number of domain name registrations under our management may be hindered by certain factors, including overall economic conditions, competition from country code top-level domains (“ccTLDs”), other generic top-level domains (“gTLDs”), services that offer alternatives for an online presence, such as social media, and ongoing changes in the internet practices and behaviors of consumers and businesses. Factors such as the evolving practices and preferences of internet users, and how they navigate the internet, as well as the motivation of domain name registrants and how they will manage their investment in domain names, can negatively impact our business and the demand for new domain name registrations and renewals.
Business Highlights and Trends
• We recorded revenues of $323.6 million during the three months ended March 31, 2021, an increase of 4% compared to the same period in 2020.
• We recorded operating income of $210.4 million during the three months ended March 31, 2021, an increase of 2% compared to the same period in 2020.
• As of March 31, 2021, we had 168.0 million .com and .net registrations in the domain name base, which represents a 5% increase from March 31, 2020, and a net increase of 2.8 million domain name registrations from December 31, 2020.
• During the three months ended March 31, 2021, we processed 11.6 million new domain name registrations for .com and .net compared to 10.0 million for the same period in 2020.
• The final .com and .net renewal rate for the fourth quarter of 2020 was 73.5% compared to 73.8% for the fourth quarter of 2019. Renewal rates are not fully measurable until 45 days after the end of the quarter.
• During the three months ended March 31, 2021, we repurchased 0.9 million shares of our common stock for an aggregate cost of $172.6 million. As of March 31, 2021, there was approximately $910.0 million remaining available for future share repurchases under our share repurchase program.
• We generated cash flows from operating activities of $198.3 million during the three months ended March 31, 2021, compared to $180.1 million for the same period in 2020.
• On February 11, 2021, we announced that we will increase the annual registry-level wholesale fee for each new and renewal .com domain name registration from $7.85 to $8.39, effective September 1, 2021.
Pursuant to our agreements with the Internet Corporation for Assigned Names and Numbers (“ICANN”), we make available files containing all active domain names registered in the .com and .net registries. Further, we also make available a summary of the active zone count registered in the .com and .net registries and the number of .com and .net domain name registrations in the domain name base. The zone counts and information on how to obtain access to the zone files can be found at https://www.Verisign.com/zone. The domain name base is the active zone plus the number of domain names that are registered but not configured for use in the respective top-level domain zone file plus the number of domain names that are in a client or server hold status. The domain name base may also reflect compensated or uncompensated judicial or administrative actions to add or remove from the active zone an immaterial number of domain names. These files and the related summary data are updated at least once per day. The update times may vary each day. The number of domain names provided in this Form 10-Q are as of midnight of the date reported.
Table of Contents
12

COVID-19 Update
The United States and the global community we serve are facing unprecedented challenges posed by the COVID-19 pandemic. In response to the pandemic, we have established a task force to monitor the pandemic and have taken a number of actions to protect our employees, including restricting travel, modifying our sick leave policy to encourage quarantine and isolation when warranted, and directing most of our employees to work from home. We have implemented our readiness plans, which include the ability to maintain critical internet infrastructure with most employees working remotely. We believe that the effects of the pandemic to date have led to an increase in the demand for domain names, particularly as businesses and entrepreneurs have been seeking to establish or expand their presence online in response to the pandemic. Our revenues continued to grow during 2020 and the first quarter of 2021 primarily driven by an increase in the domain name base for the .com TLD; however, the situation remains uncertain and hard to predict. The broader implications of the pandemic on our business and operations and our financial results, including the extent to which the effects of the pandemic will impact future growth in the domain name base, remain uncertain. The duration and severity of the economic disruptions from the pandemic may ultimately result in negative impacts on our business and operations, results of operations, financial condition, cash flows, liquidity and capital and financial resources. Because fees for domain name registrations and renewals are generally due at the time of registration or renewal and revenues from such registrations and renewals are recognized ratably over their terms, the effects of the pandemic may not be fully reflected in our results of operations until future periods. For further discussion, see “Risk Factors – The effects of the COVID-19 pandemic have impacted how we operate our business, and the extent to which the effects of the pandemic will impact our business, operations, financial condition and results of operations remains uncertain” in Part 1, Item 1A of the 2020 Form 10-K.
Results of Operations
The following table presents information regarding our results of operations as a percentage of revenues:
Three Months Ended March 31, 2021 2020Revenues.............................................................................................................................. 100.0 % 100.0 %Costs and expenses:
Cost of revenues........................................................................................................... 14.5 14.6 Sales and marketing..................................................................................................... 2.6 2.1 Research and development........................................................................................... 6.3 5.6 General and administrative........................................................................................... 11.6 11.7
Total costs and expenses....................................................................................... 35.0 34.0 Operating income................................................................................................................ 65.0 66.0 Interest expense................................................................................................................... (7.0) (7.2) Non-operating income, net.................................................................................................. 0.2 2.3 Income before income taxes................................................................................................ 58.2 61.1 Income tax (expense) benefit............................................................................................... (11.7) 45.8 Net income........................................................................................................................... 46.5 % 106.9 %
Revenues
Our revenues are primarily derived from registrations for domain names in the .com and .net domain name registries. We also derive revenues from operating domain name registries for several other TLDs and from providing back-end registry services to a number of TLD registry operators, all of which are not significant in relation to our consolidated revenues. For domain names registered in the .com and .net registries we receive a fee from registrars per annual registration that is determined pursuant to our agreements with ICANN. Individual customers, called registrants, contract directly with registrars or their resellers, and the registrars in turn register the domain names with Verisign. Changes in revenues are driven largely by changes in the number of new domain name registrations and the renewal rate for existing registrations as well as the impact of new and prior price increases, to the extent permitted by ICANN and the Department of Commerce (“DOC”). New registrations and the renewal rate for existing registrations are impacted by continued growth in online advertising, e-commerce, and the number of internet users, as well as marketing activities carried out by us and our registrars. We also offer promotional incentive-based discount programs to registrars based upon market conditions and the business environment in which the registrars operate.
The annual fee for a .com domain name registration has been fixed at $7.85 since 2012. On October 26, 2018, Verisign and the DOC amended the Cooperative Agreement. The amendment, among other items, extends the term of the Cooperative Agreement until November 30, 2024 and permits the price of a .com domain name to be increased, subject to appropriate
Table of Contents
13

changes to the .com Registry Agreement, without further DOC approval, by up to 7% in each of the final four years of each six-year period beginning on October 26, 2018. On March 27, 2020, Verisign and ICANN amended the .com Registry Agreement (“Third .com Amendment”) that, among other items, incorporates these changes agreed to with the DOC to the pricing terms. On February 11, 2021, we announced that we will increase the annual registry-level wholesale fee for each new and renewal .com domain name registration from $7.85 to $8.39, effective September 1, 2021. We have the contractual right to increase the fees for .net domain name registrations by up to 10% each year during the term of our agreement with ICANN, through June 30, 2023. All fees paid to us for .com and .net registrations are in U.S. dollars.
A comparison of revenues is presented below:
Three Months Ended March 31,2021 % Change 2020
(Dollars in thousands)Revenues......................................................................................................... $ 323,621 4 % $ 312,524
The following table compares the .com and .net domain name registrations in the domain name base:
March 31, 2021 % Change March 31, 2020
.com and .net domain name registrations in the domain name base................ 168.0 million 5 % 160.7 million
Revenues increased by $11.1 million during the three months ended March 31, 2021, as compared to the same period last year, primarily due to an increase in revenues from the operation of the registry for the .com TLD driven by a 5% increase in the domain name base for .com.
Growth in the domain name base has been primarily driven by continued internet growth and marketing activities carried out by us and our registrars. However, competitive pressure from ccTLDs, other gTLDs, services that offer alternatives for an online presence, such as social media, ongoing changes in internet practices and behaviors of consumers and business, as well as the motivation of existing domain name registrants managing their investment in domain names, and historical global economic uncertainty, has limited the rate of growth of the domain name base in recent years and may do so in the remainder of 2021 and beyond.
We expect the rate of growth in revenues will remain consistent during the remainder of 2021 compared to the three months ended March 31, 2021, as a result of continued growth in the aggregate number of .com domain names and the impact of the price increase for .com domain names which becomes effective September 1, 2021.
Geographic revenues
We generate revenues in the U.S.; Europe, the Middle East and Africa (“EMEA”); China; and certain other countries, including Canada, Australia, and Japan.
The following table presents a comparison of our geographic revenues:
Three Months Ended March 31,2021 % Change 2020
(Dollars in thousands)U.S....................................................................................................................................... $ 207,062 5 % $ 197,503 EMEA.................................................................................................................................. 56,388 8 % 52,105 China.................................................................................................................................... 25,432 (16) % 30,187 Other.................................................................................................................................... 34,739 6 % 32,729
Total revenues.............................................................................................................. $ 323,621 $ 312,524
Revenues in the table above are attributed to the country of domicile and the respective regions in which our registrars are located; however, this may differ from the regions where the registrars operate or where registrants are located. Revenue growth for each region may be impacted by registrars reincorporating, relocating, or from acquisitions or changes in affiliations of resellers. Revenue growth for each region may also be impacted by registrars domiciled in one region, registering domain names in another region. During the three months ended March 31, 2021, revenues increased in all regions except China. Revenues from registrars based in China declined during the first quarter of 2021 as a result of lower new registrations and renewal rates in the country.
Table of Contents
14

Cost of revenues
Cost of revenues consist primarily of salaries and employee benefits expenses for our personnel who manage the operational systems, depreciation expenses, operational costs associated with the delivery of our services, fees paid to ICANN, customer support and training, costs of facilities and computer equipment used in these activities, telecommunications expense and allocations of indirect costs such as corporate overhead.
A comparison of Cost of revenues is presented below:
Three Months Ended March 31,2021 % Change 2020
(Dollars in thousands)Cost of revenues.................................................................................................................. $ 46,968 3 % $ 45,573
Cost of revenues increased by $1.4 million during the three months ended March 31, 2021, compared to the same period last year, due to a combination of individually insignificant factors. Salary and employee benefits expenses remained consistent as the functional realignment of some headcount to research and development in the first quarter of 2020 was offset by other headcount increases throughout the rest of 2020.
We expect Cost of revenues as a percentage of revenues to remain consistent during the remainder of 2021 compared to the three months ended March 31, 2021.
Sales and marketing
Sales and marketing expenses consist primarily of salaries and other personnel-related expenses, travel and related expenses, trade shows, costs of computer and communications equipment and support services, facilities costs, consulting fees, costs of marketing programs, such as online, television, radio, print and direct mail advertising costs, and allocations of indirect costs such as corporate overhead.
A comparison of Sales and marketing expenses is presented below:
Three Months Ended March 31,2021 % Change 2020
(Dollars in thousands)Sales and marketing............................................................................................................. $ 8,484 28 % $ 6,604
Sales and marketing expenses increased by $1.9 million during the three months ended March 31, 2021, compared to the same period last year, primarily due to an increase in expenses related to marketing campaigns in various regions.
We expect Sales and marketing expenses as a percentage of revenues to remain consistent during the remainder of 2021, compared to the three months ended March 31, 2021.
Research and development
Research and development expenses consist primarily of costs related to research and development personnel, including salaries and other personnel-related expenses, consulting fees, facilities costs, computer and communications equipment, support services used in our service and technology development, and allocations of indirect costs such as corporate overhead.
A comparison of Research and development expenses is presented below:
Three Months Ended March 31,2021 % Change 2020
(Dollars in thousands)Research and development.................................................................................................. $ 20,311 17 % $ 17,358
Research and development expenses increased by $3.0 million during the three months ended March 31, 2021, compared to the same period last year, primarily due to a $2.1 million increase in salary and employee benefits expenses, including stock-based compensation, resulting from the functional realignment of some headcount from cost of revenues during the first quarter of 2020.
We expect Research and development expenses as a percentage of revenues to remain consistent during the remainder of 2021 compared to the three months ended March 31, 2021.
Table of Contents
15

General and administrative
General and administrative expenses consist primarily of salaries and other personnel-related expenses for our executive, administrative, legal, finance, information technology and human resources personnel, costs of facilities, computer and communications equipment, management information systems, support services, professional services fees, and certain tax and license fees, offset by allocations of indirect costs such as facilities and shared services expenses to other cost types.
A comparison of General and administrative expenses is presented below:
Three Months Ended March 31,2021 % Change 2020
(Dollars in thousands)
General and administrative.................................................................................................. $ 37,451 2 % $ 36,725
General and administrative expenses increased by $0.7 million during the three months ended March 31, 2021, compared to the same period last year, due to a $3.2 million increase in salary and employee benefits expenses, including stock-based compensation expenses, partially offset by a $2.0 million decrease in charitable contributions. The increase in salary and employee benefits expenses, including stock-based compensation expenses was due to an increase in average headcount. Stock-based compensation expenses also increased due to higher achievement levels on certain performance-based RSU grants. Charitable contributions decreased due to contributions made in the first quarter of 2020 to support the response to the COVID-19 pandemic.
We expect General and administrative expenses as a percentage of revenues to remain consistent during the remainder of 2021 compared to the three months ended March 31, 2021.
Interest expense
Interest expense remained consistent in the three months ended March 31, 2021 as compared to the same period last year. We expect quarterly Interest expense to remain consistent during the remainder of 2021 compared to the three months ended March 31, 2021.
Non-operating income, net
The following table presents the components of Non-operating income, net:
Three Months Ended March 31,2021 2020
(In thousands)
Interest income.................................................................................................................... $ 216 $ 4,421 Transition services income................................................................................................... — 2,100 Other, net............................................................................................................................. 228 563
Total non-operating income, net.................................................................................. $ 444 $ 7,084
Interest income decreased in the three months ended March 31, 2021 due to a decline in interest rates on our investments in debt securities. The transition services income in 2020 relates to the divested security services business. The transition services agreement ended in February 2020.
We expect quarterly Non-operating income, net to remain consistent during the remainder of 2021 compared to the three months ended March 31, 2021.
Income tax expense (benefit)
The following table presents Income tax expense (benefit) and the effective tax rate:
Three Months Ended March 31, 2021 2020 (Dollars in thousands)Income tax expense (benefit)............................................................................................... $ 37,963 $ (143,303) Effective tax rate.................................................................................................................. 20 % (75) %
The effective tax rate for the three months ended March 31, 2021 was lower than the statutory federal rate of 21% primarily due to a lower effective tax rate on foreign income, partially offset by state income taxes. The effective tax rate for the three months ended March 31, 2020 was lower than the statutory federal rate of 21% primarily due to the remeasurement of
Table of Contents
16

unrecognized tax benefits discussed below, a lower effective tax rate on foreign income, and $11.8 million of excess tax benefits related to stock-based compensation, partially offset by state income taxes.
During the three months ended March 31, 2020, we remeasured previously unrecognized income tax benefits relating to the worthless stock deduction taken in 2013. The remeasurement, which resulted in the recognition of a $167.8 million benefit in the quarter, was based on IRS written confirmation indicating no examination adjustment would be proposed. Notwithstanding this written confirmation, our U.S. federal income tax returns remain under examination by the IRS for 2010 through 2014.
We expect our annual effective tax rate for 2021 to be between 20% and 23%.
Liquidity and Capital Resources
The following table presents our principal sources of liquidity:
March 31, December 31,2021 2020
(In thousands)Cash and cash equivalents................................................................................................... $ 246,811 $ 401,194 Marketable securities........................................................................................................... 934,365 765,713
Total............................................................................................................................. $ 1,181,176 $ 1,166,907
The marketable securities primarily consist of debt securities issued by the U.S. Treasury meeting the criteria of our investment policy, which is focused on the preservation of our capital through investment in investment grade securities. The cash equivalents consist of amounts invested in money market funds, time deposits and U.S. Treasury bills purchased with original maturities of three months or less. As of March 31, 2021, all of our debt securities have contractual maturities of less than one year. Our cash and cash equivalents are readily accessible. For additional information on our investment portfolio, see Note 2, “Financial Instruments,” of our Notes to Condensed Consolidated Financial Statements in Part I, Item I of this Quarterly Report on Form 10-Q.
During the three months ended March 31, 2021, we repurchased 0.9 million shares of our common stock for an aggregate cost of $172.6 million. As of March 31, 2021, there was approximately $910.0 million remaining available for future share repurchases under the share repurchase program which has no expiration date.
As of March 31, 2021, we had $550.0 million principal amount outstanding of 4.75% senior unsecured notes due 2027, $500.0 million principal amount outstanding of 5.25% senior unsecured notes due 2025, and $750.0 million principal amount outstanding of 4.625% senior unsecured notes due 2023. As of March 31, 2021, there were no borrowings outstanding under our $200.0 million credit facility that will expire in 2024.
We believe existing cash, cash equivalents and marketable securities, and funds generated from operations, together with our borrowing capacity under the unsecured revolving credit facility should be sufficient to meet our working capital, capital expenditure requirements, and to service our debt for at least the next 12 months. We regularly assess our cash management approach and activities in view of our current and potential future needs.
In summary, our cash flows for the three months ended March 31, 2021 and 2020 were as follows:
Three Months Ended March 31, 2021 2020 (In thousands)Net cash provided by operating activities............................................................................ $ 198,336 $ 180,060 Net cash (used in) provided by investing activities............................................................. (175,204) 79,084 Net cash used in financing activities................................................................................... (177,313) (267,327) Effect of exchange rate changes on cash, cash equivalents, and restricted cash................. (202) (1,316)
Net decrease in cash, cash equivalents, and restricted cash......................................... $ (154,383) $ (9,499)
Cash flows from operating activities
Our largest source of operating cash flows is cash collections from our customers. Our primary uses of cash from operating activities are for personnel-related expenditures, and other general operating expenses, as well as payments related to taxes, interest and facilities.
Net cash provided by operating activities increased during the three months ended March 31, 2021, compared to the same period last year, primarily due to an increase in cash received from customers, partially offset by increases in cash paid to employees and vendors, and decreases in cash received from interest on investments and from transition services. Cash received
Table of Contents
17

from customers increased primarily due to higher domain name registrations and renewals. Cash paid to employees and vendors increased primarily due to the timing of payments and an increase in operating expenses. Cash received from interest on investments decreased due to a decline in interest rates. Cash received from transition services decreased due to the expiration of the transition services agreement related to our divested security services business in February 2020.
Cash flows from investing activities
The changes in cash flows from investing activities primarily relate to purchases, maturities and sales of marketable securities, purchases of property and equipment and the sale of businesses.
We had net cash outflows from investing activities in the three months ended March 31, 2021, compared to net cash inflows during the same period last year, primarily due to an increase in purchases of marketable securities, net of proceeds from maturities and sales of marketable securities as well as a payment received during the first quarter of 2020 related to our divested security services business, partially offset by a decrease in purchases of property and equipment.
Cash flows from financing activities
The changes in cash flows from financing activities primarily relate to share repurchases and our employee stock purchase plan.
Net cash used in financing activities decreased during the three months ended March 31, 2021, compared to the same period last year, primarily due to a decrease in share repurchases.
ITEM 3. QUANTITATIVE AND QUALITATIVE DISCLOSURES ABOUT MARKET RISK
There have been no significant changes in our market risk exposures since December 31, 2020.
ITEM 4. CONTROLS AND PROCEDURES
Evaluation of Disclosure Controls and Procedures
Based on our management’s evaluation, with the participation of our Chief Executive Officer (our principal executive officer) and our Chief Financial Officer (our principal financial officer), as of March 31, 2021, our principal executive officer and principal financial officer have concluded that our disclosure controls and procedures (as defined in Rules 13a-15(e) and 15d-15(e) under the Exchange Act) are effective to ensure that information required to be disclosed by us in reports that we file or submit under the Exchange Act is recorded, processed, summarized and reported within the time periods specified in SEC rules and forms and is accumulated and communicated to our management, including our principal executive officer and principal financial officer, as appropriate, to allow timely decisions regarding required disclosure.
Changes in Internal Control over Financial Reporting
There was no change in our internal control over financial reporting (as such term is defined in Rules 13a-15(f) and 15d-15(f) under the Exchange Act) during the three months ended March 31, 2021 that has materially affected, or is reasonably likely to materially affect, the Company’s internal control over financial reporting.
Inherent Limitations of Disclosure Controls and Internal Control over Financial Reporting
Because of their inherent limitations, our disclosure controls and procedures and our internal control over financial reporting may not prevent material errors or fraud. A control system, no matter how well conceived and operated, can provide only reasonable, not absolute, assurance that the objectives of the control system are met. The effectiveness of our disclosure controls and procedures and our internal control over financial reporting is subject to risks, including that the control may become inadequate because of changes in conditions or that the degree of compliance with our policies or procedures may deteriorate.
Table of Contents
18
PART II—OTHER INFORMATION
ITEM 1. LEGAL PROCEEDINGS
As previously disclosed, a subsidiary of Afilias plc (“Afilias”), a competitor and losing bidder in the .web auction, filed a form of arbitration proceeding against ICANN, an Independent Review Process (“IRP”) under ICANN’s bylaws, on November 14, 2018. Afilias alleges that the agreement between Verisign and Nu Dotco, LLC (“NDC”) pertaining to .web violated ICANN’s new gTLD Applicant Guidebook. As a result, Afilias claims that ICANN had a duty to disqualify NDC’s bid and award the .web gTLD to Afilias. Afilias also claims that ICANN would violate its bylaws pertaining to competition by awarding the .web gTLD to Verisign. Afilias amended its IRP request on March 21, 2019 in part to oppose Verisign’s and NDC’s participation in the IRP. A hearing was held on Verisign’s and NDC’s applications for participation and, on February 12, 2020, the IRP panel permitted Verisign and NDC to participate in aspects of the IRP. In early August 2020, the IRP panel held a hearing on Afilias’ claims. On April 7, 2021, the IRP panel formally declared the IRP hearing closed. Under the applicable arbitration rules, the IRP Panel should now issue a final decision within 60 days from this date.
We are also involved in various investigations, claims and lawsuits arising in the normal conduct of our business, none of which, in our opinion, will have a material adverse effect on our financial condition, results of operations, or cash flows. We cannot assure you that we will prevail in any litigation. Regardless of the outcome, any litigation may require us to incur significant litigation expense and may result in significant diversion of management attention.
ITEM 1A. RISK FACTORS
Our business, operating results, financial condition, reputation, cash flows or prospects can be materially adversely affected by a number of factors including but not limited to those described in Part I, Item 1A of the 2020 Form 10-K under the heading “Risk Factors.” In such case, the trading price of our common stock could decline and you could lose part or all of your investment. Additional risks and uncertainties not currently known to us or that we currently deem immaterial may also materially adversely affect our business, operating results, financial condition, reputation, cash flows and prospects. Actual results could differ materially from those projected in the forward-looking statements contained in this Form 10-Q as a result of the risk factors described in Part I, Item 1A of the 2020 Form 10-K and in other filings we make with the SEC. There have been no material changes to the Company’s risk factors since the 2020 Form 10-K.
ITEM 2. UNREGISTERED SALES OF EQUITY SECURITIES AND USE OF PROCEEDS
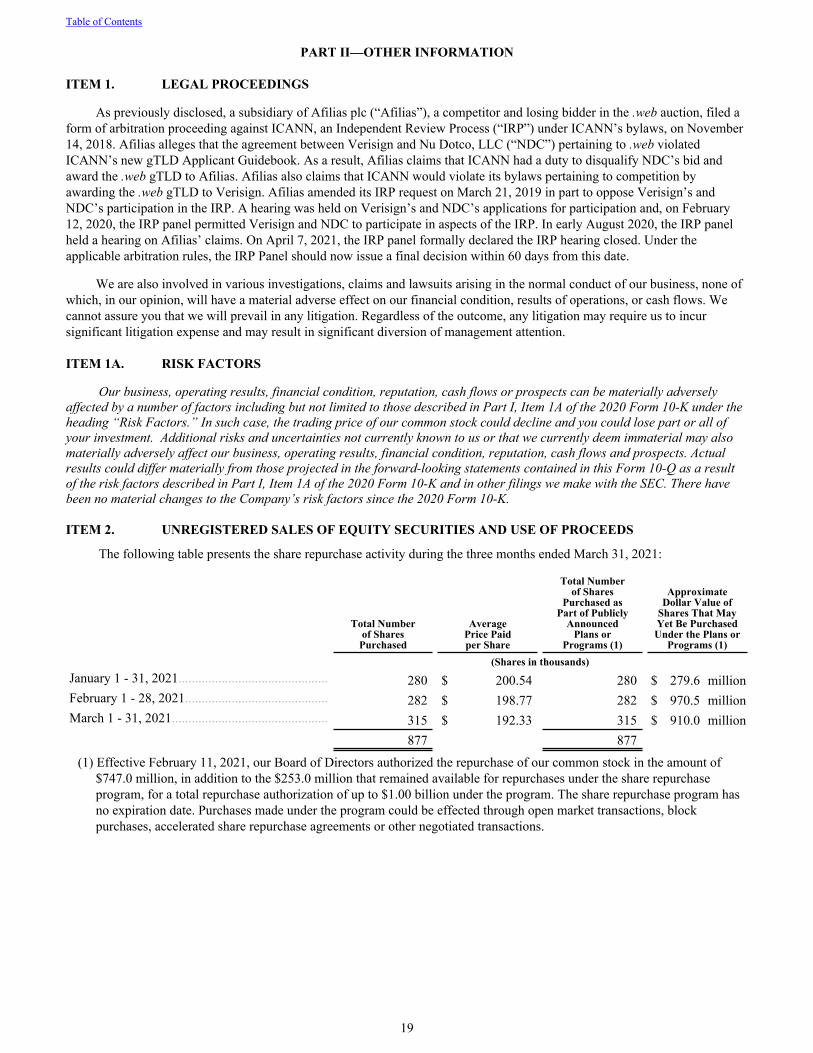
The following table presents the share repurchase activity during the three months ended March 31, 2021:
Total Numberof Shares
Purchased
AveragePrice Paidper Share
Total Numberof Shares
Purchased asPart of Publicly
AnnouncedPlans or
Programs (1)
ApproximateDollar Value of
Shares That MayYet Be PurchasedUnder the Plans or
Programs (1) (Shares in thousands)January 1 - 31, 2021............................................. 280 $ 200.54 280 $ 279.6 millionFebruary 1 - 28, 2021........................................... 282 $ 198.77 282 $ 970.5 millionMarch 1 - 31, 2021............................................... 315 $ 192.33 315 $ 910.0 million
877 877
(1) Effective February 11, 2021, our Board of Directors authorized the repurchase of our common stock in the amount of $747.0 million, in addition to the $253.0 million that remained available for repurchases under the share repurchase program, for a total repurchase authorization of up to $1.00 billion under the program. The share repurchase program has no expiration date. Purchases made under the program could be effected through open market transactions, block purchases, accelerated share repurchase agreements or other negotiated transactions.
Table of Contents
19

ITEM 6. EXHIBITS
As required under Item 6—Exhibits, the exhibits filed as part of this report are provided in this separate section. The exhibits included in this section are as follows:
ExhibitNumber Exhibit Description Incorporated by Reference
Form Date Number Filed Herewith
31.01 Certification of Principal Executive Officer pursuant to Exchange Act Rule 13a-14(a).
X
31.02 Certification of Principal Financial Officer pursuant to Exchange Act Rule 13a-14(a).
X
32.01 Certification of Principal Executive Officer pursuant to Exchange Act Rule 13a-14(b) and Section 1350 of Chapter 63 of Title 18 of the U.S. Code (18 U.S.C. 1350). *
X
32.02 Certification of Principal Financial Officer pursuant to Exchange Act Rule 13a-14(b) and Section 1350 of Chapter 63 of Title 18 of the U.S. Code (18 U.S.C. 1350). *
X
101 Interactive Data File. The instance document does not appear in the Interactive Data File because its XBRL tags are embedded within the Inline XBRL document.
X
104 Cover Page Interactive Data File (formatted as Inline XBRL and contained in Exhibit 101).
X
* As contemplated by SEC Release No. 33-8212, these exhibits are furnished with this Quarterly Report on Form 10-Q and are not deemed filed with the SEC and are not incorporated by reference in any filing of VeriSign, Inc. under the Securities Act of 1933 or the Securities Exchange Act of 1934, whether made before or after the date hereof and irrespective of any general incorporation language in such filings.
Table of Contents
20

SIGNATURES
Pursuant to the requirements of the Securities Exchange Act of 1934, the registrant has duly caused this report to be signed on its behalf by the undersigned thereunto duly authorized.
VERISIGN, INC.
Date: April 22, 2021 By: /S/ D. JAMES BIDZOS D. James Bidzos
Chief Executive Officer
Date: April 22, 2021 By: /S/ GEORGE E. KILGUSS, III George E. Kilguss, IIIChief Financial Officer
Table of Contents
21