for the year ended 30 june 2017 - aspenpharma.com · other commercial pharma brands * 14 020 13 811...
TRANSCRIPT

Annual Results PresentationFor the year ended 30 June 2017

Annual Results Presentation for the year ended 30 June 2017
Highlights
2
Delivery on guidance of strong H2 Revenue (R’ billion)
NHEPS (cents) Cashflow
Growth*CER
Growth
+16% +21%
+6% +7%
+27% +37%
Operating cash flow per share 1 421 cents
Operating profit to cash flow conversion rate
101%
109%
*Prior comparative period restated to prevailing average exchange rates
FY 2017
H2 2017
H1 2017
FY 2017
771.2
H1 2017
H2 2017
1,463.2
692.0
• Revenue growth even higher than H1
• Gross profit percentage impacted by increased anaesthesia
• NHEPS growth more in line with revenue
• Sustained improvements in working capital and operating cash flows
19.8
21.4
Growth*CER
Growth
+16% +22%
+13% +14%
+19% +31%
41.2
Annual Results Presentation for the year ended 30 June 2017
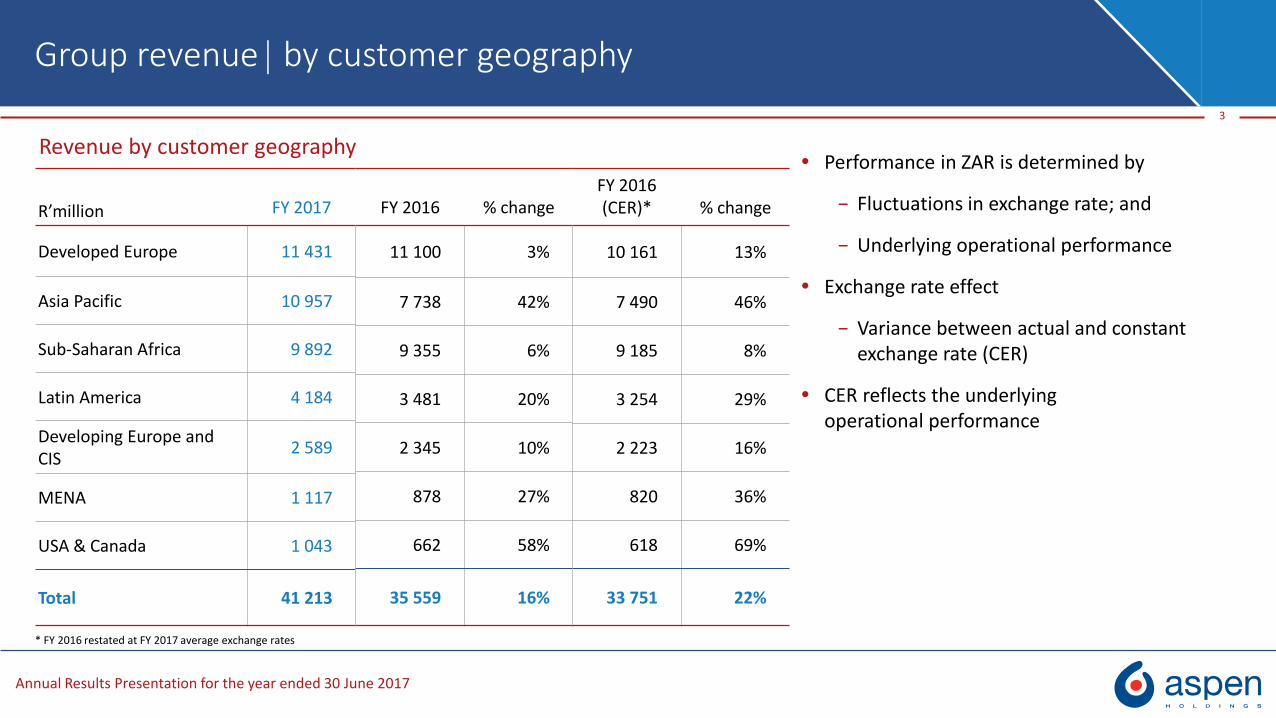
R’million FY 2017 FY 2016 % changeFY 2016(CER)* % change
Developed Europe 11 431 11 100 3% 10 161 13%
Asia Pacific 10 957 7 778 42% 7 490 46%
Sub-Saharan Africa 9 892 9 355 6% 9 185 8%
Latin America 4 184 3 481 20% 3 254 28%
Developing Europe and CIS
2 589 2 345 10% 2 223 16%
MENA 1 117 878 27% 820 36%
USA & Canada 1 043 662 58% 618 69%
Total 41 213 35 559 16% 33 751 22%
Group revenue by customer geography
3
Performance in ZAR is determined by
− Fluctuations in exchange rate; and
− Underlying operational performance
Exchange rate effect
− Variance between actual and constant exchange rate (CER)
CER reflects the underlying operational performance
Revenue by customer geography
* FY 2016 restated at FY 2017 average exchange rates
FY 2016 % change
11 100 3%
7 738 42%
9 355 6%
3 481 20%
2 345 10%
878 27%
662 58%
35 559 16%
FY 2016(CER)* % change
10 161 13%
7 490 46%
9 185 8%
3 254 29%
2 223 16%
820 36%
618 69%
33 751 22%

Annual Results Presentation for the year ended 30 June 2017
R’million FY 2017 FY 2016 % change FY 2016 (CER) % change
Commercial Pharma 31 437 25 403 24% 24 240 30%
Anaesthetics* 7 065 114 >100% 114 >100%
Thrombosis* 5 665 6 448 -12% 5 989 -5%
High Potency & Cytotoxics* 4 687 5 030 -7% 4 696 0%
Other Commercial Pharma Brands * 14 020 13 811 2% 13 441 4%
Nutritionals 3 224 3 516 -8% 3 331 -3%
Manufacturing 6 552 6 640 -1% 6 180 6%
- API 4 411 4 365 1% 4 041 9%
- FDF 2 141 2 275 -6% 2 139 0%
Total Revenue 41 213 35 559 16% 33 751 22%
FY 2016 (CER) % change
24 240 30%
114 >100%
5 989 -5%
4 696 0%
13 441 4%
3 331 -3%
6 180 6%
4 041 9%
2 139 0%
33 751 22%
Group revenue by business segment
4
Revenue by business segment
* Therapeutic focused brands* Other Commercial Pharma Brands are largely domestic brands
The evolution of AspenCommercial Pharma• Geographic diversity• Product portfolioManufacturing Capacity and Capability• Finished Dose Form• API

Annual Results Presentation for the year ended 30 June 2017
FY 2000
6
Commercial Pharma geographic diversity
FY 2013 FY 2017
South Africa only
Predominantly SA and Australia
Global Multinational
Sales R1.0 billion Sales R18.6 billion Sales R31.4 billionSouth Africa
Australasia
Brazil
Latin America
SSA
Rest of Asia
Philippines
Japan
Rest of world
South Africa
Australia
Japan
Germany
China
Brazil
France
Italy
United Kingdom
Mexico
Russian Federation
United States
Netherlands
Poland
Canada
Belgium
Tanzania
Rest of World
In FY2017, there was a further ±R10 billion of revenue from Nutritionals and Manufacturing

Annual Results Presentation for the year ended 30 June 2017
FY 2000
7
Commercial Pharma product portfolio
FY 2013 FY 2017
Other Commercial Pharma Brands Predominantly Other Commercial
Pharma Brands with limited therapeutic focused brands
Global and diverse product range with a focus on Speciality
Sales R1.0 billion Sales R18.6 billion Sales R31.4 billion
Anaesthetics
Thrombosis
High Potency & Cytotoxics
Other Commercial PharmaBrands
• SA < 50% of Other Commercial Pharma brandsFY 2017: • Generics account for ±10% of sales

Annual Results Presentation for the year ended 30 June 2017
FY 2000
8
Manufacturing FDF capacity & capability
FY 2013 FY 2017
Tablets onlyPredominantly solidswith some Speciality
Dominant sterile platform with Speciality & Solids
75%
13%
12%
Solids High Potency Steriles
32%
7%58%
3%
Solids High Potency
Steriles Semisolids/Liquids
FY2022 Further evolution to
Sterile Manufacturing
PE - Tablets• BO - High Potency• PE – Lyophilisation & Eye drops
• PE – High Potency & CytotoxicsSteriles (amps & vials)
• BO – Hormonal creams• NDB – Prefilled syringes
Anaesthesia
Products

Annual Results Presentation for the year ended 30 June 2017
9
Manufacturing API capacity & capability
FY 2013 FY 2017
100%
Capabilities
Anaesthetics
Muscle relaxants
Narcotics
Analgesics
Antipsychotics
Antineoplastics
Bronchodilators
Added Capabilities
High Potency & Cytotoxics
Steroids/Alkaloids/Heterocyclics
Conjugated & Esterified estrogens
Peptides
Hormonal & General intermediates
Biochemicals – Heparin & DanaparoidGonadotropins
Total Capacity 200 KvH Total Capacity 980 KvH
NDB: Purification of Fondaparinux Conversion of heparin to Nadroparin
*Intermediate manufacturing
Cape Town - FCC
• Broader geographic diversity• Enhanced capabilities• Five fold capacity increase
Netherlands- OssSpeciality chemicals
20%
Netherlands- OssBiochemicals
15%
India – Vizag*31%
Cape Town – FCC34%

Commercial Pharma

Annual Results Presentation for the year ended 30 June 2017
Weighting towards Emerging Markets
− Maybe the only global pharmaceutical multinational
11
Commercial Pharma revenue contribution by region & therapeutic category
22%
18%
15%
45%
Anaesthetics Thrombosis
High Potency And Cytotoxic Other Commercial Pharma Brands
DM revenue contribution
Developed and Emerging Markets as defined by MSCI ACWI Index and Frontier Markets Index
46%
EM revenue contribution
54%Developed Markets

Annual Results Presentation for the year ended 30 June 2017
Largest sector of therapeutic focused brands
Broad portfolio
− No.1 globally (ex-USA)
− Local, general and topical
− AZ & GSK products included for ten and four months respectively
Anaesthetic Brands
Regional representationR’ million FY 2017
FY 2016 (CER) % change
Developed Markets 3 885 7 >100%
Emerging Markets 3 180 107 >100%
Total Revenue 7 065 114 >100%
DM revenue contribution
55%
EM revenue contribution
45%
Developed Markets
Emerging Markets
12
Annual Results Presentation for the year ended 30 June 2017
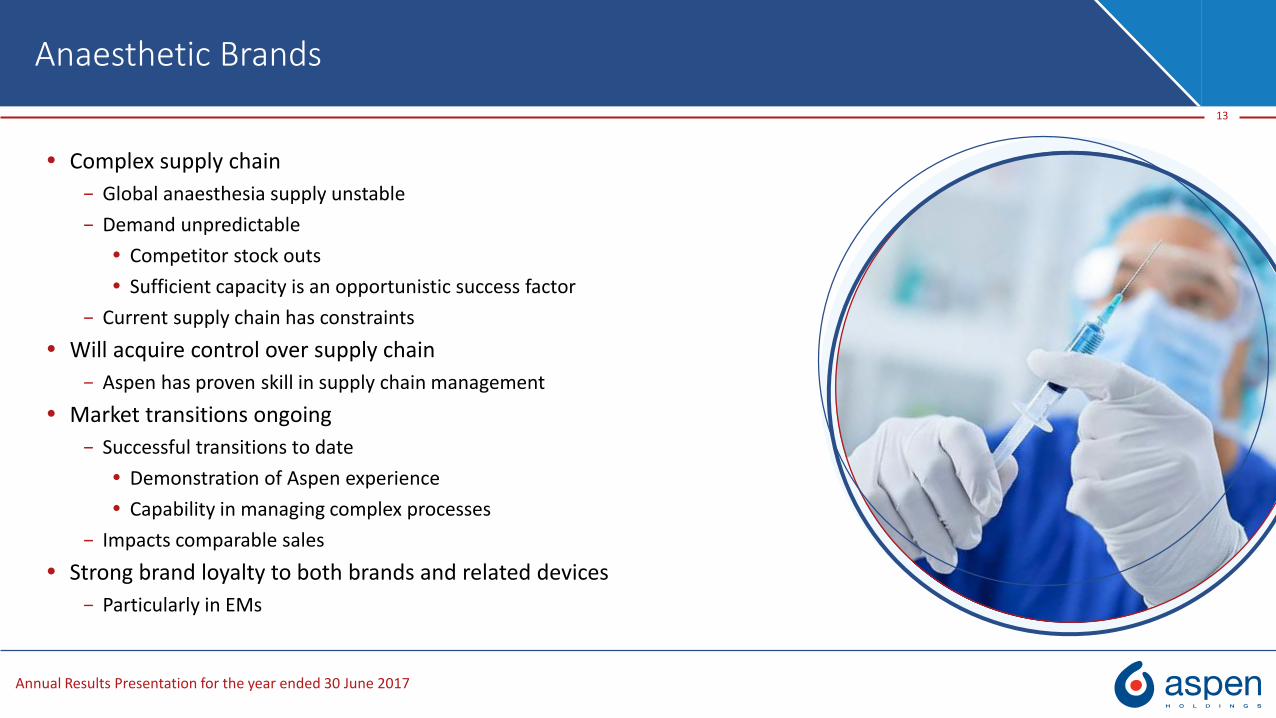
Anaesthetic Brands
Complex supply chain
− Global anaesthesia supply unstable
− Demand unpredictable
Competitor stock outs
Sufficient capacity is an opportunistic success factor
− Current supply chain has constraints
Will acquire control over supply chain
− Aspen has proven skill in supply chain management
Market transitions ongoing
− Successful transitions to date
Demonstration of Aspen experience
Capability in managing complex processes
− Impacts comparable sales
Strong brand loyalty to both brands and related devices
− Particularly in EMs
13

Annual Results Presentation for the year ended 30 June 2017
-19.7%-15.7%
-1.5%
2.5%
7.0% 8.6%
DIPRIVAN TOTAL AZ ANAESTHETICS
Dec 2015 Aug 2016 Jun 2017
Anaesthetic Brands China
14
IMS Ex-factory MAT Growth Rates - Units
Significant operational structure established within China Fully operational offices in the following locations:
− Beijing, Shanghai and Guangzhou
Infrastructure established, capacity to take on more
“A man grows most tired while standing still” - Chinese Proverb
Geography of detailing head count Number of
heads
Shandong / Henan 中原大区 30
Beijing 北京大区 20
Tianjing / Inner Mongolia / Shanxi / Hebei 华北大区 26
Heilongjiang / Jilin / Liaoning 东北大区 23
Shaanxi / Gansu / Ningxia / Qinhai / Xinjiang 西北大区 21
Jiangsu / Anhui 华中大区 29
Shanghai / Zhejiang 华东大区 48
Guangdong / Hainan / Fujian / Guangxi 华南大区 60
Hunan / Hubei / Jiangxi 中南大区 27
Sichuan / Chongqing / Yunan / Guizhou / Tibet
西南大区 29
Total 313
Detailing heads count increase 1 Sept 2017 (GSK Transfers)
225
Total heads dealing with doctors and product
538
Support Staff 72
Total Aspen China 610 Still very early days – encouraging signs in the AZ portfolio

Annual Results Presentation for the year ended 30 June 2017
Anaesthetic Brands Prospects
The anaesthetics portfolio has positively impacted sales
− Annualised effect will enhance FY 2018 performance
Largely fits on existing infrastructure
− Commercial and manufacturing synergies
Critical mass to establish presence in China and Japan
Structure of initial transaction negatively affected gross margins
Reversed by acquisition of supply rights
− Cessation of royalty payment
Operating income to be positively impacted
− FY 2017 pro forma + USD 90 million
Ready pipeline provided by breadth of portfolio
− Introduce diverse existing products into new markets
15

Annual Results Presentation for the year ended 30 June 2017
Thrombosis sales down R324 million
− Developed Europe down R605 million
EMs providing positive offset
16
Thrombosis Brands
Regional representation
R ’million FY 2017 FY 2016 (CER) % change
DevelopedMarkets
3 255 3 861 (16%)
Emerging Markets
2 410 2 128 13%
Total Revenue 5 665 5 989 (5%)
Developed Asia, Australasia & North America
DM revenue contribution
57%
EM revenue contribution
43%
Developed Markets
Emerging Markets
Annual Results Presentation for the year ended 30 June 2017
Developed Europe Rest of World
17
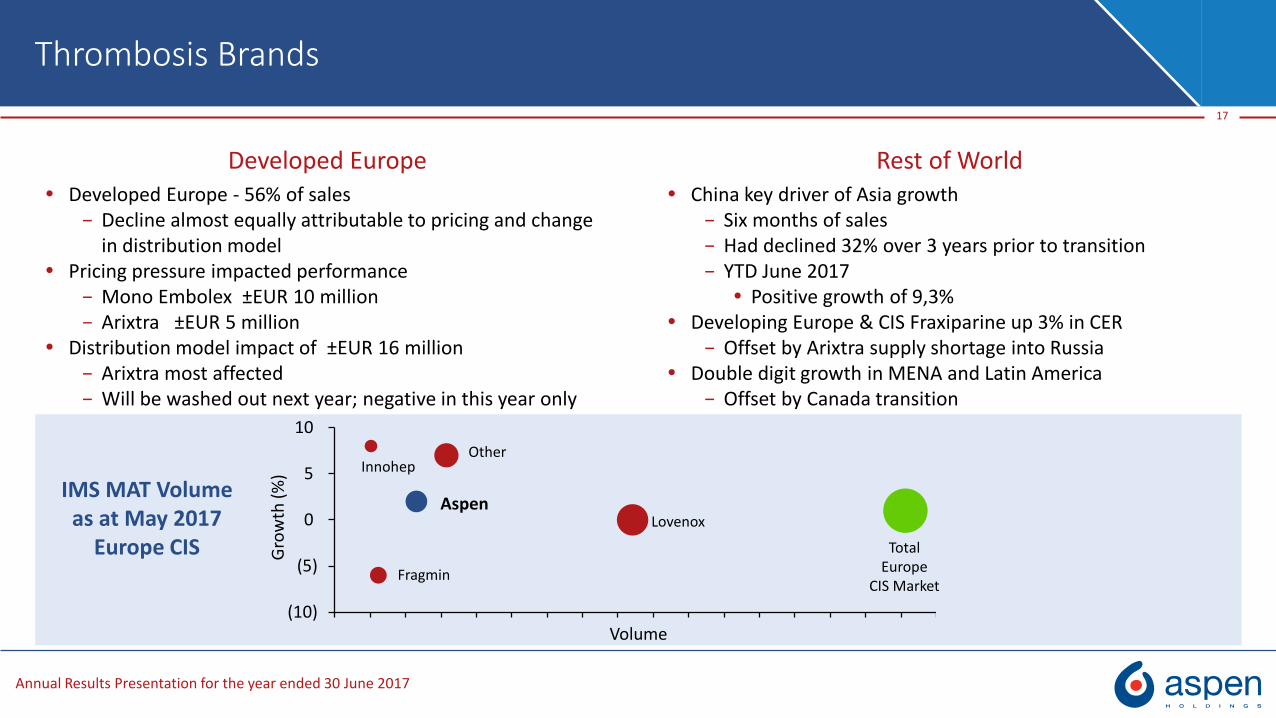
Thrombosis Brands
Developed Europe - 56% of sales− Decline almost equally attributable to pricing and change
in distribution model Pricing pressure impacted performance
− Mono Embolex ±EUR 10 million− Arixtra ±EUR 5 million
Distribution model impact of ±EUR 16 million− Arixtra most affected− Will be washed out next year; negative in this year only
China key driver of Asia growth− Six months of sales− Had declined 32% over 3 years prior to transition− YTD June 2017
Positive growth of 9,3% Developing Europe & CIS Fraxiparine up 3% in CER
− Offset by Arixtra supply shortage into Russia Double digit growth in MENA and Latin America
− Offset by Canada transition
IMS MAT Volumeas at May 2017
Europe CIS
(10)
(5)
0
5
10
Gro
wth
(%
)
Other
Lovenox
Volume
Aspen
Innohep
Fragmin
Total Europe
CIS Market

Annual Results Presentation for the year ended 30 June 2017
Fraxiparine & Orgaran
Combined contribution > 60% of total thrombosis sales
CER growth of 7% for FY 2017− Base business grew 2%
(excluding China & Italy distribution)
Sustained growth to continue− Enoxaparin biosimilar impact
− Regulatory approval on broadened indications
No longer a competitive disadvantage
− China annualised
Anticipated Orgaran registration timing − Selected Europe June 2018
− USA reactivation December 2018
− Other EMs under considerations
Arixtra & Mono-Embolex
Arixtra
Potential broader generic entry
Growth anticipated
− FY 2017 artificially low base
− Aspen extremely competitive due to low COGs
Mono-Embolex
Price decrease washed out
− Synergies to impact margin
18
Thrombosis Brands | Prospects
Forecast growth across each brand & entire thrombosis portfolio
Challenging environment for injectables market due to biosimilar, generic and oral competitors
Aspen well positioned strategically

Annual Results Presentation for the year ended 30 June 2017
Lead brands/molecules include:
− Imuran, Ovestin and Levothyroxine brands
Inability to transition manufacture of Thyrax timeously
− Negative impact on Developed Europe and Asia
− Excluding Thyrax, segment growth of 2%
− Developed Europe also impacted by changed distribution model
Existing portfolio has strong EM potential
− Double digit growth in Latam, Russia and South Africa
− Asia to grow with supply
19
High Potency & Cytotoxic Brands
Regional representationR ’million FY 2017 FY 2016 (CER) % change
Developed Markets 2 671 2 971 (10%)
Emerging Markets 2 016 1 725 17%
Total Revenue 4 687 4 696 0%
DM revenue contribution
57%
EM revenue contribution
43%
Developed Markets
Emerging Markets

Annual Results Presentation for the year ended 30 June 2017
High Potency & Cytotoxic Brands Prospects
Existing portfolio stable
− Niche growth opportunity for EMs
− Onco ANDA launch estimated for December 2017
Progress made in stabilising synthetic esterified and conjugated estrogens
− Facilitated/fast tracked entry into USA
Exclusive licence agreement with Teva in the USA
− Products are Enjuvia and Cenestin
Synthetic conjugated estrogens
NDAs
Off the market
Unable to source API
− Exciting and potentially material opportunity
Renewable long term agreement
Royalty payable on net sales
Positioned to compete with natural conjugated estrogens
− Which are sourced from pregnant mares
20

Annual Results Presentation for the year ended 30 June 2017
Divestments & Discontinued operations
− Termination of GSK agreement in SSA
− Divested, discontinued and to be discontinued products in Australasia
− Divestment of commodity products and facility in Latin America
21
Other Commercial Pharma Brands
Regional representationR’million FY 2017 FY 2016 (CER) % change
Total Revenue 14 020 13 441 4%
Sub-Saharan Africa 7 182 6 845 5%
Australasia 3 652 3 998 (9%)
Latin America 1 187 1 124 6%
Rest of world 1 999 1 474 36%
Divestments & Discontinued (416) (957)
Sub-Saharan Africa (51) (165)
Australasia (290) (668)
Latin America (75) (124)
Total Revenue (ex- divestments) 13 604 12 484 9%
DM revenue contribution
34%
EM revenue contribution
66%
Developed Markets
Emerging Markets
Annual Results Presentation for the year ended 30 June 2017
Sub-Saharan Africa South Africa
22
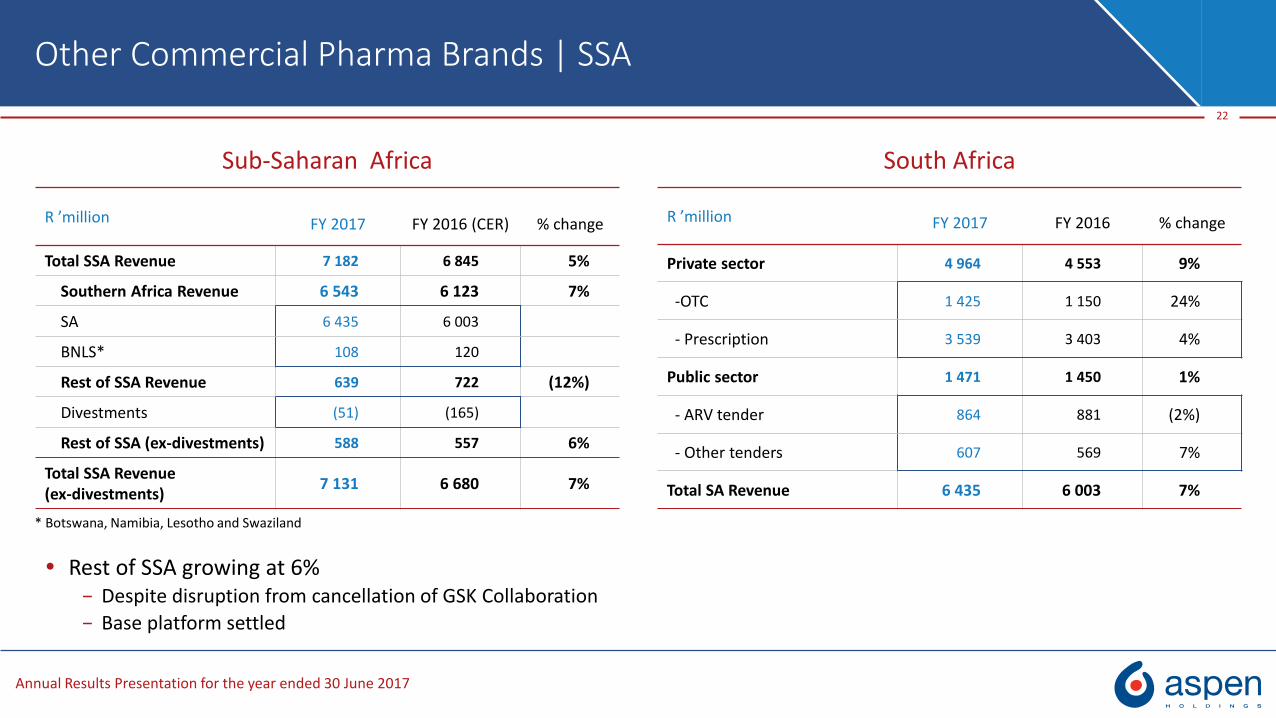
Other Commercial Pharma Brands | SSA
* Botswana, Namibia, Lesotho and Swaziland
R ’million FY 2017 FY 2016 % change
Private sector 4 964 4 553 9%
-OTC 1 425 1 150 24%
- Prescription 3 539 3 403 4%
Public sector 1 471 1 450 1%
- ARV tender 864 881 (2%)
- Other tenders 607 569 7%
Total SA Revenue 6 435 6 003 7%
R ’million FY 2017 FY 2016 (CER) % change
Total SSA Revenue 7 182 6 845 5%
Southern Africa Revenue 6 543 6 123 7%
SA 6 435 6 003
BNLS* 108 120
Rest of SSA Revenue 639 722 (12%)
Divestments (51) (165)
Rest of SSA (ex-divestments) 588 557 6%
Total SSA Revenue (ex-divestments)
7 131 6 680 7%
Rest of SSA growing at 6% − Despite disruption from cancellation of GSK Collaboration
− Base platform settled

Annual Results Presentation for the year ended 30 June 2017
Private sector +9%
Private market growth rebounded in H2 2017
− H1 vs H1 -7%
− H2 vs H2 +29%
Aspen has largest share of private sector
− Largest brand
− Three of the top five generic products
− Four of the top twenty products by value
OTC segment boosted by downscheduling of Mybulen
23
Other Commercial Pharma Brands South Africa
Public sector +1%
12 month extension to the ARV tender− From 31 March 2018
Aspen awarded increased share of the OSD tender− 36.7% vs 32.4% previously
− Effective August 2016
10 000 000
14 000 000
18 000 000
22 000 000
26 000 000
Jul2016
Aug2016
Sep2016
Oct2016
Nov2016
Dec2016
Jan2017
Feb2017
Mar2017
Apr2017
May2017
Jun2017
Mybulen and Mybucod Myprodol and Gen-PayneEmphatic response to the prior year’s challenges
H2 Growth driven by restructured commercial teamImproved supply chain management
Momentum has swung
Gains locked in
Sustainable
Mybulen vs competitor brands - Value Total Market all Sku’s

Annual Results Presentation for the year ended 30 June 2017
Other Commercial Pharma Brands Australasia
Divested/Discontinued
− Related to products divested and licences that have been or will be discontinued at contract termination
− Sales will halve in FY 2018 and then fall to zero as contracts end and products transition
Generic pipeline divested
− Relevant pipeline under development to sustain reshaped business
Benefit of focus being realised
− Base growth of 3% in OTC
− Prescription volume increases offset price reductions
24
R’millionFY 2017 FY 2016 (CER) % change
Total Revenue 3 652 3 998 (9%)
Divested & Discontinued (290) (668)
Total Revenue (ex-divestments) 3 362 3 330 1%
R’millionFY 2017 FY 2016 (CER) % change
OTC 808 782 3%
Prescription 2 554 2 548 0%
Total Revenue (ex-divestments) 3 362 3 330 1%
Annual Results Presentation for the year ended 30 June 2017
Latin America Rest of World
25
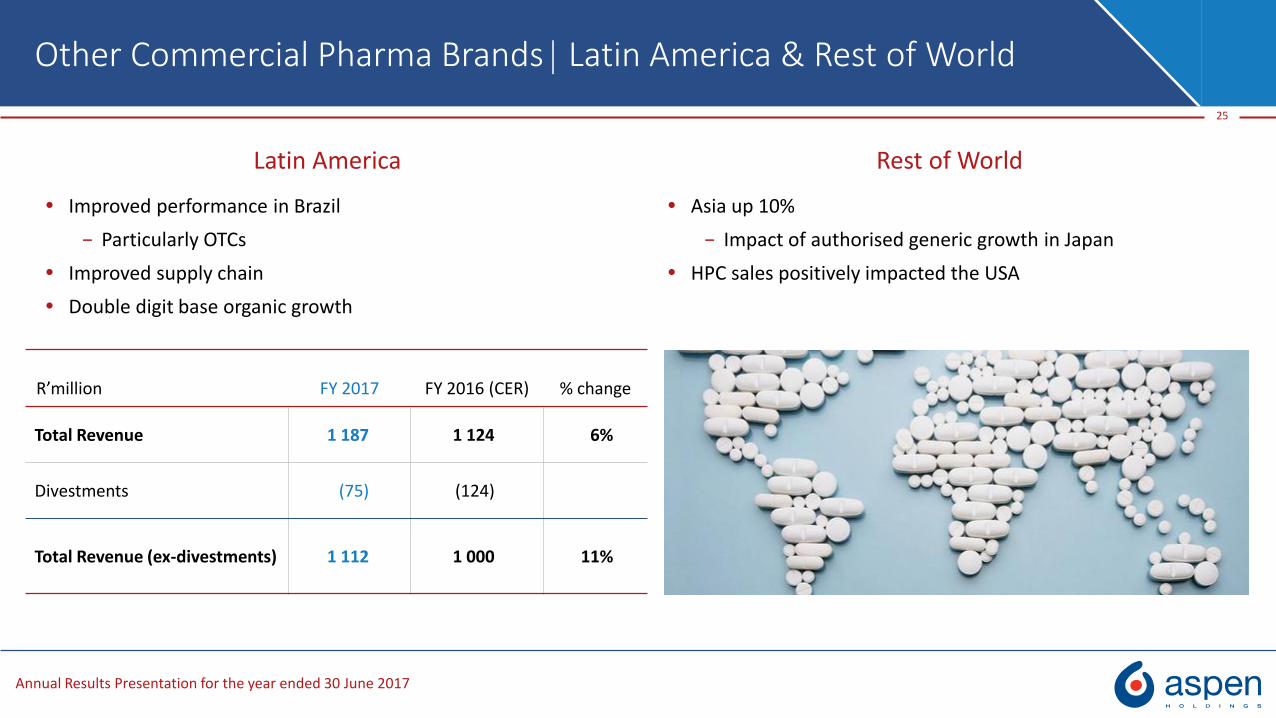
Other Commercial Pharma Brands Latin America & Rest of World
Improved performance in Brazil
− Particularly OTCs
Improved supply chain
Double digit base organic growth
Asia up 10%
− Impact of authorised generic growth in Japan
HPC sales positively impacted the USA
R’million FY 2017 FY 2016 (CER) % change
Total Revenue 1 187 1 124 6%
Divestments (75) (124)
Total Revenue (ex-divestments) 1 112 1 000 11%

Annual Results Presentation for the year ended 30 June 2017
Other Commercial Pharma Brands Prospects
26
Aspen’s engine room
− Largest sector within Commercial Pharma
− Dominated by EMs and Australia
Organic growth opportunity
− Volume growth
− Broad pipelines to support sustained growth
− Strong market positions
Performance critical to Group
− SA performance in H2 positively influenced Group performance
− Latin America and other EMs to provide broader growth opportunities

Nutritionals

Annual Results Presentation for the year ended 30 June 2017
Nutritionals
28
R’million FY 2017 FY 2016 (CER) % change
Latin America 1 462 1 395 5%
SSA 967 932 4%
Australasia 795 1 004 (21%)
Total Revenue 3 224 3 331 (3%)
Challenging H1
− Venezuela implosion
− Restriction of Chinese imports
Decreased sales in Australia
Overstocked Australian market
Recovery in H2

Annual Results Presentation for the year ended 30 June 2017
Latin America
Strong H2
− H2 2017 vs H1 2017 +9% CER
− H2 2017 vs H2 2016 +16% CER
− Infacare penetration into mid-tier sector
Roll out following tender success in Mexico
Private market launch
Volumes to offset Venezuela
− Stock levels normalised
SSA
Aspen SA continues to grow in both volume and value
− Market share increasing
Strategic manufacturing partnership with Clover
World class accredited manufacturing facility
− Capacity in place to support growth
Middle East and East Africa
− Populous with high relative birth rates
29
Nutritionals Latin America & SSA
19.8%21.7% 22.4%
24.1%25.5% 26.0%
2012 2013 2014 2015 2016 2017
*Aspen Market Share Evolution - Volume
*Source: AC Nielsen June 2017

Annual Results Presentation for the year ended 30 June 2017
Nutritionals Asia Pacific
30
Australia: In-market salesAustralia
Starting to see first signs of rebound
Volumes stabilising and now growing
Pricing pressures decreasing
Transition of own brand underway
− Australia in Q4 CY 2017
Capacity in NZNM
− Increased by 24 000 tonnes since investment
− Four fold increase in capacity
− Facilitates launch into China
China
Launch October 2017
− Hong Kong based partner
No unregistered products permitted in China after December 2017
Aspen registration anticipated by March 2018
− Stock build
− Facility already approved
Performance in China represents a significant growth opportunity UnitsValue
Q4 2017
Q3 2017
Q4 2016-5%
6%
0%
10%

Operations & Synergies

Annual Results Presentation for the year ended 30 June 2017
Operations
32
R’million FY 2017 FY 2016 (CER) % change
API 4 411 4 041 9%
FDF 2 141 2 139 0%
Total Revenue 6 552 6 180 6%
Good performance across APIs
− Both at FCC & Oss
FDF impacted by
− Acquisition of GSK thrombosis portfolio in China
Now part of Commercial Pharma
− Decline in Australia manufacture
Divested products transferring
Inordinate focus on operations
− Highest risk
− Absorbed disproportionate amount of senior management time
− Required our top skills and expertise
− Prioritised ahead of commercial
Real and potentially dire EHS risk
Meet commitments to partners/employees/society
Manufacturing facility progress
− French facility reshaped
− Dutch facilities
Approaching end state
High risk steps transferred
Authorities comfortable with Aspen and process
Annual Results Presentation for the year ended 30 June 2017
Synergies
Synergies have been critical to defending our profitability
− Collapse of Rouble
− Lost Pharma and Nutritional operating income from Venezuela
Synergies of approximately R1.2 billion unlocked in FY 2017
− Currency headwinds
− Price erosion in Europe
− Chinese restrictions on IMFs
− Increased Asia Pacific infrastructural investment
Future synergies remain meaningful and include
− Cost Synergies
Volume increases at NDB
FDF & API manufacture of Mono Embolex
Reshaped API facilities
Revenue synergies
− Orgaran growth and new registrations
− USA product launches
HPC post patent in February 2018
Synthetic and Conjugated estrogens
Lower dosage estradiols
Further synergies of ±R500 million forecast for FY 2018
33
Next wave of supply chain savings anticipated out of anaesthetics

Summary & Prospects

Annual Results Presentation for the year ended 30 June 2017
Summary
Impressive results despite challenging global pharma environment
Currency headwinds
− More than offset by operational performance
− Improved normalised operating profit to cash flow conversion rate
− Delivery on promise of strong H2
− H2 2017 NHEPS up 27% (37% CER) vs H2 2016
Dealing proactively with oncology portfolio pricing challenges
− DA successfully closed
− SA positively and proactively engaged
− Reviewing judgement in Italy case, assessing merits for appeal
− EU investigation process in early stages and moving forward constructively
35

Annual Results Presentation for the year ended 30 June 2017
Summary
Testing and transformative period
Business reshaped structurally− Clearly defined business units with focused, measurable objectives
− Infrastructure established in China and Japan
− European facilities nearly settled
− Operations also settled with full focus now on commercial execution, synergy extraction and expense management
Nutritionals stronger following challenging period
Commercial Pharma − EM teams performing
Core Aspen competence
− Developed Europe needs attention
One off negatives also impacted
− China is a new growth frontier
− Strong SA H2
Back on track and contributing
− Anaesthetics and synergies
More than offset divestments and other adverse pressures
− Conjugated estrogens an exciting opportunity
36
Annual Results Presentation for the year ended 30 June 2017
Sales
Annualised anaesthetic sales
Base organic growth in Commercial Pharma
− Across each therapeutic sector
− Developed Europe to improve
− EMs performing
SA to sustain positive growth momentum
China growing share of revenue
IMFs to recover strongly
− First direct sales to China
Manufacturing revenues stabilising
Profitability
Exchange rate will always impact
Further extraction of efficiencies
− Margin and Cashflow positive
Commitment to increased presence in Asia Pacific
− Operating expense increases of about USD 30 million
Acquisition of anaesthetic IP and manufacturing rights
− Positive impact on margins
− Would have added USD 90 million to FY 2017
Synergies to positively impact
− Less pricing and other offsets projected
Prospects
37

Annual Results Presentation for the year ended 30 June 2017
Prospects
Worked extremely hard operationally on reconfiguring Aspen
− Transformation over last few years clearly demonstrated
− Business de-risked
Geographically
Product portfolio
FDF and API capability
Challenging journey but destination made effort worthwhile
− Tribute to a skilled, passionate, determined and globally competitive team
Unbroken track record of sustained NHEPS growth
38
20092006 2011 2013201220082007 2010 201720162014
+36%
201520012000 20052002 2004200319991998
19 years of sustained NHEPS growth
CAGR: FY ’98 –FY’17
A man grows most tired while standing still – Chinese Proverb
14.63
To rest is to rust – Aspenism
Half on half
Year on year

Financial review

Annual Results Presentation for the year ended 30 June 2017
Financial performance headlines
40
Acquisitive and organicrevenue growth
Margin % dilution due to
anaesthetic dealstructure
Currency influence:
negative to earnings,
positive to debt
Strongoperating cash flows
Improvedworking capital position
Leverage ratio
comfortable
Capex
re-alignmentAccretive
second transaction withAstra Zeneca
Increaseddividend

Annual Results Presentation for the year ended 30 June 2017
Abridged statement of normalised comprehensive income
R ’million FY 2017 FY 2016 % change FY 2016 (CER) % change
Net revenue 41 213 35 559 16% 33 751 22%
Gross profit 19 897 17 900 11% 17 161 16%
Gross profit margin 48,3% 50,3% 50,8%
EBITDA 11 416 10 105 13% 9 684 18%
EBITDA margin 27,7% 28,4% 29,0%
Depreciation (700) (649) (615)
Amortisation (567) (570) (545)
Operating profit 10 149 8 886 14% 8 524 19%
Net funding costs (2 107) (1 723) (1 652)
Share of after-tax net profits of joint venture 13 18 17
Profit before tax 8 055 7 181 12% 6 889 17%
Tax (1 376) (1 400) (1 350)
Profit after tax 6 679 5 781 16% 5 539 21%
NHEPS (cents) 1 463 1 264 16% 1 211 21%
Normalised effective tax rate 17,1% 19,5% 19,6%
41
FY 2016 (CER) % change
33 751 22%
17 161 16%
50,8%
9 684 18%
29,0%
(615)
(545)
8 524 19%
(1 652)
17
6 889 17%
(1 350)
5 539 21%
1 211 21%
19,6%
Annual Results Presentation for the year ended 30 June 2017
+22%
33 751
41 213
1 808739
9 684
421
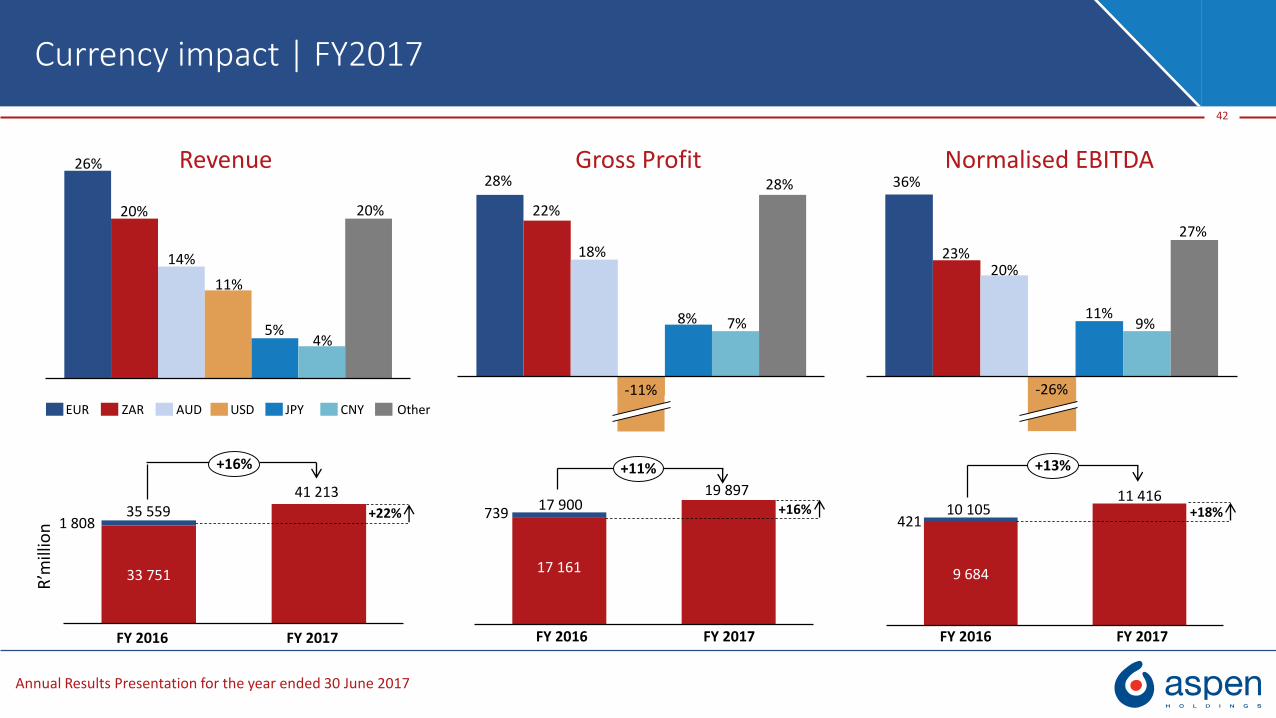
Revenue
42
Currency impact | FY2017
Gross Profit Normalised EBITDA26%
20%
14%
20%
4%5%
11%
-11%
28%
7%8%
18%
22%
28%
-26%
9%
27%
23%
36%
11%
20%
EUR ZAR CNYJPYUSDAUD Other
35 559
+16% +11%
17 161
+16%
19 89717 900 10 105 +18%
11 416
+13%
R’m
illio
n
FY 2016 FY 2017 FY 2016 FY 2017 FY 2016 FY 2017

Annual Results Presentation for the year ended 30 June 2017
EBITDA Margin
43
FY 2016 Normalised
EBITDA Margin
Administrative
-0,7pp
Other Commercial
Pharma brands
Therapeutic focused brands
Net other operating
income
27,7%-1.4%
Nutritionals FY 2017 Normalised
EBITDA Margin
-0.9%
-0.1%0.4%
0.6%
0.4%
0.3%
Depreciation & Amortisation
28.4%
Selling & Distribution
Contribution to change in Normalised EBITDA Margin

Annual Results Presentation for the year ended 30 June 2017
Capital raising fees 23,5 58,9
Restructuring costs 66,7 50,4
Transactions costs 68,6 74,8
Net hyperinflationary adjustment¹ - 190,6
Product litigation costs 34,9 -
Foreign exchange gain relating to acquisition ( 30,0) -
Normalised HEPS 1 463,2 1 263,7 16%
Loss on sale of property, plant and equipment 5,4 0,2
Net impairment of property, plant and equipment 43,2 3,5
Impairment of intangible assets 93,5 198,3
Loss on sale of business 15,4 -
Profit on sale of divested products - (258,6)
Loss on sale of intangible assets 18,6 0,2
Headline earnings per share (HEPS) 1 299,5 889,0 46%
Reconciliation of NHEPS
44
1. Net monetary adjustments and currency devaluations relating to hyperinflationary economies
Cents FY 2017 FY 2016 % change
Basic earnings per share (EPS) 1 123,4 945,4 19%
Annual Results Presentation for the year ended 30 June 2017
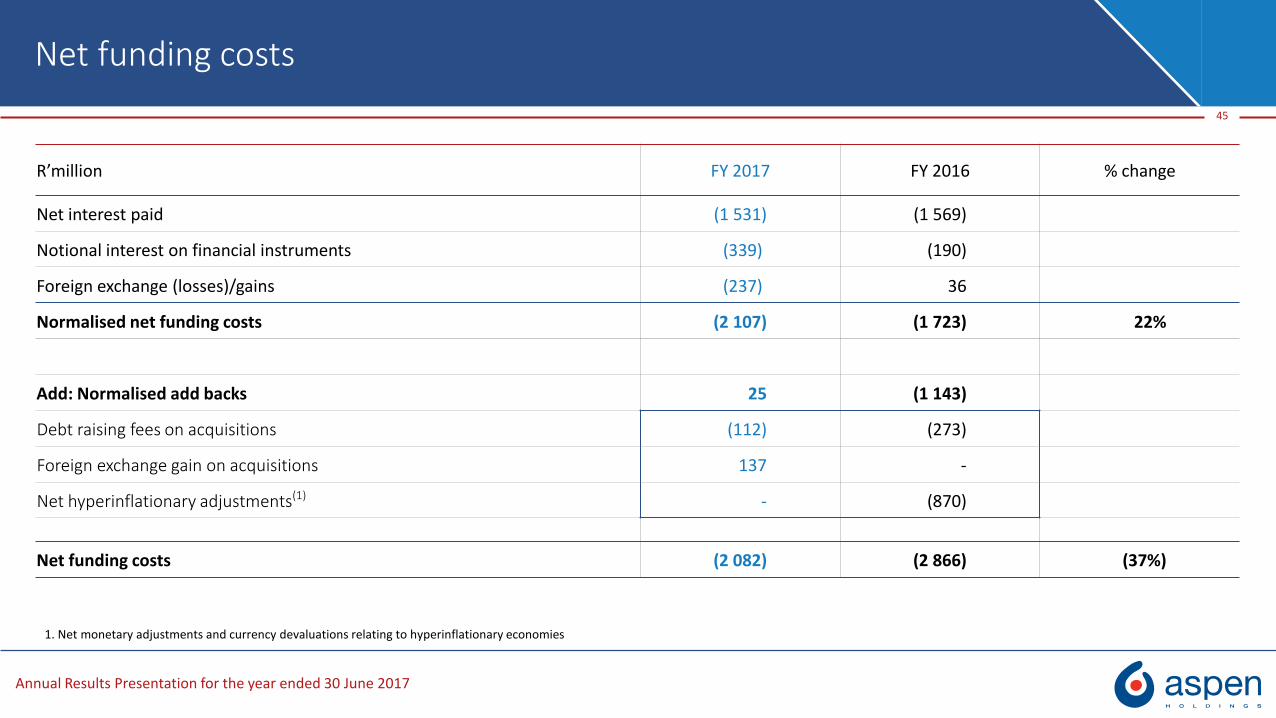
Net funding costs
R’million FY 2017 FY 2016 % change
Net interest paid (1 531) (1 569)
Notional interest on financial instruments (339) (190)
Foreign exchange (losses)/gains (237) 36
Normalised net funding costs (2 107) (1 723) 22%
45
1. Net monetary adjustments and currency devaluations relating to hyperinflationary economies
Add: Normalised add backs 25 (1 143)
Debt raising fees on acquisitions (112) (273)
Foreign exchange gain on acquisitions 137 -
Net hyperinflationary adjustments(1) - (870)
Net funding costs (2 082) (2 866) (37%)
Annual Results Presentation for the year ended 30 June 2017
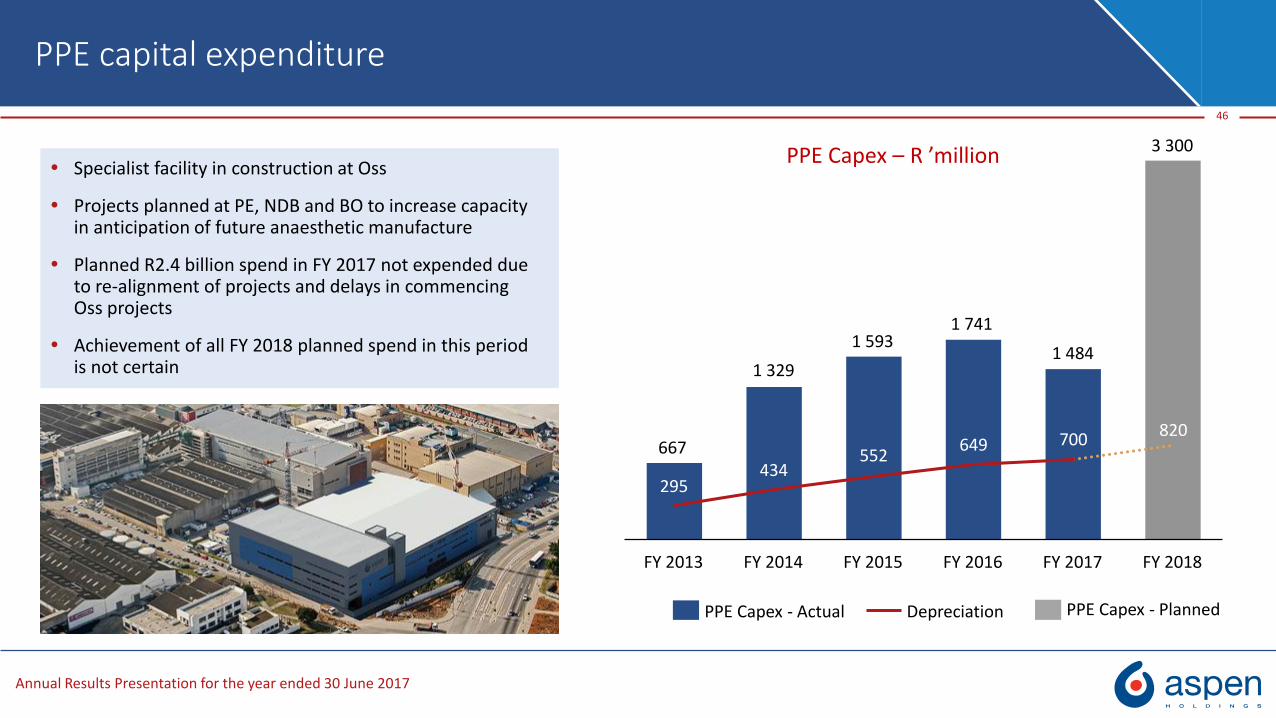
Specialist facility in construction at Oss
Projects planned at PE, NDB and BO to increase capacity in anticipation of future anaesthetic manufacture
Planned R2.4 billion spend in FY 2017 not expended due to re-alignment of projects and delays in commencing Oss projects
Achievement of all FY 2018 planned spend in this period is not certain
PPE capital expenditure
46
295 434
552 649 700 820
FY 2017FY 2016FY 2013 FY 2018FY 2015FY 2014
PPE Capex – R ’million
DepreciationPPE Capex - Actual PPE Capex - Planned
667
1 329
1 5931 741
1 484
3 300

Annual Results Presentation for the year ended 30 June 2017
9 794
3 225
R’m
illio
n
47
Cashflow
10 817
6 487
R’m
illio
n
Decreased investment in working capital has substantially benefited cash flow
Operating cash flow per share has more than doubledOperating
CashflowTax Net
funding costs
Working capitalCash operating profit
-915-1 913
-1 502
FY2016
FY 2017
-3 381
-1 682-1 506
101%
79%1,421.4
FY 2016
706.7
109%
FY 2017
Operating cash flow per share (cents)
Cashflow conversion rate

Annual Results Presentation for the year ended 30 June 2017
0.7
0.4
Working Capital
48
R ’million FY 2016 FY 2017
Net Working capital 17 741 16 716
Net Working capital – excluding Oss 12 852 12 465
Working capital as % of revenue 50% 41%
Less: Attributable to Oss (10%) (8%)
Working capital excluding Oss as a % of revenue
40% 33%
Improving trend maintained
Also an improvement in relative value of Oss working capital
Working capital investment relates to acquisition and synergy initiatives
Anaesthetics
16,7
FY2017FY2016
17,7
Foreign exchange rate
Strategic API stock build
Operational improvements
-0,9
-1,2
Working Capital – R ’billion

Annual Results Presentation for the year ended 30 June 2017
Borrowings
49
Blended interest rates for borrowings
Debt denominationFY 2017
Weighted average rate p.a
ZAR 8.8%
AUD 3.8%
EUR 2.1%
Key Indicators FY 2017 FY 2016
Gearing 47% 44%
Net Debt/EBITDA 3.2 3.3
Interest cover ratio 7.9 5.9
Asia Pacific - AUD
International - EUR
69%
South Africa - ZAR
8%
23%
Net Debt: R37,1 billion

Annual Results Presentation for the year ended 30 June 2017
Borrowings
50
R’ million FY 2017 FY 2016
Opening balance 32 694 30 048
Cash flow from operating activities (6 488) (3 225)
Capital expenditure 2 632 2 818
Proceeds from sale of assets (929) (5 401)
Acquisitions of brands/businesses 9 428 676
Payment of deferred consideration 192 823
Distribution to shareholders 1 229 997
Other 437 398
Exchange rate effect (2 064) 5 560
Closing balance 37 131 32 694
Amend and extend exercise scheduled
Non-current
18.9
10.9
32.7
37.1
10.7
32.7
Current
28.9
Cash
Net borrowings
10.9
FY 2017
FY 2016
Analysis of R37,1 billion net borrowings

Annual Results Presentation for the year ended 30 June 2017
AstraZeneca transaction announcement
On 13 September 2017, entered into agreement with AstraZeneca under which Aspen Global Incorporated (AGI) will acquire remaining rights to the intellectual property and manufacturing know-how related to AstraZeneca’s anaesthetics portfolio
− This follows commercial agreement entered into in June 2016 relating to same portfolio
− USD 555 million initial consideration
− Additional milestone payments of up to USD 211 million based on sales and gross profit in the period to 30 November 2019
− AstraZeneca will continue to manufacture and supply to AGI for a transition period of up to five years
− Management of third party suppliers to transition within one year
Transaction would have generated an additional contribution to operating profit of approximately USD 90 million for FY 2017
− Based on the terms of the agreement and Aspen’s expected related incremental costs
Transaction is expected to close in the fourth quarter of calendar 2017
51

Thank you

Appendices

Annual Results Presentation for the year ended 30 June 2017
Cautionary regarding forward looking statements
This presentation has been prepared by Aspen Pharmacare Holdings Limited based on information available to it as at the date of the presentation.
This presentation may contain prospects, projections, future plans and expectations, strategy and other forward-looking statements that are not historical in nature. These which include, without limitation, prospects, projections, plans and statements regarding Aspen's future results of operations, financial condition or business prospects are based on the current views, assumptions, expectations, estimates and projections of the directors and management of Aspen about the business, the industry and the markets in which Aspen operates.
These statements are not guarantees of future performance and are subject to known and unknown risks, uncertainties and other factors, some of which are beyond Aspen’s control and are difficult to predict. Actual results, performance or achievements could be materially different from those expressed, implied or forecasted in these forward-looking statements.
Any such prospects, projections, future plans and expectations, strategy and forward-looking statements in the presentation speak only as at the date of the presentation and Aspen assumes no obligation to update or provide any additional information in relation to such prospects, projections, future expectations and forward-looking statements.
Given the aforementioned uncertainties, current and prospective investors are cautioned not to place undue reliance on any of these projections, future plans and expectations, strategy and forward-looking statements.
54

Annual Results Presentation for the year ended 30 June 2017
Appendices
Appendix 1: Abridged group statement of comprehensive income
Appendix 2: Group statement of financial position
Appendix 3: Extract from group statement of cash flows
Appendix 4: Key currency movements vs ZAR – 2017 vs 2016
Appendix 5: Key currency movements vs ZAR – H2 2017 vs H1 2017
Appendix 5: Institutional investors
55

Annual Results Presentation for the year ended 30 June 2017
Appendix 1: Abridged Group statement of comprehensive income
R ’million FY 2017 FY 2016 % change
Net revenue 41 213 35 559 16%
Gross profit 19 896 17 900 11%
Gross profit margin 48,3% 50,3%
Net other operating income 345 1 888
Net operating expenses (11 920) (10 819)
Operating profit 8 321 8 969 (7%)
Net funding costs (2 082) (2 866)
Share of after-tax net profits of joint venture 13 18
Profit before tax 6 252 6 121 2%
Tax (1 124) (1 793)
Profit after tax 5 128 4 328 18%
Effective tax rate 18,0% 29,3%
56
Operating profit 8 321 8 969 (7%)
Depreciation 700 649
Amortisation 567 570
EBITDA 9 588 10 188 (6%)EBITDA margin 23,3% 28,7%

Annual Results Presentation for the year ended 30 June 2017
R' million FY 2017 FY 2016
TOTAL ASSETS
Non-current assets 78 273 67 138
Intangible assets 60 006 49 068
Property, plant and equipment 9 749 9 670
Goodwill 5 940 6 021
Deferred tax assets 1 029 1 093
Contingent environmental indemnification assets 747 818
Other non-current assets 802 468
Current assets 38 048 37 146
Inventories 13 611 14 396
Receivables and other current assets 13 530 11 729
Cash and cash equivalents 10 707 10 934
Assets classified as held-for-sale 200 87
Total assets 116 321 104 284
Appendix 2: Group statement of financial position
57

Annual Results Presentation for the year ended 30 June 2017
Appendix 2: Group statement of financial position (continued)
58
R' million FY 2017 FY 2016
EQUITY AND LIABILIITIES
Share capital and reserves 43 138 42 535
Non-current liabilities 38 356 40 676
Borrowings 28 978 32 653
Other non-current liabilities 4 380 2 608
Unfavourable and onerous contracts 1 635 2 172
Deferred tax liabilities 2 045 1 753
Contingent environmental liabilities 747 818
Retirement and other employee benefits 571 672
Current liabilities 34 827 21 073
Borrowings 18 860 10 875
Trade and other payables 10 257 8 284
Other current liabilities 5 362 1 533
Unfavourable and onerous contracts 348 381
Total equity and liabilities 116 321 104 284

Annual Results Presentation for the year ended 30 June 2017
Appendix 3: Extract from Group statement of cash flows
R' million FY 2017 FY 2016
Cash operating profit 10 817 9 794
Changes in working capital (915) (3 381)
Cash generated from operations 9 902 6 413
Net finance costs paid (1 913) (1 682)
Tax paid (1 502) (1 506)
Cash generated from operating activities 6 487 3 225
Operating cash flow per share (cents) 1 421,4 706,7
59

Annual Results Presentation for the year ended 30 June 2017
Appendix 4: Key currency movements vs ZAR – 2017 vs 2016
60
10.26
4.20
3.44
2.00
0.70
0.22
0.13
10.61
3.95
3.75
2.26
0.84
0.22
0.13
+6%
JPY
-11%
-8%
+4%
-16%
RUB
-1%
-7%
PLN
BRL
MXN
-8%
-3%
CNY
-19%
EUR
14,58
16,11
USD
GBP21,38
AUD
13,61
14,84
17,27
2017 avg rate
2016 avg rate
Annual Results Presentation for the year ended 30 June 2017
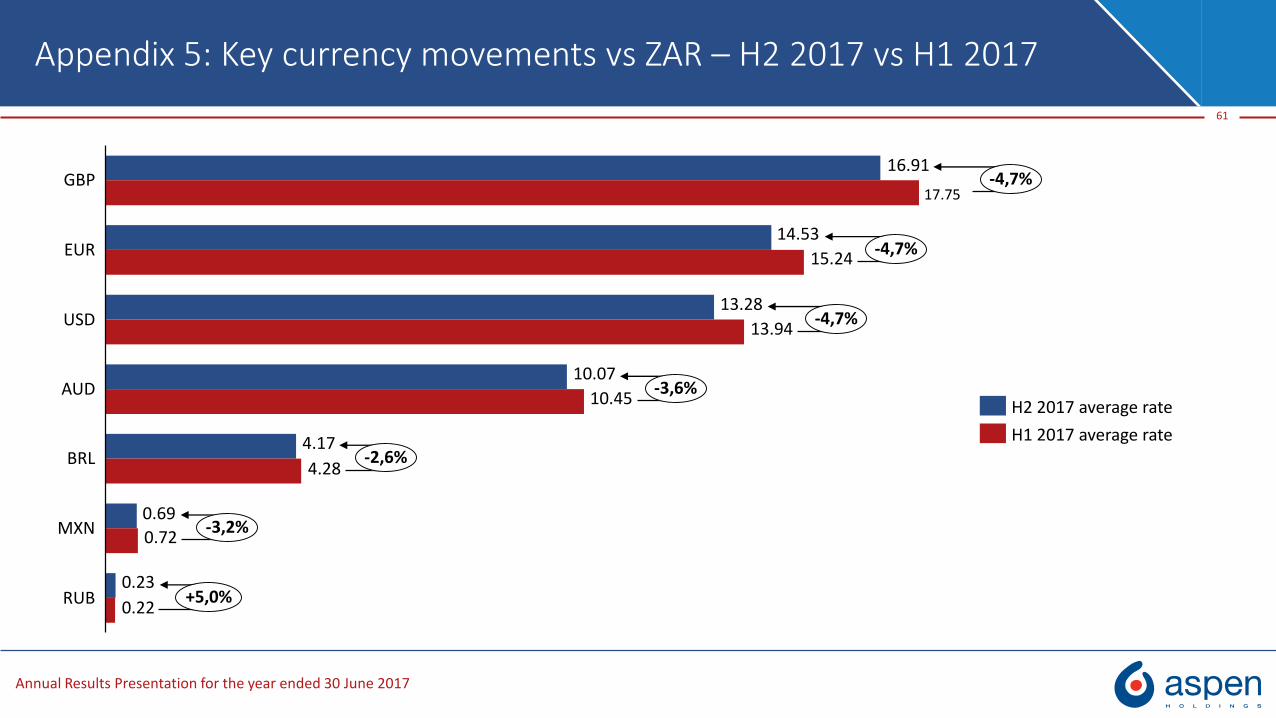
Appendix 5: Key currency movements vs ZAR – H2 2017 vs H1 2017
61
16.91
14.53
13.28
10.07
4.17
0.69
0.23
15.24
13.94
10.45
4.28
0.72
0.22
-4,7%
-3,6%
-3,2%
-2,6%
RUB
GBP
BRL
AUD
MXN
USD
EUR
-4,7%
-4,7%
+5,0%
H1 2017 average rate
H2 2017 average rate
17.75

Annual Results Presentation for the year ended 30 June 2017
Appendix 6: Institutional investors
62
63.3%
17.1%
14.7%
4.4%
0.5%
Southern Africa North America Europe Asia Pacific Middle East