for the year ended 31 december 2017 - angloamerican.com/media/files/a/anglo-american-plc-v... ·...
TRANSCRIPT

YEAR END FINANCIAL REPORT
for the year ended 31 December 2017

This page has been intentionally left blank.

-1-
22 February 2018 Anglo American Preliminary Results 2017 Free cash flow increased by 93% to $4.9 billion, halving net debt to $4.5 billion Mark Cutifani, Chief Executive of Anglo American, said: “We have delivered a 93% increase in attributable free cash flow, almost halving net debt to $4.5 billion at the year end. These strong financial results benefit from transformed productivities and efficiencies across our business – including a 28% productivity improvement in 2017 alone – together with our portfolio upgrading and improved prices for many of our products. Our increased dividend for the second half equates to our targeted level of 40% of underlying earnings, totalling $1.02 per share for the year as a whole. “We exceeded our cost and volume improvement target for the year, achieving $1.1 billion of underlying EBITDA benefit. Over the last five years, we have now delivered a $4.2 billion annual underlying EBITDA improvement. While we have already driven a material operational turnaround, we believe there is significant additional upside within the business both through further operating gains and from selected organic growth options. As part of how we run the business, we are therefore targeting an additional $3-4 billion annual run-rate improvement by 2022 from production volumes, productivity improvements and cost reductions.” Highlights – year ended 31 December 2017 • Delivered attributable free cash flow* of $4.9 billion, a 93% increase • Reduced net debt* to $4.5 billion, a 47% reduction, equal to 0.5x net debt / EBITDA • Generated underlying EBITDA* of $8.8 billion, a 45% increase • Profit attributable to equity shareholders doubled to $3.2 billion • Achieved cost and volume improvements of $1.1 billion – in excess of target • Targeting additional $3-4 billion annual underlying EBITDA run-rate improvement by 2022 • Increased dividend of 54 US cents per share for the second half, equal to 40% of second half underlying
earnings* - Total dividend payable for 2017 of $1.02 per share
Year ended US$ million, unless otherwise stated
31 December 2017
31 December 2016
Change
Underlying EBITDA* 8,823 6,075 45% Underlying earnings* 3,272 2,210 48% Profit attributable to equity shareholders of the Company 3,166 1,594 99% Underlying earnings per share* ($) 2.57 1.72 49% Earnings per share ($) 2.48 1.24 100% Dividend per share ($) 1.02 – – Group attributable ROCE* 19% 11% –
Notes to the highlights and table are shown at the bottom of this section.
Words with this symbol * are defined as Alternative Performance Measures (‘APMs’). For more information on the APMs used by the Group, including definitions, please refer to page 57.

-2-
Safety and environmental performance Anglo American’s safety record in 2017 was the Group’s single disappointment. Nine people lost their lives in fatal accidents in 2017, all in South Africa. Every leader in the business understands it is unacceptable to continue to work where there is a likely consequence of injury. As a result, significant further operational interventions to manage activity risks to end fatal incidents across all operations have taken place. Safety continues to be the Group’s most critical area of focus, and while significant progress over recent years must be recognised ‒ reducing safety incident rates by more than 40% ‒ there is still a long way to go on the journey to zero harm. Environmental incidents have been reduced by more than 90% since 2013, with continued focus on detailed operational planning across Anglo American’s operating interests. Good progress continues to be made towards greater water and energy efficiency, as part of the overall business improvements. Operational and financial review of Group results for the year ended 31 December 2017 SUMMARY Anglo American’s profit attributable to equity shareholders doubled to $3.2 billion (2016: $1.6 billion). Underlying earnings were $3.3 billion (2016: $2.2 billion), while operating profit was $5.5 billion (2016: $1.7 billion).
Group underlying EBITDA increased by 45% to $8.8 billion (2016: $6.1 billion), benefiting from strong bulk commodity and copper prices. Cost and volume improvements across the Group benefited underlying EBITDA by $1.1 billion, exceeding the $1.0 billion target for the year, driven by the ongoing ramp-up of Minas-Rio and strong sales volumes at De Beers in the first quarter. There were also productivity improvements at Kumba, with increased fleet efficiency and higher plant yields, while Platinum made a solid recovery from the operational challenges experienced in 2016. The impact of the Group’s ongoing cost-efficiency programme also played a significant role in exceeding our improvement target for the year.
The Group delivered a strong operational performance and increased copper equivalent production by 5%, despite challenges arising from adverse weather conditions in Australia, and an extended longwall move at Grosvenor (Metallurgical Coal).
Group copper equivalent unit costs increased by 7%, principally driven by stronger producer currencies. When the impact of foreign exchange movement is excluded, this increase was only 2%; below the Group’s weighted average CPI for the year of 4%. Attributable ROCE increased to 19% (2016: 11%), owing to the 73% improvement in attributable underlying EBIT to $5.1 billion. Net debt (including related derivatives) reduced to $4.5 billion, $4.0 billion lower than at 31 December 2016. The reduction was driven by $4.9 billion of attributable free cash flow, reflecting the strong underlying EBITDA and working capital inflows, partly offset by the payment of dividends to Group shareholders. Our materially improved balance sheet supported the resumption of the dividend at the half year. Based on a payout ratio dividend policy, 48 US cents per share was paid in September 2017. In line with this policy, the Board proposes a final dividend of 40% of second half underlying earnings equal to 54 US cents per share, bringing the total dividends paid and proposed for the year to $1.02 per share.

-3-
OPERATIONAL PERFORMANCE We have continued to lift the performance of our assets through the implementation of our Operating Model. Across the Group, production increased by 5% on a copper equivalent basis, driven by improved performances at De Beers (+22%), Kumba Iron Ore (+8%) and Iron Ore Brazil (+4%), partly offset by lower production at the Coal operations (-4%)(1). At De Beers, rough diamond production increased by 22% to 33.5 million carats (2016: 27.3 million carats), reflecting stronger trading conditions and the contribution from the Gahcho Kué mine in Canada, which entered commercial production in March 2017. Kumba delivered a strong operational performance, increasing iron ore production by 8% to 45.0 Mt (2016: 41.5 Mt), following improvements in mining productivity resulting from fleet efficiencies and higher plant yields. In Brazil, our Minas-Rio iron ore operation produced 16.8 Mt (wet basis), 4% higher (2016: 16.1 Mt), as the operation continued to ramp up its current operating capacity. Copper production was in line with the prior year at 579,300 tonnes (2016: 577,100 tonnes), with solid performances at Los Bronces and Collahuasi partly offset by the impact of lost production at El Soldado, owing to the temporary suspension of mining operations in the first half. Our Metallurgical Coal business in Australia produced 19.7 Mt of metallurgical coal, 6% lower than the prior year (2016: 20.9 Mt). This was driven by the divestment of Foxleigh mine (PCI producer), although was largely offset by a strong performance at the underground longwall operations, which produced 12.3 Mt, 14% higher than the prior year (2016: 10.8 Mt). Coal South Africa’s export thermal coal production declined by 3% to 18.6 Mt (2016: 19.1 Mt), mainly owing to operational challenges at Khwezela mine, and the planned transition to a new pit at Mafube. The Coal South Africa operations were also affected by self-enforced safety stoppages, following three fatalities in the year. Group copper equivalent unit costs increased by 7%, driven mainly by stronger producer currencies. Excluding the impact of foreign exchange, the cost increase was 2%. Lower unit costs were realised at Platinum in rand terms, as a result of ongoing cost-saving initiatives, and at De Beers, where higher production and efficiency drives helped reduce unit costs. These efficiencies were offset, however, by higher costs across the Coal business which, in addition to experiencing Khwezela’s operational challenges, encountered lower volumes at Dawson and the effects of the extended longwall move at Grosvenor (both Metallurgical Coal). FINANCIAL PERFORMANCE UNDERLYING EBITDA* Group underlying EBITDA increased by 45% to $8.8 billion (2016: $6.1 billion), with a five percentage point increase in EBITDA margin from 26% to 31%, driven by strong pricing, particularly in bulk commodities and copper, continued productivity improvements and cost control across the portfolio. Underlying EBITDA* by segment $ million
Year ended 31 December 2017
Year ended 31 December 2016
De Beers 1,435 1,406 Copper 1,508 903 Platinum 866 532 Iron Ore and Manganese 2,357 1,536 Coal 2,868 1,646 Nickel 81 57 Corporate and other (292) (5) Total 8,823 6,075 (1) Metallurgical and export thermal coal production.

-4-
Underlying EBITDA* reconciliation 2016 to 2017 The reconciliation of underlying EBITDA from $6.1 billion in 2016 to $8.8 billion in 2017 allows an understanding of the controllable factors (e.g. cost and volume) and those largely outside of management control (e.g. price, foreign exchange and inflation) that drive the Group’s performance. $ billion 2016 underlying EBITDA* 6.1 Price 2.4 Foreign exchange (0.7) Inflation (0.4)
Volume 0.9 Cost 0.2
Net volume and cost improvements 1.1 Other 0.3 2017 underlying EBITDA* 8.8 Price
Average market prices for the Group’s basket of commodities and products increased by 16%, contributing $2.4 billion of improvement to underlying EBITDA. The realised prices of metallurgical coal and copper increased by 57% and 29% respectively, while palladium (Platinum) showed a 44% improvement in realised price. The average realised price of diamonds decreased by 13%, mainly owing to a lower-value mix, with the average rough price index being 3% higher. Foreign exchange
Stronger producer country currencies had the effect of reducing underlying EBITDA by $0.7 billion, mainly owing to a 9% strengthening of the South African rand and a 4% strengthening of the Chilean peso against the dollar. Inflation
The Group’s weighted average CPI for the year was 4%, in line with the prior year, principally influenced by South Africa, which had local CPI of 5%. The impact of inflationary cost increases reduced underlying EBITDA by $0.4 billion. Volume
Following the cessation of capitalisation of earnings at Minas-Rio in January 2017, the operation’s 16.8 Mt iron ore production materially benefited underlying EBITDA by $0.4 billion, which was also boosted by higher sales volumes at De Beers, reflecting stronger demand for lower-value goods in the first quarter of 2017. Kumba’s increased fleet efficiency and higher plant yields, as well as Platinum’s solid recovery from the operational challenges experienced in 2016, also contributed to the Group volume improvement. Cost
The Group’s cost improvements benefited underlying EBITDA by $0.2 billion, overcoming the effects of above-CPI inflationary pressure on the mining industry. This performance reflected the numerous cost-saving initiatives being implemented across the Group. Other
Improved profitability at the Group’s joint ventures and associates, Samancor, Cerrejón and Jellinbah, added $0.5 billion to underlying EBITDA. This was driven by higher prices on a stable production base. The action taken in 2016 to streamline our portfolio, which included the disposal of our Niobium and Phosphates business and tactical divestments at Metallurgical Coal, had a negative underlying EBITDA impact of $0.2 billion.

-5-
UNDERLYING EARNINGS* Group underlying earnings increased by 48% to $3.3 billion (2016: $2.2 billion), in excess of the 45% increase to underlying EBITDA. Reconciliation to underlying earnings* $ million
Year ended 31 December 2017
Year ended 31 December 2016
Underlying EBITDA* 8,823 6,075 Depreciation and amortisation (2,576) (2,309) Net finance costs and income tax expense (2,223) (1,118) Non-controlling interests (752) (438) Underlying earnings* 3,272 2,210 Depreciation and amortisation
Depreciation and amortisation increased to $2.6 billion (2016: $2.3 billion), reflecting cessation of capitalisation at Grosvenor in August 2016, and at Minas-Rio and Gahcho Kué during the course of 2017, in addition to the effect of stronger local currencies. Net finance costs
Net finance costs, before special items and remeasurements, excluding associates and joint ventures, were $0.5 billion (2016: $0.2 billion). The increase was principally driven by the cessation of capitalisation of borrowing costs associated with Minas-Rio and Grosvenor, leading to a reduction in interest costs capitalised to $35 million (2016: $0.4 billion), as well as the impact of increases in LIBOR. This was partly offset by lower interest expense resulting from reduced average borrowings during the year. Income tax expense
The underlying effective tax rate was 29.7% for the year ended 31 December 2017 (2016: 24.6%). The effective tax rate in 2017 benefited from the reassessment of deferred tax balances, primarily in Australia and Brazil, partly offset by the reassessment of withholding tax provisions, primarily in relation to Chile and South Africa, and the impact of the relative levels of profits arising in the Group’s operating jurisdictions. In future periods, it is expected that the underlying effective tax rate will remain above the United Kingdom statutory tax rate. The tax charge for the year, before special items and remeasurements, was $1.3 billion (2016: $0.7 billion). Non-controlling interests
Non-controlling interests of $0.8 billion (2016: $0.4 billion) principally relate to minority shareholders in Kumba Iron Ore (Iron Ore and Manganese) and has increased as a result of higher profitability at Anglo American Sur (Copper). SPECIAL ITEMS AND REMEASUREMENTS Special items and remeasurements are a net charge of $0.1 billion (2016: net charge of $0.6 billion) and include net impairment reversals of $0.4 billion, relating to the impairment reversal at Sishen (Iron Ore and Manganese) of $0.5 billion, and El Soldado (Copper) of $0.2 billion, partly offset by impairments of the Group’s interest in BRPM (Platinum) and at Coal South Africa. Full details of the special items and remeasurements recorded in the year are included in note 9 to the Condensed financial statements.
Strategic report

-6-
CASH FLOW Cash flows from operations
Cash flows from operations increased by $2.5 billion to $8.4 billion (2016: $5.8 billion), reflecting strong underlying EBITDA from subsidiaries and joint operations and working capital inflows. Cash inflows on operating working capital were $0.9 billion (2016: inflows of $0.4 billion), driven mainly by an increase in operating payables across the Group and, in particular, by a $0.2 billion prepayment from a customer in our Platinum business. Attributable free cash flow*
Attributable free cash flow increased to a $4.9 billion inflow (2016: $2.6 billion inflow). The improvement resulted from a $2.5 billion increase in cash flows from operations and a $0.2 billion reduction in capital expenditure, offset by a $0.6 billion increase in dividends paid to non-controlling interests. NET DEBT*
$ million 2017 2016 Opening net debt* (8,487) (12,901) Underlying EBITDA* from subsidiaries and joint operations 7,632 5,469 Working capital movements 879 391 Other cash flows from operations (136) (22) Cash flows from operations 8,375 5,838 Capital expenditure* (2,150) (2,387) Cash tax paid(1) (843) (465) Dividends from associates, joint ventures and financial asset investments 517 172 Net interest(2) (355) (581) Dividends paid to non-controlling interests (601) (15) Attributable free cash flow* 4,943 2,562 Dividends to Anglo American plc shareholders (618) – Other net debt movements (339) 1,852 Total movement in net debt*(3) 3,986 4,414 Closing net debt* (4,501) (8,487)
(1) 2016 excludes tax payments of $146 million relating to disposals, which are shown as part of net disposal proceeds. (2) Includes cash inflows of $22 million (2016: $89 million), relating to interest payments on derivatives hedging net debt, which are
included in cash flows from derivatives related to financing activities. (3) Net debt excludes the own credit risk fair value adjustment on derivatives of $9 million (2016: $73 million). Net debt (including related derivatives) of $4.5 billion was $4.0 billion lower than at 31 December 2016, representing gearing of 13% (2016: 26%). Net debt at 31 December 2017 comprised cash and cash equivalents of $7.8 billion (2016: $6.0 billion) and gross debt, including related derivatives, of $12.3 billion (2016: $14.5 billion). The reduction in net debt was driven by $4.9 billion of attributable free cash flow, partly offset by the payment of dividends to Group shareholders in September, as well as other net debt movements. BALANCE SHEET Net assets of the Group increased by $4.6 billion to $28.9 billion (2016: $24.3 billion). This reflected the reduction in net debt and net foreign exchange gains relating principally to operations with South African rand and Australian dollar functional currencies. Capital expenditure of $2.2 billion was more than offset by depreciation and amortisation of $2.6 billion.

-7-
ATTRIBUTABLE ROCE* Attributable ROCE increased to 19% (2016: 11%), primarily owing to the 73% improvement in attributable underlying EBIT to $5.1 billion (2016: $3.0 billion), driven by higher prices, higher sales volumes at De Beers, the ongoing ramp-up of production at Minas-Rio in Brazil and the continued delivery of cost efficiency programmes across the Group. This improvement was mitigated by inflation and stronger producer country currencies. Average attributable capital employed was constant at $27.4 billion (2016: $27.4 billion), as capital expenditure and the strengthening of producer currencies were offset by the impact of disposals during 2016 on average capital employed, and a $0.9 billion reduction in working capital during the year. LIQUIDITY AND FUNDING In March 2017, the Group completed the repurchase of $1.3 billion (including the cost of unwinding associated derivatives) of euro- and sterling-denominated bonds with maturities from April 2018 to June 2019. This was followed in April 2017 with a $1.0 billion dual tranche 5- and 10-year issuance in the US bond markets. In September 2017, the Group completed the repurchase of $1.9 billion (including the cost of unwinding associated derivatives) of US- and euro-denominated bonds with maturities from September 2018 to November 2020. Concurrently, the Group issued corporate bonds with a US dollar equivalent value of $2.0 billion, including a $1.3 billion dual tranche 7- and 10-year issuance in the US bond markets and a €0.6 billion 8-year bond in the European bond markets. On 7 February 2018, Anglo American gave notice that it will redeem in full its outstanding $750 million, 9.375% US bond, due April 2019, on 9 March 2018. These transactions, as well as $1.9 billion of bond maturities during 2017, have reduced short term refinancing requirements, increased the weighted average maturity of outstanding debt by approximately one year and reduced gross debt. GROUP CAPITAL EXPENDITURE* Capital expenditure decreased to $2.2 billion (2016: $2.4 billion), due to rigorous capital discipline applied to all project investments, coupled with the commissioning of the Minas-Rio, Gahcho Kué and Grosvenor projects – all previously projects in execution, for which capitalisation has ceased.
$ million
Year ended 31 December 2017
Year ended 31 December 2016
Expansionary 384 967 Stay-in-business 1,310 1,042 Development and stripping 586 551 Proceeds from disposal of property, plant and equipment (52) (23) Total 2,228 2,537 Capitalised operating cash flows (78) (150) Total capital expenditure 2,150 2,387 Stay-in-business capital expenditure increased to $1.3 billion (2016: $1.0 billion), primarily owing to the inclusion of expenditure at these newly commissioned assets and stronger producer currencies. Capital expenditure on our expansionary projects during the year was focused on the ongoing development of De Beers’ Venetia underground mine in South Africa. The project is now well under way, with the underground operation expected to be the mine’s principal source of ore during 2023, extending the life of mine to 2046. In 2018, we expect capital expenditure to increase to between $2.6 and $2.8 billion.
Strategic report Strategic report

-8-
DIVIDENDS Our materially improved balance sheet supported the decision to resume dividend payments at the half year, six months earlier than expected, and a dividend based on 40% of first half underlying earnings was paid in September 2017. The payout ratio based dividend policy provides shareholders with exposure to improvements in product prices, while retaining cash flow flexibility during periods of weaker pricing. In line with the policy, the Board proposes a final dividend of 40% of second half underlying earnings, equal to 54 US cents per share, bringing the total dividends paid and proposed in the year to $1.02 per share. PORTFOLIO UPGRADE Disposals announced and completed
During 2017, we completed the disposal of our 83.3% interest in the Dartbrook coal mine (Metallurgical Coal) to Australian Pacific Coal Limited, our 42.5% interest in the Pandora mine (Platinum) and certain Amandelbult resources (Platinum). In February 2018, we completed the disposal of Platinum’s 85% interest in Union Mine and 50.1% interest in Masa Chrome Company Proprietary Limited in South Africa to a subsidiary of Siyanda Resources Proprietary Limited. Anglo American entered into several sale agreements, the completion of which are subject to, among other things, regulatory approvals, including our 88.2% interest in the Drayton thermal coal mine and Drayton South project in Australia to Malabar Coal Limited. The sale of the Eskom-tied domestic thermal coal operations in South Africa to a wholly owned subsidiary of Seriti Resources Holdings Proprietary Limited is expected to complete on 1 March 2018. In addition, in January 2018, we agreed the sale of the New Largo thermal coal project and Old New Largo closed colliery in South Africa to New Largo Coal Proprietary Limited, which is owned by Seriti Resources Holdings Proprietary Limited, Coalzar Proprietary Limited and the Industrial Development Corporation. Other portfolio changes Bokoni mine (Platinum) in South Africa was placed onto care and maintenance by Platinum’s joint venture partner, Atlatsa Resources, during the year. Damtshaa diamond mine in Botswana, which was placed onto care and maintenance from 1 January 2016, successfully achieved a restart in the fourth quarter of 2017, in preparation for 2018 production. Having exceeded its original diamond production forecast over its expected lifespan, De Beers’ Victor mine in Canada is due to close in 2019, when the open pit will have been depleted. THE BOARD With effect from the conclusion of the Annual General Meeting held on 24 April 2017, Nolitha Fakude joined the Board as a non-executive director and Stephen Pearce succeeded René Médori as finance director. Mr Médori left the Board with effect from that date. Ian Ashby was appointed to the Board as a non-executive director on 25 July 2017. Mr Stuart Chambers joined the Board as a non-executive director and chairman designate on 1 September 2017. Sir John Parker retired from the Board on 31 October 2017 and was succeeded as chairman by Mr Chambers with effect from 1 November 2017.
Strategic report

-9-
PRINCIPAL RISKS AND UNCERTAINTIES Anglo American plc is exposed to a variety of risks and uncertainties which may have a financial, operational or reputational impact on the Group, and which may also have an impact on the achievement of social, economic and environmental objectives. The principal risks and uncertainties facing the Group at the 2017 year-end are set out in detail in the strategic report section of the Annual Report 2017. The principal risks relate to the following: • Catastrophic risks • Political and regulatory • Competitive position • Investor activism • Future demand for diamonds • Future demand for PGMs • Cyber security • Safety • Commodity prices • Corruption • Operational performance including delivery of cash targets The Group is exposed to changes in the economic environment, as with any other business. Details of any key risks and uncertainties specific to the period are covered in the Operations review section. The Annual Report 2017 will be available on the Group’s website from 5 March 2018. www.angloamerican.com

-10-
Operations review for the year ended 31 December 2017
DE BEERS Financial and operational metrics(1)
Production
volume Sales
volume
Price Unit cost* Revenue*
Underlying EBITDA*
Underlying EBITDA margin
Underlying EBIT* Capex* ROCE*
’000
carats ’000
carats(2) $/ct(3) $/ct(4) $m(5) $m $m $m(6) De Beers 33,454 32,455 162 63 5,841 1,435 25% 873 273 9%
Prior year 27,339 29,965 187 67 6,068 1,406 23% 1,019 526 11% Botswana (Debswana) 22,684 – 159 28 – 484 – 447 86 –
Prior year 20,501 – 152 26 – 571 – 543 90 – Namibia (Namdeb Holdings) 1,805 – 539 257 – 176 – 146 33 –
Prior year 1,573 – 528 245 – 184 – 163 65 – South Africa (DBCM) 5,208 – 129 62 – 267 – 119 114 –
Prior year 4,234 – 121 53 – 268 – 172 156 –
Canada(7) 3,757 – 235 57 – 205 – 58 (5) – Prior year 1,031 – 271 212 – 79 – 13 184 –
Trading – – – – – 449 – 443 1 – Prior year – – – – – 378 – 371 3 –
Other(8) – – – – – (146) – (340) 44 –
Prior year – – – – – (74) – (243) 28 – (1) Prepared on a consolidated accounting basis, except for production, which is stated on a 100% basis except for the Gahcho Kué joint
venture in Canada, which is on an attributable 51% basis. (2) Consolidated sales volumes (2017: 33.1 million carats; 2016: 30.0 million carats) exclude pre-commercial production sales volumes
from Gahcho Kué. Total sales volumes (100%), which are comparable to production, were 35.1 million carats (2016: 32.0 million carats). Total sales volumes (100%) include pre-commercial production sales volumes from Gahcho Kué and De Beers’ JV partners’ 50% proportionate share of sales to entities outside De Beers from the Diamond Trading Company Botswana and the Namibia Diamond Trading Company.
(3) Pricing for the mining business units is based on 100% selling value post-aggregation of goods. The De Beers realised price includes the price impact of the sale of non-equity product and, as a result, is not directly comparable to De Beers unit costs, which relate to equity production only.
(4) Unit cost is based on consolidated production and operating costs, excluding depreciation and operating special items, divided by carats recovered.
(5) Includes rough diamond sales of $5.2 billion (2016: $5.6 billion). (6) Includes pre-commercial production capitalised operating cash inflows from Gahcho Kué. (7) For Canada, price excludes Gahcho Kué contribution from sales related to pre-commercial production, which were capitalised in the
first half of 2017. Unit costs include Gahcho Kué contribution following achievement of commercial production on 2 March 2017. (8) Other includes Element Six, downstream, acquisition accounting adjustments, projects and corporate. Financial and operational overview Underlying EBITDA increased by 2% to $1,435 million (2016: $1,406 million) despite lower revenue following the one-off industry midstream restocking in 2016. This performance was driven by improved margins, which benefited from lower unit costs (supported by higher production and efficiency drives across the business), a strong contribution from Canada (driven by Gahcho Kué’s ramp-up and the closure of Snap Lake), and Element Six (which benefited from a recovery in oil and gas markets). This was partly offset by unfavourable exchange rates, and an increasing proportion of waste mining costs being expensed rather than capitalised, owing to an improved strip ratio at Venetia in South Africa.
Strategic report

-11-
Total revenue declined by 4% to $5.8 billion (2016: $6.1 billion) – as expected, given the benefit of strong midstream restocking in the first half of 2016. The average realised rough diamond price decreased by 13% to $162/carat (2016: $187/carat) mainly owing to a lower value mix; this was partly offset by an 8% increase in consolidated sales volumes to 32.5 million carats (2016: 30.0 million carats). This reflected stronger demand for lower-value goods in Sight 1 of 2017, following a recovery from the initial impact of India’s demonetisation programme in late 2016, as well as the ramp-up of production from lower value per carat but high margin operations, including Orapa and Gahcho Kué. The lower-value mix was compensated in part by a higher average rough price index, which was 3% above that of 2016. Capital expenditure reduced by 48% to $273 million (2016: $526 million), mainly owing to the completion of major projects, including Gahcho Kué; Debmarine Namibia’s new exploration and sampling vessel, the SS Nujoma; and planned lower waste capitalisation at Venetia. The SS Nujoma, which was delivered three months ahead of schedule and under budget, was officially inaugurated in June 2017 and is fully operational. Markets Early signs are that global consumer demand for diamond jewellery registered positive growth in 2017 in US dollar terms, following a marginal increase in 2016. Sustained diamond jewellery demand growth in the US was once again the main contributor to this positive outcome. Demand for diamond jewellery by Chinese consumers grew marginally, in local currency and dollar terms. In contrast, consumer demand for diamonds softened in India and the Gulf states, both in local currency and dollar terms, while Japan’s consumer demand growth was flat in local currency and lower in dollars. Diamond producers’ primary stocks are estimated to have reduced considerably during the first half of 2017, as sentiment in the midstream improved and rough and polished inventories normalised for businesses in this segment of the value chain. However, as a result of US retailers tightly managing their inventories and the earlier timing of Diwali in India, there was a slight seasonal build-up of polished inventory in the midstream going into the fourth quarter. Overall, early indications are that additional consumer marketing undertaken during the main selling season had a positive effect on polished demand in the US, China and India in the final quarter of the year, leading to a positive impact on overall polished inventories. Operating performance Mining and manufacturing
Rough diamond production increased by 22% to 33.5 million carats (2016: 27.3 million carats), reflecting stronger underlying trading conditions as well as the contribution from the ramp-up of Gahcho Kué. Botswana (Debswana) increased production by 11% to 22.7 million carats (2016: 20.5 million carats). Production at Orapa was 28% higher, mainly driven by planned increases in plant performance and the ramp-up of Plant 1, which was previously on partial care and maintenance in response to trading conditions in late 2015. In June 2017, Jwaneng processed its first ore from Cut-8, which is expected to become the mine’s main source of ore during 2018. In Namibia (Namdeb Holdings), production increased by 15% to 1.8 million carats (2016: 1.6 million carats), primarily owing to higher production from Debmarine Namibia’s Mafuta vessel, driven by higher mining rates following an extended scheduled in-port during 2016. At Namdeb’s land operations, production rose by 6%, despite challenging conditions, including grade variability owing to the nature of alluvial deposits, structural cost pressures, and some operations nearing the end of their lives. In South Africa (DBCM), production increased by 23% to 5.2 million carats (2016: 4.2 million carats), primarily owing to Venetia, driven by higher grades as well as improved operational performance benefiting tonnes treated. Construction continues on the Venetia Underground mine, which is expected to become the mine’s principal source of production during 2023.
-12-
In Canada, production increased to 3.8 million carats (2016: 1.0 million carats) owing to the ramp-up of Gahcho Kué, which entered commercial production in March 2017. During the year, Gahcho Kué benefited from higher than expected grades, partly offset by a lower average value of production. Owing to the differences in lobe characteristics across different kimberlite pipes, the average grade and realised price will continue to vary and will be dependent on the area mined. Production at Victor increased by 21% to 0.7 million carats as a result of higher grades. Victor, which has been operating successfully since 2008, is due to close in 2019, when the open pit is expected to have been depleted. The closure of Snap Lake, which is currently on care and maintenance, is progressing, with flooding having been completed, thereby minimising holding costs while preserving the long term viability of the orebody. Other revenue includes Element Six, which grew strongly, driven primarily by a recovery in the oil and gas business but also supported by the automotive and consumer electronics segments. Brands In March 2017, De Beers acquired its joint venture partner’s 50% shareholding in De Beers Jewellers (DBJ). With full ownership of the business (and the De Beers corporate brand), the process of integrating the DBJ brand and network of 30 stores in 16 key consumer markets around the world is well under way. Forevermark™ continued to expand its retailer network and is now available in more than 2,200 outlets in 25 markets, an increase of 10% since the end of 2016. By May 2017, Forevermark™ had inscribed its two-millionth diamond, the second million having taken only half the time it took to inscribe the first million. For the peak holiday sales period, the brand launched “Forevermark Tribute™ Collection”, a significant marketing investment across multiple channels in the key US market. The Tribute™ Collection, and its supporting campaign, symbolises and celebrates the many facets of the wearer, and reflects the growing trend for women to self-purchase. In February 2017, De Beers unveiled its next-generation automated melée screening instrument (AMS2™), which is significantly less expensive, screens 10 times faster, can handle stones three times smaller, and has lower referral rates than its predecessor. In addition, an industry-first synthetic-screening device for stones in set jewellery (SYNTHdetect™) was launched in June 2017, along with the roll-out by the International Institute of Diamond Grading & Research of a synthetics-detection training course. During 2017, De Beers invested more than $140 million in marketing (19% more than in 2016) through a combination of proprietary and partnership activity centred on the US, China and India. De Beers also substantially increased its investment in the Diamond Producers Association, a producer-wide body that works to enhance consumer demand by promoting the appeal, integrity and reputation of diamonds. De Beers also began the development of a new digital platform for the diamond industry, backed by highly secure blockchain technology, which will provide a single immutable record for every diamond that is registered. Currently in the pilot phase, this initiative is being designed to underpin confidence in diamonds and the diamond industry for all stakeholders, while streamlining existing manual processes and creating new efficiencies in the value chain. Outlook Improving global macro-economic conditions remain supportive of consumer demand growth for polished diamonds in 2018. The degree of global economic growth, however, will be dependent upon a number of factors, including the extent of the positive impact on growth in consumer spending from US tax cuts, the strength of the dollar on consumer demand in non-dollar-denominated countries, and how successfully China manages its adjustment to a more domestic consumer-driven economy. For 2018, forecast diamond production (on a 100% basis except Gahcho Kué on an attributable 51% basis) is expected to be in the range of 34-36 million carats, subject to trading conditions.

-13-
COPPER Financial and operational metrics
Production
volume Sales
volume Price
C1 unit cost* Revenue*
Underlying EBITDA*
Underlying EBITDA
margin(3) Underlying
EBIT* Capex* ROCE*
kt kt(1) c/lb c/lb(2) $m $m $m $m Copper 579 580 290 147 4,233 1,508 41% 923 665 16% Prior year 577 578 225 137 3,066 903 31% 261 563 6%
Los Bronces 308 307 – 169 1,839 737 40% 401 245 – Prior year 307 308 – 156 1,386 326 24% (49) 241 –
Collahuasi(4) 231 232 – 113 1,314 806 61% 594 243 – Prior year 223 223 – 111 1,068 569 53% 342 144 –
Other operations 40 41 – – 1,080 76 16% 39 177 – Prior year 47 47 – – 612 83 18% 43 178 –
Projects and corporate – – – – – (111) – (111) – –
Prior year – – – – – (75) – (75) – – (1) Excludes 111 kt third-party sales. (2) C1 unit cost includes by-product credits. (3) Excludes impact of third-party sales. (4) 44% share of Collahuasi production, sales and financials. Financial and operating overview Underlying EBITDA increased by 67% to $1,508 million (2016: $903 million), primarily as a result of a 27% increase in the average LME copper price, as well as a continued focus on cost-reduction initiatives. Production increased to 579,300 tonnes, with solid performances at Los Bronces and Collahuasi partly offset by the impact of lost production at El Soldado, owing to the temporary suspension of mining operations in the first half. At 31 December 2017, 108,000 tonnes of copper were provisionally priced at 328 c/lb. Markets
The differences between market price and realised price are largely a function of the timing of sales across the year and provisional pricing adjustments. The increase in price in 2017 reflects improved demand and a slowdown in mine supply, stimulating more favourable investor sentiment. Operating performance At Los Bronces, production in 2017 increased marginally to 308,300 tonnes (2016: 307,200 tonnes). Higher grades (2017: 0.71% vs 2016: 0.67%) were partly offset by lower throughput, following a failure in the ball mill stator at the processing plant during the third and fourth quarters. C1 unit costs increased by 8% to 169 c/lb (2016: 156 c/lb), reflecting the effect of the stronger Chilean peso and cost inflation.
2017 2016
Average market price (c/lb) 280 221 Average realised price (c/lb) 290 225

-14-
At Collahuasi, Anglo American’s attributable share of copper production was 230,500 tonnes, an increase of 3% (2016: 222,900 tonnes). It was another year of record copper in concentrate production for the operation, building on 2016’s record output. Production benefited from higher grades, as well as strong sustained plant performance following the completion of a two-month planned maintenance at the processing plant in the second quarter. C1 unit costs were 113 c/lb (2016: 111c/lb), with the increase in production and continued cost-saving initiatives partly offsetting the effects of the stronger Chilean peso, cost inflation and lower by-product credits. Production at El Soldado decreased by 14% to 40,500 tonnes (2016: 47,000 tonnes), owing largely to the temporary suspension of mine operations from 18 February to 28 April 2017, which resulted in 6,000 tonnes of lost production. C1 unit costs increased by 27% to 233 c/lb (2016: 184 c/lb) as a result of the lower output, the stronger Chilean peso and cost inflation. Operational outlook Production in 2018 is expected to increase with the planned mining of higher ore grades at Collahuasi and Los Bronces. Production guidance for 2018 has been tightened to 630,000-660,000 tonnes.

-15-
PLATINUM Financial and operational metrics
Production volume
platinum
Production volume
palladium
Sales volume
platinum Basket
price Unit cost* Revenue*
Underlying EBITDA*
Underlying EBITDA margin
Underlying EBIT* Capex* ROCE*
koz(1) koz(1) koz $/Pt oz(2) $/Pt oz(3) $m $m $m $m
Platinum 2,397 1,557 2,505 1,966 1,443 5,078 866 17% 512 355 10% Prior year 2,382 1,539 2,416 1,753 1,330 4,394 532 12% 185 314 4%
Mogalakwena 464 509 467 2,590 1,179 1,211 578 48% 448 151 – Prior year 412 452 415 2,345 1,257 968 393 41% 269 157 –
Amandelbult(4) 438 202 459 1,868 1,596 858 88 10% 34 34 – Prior year 459 207 466 1,567 1,254 727 97 13% 41 25 –
Purchase of concentrate(5) 1,021 549 1,082 – – 1,884 173 9% 145 – –
Prior year 652 388 656 – – 1,033 96 9% 77 – –
Other operations 474 297 497 – – 1,125 83 7% (59) 170 – Prior year 859 492 879 – – 1,666 (14) (1)% (162) 129 –
Projects and corporate – – – – – – (56) – (56) – –
Prior year – – – – – – (40) – (40) 3 –
(1) Production disclosure reflects own-mined production and purchase of metal in concentrate. (2) Average US$ basket price. (3) Total cash operating costs – includes on-mine, smelting and refining costs only. (4) Excludes 8 koz (2016: 8 koz) of platinum production now included in purchase of concentrate. (5) Purchase of concentrate from joint ventures, associates and third parties for processing into refined metal. Financial and operating overview Underlying EBITDA increased by 63% to $866 million (2016: $532 million), largely as a result of higher sales volumes (platinum, palladium and some minor metals) and stronger prices for palladium and rhodium. Lower local currency costs, driven by ongoing cost improvement initiatives, were offset by the stronger South African rand, resulting in an 8% increase in US dollar costs to $1,443/ounce (2016: $1,330/ounce). Markets
An increase in palladium and rhodium prices, driven by strong demand, supported a stronger basket price in both dollars and rand, despite a lower average platinum price during the year. Operating performance Total platinum production (metal in concentrate), including both own-mined production and purchase of concentrate, increased by 1% to 2,397,400 ounces (2016: 2,381,900 ounces). Total palladium production (metal in concentrate), including both own-mined production and purchase of concentrate, was also 1% higher at 1,557,300 ounces (2016: 1,538,700 ounces).
2017 2016 Average platinum market price ($/oz) 950 989 Average palladium market price ($/oz) 871 615 Average rhodium market price ($/oz) 1,097 681 Average gold market price ($/oz) 1,258 1,248 US$ realised basket price ($/Pt oz) 1,966 1,753 Rand realised basket price (R/Pt oz) 26,213 25,649

-16-
Production from own-managed mines
Platinum produced from own-managed mines, excluding projects, increased by 3% to 1,130,900 ounces (2016: 1,096,200 ounces), while palladium production grew by 7% to 847,200 ounces (2016: 789,600 ounces). Platinum’s flagship Mogalakwena mine produced a record 463,800 ounces of platinum (2016: 411,900 ounces) and 508,900 ounces of palladium (2016: 452,000 ounces), a 13% increase for both. The increase resulted from improved concentrator throughput and recoveries following implementation of the North concentrator plant optimisation project, as well as higher average grades. Amandelbult complex yielded 438,000 ounces of platinum (2016: 458,600 ounces) and 202,500 ounces of palladium (2016: 207,300 ounces), representing decreases of 4% and 2% respectively. This was caused primarily by excessive rainfall in the first quarter, which constrained production from the surface operations, lower immediately available Ore Reserves, and increased development as the mine makes its transition from the Tumela Upper to the Dishaba Lower mining areas. Production was further affected by three fatal incidents and their subsequent associated safety stoppages. Unki mine in Zimbabwe maintained its platinum production level for the year at 74,600 ounces (2016: 74,500 ounces), while raising its palladium output by 5% to 64,400 ounces (2016: 61,400 ounces). This performance was largely driven by more efficient mining, which reduced waste mining, resulting in higher-grade ore being delivered to the concentrator. Owing to planned maintenance at the concentrator in the fourth quarter, Unki had an ore stockpile at the end of 2017, which will be processed in 2018. Union mine produced 154,500 ounces of platinum (2016: 151,200 ounces) and 71,400 ounces of palladium (2016: 68,900 ounces), increases of 2% and 4% respectively, as a result of improved stoping efficiencies. As announced by Platinum on 26 January 2018, Union mine has now been sold to Siyanda Resources Proprietary Limited, effective 1 February 2018. With effect from this date, Union mine’s output is being recognised as third-party purchase of concentrate. Joint venture production
Platinum and palladium production from the Mototolo, Modikwa and Kroondal joint ventures, inclusive of both own-mined share and purchase of concentrate production, decreased by 3% and 1% respectively, to 490,600 ounces of platinum (2016: 505,600 ounces) and 323,100 ounces of palladium (2016: 327,800 ounces). The decrease was largely due to the stoppage of the Mototolo concentrator for remedial work to stabilise the tailings storage facility. This resulted in a 27% reduction in platinum output to 85,300 ounces (2016: 116,700 ounces) and a 26% reduction in palladium output to 52,500 ounces (2016: 70,700 ounces). Modikwa platinum production rose by 10% to 126,700 ounces (2016: 114,800 ounces), and palladium production by 9% to 122,700 ounces (2016: 112,200 ounces) on the back of increased underground mining efficiencies and improved concentrator recoveries. Kroondal’s production was slightly higher owing to increased underground productivity, with platinum and palladium production both 2% higher at 278,600 ounces (2016: 274,100 ounces) and 147,900 ounces (2016: 144,900 ounces) respectively. Purchase of concentrate from associates
Total platinum production from associates decreased by 5% to 265,500 ounces (2016: 279,300 ounces), while palladium production was 10% lower at 127,900 ounces (2016: 141,700 ounces). BRPM produced 211,900 ounces of platinum (2016: 195,900 ounces) and 87,600 ounces of palladium (2016: 81,300 ounces), both increasing by 8%, as the Styldrift project continued its ramp-up. On 31 October 2017, Bokoni mine was placed onto care and maintenance by Platinum’s joint venture partner, Atlatsa Resources, resulting in a 36% reduction in platinum output to 53,600 ounces (2016: 83,400 ounces) and a 33% decrease in palladium output to 40,300 ounces (2016: 60,400 ounces). No further loss-making production will be produced from Bokoni while the mine and concentrator remain on care and maintenance.

-17-
Purchase of concentrate from third parties
Increased third-party purchases of concentrate led to a yearly total of 510,400 ounces of platinum (2016: 119,800 ounces) and 259,200 ounces of palladium (2016: 82,600 ounces). Production from Rustenburg has been purchased since 1 November 2016, when the operation was sold to Sibanye. The Maseve operation, owned by Platinum Group Metals, was placed onto care and maintenance in the third quarter. No further third-party purchase of concentrate is currently expected from the Maseve mine. Refined production
Refined platinum production increased by 8% to 2,511,900 ounces (2016: 2,334,700 ounces), and refined palladium production by 14% to 1,668,500 ounces (2016: 1,464,200 ounces). Refined production in 2016 was materially affected by a Section 54 safety stoppage at the Precious Metals Refinery, as well as by a run-out at the Waterval smelter in September of that year; the subsequent recovery from these developments was largely responsible for the increase in output in 2017. The planned rebuild of the Waterval No. 2 furnace in the first quarter of 2017, and a high-pressure water leak at the converter plant in June 2017, delayed refining the backlog of material from 2016 to the second half of the year, with the full additional 100,000 ounces refined by year end. Platinum sales volumes increased by 4% to 2,504,600 ounces (2016: 2,415,700 ounces), while palladium sales volumes rose by 3% to 1,571,700 ounces (2016: 1,532,100 ounces), in line with higher refined production. Operational outlook Platinum production (metal in concentrate) for 2018 is expected to be 2.3-2.4 million ounces. Palladium production (metal in concentrate) for 2018 is expected to be 1.5-1.6 million ounces.

-18-
IRON ORE AND MANGANESE Financial and operational metrics
Production
volume Sales
volume Price Unit
cost* Revenue* Underlying
EBITDA*
Underlying EBITDA margin
Underlying EBIT* Capex* ROCE*
Mt(1) Mt $/t(2) $/t(3) $m $m $m $m Iron Ore and Manganese – – – – 5,831 2,357 40% 1,978 252 21%
Prior year – – – – 3,426 1,536 45% 1,275 269 12% Kumba Iron Ore 45.0 44.9 71 31 3,486 1,474 42% 1,246 229 47%
Prior year 41.5 42.5 64 27 2,801 1,347 48% 1,135 160 51% Iron Ore Brazil 16.8 16.5 65 30 1,405 435 31% 335 23
(5) 6%
Prior year 16.1 16.2 54 28 – (6) – (6) 109 (1)%
Samancor(4) 3.6 3.6 – – 940 529 56% 478 – 115% Prior year 3.3 3.4 – – 625 258 41% 209 – 59% Projects and corporate – – – – – (81) – (81) – –
Prior year – – – – – (63) – (63) – –
(1) Iron Ore Brazil production is Mt (wet basis). (2) Prices for Kumba Iron Ore are the average realised export basket price (FOB Saldanha). Prices for Iron Ore Brazil are the average
realised export basket price (FOB Açu) (wet basis). (3) Unit costs for Kumba Iron Ore are on an FOB dry basis. Unit costs for Iron Ore Brazil are on an FOB wet basis. (4) Production, sales and financials include ore and alloy. (5) $80 million of capital expenditure offset by capitalised cash inflows of $31 million relating to working capital in place at
31 December 2016, in addition to a $25 million inflow relating to capex hedges. Financial and operating overview Kumba
Underlying EBITDA of $1,474 million was 9% higher (2016: $1,347 million), with a 6% improvement in total sales volumes and an 11% increase in the realised price being offset by a 15% increase in FOB unit costs. The increase in unit costs was largely driven by the impact of the stronger South African rand (rand FOB unit costs increased by 2%) and cost inflation, including higher rail costs. This was partly offset, however, by productivity gains in mining and processing that led to an 8% rise in production, and through a higher premium achieved for lump product. In line with higher production volumes, export sales volumes increased by 7% to 41.6 Mt (2016: 39.1 Mt). Total finished product stock also increased to 4.3 Mt (2016: 3.5 Mt), reflecting the increase in output. Iron Ore Brazil
Underlying EBITDA amounted to $435 million (2016: $6 million loss), reflecting the operation’s continued ramp-up to its current operating capacity and the cessation of capitalisation of operating results since January 2017. The average FOB realised price of $65/wet metric tonne (equivalent to $71/dry metric tonne) was $11/tonne, or 20%, higher than that achieved in 2016. FOB unit costs increased by 7% to $30/wet metric tonne (2016: $28/wet metric tonne) as higher production volumes and the implementation of cost reduction initiatives only partly offset the strengthening of the Brazilian real.
Strategic report
-19-
Samancor
Underlying EBITDA increased by $271 million to $529 million (2016: $258 million), driven mainly by significantly higher realised manganese ore and alloy prices and a 7% increase in ore sales. Markets
Iron ore 2017 2016 Average market price (IODEX 62% Fe CFR China – $/tonne) 71 58 Average market price (MB 66% Fe Concentrate CFR – $/tonne) 87 69 Average realised price (Kumba export – $/tonne) (FOB Saldanha) 71 64 Average realised price (Minas-Rio – $/tonne) (FOB wet basis) 65 54 Kumba’s outperformance over the IODEX (Platts) 62% Fe CFR China index is primarily representative of the higher iron (Fe) content and the relatively high proportion (approximately 66%) of lump in the overall product portfolio. Minas-Rio produces higher grade products than the reference product used for the IODEX 62% Fe index. The pricing of Minas-Rio’s products reflects the higher Fe content and lower gangue of those products compared with the IODEX 62% reference. IODEX 62% is referred to for comparison purposes only. Manganese
During 2017, the average benchmark manganese ore price (benchmark CRU 44% CIF China) increased by 36% to $5.97/dmtu (2016: $4.38/dmtu), largely attributable to higher Chinese steel production and limited ore supply in the market, resulting from production cuts made in late 2015 and early 2016. Operating performance Kumba
Sishen’s production increased by 10% to 31.1 Mt (2016: 28.4 Mt) following improvements in mining productivity resulting from fleet efficiencies and higher plant yields, brought about from the implementation of the Operating Model. Consequently, the amount of waste mined rose, as planned, to 162 Mt (2016: 137 Mt), an 18% increase. Additional operator training, changed shift patterns, together with higher workforce attendance rates, yielded positive results in the form of increased direct operating hours, enabling the mine to reduce its reliance on contractors. Kolomela’s production increased by 9% to 13.9 Mt (2016: 12.7 Mt), also reflecting productivity improvements following the roll-out of the Operating Model. Waste mining volumes grew by 11% to 55.6 Mt (2016: 50.2 Mt), supporting higher production levels. The Kolomela modular plant delivered 0.5 Mt, although performance was affected by delays in the ramp-up of the crushing plant. Iron Ore Brazil
Minas-Rio’s production of 16.8 Mt (wet basis) was 4% higher (2016: 16.1 Mt) as the operation continued to ramp up its current operating capacity. The ramp-up schedule was affected as mining operations were restricted to the remaining Ore Reserves in the Step 2 licence area, which included lower grade ore.

-20-
Samancor
Manganese ore output increased by 11% to 3.5 Mt (attributable basis) (2016: 3.1 Mt). Production from the Australian operations was 7% higher owing to increased concentrator throughput and higher yields as a result of favourable weather and the availability of suitable feed types. The South African operations increased production by 18%, taking advantage of stronger demand and pricing and the sale of lower quality fines product. Production of manganese alloys increased by 8% to 149,200 tonnes (attributable basis) (2016: 137,800 tonnes), mainly as a result of improved power availability at the Australian operations. In South Africa, manganese alloy production continued to utilise only one of the operation’s four furnaces. Operational outlook Kumba
Kumba’s full year production guidance for 2018 has been increased to 44-45 Mt following the recent strong performance at both Sishen and Kolomela. Sishen is expected to produce 30-31 Mt of product and mine 170-180 Mt of waste. Kolomela is expected to produce around 14 Mt, while waste removal, in support of the increased annual output, is expected to be around 55-57 Mt. Iron Ore Brazil
Minas-Rio continues to focus on obtaining the Step 3 operating licence required for the operation to access the full range of run-of-mine ore grades and target the operation’s nameplate capacity of 26.5 Mt (wet basis). The Step 3 installation licence was granted in January 2018, following delays during 2017, which will allow the Step 3 construction work to proceed. As a consequence of receiving the installation licence, the Provisional Operational Authorisation (‘APO’) is expected before November 2018 and the full Step 3 operational licence by mid-2019. Production guidance for 2018 has been lowered to 13-15 Mt (previously 15-18 Mt) as a result of the lower ore grades at the remaining Step 2 area and the delays to the Step 3 operational licence process. In 2018, unit costs are expected to increase as a result of lower production volumes, and to be in the region of $35/wet metric tonne. Samancor
Australian manganese ore production guidance of 2.1 Mwmt (100% basis) for 2018 remains unchanged. South African manganese ore production guidance has increased by 8% to 3.4 Mwmt (100% basis), subject to continued strong market demand. Legal
Sishen consolidated mining right granted
Sishen’s application to extend the mining right by the inclusion of the adjacent Prospecting Rights was granted on 6 July 2017, and the process to amend the Sishen mining right continues. Mining operations in this area will only commence once the required environmental authorisation has been approved, which is expected soon. The grant allows Sishen mine to expand its current mining operations within the adjacent Dingleton area.
-21-
COAL Financial and operational metrics
Production
volume Sales
volume Price Unit cost* Revenue*
Underlying EBITDA*
Underlying EBITDA
margin(5) Underlying
EBIT* Capex* ROCE*
Mt(1) Mt(2) $/t(3) $/t(4) $m $m $m $m Coal 48.9 49.0 – – 7,211 2,868 46% 2,274 568 67%
Prior year 50.7 50.6 – – 5,263 1,646 36% 1,112 613 29%
Metallurgical Coal 19.7 19.8 185 61 3,675 1,977 54% 1,594 416 86% Prior year 20.9 20.7 112 51 2,547 996 39% 661 523 30%
Coal South Africa 18.6 18.6 76 44 2,746 588 32% 466 152 54% Prior year 19.1 19.1 60 34 2,109 473 33% 366 90 41%
Cerrejón 10.6 10.6 75 31 790 385 49% 296 – 35%
Prior year 10.7 10.8 56 28 607 235 39% 143 – 17%
Projects and corporate
– – – – – (82) – (82) – –
Prior year – – – – – (58) – (58) – –
(1) Production volumes are saleable tonnes. South African production volume is export production only and excludes Eskom-tied operations volumes of 23.9 Mt (2016: 24.8 Mt) and other domestic production of 7.5 Mt (2016: 9.9 Mt). Metallurgical Coal production volumes excludes thermal coal production volumes of 1.6 Mt (2016: 9.5 Mt, including 5.6 Mt of domestic thermal coal).
(2) South African sales volumes exclude all domestic sales of 32.0 Mt (2016: 34.5 Mt) and non-equity traded sales of 7.6 Mt (2016: 6.1 Mt). Metallurgical Coal sales volumes exclude thermal coal sales of 1.8 Mt (2016: 9.6 Mt, including 5.4 Mt of domestic thermal coal).
(3) Metallurgical Coal is the weighted average hard coking coal and PCI sales price achieved. Coal South Africa is the weighted average export thermal coal price achieved.
(4) FOB cost per saleable tonne, excluding royalties. Metallurgical Coal excludes study costs and Callide. Coal South Africa unit cost is for the export operations.
(5) Excludes impact of third-party sales and Eskom-tied operations. Financial and operating overview Metallurgical Coal
Underlying EBITDA doubled to $1,977 million (2016: $996 million), owing to a 65% increase in the metallurgical coal realised price and higher production at all three underground operations. This was partly offset by planned production cuts at Dawson and Capcoal open cut operations and the impact of divestments on output. Following the divestments of Foxleigh (a PCI producer) and Callide (a domestic and export thermal coal producer), and the cessation of mining activities at Drayton (an export thermal coal producer), the business now produces a greater proportion of higher-margin hard coking coal (80% of total production, compared with 53% in 2016). Coal South Africa
Underlying EBITDA increased by 24% to $588 million (2016: $473 million), mainly attributable to a 27% increase in the export thermal coal price. US dollar unit costs for the export trade operations increased by 29% to $44/tonne (2016: $34/tonne), owing to the stronger South African rand ($4/tonne impact), lower production ($4/tonne impact), mainly at Khwezela, and cost-inflation pressures ($2/tonne). The sale of the Eskom-tied domestic thermal coal operations consisting of New Vaal, New Denmark, and Kriel collieries, as well as four closed collieries (together, ‘Eskom-tied operations’) by Anglo Operations Proprietary Limited and Anglo American Inyosi Coal Proprietary Limited to a wholly owned subsidiary of Seriti Resources Holdings Proprietary Limited was announced on 10 April 2017 for a consideration payable, as at 1 January 2017, of R2.3 billion (approximately $164 million). The transaction is expected to complete on 1 March 2018.
-22-
The sale of the New Largo thermal coal project and Old New Largo closed colliery in South Africa (together, ‘New Largo’) by Anglo American Inyosi Coal Proprietary Limited to New Largo Coal Proprietary Limited for R850 million (approximately $71 million), was announced on 29 January 2018. The sale is subject to conditions precedent customary for a transaction of this nature, including regulatory approvals in South Africa. The transaction is expected to close in the second half of 2018. The financial results reported for the period ended 31 December 2017 include the Eskom-tied domestic thermal coal operations and New Largo. Cerrejón
Underlying EBITDA increased to $385 million (2016: $235 million), owing mainly to higher export thermal coal prices, partly offset by a 2% decrease in sales volumes. Markets Metallurgical coal
2017 2016 Average market price for premium low-volatility hard coking coal ($/tonne)(1) 188 143 Average market price for premium low-volatility PCI ($/tonne)(1) 119 97 Average realised price for premium low-volatility hard coking coal ($/tonne) 187 119 Average realised price for PCI ($/tonne) 125 77 (1) Represents average spot prices. Prior year prices were previously based on the quarterly average benchmark and have been restated
accordingly. Average realised prices differ from the average market price owing to differences in material grade and timing of contracts. Prices in 2017 were supported by higher steel prices and strong demand globally, as well as by supply constraints arising from wet weather in Queensland in the second quarter. Thermal coal
The average realised price for thermal coal will differ from the average market price owing to timing and quality differences relative to the industry benchmark. The difference in the realised price compared with the benchmark price, between 2016 and 2017, reflects changing quality mix owing to a higher proportion of secondary products being sold into the export market. The thermal coal market saw the positive price effects of the Chinese domestic coal production rationalisation, which supported coal imports into China and lifted seaborne pricing. On the supply side, Australia was stable, while Indonesia was constrained owing to mining issues associated with ongoing wet weather. The Atlantic region saw coal prices supported by higher electricity prices, partly driven by nuclear outages in France.
2017 2016
Average market price ($/tonne, FOB Australia) 89 66 Average market price ($/tonne, FOB South Africa) 84 64 Average market price ($/tonne, FOB Colombia) 78 58 Average realised price – Export Australia ($/tonne, FOB) 91 55 Average realised price – Export South Africa ($/tonne, FOB) 76 60 Average realised price – Domestic South Africa ($/tonne) 21 17 Average realised price – Colombia ($/tonne, FOB) 75 56

-23-
Operating performance Metallurgical Coal
Production from the underground longwall operations was 14% higher at 12.3 Mt (2016: 10.8 Mt), and included 0.3 Mt from the ramp-up of Grosvenor and record production of 5.4 Mt from Moranbah. Both Capcoal open cut and Dawson recorded lower production as the sites established alternative pit areas and removed higher-cost production. Following a recovery from the geological issues experienced in the first six months, and a strong operational performance through the third quarter, Grosvenor completed its first longwall panel during the final quarter of 2017, and also completed an extended longwall move in order to rectify defective components identified during the first panel. Production on the second longwall panel commenced in December and is in line with the ramp-up plan. Coal South Africa
Export production decreased by 3% to 18.6 Mt (2016: 19.1 Mt), with continued productivity improvements at the underground operations more than offset by a self-enforced 100-hour safety stoppage at all operations following the third fatality of the year. In addition, at Khwezela there were operational challenges with the waste fleet and coal recovery operations. Total production from trade mines decreased by 11% to 22.0 Mt (2016: 24.6 Mt), mainly owing to the planned ramp-down of Khwezela’s Eskom pit, which reached its end of life in the first half of 2017. Production from Eskom-tied operations decreased by 4% to 23.9 Mt (2016: 24.8 Mt) due to lower Eskom offtake from New Vaal and reserve constraints at Kriel as it approaches the end of its mine life. Cerrejón
Anglo American’s attributable output from its 33.3% shareholding in Cerrejón was 10.6 Mt, in line with the prior year. Operational outlook Metallurgical Coal
Export metallurgical coal production guidance for 2018 is unchanged at 20-22 Mt. Export thermal coal
Full year production guidance for 2018 for export thermal coal from South Africa and Cerrejón is unchanged at 29-31 Mt.
Strategic report

-24-
NICKEL Financial and operational metrics
Production
volume Sales
volume Price
C1 unit cost* Revenue*
Underlying EBITDA*
Underlying EBITDA margin
Underlying EBIT* Capex* ROCE*
t t c/lb c/lb $m $m(1) $m(1) $m Nickel 43,800 43,000 476 365 451 81 18% 0 28 0% Prior year 44,500 44,900 431 350 426 57 13% (15) 62 (1)%
(1) Nickel segment includes $3 million projects and corporate costs (2016: $10 million). Financial and operating overview Underlying EBITDA increased by 42% to $81 million (2016: $57 million), reflecting a higher nickel price, partly offset by the unfavourable impact of the stronger Brazilian real and cost inflation. Nickel unit costs increased by 4% to 365 c/lb (2016: 350 c/lb) as adverse exchange rates and inflation were only partly compensated by other cost-saving efforts, including lower energy costs. Markets
The average market price is the LME nickel price, from which ferronickel pricing is derived. Ferronickel is traded based on discounts or premiums to the LME price, depending on market conditions, supplier products and consumer preferences. Differences between market prices and realised prices are largely due to variances between the LME and the ferronickel price. Operating performance Nickel output decreased by 2% to 43,800 tonnes (2016: 44,500 tonnes) as instabilities at both smelting operations negatively affected Barro Alto’s production performance in February 2017. The root causes were addressed and the operations returned to stable performance from the second quarter. Codemin’s production of metal was in line with the prior year at 9,000 tonnes. Operational outlook Production guidance for 2018 has been lowered to 42,000-44,000 tonnes, as a result of planned maintenance at Barro Alto’s plant.
2017 2016
Average market price (c/lb) 472 436 Average realised price (c/lb) 476 431
Strategic report

-25-
CORPORATE AND OTHER Financial metrics
Revenue* Underlying
EBITDA* Underlying
EBIT* Capex*
$m $m $m $m Segment 5 (292) (313) 9
Prior year 499 (5) (71) 40
Niobium and Phosphates – – – – Prior year 495 118 79 26
Exploration – (103) (103) – Prior year – (107) (107) –
Corporate activities and unallocated costs 5 (189) (210) 9
Prior year 4 (16) (43) 14
Financial and operating overview Corporate and other reported an underlying EBITDA loss of $292 million (2016: $5 million loss). Niobium and Phosphates
The sale of the Niobium and Phosphates business to China Molybdenum Co Ltd. was completed on 30 September 2016. Exploration
Exploration expenditure decreased to $103 million (2016: $107 million), reflecting a general reduction across most of the commodities, driven primarily by lower drilling activities. Corporate activities and unallocated costs
Underlying EBITDA amounted to a $189 million loss (2016: $16 million loss), driven primarily by a year-on-year loss recognised in the Group’s self-insurance entity, reflecting lower premium income and higher net claims and settlements during 2017.

-26-
For further information, please contact:
Media Investors UK James Wyatt-Tilby [email protected] Tel: +44 (0)20 7968 8759
UK Paul Galloway [email protected] Tel: +44 (0)20 7968 8718
Marcelo Esquivel [email protected] Tel: +44 (0)20 7968 8891
Trevor Dyer [email protected] Tel: +44 (0)20 7968 8992
South Africa Pranill Ramchander [email protected] Tel: +27 (0)11 638 2592 Ann Farndell [email protected] Tel: +27 (0)11 638 2786
Sheena Jethwa [email protected] Tel: +44 (0)20 7968 8680
Notes to editors: Anglo American is a globally diversified mining business. Our portfolio of world-class competitive mining operations and undeveloped resources provides the raw materials to meet the growing consumer-driven demands of the world’s developed and maturing economies. Our people are at the heart of our business. It is our people who use the latest technologies to find new resources, plan and build our mines and who mine, process and move and market our products to our customers around the world. As a responsible miner – of diamonds (through De Beers), copper, platinum and other precious metals, iron ore, coal and nickel – we are the custodians of what are precious natural resources. We work together with our key partners and stakeholders to unlock the long-term value that those resources represent for our shareholders and for the communities and countries in which we operate – creating sustainable value and making a real difference. www.angloamerican.com
Webcast of presentation: A live webcast of the results presentation, starting at 9.00am UK time on 22 February 2018, can be accessed through the Anglo American website at www.angloamerican.com Note: Throughout this results announcement, ‘$’ denotes United States dollars and ‘cents’ refers to United States cents. Tonnes are metric tons, ‘Mt’ denotes million tonnes and ‘kt’ denotes thousand tonnes, unless otherwise stated. Forward-looking statements: This announcement includes forward-looking statements. All statements other than statements of historical facts included in this announcement, including, without limitation, those regarding Anglo American’s financial position, business, acquisition and divestment strategy, dividend policy, plans and objectives of management for future operations (including development plans and objectives relating to Anglo American’s products, production forecasts and Ore Reserves and Mineral Resources), are forward-looking statements. By their nature, such forward-looking statements involve known and unknown risks, uncertainties and other factors which may cause the actual results, performance or achievements of Anglo American, or industry results, to be materially different from any future results, performance or achievements expressed or implied by such forward-looking statements. Such forward-looking statements are based on numerous assumptions regarding Anglo American’s present and future business strategies and the environment in which Anglo American will operate in the future. Important factors that could cause Anglo American’s actual results, performance or achievements to differ materially from those in the forward-looking statements include, among others, levels of actual production during any period, levels of global demand and commodity market prices, mineral resource exploration and development capabilities, recovery rates and other operational capabilities, the availability of mining and processing equipment, the ability to produce and transport products profitably, the impact of foreign currency exchange rates on market prices and operating costs, the availability of sufficient credit, the effects of inflation, political uncertainty and economic conditions in relevant areas of the world, the actions of competitors, activities by governmental authorities such as changes in taxation or safety, health, environmental or other types of regulation in the countries where Anglo American operates, conflicts over land and resource ownership rights and such other risk factors identified in Anglo American’s most recent Annual Report. Forward-looking statements should, therefore, be construed in light of such risk factors and undue reliance should not be placed on forward-looking statements. These forward-looking statements speak only as of the date of this announcement. Anglo American expressly disclaims any obligation or undertaking (except as required by applicable law, the City Code on Takeovers and Mergers (the “Takeover Code”), the UK Listing Rules, the Disclosure and Transparency Rules of the Financial Conduct Authority, the Listings Requirements of the securities exchange of the JSE Limited in South Africa, the SWX Swiss Exchange, the Botswana Stock Exchange and the Namibian Stock Exchange and any other applicable regulations) to release publicly any updates or revisions to any forward-looking statement contained herein to reflect any change in Anglo American’s expectations with regard thereto or any change in events, conditions or circumstances on which any such statement is based. Nothing in this announcement should be interpreted to mean that future earnings per share of Anglo American will necessarily match or exceed its historical published earnings per share. Certain statistical and other information about Anglo American included in this announcement is sourced from publicly available third party sources. As such, it presents the views of those third parties, though these may not necessarily correspond to the views held by Anglo American. Anglo American plc 20 Carlton House Terrace London SW1Y 5AN United Kingdom Registered office as above. Incorporated in England and Wales under the Companies Act 1985. Registered Number: 3564138 Legal Entity Identifier: 549300S9XF92D1X8ME43

-27-
CONDENSED FINANCIAL STATEMENTS
for the year ended 31 December 2017

-28-
CONTENTS Primary statements Consolidated income statement 29Consolidated statement of comprehensive income 30Consolidated balance sheet 31Consolidated cash flow statement 32Consolidated statement of changes in equity 33 Notes to the Condensed financial statements 1. Basis of preparation 342. Changes in accounting policies and disclosures 34 Financial performance 3. Financial performance by segment 354. Earnings per share 375. Net finance costs 386. Income tax expense 397. Dividends 41 Significant items 8. Significant accounting matters 429. Special items and remeasurements 44 Capital base 10. Capital by segment 4811. Capital expenditure 50 Net debt 12. Net debt 5113. Borrowings 53 Unrecognised items and uncertain events 14. Events occurring after end of year 5415. Contingent liabilities 54 Group structure 16. Assets and liabilities held for sale 5417. Disposals 54 Summary by operation 55 Key financial data 56 Alternative performance measures 57 Exchange rates and commodity prices 63

-29-
Consolidated income statement for the year ended 31 December 2017 2017 2016
US$ million Note
Before special
items and remeasure-
ments
Special items and
remeasure-ments
(note 9) Total
Before special
items and remeasure-
ments
Special items and
remeasure- ments
(note 9) Total
Revenue 3 26,243 – 26,243 21,378 – 21,378 Operating costs (21,001) 287 (20,714) (18,047) (1,665) (19,712) Operating profit 3 5,242 287 5,529 3,331 (1,665) 1,666 Non-operating special items 9 – (5) (5) – 1,203 1,203 Net income from associates and joint ventures 3 577 (10) 567 271 7 278 Profit before net finance costs and tax 5,819 272 6,091 3,602 (455) 3,147
Investment income 268 – 268 186 120 306 Interest expense (694) (99) (793) (490) (45) (535) Other net financing losses (47) (14) (61) 95 (389) (294)
Net finance costs 5 (473) (113) (586) (209) (314) (523) Profit before tax 5,346 159 5,505 3,393 (769) 2,624 Income tax expense 6 (1,324) (122) (1,446) (742) 44 (698) Profit for the financial year 4,022 37 4,059 2,651 (725) 1,926 Attributable to: Non-controlling interests 750 143 893 441 (109) 332 Equity shareholders of the Company 3,272 (106) 3,166 2,210 (616) 1,594
Earnings per share (US$) Basic 4 2.57 (0.09) 2.48 1.72 (0.48) 1.24 Diluted 4 2.53 (0.08) 2.45 1.70 (0.47) 1.23

-30-
Consolidated statement of comprehensive income for the year ended 31 December 2017 US$ million 2017 2016
Profit for the financial year 4,059 1,926 Items that will not be reclassified to the income statement (net of tax) Remeasurement of net retirement benefit obligation 204 (179) Items that have been or may subsequently be reclassified to the income statement (net of tax) Net exchange differences:
Net gain (including associates and joint ventures) 1,725 1,150 Cumulative gain transferred to the income statement on disposal of foreign operations (81) (50)
Revaluation of available for sale investments: Net revaluation gain 23 122 Cumulative revaluation gain transferred to the income statement on disposal (43) (151)
Revaluation of cash flow hedges: Transferred to the income statement – (11) Share of associates' and joint ventures' other comprehensive income (1) –
Other comprehensive income for the financial year (net of tax) 1,827 881 Total comprehensive income for the financial year (net of tax) 5,886 2,807 Attributable to: Non-controlling interests 1,240 514 Equity shareholders of the Company 4,646 2,293

-31-
Consolidated balance sheet as at 31 December 2017 US$ million Note 2017 2016
ASSETS Non-current assets Intangible assets 3,323 3,217 Property, plant and equipment 30,643 28,719 Environmental rehabilitation trusts 421 353 Investments in associates and joint ventures 1,956 1,974 Financial asset investments 561 835 Trade and other receivables 937 812 Deferred tax assets 1,191 1,013 Derivative financial assets 309 484 Other non-current assets 487 293 Total non-current assets 39,828 37,700 Current assets Inventories 4,441 3,727 Trade and other receivables 2,136 2,232 Current tax assets 146 330 Derivative financial assets 81 109 Cash and cash equivalents 12 7,800 6,051 Total current assets 14,604 12,449 Assets classified as held for sale 16 129 – Total assets 54,561 50,149
LIABILITIES Current liabilities Trade and other payables (4,501) (3,384) Short term borrowings 12, 13 (1,351) (1,806) Provisions for liabilities and charges (562) (621) Current tax liabilities (601) (442) Derivative financial liabilities (336) (272) Total current liabilities (7,351) (6,525) Non-current liabilities Trade and other payables (89) (116) Medium and long term borrowings 12, 13 (10,620) (11,363) Retirement benefit obligations (695) (778) Deferred tax liabilities (4,188) (3,520) Derivative financial liabilities (460) (1,603) Provisions for liabilities and charges (2,235) (1,919) Total non-current liabilities (18,287) (19,299) Liabilities directly associated with assets classified as held for sale 16 (41) – Total liabilities (25,679) (25,824)
Net assets 28,882 24,325
EQUITY Called-up share capital 772 772 Share premium account 4,358 4,358 Own shares (6,191) (6,090) Other reserves (8,702) (10,000) Retained earnings 32,735 29,976 Equity attributable to equity shareholders of the Company 22,972 19,016 Non-controlling interests 5,910 5,309 Total equity 28,882 24,325
The financial statements of Anglo American plc, registered number 03564138, were approved by the Board of directors on 21 February 2018 and signed on its behalf by:
Mark Cutifani Stephen Pearce Chief Executive Finance Director

-32-
Consolidated cash flow statement for the year ended 31 December 2017 US$ million Note 2017 2016
Cash flows from operating activities Profit before tax 5,505 2,624 Net finance costs including financing special items and remeasurements 586 523 Net income from associates and joint ventures (567) (278) Non-operating special items 9 5 (1,203) Operating profit 5,529 1,666 Operating special items and remeasurements 9 (287) 1,665 Cash element of special items (102) (144) Depreciation and amortisation 2,390 2,138 Share-based payment charges 180 174 Decrease in provisions and net retirement benefit obligations (311) (139) (Increase)/decrease in inventories (294) 301 Decrease/(increase) in operating receivables 23 (365) Increase in operating payables 1,150 455 Other adjustments 97 87 Cash flows from operations 8,375 5,838 Dividends from associates and joint ventures 506 167 Dividends from financial asset investments 11 5 Income tax paid (843) (611) Net cash inflows from operating activities 8,049 5,399
Cash flows from investing activities Expenditure on property, plant and equipment 11 (2,278) (2,418) Cash flows from derivatives related to capital expenditure 11 40 (22) Proceeds from disposal of property, plant and equipment 11 52 23 Investments in associates and joint ventures (86) (51) Purchase of financial asset investments (6) (3) Net redemption of financial asset loans and receivables 168 61 Interest received and other investment income 165 77 Net cash inflow on disposals 17 52 1,765 Return of capital and repayments of capitalised loans by associates and joint ventures – 62 Other investing activities (54) (19) Net cash used in investing activities (1,947) (525)
Cash flows from financing activities Interest paid (542) (747) Cash flows from derivatives related to financing activities 12 (419) (414) Dividends paid to Company shareholders (618) – Dividends paid to non-controlling interests (601) (15) Proceeds from issuance of bonds 2,998 – Proceeds from other borrowings 35 694 Repayments of bonds and borrowings (5,189) (5,213) Proceeds from issue of shares to non-controlling interests 36 38 Purchase of shares by Group companies for employee share schemes (242) (117) Other financing activities (11) (6) Net cash used in financing activities (4,553) (5,780)
Net increase/(decrease) in cash and cash equivalents 1,549 (906)
Cash and cash equivalents at start of year 12 6,044 6,889 Cash movements in the year 1,549 (906) Effects of changes in foreign exchange rates 199 61 Cash and cash equivalents at end of year 12 7,792 6,044

-33-
Consolidated statement of changes in equity for the year ended 31 December 2017
US$ million
Total share
capital(1) Own
shares(2) Retained earnings
Cumulative translation
adjustment reserve
Other reserves(3)
Total equity attributable
to equity shareholders
of the Company
Non-controlling
interests Total
equity
At 1 January 2016 5,130 (6,051) 28,301 (11,747) 936 16,569 4,773 21,342 Total comprehensive income – – 1,419 896 (22) 2,293 514 2,807 Dividends payable – – – – – – (40) (40) Issue of shares to non-controlling interests – – – – – – 38 38 Equity settled share-based payment schemes – (39) 146 – (63) 44 24 68 Tax recognised directly in equity – – 110 – – 110 – 110 At 31 December 2016 5,130 (6,090) 29,976 (10,851) 851 19,016 5,309 24,325 Total comprehensive income – – 3,351 1,577 (282) 4,646 1,240 5,886 Dividends payable – – (618) – – (618) (672) (1,290) Issue of shares to non-controlling interests – – – – – – 36 36 Equity settled share-based payment schemes – (101) 26 – 6 (69) (3) (72) Other – – – – (3) (3) – (3) At 31 December 2017 5,130 (6,191) 32,735 (9,274) 572 22,972 5,910 28,882
(1) Includes share capital and share premium. (2) Own shares comprise shares of Anglo American plc held by the Company (treasury shares), its subsidiaries and employee benefit trusts. (3) Includes the share-based payment reserve, available for sale reserve, cash flow hedge reserve, capital redemption reserve and legal reserve.

-34-
Notes to the Condensed financial statements
1. BASIS OF PREPARATION
The Condensed financial statements for the year ended 31 December 2017 do not constitute statutory accounts as defined in section 435 (1) and (2) of the Companies Act 2006. Statutory accounts for the year ended 31 December 2016 have been delivered to the Registrar of Companies and those for 2017 will be delivered following the Company’s Annual General Meeting convened for 8 May 2018. The auditors have reported on these accounts; their reports were unqualified, did not include a reference to any matters to which the auditors drew attention by way of emphasis of matter and did not contain a statement under section 498 (2) or (3) of the Companies Act 2006. Whilst the preliminary announcement (the Condensed financial statements) has been prepared in accordance with International Financial Reporting Standards (IFRS) and IFRS Interpretations Committee (IFRIC) interpretations adopted for use by the European Union, with those parts of the Companies Act 2006 applicable to companies reporting under IFRS and with the requirements of the United Kingdom Listing Authority (UKLA) Listing Rules, these Condensed financial statements do not contain sufficient information to comply with IFRS. The Group will publish full financial statements that comply with IFRS in March 2018. Going concern The financial position of the Group, its cash flows, liquidity position and borrowing facilities are set out in the Financial review of Group results for the year ended 31 December 2017 on pages 2 to 8. The Group’s net debt (including related hedges) at 31 December 2017 was $4.5 billion (31 December 2016: $8.5 billion) representing a gearing level of 13% (31 December 2016: 26%). Further analysis of net debt is set out in note 12 and details of borrowings and facilities are set out in note 13. The directors have considered the Group's cash flow forecasts for the period to the end of 31 March 2019. The Board is satisfied that the Group’s forecasts and projections, taking into account reasonably possible changes in trading performance, show that the Group will be able to operate within the level of its current facilities for the period assessed. For this reason the Group continues to adopt the going concern basis in preparing its Condensed financial statements.
2. CHANGES IN ACCOUNTING POLICIES AND DISCLOSURES
The Condensed financial statements have been prepared under the historical cost convention as modified by the revaluation of pension assets and liabilities and certain financial instruments. The accounting policies applied are consistent with those adopted and disclosed in the Group financial statements for the year ended 31 December 2016, except for changes arising from the adoption of the following new accounting pronouncements which became effective in the current reporting period:
• Annual improvements to IFRSs 2014-2016 cycle: IFRS 12 Disclosure of Interests in Other Entities.
• Amendments to IAS 7 Statement of Cash Flows: Disclosure Initiative.
• Amendments to IAS 12 Income taxes: Recognition of Deferred Tax Assets for Unrealised Losses.
The adoption of these new accounting pronouncements has not had a significant impact on the accounting policies, methods of computation or presentation applied by the Group. The Group has not early adopted any other amendment, standard or interpretation that has been issued but is not yet effective. It is expected that where applicable, these standards and amendments will be adopted on each respective effective date.

-35-
Notes to the Condensed financial statements
FINANCIAL PERFORMANCE
Profit attributable to equity shareholders increased 99% to $3,166 million and underlying earnings increased 48% to $3,272 million. The following disclosures provide further information about the drivers of the Group’s financial performance in the year. This includes analysis of the respective contribution of the Group’s operating segments along with information about net finance costs and tax. In addition, disclosure on earnings per share and the dividend is provided.
3. FINANCIAL PERFORMANCE BY SEGMENT
Overview The Group’s segments are aligned to those business units that are evaluated regularly by the chief operating decision maker in deciding how to allocate resources and in assessing performance. The disclosures in this note include certain Alternative Performance Measures (APMs). For more information on the APMs used by the Group, including definitions, please refer to page 57. Segment results 2017
US$ million Group
revenue Underlying
EBITDA
Depreciation and
amortisation Underlying
EBIT
Net finance costs and
income tax expense
Non- controlling
interests Underlying
earnings De Beers 5,841 1,435 (562) 873 (244) (101) 528 Copper 4,233 1,508 (585) 923 (440) (113) 370 Platinum 5,078 866 (354) 512 (218) (77) 217 Iron Ore and Manganese 5,831 2,357 (379) 1,978 (507) (445) 1,026 Coal 7,211 2,868 (594) 2,274 (484) (27) 1,763 Nickel 451 81 (81) – (4) – (4) Corporate and other 5 (292) (21) (313) (326) 11 (628) 28,650 8,823 (2,576) 6,247 (2,223)(1) (752) 3,272 Less: associates and joint ventures (2,407) (1,191) 186 (1,005) 426 2 (577) Subsidiaries and joint operations 26,243 7,632 (2,390) 5,242 (1,797) (750) 2,695 Reconciliation: Net income from associates and joint ventures 567 567 Special items and remeasurements 282 (96) Closest equivalent IFRS measure 6,091 3,166 2016
US$ million Group
revenue Underlying
EBITDA
Depreciation and
amortisation Underlying
EBIT
Net finance costs and
income tax expense
Non- controlling
interests Underlying
earnings De Beers 6,068 1,406 (387) 1,019 (242) (110) 667 Copper 3,066 903 (642) 261 (9) 102 354 Platinum 4,394 532 (347) 185 (101) (19) 65 Iron Ore and Manganese 3,426 1,536 (261) 1,275 (304) (405) 566 Coal 5,263 1,646 (534) 1,112 (183) (16) 913 Nickel 426 57 (72) (15) (42) – (57) Corporate and other 499 (5) (66) (71) (237) 10 (298) 23,142 6,075 (2,309) 3,766 (1,118)(1) (438) 2,210 Less: associates and joint ventures (1,764) (606) 171 (435) 167 (3) (271) Subsidiaries and joint operations 21,378 5,469 (2,138) 3,331 (951) (441) 1,939 Reconciliation: Net income from associates and joint ventures 278 278 Special items and remeasurements (462) (623) Closest equivalent IFRS measure 3,147 1,594 (1) Comprises net finance costs of $526 million (2016: $253 million) and income tax expense of $1,697 million (2016: $865 million).

-36-
Notes to the Condensed financial statements 3. FINANCIAL PERFORMANCE BY SEGMENT (continued)
The Kumba Iron Ore, Iron Ore Brazil and Samancor business units have been aggregated as the ‘Iron Ore and Manganese’ segment on the basis of the ultimate product produced (ferrous metals). The ‘Corporate and other’ segment includes unallocated corporate costs, exploration costs and the Niobium and Phosphates business unit. Exploration costs represent the cost of the Group’s exploration activities across all segments. Comparative information for Corporate and other has been restated to include Niobium and Phosphates, which was sold in 2016. The segment results are stated after elimination of inter-segment interest and dividends and include an allocation of corporate costs. Further information Segments predominantly derive revenue as follows – De Beers: rough and polished diamonds; Copper: copper; Platinum: platinum group metals; Iron Ore and Manganese: iron ore, manganese ore and alloys; Coal: metallurgical coal and thermal coal; Nickel: nickel. Group revenue by product US$ million 2017 2016
Diamonds 5,841 6,064 Copper 4,128 2,946 Platinum 2,454 2,498 Palladium 1,417 967 Rhodium 327 215 Iron ore 4,489 2,611 Manganese ore and alloys 940 625 Metallurgical coal 3,357 2,243 Thermal coal 3,854 3,024 Nickel 728 694 Niobium – 137 Phosphates – 358 Other 1,115 760 28,650 23,142
Group revenue by destination
The Group’s geographical analysis of segment revenue is allocated based on the customer’s port of destination. Where the port of destination is not known revenue is allocated based on the customer’s country of domicile: US$ million 2017 2016
South Africa 1,876 1,630 Other Africa 1,709 1,604 Brazil 422 679 Chile 432 481 Other South America 9 12 North America 875 572 Australia 41 164 China 6,451 4,784 India 3,636 2,756 Japan 2,625 2,131 Other Asia 5,514 3,813 United Kingdom (Anglo American plc’s country of domicile) 1,571 1,341 Other Europe 3,489 3,175 28,650 23,142

-37-
Notes to the Condensed financial statements
4. EARNINGS PER SHARE
Overview The disclosures in this note include certain Alternative Performance Measures (APMs). For more information on the APMs used by the Group, including definitions, please refer to page 57.
US$ 2017 2016
Earnings per share Basic 2.48 1.24 Diluted 2.45 1.23 Underlying earnings per share Basic 2.57 1.72 Diluted 2.53 1.70 Headline earnings per share Basic 2.29 1.47 Diluted 2.26 1.46 Further information The calculation of basic and diluted earnings per share is based on the following data:
Profit attributable to equity
shareholders of the Company
Underlying earnings Headline earnings
2017 2016 2017 2016 2017 2016
Earnings (US$ million)
Basic and diluted earnings 3,166 1,594 3,272 2,210 2,920 1,896
Number of shares (million) Basic number of ordinary shares outstanding 1,275 1,288 1,275 1,288 1,275 1,288 Effect of dilutive potential ordinary shares 18 12 18 12 18 12 Diluted number of ordinary shares outstanding 1,293 1,300 1,293 1,300 1,293 1,300 The average number of ordinary shares in issue excludes shares held by employee benefit trusts and Anglo American plc shares held by Group companies. The diluted number of ordinary shares outstanding including share options and awards is calculated on the assumption of conversion of all potentially dilutive ordinary shares. In the year ended 31 December 2017 there were 132,188 (2016: 274,815) share options which were potentially dilutive but not included in the calculation of diluted earnings because they were anti-dilutive. Headline earnings, a Johannesburg Stock Exchange defined performance measure, is reconciled from underlying earnings as follows: US$ million 2017 2016
Underlying earnings for the financial year 3,272 2,210 Operating special items – restructuring 31 (90) Other operating special items (60) – Operating remeasurements (86) (25) Non-operating special items – credits/(charges) relating to BEE transactions 14 (36) Financing special items and remeasurements (114) (318) Tax special items and remeasurements (32) 33 Associates’ and joint ventures’ special items and remeasurements (8) 7 Other reconciling items (97) 115 Headline earnings for the financial year 2,920 1,896
The reconciling items above are shown net of tax and non-controlling interests. Other reconciling items principally relate to the settlement of class action claims (2016: principally relate to derecognition of contingent liabilities previously recognised in business combinations and losses on disposal of plant and equipment and other assets).

-38-
Notes to the Condensed financial statements
5. NET FINANCE COSTS
US$ million 2017 2016
Investment income Interest income from cash and cash equivalents 154 78 Interest income from associates and joint ventures 35 50 Other interest income 52 43 Net interest income on defined benefit arrangements 16 20 Dividend income from financial asset investments 11 5 268 196 Less: interest income capitalised – (10) Investment income before special items and remeasurements 268 186 Financing special items and remeasurements – 120 Investment income 268 306 Interest expense Interest and other finance expense (580) (711) Net interest cost on defined benefit arrangements (49) (44) Unwinding of discount relating to provisions and other liabilities (100) (111) (729) (866) Less: interest expense capitalised 35 376 Interest expense before special items and remeasurements (694) (490) Financing special items and remeasurements (99) (45) Interest expense (793) (535) Other net financing losses Net foreign exchange (losses)/gains (47) 84 Other net fair value gains – 11 Other net financing (losses)/gains before special items and remeasurements (47) 95 Financing special items and remeasurements (14) (389) Other net financing losses (61) (294)
Net finance costs (586) (523)

-39-
Notes to the Condensed financial statements
6. INCOME TAX EXPENSE
Overview The effective tax rate for the year of 26.3% (2016: 26.6%) is higher (2016: higher) than the applicable weighted average statutory rate of corporation tax in the United Kingdom of 19.25% (2016: 20%).
2017
Profit before tax
US$ million
Tax (charge)/credit
US$ million Effective
tax rate
Calculation of effective tax rate (statutory basis) 5,505 (1,446) 26.3% Adjusted for:
Special items and remeasurements (159) 122 Associates’ and joint ventures’ tax and non-controlling interests 375 (373)
Calculation of underlying effective tax rate 5,721 (1,697) 29.7% The underlying effective tax rate was 29.7% for the year ended 31 December 2017. This is higher than the equivalent underlying effective tax rate of 24.6% for the year ended 31 December 2016. The effective tax rate in 2017 has benefited from the reassessment of deferred tax balances primarily in Australia and Brazil, partially offset by the reassessment of withholding tax provisions primarily in relation to Chile and South Africa, and the impact of the relative levels of profits arising in the Group’s operating jurisdictions. In future periods, it is expected that the underlying effective tax rate will remain above the United Kingdom statutory tax rate. The disclosures in this note include certain Alternative Performance Measures (APMs). For more information on the APMs used by the Group, including definitions, please refer to page 57.
a) Analysis of charge for the year
Current tax includes royalties which meet the definition of income tax and are in addition to royalties recorded in operating costs.
US$ million 2017 2016
United Kingdom corporation tax 29 26 South Africa tax 649 433 Other overseas tax 689 101 Prior year adjustments (162) (176) Current tax 1,205 384 Deferred tax 119 358 Income tax expense before special items and remeasurements 1,324 742 Special items and remeasurements tax (note 9) 122 (44) Income tax expense 1,446 698
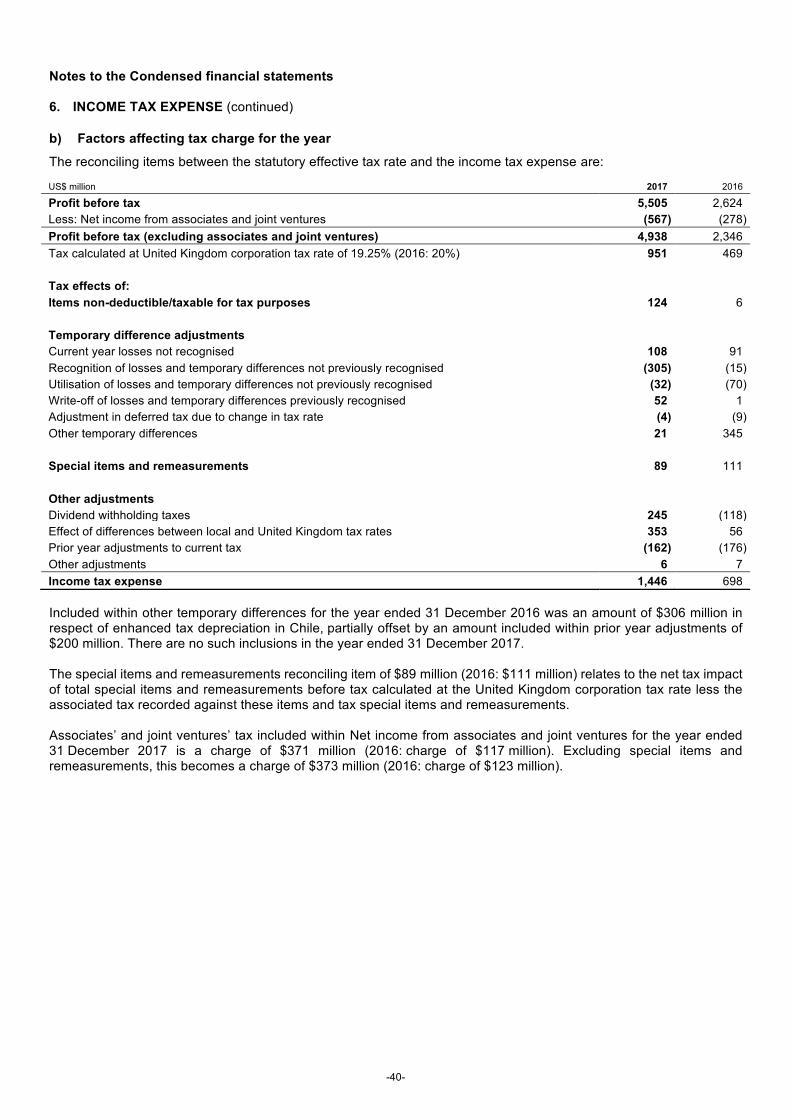
-40-
Notes to the Condensed financial statements 6. INCOME TAX EXPENSE (continued)
b) Factors affecting tax charge for the year The reconciling items between the statutory effective tax rate and the income tax expense are: US$ million 2017 2016
Profit before tax 5,505 2,624 Less: Net income from associates and joint ventures (567) (278) Profit before tax (excluding associates and joint ventures) 4,938 2,346 Tax calculated at United Kingdom corporation tax rate of 19.25% (2016: 20%) 951 469 Tax effects of: Items non-deductible/taxable for tax purposes 124 6
Temporary difference adjustments Current year losses not recognised 108 91 Recognition of losses and temporary differences not previously recognised (305) (15) Utilisation of losses and temporary differences not previously recognised (32) (70) Write-off of losses and temporary differences previously recognised 52 1 Adjustment in deferred tax due to change in tax rate (4) (9) Other temporary differences 21 345
Special items and remeasurements 89 111
Other adjustments Dividend withholding taxes 245 (118) Effect of differences between local and United Kingdom tax rates 353 56 Prior year adjustments to current tax (162) (176) Other adjustments 6 7 Income tax expense 1,446 698
Included within other temporary differences for the year ended 31 December 2016 was an amount of $306 million in respect of enhanced tax depreciation in Chile, partially offset by an amount included within prior year adjustments of $200 million. There are no such inclusions in the year ended 31 December 2017. The special items and remeasurements reconciling item of $89 million (2016: $111 million) relates to the net tax impact of total special items and remeasurements before tax calculated at the United Kingdom corporation tax rate less the associated tax recorded against these items and tax special items and remeasurements. Associates’ and joint ventures’ tax included within Net income from associates and joint ventures for the year ended 31 December 2017 is a charge of $371 million (2016: charge of $117 million). Excluding special items and remeasurements, this becomes a charge of $373 million (2016: charge of $123 million).

-41-
Notes to the Condensed financial statements
7. DIVIDENDS
2017 2016
Proposed final ordinary dividend per share (US cents) 54 – Proposed final ordinary dividend (US$ million) 695 –
These financial statements do not reflect the proposed final ordinary dividend as it is still subject to shareholder approval. Dividends payable during the year are as follows: US$ million 2017 2016
Final ordinary dividend for 2016 – Nil per ordinary share (2015: Nil per ordinary share) – – Interim ordinary dividend for 2017 – 48 US cents per ordinary share (2016: Nil per ordinary share) 618 –
618 –

-42-
Notes to the Condensed financial statements
SIGNIFICANT ITEMS
Special items and remeasurements are a net charge of $0.1 billion and include net impairment reversals of $0.4 billion, relating to the impairment reversals at Sishen (Iron Ore and Manganese) of $0.5 billion and El Soldado (Copper) of $0.2 billion, partially offset by impairments of the Group’s interest in BRPM (Platinum) and at Coal South Africa (Coal). During 2017, the significant accounting matters addressed by management included:
• the assessment of impairment and impairment reversal indicators; and
• the estimation of cash flow projections for impairment testing.
8. SIGNIFICANT ACCOUNTING MATTERS
In the course of preparing financial statements, management necessarily makes judgements and estimates that can have a significant impact on the financial statements. The critical judgements and sources of estimation uncertainty that affect the results for the year ended 31 December 2017 are set out below. In addition to these items, further detail on other significant judgements and estimates determined by management is provided, where applicable, in the relevant note to the Condensed financial statements. Impairment and impairment reversals of assets i) Critical accounting judgements The Group assesses at each reporting date whether there are any indicators that its assets and cash generating units (CGUs) may be impaired. Operating and economic assumptions, which could affect the valuation of assets using discounted cash flows, are updated regularly as part of the Group’s planning and forecasting processes. Judgement is therefore required to determine whether the updates represent significant changes in the service potential of an asset or CGU, and are therefore indicators of impairment or impairment reversal. The judgement also takes into account the Group’s long-term economic forecasts, market consensus and sensitivity analysis of the discounted cash flow models used to value the Group’s assets. Assets (other than goodwill) that have been previously impaired must be assessed for indicators of both impairment and impairment reversal. Such assets are, by definition, carried on the balance sheet at a value close to their recoverable amount at the last assessment. Therefore in principle any change to operational plans or assumptions, economic parameters, or the passage of time, could result in further impairment or impairment reversal if an indicator is identified. Significant operating assets that the Group has previously impaired include Minas-Rio and Sishen (Iron Ore and Manganese); Moranbah-Grosvenor, Capcoal, Dawson and Isibonelo (Coal); Barro Alto (Nickel) and El Soldado (Copper). These assets have a combined carrying value of $10.0 billion within Property, plant and equipment as at 31 December 2017. ii) Cash flow projections for impairment testing Expected future cash flows used in discounted cash flow models are inherently uncertain and could materially change over time. They are significantly affected by a number of factors including Ore Reserves and Mineral Resources, together with economic factors such as commodity prices, exchange rates, discount rates and estimates of production costs and future capital expenditure. Where discounted cash flow models based on management’s assumptions are used, the resulting fair value measurements are considered to be at level 3 in the fair value hierarchy, as defined in IFRS 13 Fair Value Measurement, as they depend to a significant extent on unobservable valuation inputs. Cash flow projections are based on financial budgets and Life of Mine Plans or, for non-mine assets, an equivalent appropriate long-term forecast, incorporating key assumptions as detailed below:
• Ore Reserves and Mineral Resources Ore Reserves and, where considered appropriate, Mineral Resources are incorporated in projected cash flows, based on Ore Reserves and Mineral Resources statements and exploration and evaluation work undertaken by appropriately qualified persons. Mineral Resources are included where management has a high degree of confidence in their economic extraction, despite additional evaluation still being required prior to meeting the required confidence to convert to Ore Reserves.

-43-
Notes to the Condensed financial statements 8. SIGNIFICANT ACCOUNTING MATTERS (continued)
• Commodity and product prices Commodity and product prices are based on latest internal forecasts, benchmarked with external sources of information, to ensure they are within the range of available analyst forecasts. In estimating the forecast cash flows, management also takes into account the expected realised price from existing contractual arrangements.
• Foreign exchange rates
Foreign exchange rates are based on latest internal forecasts, benchmarked with external sources of information for relevant countries of operation. Long-term foreign exchange rates are kept constant on a real basis.
• Discount rates
Cash flow projections used in fair value less costs of disposal impairment models are discounted based on a real post-tax discount rate, assessed annually, of 7.0% (2016: 6.5%). Adjustments to the rate are made for any risks that are not reflected in the underlying cash flows, including the risk profile of the individual asset and country risk.
• Operating costs, capital expenditure and other operating factors
Operating costs and capital expenditure are based on financial budgets covering a five year period. Cash flow projections beyond five years are based on Life of Mine Plans or non-mine production plans, as applicable, and internal management forecasts. Cost assumptions incorporate management experience and expectations, as well as the nature and location of the operation and the risks associated therewith (for example, the grade of Ore Reserves varying significantly over time and unforeseen operational issues). Underlying input cost assumptions are consistent with related output price assumptions. Other operating factors, such as the timelines of granting licences and permits are based on management’s best estimate of the outcome of uncertain future events at the balance sheet date.
Where an asset has potential for future development through capital investment, to which a market participant would attribute value, and the costs and economic benefits can be estimated reliably, this development is included in the cash flows (with appropriate risk adjustments).
iii) Key sources of estimation uncertainty For assets where indicators of impairment or impairment reversal are identified, the Group performs impairment reviews to assess the recoverable amount of its operating assets principally with reference to fair value less costs of disposal, assessed using discounted cash flow models. Mining operations are large, complex assets requiring significant technical and financial resources to operate. Their value may be sensitive to a range of characteristics unique to each asset. Management applies judgement in determining the assumptions that are considered to be reasonable and consistent with those that would be applied by market participants. Sishen
The Sishen iron ore mine (Iron Ore and Manganese) is located in the Northern Cape Province in South Africa. It was impaired at year end 2015 by $0.5 billion based on a recoverable amount of $1.3 billion, as a result of a deterioration in the long-term outlook for iron ore prices, which led to a reconfiguration of the Sishen pit shell to improve cash flows. During 2017, Sishen has achieved improved levels of production and operating efficiencies. Additionally, whilst the long-term outlook for iron ore has remained broadly unchanged since 2015, the outlook for market conditions in the nearer term has improved. Consequently, the valuation of the Sishen mine has been assessed and the previous impairment has been reversed to the carrying value of $2.1 billion that would have been determined had no impairment loss been previously recognised, resulting in a gain of $468 million ($216 million after tax and non-controlling interests). Of the impairment reversal, $175 million has been recorded against plant and equipment, $169 million against mining properties and leases, $55 million against land and buildings and $69 million against capital works in progress, with an associated tax charge of $129 million. The valuation, based on discounted cash flows, is sensitive to changes in input assumptions particularly in relation to future iron ore prices and South African rand foreign exchange rates. For example, a $5/tonne increase in the long-term price forecast for iron ore equates to a $0.3 billion increase in the valuation. The recoverable amount has been assessed under a range of valuation scenarios, incorporating downside adjustments to both operating and economic assumptions, all of which indicate headroom over the revised carrying value of $2.1 billion. For example, under the most conservative downside case considered the headroom is $0.4 billion.

-44-
Notes to the Condensed financial statements 8. SIGNIFICANT ACCOUNTING MATTERS (continued)
Minas-Rio
The Minas-Rio iron ore project (Minas-Rio) (Iron Ore and Manganese) in Brazil was acquired in two separate transactions in 2007 and 2008. Prior to 2016, impairment charges totalling $11.3 billion (before tax) were recorded against the carrying value of Minas-Rio. The valuation was reassessed as at 31 December 2017 and the recoverable amount was considered to be in line with the carrying value of $4.2 billion. The valuation remains sensitive to economic and operational factors that provide both upside and downside risk, including price and the scheduling of required permits and licences. For example, a $5/tonne change in the long-term price forecast for iron ore, with all other valuation assumptions remaining the same, would change the valuation by $0.7 billion. El Soldado
In 2016, an impairment of $200 million was recorded to fully impair El Soldado (Copper), following the suspension of mining operations in February 2017 due to licensing uncertainty. In March 2017, the Group was notified that El Soldado’s mine permit application had been rejected by the Chilean mining authorities. Following an appeal, the mining permit was approved and mining operations were resumed in April 2017. As a result of the receipt of the permit, an impairment reversal of $194 million ($65 million after tax and non-controlling interests) has been recorded.
9. SPECIAL ITEMS AND REMEASUREMENTS
Overview 2017 2016
US$ million Before tax Tax
Non-controlling
interests Net Net
Impairments and impairment reversals 442 (177) (154) 111 (1,354) Restructuring costs 31 – – 31 (90) Other operating special items (91) 31 – (60) – Operating remeasurements (95) 12 (3) (86) (25) Operating special items and remeasurements 287 (134) (157) (4) (1,469)
Disposals of businesses and investments 4 47 20 71 1,082 Adjustments relating to business combinations 59 – (6) 53 82 Adjustments relating to former operations (84) (1) (1) (86) 3 Credits/(charges) relating to BEE transactions 16 – (2) 14 (36) Non-operating special items (5) 46 11 52 1,131
Financing special items and remeasurements (113) – (1) (114) (318) Tax special items and remeasurements – (34) 2 (32) 33 Total 169 (122) (145) (98) (623) Associates' and joint ventures' special items and remeasurements (10) 7 Non-controlling interests on associates’ and joint ventures’ special items and remeasurements 2 – Total special items and remeasurements (106) (616)

-45-
Notes to the Condensed financial statements 9. SPECIAL ITEMS AND REMEASUREMENTS (continued)
Special items Special items are those items of financial performance that, due to their size and nature, the Group believes should be separately disclosed on the face of the income statement. These items, along with related tax and non-controlling interests, are excluded from underlying earnings, which is an Alternative Performance Measure (APM). For more information on the APMs used by the Group, including definitions, please refer to page 57.
• Operating special items are those that relate to the operating performance of the Group and principally include impairment charges and reversals and restructuring costs.
• Non-operating special items are those that relate to changes in the Group’s asset portfolio. This category principally includes profits and losses on disposal of businesses and investments or closure of operations, adjustments relating to business combinations, and adjustments relating to former operations of the Group, such as changes in the measurement of deferred consideration receivable or provisions recognised on disposal or closure of operations in prior periods. This category also includes charges relating to Black Economic Empowerment (BEE) transactions.
• Financing special items are those that relate to financing activities and include realised gains and losses on early repayment of borrowings, and the unwinding of the discount on material provisions previously recognised as special items.
• Tax special items are those that relate to tax charges or credits where the associated cash outflow or inflow is anticipated to be significant due to its size and nature, principally including resolution of tax enquiries.
Remeasurements Remeasurements are items that are excluded from underlying earnings in order to reverse timing differences in the recognition of gains and losses in the income statement in relation to transactions that, whilst economically linked, are subject to different accounting measurement or recognition criteria. Remeasurements include mark-to-market movements on derivatives that are economic hedges of transactions not yet recorded in the financial statements, in order to ensure that the overall economic impact of such transactions is reflected within the Group’s underlying earnings in the period in which they occur. When the underlying transaction is recorded in the income statement, the realised gains or losses are reversed from remeasurements and are recorded in underlying earnings within either revenue, operating costs or net finance costs as appropriate. If the underlying transaction is recorded in the balance sheet, for example capital expenditure, the realised amount remains in remeasurements on settlement of the derivative.
• Operating remeasurements include unrealised gains and losses on derivatives relating to revenue, operating costs or capital expenditure transactions. They also include the reversal through depreciation and amortisation of a fair value gain or loss, arising on revaluation of a previously held equity interest in a business combination.
• Financing remeasurements include unrealised gains and losses on financial assets and liabilities that represent economic hedges, including accounting hedges, related to financing arrangements.
• Tax remeasurements include foreign exchange impacts arising in US dollar functional currency entities where tax calculations are generated based on local currency financial information and hence deferred tax is susceptible to currency fluctuations.
Operating special items Impairments and impairment reversals
Net impairments and impairment reversals of $442 million ($111 million after tax and non-controlling interests) for the year ended 31 December 2017 principally comprise the impairment reversals of Sishen (Iron Ore and Manganese) of $468 million ($216 million after tax and non-controlling interests) and El Soldado (Copper) of $194 million ($65 million after tax and non-controlling interests), the impairment of the investment in Bafokeng–Rasimone Platinum Mine (BRPM) (Platinum) of $147 million ($116 million after tax and non-controlling interests) and an impairment of $61 million ($44 million after tax) in Coal South Africa (Coal). Further information on significant accounting matters relating to impairments and impairment reversals is provided in note 8. BRPM impairment
The Group holds a 33% interest in BRPM (Platinum) and an 11.44% shareholding in Royal Bafokeng Platinum Limited (RBPlat), the Johannesburg Stock Exchange listed controlling shareholder of the operation. Given the reduction in the market capitalisation of RBPlat, the carrying value of the investment in BRPM has been assessed for impairment. This has resulted in an impairment of $147 million ($116 million after tax and non-controlling interests) which has been recorded against investments in associates to bring the carrying amount into line with its recoverable amount of $0.2 billion.

-46-
Notes to the Condensed financial statements 9. SPECIAL ITEMS AND REMEASUREMENTS (continued)
2016
Net impairments of $1,354 million after tax and non-controlling interests for the year ended 31 December 2016 principally related to the impairment of the Moranbah North and Grosvenor cash generating unit (Coal). Other operating special items
The loss of $91 million ($60 million after tax) relates to the cost to the Group of an arbitration settlement relating to a commercial dispute arising during the construction of the Barro Alto Nickel project. Restructuring costs
Following the finalisation of the Driving Value programme and the decision to continue metallurgical coal operations in Australia, restructuring provisions recognised in 2016 relating to the closure of the Brisbane Corporate Office have been derecognised, resulting in a credit of $31 million ($31 million after tax). Restructuring costs for the year ended 31 December 2016 were $120 million ($90 million after tax and non-controlling interests). Operating remeasurements Operating remeasurements reflect a net loss of $95 million ($86 million after tax and non-controlling interests) which principally relates to a $118 million depreciation and amortisation charge arising due to the fair value uplift on the Group’s pre-existing 45% shareholding in De Beers, which was required on acquisition of a controlling stake. This was partially offset by net gains on derivatives of $23 million, principally related to economic hedges of capital expenditure. Operating remeasurements reflected a net loss of $33 million ($25 million after tax and non-controlling interests) for the year ended 31 December 2016. Non-operating special items Disposals of businesses and investments
On 15 February 2017, the Group announced that it had agreed the sale of its interests in the Union platinum mine and Masa Chrome Company Proprietary Limited (Platinum) to a subsidiary of Siyanda Resources Proprietary Limited for consideration comprising upfront cash of R400 million ($34 million) and deferred consideration based on the operation’s free cash flow generation over a ten year period. The fair value of the Union mine and its associated Mineral Resources is expected to be recovered principally through the sale. An impairment of $197 million ($113 million after tax and non-controlling interests) has been recorded to bring the operation’s carrying value into line with its fair value less costs of disposal. The impairment charge has been recorded principally against Property, plant and equipment. On 1 February 2018, the Group completed the sale. In addition, a gain on disposal of $76 million ($76 million after tax) was recorded on the disposal of the Group’s 83.3% interest in the Dartbrook mine (Coal) and a further gain on disposal of $82 million ($65 million after non-controlling interests) was recorded on disposal of long-dated Mineral Resources in Platinum. In October 2017, the Group recorded a net gain of $43 million ($43 million after tax) on the disposal of its 11.18% interest in Dreamvision Investments 15 Proprietary Limited through a share buy-back which formed part of the unwinding of Exxaro Resources Limited’s original BEE transaction. This holding equated to a 2.28% interest in Exxaro. 2016
Non-operating special items in the year ended 31 December 2016 of $1,131 million after tax and non-controlling interests principally included net gains on the disposals of Callide (Coal), Niobium and Phosphates (Corporate and other) and the Group’s investment in Exxaro Resources Limited (Corporate and other) and a net loss on the disposal of the Rustenburg mine (Platinum). Adjustments relating to business combinations
Of the gain of $59 million, $39 million ($33 million after non-controlling interests) relates to the acquisition of the remaining 50% share in De Beers Jewellers (De Beers) in March 2017. The remaining $20 million gain relates to adjustments in respect of business combinations in prior periods.

-47-
Notes to the Condensed financial statements 9. SPECIAL ITEMS AND REMEASUREMENTS (continued)
Adjustments relating to former operations
Anglo American South Africa Limited
Anglo American South Africa Limited (AASA) is named as one of 32 respondents in a consolidated class certification application filed in the South Gauteng High Court (Johannesburg) on behalf of former mineworkers (or their dependants or survivors) who allegedly contracted silicosis or tuberculosis as a result of having worked for various gold mining companies including some in which AASA was a shareholder and to which AASA provided various technical and administrative services (the ‘class action claims’). The High Court has certified two classes of claimants: those with silicosis or who died from silicosis and those with tuberculosis or who died from tuberculosis. AASA and other respondents are appealing the ruling which had been set down for hearing from 19 to 23 March 2018, but was subsequently postponed indefinitely based on the progress made in the settlement negotiations with the claimants’ representatives. AASA, AngloGold Ashanti, Gold Fields, Harmony Gold and Sibanye Gold announced in November 2014 that they had formed an industry working group to address issues relating to compensation and medical care for occupational lung disease in the gold mining industry in South Africa. The working group was subsequently extended in 2015 to include African Rainbow Minerals. At the same time, the industry working group has been engaging all stakeholders on these matters, including government, organised labour, other mining companies and legal representatives of claimants who have filed legal suits against the companies. These engagements have sought a comprehensive solution to address legacy compensation issues and future legal frameworks that is fair to past and current employees and enables companies to continue to be competitive over the long term. The companies in the working group continue to defend the legal proceedings filed against them. As a consequence of the status of negotiations between the working group and affected stakeholders, a charge of $101 million was recognised at 30 June 2017 within non-operating special items ($101 million after tax), representing management’s best estimate of the cost to the Group of a settlement of the class action claims and related costs. The ultimate outcome of these matters remains uncertain, with a possible failure to reach a settlement or to obtain the requisite court approval of the settlement, and the provisions recorded in the financial statements are consequently subject to adjustment or reversal in the future, depending on the progress of the working group discussions and stakeholder consultations, and the ongoing legal proceedings. Other
The remaining net gain of $17 million before tax and non-controlling interests relates to adjustments in respect of disposals completed in prior years. Credits relating to BEE transactions The net gain of $16 million ($14 million after tax and non-controlling interests) relates to the revaluation of provisions associated with De Beers BEE transactions recorded in prior years. In 2016 the net charge of $36 million principally included $24 million ($20 million after tax and non-controlling interests) related to the repurchase of shares in Ponahalo Holdings Limited awarded to certain employees and their dependents as part of DBCM’s 2006 empowerment transaction. Financing special items and remeasurements Financing special items and remeasurements principally comprise a loss of $95 million (2016: net gain of $120 million) arising on bond buybacks completed in the period and a net fair value loss of $14 million (2016: $389 million) on derivatives hedging net debt. Tax associated with special items and remeasurements This includes a tax remeasurement charge of $34 million (2016: credit of $74 million) principally arising on Brazilian deferred tax assets. Of the total tax charge of $122 million, there is a net current tax charge of $1 million (2016: charge of $129 million) and a net deferred tax charge of $121 million (2016: credit of $173 million). Associates’ and joint ventures’ special items and remeasurements Associates’ and joint ventures’ special items and remeasurements relates to the Coal and Platinum segments (2016: Coal and Iron Ore and Manganese segments).

-48-
Notes to the Condensed financial statements
CAPITAL BASE
We have a value-focused approach to capital allocation with clear prioritisation: maintain asset integrity; ensure a strong balance sheet; and pay dividends to our shareholders. Value-disciplined capital allocation throughout the cycle is critical to protecting and enhancing our shareholders’ capital, given the long-term and capital intensive nature of our business. The Group uses attributable return on capital employed (ROCE) to monitor how efficiently assets are generating profit on invested capital for the equity shareholders of the Company. Attributable ROCE is an Alternative Performance Measure (APM). For more information on the APMs used by the Group, including definitions, please refer to page 57. Attributable ROCE % US$ million 2017 2016
De Beers 9% 11% Copper 16% 6% Platinum 10% 4% Iron Ore and Manganese 21% 12% Coal 67% 29% Nickel – (1)% Corporate and other n/a n/a 19% 11% Attributable ROCE increased to 19% in 2017 (2016: 11%), primarily because of higher attributable underlying EBIT. Average attributable capital employed remained flat at $27.4 billion as disposals in 2016 and reductions in working capital were offset by the impact of the strengthening South African rand and Australian dollar on assets denominated in those currencies.
10. CAPITAL BY SEGMENT
The disclosures in this note include certain Alternative Performance Measures (APMs). For more information on the APMs used by the Group, including definitions, please refer to page 57. Capital employed by segment Capital employed is the principal measure of segment assets and liabilities reported to the Group Management Committee. Capital employed is defined as net assets excluding net debt and financial asset investments. Capital employed US$ million 2017 2016
De Beers 9,294 8,725 Copper 5,899 6,073 Platinum 4,510 4,457 Iron Ore and Manganese 8,008 7,472 Coal 3,384 3,509 Nickel 1,959 2,003 Corporate and other (241) (335) Capital employed 32,813 31,904 Reconciliation to Consolidated balance sheet: Net debt (4,501) (8,487) Debit valuation adjustment attributable to derivatives hedging net debt 9 73 Financial asset investments 561 835 Net assets 28,882 24,325

-49-
Notes to the Condensed financial statements 10. CAPITAL BY SEGMENT (continued)
Non-current assets by location
Intangible assets and
Property, plant and equipment Total non-current assets US$ million 2017 2016 2017 2016
South Africa 10,818 9,554 11,638 10,488 Botswana 4,536 4,266 4,536 4,266 Other Africa 1,121 1,019 1,127 1,025 Brazil 5,589 5,674 5,729 5,804 Chile 6,281 6,089 6,282 6,089 Other South America 1,282 1,106 2,128 1,915 North America 741 784 739 787 Australia and Asia 2,302 2,078 2,798 2,451 United Kingdom (Anglo American plc's country of domicile) 1,168 1,263 1,247 1,321 Other Europe 128 103 128 125 Non-current assets by location 33,966 31,936 36,352 34,271 Unallocated assets 3,476 3,429 Total non-current assets 39,828 37,700 Total non-current assets by location primarily comprise Intangible assets, Property, plant and equipment, Environmental rehabilitation trusts and Investments in associates and joint ventures.

-50-
Notes to the Condensed financial statements
11. CAPITAL EXPENDITURE
The disclosures in this note include certain Alternative Performance Measures (APMs). For more information on the APMs used by the Group, including definitions, please refer to page 57. Capital expenditure by segment
US$ million 2017 2016
De Beers 273 526 Copper 665 563 Platinum 355 314 Iron Ore and Manganese 252 269 Coal 568 613 Nickel 28 62 Corporate and other 9 40 Capital expenditure 2,150 2,387 Reconciliation to Consolidated cash flow statement: Cash flows from derivatives related to capital expenditure 40 (22) Proceeds from disposal of property, plant and equipment 52 23 Direct funding for capital expenditure received from non-controlling interests 36 30 Expenditure on property, plant and equipment 2,278 2,418 Comparative information for Corporate and other has been restated to include Niobium and Phosphates, which was sold in 2016. Capitalised operating cash flows Capital expenditure includes net capitalised operating cash inflows of $78 million (2016: net inflows of $150 million) generated by operations prior to reaching commercial production for accounting purposes. Capital expenditure by category US$ million 2017 2016
Expansionary 306 817 Stay-in-business 1,310 1,042 Stripping and development 586 551 Proceeds from disposal of property, plant and equipment (52) (23) 2,150 2,387 Expansionary capital expenditure includes the cash flows from derivatives related to capital expenditure and is net of direct funding for capital expenditure received from non-controlling interests.

-51-
Notes to the Condensed financial statements
NET DEBT
Net debt decreased from $8.5 billion to $4.5 billion during the year, driven by operating cash inflows. Gearing has decreased from 26% at 31 December 2016 to 13% at 31 December 2017 as net debt decreased coupled with an increase in total capital. US$ million 2017 2016
Net assets 28,882 24,325 Net debt including related derivatives (note 12) 4,501 8,487 Total capital 33,383 32,812 Gearing 13% 26% Net debt is calculated as total borrowings less cash and cash equivalents (including derivatives that provide an economic hedge of net debt). Total capital is calculated as ‘Net assets’ (as shown in the Consolidated balance sheet) excluding net debt.
12. NET DEBT
Overview The disclosures in this note include certain Alternative Performance Measures (APMs). For more information on the APMs used by the Group, including definitions, please refer to page 57. Movement in net debt
US$ million
Cash and cash
equivalents Short term borrowings
Medium and long term
borrowings
Net debt excluding
derivatives
Derivatives hedging net debt
Net debt including
derivatives
At 1 January 2016 6,889 (1,634) (16,318) (11,063) (1,838) (12,901)
Cash flow (906) 1,834 2,685 3,613 414 4,027
Reclassifications – (1,977) 1,977 – – –
Movement in fair value – 19 79 98 55 153
Other non-cash movements – (12) 59 47 – 47
Currency movements 61 (29) 155 187 – 187
At 31 December 2016 6,044 (1,799) (11,363) (7,118) (1,369) (8,487) Cash flow 1,549 1,838 318 3,705 419 4,124 Reclassifications – (1,077) 1,077 – – – Movement in fair value – (7) 210 203 601 804 Other non-cash movements – (151) (144) (295) – (295) Currency movements 199 (128) (718) (647) – (647)
At 31 December 2017 7,792 (1,324) (10,620) (4,152) (349) (4,501)

-52-
Notes to the Condensed financial statements 12. NET DEBT (continued)
Further information Reconciliation to the Consolidated balance sheet
Cash and
cash equivalents Short term borrowings Medium and
long term borrowings
US$ million 2017 2016 2017 2016 2017 2016
Balance sheet 7,800 6,051 (1,351) (1,806) (10,620) (11,363) Balance sheet – disposal groups 19 – – – – – Bank overdrafts (27) (7) 27 7 – – Net cash/(debt) classifications 7,792 6,044 (1,324) (1,799) (10,620) (11,363)
South Africa net cash
The Group operates in South Africa where the existence of exchange controls may restrict the use of certain cash balances. The Group therefore monitors the cash and debt associated with these operations separately. These restrictions are not expected to have a material effect on the Group’s ability to meet its ongoing obligations. Below is a breakdown of net cash in South Africa. US$ million 2017 2016
Cash and cash equivalents 4,276 2,749 Short term borrowings (34) (61) Medium and long term borrowings (798) (1,130) Net cash excluding derivatives 3,444 1,558 Derivatives hedging net debt 2 – Net cash including derivatives 3,446 1,558
Debit valuation adjustment The debit valuation adjustments reduce the valuation of derivative liabilities hedging net debt reflecting the impact of the Group’s own credit risk. These adjustments are excluded from the Group’s definition of net debt (as detailed on page 59). The movement in the debit valuation adjustments are as follows: US$ million 2017 2016
At 1 January 73 555 Movement in fair value (64) (482) At 31 December 9 73

-53-
Notes to the Condensed financial statements
13. BORROWINGS
Overview The Group accesses borrowings mostly in capital markets through bonds issued under the Euro Medium Term Note (EMTN) programme, the South African Domestic Medium Term Note (DMTN) programme, the Australian Medium Term Note (AMTN) programme and through accessing the US bond markets. The Group uses interest rate and cross currency swaps to ensure that the majority of the Group’s borrowings are floating rate US dollar denominated. In March 2017, the Group completed a bond buyback transaction consisting of Euro and Sterling denominated bonds with maturities from April 2018 to June 2019. The Group used $1.27 billion of cash to retire $1.25 billion of contractual repayment obligations (including derivatives hedging the bonds). In April 2017, the Group issued $300 million 3.75% senior notes due 2022 and $700 million 4.75% senior notes due 2027 through accessing the US bond markets. In September 2017, the Group completed a bond buyback transaction consisting of Euro and US dollar denominated bonds with maturities from September 2018 to November 2020. The Group used $1.93 billion of cash to retire $1.86 billion of contractual repayment obligations (including derivatives hedging the bonds). In September 2017, the Group issued $650 million 3.625% senior notes due 2024 and $650 million 4% senior notes due 2027 through accessing the US bond markets. The Group also issued €600 million 1.625% senior notes due 2025 under the EMTN programme. On 7 February 2018, the Group gave notice that it will redeem in full its outstanding $750 million 9.375% US bond due April 2019 on 9 March 2018. Further information 2017 2016
US$ million Short term
borrowings
Medium and long term
borrowings Total
borrowings
Contractual repayment at hedged
rates Short term borrowings
Medium and long term
borrowings Total
borrowings
Contractual repayment at hedged
rates
Secured Bank loans and overdrafts 18 39 57 57 13 48 61 61 Obligations under finance leases 13 68 81 81 8 53 61 61 31 107 138 138 21 101 122 122 Unsecured Bank loans and overdrafts 24 123 147 147 12 457 469 469 Bonds issued under EMTN programme 717 4,702 5,419 5,704 633 6,230 6,863 8,191 US bonds – 5,362 5,362 5,433 1,086 3,867 4,953 4,937 Bonds issued under AMTN programme 397 – 397 470 – 371 371 470 Bonds issued under DMTN programme – 199 199 199 44 179 223 222 Interest payable and other loans 182 127 309 309 10 158 168 168 1,320 10,513 11,833 12,262 1,785 11,262 13,047 14,457 Total borrowings 1,351 10,620 11,971 12,400 1,806 11,363 13,169 14,579 The Group had the following undrawn committed borrowing facilities at 31 December:
US$ million 2017 2016
Expiry date Within one year 490 660 Greater than one year, less than two years 598 1,446 Greater than two years, less than three years 7,676 1,175 Greater than three years, less than four years – 6,203 Greater than four years, less than five years 244 223 9,008 9,707 Undrawn committed borrowing facilities expiring within one year include undrawn South African rand facilities equivalent to $0.3 billion (2016: $0.5 billion) in respect of facilities with a 364 day maturity which roll automatically on a daily basis, unless notice is served.

-54-
Notes to the Condensed financial statements
UNRECOGNISED ITEMS AND UNCERTAIN EVENTS
14. EVENTS OCCURRING AFTER END OF YEAR
With the exception of the completion of the sale transaction for the Union platinum mine detailed in note 16, the redemption of a bond detailed in note 13 and the proposed final dividend for 2017, there have been no reportable events since 31 December 2017.
15. CONTINGENT LIABILITIES
The Group is subject to various claims which arise in the ordinary course of business. Additionally, the Group has provided indemnities against certain liabilities as part of agreements for the sale or other disposal of business operations. Having taken appropriate legal advice, the Group believes that a material liability arising from the indemnities provided is remote. The Group is required to provide guarantees in several jurisdictions in respect of environmental restoration and decommissioning obligations. The Group has provided for the estimated cost of these activities.
GROUP STRUCTURE
16. ASSETS AND LIABILITIES HELD FOR SALE
Assets classified as held for sale as at 31 December 2017 of $129 million and associated liabilities of $41 million relate to the Union mine (Platinum) in South Africa and the former head office of De Beers in the UK. The sale transaction for the Union mine was announced on 15 February 2017 and subsequently completed on 1 February 2018.
17. DISPOSALS
During the year, the Group completed the disposal of the Group’s 83.3% interest in the Dartbrook coal mine (Coal), realising net cash proceeds of $13 million and resulting in a net gain on disposal of $76 million, including recycling of a cumulative translation gain of $81 million from reserves. Platinum disposed of long-dated Mineral Resources for proceeds of $82 million. In addition, the Group made net cash payments of $126 million principally in respect of disposals completed in prior years, which included payments for in-process inventories from the Rustenburg mine (Platinum) held at the date of disposal following the disposal of the operation in 2016 of $117 million. This resulted in a net cash outflow on disposals of subsidiaries and joint operations of $31 million. The Group also received proceeds of $61 million on the sale of financial asset investments, including Dreamvision Investments (see note 9), and proceeds of $22 million on the disposal of interests in associates. This resulted in a net cash inflow on disposals of $52 million. 2016 Disposals in 2016 principally comprised the sale of the Callide thermal coal mine in Queensland (Coal), the sale of the Niobium and Phosphates businesses (Corporate and other), the sale of the Rustenburg mine (Platinum) and the sale of the Group’s 70% interest in the Foxleigh metallurgical coal mine in Queensland (Coal).

-55-
Summary by operation This section includes certain Alternative Performance Measures (APMs). For more information on the APMs used by the Group, including definitions, please refer to page 57. Marketing activities are allocated to the underlying operation to which they relate.
Group revenue (1) Underlying EBITDA Underlying earnings Capital expenditure US$ million 2017 2016 2017 2016 2017 2016 2017 2016
De Beers 5,841 6,068 1,435 1,406 528 667 273 526 Mining
Debswana (Botswana) n/a n/a 484 571 n/a n/a 86 90 Namdeb Holdings (Namibia) n/a n/a 176 184 n/a n/a 33 65 South Africa n/a n/a 267 268 n/a n/a 114 156 Canada n/a n/a 205 79 n/a n/a (5) 184
Trading n/a n/a 449 378 n/a n/a 1 3 Other(2) n/a n/a (110) (35) n/a n/a 44 28 Projects and corporate – – (36) (39) n/a n/a – –
Copper 4,233 3,066 1,508 903 370 354 665 563 Los Bronces 1,839 1,386 737 326 n/a n/a 245 241 Collahuasi 1,314 1,068 806 569 356 221 243 144 Other operations 1,080 612 76 83 n/a n/a 177 178 Projects and corporate – – (111) (75) (72) (75) – –
Platinum 5,078 4,394 866 532 217 65 355 314 Mogalakwena 1,211 968 578 393 n/a n/a 151 157 Amandelbult 858 727 88 97 n/a n/a 34 25 Purchase of concentrate(3) 1,884 1,033 173 96 n/a n/a – – Other operations 1,125 1,666 83 (14) n/a n/a 170 129 Projects and corporate – – (56) (40) n/a n/a – 3
Iron Ore and Manganese 5,831 3,426 2,357 1,536 1,026 566 252 269 Kumba Iron Ore 3,486 2,801 1,474 1,347 467(4) 475(4) 229 160 Iron Ore Brazil (Minas-Rio) 1,405 – 435 (6) 413 4 23 109 Samancor (Manganese) 940 625 529 258 223 146 – – Projects and corporate – – (81) (63) (77)(4) (59)(4) – –
Coal 7,211 5,263 2,868 1,646 1,763 913 568 613 Metallurgical Coal 3,675 2,547 1,977 996 1,348 625 416 523 South Africa 2,746 2,109 588 473 311 258 152 90 Cerrejón 790 607 385 235 181 85 – – Projects and corporate – – (82) (58) (77) (55) – –
Nickel 451 426 81 57 (4) (57) 28 62
Corporate and other(5) 5 499 (292) (5) (628) (298) 9 40 Niobium and Phosphates – 495 – 118 – 78 – 26 Exploration – – (103) (107) (91) (99) – – Corporate activities and unallocated costs 5 4 (189) (16) (537) (277) 9 14 28,650 23,142 8,823 6,075 3,272 2,210 2,150 2,387
(1) Group revenue for copper is shown after deduction of treatment and refining charges (TC/RCs). (2) Other includes Element Six, downstream activities and the purchase price allocation adjustment. (3) Purchase of concentrate from joint ventures, associates and third parties for processing into refined metals. (4) Of the projects and corporate expense, which includes a corporate cost allocation, $49 million (2016: $37 million) relates to Kumba Iron Ore. The total contribution from
Kumba Iron Ore to the Group’s underlying earnings is $418 million (2016: $438 million). (5) Comparative information for Corporate and other has been restated to include Niobium and Phosphates, which was sold in 2016.

-56-
Key financial data This section includes certain Alternative Performance Measures (APMs). For more information on the APMs used by the Group, including definitions, please refer to page 57.
US$ million (unless otherwise stated) 2017 2016 2015 2014 2013 2012
restated(1) 2011 2010 2009 2008
Income statement measures Group revenue 28,650 23,142 23,003 30,988 33,063 32,785 36,548 32,929 24,637 32,964 Underlying EBIT 6,247 3,766 2,223 4,933 6,620 6,253 11,095 9,763 4,957 10,085 Underlying EBITDA 8,823 6,075 4,854 7,832 9,520 8,860 13,348 11,983 6,930 11,847 Revenue 26,243 21,378 20,455 27,073 29,342 28,680 30,580 27,960 20,858 26,311 Net finance costs (before special items and remeasurements) (473) (209) (458) (256) (276) (299) (20) (244) (273) (452) Profit/(loss) before tax 5,505 2,624 (5,454) (259) 1,700 (171) 10,782 10,928 4,029 8,571 Profit/(loss) for the financial year 4,059 1,926 (5,842) (1,524) 426 (564) 7,922 8,119 2,912 6,120 Non-controlling interests (893) (332) 218 (989) (1,387) (906) (1,753) (1,575) (487) (905) Profit/(loss) attributable to equity shareholders of the Company 3,166 1,594 (5,624) (2,513) (961) (1,470) 6,169 6,544 2,425 5,215 Underlying earnings 3,272 2,210 827 2,217 2,673 2,860 6,120 4,976 2,569 5,237 Balance sheet measures Capital employed 32,813 31,904 32,842 43,782 46,551 49,757 41,667 42,135 36,623 29,808 Net assets 28,882 24,325 21,342 32,177 37,364 43,738 43,189 37,971 28,069 21,756 Non-controlling interests (5,910) (5,309) (4,773) (5,760) (5,693) (6,127) (4,097) (3,732) (1,948) (1,535) Equity attributable to equity shareholders of the Company 22,972 19,016 16,569 26,417 31,671 37,611 39,092 34,239 26,121 20,221 Cash flow measures Cash flows from operations 8,375 5,838 4,240 6,949 7,729 7,370 11,498 9,924 4,904 9,579 Capital expenditure (2,150) (2,387) (4,177) (6,018) (6,075) (5,947) (5,672) (4,902) (4,707) (5,282) Net debt (4,501) (8,487) (12,901) (12,871) (10,652) (8,510) (1,374) (7,384) (11,280) (11,340) Metrics and ratios Underlying earnings per share (US$) 2.57 1.72 0.64 1.73 2.09 2.28 5.06 4.13 2.14 4.36 Earnings per share (US$) 2.48 1.24 (4.36) (1.96) (0.75) (1.17) 5.10 5.43 2.02 4.34 Ordinary dividend per share (US cents) 102 – 32 85 85 85 74 65 – 44 Ordinary dividend cover (based on underlying earnings per share) 2.5 – 2.0 2.0 2.5 2.7 6.8 6.4 – 9.9 Underlying EBIT margin 21.8% 16.3% 9.7% 15.9% 20.0% 19.1% 30.4% 29.6% 20.1% 30.6% Underlying EBIT interest cover(2) 16.5 16.7 10.1 30.1 35.8 36.8 n/a 34.2 19.6 24.1 Underlying effective tax rate 29.7% 24.6% 31.0% 29.8% 32.0% 29.0% 28.3% 31.9% 33.1% 33.4% Gearing (net debt to total capital)(3) 13% 26% 38% 29% 22% 16% 3% 16% 29% 34%
(1) Certain balances relating to 2012 were restated to reflect the adoption of new accounting pronouncements. See note 2 of the 2013 Consolidated financial statements for details.
(2) Underlying EBIT interest cover is underlying EBIT divided by net finance costs, excluding net foreign exchange gains and losses, unwinding of discount relating to provisions and other liabilities, financing special items and remeasurements, and including the Group’s attributable share of associates’ and joint ventures’ net finance costs, which in 2011 resulted in a net finance income and therefore the ratio is not applicable.
(3) Net debt to total capital is calculated as net debt divided by total capital (being ‘Net assets’ as shown in the Consolidated balance sheet excluding net debt).

-57-
Alternative performance measures Introduction When assessing and discussing the Group’s reported financial performance, financial position and cash flows, management makes reference to Alternative Performance Measures (APMs) of historical or future financial performance, financial position or cash flows that are not defined or specified under International Financial Reporting Standards (IFRS). The APMs used by the Group fall into two categories:
• Financial APMs: These financial measures are usually derived from the financial statements, prepared in accordance with IFRS. Certain financial measures cannot be directly derived from the financial statements as they contain additional information, such as financial information from earlier periods or profit estimates or projections. The accounting policies applied when calculating APMs are, where relevant and unless otherwise stated, substantially the same as those disclosed in the Group’s Consolidated financial statements for the year ended 31 December 2016.
• Non-financial APMs: These measures incorporate certain non-financial information that management believes is useful when assessing the performance of the Group.
APMs are not uniformly defined by all companies, including those in the Group’s industry. Accordingly, the APMs used by the Group may not be comparable with similarly titled measures and disclosures made by other companies. APMs should be considered in addition to, and not as a substitute for or as superior to, measures of financial performance, financial position or cash flows reported in accordance with IFRS. Purpose The Group uses APMs to improve the comparability of information between reporting periods and business units, either by adjusting for uncontrollable factors or special items which impact upon IFRS measures or, by aggregating measures, to aid the user of the Annual Report in understanding the activity taking place across the Group’s portfolio. Their use is driven by characteristics particularly visible in the mining sector:
1. Earnings volatility: The Group mines and markets commodities and precious metals and minerals. The sector is characterised by significant volatility in earnings driven by movements in macroeconomic factors, primarily price and foreign exchange. This volatility is outside the control of management and can mask underlying changes in performance. As such, when comparing year-on-year performance, management excludes certain items (such as those classed as ‘special items’) to aid comparability and then quantifies and isolates uncontrollable factors in order to improve understanding of the controllable portion of variances.
2. Nature of investment: Investments in the sector typically occur over several years and are large, requiring significant funding before generating cash. These investments are often made with partners and the nature of the Group’s ownership interest affects how the financial results of these operations are reflected in the Group’s results e.g. whether full consolidation (subsidiaries), consolidation of the Group’s attributable assets and liabilities (joint operations) or equity accounted (associates and joint ventures). Attributable metrics are therefore presented to help demonstrate the financial performance and returns available to the Group, for investment and financing activities, excluding the effect of different accounting treatments for different ownership interests.
3. Portfolio complexity: The Group operates in a number of different, but complementary, commodities, precious metals and minerals. The cost, value of and return from each saleable unit (e.g. tonne, pound, carat, ounce) can differ materially between each business. This makes understanding both the overall portfolio performance, and the relative performance of its constituent parts on a like-for-like basis, more challenging. The Group therefore uses composite APMs to provide a consistent metric to assess performance at the portfolio level.
Consequently, APMs are used by the Board and management for planning and reporting. A subset is also used by management in setting director and management remuneration. The measures are also used in discussions with the investment analyst community and credit rating agencies.

-58-
Alternative performance measures (continued)
Financial APMs
Group APM Closest equivalent IFRS measure Adjustments to reconcile to primary statements Rationale for adjustments
Income statement
Group revenue
Revenue • Revenue from associates and joint ventures
• Exclude the effect of different basis of consolidation to aid comparability
Underlying EBIT
Profit/(loss) before net finance income/ (costs) and tax
• Operating and non-operating special items and remeasurements
• Underlying EBIT from associates and joint ventures
• Exclude the impact of certain items due to their size and nature to aid comparability
• Exclude the effect of different basis of consolidation to aid comparability
Underlying EBITDA
Profit/(loss) before net finance income/ (costs) and tax
• Operating and non-operating special items and remeasurements
• Depreciation and amortisation • Underlying EBITDA from associates and
joint ventures
• Exclude the impact of certain items due to their size and nature to aid comparability
• Exclude the effect of different basis of consolidation to aid comparability
Underlying earnings
Profit/(loss) for the financial year attributable to equity shareholders of the Company
• Special items and remeasurements • Exclude the impact of certain items due to their size and nature to aid comparability
Underlying effective tax rate
Income tax expense • Tax related to special items and remeasurements
• The Group’s share of associates’ and joint ventures’ profit before tax, before special items and remeasurements, and tax expense, before special items and remeasurements
• Exclude the impact of certain items due to their size and nature to aid comparability
• Exclude the effect of different basis of consolidation to aid comparability
Underlying earnings per share
Earnings per share • Special items and remeasurements • Exclude the impact of certain items due to their size and nature to aid comparability
Balance sheet
Net debt Borrowings less cash and related hedges
• Debit valuation adjustment • Exclude the impact of accounting adjustments from the net debt obligation of the Group
Attributable ROCE
No direct equivalent • Non-controlling interests’ share of capital employed and underlying EBIT
• Average of opening and closing attributable capital employed
• Exclude the effect of different basis of consolidation to aid comparability
Cash flow
Capital expenditure (capex)
Expenditure on property, plant and equipment
• Cash flows from derivatives related to capital expenditure
• Proceeds from disposal of property, plant and equipment
• Direct funding for capital expenditure from non-controlling interests
• To reflect the net attributable cost of capital expenditure taking into account economic hedges
Attributable free cash flow
Cash flows from operations
• Capital expenditure • Cash tax paid • Dividends from associates, joint ventures
and financial asset investments • Net interest paid • Dividends to non-controlling interests
• To measure the amount of cash available to finance returns to shareholders or growth after servicing debt, providing a return to minority shareholders and meeting existing capex commitments
Group revenue Group revenue includes the Group’s attributable share of associates’ and joint ventures’ revenue. A reconciliation to ‘Revenue’, the closest equivalent IFRS measure to Group revenue is provided within note 3 to the Condensed financial statements.

-59-
Alternative performance measures (continued)
Underlying EBIT Underlying EBIT is ‘Operating profit/(loss)’ presented before special items and remeasurements(1) and includes the Group’s attributable share of associates’ and joint ventures’ underlying EBIT. Underlying EBIT of associates and joint ventures is the Group’s attributable share of associates’ and joint ventures’ revenue less operating costs before special items and remeasurements(1) of associates and joint ventures. A reconciliation to ‘Profit/(loss) before net finance income/(costs) and tax’, the closest equivalent IFRS measure to underlying EBIT is provided within note 3 to the Condensed financial statements. Underlying EBITDA Underlying EBITDA is underlying EBIT before depreciation and amortisation and includes the Group’s attributable share of associates’ and joint ventures’ underlying EBIT before depreciation and amortisation. A reconciliation to ‘Profit/(loss) before net finance income/(costs) and tax’, the closest equivalent IFRS measure to underlying EBITDA, is provided within note 3 to the Condensed financial statements. Underlying earnings Underlying earnings is ‘Profit/(loss) for the financial year attributable to equity shareholders of the Company’ before special items and remeasurements(1) and is therefore presented after net finance costs, income tax expense and non-controlling interests. A reconciliation to ‘Profit/(loss) for the financial year attributable to equity shareholders of the Company’, the closest equivalent IFRS measure to underlying earnings, is provided within note 3 to the Condensed financial statements. Underlying effective tax rate The underlying effective tax rate equates to the income tax expense, before special items and remeasurements(1) and including the Group’s share of associates’ and joint ventures’ tax before special items and remeasurements,(1) divided by profit before tax before special items and remeasurements(1) and including the Group’s share of associates’ and joint ventures’ profit before tax before special items and remeasurements.(1) A reconciliation to ‘Income tax expense’, the closest equivalent IFRS measure to underlying effective tax rate, is provided within note 6 to the Condensed financial statements. Underlying earnings per share Basic and diluted underlying earnings per share are calculated as underlying earnings divided by the basic or diluted shares in issue. The calculation of underlying earnings per share is disclosed within note 4 to the Condensed financial statements. Net debt Net debt is calculated as total borrowings less cash and cash equivalents (including derivatives which provide an economic hedge of net debt, see note 12, before taking into account the effect of debit valuation adjustments explained in note 12). A reconciliation to the Consolidated balance sheet is provided within note 12 to the Condensed financial statements. Capital expenditure (capex) Capital expenditure is defined as cash expenditure on property, plant and equipment, including related derivatives, and is presented net of proceeds from disposal of property, plant and equipment and includes direct funding for capital expenditure from non-controlling interests in order to match more closely the way in which it is managed. A reconciliation to the ‘Expenditure on property, plant and equipment’, the closest equivalent IFRS measure to capital expenditure, is provided within note 11 to the Condensed financial statements. Operating cash flows generated by operations that have not yet reached commercial production are also included in capital expenditure. However, capital expenditure is also periodically shown on an underlying basis i.e. before inclusion of capitalised operating cash flows. Where this occurs, the measure is footnoted as such. Attributable return on capital employed (ROCE) ROCE is a ratio that measures the efficiency and profitability of a company’s capital investments. Attributable ROCE displays how effectively assets are generating profit on invested capital for the equity shareholders of the Company. It is calculated as attributable underlying EBIT divided by average attributable capital employed. (1) Special items and remeasurements are defined in note 9 to the Condensed financial statements.
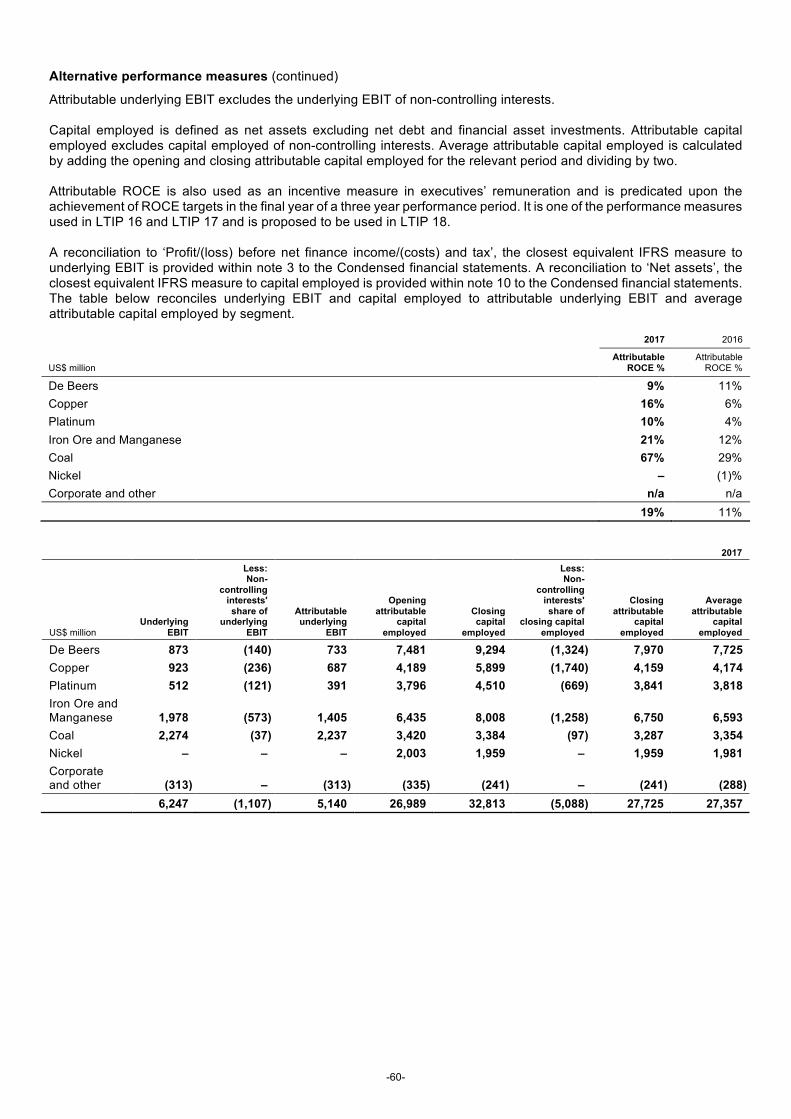
-60-
Alternative performance measures (continued)
Attributable underlying EBIT excludes the underlying EBIT of non-controlling interests. Capital employed is defined as net assets excluding net debt and financial asset investments. Attributable capital employed excludes capital employed of non-controlling interests. Average attributable capital employed is calculated by adding the opening and closing attributable capital employed for the relevant period and dividing by two. Attributable ROCE is also used as an incentive measure in executives’ remuneration and is predicated upon the achievement of ROCE targets in the final year of a three year performance period. It is one of the performance measures used in LTIP 16 and LTIP 17 and is proposed to be used in LTIP 18. A reconciliation to ‘Profit/(loss) before net finance income/(costs) and tax’, the closest equivalent IFRS measure to underlying EBIT is provided within note 3 to the Condensed financial statements. A reconciliation to ‘Net assets’, the closest equivalent IFRS measure to capital employed is provided within note 10 to the Condensed financial statements. The table below reconciles underlying EBIT and capital employed to attributable underlying EBIT and average attributable capital employed by segment.
2017 2016
US$ million Attributable
ROCE % Attributable
ROCE %
De Beers 9% 11% Copper 16% 6% Platinum 10% 4% Iron Ore and Manganese 21% 12% Coal 67% 29% Nickel – (1)% Corporate and other n/a n/a 19% 11%
2017
US$ million Underlying
EBIT
Less: Non-
controlling interests' share of
underlying EBIT
Attributable underlying
EBIT
Opening attributable
capital employed
Closing capital
employed
Less: Non-
controlling interests' share of
closing capital employed
Closing attributable
capital employed
Average attributable
capital employed
De Beers 873 (140) 733 7,481 9,294 (1,324) 7,970 7,725 Copper 923 (236) 687 4,189 5,899 (1,740) 4,159 4,174 Platinum 512 (121) 391 3,796 4,510 (669) 3,841 3,818 Iron Ore and Manganese 1,978 (573) 1,405 6,435 8,008 (1,258) 6,750 6,593 Coal 2,274 (37) 2,237 3,420 3,384 (97) 3,287 3,354 Nickel – – – 2,003 1,959 – 1,959 1,981 Corporate and other (313) – (313) (335) (241) – (241) (288) 6,247 (1,107) 5,140 26,989 32,813 (5,088) 27,725 27,357

-61-
Alternative performance measures (continued)
2016
US$ million Underlying
EBIT
Less: Non-
controlling interests' share of
underlying EBIT
Attributable underlying
EBIT
Opening attributable
capital employed
Closing capital
employed
Less: Non-
controlling interests' share of
closing capital employed
Closing attributable
capital employed
Average attributable
capital employed
De Beers 1,019 (186) 833 7,402 8,725 (1,244) 7,481 7,441 Copper 261 (15) 246 4,176 6,073 (1,884) 4,189 4,182 Platinum 185 (46) 139 3,726 4,457 (661) 3,796 3,761 Iron Ore and Manganese 1,275 (522) 753 5,756 7,472 (1,037) 6,435 6,096 Coal 1,112 (25) 1,087 3,978 3,509 (89) 3,420 3,699 Nickel (15) – (15) 1,968 2,003 – 2,003 1,986 Corporate and other (71) – (71) 763 (335) – (335) 214 3,766 (794) 2,972 27,769 31,904 (4,915) 26,989 27,379
Attributable free cash flow Attributable free cash flow is calculated as ‘Cash flows from operations’ plus dividends received from associates, joint ventures and financial asset investments, less capital expenditure, less tax cash payments excluding tax payments relating to disposals, less net interest paid including interest on derivatives hedging net debt, less dividends paid to non-controlling interests. A reconciliation of ‘Cash flows from operations’, the closest equivalent IFRS measure, is provided on page 6. Non-financial APMs Some of our measures are not reconciled to IFRS either because they include non-financial information, because there is no meaningful IFRS comparison or the purpose of the measure is not typically covered by IFRS. Group APM Category Purpose
Copper equivalent production Portfolio complexity Communicate production/revenue generation movements in a single comparable measure removing the impact of price
Unit cost Earnings volatility Express cost of producing one unit of saleable product Copper equivalent unit cost Portfolio complexity Communicate the cost of production per unit in a single comparable
measure for the portfolio Productivity Portfolio complexity Highlight efficiency in generating revenue per employee Volume and cash cost improvements Earnings volatility Quantify year-on-year EBITDA improvement removing the impact of major
uncontrollable factors Copper equivalent production Copper equivalent production, expressed as copper equivalent tonnes, shows changes in underlying production volume. It is calculated by expressing each commodity’s volume as revenue, subsequently converting the revenue into copper equivalent units by dividing by the copper price (per tonne). Long-term forecast prices (and foreign exchange rates where appropriate) are used, in order that period-on-period comparisons exclude any impact for movements in price. When calculating copper equivalent production, all volumes relating to domestic sales are excluded, as are volumes from Samancor and sales from non-mining activities. Volume from projects in pre-commercial production are included. Unit cost Unit cost is the direct cash cost including direct cash support costs incurred in producing one unit of saleable production. For bulk products (coal, iron ore), unit costs shown are FOB i.e. cost on board at port. For base metals (copper, nickel), they are shown at C1 i.e. after inclusion of by-product credits and logistics costs. For platinum and diamonds, unit costs include all direct expensed cash costs incurred i.e. excluding, amongst other things, market development activity, corporate overhead etc. Platinum unit costs exclude by-product credits. Royalties are excluded from all unit cost calculations.

-62-
Alternative performance measures (continued)
Copper equivalent unit cost Copper equivalent unit cost is the cost incurred to produce one tonne of copper equivalent. Only the cost incurred in mined output from subsidiaries and joint operations is included, representing direct costs in the Consolidated income statement controllable by the Group. Costs and volumes from associates and joint ventures are excluded, as are those from operations that are not yet in commercial production, that deliver domestic production, and those associated with third-party volume purchases of diamonds and platinum concentrate. When calculating copper equivalent unit cost, unit costs for each commodity are multiplied by relevant production, combined and then divided by the total copper equivalent production, to get a copper equivalent unit cost i.e. the cost of mining one tonne of copper equivalent. The metric is in US dollars and, where appropriate, long-term foreign exchange rates are used to convert from local currency to US dollars. Productivity The Group’s productivity measure calculates the copper equivalent production generated per employee. It is a measure that represents how well headcount is driving revenue. It is calculated by dividing copper equivalent production by the average direct headcount from consolidated mining operations in a given year. Volume and cash cost improvements The Group uses an underlying EBITDA waterfall to understand its year-on-year underlying EBITDA performance. The waterfall isolates the impact of uncontrollable factors in order that the real year-on-year improvement in performance can be seen by the user. Three variables are normalised, in the results of subsidiaries and joint operations, for:
• Price: The movement in price between comparative periods is removed by multiplying current year sales volume by the movement in realised price for each product group.
• Foreign exchange: The year-on-year movement in exchange is removed from the current year non-US dollar cost base i.e. costs are restated at prior year foreign exchange rates. The non-US dollar cash cost base excludes costs which are price linked (e.g. purchase of concentrate from third-party platinum providers, third-party diamond purchases).
• Inflation: CPI is removed from cash costs, restating these costs at the pricing level of the base year. The remaining variances in the underlying EBITDA waterfall are in real US dollar terms for the base year i.e. for a waterfall comparing 2017 with 2016, the sales volume and cash cost variances exclude the impact of price, foreign exchange and CPI and are hence in real 2016 terms. This allows the user of the waterfall to understand the underlying real movement in sales volumes and cash costs on a consistent basis.

-63-
Exchange rates and commodity prices US$ exchange rates 2017 2016
Year end spot rates South African rand 12.31 13.73 Brazilian real 3.31 3.25 Sterling 0.74 0.81 Australian dollar 1.28 1.38 Euro 0.83 0.95 Chilean peso 615 667 Botswana pula 9.85 10.69
Average rates for the year South African rand 13.31 14.70 Brazilian real 3.19 3.48 Sterling 0.78 0.74 Australian dollar 1.30 1.34 Euro 0.89 0.90 Chilean peso 649 676 Botswana pula 10.34 10.89 Commodity prices 2017 2016
Year end spot prices Copper(1) US cents/lb 325 250 Platinum(2) US$/oz 925 898 Palladium(2) US$/oz 1,057 670 Rhodium(3) US$/oz 1,700 758 Iron ore (62% Fe CFR)(4) US$/tonne 74 80 Iron ore (66% Fe Concentrate CFR)(5) US$/tonne 96 101 Hard coking coal (FOB Australia)(4) US$/tonne 262 230 PCI (FOB Australia)(4) US$/tonne 147 112 Thermal coal (FOB South Africa)(6) US$/tonne 95 86 Thermal coal (FOB Australia)(7) US$/tonne 104 94 Thermal coal (FOB Colombia)(6) US$/tonne 86 94 Nickel(1) US cents/lb 556 454
Average market prices for the year Copper(1) US cents/lb 280 221 Platinum(2) US$/oz 950 989 Palladium(2) US$/oz 871 615 Rhodium(3) US$/oz 1,097 681 Iron ore (62% Fe CFR)(4) US$/tonne 71 58 Iron ore (66% Fe Concentrate CFR)(5) US$/tonne 87 69 Hard coking coal (FOB Australia)(8) US$/tonne 188 143 PCI (FOB Australia)(8) US$/tonne 119 97 Thermal coal (FOB South Africa)(6) US$/tonne 84 64 Thermal coal (FOB Australia)(7) US$/tonne 89 66 Thermal coal (FOB Colombia)(6) US$/tonne 78 58 Nickel(1) US cents/lb 472 436
(1) Source: London Metal Exchange (LME). (2) Source: London Platinum and Palladium Market (LPPM). (3) Source: Comdaq. (4) Source: Platts. (5) Source: Metal Bulletin. (6) Source: Argus/McCloskey. (7) Source: globalCOAL. (8) Represents average spot prices. Prior year prices were previously based on the quarterly average benchmark and have been restated accordingly.

-64-
ANGLO AMERICAN plc (Incorporated in England and Wales – Registered number 03564138)
(the Company) Notice of Dividend
(Dividend No. 32) Notice is hereby given that a final dividend on the Company’s ordinary share capital in respect of the year to 31 December 2017 will be paid as follows:
Amount (United States currency) (note 1) 54 cents per ordinary share
Amount (South African currency) (note 2) R6.31692 per ordinary share
Last day to effect removal of shares between the United Kingdom (UK) and South African (SA) registers Monday, 12 March 2018
Last day to trade on the JSE Limited (JSE) to qualify for dividend Tuesday, 13 March 2018
Ex-dividend on the JSE from the commencement of trading (note 3) Wednesday, 14 March 2018
Ex-dividend on the London Stock Exchange from the commencement of trading on Thursday, 15 March 2018
Record date (applicable to both the UK principal register and SA branch register) Friday, 16 March 2018
Movement of shares between the UK and SA registers permissible from Monday, 19 March 2018
Last day for receipt of US$:£/€ currency elections by the UK Registrars (note 1) Thursday, 19 April 2018
Last day for receipt of Dividend Reinvestment Plan (DRIP) mandate forms by the UK Registrars (notes 4, 5 and 6) Thursday, 19 April 2018
Last day for receipt of DRIP mandate forms by Central Securities Depository Participants (CSDPs) (notes 4, 5 and 6) Monday, 23 April 2018
Last day for receipt of DRIP mandate forms by the South African Transfer Secretaries (notes 4, 5 and 6) Tuesday, 24 April 2018
Currency conversion US$:£/€ rates announced on Thursday, 26 April 2018
Payment date of dividend Friday, 11 May 2018 Notes 1. Shareholders on the UK register of members with an address in the UK will be paid in Sterling and those with an address in a country in the European
Union which has adopted the Euro will be paid in Euros. Such shareholders may, however, elect to be paid their dividends in US dollars provided the UK Registrars receive such election by Thursday, 19 April 2018. Shareholders with an address elsewhere will be paid in US dollars except those registered on the South African branch register who will be paid in South African rand.
2. Dividend Tax will be withheld from the amount of the gross dividend of R6.31692 per ordinary share paid to South African shareholders at the rate of 20% unless a shareholder qualifies for exemption. After the Dividend Tax has been withheld, the net dividend will be R5.053536 per ordinary share. Anglo American plc had a total of 1,405,465,332 ordinary shares in issue, including 849,387 treasury shares, as at the date hereof. In South Africa the dividend will be distributed by Anglo South Africa Capital Proprietary Limited, a South African company with tax registration number 9273/364/84/5, in accordance with the Company’s dividend access share arrangements.
3. Dematerialisation and rematerialisation of registered share certificates in South Africa will not be effected by CSDPs during the period from the JSE ex-dividend date to the record date (both days inclusive).
4. Those shareholders who already participate in the DRIP need not complete a DRIP mandate form for each dividend as such forms provide an ongoing authority to participate in the DRIP until cancelled in writing. Shareholders who wish to participate in the DRIP should obtain a mandate form from the UK Registrars, the South African Transfer Secretaries or, in the case of those who hold their shares through the STRATE system, their CSDP.
5. In terms of the DRIP, and subject to the purchase of shares in the open market, share certificates/CREST notifications are expected to be mailed and CSDP investor accounts credited/updated on or about Wednesday, 6 June 2018. CREST accounts will be credited on Wednesday, 16 May 2018.
6. Copies of the terms and conditions of the DRIP are available from the UK Registrars or the South African Transfer Secretaries.
Registered office UK Registrars South African Transfer Secretaries 20 Carlton House Terrace Equiniti Computershare Investor Services (Pty) Limited London Aspect House Rosebank Towers, 15 Biermann Avenue SW1Y 5AN Spencer Road Rosebank, Johannesburg, 2196 United Kingdom Lancing PO Box 61051 West Sussex Marshalltown, 2107 BN99 6DA South Africa United Kingdom