forage selection by mule deer: does niche breadth increase ... · i journal of zoology. pr~nt issn...
TRANSCRIPT

I
Journal of Zoology. Pr~nt ISSN 0952-8369
*
Forage selection by mule deer: does niche breadth increase with population density?
1 National Health and Environmental Effects Research Laboratory, Office of Research and Development, US Environmental Protection Agency, Narragansett, RI, USA 2 Department of Biological Sciences, ldaho State University, Pocatello, ID, USA 3 United States Forest Service, Pacific Northwest Research Station, La Grande, OR, USA
Keywords mule deer; Odocoileus hemionus; density dependence; ideal-free distribution; dietary niche dynamics.
Correspondence R. Terry Bowyer, Department of Biological Sciences, ldaho State University, Pocatello, ID 83221, USA. Tel: 208-282-4082; Fax: 208-282-4570 Email: bowyterrQisu.edu
Received 5 April 2005; accepted 1 August 2005
Abstract Effects of population density of mule deer Odocoileus hemionus on forage selection were investigated by comparing diet characteristics of two subpopulations of deer in southern California, USA, that differed in population density during winter. Quality of diet for deer, as indexed by faecal crude protein, was higher at the low- density site than at the high-density site in winter, when deer densities were different. Quality of diet was similar in summer when both areas had comparable densities of deer. Both outcomes are consistent with predictions from density- dependent selection of diets by deer. Dietary niche breadth, however, differed in a manner opposite to predictions of niche theory based on diet selection under an ideal-free distribution. During winter, when differences in density between the two study sites were pronounced, niche breadth along the dietary axis in the low- density area was twice that of the high-density site. Generalist herbivores feeding primarily on low-quality browse at high population density in winter would be expected to increase their dietary breadth by feeding on additional species of plants as they depleted their food supply. Mule deer in our study, however, decreased the breadth of their dietary niche as population density increased. We hypothesize that by rapidly eliminating high-quality forages from an area by heavy grazing, deer at higher population densities narrowed their dietary niche. Theoretical models for changes in niche dimensions, including the ideal-free distribution, need to consider such empirical outcomes.
Introduction In heterogeneous environments, resources available to a population can be viewed as continua along habitat gradi- ents (Kshatriya & Cosner, 2002). Individuals are distributed along such gradients according to how well they utilize resources. Thus, populations of K-selected species at low densities would be expected to select near-optimal habitats or resources (Pianka, 1988). As population density in- creases, however, intraspecific competition for these optimal resources also intensifies (McCullough, 1979; Kie, Bowyer & Stewart, 2003; Stewart et al., 2005). This competition results in a reduction in resources available per individual or total exclusion of some less-competitive animals from the best resources. Consequently, some individuals that exploit sub-optimal but less-contested resources may be favoured. Therefore, the variety of resources or habitats used by a population should increase with increasing population den- sity - the breadth of their niche should increase (Pianka, 1988).
The concept of density-dependent resource selection under an ideal-free distribution depends on the assumptions that individuals in a population have (1) ideal knowledge of the distribution of resources in their environment and (2) free access to all resources. This ideal-free distribution, first conceived by Fretwell & Lucas (1970), has been dis- cussed thoroughly by several authors (Sutherland, 1983; Morris, 1989; Rosenzweig, 199 1; Kennedy & Gray, 1992). The basic tenet is that as intraspecific competition increases, use of sub-optimal resources becomes a more viable strat- egy. Thus, as populations increase, shifts should occur in resource selection. Many descriptions and tests of such density-dependent shifts exist, yet most published accounts involve small-bodied species that exhibit life-history char- acteristics typical of more r-selected species (canaries Serinus canaria - Mayr, 1926; mallards Anas platyrhynchos - Harper, 1982; and voles Microrus californicus - Ostfeld, Lidicker & Heske, 1985). Few critical tests of effects of population density on breadth of dietary niche exist; how- ever, Kie & Bowyer (1999) observed that niche breadth of
Journal of Zoology 269 (2006) 39-49 @ 2006 The Zoological Society of London 39

Density-dependent forage selection by mule deer M. C. Nicholson, R. T. Bowyer and J. G. Kie
white-tailed deer Odocoileus vivginianus decreased with in- creasing population density in some seasons. Moreover, studies of whether the behaviour of large mammals was consistent with predictions of an idea-free distribution have had mixed outcomes (Mysterud et a/., 2001; Beckmann & Berger, 2003; Bro-Jorgensen, 2003; Nilsen, Linnell & An- dersen, 2004; Horner et al., 2005).
New world deer Odocoileus spp. are comparatively large, long-lived mammals with relatively low reproductive rates, with females giving extended care to young (McCullough, 1979). Deer inhabit somewhat stable environments at popu- lation densities that often are near ecological carrying capacity ( K ) . Hence, compared with other vertebrates, deer are a K-selected species (MacArthur & Wilson, 1967; Stubbs, 1977), and exhibit strong density-dependent popu- lation processes. For example, as deer populations approach or exceed K, ovulation and embryo rates decline (McCul- lough, 1979; Kie & White, 1985; Kie et al., 2003), mortality of young increases (Hungerford, 1970; Keech et al., 2000), and the physical condition of individuals becomes poor (Kie, White & Drawe, 1983; Stewart et a/., 2005). This results in increased susceptibility to parasites, diseases and predation (Mech, 1970; Kruuk, 1972; Eve & Kellogg, 1977; McCullough, 1979). Nonetheless, how density of deer affects use of resources is poorly documented; our knowl- edge of this relationship is inchoate.
Quality of forage ingested varies inversely with popula- tion density of deer (Nellis & Ross, 1969; Kie, Drawe & Scott, 1980; Hodgman & Bowyer, 1986). Further, red deer Cervus elaphus altered their use of habitat in response to changing population size (Clutton-Brock, Iason & Guiness, 1987). Data on how changes in population size affect habitat selection or use of forage are scant for most large mammals; yet, such information is vital if the consequences of density dependence are to be completely understood. We investi- gated effects of population density on forage selection by a large herbivore, the mule deer Odocoileus hemionus. This research was designed to gain a broader theoretical framework and provide insights into the role of popula- tion density in forage selection by ungulates, and whether such use of forage follows predictions of an ideal-free distribution.
There are subpopulations of mule deer in southern California, USA, with distinct and nonoverlapping distribu- tions that occur at different population densities, yet these subpopulations often occur in similar habitats (Nicholson, Bowyer & Kie, 1997). We compared two of those subpopu- lations as a critical test of how dietary-niche theory relates to deer occurring at different population densities. The null hypothesis is that with increasing density, no change occurs in the dietary niche of mule deer. For the null hypothesis to be rejected and density-dependent forage selection to be invoked, at higher densities the niche breadth (on the forage axis) should be broader than for deer at lower densities.
More deer should be forced to feed on a sub-optimal diet as forage becomes limited and, in consequence, average quality of forage for higher-density populations should be lower than for populations at low or moderate density. This
prediction is based on two possible foraging strategies. Firstly, if less high-quality forage is available per deer, these herbivores may be forced to feed on other plant species of lower quality. Nellis & Ross (1969) reported that use of forage species by mule deer was greatly affected by relative availability of forage; therefore, diet breadth should in- crease. Indeed, Kohlmann & Risenhoover (1994) reported that white-tailed deer foraged less selectively in response to forage depletion, and Spaeth et a/. (2004) reached the same conclusion for moose Alces alces. Secondly, deer may not change plant species in their diets, but may continue feeding on the same species although on poorer-quality parts of plants. If this outcome occurs, heavy browsing of these plants by deer should result. Because nutritive quality of browse decreases with increasing distance down the stem (Aldous, 1944; Bailey, 1967; Spaeth et al., 2002, 2004), forage quality should decrease as deer browse back twigs. Thus, if forage species used by deer remain constant, quality of diet should decrease, and diet breadth should remain the same.
Study site
We conducted this study from January to December 1991 in the upper drainage of the Santa Ana River in southern California, USA (34" 1 0134"N, 1 16"53'57"W). Descriptions of topography and vegetation are contained in Nicholson et a/. (1997). The Santa Ana River forms a major drainage system (32 000 ha) for the southwestern portion of the San Bernardino Mountains, 145 km east of Los Angeles, CA, USA. Slopes associated with this drainage generally are steep and topographically diverse. Elevations range from 61 0 to > 3500 m at Mt San Gorgonio. Vegetation is mostly Jeffrey pine Pinus jeffreyi forests on northern exposures, dense chaparral on southern slopes, and canyon live oak Quercus chrysolepis in valley bottoms (Munz, 1974). The climate is typical of cismontane southern California with annual temperatures ranging from > 40 "C during summer to < -20 "C in winter. Total precipitation during the study was 736 mm. Precipitation occurred primarily as snow dur- ing the cooler winter months; however, on south-facing slopes, snowfall was highly transitory and localized (Nichol- son et a/., 1997). We defined seasons based on plant phenology and life-history characteristics of deer: winter was January to May; autumn was September to December and summer was June to August.
We chose two neighbouring sub-drainages within the upper Santa Ana complex for intensive study. These sites were selected because they were ecologically similar, and because rates of hunter success indicated the two areas had different densities of mule deer. These two subpopulations were part of a larger population of mule deer inhabiting the Santa Ana complex (Nicholson et a/., 1997). Overall densi- ties of deer in the Santa Ana River drainage were likely near carrying capacity (K), because of relatively low reproductive rates of females and because primarily male deer were
Journal of Zoology 269 (2006) 39-49 @ 2006 The Zoological Society of London

M. C. Nicholson, R. T. Bowyer and J. G. Kie Density-dependent forage selection by mule deer
harvested by hunters. Nonetheless, local variation in popu- lation density occurred throughout these mountains. Both Rattlesnake and Staircase Canyons are located on the south-facing portion of the Santa Ana River drainage, between Sugarloaf Mountain and Snow Summit (Nicholson et al., 1997). Rattlesnake Canyon (695 ha) contained a lower population density of deer than did Staircase Canyon (425 ha). Based on available 7.5-min digital elevation models (United States Geological Survey), vegetation maps (United States Forest Service) and visual inspection, elevations with- in the two canyons were broadly overlapping, and similar vegetation occurred in each canyon. Although both sub- drainages contained year-round populations of deer, Stair- case Canyon served as a major winter range for migratory deer in the Santa Ana drainage. Migratory deer rarely used Rattlesnake Canyon in winter. Further, in a related study of movements (Nicholson et al., 1997), deer equipped with telemetry transmitters did not move between the two can- yons, indicating that those two areas have distinct seasonal assemblages of deer. Principal predators of deer in the area were mountain lions Puma concolor and coyotes Canis latrans. Although predation risk may have varied between areas, both canyons were easily within the daily range of movements for these large carnivores (Bekoff, 1977; Pierce et al., 1999; Pierce, Bleich & Bowyer, 2000).
Vegetation composition
A habitat map for each canyon was developed from LAND- SAT-TM imagery with Terra Mar software (Terra Mar Inc., Garden Grove, CA, USA); eight classes of vegetation were distinguished with this methodology. These classes included montane hardwood, montane conifer, mixed hardwood- conifer, manzanita chaparral, Ceanothus chaparral, sage- brush-mixed chaparral, grassland and areas of bare ground and tallus slopes. The final habitat map was transferred to a geographic information system (GIs; ARCIINFO, Envir- onmental Systems Research Institute, Redlands, CA, USA), where total area of each habitat was determined.
Herbaceous and shrub-dominated habitats were sampled with a modification of the step-point method (Bowyer & Bleich, 1984). Per cent cover and per cent relative frequency of plant species were sampled along 53 randomly located transects. Step-points occurred c. 2m apart (four strides), and transects were located at least 20m apart. A thin line was drawn perpendicular to the ground on the toe of a boot; per cent of herbaceous plants and shrub cover (woody plants) were calculated from any portion of the plant hit by the vertical projection of that thin line, whereas relative frequency was determined only for the base of plants that touched the line on the boot (Bowyer & Bleich, 1984). Each
reliable index to biomass for many plant species and forage classes (Barten, Bowyer & Jenkins, 2001). Additionally, relative frequency was determined from step points that struck the base of trees or shrubs. All habitats in both Staircase and Rattlesnake Canyons were sampled between 1 May and 30 June. The distribution of shrubs and trees would not be expected to change seasonally. Although other forage classes undoubtedly experienced growth and senes- cence during the study period, both study sites were adjacent and exposed to similar climatic regimes. Consequently, seasonal changes in vegetation abundance were likely simi- lar in both canyons.
Measures of forage quality
A subset of forage species was clipped and dried for laboratory analysis and to determine dry biomass at 3-month intervals. For trees and shrubs, this included only current annual growth from at least three composited samples from individual plants within each study area. Measures of forage quality included in vitro dry matter digestibility (IVDMD; Tilly & Terry, 1963), and per cent crude protein determined by Kjeldahl's analysis (Horwitz, 1975). Analyses were done under contract by Washington State University, Pullman, WA, USA.
Indexing abundance of deer
We sampled both canyons at monthly intervals for faecal pellets of deer using permanent circular plots of 2 m radius placed 20m apart along randomly located transects. Each 1 km-long transect consisted of 50 circular plots, and each canyon had three transects for a total of 150 plots per canyon. We indexed abundance of deer on both study sites from counts of their faeces. These data were used to confirm initial results from hunter harvests, but also to document changes in deer density in seasons during which hunting did not occur.
Although the use of faecal groups as an index to popula- tion density has been questioned (Fuller, 1991), Riney (1957) reported that counts of faecal groups could be used to detect major changes in population size, and Loft & Kie (1988) observed that this method could be used to rank relative use of habitats. Further, because we used faecal groups to compare differences between nearby canyons with similar habitats within seasons, biases from differential rates of defecation associated with use of dissimilar habitats, age of animals or season (Neff, 1968), likely did not affect our results. Indeed, these counts offer a reliable method to index and compare populations of cervids (Loft & Kie, 1988; Harkonen & Hikkila, 1999; Gibbs et al., 2004).
transect consisted of 100 points. Per cent cover of the overstory canopy in tree-dominated habitats was estimated Diet quality and composition
with a spherical densiometer (Lemmon, 1957). At each step- Nitrogen content of faeces (multiplied by 6.25 to convert to point, per cent cover was calculated from any portion of a crude protein) was used as an index to dietary quality (Leslie tree hit by a standard intersection of the spherical densi- & Starkey, 1985). Faecal groups were oven dried at 50 "C for ometer. Per cent cover is used in doubling-sampling proto- 24 h, ground with an all-purpose mill, and sifted through a cols for estimating biomass of vegetation, and provides a screen with a 0.425 mm mesh before standard Kjeldahl's
Journal of Zoology 269 (2006) 39-49 @ 2006 The Zoological Society of London 41
Density-dependent forage selection by mule deer M. C. Nicholson, R. T. Bowyer and J. G. Kie
analysis (Horwitz, 1975). Analyses of nitrogen in faeces were performed under contract by Washington State University. Nitrogen in faeces is positively correlated with dietary nitrogen for cervids feeding on diets high in browse (Leslie & Starkey, 1985, 1987; Mubanga et al., 1985). Faecal nitrogen also has been useful for indexing seasonal differ- ences in diet quality for deer (Beier, 1987), and provides a reliable index to forage quality (Leslie et al., 1989; Hodg- man, Davitt & Nelson, 1996). Further, Hodgman & Bowyer (1986) demonstrated that faecal nitrogen may provide an index to range quality. Use of nitrogen in faeces as a measure of diet quality may give questionable results when diets are composed mainly of species high in protein-com- plexing phenolics (Hobbs, 1987; Robbins et al., 1987); however, effects of those secondary compounds may be negated by deer feeding on a diverse, natural diet (Leslie & Starkey, 1985) and by mule deer possessing tannin-binding proteins in their saliva (Hagerman & Robbins, 1993). More- over, because we used faecal nitrogen as an index to diet quality for comparisons between subpopulations on similar ranges, effects of secondary compounds on our results should be similar for both subpopulations.
Diets of deer were determined to the species level from microhistological examination of plant fragments recovered from faeces, based on relative particle density of identifiable fragments (Sparks & Malechek, 1968). Anthony & Smith (1974) reported that 15 faecal groups were sufficient to describe within-season diets of deer. Thus, whenever possi- ble, 15 fresh groups of deer faeces were composited monthly for analysis of food habits. Problems with microhistological analysis of plant epidermis have arisen in comparing forages with differential digestibilities (McInnis, Vavra & Krueger, 1983). We assumed, however, that this technique provided a valid index to diets of deer in the two areas because such biases would not be expected to vary between areas. More- over, the microhistological approach may be superior to other methods, such as sampling rumens, for detecting dietary variation in forage classes over the time intervals we examined (Lewis, 1994). Microhistological analysis was done under contract by Washington State University.
Statistical analyses
Differences in deer densities were confirmed with analysis of variance (ANOVA, PROC ANOVA; SAS Institute, 1988) by testing for differences in the number of faecal groups collected in permanent plots during each season. Total number of plant species occurring in the study areas and in the diets of deer was large; hence, we used a reduced set of 23 plant species that represented the most common species in the environment or in diets of deer. Any plant species that composed 2 10% of a habitat or 2 5% of a seasonal diet were included in analyses. Likewise, we reduced forage to classes (shrubs, trees, graminoids, forbs and other) for some analyses. We used a multivariate ANOVA (MANOVA) to test for differences in the vegetation composition of habitats between areas. MANOVA also was used to test whether similar habitats in the two study areas differed in forage
classes or species composition. We used the arcsine-square root transformation on data to meet distributional assump- tions of that procedure and to insure additivity of treatment effects.
Although faeces were collected and composited monthly, data were pooled by season to improve the power of statistical tests. We evaluated differences in diets between Rattlesnake and Staircase Canyons using several techni- ques. The multi-response permutation procedure (MRPP) of BLOSSOM (Mielke, 1991; Slauson, Cade & Richards, 1991) was used to test for differences in diet quality as indexed by faecal crude protein. We used MRPP to test the null hypothesis that no differences occurred in the crude protein content of faeces between study areas within sea- sons. We employed principal component analysis (PCA) and MANOVA to detect differences in diet composition (forage classes) between the two study areas. Further, we used MANOVA to detect differences between the two canyons in principal components 1 and 2. When significant differences occurred along those axes, we inferred that diets differed between areas. Differences in diets of deer also were inferred by calculating indices of niche overlap for each seasonal diet in each area (Ricklefs, 1973). Further, niche breadth was estimated with the Shannon-Wiener formula for diversity (HI - Ricklefs, 1973), rescaled such that HI was related to the number of species (eH' - Ricklefs, 1973). Niche breadth and niche overlap were estimated from the common species of plants occurring in the diets of deer.
Results Population density, as indexed by the number of faecal groups collected on permanent plots in Staircase and Rat- tlesnake Canyons, differed markedly between the two study areas in winter, with Staircase Canyon having a much higher density of mule deer (Fig. 1). No difference was observed, however, between areas in counts of faecal groups in either summer or autumn. Further, densities of faecal groups were significantly different among seasons in both study areas, with the highest densities occurring in winter, when deer migrated to Staircase Canyon (F5,], = 32.03, P = 0.00001).
To determine if both study areas were equitable in availability of forage, we analysed the composition of the seven habitats and compared species composition between areas. We observed no significant differences in plant composition of those habitats between Rattlesnake and Staircase Canyons. Species and forage-class composition within habitats were similar between areas (F5,20 = 2.71 3, P = 0.14; F4.*, = 2.73 1, P = 0.07, respectively); although species and forage-class composition differed amongst ha- bitats (Rattlesnake, F1 1,60 = 3.847, P = 0.0092; Staircase, F12,59 = 19.07, P = 00001).
Habitat maps of each study area revealed that relative availability of habitats in the two areas was similar but not identical. Rattlesnake Canyon was composed of more mon- tane conifer habitat (36 vs. 20%), Ceanothus chaparral (7 vs. 3%) and manzanita chaparral (7 vs. 2%) than Staircase Canyon, whereas Staircase Canyon had more montane
Journal of Zoology 269 (2006) 34-49 @ 2006 The Zoological Society of London

M. C. Nicholson, R. T. Bowyer and J. G. Kie Density-dependent forage selection by mule deer I
0 Winter Summer Autumn
Season
Figure 1 Mean (f SEI faecal groups of deer collected seasonally on transects in Rattlesnake and Staircase Canyons, San Bernardino Co., CA, USA, during 1991. Probability values are a result of analysis of variance comparing densities of faecal group between areas within seasons.
hardwood (22 vs. 15%), sagebrush (17 vs. 5%) and grass- land (1 1 vs. 1 %) than Rattlesnake Canyon. The amount of mixed hardwood-conifer habitat was similar in the two canyons (Rattlesnake = 23%, Staircase = 24%). When we estimated the amount of each forage class available in each canyon we noted similar amounts of forage. Staircase Canyon was composed of 6% forbs, 8% graminoids, 15% shrubs and 44% trees, whereas Rattlesnake Canyon was composed of 4% forbs, 4% graminoids, 15% shrubs and 44% trees. The remainder of each area was bare ground. Thus, although the amount of habitats in the two areas differed slightly, relative availability of forage was similar with one important exception - twice as many graminoids were available in Staircase Canyon compared with Rattle- snake Canyon. Comparisons of common forage species between study areas revealed similar trends.
Significant differences in diet quality occurred between areas and among seasons; faecal crude protein was higher for Rattlesnake Canyon than for Staircase Canyon during winter, when Rattlesnake Canyon was at lower population density (Fig. 2). Further, deer faeces from Staircase Canyon had significantly higher levels of crude protein than did Rattlesnake Canyon in autumn, when the two areas did not differ in population density. There was no difference be- tween the two canyons in faecal crud'e protein during summer, however. Both study areas exhibited a significant difference in levels of faecal crude protein inter-seasonally with peaks in faecal crude protein occurring in summer (Fig. 2).
Faecal crude protein was highest in summer; crude protein content and IVDMD for most forages peaked in autumn (Fig. 3). Trees showed no annual trend in crude
O Winter Summer Autumn Season
Figure 2 Median levels of crude protein in faeces of mule deer in Rattlesnake (low density) and Staircase (high density) Canyons, San Bernardino Co., CA, USA, during 1991. Error bars indicate one-half the interquartile distance. Probability values are the result of a multi- response permutation procedure analysis testing the null hypothesis of no difference in faecal crude protein between study areas within seasons.
protein content. IVDMD of trees was highest in winter (perhaps as a result of inclusion of seeds and nuts in analyses of available annual growth). Deer consumed large amounts of shrubs, and secondary compounds in those species may have caused increases in faecal crude protein. Nonetheless, we observed no correlation between the per cent of shrubs in the diet and levels of faecal crude protein (r2 = 0.007, n = 265, P = 0.16), indicating that secondary compounds were not markedly biasing this index to forage quality.
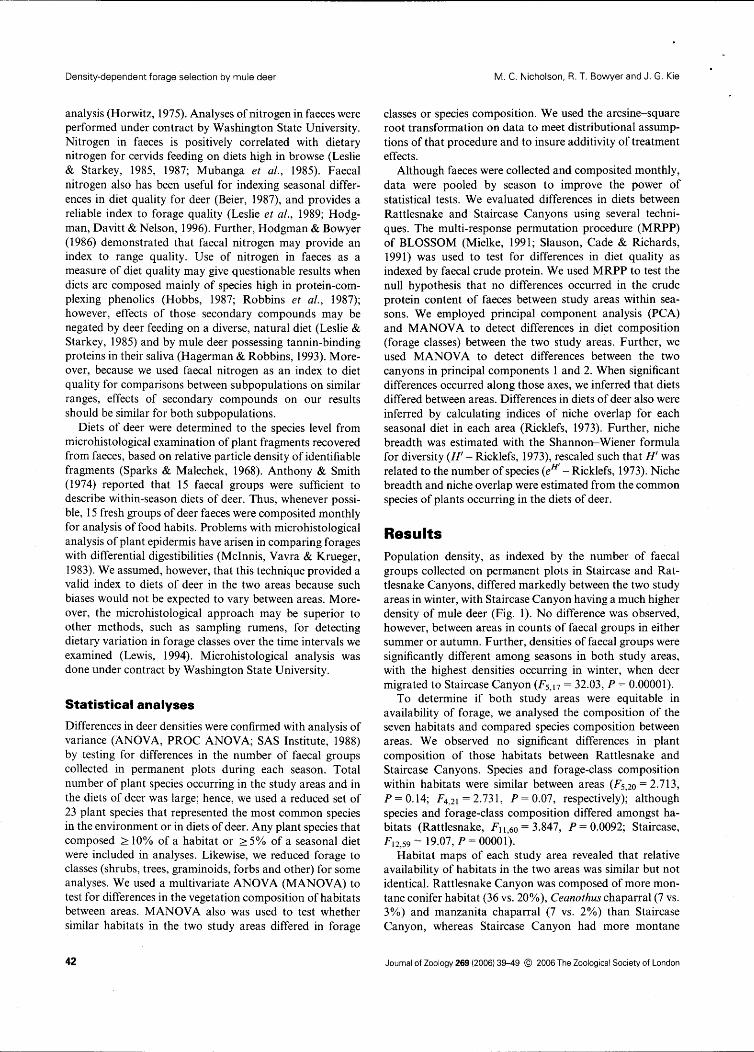
Based on PCA, clear differences in the diets of deer (measured by forage classes) on the two study areas were evident (Fig. 4); the first two principal components ex- plained 84% of the variation. Principal component 1 was significantly different between Staircase and Rattlesnake Canyons in both winter and autumn, but not in summer (F1,4 = 13.40, P 0.0352; FL,5 = 50.69, P = 0.0021; F1,6 = 1.09, P = 0.34, respectively). Eigenvectors for princi- pal component 1 were highly positive for graminoids (0.5 17) and forbs (0.496) in the diet of deer, whereas eigenvectors were negative for shrubs (-0.693) and slightly positive for trees (0.077). Principal component 1 is largely a grazing- browsing axis with positive values associated with diets rich in forbs and graminoids. This interpretation is evident when diets of mule deer in the two areas were compared (Fig. 5). Diets of deer in Rattlesnake Canyon were composed of nearly 40% forbs and grasses in winter, whereas those in Staircase Canyon were >70% shrub. This difference oc- curred even though Staircase Canyon contained nearly twice as much graminoid forage as did Rattlesnake Canyon.
The interpretation of principal component 2 was less clear, with positive loadings for trees (0.754) and graminoids (0.364), and negative ones for forbs (-0.546) and shrubs
Journal of Zoology 269 (2006) 39-49 @ 2006 The Zoological Society of London

Density-dependent forage selection by mule deer M. C. Nicholson, R. T. Bowyer and J. G. Kie
January April July October
Month
Staircase Canyon
winter
Rattlesnake Canyon
V .
- 2 0 2 4 6 Principal component 1
Staircase N - 41 canyon
V .
-2 0 2 4 6 Principal component 1
9 2- 8
O- 8 - X -2- .- 0 C .- 2 -4-
C
C
2- Staircase O Canyon
- a .a -2- 0 C .- ,? -4-
attlesnake Canyon
summer
I autumn
Rattlesnake Canyon
Month -6j . I -2 0 2 4 6
Figure 3 Crude protein (a) and in vitro dry matter digestibility (b) of Principal component 1
forage classes eaten by mule deer In San Bernardino Co., CA, USA, during 1991. Figure 4 Diets of mule deer from the low-density site in Rattlesnake
Canyon and the high-density site in Staircase Canyon, San Bernardino
(-0.036). This axis likely represent habitat types, with forb- Co., CA, USA, during 1991, for (a) winter, (b) summer and (c) autumn. Diets are plotted against the first two principal components for forage rich occurring at the negative end and classes present in deer diets. For all diets, principal component one grass-rich oak woodlands occurring on the positive end of explained 51 % of the variation in deer diets and principal component
the axis. diet such as mist'etoe and mast two explained 34%. Ninety-five per cent confidence ellipses for mean probably occur near oaks because that category was com- seasonal diets are presented for each area, posed mostly of mistletoe that grows on Quercus. Principal component 2 did not differ between the G o study aread in any season, but did differ among seasons (F5,17 = 12.83, P = 0.0017).
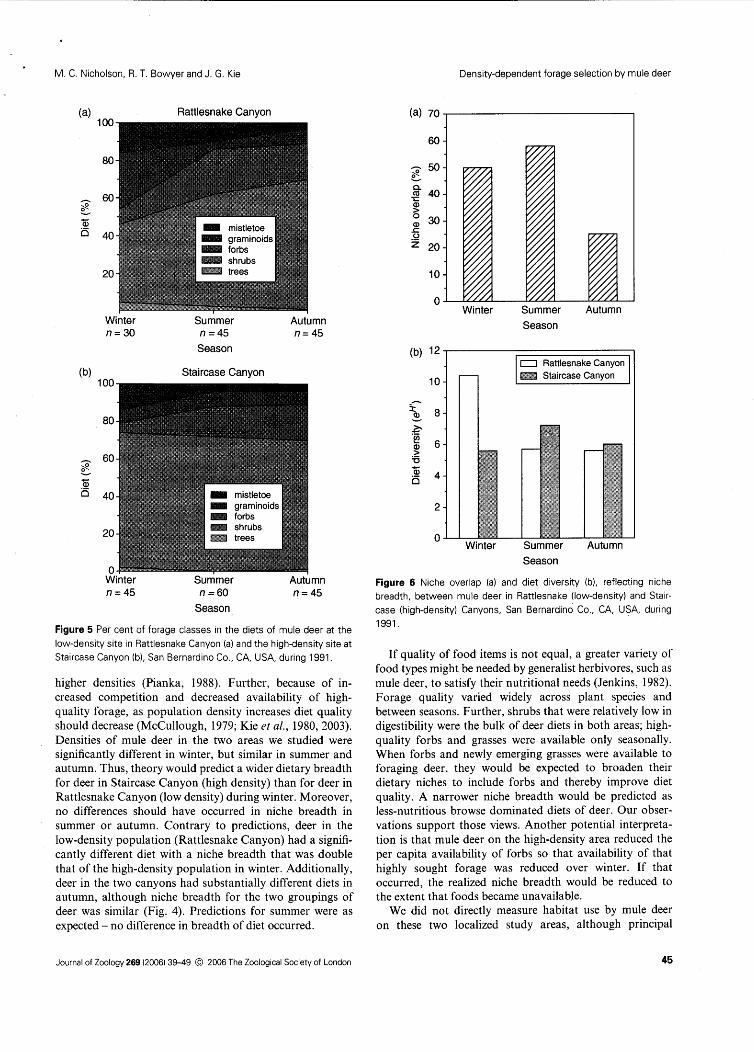
As further evidence of diet differences between Staircase and Rattlesnake Canyons, niche overlap, based on similar- ity of diets at the species level of plant composition, was extremely low (Fig. 6); diets of deer showed the greatest overlap between areas during summer. Further, niche over- lap was lowest in autumn. Diet diversity (eH') also differed between study areas (Fig. 6). In winter, diets of deer in
Rattlesnake Canyon were twice as diverse as those in Stair- case Canyon. In summer and autumn, however, deer diets were more diverse in Staircase Canyon, although those differences were not as large as during winter.
Discussion Populations that conform to niche theory in accordance with an ideal-free distribution should have broader niches at
Journal of Zoology 269 (2006) 39-49 @ 2006 The Zoological Society of London
M. C. Nicholson, R. T. Bowyer and J. G. Kie Density-dependent forage selection by mule deer
(a) Rattlesnake Canyon
Winter Summer Autumn n = 3 0 n =45 n = 4 5
Season
(b) Staircase Canyon
Winter Summer Autumn n = 4 5 n=60 n=45
Season
Figure 5 Per cent of forage classes in the diets of mule deer at the low-density site in Rattlesnake Canyon (a) and the high-density site at Staircase Canyon (b), San Bernardino Co., CA, USA, during 1991.
higher densities (Pianka, 1988). Further, because of in- creased competition and decreased availability of high- quality forage, as population density increases diet quality should decrease (McCullough, 1979; Kie et al., 1980,2003). Densities of mule deer in the two areas we studied were significantly different in winter, but similar in summer and autumn. Thus, theory would predict a wider dietary breadth for deer in Staircase Canyon (high density) than for deer in Rattlesnake Canyon (low density) during winter. Moreover, no differences should have occurred in niche breadth in summer or autumn. Contrary to predictions, deer in the low-density population (Rattlesnake Canyon) had a signifi- cantly different diet with a niche breadth that was double that of the high-density population in winter. Additionally, deer in the two canyons had substantially different diets in autumn, although niche breadth for the two groupings of deer was similar (Fig. 4). Predictions for summer were as expected - no difference in breadth of diet occurred.
0 Winter Summer Autumn
Season
0 Rattlesnake Canyon
10 @Zi Staircase Canyon "' "2
- Winter Summer Autumn
Season
Figure 6 Niche overlap (a) and diet diversity (b), reflecting niche breadth, between mule deer in Rattlesnake (low-density) and Stair- case (high-density) Canyons, San Bernardino Co., CA, USA, during 1991.
If quality of food items is not equal, a greater variety of food types might be needed by generalist herbivores, such as mule deer, to satisfy their nutritional needs (Jenkins, 1982). Forage quality varied widely across plant species and between seasons. Further, shrubs that were relatively low in digestibility were the bulk of deer diets in both areas; high- quality forbs and grasses were available only seasonally. When forbs and newly emerging grasses were available to foraging deer, they would be expected to broaden their dietary niches to include forbs and thereby improve diet quality. A narrower niche breadth would be predicted as less-nutritious browse dominated diets of deer. Our obser- vations support those views. Another potential interpreta- tion is that mule deer on the high-density area reduced the per capita availability of forbs so that availability of that highly sought forage was reduced over winter. If that occurred, the realized niche breadth would be reduced to the extent that foods became unavailable.
We did not directly measure habitat use by mule deer on these two localized study areas, although principal
Journal of Zoology 269 (2006) 39-49 @ 2006 The Zoological Society of London

Density-dependent forage selection by mule deer M. C. Nicholson, R. T. Bowyer and J. G. Kie
component 2 in our dietary analysis likely reflects such use. Based on that analysis, deer in Staircase Canyon made slightly greater use of oak grasslands (positive loadings) than in Rattlesnake Canyon, in all seasons except winter, although the overall difference between canyons in principal component 2 was not significantly different. We do not know if diet content is directly related to habitat selection in this population of deer, but other studies have observed concordant changes in deer diets with alterations in use of habitat (Leopold & Krausman, 1987; Kie & Bowyer, 1999). Different habitats had different species and forage-class composition; hence, deer had to use several habitats to maintain the diverse diets observed in this study. Conse- quently, diet breadth is an important axis of total niche breadth.
Sexual segregation is common among polygynous rumi- nants (Bowyer, 2004), and could affect our interpretation of data for periods outside the mating season. Indeed, sexes of mule deer on our study areas selected habitats differently during some seasons (Nicholson et al., 1997). Nonetheless, mule deer spatially segregate on a much finer scale than the size of the study sites we sampled (Bowyer, 1984; Bowyer, Kie & Van Ballenberghe, 1996). Consequently, differences in use of forage or habitats by the sexes already should be accounted for in our sampling design.
Although predictions concerning niche breadth predicted by density-dependent foraging under an ideal-free distribu- tion were not met, predictions of diet quality as indexed by faecal crude protein were realized. During winter, deer in Rattlesnake Canyon (the low-density site) had significantly higher-quality diets than deer in Staircase Canyon (the high- density site). Also, no difference occurred in quality of diets during summer, when the two canyons were similar in deer density. Contrary to predictions, differences in forage qual- ity reversed in autumn with levels of faecal crude protein in Staircase Canyon being significantly higher than those in Rattlesnake Canyon, although no difference was observed in deer density during that season. Those differences in diet quality could have occurred for the two areas because Staircase Canyon had nearly two times as much graminoid habitat available to deer as did Rattlesnake Canyon. Per- haps this difference in graminoid habitat resulted in Stair- case Canyon having higher values for faecal crude protein before population density began to override this effect during winter. This difference in forage availability prob- ably did not affect observed differences in diet composition during winter because population sizes were so different. Further, with high intraspecific competition for graminoids and forbs in Staircase Canyon during winter, the effective amount of graminoids per deer in the drainage was probably lower than in Rattlesnake Canyon. Indeed, the amount of graminoids in diets of deer in Staircase Canyon increased as deer density in the canyon decreased.
Differences in diet quality tracked differences in diet composition. Similar to levels of faecal crude protein, deer diets were significantly different between areas in autumn and winter. This outcome indicates that diet quality for this deer herd is, in part, related to diet composition. Indeed,
forage quality generally tracked the amount of forbs in diets of deer (Fig. 5).
Although the specific predictions of broadening dietary niche with increasing density of mule deer were not met, diet quality, diet composition and diet breadth all changed with changes in population density of deer. Density-dependent effects were observed for the diet of mule deer, but not in the manner predicted. Changes in habitat or diet selection with changes in population density can have profound implica- tions for models of habitat suitability (Van Horne, 1983; Hobbs & Hanley, 1990). Indeed, Kie & Bowyer (1999) also noted a narrowing of the dietary niche with increasing population density for white-tailed deer in some seasons. This outcome may be more common among large herbi- vores than previously suspected.
One expectation of an ideal-free distribution is that animals should distribute themselves within habitats (or along resource gradients) at densities that reflect the quality of those resources (Fretwell, 1972); more animals should be observed in those habitats (or consume those forages) that are most valuable to individuals. As a result, habitat- evaluation models often are created that assume animal density and resource density or value are equivalent. Never- theless, Rosenzweig (1985) warned that optimal habitats will necessarily be used according to their resource density only when populations are at low levels. Clearly, no simple relationship exists between the quality of habitats (or other resources) and the number of large mammals that use that resource. Thus, habitat models that do not account for effects of population density on habitat use are of suspect value - the same holds for studies of diet composition. Those interested in the management of large herbivores based on the concept of density-dependent forage selection or an ideal-free distribution will require information on the relationship of the population to K to fully interpret such data.
Warner (1990) noted that patterns of resource use may be affected by tradition, and that such behaviour may compli- cate measures of resource selection. Thus, strong traditional use of particular areas might affect our test of the dietary niche of mule deer. Indeed, many mammals exhibit philo- patry (Greenwood, 1980) and this behaviour likewise can affect how animals use resources. For Odocoileus, however, males are the principal dispersers and females are less vagile (Robinette, 1966; Kammermeyer & Marchinton, 1976); consequently, philopatry would only be expected to have a strong effect on resource use by female deer. Mule deer in southern California tend to be in mixed-sex groups during winter (Bowyer, 1984), and some of our faecal samples undoubtedly were from male deer that were not likely to be philopatric. Moreover, some adult females exhibited a facultative pattern with respect to whether they migrated (Nicholson et al., 1997); this result argues against a strong bias from traditional use of a particular area and its associated resources.
Use of habitats and the forages they contain by mule deer is highly variable and depends upon local habitat quality as well as the condition of the animals themselves. Kufeld,
46 Journal of Zoology 269 (2006) 39-49 @ 2006 The Zoological Society of London

M. C. Nicholson, R. T. Bowyer and J. G. Kie Density-dependent forage selection by mule deer
Wallmo & Feddema (1973) reported that Rocky Mountain mule deer 0. hemionus consumed at least 788 species of plants, including 202 species of trees and shrubs, 484 species of forbs and 84 species of grasses, rushes and sedges. Deer apparently have the ability to select plant parts and species from certain soil types that are high in nutritional content. Therefore, deer may choose forage not only by what species are present, but also by the quality of those species at a particular site. Spaeth et al. (2002) made a similar observa- tion for forage selection by moose. Understanding why particular species are consumed requires a tremendous
products. This is contribution number AED-02-092 of the Atlantic Ecology Division, National Health and Environ- mental Effects Laboratory, Office of Research and Devel- opment, US Environmental Protection Agency. All aspects or our research on mule deer conducted as part of this and a previous study (Nicholson er al., 1997) were approved by an independent Animal Care and Use Committee at the Uni- versity of Alaska Fairbanks.
References amount of information about the characteristics of the forage and needs of the individual animal. Our research Aldous, S.E. (1944). A deer browse method. J* Mam-
documents that such assessments cannot be made without mal. 25y 30-1 36.
also considering population density relative to carving Anthony, R.G. & Smith, N.S. (1974)- Comparison of rumen
capacity ( K ) . we focused primarily on changes in the dietary and fecal analysis to describe deer diets. J. Wildl. Mgmt. 38,
niche with regard to predictions from foraging under an 535-540.
ideal-free distribution. but habitat use ostensiblv was re- Bailey, J.A. (1967). Sampling deer browse for crude rote in. flected in the second principal component axis of our analysis (Fig. 4). Despite not accounting for potential differences in use of space within study sites, our empirical study indicates that more thought needs to be given to theoretical outcomes related to foraging under the assump- tion of an ideal-free distribution, where a reduction in forage availability with increasing population density occurs - a likely outcome for many populations of large herbivores (Kie et al., 2003). In our study, that outcome produced a narrowing of breadth with increasing density on one niche axis. A better understanding of the relationship of niche to population density is essential if our understanding of niche dynamics in relation to an ideal-free distribution is to progress.
Acknowledgements - This work was funded by grants from the California Department of Fish and Game, the National Rifle Associa- tion and the San Bernadino County Fish and Game Com- mission. Additional support was provided by the US Forest Service, and the Institute of Arctic Biology at the University of Alaska Fairbanks, the US Environmental Protection Agency (EPA), and the Department of Biological Sciences at Idaho State University. Although the research described in this article has been funded in part by the US EPA, it does not necessarily reflect the views of the Agency. Diet and forage analyses were performed at the Habitat Laboratory of Washington State University by B. Davitt. We thank F. Dean, E. Follmann, J. Fox and C. Nelleman for provid- ing advice on all aspects of this project and for critically reviewing this manuscript. We also thank S. F. Chapin, J. Fox and S. MacLean for suggestions during the develop- ment of this project. We are indebted to R. Anthes, P. August, V. Bleich, J. Maier, J. Davis, J. DeWald, S. Loe, M. Neel, J. Rechel, S. Sferra, A. Spina and T. Paulek for assistance in the field or during analyses. Mention of trade names or commercial products does not constitute endorse- ment or recommendation for use to the exclusion of similar
J. Wildl. Mgmt. 31,437-442. Barten, N.L., Bowyer, R.T. &Jenkins, K.J. (2001). Habitat
use by female caribou: tradeoffs associated with parturi- tion. J. Wildl. Mgmt. 65, 77-92.
Beckmann, J.P. & Berger, J. (2003). Using black bears to test ideal-free distribution models experimentally. J. Mammal. 84,594-606.
Beier, P. (1987). Sex differences in quality of white-tailed deer diets. J. Mammal. 68, 323-329.
Bekoff, M. (1977). Canis latrans. Mamm. Species 79, 1-9. Bowyer, R.T. (1984). Sexual segregation in southern mule
deer. J. Mammal. 65,410-41 7. Bowyer, R.T. (2004). Sexual segregation in ruminants: defini-
tions, hypotheses, and implications for conservation and management. J. Mammal. 85, 1039-1052.
Bowyer, R.T. & Bleich, V.C. (1984). Effects of cattle grazing on selected habitats of southern mule deer. CaliJ Fish Game 70,240-247.
Bowyer, R.T., Kie, J.G. & Van Ballenberghe, V. (1996). Sexual segregation in black-tailed deer: effects of scale. J. Wildl. Mgmt. 60, 1 &17.
Bro-Jorgensen, J. (2003). The significance of hotspots to lekking topi antelopes (Damaliscus lunntus). Behav. Ecol. Sociobiol. 53, 324-33 1.
Clutton-Brock, T.H., Iason, G.R. & Guiness, G.E. (1987). Sexual segregation and density-related changes in habitat use in male and female red deer (Cervus elaphus). J. Zool. (Lond.) 211,275-289.
Eve, J.H. & Kellogg, F.E. (1977). Management implications of abomassal parasites in southeastern white-tailed deer. J. Wildl. Mgmt. 41, 169-1 77.
Fretwell, S.D. (1972). Populations in a seasonal environment. Princeton: Princeton University Press.
Fretwell, S.D. & Lucas, H.L. Jr. (1970). On territorial behavior and other factors influencing habitat distribution in birds. I. Theoretical development. Acta Biotheor. 19, 16-36.
Fuller, T.K. (199 1). Do pellet counts index white-tailed deer number and population change? J. Wildl. Mgmt. 55, 393-396.
Journal of Zoology 269 (2006) 39-49 @ 2006 The Zoological Society of London

Density-dependent forage selection by mule deer M. C. Nicholson, R. T. Bowyer and J. G. Kie
Gibbs, M.C., Jenks, J.A., DePerno, C.S., Sowell, B.F. & Jenkins, K.J. (2004). Cervid forage utilization in noncom- merically thinned ponderosa pine forests. J. Range Mgmt. 57,435441.
Greenwood, P.J. (1980). Mating systems, philopatry and dispersal in birds and mammals. Anim. Behav. 28, 1140-1 162.
Hagerman, A.E. & Robbins, C.T. (1993). Specificity of tannin-binding salivary proteins relative to diet selection by mammals. Can. J. Zool. 71, 628433.
Harkonen, S. & Hiekkila, R. (1999). Use of pellet group counts in determining density and habitat use of moose Alces alces in Finland. Wildl. Biol. 5,233-239.
Harper, D.G.C. (1982). Competitive foraging in mallards: 'ideal free' ducks. Anim. Behav. 30, 575-584.
Hobbs, N.T. (1987). Fecal indices to dietary quality: a critique. J. Wildl. Mgmt. 51, 3 17-320.
Hobbs, N.T. & Hanley,T.A. (1990). Habitat evaluation: do use/availability data reflect carrying capacity? J. Wildl. Mgmt. 54,515-522.
Hodgman, T.P. & Bowyer, R.T. (1986). Fecal crude protein relative to browsing intensity by white-tailed deer on wintering areas in Maine. Acta Therio. 31, 347-353.
Hodgman, T.P., Davitt, B.B. & Nelson, J.R. (1996). Mon- itoring mule deer diet quality and intake with fecal indices. J. Range Mgmt. 49,215-222.
Horner, O.P., Wachter, B., East, M.L., Runyoro, V.A. & Hofer, H. (2005). The effect of prey abundance and fora- ging tactics on the population dynamics of a social, territorial carnivore, the spotted hyena. Oikos 108, 544-554.
Horwitz, W. (1975). Official methods of analysis of the Asso- ciation of Official Analytical Chemists. 12th edn. Washing- ton, DC: Association of Official Analytical Chemists.
Hungerford, C.R. (1970). Responses of Kaibab mule deer to management of summer range. J. Wildl. Mgmt. 32, 852-862.
Jenkins, S.H. (1 982). Management implications of optimal foraging theory: a critique. J. Wildl. Mgmt. 46, 255-257.
Kammermeyer, K.E. & Marchinton, R.L. (1 976). Notes on dispersal of male white-tailed deer. J. Mammal. 57, 776-778.
Keech, M.A., Bowyer, R.T., Ver Hoef, J.M., Boertje, R.D., Dale, B. W. & Stephenson, T.R. (2000). Life-history consequences of maternal condition in Alaskan moose. J. Wildl. Mgmt. 64,450-462.
Kennedy, M. & Gray, R.D. (1992). Can ecological theory predict the distribution of foraging animals? A critical analysis of experiments on the ideal free distribution. Oikos 68, 158-166.
Kie, J.G. & Bowyer, R.T. (1999). Sexual segregation in white- tailed deer: density-dependent changes in use of space, habitat selection, and dietary niche. J. Mammal. 80, 1004-1 020.
Kie, J.G., Bowyer, R.T. & Stewart, K.M. (2003). Ungulates in western forests: habitat requirements, population
dynamics, and ecosystem processes. In Mammal coinmu- nity dynamics: management and conservation in the conifer- ous forests of ~.tjestern North America: 296-340. Zabel, C.J. & Anthony, R.G. (Eds). Cambridge: Cambridge Univer- sity Press.
Kie, J.G., Drawe, D.L. & Scott, G. (1 980). Changes in diet and nutrition with increased herd size in Texas white-tailed deer. J. Range Mgmt. 33,28-34.
Kie, J.G. & White, M. (1985). Population dynamics of white- tailed deer (Odocoileus virginianus) on the Welder Wildlife Refuge, Texas. Southwest Nat. 30, 105-1 18.
Kie, J.K., White, M. & Drawe, D.L. (1983). Condition parameters of white-tailed deer in Texas. J. Wildl. Mgmt. 47,583-594.
Kohlmann, S.G. & Risenhoover, K.L. (1994). Spatial and behavioral response of white-tailed deer to forage deple- tion. Can. J. 2001.72, 506-513.
Kruuk, H. (1972). The spotted hyena: a study ofpredation and social behavior. Chicago: University of Chicago Press.
Kshatriya, M. & Cosner, C. (2002). A continuum formulation of the ideal free distribution and its implication for popu- lation dynamics. Theor. Popul. Biol. 61, 277-284.
Kufeld, R.C., Wallmo, O.C. & Feddema, C. (1 973). Foods of the Rocky Mountain mule deer. Forest Service Paper RM- 1 1 1, United States Department of Agriculture, 1-3 1.
Lemmon, P.E. (1957). A new instrument for estimating forest over-story density. For. Sci. 2, 314-320.
Leopold, B.D. & Krausman, P.R. (1987). Diets of two desert mule deer herds in Big Bend National Park, Texas. South- west. Nat. 32,449-455.
Leslie, D.M. Jr., Jenks, J.A., Chilelli, M. & Lavigne, G.R. (1989). Nitrogen and diaminopimelic acid in deer and moose feces. J. Wildl. Mgmt. 53, 2 16-2 18.
Leslie, D.M. Jr. & Starkey, E.E. (1 985). Fecal indices to dietary quality of cervids in old-growth forests. J. Wildl. Mgmt. 49, 142-146.
Leslie, D.M. Jr. & Starkey, E.E. (1987). Fecal indices to dietary quality: a reply. J. Wildl. Mgmt. 51, 321-325.
Lewis, S.W. (1994). Fecal and rumen analysis in relation to temporal variation in black-tailed deer diets. J. Wildl. Mgmt. 58, 53-58.
Loft, E.R. & Kie, J.G. (1988). Comparison of pellet-group and radio triangulation methods for assessing deer habitat use. J. Wildl. Mgmt. 52, 524-527.
MacArthur, R.H. &Wilson, E.O. (1967). The theory of island biogeography. Princeton: Princeton University Press.
Mayr, E. (1926). Die Ausbreitung des Girlitz (Serinus canaria serinus L.). J. Ornithol. 74, 571-671.
McCullough, D.R. (1 979). The George Reserve deer herd: population ecology of a K-selected species. Ann Arbor: University of Michigan Press.
McInnis, M.L., Vavra, M. & Krueger, W.C. (1983). A comparison of four methods used to determine the diets of large herbivores. J. Range Mgmt. 36, 302-306.
Mech, L.D. (1 970). The wolJ the ecology and behavior of an endangered species. Garden City: Natural History Press.
Journal of Zoology 269 (2006) 3949 @ 2006 The Zoological Society of London

M. C. Nicholson, R. T. Bowyer and J. G. Kie Density-dependent forage selection by mule deer
Mielke, P.W. (1 99 1). The application of multivariate permu- tation methods based on distance functions in the earth sciences. Earth-Sci. Rev. 31, 55-71.
Morris, D. W. (1 989). Density-dependent habitat selection: testing the theory with fitness data. Evol. Ecol. 2, 232-252.
Mubanga, G., Holechek, J.L., Valdez, R. & Schemnitz, S.D. (1985). Relationships between diet and fecal nutritive quality in mule deer. Southwest Nat. 30, 573-578.
Munz, P.A. (1974). AJlora of southern California. Berkeley: University of California Press.
Mysterud, A., Langvatn, R., Yoccoz, N.G & Stenseth, N.C. (2001). Plant phenology, migration and geographical var- iation in body weight of a large herbivore: the effect of a variable topography. J. Anim. Ecol. 70,915-923.
Neff, D.J. (1968). The pellet-group count technique for big game trend, census and distribution: a review. J. Wildl. Mgmt. 33, 191-195.
Nellis, C.H. & Ross, R.L. (1969). Changes in mule deer food habits associated with herd reduction. J. Wildl. Mgmt. 33, 191-195.
Nicholson, M.C., Bowyer, R.T. & Kie, J.G. (1997). Habitat selection and survival of mule deer: tradeoffs associated with migration. J. Mammal. 78,483-504.
Nilsen, E.B., Linnell, J.D.C. & Andersen, R. (2004). Indivi- dual access to preferred habitat affects fitness components in female roe deer Capreolus capreolus. J. Anim. Ecol. 73, 44-50.
Ostfeld, R.S., Lidicker, W.Z. Jr. & Heske, E.J. (1985). The relationship between habitat heterogeneity, space use, and demography in a population of California voles. Oikos 45, 433442.
Pianka, E.R. (1988). Evolutionary ecology. 4th edn. New York: Harper and Row Publishers.
Pierce, B.M., Bleich, V.C. & Bowyer, R.T. (2000). Social organization of mountain lions: does a land-tenure system regulate population size? Ecology 81, 1533-1 543.
Pierce, B.M., Bleich, V.C., Wehausen, J.D. & Bowyer, R.T. (1999). Migratory patterns of mountain lions: implications for social regulation and conservation. J. Mammal. 80, 986-992.
Ricklefs, R.E. (1973). Ecology. Newton: Chiron Press. Riney, T. (1957). The use of faeces counts in studies of several
free-ranging mammals in New Zealand. New Zeal. J. Sci. Tech. 38,507-532.
Robbins, C.T., Hanley, T.A., Hagerman, A.E., Hjeljord, O., Baker, D.L., Schwartz, C.C. & Mautz, W.W. (1987). Role of tannins in defending plants against ruminants: reduction in protein availability. Ecology 68,98-107.
Robinette, W.L. (1966). Mule deer home range and dispersal in Utah. J. Wildl. Mgmt. 30,335-349.
Rosenzweig, M.L. (1 985). Some theoretical aspects of habitat selection. In Habitat selection in birds: 5 17-540. Cody, M.L. (Ed.). New York: Academic Press Inc.
Rosenzweig, M.L. (1991). Habitat selection and population interactions: the search for mechanism. Am. Nat. 137 (Suppl), S5-S28.
SAS Institute Inc. (1988). SASISTAT user's guide, release 6.03 ed. Cary, NC: SAS Institute, Inc.
Slauson, W.L., Cade, B.S. & Richards, J.D. (1 991). Users manual for BLOSSOM statistical software. Fort Collins: US Fish and Wildlife Service, National Ecology Research Center.
Spaeth, D.F., Bowyer, R.T., Stephenson, T.R. & Barboza, P.S. (2004). Sexual segregation in moose Alces alces: an experimental manipulation of foraging behaviour. Wildl. Biol. 10, 59-72.
Spaeth, D.F., Bowyer, R.T., Stephenson, T.R., Barboza, P.S. & Van Ballenberghe, V. (2002). Nutritional quality of willows for moose: effects of twig age and diameter. AIces 38, 143-1 54.
Sparks, D.R. & Malechek, J.C. (1968). Estimating percentage dry weight in diets using a microscope technique. J. Range Mgmt. 21,264-265.
Stewart, K.M., Bowyer, R.T., Dick, B.L., Johnson, B.K. & Kie, J.G. (2005). Density-dependent effects on physical condition and reproduction in North American elk: an experimental test. Oecologia 143, 85-93.
Stubbs, M. (1977). Density dependence in the life cycles of animals and its importance in K-and r-selected strategies. J. Anim. Ecol. 46,677-688.
Sutherland, W.J. (1983). Aggregation and the 'ideal free' distribution. J. Anim. Ecol. 52, 821-828.
Tilly, J.M.A. &Terry, R.A. (1963). A two-stage technique for the in vitro digestion of forage crops. J. Br. Grassland Soc. 18, 104-1 11.
Van Horne, B. (1983). Density as a misleading indicator of habitat quality. J. Wildl. Mgmt. 47, 893-90 1.
Warner, R.R. (1990). Resource assessment versus tradition in mating-site determination. Am. Nat. 135,205-2 17.
Journal of Zoology 269 (2006) 39-49 O 2006 The Zoological Society of London