foraging ecology of the cook’s petrel pterodroma cookii ... · rayner et al.: foraging ecology of...
TRANSCRIPT

MARINE ECOLOGY PROGRESS SERIESMar Ecol Prog Ser
Vol. 370: 271–284, 2008doi: 10.3354/meps07660
Published October 28
INTRODUCTION
Early land-based studies on ecological competitionand overlap in seabird communities considered thatasynchrony in breeding timetables played a role instaggering peak demand for shared prey resources.Yet, in the absence of some means of tracking birds atsea, those studies were unable to assess the impor-tance of spatial and behavioural segregation at sea(Brooke 2004). Since then, the development of light-weight satellite and geolocation tracking technologies
has provided opportunities for examining niche over-lap in seabirds (Weimerskirch et al. 1993, 1997, Phillipset al. 2006).
In particular, studies during the breeding season,when adults are amenable for short-term deploymentand retrieval of tracking devices, have provided valu-able insights into inter- and intraspecific behaviouralflexibility and specialisation (Phillips et al. 2005, Pha-lan et al. 2007). Analyses to date suggest significantspatial segregation of conspecifics when colonies are10s to 100s of km apart (Ainley et al. 2003, 2004). How-
© Inter-Research 2008 · www.int-res.com*Email: [email protected]
Foraging ecology of the Cook’s petrel Pterodromacookii during the austral breeding season:
a comparison of its two populations
M. J. Rayner1,*, M. E. Hauber1, M. N. Clout1, D. S. Seldon1, S. Van Dijken1, S. Bury2, R. A. Phillips3
1School of Biological Sciences, University of Auckland, Private Bag 92019, Auckland 1142, New Zealand2National Institute of Water and Atmospheric Research, PO Box 14-901, Kilbernie, Wellington 6011, New Zealand
3British Antarctic Survey, Natural Environment Research Council, High Cross, Madingley Road, Cambridge CB3 0ET, UK
ABSTRACT: This study examined divergence in the foraging distribution, at-sea behaviour and pro-visioning strategies of a small procellarid, the Cook’s petrel Pterodroma cookii, during chick-rearingat 2 islands off New Zealand, separated latitudinally by ~1000 km. There was little overlap in forag-ing distribution between adults from Little Barrier Island (LBI), which ranged to the west into theNorthern Tasman Sea and east into the Pacific Ocean, and conspecifics from Codfish Island (CDF),which foraged west of the South Island in the south Tasman Sea in association with the subtropicalconvergence zone. Although birds from CDF ranged further than those from LBI, there was no differ-ence in mean foraging trip duration. Cook’s petrels from CDF foraged over deeper, cooler water, withhigher primary productivity, than conspecifics from LBI. At-sea behaviour also differed: adults fromLBI spent less time in flight, and showed less variation in total flight time per day. Overall, Cook’spetrels spend much more time in flight than albatrosses, and approximately the same amounts of timeon the water during the night as during the day, suggesting a high portion of nocturnal foraging. Divedepths did not differ between colonies but were greater than expected for a gadfly petrel. Stableisotope signatures of blood indicated population-specific diets, and suggested that birds from LBIprimarily consume cephalopods and fish, whereas those from CDF eat more crustaceans. Chicks atCDF received more food. These results suggest a broad divergence in foraging strategies betweengeographically well-separated colonies in response to regional differences in oceanography.
KEY WORDS: Foraging distribution · Geolocation loggers · Stable isotopes · Subtropical convergence ·Gadfly petrel
Resale or republication not permitted without written consent of the publisher
Mar Ecol Prog Ser 370: 271–284, 2008
ever, there have been relatively few studies of highlypelagic species from more widely separated popula-tions, where there is nonetheless the potential for someoverlap and interaction at sea. Such comparisons areparticularly interesting given the potential for geneticisolation between populations, as most seabirds dis-play a high degree of natal philopatry (Warham 1996).In addition, the high degree of behavioural flexibilityof adults may also lead to divergence in foragingstrategies, particularly between distant colonies in dis-similar oceanographic domains.
Until recently, owing to the relatively large size ofthe available technology, detailed studies on the move-ments of pelagic seabirds had been restricted tomedium to large species to which attachment of equip-ment was feasible without impacting the animal’sbehaviour (Weimerskirch et al. 1993, 1997, Stahl &Sagar 2000a,b). Information on the distribution andbehaviour of smaller species (<300 g) at sea was there-fore restricted to band recoveries (Patterson & Hunter2000) and shipboard observations (Bartle et al. 1990).However, advances in lightweight global location sen-sors (geolocation loggers), which record the approxi-mate geographic location of animals at sea using infor-mation on light intensity, now present a uniqueopportunity to study variation in the at-sea behaviourof these smaller seabirds in unprecedented detail,without any apparent deleterious effects (Rayner2007).
Cook’s petrel Pterodroma cookii (200 g) is one of agroup of 10 small, highly pelagic petrel taxa oftenplaced in the subgenus cookilaria (Onley & Scofield2007). Cook’s petrels qualify as ‘endangered’ underthe International Union for Conservation of Nature’s(IUCN) criteria, and are restricted to the Pacific Ocean,where they breed in the north of the New Zealandarchipelago on Little Barrier Island (LBI) and GreatBarrier Island (Imber et al. 2003, Rayner et al. 2007a)and, 1000 km to the south, on Codfish Island (CDF)(Rayner et al. 2008). Between these distant colonies,the species was once widespread on the New Zealandmainland (Imber et al. 2003). There are no publishedtracking studies for any of the 39 gadfly petrel species(Pterodroma spp.) (Brooke 2004).
The nonbreeding range of Cook’s petrels has beeninferred from at-sea observations to involve a transe-quatorial migration to key wintering areas in the eastPacific Ocean, particularly offshore of western Mexicoand California, and in the temperate and subarcticwaters of the central north Pacific (Bartle et al. 1990).In turn, during breeding, Cook’s petrels are assumedto be restricted to waters around New Zealand, butnothing is known about potential foraging ranges.There are morphological differences between thenorthern and southern populations, and a strong de-
gree of breeding asynchrony; the LBI populationbreeds ca. 1 mo earlier than the CDF population, sug-gesting a considerable degree of behavioural and per-haps genetic isolation (Imber et al. 2003).
The aim of the present study was to combine data onmovements, activity patterns and dive depth withinformation on foraging from stable isotope signaturesand provisioning rates and meal sizes delivered tochicks to characterise and evaluate differences in theforaging ecology of Cook’s petrel breeding at 2 distantcolonies, LBI and CDF, during the austral summer. Akey prediction of this investigation was that environ-mental differences in resource availability, resultingfrom the broad latitudinal separation of these islands,would be reflected in the divergence of the distribu-tion, diet and behaviour of adult Cook’s petrel at sea.
MATERIALS AND METHODS
Study sites. This study was carried out on Cook’spetrel in the austral summer of 2006–2007 on LBI(36° 11’ S, 175° 04’ E) and CDF (46° 11’ S, 167° 38’ E),New Zealand. Work was conducted for 2 wk duringthe first month of chick-rearing at each study location.Given the 1 mo asynchrony in the breeding timetablebetween the 2 populations (Imber et al. 2003), the pre-sent study was conducted at LBI between mid-Januaryand early February and at CDF between mid- and lateFebruary to include comparable stages of the breedingcycle between birds breeding at either of the 2 studysites.
At each colony, 10 active breeding burrows wereselected from burrows with previously installedremovable lids which permitted easy access to nestchambers (Rayner et al. 2007b). An additional 10 activebreeding burrows were used as controls for the effectof tracker attachment on foraging and breeding behav-iour. Adult attendance at these burrows was monitoredusing stick gates at the burrow entrance (a small wallof upright twigs that would be knocked down when abird enters). At the 10 burrows with birds tracked,chick tarsus length was also measured to the nearestmm using dial callipers at the start of the study, andchick mass monitored daily by the weighing of chicksbetween 11:00 and 13:00 h. Chicks were virtuallyalways fed between 22:00 and 02:00 h. Chicks thatgained mass over a 24 h period were assumed to havebeen fed, and the mass of the meal(s) was estimated asthe sum of the daily mass increment, and 50% of themean 24 h weight loss of all unfed chicks, as chickswould usually have been fed 12 h earlier (Hamer et al.1997, Rayner 2007). Foraging trip duration to the near-est day was recorded for all banded birds and all studyburrows (at both colonies) were visited by no more
272

Rayner et al.: Foraging ecology of Cook’s petrel
than 1 adult night–1 as ascertained by trapdoors (seenext paragraph).
Logger deployment, data processing and remotesensing data. Combined global location sensor andimmersion loggers (GLS-I; Afanasyev 2004) weighing2.4 g were deployed on 1 adult Cook’s petrel (for asingle foraging trip) from 10 burrows at each study site.Dummy loggers weighing 4.5 g had been trialled pre-viously on Cook’s petrels and were shown not to alterforaging trip durations (Rayner 2007). All breedingadults from study burrows had been banded and sexedin the previous breeding season through DNA analysisof blood samples taken from the tarsal vein using stan-dard PCR methods (Fridolfsson & Ellegren 1999) and,as a result, loggers were deployed on an even sex ratio(5 males and 5 females) from each population (1 birdtracked per pair breeding in each burrow). Adultswere captured at night after returning to feed chicksusing trapdoors. These were manufactured from120 mm drain pipe and Perspex plastic, and allowedentry only. Burrows were checked regularly, and themaximum time that a bird would have been trappedwas 1 to 2 h. Loggers were attached by a cable tie to aDarvic PVC plastic leg band fitted to the tarsus (totalattachment weight 3 g or ~1.5% of body weight), andretrieved after single foraging trips using the sameburrow gate system.
The loggers measured light level every minute andlogged its maximum intensity every 10 min. Light datawere processed using Multitrace software (JensenSoftware Systems) and locations (2 d–1) were estimated(Phillips et al. 2004). Sunrise and sunset times wereidentified based on light curve thresholds, with longi-tude calculated from the time of local midday relativeto Greenwich Mean Time, and latitude calculated fromday length. Locations with interruptions around sunsetand sunrise were screened from the data set. Based onconcurrent deployment of GLS loggers and satellitetransmitters in black-browed albatrosses Thalassarchemelanophrys, locations were considered to have amean accuracy ± SD of around 186 ± 114 km (Phillipset al. 2004).
The foraging distribution of each Cook’s petrel popu-lation was established by generating kernel densitymaps in a Lambert Equal-Area Azimuthal (South Pole)projection with the Spatial Analyst extension of Arc-view 9.0 (ESRI), using a search radius of 200 km andcell size of 50 km (Phillips et al. 2005, 2007). Kerneldensity maps were overlaid on bathymetry (obtainedfrom www.ngdc.noaa.gov/mgg/gdas/gd_designagrid.html) and monthly composites of remotely sensed sea-surface characteristics. These were sea-surface temper-ature (SST) in °C and chlorophyll a (chl a) concentrationin mg chl m–3 (which is a proxy for oceanic primary pro-duction) as Aqua MODIS-mapped products down-
loaded from http://web.science.oregonstate.edu/ocean.productivity (Behrenfeld & Falkowski 1997). Monthlycomposites from January and February were used forthe LBI and CDF studies respectively, with all mapoverlays having a 9 km resolution. For further analyses,the average value for the 3 environmental variables(bathymetry, SST and chl a) was extracted for all 50 kmkernel cells for each Cook’s petrel population usingArcview’s ArcGrid extension and FOCALMEAN func-tion. The maximum range achieved by each bird wascalculated in ArcMap by measuring the great circle dis-tance between the colony and the furthest location(Phillips et al. 2007).
Foraging behaviour. The loggers also tested for salt-water immersion every 3 s and logged a value every10 min ranging from 0 (completely dry) to 200 (com-pletely wet) (Phalan et al. 2007, Phillips et al. 2007).These data were matched against the time of civil twi-light (when the sun is 6° below the horizon) and used tocalculate the percentage of time spent on the waterduring daylight and darkness (Phillips et al. 2007).Cook’s petrels often return to breeding colonies duringdaylight and spend extended periods on the waterbefore coming ashore in darkness (M. J. Rayner pers.obs.). Visual examination of immersion data from log-gers confirmed this conclusion, with all birds showingextended periods of immersion prior to darkness on theday of return. The final day of activity data for eachtracked bird was therefore excluded from analysis togain an unbiased reflection of foraging activity pat-terns of birds at sea.
To quantify dive depths attained by Cook’s petrel,capillary-tube dive depth gauges were attached to themate of Cook’s petrels tracked with GLS loggers usingthe same capture and recapture protocols. Gaugeswere attached to the underside of the 3 central rectri-ces using thin strips of cloth duct tape (Sellotape) withthe open end facing towards the end of the retrices,and consisted of a 10 cm length of 1 mm internal dia-meter (2 mm external diameter, total weight 1 g or0.5% of body weight) clear capillary tubing, coatedinternally with a thin layer of icing sugar and heatsealed at one end (Burger & Wilson 1988, Prince &Jones 1992). Maximum dive depth was calculated asper Burger & Wilson (1988) using the formula d =10.08(Ls/Ld – 1), where d is the maximum dive depth inm, 10.08 m the seawater depth required for a 1 atmchange in pressure, Ls the length of the air column inthe capillary tube prior to deployment and Ld thelength of the air column, in the same length unit as Ls,after deployment.
Stable isotope ratios. Stable isotope ratios of bloodreflect those of the prey consumed by an animal over aperiod of days to weeks (Hobson 1993). Measures ofδ13C (the 13C:15C ratio) and δ15N (the 15N:14N ratio) are
273

Mar Ecol Prog Ser 370: 271–284, 2008
particularly useful in studies of marine organisms, asδ13C provides spatial information (on latitudinal distri-bution at sea and reliance on benthic vs. pelagic, andinshore vs. offshore diet), whereas δ15N increases in astepwise manner by ~3 to 5‰ with each trophic leveland, given information on prey baseline levels, canprovide information on the type of prey consumed(Hobson et al. 1994, Bearhop et al. 2002). To provide aninterpopulation comparison of isotope ratios, bloodsamples (0.05 ml) were collected from the tarsal veinsof adult Cook’s petrels returning from foraging tripswith geolocators and dive depth gauges attached.Samples were stored in 70% ethanol, with the ethanolremoved prior to analysis by heating the samples in anincubator for 12 h at 50°C. All stable isotope analyseswere carried out on a DeltaPlus (Thermo-Finnigan) con-tinuous flow isotope ratio mass spectrometer. Solidblood samples were prepared in tin boats and com-busted in an NA 1500N (Fisons Instruments) elementalanalyser combustion furnace at 1020°C in a flow of O2
and He carrier gas. Oxides of nitrogen were convertedto N2 gas in a reduction furnace at 640°C. N2 and CO2
gases were separated on a Porapak Q gas chromato-graph column before being introduced to the massspectrometer detector via an open split Conflo II inter-face (Thermo-Finnigan). CO2 and N2 reference gasstandards were introduced to the mass spectrometerwith every sample analysis. ISODAT (Thermo-Finni-gan) software was used to calculate δ15N valuesagainst atmospheric air, and δ13C values against theCO2 reference gas relative to the international Pee DeeBelemnite (PDB) standard, correcting for 17O. Mea-surement precision was estimated to be 0.1 to 0.5‰ forδ15N and 0.3 to 0.4‰ for δ13C.
Analyses. Differences in initial chick tarsus lengthsand patterns of parental burrow attendance (mean vis-its night–1 over the entire study period) between controland tracked burrows were tested using Student’s t-testsat each location. Comparisons of foraging characteris-tics (trip duration, chick meal mass, percentage time onwater during daylight and darkness, maximum rangeand dive depth), and stable isotope ratios, were madeusing Student’s t-tests with arcsine and log transforma-tions where appropriate to normalise data between is-lands. We also quantified sex-specific data on all as-pects of adult behaviours.
Mean foraging trip duration was also comparedbetween adults at LBI in 2005–2006 (Rayner 2007) and2006–2007 (the present study), and at CDF in 2006–2007 (the present study). A bimodal foraging strategy(interspersed short and long trips) is a recognised for-aging strategy in procellariiform seabirds (Weimers-kirch et al. 1994, Cherel et al. 2002b), and so weapplied a Shapiro-Wilk test to assess whether the dis-tribution of foraging trip durations from either site
departed from a unimodal normal distribution. Mealmass was compared between populations, using themean value for each chick during the entire 14 d studyto avoid pseudo-replication. Logistic regression wasused to compare environmental predictors of at-sealocations, calculated within kernel cells, between the60% kernels for birds from each breeding site. The60% kernel distributions were used to account for lowaccuracy of positions acquired by GLS loggers (Phillipset al. 2007) which have a mean error of 186 ± 114 km(Phillips et al. 2004). Natural-log or square-root trans-formations were used to normalise the data and 3-wayinteractions included in the model as a result of corre-lations between the 3 predictors. The strength of spa-tial cross-correlation between the kernel density sur-face and each environmental predictor was calculatedusing the CORRELATION function in the ArcGridextension to Arcview. Unless otherwise stated, allanalyses were conducted using JMP 5.1 (SAS Institute)with a threshold of significance set at α = 0.05, andwere 2-tailed tests. Data are shown as mean ± SD.
RESULTS
There was no difference in the average initial tarsuslength of chicks from LBI (28.32 ± 3.07 mm) and CDF(26.73 ± 2.59 mm) (t-test: t18 = 1.25, p = 0.88), confirm-ing chicks were of similar ages and comparable devel-opmental stages at the 2 colonies at the start of therespective study periods.
Device effects
Eight of the 10 breeding adults fitted with loggers atLBI were recaptured by the end of the 2 wk studyperiod and the loggers retrieved. Of these, 1 loggerfailed to download. Loggers from the missing 2 birdswere retrieved in the subsequent 2007–2008 breedingseason; these birds appeared in good breeding condi-tion and were found incubating eggs. All 10 breedingadults fitted with loggers at CDF were recaptured andthe loggers retrieved. Over the 14 d study period therewas no significant difference in the feeding frequencyat tracked (n = 10) and control (n = 10) burrows on LBI(0.28 ± 0.08 and 0.32 ± 0.08 visits night–1, respectively;t-test: t18 = –1.44, p = 0.18) and CDF (0.38 ± 0.12 and0.38 ± 0.03 visits night–1, respectively; t-test: t18 = –0.79,p = 0.44). There was also no significant difference inforaging trip duration between birds fitted with log-gers (1.5% of body weight) compared with birds fittedwith depth gauges only (0.5% of body weight) at LBI(5.0 ± 2.7 and 6.3 ± 2.7 d, respectively; t-test: t14 =–0.99, p = 0.19) or CDF (4.6 ± 1.4 and 5.5 ± 1.5 d,
274
Rayner et al.: Foraging ecology of Cook’s petrel
respectively; t-test: t16 = 1.34, p = 0.20). Fledging datawere not collected for the CDF population because oflimited access to the island for seabird research, whileall chicks from study and control burrows on LBIfledged successfully after completion of the study, asdetermined by subsequent burrow inspections.
Foraging duration, distribution and environment
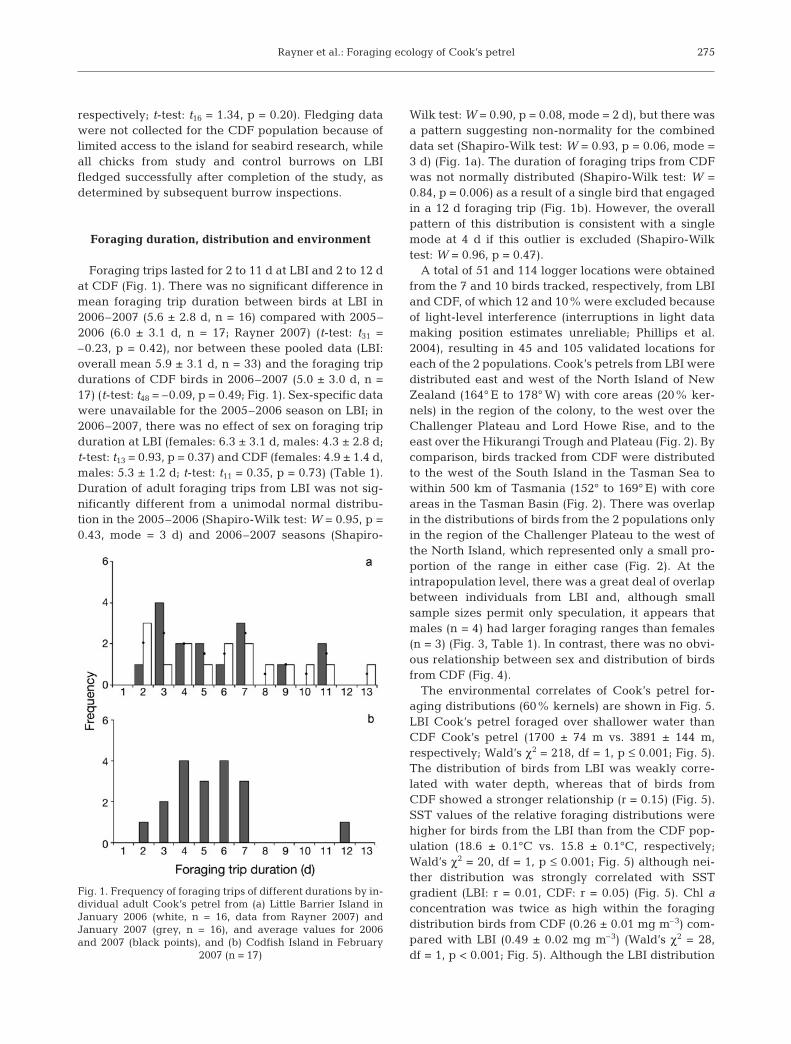
Foraging trips lasted for 2 to 11 d at LBI and 2 to 12 dat CDF (Fig. 1). There was no significant difference inmean foraging trip duration between birds at LBI in2006–2007 (5.6 ± 2.8 d, n = 16) compared with 2005–2006 (6.0 ± 3.1 d, n = 17; Rayner 2007) (t-test: t31 =–0.23, p = 0.42), nor between these pooled data (LBI:overall mean 5.9 ± 3.1 d, n = 33) and the foraging tripdurations of CDF birds in 2006–2007 (5.0 ± 3.0 d, n =17) (t-test: t48 = –0.09, p = 0.49; Fig. 1). Sex-specific datawere unavailable for the 2005–2006 season on LBI; in2006–2007, there was no effect of sex on foraging tripduration at LBI (females: 6.3 ± 3.1 d, males: 4.3 ± 2.8 d;t-test: t13 = 0.93, p = 0.37) and CDF (females: 4.9 ± 1.4 d,males: 5.3 ± 1.2 d; t-test: t11 = 0.35, p = 0.73) (Table 1).Duration of adult foraging trips from LBI was not sig-nificantly different from a unimodal normal distribu-tion in the 2005–2006 (Shapiro-Wilk test: W = 0.95, p =0.43, mode = 3 d) and 2006–2007 seasons (Shapiro-
Wilk test: W = 0.90, p = 0.08, mode = 2 d), but there wasa pattern suggesting non-normality for the combineddata set (Shapiro-Wilk test: W = 0.93, p = 0.06, mode =3 d) (Fig. 1a). The duration of foraging trips from CDFwas not normally distributed (Shapiro-Wilk test: W =0.84, p = 0.006) as a result of a single bird that engagedin a 12 d foraging trip (Fig. 1b). However, the overallpattern of this distribution is consistent with a singlemode at 4 d if this outlier is excluded (Shapiro-Wilktest: W = 0.96, p = 0.47).
A total of 51 and 114 logger locations were obtainedfrom the 7 and 10 birds tracked, respectively, from LBIand CDF, of which 12 and 10% were excluded becauseof light-level interference (interruptions in light datamaking position estimates unreliable; Phillips et al.2004), resulting in 45 and 105 validated locations foreach of the 2 populations. Cook’s petrels from LBI weredistributed east and west of the North Island of NewZealand (164° E to 178° W) with core areas (20% ker-nels) in the region of the colony, to the west over theChallenger Plateau and Lord Howe Rise, and to theeast over the Hikurangi Trough and Plateau (Fig. 2). Bycomparison, birds tracked from CDF were distributedto the west of the South Island in the Tasman Sea towithin 500 km of Tasmania (152° to 169° E) with coreareas in the Tasman Basin (Fig. 2). There was overlapin the distributions of birds from the 2 populations onlyin the region of the Challenger Plateau to the west ofthe North Island, which represented only a small pro-portion of the range in either case (Fig. 2). At theintrapopulation level, there was a great deal of overlapbetween individuals from LBI and, although smallsample sizes permit only speculation, it appears thatmales (n = 4) had larger foraging ranges than females(n = 3) (Fig. 3, Table 1). In contrast, there was no obvi-ous relationship between sex and distribution of birdsfrom CDF (Fig. 4).
The environmental correlates of Cook’s petrel for-aging distributions (60% kernels) are shown in Fig. 5.LBI Cook’s petrel foraged over shallower water thanCDF Cook’s petrel (1700 ± 74 m vs. 3891 ± 144 m,respectively; Wald’s χ2 = 218, df = 1, p ≤ 0.001; Fig. 5).The distribution of birds from LBI was weakly corre-lated with water depth, whereas that of birds fromCDF showed a stronger relationship (r = 0.15) (Fig. 5).SST values of the relative foraging distributions werehigher for birds from the LBI than from the CDF pop-ulation (18.6 ± 0.1°C vs. 15.8 ± 0.1°C, respectively;Wald’s χ2 = 20, df = 1, p ≤ 0.001; Fig. 5) although nei-ther distribution was strongly correlated with SSTgradient (LBI: r = 0.01, CDF: r = 0.05) (Fig. 5). Chl aconcentration was twice as high within the foragingdistribution birds from CDF (0.26 ± 0.01 mg m–3) com-pared with LBI (0.49 ± 0.02 mg m–3) (Wald’s χ2 = 28,df = 1, p < 0.001; Fig. 5). Although the LBI distribution
275
Fig. 1. Frequency of foraging trips of different durations by in-dividual adult Cook’s petrel from (a) Little Barrier Island inJanuary 2006 (white, n = 16, data from Rayner 2007) andJanuary 2007 (grey, n = 16), and average values for 2006and 2007 (black points), and (b) Codfish Island in February
2007 (n = 17)

Mar Ecol Prog Ser 370: 271–284, 2008
was only weakly correlated with productivity (r =0.03), the CDF distribution was correlated with a bandof high productivity running east–west at ~45° S (r =0.39) (Fig. 5).
At-sea behaviour
There was no consistent difference between Cook’spetrels from LBI and CDF in the percentage of timespent on the water during daylight (23.7 ± 10.7 and18.4 ± 8.7%, respectively; t-test: t15 = 1.15, p = 0.27) ordarkness (31.0 ± 14.4 and 20.0 ± 11.3%, respectively;t-test: t15 = 1.75, p = 0.10) or on the activity coefficient of
276
Sex Duration Max. range % Time on water Coefficient of variation Dive depth(d) (km) Darkness Daylight Total Darkness Daylight Total (m)
LBIFemale 6.3 ± 3.1 221 ± 31 44.2 ± 11.9 13.1 ± 14.9 31.4 ± 6.3 1.0 ± 0.2 1.8 ± 0.7 1.3 ± 0.6 3.4 ± 1.0
(3–11)8 (195–255)3 (30.7–53.2)3 (8.3–38.2)3 (24.1–35.5)3 (0.9–1.8)3 (1.2–2.6)3 (0.9–2.5)3 (2.4–4.5)3
Male 4.3 ± 2.8 691 ± 245 21.0 ± 4.0 24.2 ± 8.8 23.0 ± 4.7 1.6 ± 0.2 1.6 ± 0.3 1.6 ± 0.2 12.3 ± 12.0(3–11)8 (343–889)4 (17.4–26.5)4 (15.6–36.6)4 (19.7–29.8)4 (1.4–1.8)4 (1.2–1.9)4 (1.2–1.9)4 (2.3–27.5)4
Total 5.6 ± 2.9 489 ± 306 40.0 ± 14.4 23.7 ± 10.7 26.6 ±6.7 1.4 ± 0.5 1.7 ± 0.4 1.5 ± 0.4 8.5 ± 9.7(3–11)16 (195–889)7 (17.4–53.2)7 (8.3–38.2)7 (19.7–35.5)7 (0.9–1.8)7 (1.2–2.6)7 (0.9–2.5)7 (2.3–27.5)7
CDFFemale 4.9 ± 1.4 768 ± 402 13.1 ± 10.1 12.8 ± 5.4 13.4 ± 5.3 2.4 ± 0.1 2.4 ±0.6 2.4 ± 0.8 7.0 ± 3.5
(3–7)10 (577–1136)5 (3.0–29.9)5 (5.0–20.2)5 (6.9–21.1)5 (1.4–3.9)5 (1.8–3.3)5 (1.4–3.9)5 (3.5–12.5)5
Male 5.3 ± 1.2 904 ± 276 26.8 ± 8.0 23.9 ± 8.1 25.1 ± 6.6 1.6 ± 0.3 1.7 ± 0.3 1.6 ± 0.3 13.0 ± 12.0(4–7)7 (401–1305)5 (18.7–39.7)5 (10.6–33.3)5 (13.8–31.0)5 (1.4–2.0)5 (1.4–1.8)5 (1.4–2.0)5 (4.6–21.4)2
Total 5.0 ± 3.0 836 ± 333 20.0 ± 11.3 18.4 ± 8.7 19.2 ± 8.4 2.0 ± 0.6 2.0 ± 1.0 2.0 ± 0.8 8.7 ± 6.4(3–7)17 (401–1305)10 (3.0–39.7)10 (5.0–33.3)10 (6.9–31.0)10 (1.4–3.9)10 (1.4–3.3)10 (1.4–3.9)10 (3.5–21.4)7
Table 1. Sex-specific activity data for Cook’s petrel from Little Barrier Island (LBI) and Codfish Island (CDF). Values are mean ± SD (range) with sample sizes included in italicised subscript
Fig. 2. Kernel density distribution of breeding Cook’s petrel from Little Barrier Island (n = 7, January 2007, enclosed by solid blackline) and Codfish Island (n = 10, February 2007, enclosed by dashed black line). Bathymetric contours are 500, 1000, 2000 and4000 m (light grey to black). Numbers mark approximate locations of (1) Tasman Basin, (2) Challenger Plateau, (3) Lord HoweRise, (4) Hikurangi Trough and (5) Hikurangi Plateau (derived from www.nabis.govt.nz). Heavy dot-dashed line: approximate
summer location of Subtropical Convergence, based on Stanton & Ridgeway (1988) and Orsi et al. (1995)

Rayner et al.: Foraging ecology of Cook’s petrel 277
Fig. 3. Boundaries of 60% kernel density distributions forindividual breeding Cook’s petrel from Little Barrier Islandoverlaid on bathymetric contours. f Female (a,c,e) and m(b,d,f,g) male birds; superscripted numbers: foraging
duration (days). Scale bar = 200 km

Mar Ecol Prog Ser 370: 271–284, 2008278
Fig. 4. Boundaries of 60% kernel density distributions for individual breeding Cook’s petrel from Codfish Island overlaid on bathymetric contours. f Female (a,c,e,g,i) and m male (b,d,f,h,i) birds; superscripted numbers: foraging duration (days).
Scale bar = 200 km

Rayner et al.: Foraging ecology of Cook’s petrel 279
variation (CV) during daylight (1.7 ± 0.4 and 2.0 ± 1.0,respectively; t-test: t15 = 1.50, p = 0.16) or darkness (1.4± 0.5 and 2.0 ± 0.6, respectively; t-test: t15 = 1.30, p =0.23) (Table 1). However, within each 24 h period, (datacombined), birds from LBI spent a higher percentageof their time on the water (t-test: t15 = 2.01, p = 0.03;Fig. 6a) and displayed less immersion variation (t-test:t15 = –2.75, p < 0.01; Fig. 6b). They also had smallermaximum foraging ranges than those from CDF (t-test:t15 = –2.22, p = 0.02), but travelled similar distances perday whilst at sea (t-test: t15 = –0.84, p = 0.10) (Table 1).There was considerable variation in maximum divedepth, which ranged from 2 to 27 m and from 3 to 21 mfor birds from LBI and CDF, respectively, but there wasno significant difference in the mean for each colony(8.5 ± 3.9 m, n = 7, and 8.7 ± 2.4 m, n = 7, respectively;
t-test: t12 = –0.68, p = 0.26; Table 1). Nor was there anyobvious sex-related differences in any behaviouralparameter at either colony (Table 1), although smallsample sizes prevented statistical testing.
Stable isotopes
A total of 12 blood samples were collected fromCook’s petrels returning to LBI with loggers (n = 7) ordepth gauges (n = 5), and 11 blood samples fromCook’s petrel returning to CDF with loggers (n = 10) ordepth gauges (n = 1). There was a significant differ-ence in mean blood δ15N between adults at LBI (12.8 ±0.5) compared with CDF (11.7 ± 0.5) (t-test: t21 = –5.14,p < 0.001), but not in mean blood δ13C values (means of
Fig. 5. Environmental characteristics of foraging distributions of Cook’s petrels from Little Barrier Island (LBI, n = 7) and CodfishIsland (CDF, n = 10). Graphs show differences in the average (±SD) values for water depth, sea surface temperature (SST) andchl a concentration, extracted from the 60% kernels of each population distribution. ***p ≤ 0.001 for difference from the logisticregression model. Coloured panels show degree of correlation between the 60% kernel density distribution for each population
and underlying environmental parameters

Mar Ecol Prog Ser 370: 271–284, 2008
18.4 ± 0.4 and 18.6 ± 0.4 for LBI and CDF, respectively;t-test, t21 = –0.45, p = 0.66) (Fig. 7). There was no signif-icant difference between the isotope ratios of birdswith loggers (δ15N = 12.6 ± 0.3, δ13C = –18.9 ± 0.3)rather than depth gauges (δ15N = 13.0 ± 0.4, δ13C =–18.6 ± 0.7) at LBI (t-test, t11 = –1.48, p = 0.18 for δ15N,and t11 = 1.38, p = 0.20 for δ13C), indicating that devicetype had no discernable effect upon prey selection.There was no effect of sex on stable isotope values atLBI (δ15N in females = 12.7 ± 0.3, in males = 12.8 ± 0.4,t-test, t10 = 0.54, p = 0.60; δ13C in females = –18.52 ± 0.5,in males = –18.30 ± 0.4, t-test, t10 = 1.08, p = 0.30) orCDF (δ15N in females = 11.5 ± 0.6, in males = 11.8 ± 0.5,t-test, t9 = 0.55, p = 0.60; δ13C in females = –18.7 ± 0.5,in males = –18.3 ± 0.2, t-test, t9 = 1.48, p = 0.17).
Chick provisioning
The mean meal mass fed to chicks at CDF (37.9 ±6.7 g) was higher on average than at LBI (36.8 ± 4.0 g),although the difference was non-significant (t-test:t19 = –1.24, p = 0.81) (Fig. 8a). However, mean daily
food delivery (g night–1) over the length of each studyperiod was significantly greater for chicks at CDF(13.2 ± 1.0 g night–1) than at LBI (10.0 ± 1.2 g night–1)(t-test: t18 = –2.45, p = 0.01) (Fig. 8b), presumably re-flecting the greater mean meal mass and shorter forag-ing trip durations at this colony.
280
Fig. 6. Daily foraging activity of Cook’s petrel tracked fromLittle Barrier Island (LBI) and Codfish Island (CDF) showing(a) percentage of time spent on the water (±SD) and (b)variation in immersion activity (±SD). White and grey barcomponents represent daytime and nighttime contributions
to activity variable, respectively. *p < 0.05, **p < 0.01
Fig. 7. Stable isotope signatures in the blood of Cook’s petrelduring early chick-rearing at Little Barrier Island (s = male,h = female, n = 12) and Codfish Island (d = male, j = female,
n = 11)
Fig. 8. Provisioning rate of Cook’s petrels. (a) Mean meal mass(±SD) and (b) daily food delivery (±SD) over the 14 d studyperiod at Little Barrier Island (LBI) and Codfish Island (CDF).
n.s. = not significant. *p < 0.05

Rayner et al.: Foraging ecology of Cook’s petrel
DISCUSSION
This study presents the first detailed analysis of theforaging behaviour and ecology of a small petrel(<300 g) using geolocation technology with key find-ings relating to the spatial, behavioural and dietarysegregation of the 2 major and geographically distantCook’s petrel populations. Despite the low precision ofthe geolocators used (mean accuracy ± SD, 186 ±114 km; Phillips et al. 2004), the spatial segregation offoraging ranges of Cook’s petrel during chick provi-sioning was sufficient to be captured using thesedevices. Previous investigation demonstrated no dis-cernible impacts of heavier geolocators than thoseused in the present study on the foraging duration andprovisioning rate of Cook’s petrel (Rayner 2007). Inaddition, comparison of foraging trip durations and iso-tope values between birds fitted with loggers com-pared with depth gauges showed no apparent effects.There is therefore no reason to suspect that the forag-ing behaviour observed during the present study wasunrepresentative. A weakness of the present study,however, was its temporal scope. The study wasdesigned to focus on the same breeding stage of theadult birds by comparing data on pairs with similardevelopmental stages of chicks. Yet, the foragingstrategies of petrels often change with breeding stage(Warham 1990, Weimerskirch et al. 1993, 1997) and socaution must be advised in assuming that birds fromthe 2 populations show as distinctive distributions orbehaviour at other times of the season or in other years.
Foraging distribution and duration
Colony-specific foraging areas have been widelydocumented in studies of seabirds (Ainley et al. 2003,2004, Peck & Congdon 2005), and ecological theorypredicts that density-dependent competition drivesthis spatial segregation because of the fitness advan-tages of feeding closer to the nest site (Ashmole 1963,Diamond 1978). In the present study the foraging dis-tributions of tracked Cook’s petrel were highly segre-gated, overlapping only at the periphery of theirrespective distributions at ~38° S (Fig. 2). Cook’spetrels from LBI foraged east and west of the NorthIsland over the continental shelf, shelf break andpelagic waters, in a distribution that was not closelyassociated with particular environmental parameters(depth, SST and chl a). By comparison, Cook’s petrelfrom CDF foraged west of the South Island in the Tas-man Sea, primarily away from the continental shelf.The 2 populations could be clearly separated by habi-tat: birds from CDF on average foraged over deeper(3789 m, cf. LBI: 1887), cooler water (15.8°C, cf. LBI:
18.5°C) with higher chl a concentration (0.48 mg m–3,cf. LBI: 0.26 mg m–3) than those from LBI (Fig. 5). Closeassociation between the core range of Cook’s petrelfrom CDF and high chl a concentrations in the TasmanSea subtropical convergence, where enhanced verticalmixing of warm and cool water masses promotesincreased surface nutrient levels and high level of pri-mary productivity (Orsi et al. 1995), is particular note-worthy.
Density-dependent competition related to colonysize is usually considered to be a key determinant offoraging distribution and behaviour. Positive relation-ships between colony size and area of foraginggrounds, maximum foraging range, foraging trip dura-tion and provisioning rate have been demonstrated ina range of colonial seabirds, with resource depletionand increased interference competition close to thecolonies assumed to be driving this process (Lewis etal. 2001, Ainley et al. 2003, 2004). Data for Cook’spetrel are inconsistent with this hypothesis, as maxi-mum foraging ranges of birds at LBI were significantlyshorter than those at CDF, despite a population size~50 times greater (286 000 breeding pairs at LBI vs.6000 breeding pairs at CDF; Rayner et al. 2007c, 2008).Two non-exclusive explanations could account for thisdiscrepancy. First, the Tasman Sea likely experiencesmore consistent wind velocities than the east coast ofthe North Island as a result of the predominantly westto southwest winds generated by subantarctic weathersystems (Richard et al. 2005). Higher wind speedsimprove flight efficiency and speed in procellari-iformes (Warham 1996). This would reduce travel costsfor Cook’s petrel from CDF, allowing them to activelytarget a spatially discrete, and geographically distant,foraging area at the mid-Tasman subtropical conver-gence. Similarly, other procellariiformes, includingBuller’s albatross Thalassarche bulleri, forage close tothe Tasman Sea subtropical convergence during thebreeding season, presumably also exploiting theenhanced food resources in this highly productivezone (Stahl & Sagar 2000a,b).
A range of studies demonstrated the use of 2-foldforaging strategies in procellariiformes during chick-rearing, with adults alternating between short trips, toprovision chicks, and long trips, to maintain their ownbody condition (Weimerskirch et al. 1997, Cherel et al.2002a, Peck & Congdon 2005). The evidence for abimodal foraging strategy in either Cook’s petrel pop-ulation in the present study was inconclusive, suggest-ing that during the early phase of chick-rearing, forag-ing resources may be sufficient to allow breeding birdsto provision chicks and maintain their own physiologi-cal requirements. However, the duration of the presentstudy may have been insufficient to capture the com-plete range of trip durations, particularly if the fre-
281
Mar Ecol Prog Ser 370: 271–284, 2008
quency of long trips was lower than shorter trips. As aresult, caution should be exercised in concluding alack of bimodal foraging in Cook’s petrel duringbreeding.
Foraging behaviour
In addition to divergent spatial distributions andrange characteristics, Cook’s petrel from LBI and CDFexhibited different patterns of foraging activity. Birdsfrom CDF spent more time in flight than those fromLBI, consistent with their greater foraging ranges,which we suggest might be facilitated by the morefavourable and predictable weather conditions in thesouth Tasman Sea. However, the difference could alsorelate to diet selection and whether birds predomi-nantly search for prey in flight or sit on the water andambush prey that come to the surface, which may bemuch more effective at night (Catry et al. 2004, Phalanet al. 2007). As a result of technological limitations,previous studies investigating the foraging activity ofseabirds focused on larger species with very differentcircadian activity patterns. For example, during thesame breeding stage (post-brood chick-rearing), alba-trosses spend much more time overall than Cook’spetrel (~31 to 55% vs. 20% for Cook’s petrel) and ahigher percentage of darkness on the water (~57 to90% vs. 10% for Cook’s petrel) (Phalan et al. 2007).The difference most likely reflects the relative advan-tage of the alternative foraging strategies outlinedabove (‘Foraging distribution and duration’). Alba-trosses have a reduced ability to see and capture preyfrom the air at night (Weimerskirch et al. 1994, 2005,Phalan et al. 2007), whereas our data strongly suggestthat Cook’s petrel is a highly active nocturnal forager.
Cook’s petrels lack the aquatic features of divingshearwaters (Puffinus spp.) such as compact plumageand compressed tarsi, and are thus considered to feedmainly on prey floating near the surface (Warham1990, Brooke 2004). However, although not as deep-diving as common diving petrels Pelecanoides urina-trix (mean 30 m) (Bocher et al. 2000), the maximumdive depths recorded in the birds in the present study(mean 8 m, max. 27.5 m) were deeper than those ofother small petrels, including Bulwer’s petrel Bulweriabulwerii (mean 2 to 3 m, max. 5 m) (Mougin & Mougin2000), blue petrel Halobaena caerulea (mean 4.4 m,max. 6 m) (Cherel et al. 2002b), but not as deep as theconsiderably larger wedge-tailed shearwater Puffinuspacificus (mean 14.0 m, max. 66.0 m) (Burger 2001),Audubon’s shearwater Puffinus lherminieri (average15.0 m, max. 35.0 m) (Burger 2001) and sooty shear-water Puffinus griseus (average 14.2 m, max. 68.2 m)(Shaffer et al. 2006). This suggests a greater reliance
on pursuit diving in the Cook’s petrel than previouslythought and indicates that morphological characteris-tics may not always be indicative of diving ability inprocellariiformes.
Carbon isotope values provide an indication of for-aging latitude (lower δ13C values at higher latitudes)and the degree of pelagic (off-shelf) versus inshore for-aging (higher δ13C values in species that forage ininshore environments) (Cherel et al. 2000, Thompsonet al. 2000, Quillfeldt et al. 2005). That δ13C signaturesfor Cook’s petrel from LBI and CDF are similar is pre-sumably because birds from both colonies foraged inrelatively deep subtropical waters. Significant differ-ences in the δ15N signatures, however, indicate somedegree of dietary specialisation (Fig. 7), with adultsfrom LBI apparently including a larger component ofhigher trophic-level prey than those from CDF. Imber(1996) found the diet of Cook’s petrel from LBI to becomprised, in order of importance, of cephalopoda(squid species), fish, crustaceans (krill species) andtunicates. Although the diet of Cook’s petrel at CDF isunknown, cephalopods (δ15N: 8.1 to 10.2‰) and fish(δ15N: 7.5 to 10.9‰) (Burns et al. 1998, Cherel et al.2000, Kaehler et al. 2000) occupy a higher trophic levelthan marine crustaceans (δ15N: 3.6 to 6.5‰) (Thomp-son & Furness 1995, Cherel et al. 2002b). Accordingly,the differences in δ15N suggest that Cooks’ petrel fromLBI consume more cephalopods and fish and fewercrustaceans than those from CDF.
Regional differences in oceanic productivity andthus food availability to breeding birds have led to adivergence in foraging and provisioning strategiesamong different colonies of a variety of seabirds (Stahl& Sagar 2000a,b, Ainley et al. 2004, Walker & Elliot2006). The results of the present study suggest thesame applies to Cook’s petrel. Combining informationon distribution, at-sea activity and stable isotope sig-natures suggests that during chick-rearing, Cook’spetrel from CDF took advantage of potentially morefavourable winds to target abundant, lower trophic-level prey found in association with the Tasman Seasubtropical convergence. By comparison, Cook’s petrelfrom LBI foraged more widely in the Tasman Sea andPacific Ocean and targeted a broader array of dietarycomponents including crustaceans, squid and fish.Future research should focus on whether these differ-ences in foraging distribution and behaviour persistthroughout the year, and also on an investigation of thelevels of genetic variation and degree of reproductiveisolation between these distant colonies, particularlygiven the difference in breeding phenology.
Acknowledgements. We thank the New Zealand Departmentof Conservation staff from the Auckland (S. Cameron, S.McInnis, R. Renwick and L. Whitwell) and Southern Islands
282

Rayner et al.: Foraging ecology of Cook’s petrel
(T. Lawrence, P. McClelland, D. Vercoe and D. Veint) Conser-vancies for facilitating access to conduct this research, andfor assistance and support. We are indebted to M. Le Corre,S. Bartle, B. Dunphy, M. Imber and 2 anonymous refereesfor improving the manuscript, and acknowledge essentialresearch funding by the Little Barrier Island Supporters Trust,through an ASB Bank Community Trust grant, and by theUniversity of Auckland, through the Faculty of Science Pro-fessional Development Fund and School of Biological Sci-ences performance-based research fund. M.J.R. was sup-ported by a New Zealand Tertiary Education Commission TopAchiever Doctoral Scholarship. This research was conductedwith ethics approval from the University of Auckland AnimalEthics Committee and research permission from the NewZealand Department of Conservation.
LITERATURE CITED
Afanasyev V (2004) A miniature daylight level and activitydata recorder for tracking animals over long periods. MemNatl Inst Polar Res 58(Spec Issue):227–233
Ainley DG, Ford RG, Brown ED, Suryan RM, Irons DB (2003)Prey resources, competition, and geographic structure ofkittiwake colonies in Prince William Sound. Ecology 84:709–723
Ainley DG, Ribic CA, Ballard G, Heath S and others (2004)Geographic structure of Adélie penguin populations:overlap in colony-specific foraging areas. Ecol Monogr 74:159–178
Ashmole NP (1963) The regulation of numbers of tropicaloceanic seabirds. Ibis 103b:458–473
Bartle JA, Hu D, Stahl JC, Pyle P, Simons TR, Woodby D(1990) Status and ecology of gadfly petrels in the temper-ate north Pacific. In: Vermeer K, Briggs KT, Morgan KH,Siegel-Causey D (eds) The status, ecology, and conserva-tion of marine birds of the North Pacific. CanadianWildlife Service Special Publication, Ottawa, p 101–111
Bearhop S, Waldron S, Votier SC, Furness RW (2002) Factorsthat influence assimilation rates and fractionation of nitro-gen and carbon stable isotopes in avian blood and feath-ers. Physiol Biochem Zool 75:451–458
Behrenfeld MJ, Falkowski PG (1997) Photosynthetic ratesderived from satellite-based chlorophyll concentration.Limnol Oceanogr 42:1–20
Bocher P, Cherel Y, Hobson KA (2000) Complete trophic seg-regation between South Georgian and common divingpetrels during breeding at Iles Kerguelen. Mar Ecol ProgSer 208:249–264
Brooke MDL (2004) Albatrosses and petrels across the world.Oxford University Press, Oxford
Burger AE (2001) Diving depths of shearwaters. Auk 118:755–759
Burger AE, Wilson RP (1988) Capillary-tube depth gauges fordiving animals: an assessment of their accuracy andapplicability. J Field Ornithol 59:345–354
Burns JM, Trumble SJ, Castellini MA, Testa JW (1998) Thediet of Weddell seals in McMurdo Sound, Antarctica asdetermined from scat collections and stable isotopeanalysis. Polar Biol 19:272–282
Catry P, Phillips RA, Phalan B, Silk JRD, Croxall JP (2004)Foraging strategies of grey-headed albatross Thalas-sarche chrysostoma: integration of movements, activityand feeding events. Mar Ecol Prog Ser 280:261–273
Cherel Y, Hobson KA, Weimerskirch H (2000) Using stable-isotope analysis of feathers to distinguish moulting andbreeding origins of seabirds. Oecologia 122:155–162
Cherel Y, Bocher P, De Broyer C, Hobson KA (2002a) Foodand feeding ecology of the sympatric thin-billed Pachy-ptila belcheri and Antarctic P. desolata prions at IlesKerguelan, Southern Indian Ocean. Mar Ecol Prog Ser228:263–281
Cherel Y, Bocher P, Trouvé C, Weimerskirch H (2002b) Dietand feeding ecology of blue petrels Halobaena caerulea atIles Kerguelen, Southern Indian Ocean. Mar Ecol Prog Ser228:283–299
Diamond AW (1978) Feeding strategies and population size intropical seabirds. Am Nat 112:215–224
Fridolfsson AK, Ellegren H (1999) A simple and universalmethod for molecular sexing of non-ratite birds. J AvianBiol 30:116–121
Hamer KC, Nicholson LW, Hill JK, Wooller RD, Bradley JS(1997) Nestling obesity in procellariiform seabirds: tempo-ral and stochastic variation in provisioning and growth ofshort-tailed shearwaters Puffinus tenuirostris. Oecologia112:4–11
Hobson KA (1993) Trophic relationships among high Arcticseabirds: insights from tissue-dependent stable-isotopemodels. Mar Ecol Prog Ser 95:7–18
Hobson KA, Piatt JF, Pitocchelli J (1994) Using stable isotopesto determine seabird trophic relationships. J Anim Ecol 63:786–798
Imber MJ (1996) The food of Cook’s petrel Pterodroma cookiiduring its breeding season on Little Barrier Island, NewZealand. Emu 96:189–194
Imber MJ, West JA, Cooper WJ (2003) Cook’s petrel (Ptero-droma cookii): historic distribution, breeding biology, andeffects of predators. Notornis 50:221–230
Kaehler S, Pakhomov EA, McQuaid CD (2000) Trophic struc-ture of the marine food web at the Prince Edward Islands(Southern Ocean) determined by δ13C and δ15N analysis.Mar Ecol Prog Ser 208:13–20
Lewis S, Sherratt TN, Hamer KC, Wanless S (2001) Evidenceof intra-specific competition for food in a pelagic seabird.Nature 412:816–819
Mougin JL, Mougin MC (2000) Maximum diving depths forfeeding attained by Bulwer’s petrels (Bulweris bulwerii)during the incubation period. J Zool 250:75–77
Onley D, Scofield P (2007) Albatrosses, petrels & shearwatersof the world. Princeton University Press, Princeton, NJ
Orsi AH, Whitworth T, Nowlin WD (1995) On the meridionalextent and fronts of the Antarctic Circumpolar Current.Deep-Sea Res Part I 42:641–673
Patterson DL, Hunter S (2000) Giant petrel Macronectes spp.band recovery analysis from the International Giant PetrelBanding Project, 1988/89. Mar Ornithol 28:69–74
Peck DR, Congdon BC (2005) Colony-specific foraging be-haviour and co-ordinated divergence of chick develop-ment in the wedge-tailed shearwater Puffinus pacificus.Mar Ecol Prog Ser 299:289–296
Phalan B, Phillips RA, Silk JRD, Afanasyev V and others(2007) Foraging behaviour of four albatross species bynight and day. Mar Ecol Prog Ser 340:271–286
Phillips RA, Silk JRD, Croxall JP, Afanasyev V, Briggs DR(2004) Accuracy of geolocation estimates for flying sea-birds. Mar Ecol Prog Ser 266:265–272
Phillips RA, Silk JRD, Croxall JP (2005) Foraging and provi-sioning strategies of the light-mantled sooty albatross atSouth Georgia: competition and co-existence with sym-patric pelagic predators. Mar Ecol Prog Ser 285:259–270
Phillips RA, Silk JRD, Croxall JP, Afanasyev V (2006) Year-round distribution of white-chinned petrels from SouthGeorgia: relationships with oceanography and fisheries.Biol Conserv 129:336–347
283

Mar Ecol Prog Ser 370: 271–284, 2008
Phillips RA, Catry P, Silk JRD, Bearhop S, McGill R,Afanasyev V, Strange IJ (2007) Movements, winter distri-bution and activity patterns of Falkland and brown skuas:insights from loggers and isotopes. Mar Ecol Prog Ser 345:281–291
Prince PA, Jones M (1992) Maximum dive depths attained bySouth Georgia diving petrel Pelecanoides georgicus atbird island South Georgia. Antarct Sci 4:433–434
Quillfeldt P, McGill RA, Furness RW (2005) Diet and foragingareas of Southern Ocean seabirds and their prey inferredfrom stable isotopes: review and case study of Wilson’sstorm-petrel. Mar Ecol Prog Ser 295:295–304
Rayner MJ (2007) Effects of dummy global location sensors onforaging behaviour of Cook’s petrel (Pterodroma cookii).Wilson J Ornithol 119:109–111
Rayner MJ, Hauber ME, Clout MN (2007a) Breeding habitatof the Cook’s petrel (Pterodroma cookii) on Little BarrierIsland (Hauturu): implications for the conservation of aNew Zealand endemic. Emu 107:59–68
Rayner MJ, Hauber ME, Imber MJ, Stamp RK, Clout MN(2007b) Spatial heterogeneity of mesopredator releasewithin an oceanic island system. Proc Natl Acad Sci USA104:20862–20865
Rayner MJ, Clout MN, Stamp RK, Imber MJ, Brunton DH,Hauber ME (2007c) Predictive habitat modelling improvesthe population census accuracy of a burrowing seabird: astudy of the endangered Cook’s petrel. Biol Conserv 138:235–247
Rayner MJ, Parker KA, Imber MJ (2008) Population census ofCook’s petrel Pterodroma cookii breeding on CodfishIsland (New Zealand) and the global conservation statusof the species. Bird Conserv Int 18:211–218
Richard GJ, Hadfield MG, Roberts MJ (2005) Development ofa regional ocean model for New Zealand. N Z J MarFreshw Res 39:1171–1191
Shaffer SA, Tremblay Y, Weimerskirch H, Scott D and others(2006) Migratory shearwaters integrate oceanic resourcesacross the Pacific Ocean in an endless summer. Proc NatlAcad Sci USA 103:12799–12802
Stahl JC, Sagar PM (2000a) Foraging strategies and migra-tion of southern Buller’s albatrosses Diomedea bulleribreeding on the Solnder Is, New Zealand. J R Soc N Z 30:319–334
Stahl JC, Sagar PM (2000b) Foraging strategies of southernBuller’s albatrosses Diomedea bulleri breeding on theSnares, New Zealand. J R Soc N Z 30:299–318
Stanton BR, Ridgeway NM (1988) An oceanographic surveyof the subtropical convergence zone in the Tasman Sea.N Z J Mar Freshw Res 22:583–593
Thompson DR, Furness RW (1995) Stable-isotope ratios of car-bon and nitrogen indicate seasonal dietary shifts in north-ern fulmars. Auk 112:493–498
Thompson DR, Phillips RA, Stewart FM, Waldron S (2000)Low δ13C in pelagic seabirds: lipid ingestion as a potentialsource of 13C-depleted carbon in Procellariiformes. MarEcol Prog Ser 208:265–271
Walker K, Elliot G (2006) At-sea distributions of Gibson’s andAntipodean wandering albatrosses, and relationships withlongline fisheries. Notornis 53:265–290
Warham J (1990) The petrels their ecology and breeding sys-tems. Academic Press, London
Warham J (1996) The behaviour, population biology andphysiology of the petrels. Academic Press, London
Weimerskirch H, Salamolard M, Sarrazin F, Jouventin M(1993) Foraging strategies of wandering albatrossesthroughout the breeding season, a study using satellitetelemetry. Auk 110:325–342
Weimerskirch H, Chastel O, Ackermann L, Chaurand T,Cuenot-Chaillet F, Hindermeyer X, Judas J (1994) Alter-nate long and short foraging trips in pelagic seabird par-ents. Anim Behav 47:472–476
Weimerskirch H, Cherel Y, Cuenot-Chaillet F, Ridoux V(1997) Alternative foraging strategies and resource alloca-tion by male and female wandering albatrosses. Ecology78:2051–2063
Weimerskirch H, Gault A, Cherel Y (2005) Prey distributionand patchiness: factors in foraging success and efficiencyof wandering albatross. Ecology 86:2611–2622
284
Editorial responsibility: Matthias Seaman,Oldendorf/Luhe, Germany
Submitted: May 13, 2008; Accepted: July 22, 2008Proofs received from author(s): October 20, 2008