forbearance expectations and the subordinated debt signal of
TRANSCRIPT
Forbearance Expectations and the Subordinated Debt Signal of Bank Insolvency
Gerald A. Hanweck*Visiting Scholar, [email protected]
andProfessor of Finance
School of ManagementGeorge Mason University
Fairfax, VA [email protected]
Lewis J. SpellmanProfessor of Finance
McCombs School of BusinessThe University of Texas at Austin
Austin, TX [email protected]
August 2002
Abstract
It has been proposed that bank subordinated debt yields be used as a signaling device to reflect abank’s condition. Of particular interest to those charged with the bank safety net is a reduction in therecognition lag of bank distress in order to promote self-correction by the bank or for the regulator toprevent costly forbearance of an insolvent bank. Using the Black and Cox contingent claims model forsubordinated debt valuation, we relate the signaling device, the bank’s subordinated debt yield, to theinvestors’ view of the bank’s solvency. The analytical solution to the model reveals that if investor’sforbearance expectations were to be under the maximum of 270 days allowed under Prompt CorrectiveAction standards, subordinated debt yield spreads will generally anticipate the bank’s insolvency. Ifinvestors hold longer forbearance expectations subordinated debt yield spreads fail to give an earlywarning of bank insolvency. Based on empirical estimates from bank subordinated debt observationsover the latter half of the l990s, investor’s expected forbearance exceeded 270 days so thatsubordinated debt yields did not likely provide early insolvency recognition. Our conclusion is thatlengthy forbearance expectations prevail, despite a legislative mandate to the contrary, that preventsthe subordinated debt signal from being effective and useful as a basis for insolvency detection orfederal deposit insurance pricing.
For submission to the joint FDIC and Journal of Financial Services Research Conference on “Pricingthe Risks of Deposit Insurance,” September 2002, Washington, D.C.
* Hanweck wishes to thank Art Murton and Fred Carns, Director and Associate Director of the Division of Insurance andResearch of the FDIC, and Tom Lutton for help and support on this project. However, all errors and omissions are theresponsibility of the authors and the views expressed in this paper may not reflect those of the FDIC or its staff.
2
Forbearance Expectations and the Subordinated Debt Signal of Bank Insolvency
I. Introduction
Following the worst bank and thrift insolvencies of the late l980s and early 1990s since the
great depression era, two cornerstones for the early reaction time to defend the bank insurance fund
have emerged: the use of market prices of bank securities to provide an early recognition of an
impending insolvency and a legislative mandate to quickly resolve insolvent banks known as Prompt
Corrective Action (PCA). Underlying this approach is a presumption that an early market signal of an
impending insolvency would pressure a bank to resolve its problems while still solvent (market
discipline)1 and if the problems were not corrected, the early signal would pressure the bank supervisor
to deny forbearance to avoid high deposit insurance payouts that had prevailed in the past.2
Because early recognition of tangible insolvency through accounting data has proved to be
problematic (Beaver, et. al. (1992) and White (1991)) proposals from both academic sources (Shadow
Financial Regulatory Committee (2000) and Calomiris (1999)) and government sources (Basle (1999),
Study Group on Subordinated Notes and Debentures (1999)) for the mandatory issuance of
subordinated debt have emerged.3 As a result of these recommendations, the Gramm-Leach-Bliley Act
of l999 required that the 50 largest U.S. insured banking companies issue subordinated debt so that the
secondary market prices of the subordinated debt might provide a real time signal of possible
1 See Study Group(1999) for a discussion of the cumulative pressures on the bank to discipline its risk taking. Bliss andFlannery (2000) for a discussion of the disciplinary effect of securities pricing. Numerous benefits have been cited thatwould derive from the market measure of bank solvency. First, it is thought that it would “discipline” banks from furtherrisk taking by providing a signal that additional capital, downsizing or restructuring was required. If the discipline wouldnot be self imposed, discipline would likely be imposed by other claimants and correspondents who would alter the termsof supplying credit to the banking institution and reduce the bank’s ability to charge premium lending rates based on itsprime reputation (Cook, Schellhorn and Spellman(2002)).2 Investor signals of bank solvency can derive from a number of priced claims though most studies have examined bankdeposits, whether insured or uninsured (for example, Cook and Spellman(1996)), and subordinated debt (for example,Flannery and Sorescu (1996)). Recently there has been an expansion in the investigation of other market signals to includemarket microstructure variables such as bid-asked spreads, trading volume and volatility in the pricing of bank stock(Flannery, Kwan and Nimalendran (2000)).3 Accounting measures of bank market valued capital do not exist, but accounting measures of tangible capital for bankingcompanies is readily available. Accounting is based on GAPP standards that are relatively slow to write-off bank assets andthere is no active secondary market in most banks loans so that a market reading of the banks market value of assets is notpossible on an on going basis.
3
problems. If the signal of bank insolvency is present, the intervention by the regulators contained in
the PCA provisions of the Federal Deposit Insurance Corporation Improvement Act (FDICIA) is to be
triggered if the regulator believes the bank’s tangible capital has deteriorated to 2 percent or less of
assets. Thereafter a receivership is called for within 270 days to comply with capital standards though
this time standard can and has often been extended.4
The more recent interest in subordinated debt prices extends beyond the early signaling of bank
insolvency and has progressed to a proposal for the regulator to act on the signal of elevated
subordinated debt yields and declare the bank critically undercapitalized (Shadow Financial
Regulatory Committee (2000, p. 49)) and resolve the bank (Evanoff and Wall (2002)). Because the
existing legal grounds for the regulator to fail a bank are insufficient capital, any early signal that
results in the regulator seizing the bank’s assets through a receivership must be tied to insufficient
capital.5 To not relate the receivership to insufficient capital exposes the regulator to a possible
reversal of the receivership in the courts and the imposition of serious monetary penalties on the
regulator (Schellhorn and Spellman (2000).6 Hence if subordinated debt yields are to provide a signal
that either invokes the PCA mandate for corrective action or results in a receivership of the bank’s
assets, it is important that the relationship of the subordinated debt yield to the bank’s capital
(solvency) be understood as the regulator will likely be challenged by the bank’s claimants.
4 If the bank is declared to be critically undercapitalized the Act calls for a receivership or conservatorship not later than 90days after an insured depository institution becomes critically undercapitalized. However, the Act explicitly allowsreceivership delays since the bank is given the opportunity to restore capital for a time period of up to 270 days andpossibly longer (FDICIA, subtitle D, Section (3), subsection (h)(3)(c)(I)(ii)(I and II). After the expiration of the 270 days,additional delays are based on the Federal banking agency determination that the bank has positive net worth, the bank is insubstantial compliance with an approved capital restoration plan, the bank is profitable or has an upward trend in earningsthat agency projects as sustainable and the bank is reducing the ratio of non performing loans to total loans. SeeFDIC(l997, p.454) for data on actual delays.5 FDICIA requires that “critically undercapitalized” institutions be dealt with by appointing a receiver. (FDIC, Public Law102-242, December 19, 1991, Subtitle D, Section 131, subsection (h)(3)). The method used to justify categorization of abank as “critically undercapitalized” however, is left to the appropriate Federal banking agency (see FDICIA, Public Law102-242, December 19, 1991, Subtitle D, Section 131, subsection (h)(3)(c)(i). Conceivably the banks subordinated debtyield spread to the Treasury can be invoked. However, it is likely that the receiver will be challenged to show that spreadsare an appropriate criteria for determining a bank to be critically undercapitalized.6 The article cites instances when the courts reversed a receivership decision and awarded damages to the holders of thebank securities.

4
While the yield-insolvency linkage is important to the consideration of when and whether to
fail a bank, much of the literature on subordinated debt yields relates to “default risk” (for example,
Flannery and Sourescu (1996)). In the case of regulated banks, subordinated debt defaults if (a) the
regulator believes the bank’s capital has deteriorated to below 2 percent on a tangible assets basis, (b)
the chartering authority elects to proceed to appoint the FDIC as a conservator or receiver of the bank’s
assets and debts or (c) the bank’s liquidated assets indeed are insufficient to pay off both the bank’s
senior and subordinated debt.7 Hence, the default risk that should be reflected in the market yield of
subordinated debt is the prospect for inadequate capital (both on an a priori and ex post basis) and the
timeliness of the receivership.8 Delays in the receivership or forbearance lend value to the bank’s
securities as the banks are given the opportunity to recover and avoid the receivership. Hence, the
yield premiums will reflect the bank’s solvency state and investors’ forbearance expectations.
The purpose of this paper is to relate bank subordinated debt yields and pricing to bank
solvency and show how the yield-solvency relationship is affected by investors’ expectations of
forbearance. In the context of the options pricing model that will be employed, the expiration time of
the contract encompasses the sum of the time for the regulator to recognize a bank as critically
undercapitalized, the FDICIA allowed time to develop and execute a capital plan, and the time delays
thereafter. We shall interpret the time of the expiration of the implied options contract as investor’s
“expected forbearance” encompassing all three delays that are normally found in any bank insolvency:
the recognition time, the attempted remediation time and the receivership delays thereafter. That is the
investors’ expected forbearance is a variable that the regulator does not control, but investors will have
an expectation of regulatory forbearance in terms of time delays that will affect the market value of
7 It is possible for subordinated debt to go into default prior to a receivership, although we do not find any such cases.However, if the banking company were to violate a debt covenant, the investors could declare the debt in default and triggera shortening of the regulator’s forbearance.8 The default process for bank debt differs from the default process of the debt of non-financial private companies. For thenon-financial private company, the inability of the company to provide debt service under the terms of the debt causes thetrustee for the debt class to attempt to convince the bankruptcy court to liquidate the firm’s assets and pay off the debt
5
their investment in the bank’s debt or equity. We will demonstrate how expected forbearance affects
the pricing performance of subordinated debt. Of special importance is its affect on the pricing signal
as the bank nears the PCA trigger point of 2 percent of tangible capital and below.
In order for subordinated debt pricing to provide recognition of tangible insolvency, the
implicit working assumption behind the mandatory subordinated debt proposal, is that the market yield
spreads of subordinated debt to the riskless rate is reflective of the bank’s declining solvency ratio. An
unambiguous signal is important when the bank reaches 2 percent of tangible capital in order to present
the regulator with the grounds to proceed with corrective action. 9 That is, deteriorating solvency
should be reflected in rising yield spreads. These spreads should widen meaningfully prior to actual
insolvency (zero capital ratio) in order to allow the regulator to confront the bank while it still has
positive tangible capital.
This paper analytically examines the ability of subordinated debt yield spreads to recognize
bank insolvency. We find that meaningful subordinated debt yield spreads occur when forbearance
expectations are within the 270-day maximum allowed under PCA. However, as we show, longer
forbearance expectations can cause the market yield spreads to fail to recognize the underlying
solvency state of the bank until the bank is seriously insolvent. In fact under reasonable assumptions,
the bank subordinated debt yield spreads are still generally less than a junk bond spread to the Treasury
when the bank has seriously impaired capital at market value. This is because expected forbearance
has sufficient value to makeup for the insolvency.
Given the possibility of long expected forbearance time, we then make an empirical
investigation of the investors’ implied forbearance expectations relative to the bank’s solvency. These
estimates are made monthly for selected bank holding companies for which traded subordinated debt
holders. That is for the non-financial private company, cash flow, irrespective of solvency, triggers default, whereas thedefault of debt for the regulated bank follows insolvency if the regulator decides to proceed with a receivership.9 The OCC is bound to show insufficient capital where as state banking agencies might resort to showing “impaired” capitalor unsound and unsafe practices.
6
and equity securities were outstanding during the l990s. These estimates of bank solvency and the
corresponding forbearance expectations are made by the use of the contingent claims model for which
forbearance expectations and solvency are derived from the market pricing of a bank’s subordinated
debt and equity. That is, the observed market data implicitly contain the investor’s implied values of
the bank’s forbearance expectations and corresponding solvency ratio.
We find that there were episodes for individual bank’s for which investors believed that the
bank met the PCA 2 percent tangible capital criteria for intervention, but held expectations that PCA
maximum of 270 days would not be observed. The debt was priced accordingly with market yield
spreads that did not make it to the junk debt category. In general we find that yield spread-solvency
relationships were weak because the investors were pricing long forbearance periods. Indeed we found
a perverse effect that forbearance expectations periods increased as banks lost solvency.
In Section II, we review the literature on the information content of bank subordinated debt
yield spreads and the literature on forbearance expectations. In Section III we specify the contingent
claims model for the valuation of subordinated debt. We then provide analytical yield spread-solvency
relationships. In particular we examine subordinated debt yields corresponding to the PCA 2 percent
tangible capital threshold to determine what pricing signals can be anticipated for a given level of
forbearance expectations. We go on to examine the effects of long versus short forbearance
expectations on the subordinated debt-pricing signal of bank insolvency. In Section IV we make
empirical estimates of the implied bank solvency and simultaneous forbearance expectations that are
contained in the observed market prices of the bank’s subordinated debt and equity. In general, we
find that during the l990s forbearance expectations held by market investors in bank securities
exceeded the 270-day criteria allowed in PCA and were usually in excess of 1 year and lengthened as
the bank became more insolvent. In Section V we summarize and conclude regarding the ability to
determine a bank’s solvency relative to subordinated debt yield spreads and the apparent role of
forbearance expectations to cause observed bank subordinated debt yields to fail to reflect bank
7
insolvency. Consequently, bank subordinated debt yield spreads require considerable interpretation in
order to assess the bank’s condition.
II. Subordinated Debt Yields Spreads, Solvency and Forbearance Expectations
In the empirical literature, subordinated debt yields have been studied for their information content
as they relate to accounting measures (Flannery and Sorescu (1996) and Evanoff and Wall (2002)), to
credit ratings (Berger, Davies and Flannery (2000)) and to bank examination ratings (DeYoung,
Flannery, Land and Sorescu (2002) and Evanoff and Wall (2002)). Implicit in Flannery and Sorescu is
a relationship of yields to bank capital where statistical significance in some years between 1983 and
l991 was found for variables that relate to the bank’s capital. These include variables associated with
potential capital write-offs with a leverage variable that is largely driven by the market value of the
bank’s common equity, and the bank’s size as measured by the book value of assets.10 The results are
not consistent year to year but improve after the passage of FDICIA with the PCA standards in l991. In
fact previous studies of bank subordinated debt yields covering the pre-PCA era were notable in that
they failed to find any relationship of subordinated debt yields to accounting risk measures (Avery,
Belton and Goldberg (1998) and Gorton and Santomero (1990)). The authors attribute the Too-Big-
To-Fail (TBTF) effect that shaped forbearance expectations prior to PCA in l99l that apparently
reduced risk pricing of subordinated debt and have also been attributed to elevating equity pricing as
well (O’Hara and Shaw (l990)).11 In the context of this paper, TBTF implies forbearance expectations
were lengthy. Additionally, forbearance expectations inherent in TBTF have been reported to be the
motivation for bank mergers (Kane (2000)) that have been found to influence the pricing of bank debt
(Penas and Unal (2001)).
10 The variables that were statistically significant in the cross sections for some of the years are: the ratio of non-accruingloans to total assets, the ratio of non-accruing loans past due 90 days or more to total assets, the ratio of other real estateloans to total assets, the log of the issuing bank’s total assets, and the ratio of total (book) liabilities to the market value ofcommon stock plus the book value of preferred stock.
8
While the empirical studies of bank subordinated debt yield spreads provide some statistical
support for both forbearance expectations and solvency issues, these studies only indirectly link the
subordinated debt pricing to insolvency and the forbearance of the insolvent. To analyze the issue of
the potential early warning of subordinated debt yields as they relate to deteriorating bank solvency,
we employ the contingent claims framework of security prices that connects the pricing of the banks
subordinated debt and equity to the investors’ belief in the solvency of the bank. This relationship of
debt and equity prices to solvency also depends on the investor’s belief in the bank’s asset variance
and the time until expiration of the option. The time until expiration, in this context, can be thought of
as determined by forbearance expectations.12 When viewed in an options framework, the pricing of
subordinated debt is dependent on the bank’s market value of capital-to-assets ratio (solvency), the
time until the option expires (expected forbearance) and the bank’s asset return volatility. These are
the relevant variables in the determination of subordinated debt prices.
Although regulators set actual forbearance, investors cannot escape making an estimate of this
regulatory controlled variable as it impacts the value of their subordinated debt holdings.13 Since
forbearance time has value to investors, the investors’ expected forbearance is priced. Investors might
rationalize forbearance expectations based on their observation of historical forbearance performance.
The FDIC estimates that the average time until closure of 343 banks between l984 and l992 from the
time the bank was determined to have reached the 2 percent PCA tripwire was 1.21 years. When
weighted by bank size, forbearance was 1.84 years after recognition of the PCA threshold.14 These
FDIC forbearance estimates were measured from when the FDIC first determined 2 percent solvency
11 The Comptroller of the Currency testified before Congress in September, l984 that some banks were simply too big tofail henceforth known as TBTF.12 Forbearance expectations or the values of τ exist for all banks at all times irrespective of whether the bank is animmediate candidate for resolution. It is simply the implied life of the contract from that date forward. For solvent banksthat have enjoyed extended lives, this occurs because each day in the market the investors “reinstate” the length of life ofthe options.13 Allen and Saunders (1993) characterize the process as a regulatory call on the owner’s ability to put the bank assets backto the FDIC.
9
was reached which was generally based on notoriously trailing accounting data (Beaver, Datar and
Wolfson (1992)). Recognition lags would also occur if the PCA trigger were supplied by bank
examination data. This means of recognition also trails as examination intervals have averaged at least
1 year for all banks and 2.3 years for banks with low CAMEL ratings despite the relatively high
incidence (36 percent) of failed banks that enjoyed low CAMEL ratings within one or two years of
failure.15
Hence, with substantial recognition lags of tangible capital based on accounting or examination
data, it is reasonable to believe that investors’ forbearance expectations could well be longer than the
maximum of 270 days mandated by PCA. Another reason for investor forbearance expectations to be
lengthy is that 73 percent of banks that reached the PCA insolvency threshold were given the time to
become solvent and were not subsequently resolved.16 Thus, investors have observed that forbearance
adds value to bank securities as it often enables the bank to regain solvency and retain its “going
concern” value.
Bank subordinated debt pricing also is responsive to investors’ implicit estimate of asset
volatility. This is a measure of the risk of asset value that incorporates any balance sheet or current
income impact on the market value of the bank’s assets. In effect, the asset volatility is measured as
the annualized standard deviation of the bank’s return on assets and incorporates the risk influences
found in many studies having to do with asset reserving, write-offs or variation in income.
14 The data are found in FDIC (1997, Table 12.15, p. 455). The data is given in terms of days. The authors convertedthese to years of forbearance.15 Table 12.1 FDIC (1997) p. 429 details the average examination interval by year between l979 and 1994 by CAMELrating. The longest intervals were 845 days or 5 years for CAMEL 1 banks in l986. The shortest was 245 days or .67 yearsfor the CAMEL 5 banks in 1994.16 FDIC, ibid, p. 439.
10
III. The Yield Spread-Solvency Model
A. The Contingent Claims Model for Bank Subordinated Debt and Equity
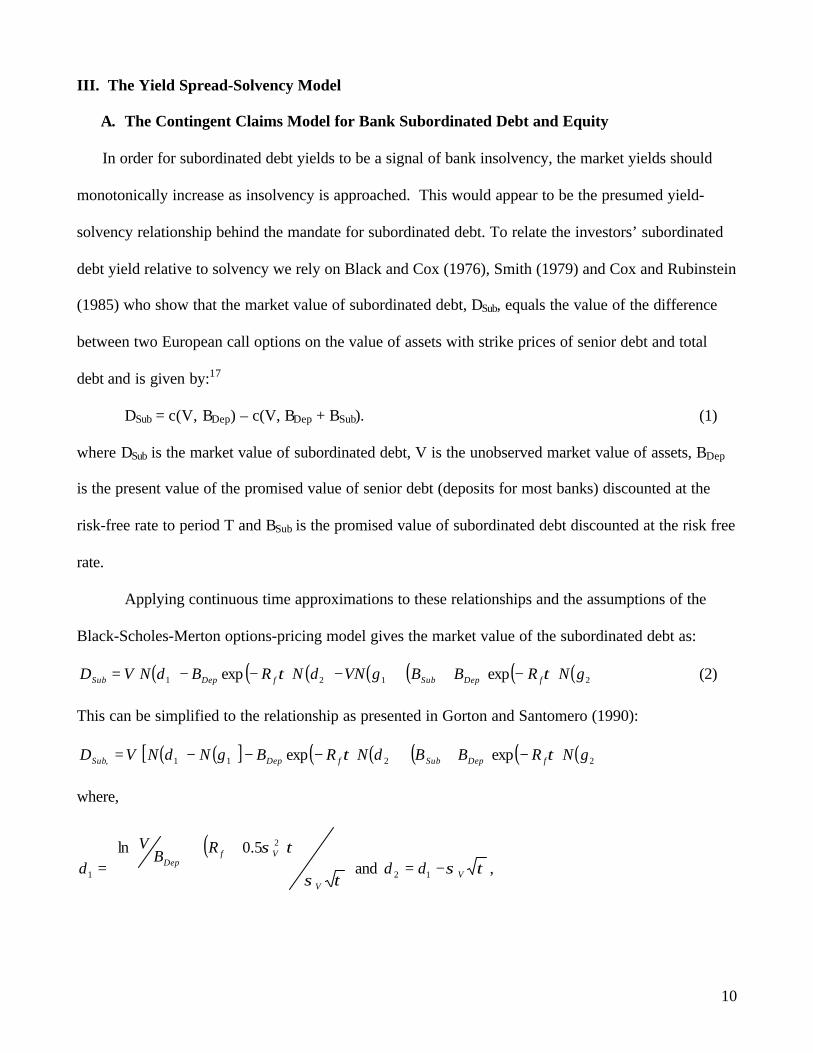
In order for subordinated debt yields to be a signal of bank insolvency, the market yields should
monotonically increase as insolvency is approached. This would appear to be the presumed yield-
solvency relationship behind the mandate for subordinated debt. To relate the investors’ subordinated
debt yield relative to solvency we rely on Black and Cox (1976), Smith (1979) and Cox and Rubinstein
(1985) who show that the market value of subordinated debt, DSub, equals the value of the difference
between two European call options on the value of assets with strike prices of senior debt and total
debt and is given by:17
DSub = c(V, BDep) – c(V, BDep + BSub). (1)
where DSub is the market value of subordinated debt, V is the unobserved market value of assets, BDep
is the present value of the promised value of senior debt (deposits for most banks) discounted at the
risk-free rate to period T and BSub is the promised value of subordinated debt discounted at the risk free
rate.
Applying continuous time approximations to these relationships and the assumptions of the
Black-Scholes-Merton options-pricing model gives the market value of the subordinated debt as:
( ) ( ) ( ) ( ) ( ) ( ) ( )2121 expexp gNRBBgVNdNRBdNVD fDepSubfDepSub ττ −++−−−= (2)
This can be simplified to the relationship as presented in Gorton and Santomero (1990):
( ) ( )[ ] ( ) ( ) ( ) ( ) ( )2211, expexp gNRBBdNRBgNdNVD fDepSubfDepSub ττ −++−−−=
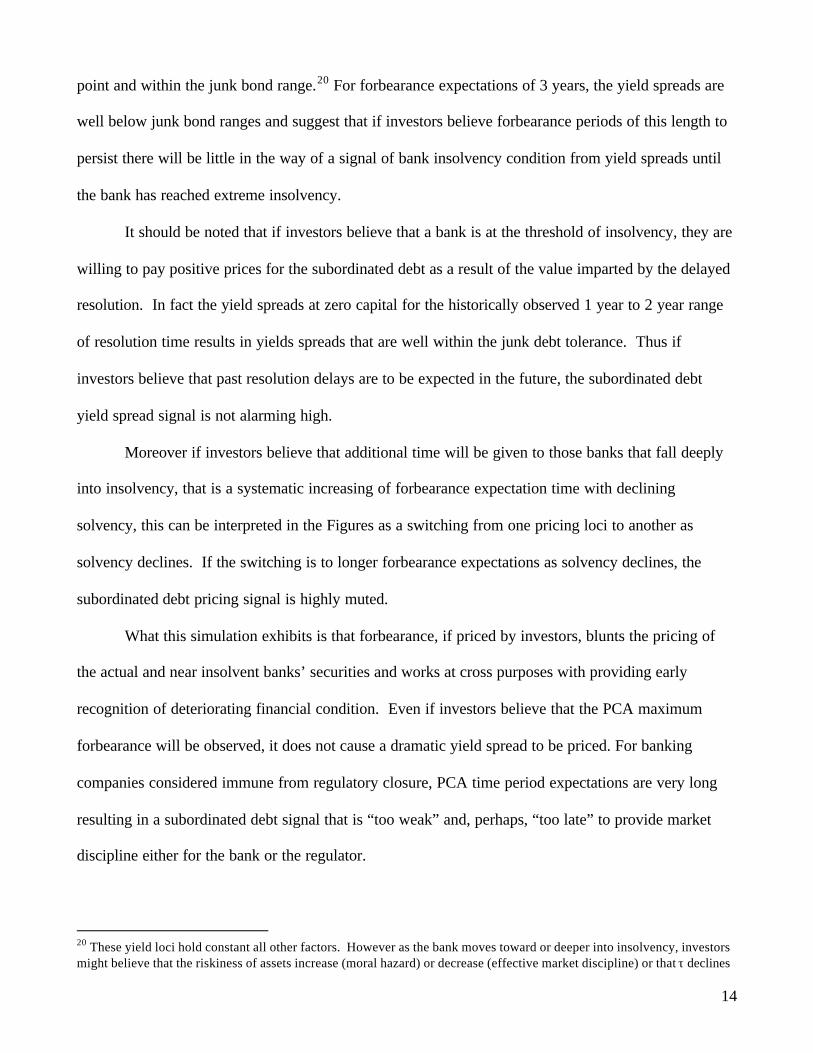
where,
( )τσ
τσ
V
VfDep
RBV
d
++
=
2
1
5.0ln and τσVdd −= 12 ,

11
( ) ( )τσ
τσ
V
VfSubDep
RBBV
g
++
+=
2
1
5.0ln and τσVgg −= 12
V = the market value of assets,
B = the promised value of bank liabilities discounted at the risk-free rate to time T,
Rf = the risk-free rate with a maturity consistent with the time to asset valuation (bank examination),
τ = the market-perceived time until receivership,
σV = the standard deviation (volatility) of the rate of return on assets,
ln(x) = the natural logarithm of x,
exp(x) = the value e raised to the power of x, and
N(x) = the cumulative standard normal distribution.
Consistent with the above model of subordinated debt, the equity value of a firm can be
considered as a call option on its assets with a strike price being its total promised debt, B, is:
( ) ( ) ( ) ( )21 exp gNRBgVNE f τ−−= (3)
where E is the market value of equity and g1, g2 and all other variables are defined as above.
Our objective is to estimate three parameters of the contingent claims model of pricing: the
market value of assets, V, the volatility of asset returns, σV, and the investors’ expected time to
resolution, τ. To solve for three variables a third equation is necessary. Ronn and Verma (1996) and
Hull (2000, p.630-631) show that by applying Ito’s lemma to the generating process for the value of
assets, the following relationship with observable market value of equity and its volatility can be used
as the third equation in our system:
σEE = N(g1)σVV (4)
17 The valuation equation for subordinated debt is derived in Black and Cox (1976) and Smith (1979). Cox and Rubinstein(1985) show that the subordinated debt value equals the difference between two European call options:
12
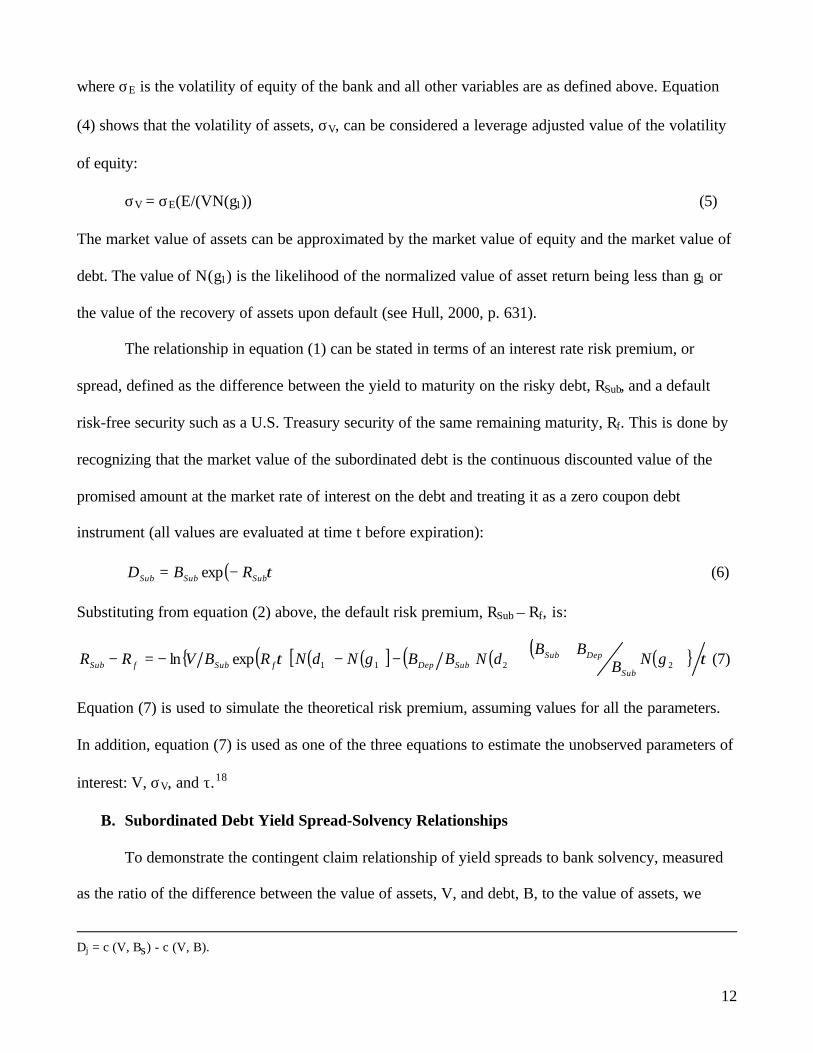
where σE is the volatility of equity of the bank and all other variables are as defined above. Equation
(4) shows that the volatility of assets, σV, can be considered a leverage adjusted value of the volatility
of equity:
σV = σE(E/(VN(g1)) (5)
The market value of assets can be approximated by the market value of equity and the market value of
debt. The value of N(g1) is the likelihood of the normalized value of asset return being less than g1 or
the value of the recovery of assets upon default (see Hull, 2000, p. 631).
The relationship in equation (1) can be stated in terms of an interest rate risk premium, or
spread, defined as the difference between the yield to maturity on the risky debt, RSub, and a default
risk-free security such as a U.S. Treasury security of the same remaining maturity, Rf. This is done by
recognizing that the market value of the subordinated debt is the continuous discounted value of the
promised amount at the market rate of interest on the debt and treating it as a zero coupon debt
instrument (all values are evaluated at time t before expiration):
( )τSubSubSub RBD −= exp (6)
Substituting from equation (2) above, the default risk premium, RSub – Rf, is:
{ ( ) ( ) ( )[ ] ( ) ( ) ( ) ( ) } ττ 2211expln gNBBB
dNBBgNdNRBVRRSub
DepSubSubDepfSubfSub
++−−−=− (7)
Equation (7) is used to simulate the theoretical risk premium, assuming values for all the parameters.
In addition, equation (7) is used as one of the three equations to estimate the unobserved parameters of
interest: V, σV, and τ.18
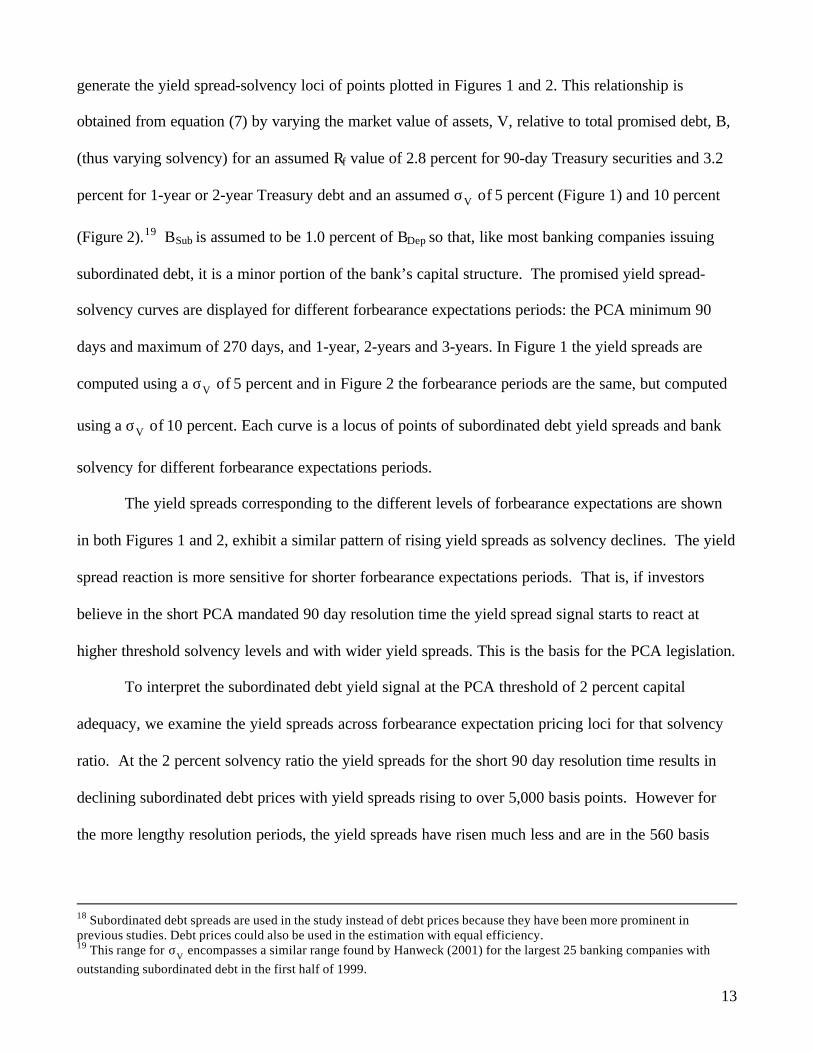
B. Subordinated Debt Yield Spread-Solvency Relationships
To demonstrate the contingent claim relationship of yield spreads to bank solvency, measured
as the ratio of the difference between the value of assets, V, and debt, B, to the value of assets, we
Dj = c (V, Bs) - c (V, B).
13
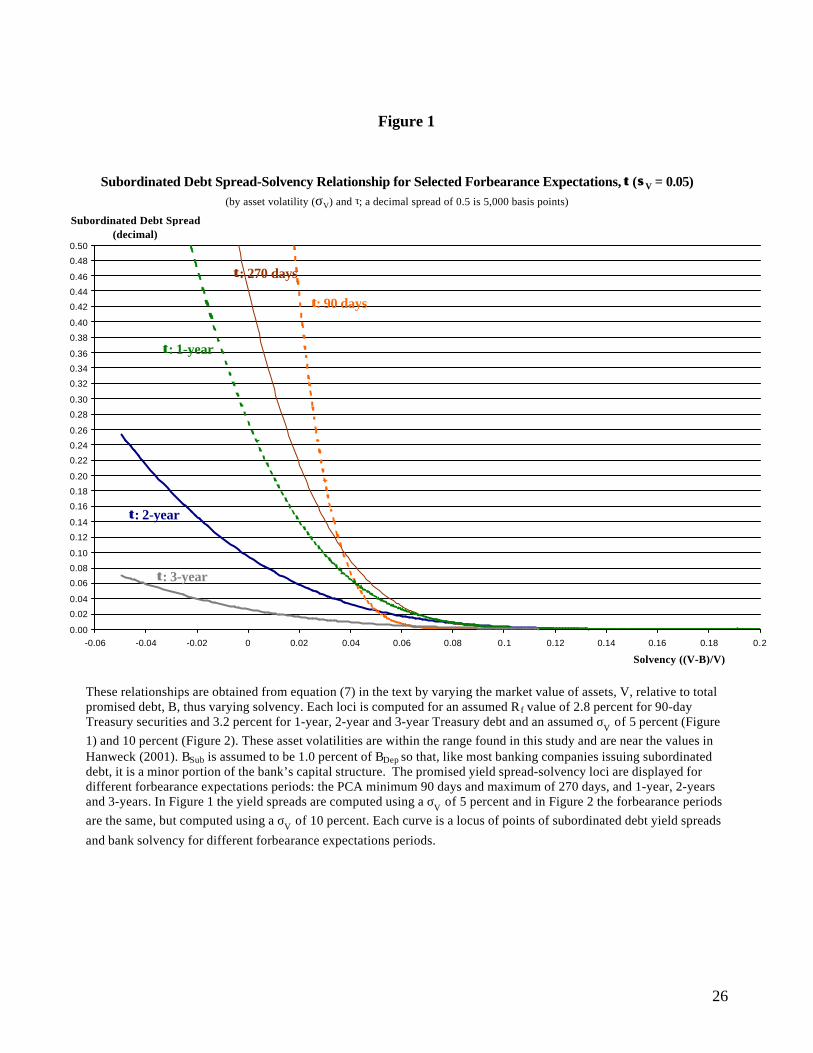
generate the yield spread-solvency loci of points plotted in Figures 1 and 2. This relationship is
obtained from equation (7) by varying the market value of assets, V, relative to total promised debt, B,
(thus varying solvency) for an assumed Rf value of 2.8 percent for 90-day Treasury securities and 3.2
percent for 1-year or 2-year Treasury debt and an assumed σV of 5 percent (Figure 1) and 10 percent
(Figure 2).19 BSub is assumed to be 1.0 percent of BDep so that, like most banking companies issuing
subordinated debt, it is a minor portion of the bank’s capital structure. The promised yield spread-
solvency curves are displayed for different forbearance expectations periods: the PCA minimum 90
days and maximum of 270 days, and 1-year, 2-years and 3-years. In Figure 1 the yield spreads are
computed using a σV of 5 percent and in Figure 2 the forbearance periods are the same, but computed
using a σV of 10 percent. Each curve is a locus of points of subordinated debt yield spreads and bank
solvency for different forbearance expectations periods.
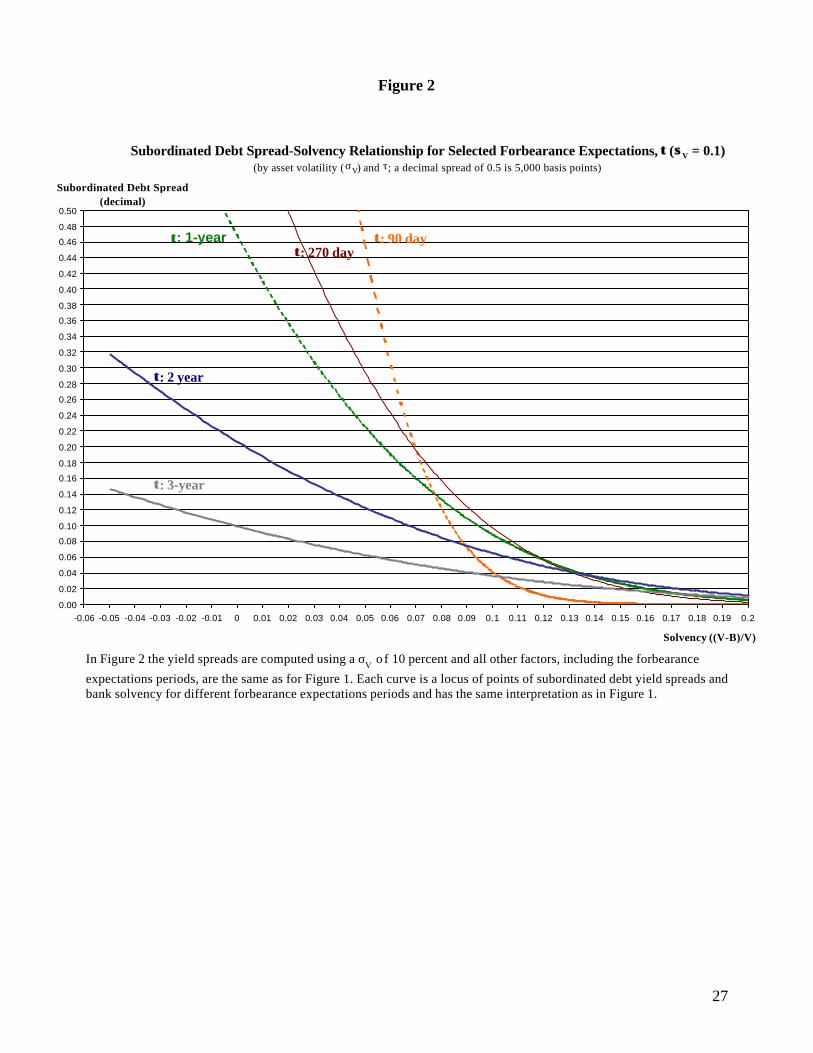
The yield spreads corresponding to the different levels of forbearance expectations are shown
in both Figures 1 and 2, exhibit a similar pattern of rising yield spreads as solvency declines. The yield
spread reaction is more sensitive for shorter forbearance expectations periods. That is, if investors
believe in the short PCA mandated 90 day resolution time the yield spread signal starts to react at
higher threshold solvency levels and with wider yield spreads. This is the basis for the PCA legislation.
To interpret the subordinated debt yield signal at the PCA threshold of 2 percent capital
adequacy, we examine the yield spreads across forbearance expectation pricing loci for that solvency
ratio. At the 2 percent solvency ratio the yield spreads for the short 90 day resolution time results in
declining subordinated debt prices with yield spreads rising to over 5,000 basis points. However for
the more lengthy resolution periods, the yield spreads have risen much less and are in the 560 basis
18 Subordinated debt spreads are used in the study instead of debt prices because they have been more prominent inprevious studies. Debt prices could also be used in the estimation with equal efficiency.19 This range for σV encompasses a similar range found by Hanweck (2001) for the largest 25 banking companies withoutstanding subordinated debt in the first half of 1999.
14
point and within the junk bond range.20 For forbearance expectations of 3 years, the yield spreads are
well below junk bond ranges and suggest that if investors believe forbearance periods of this length to
persist there will be little in the way of a signal of bank insolvency condition from yield spreads until
the bank has reached extreme insolvency.
It should be noted that if investors believe that a bank is at the threshold of insolvency, they are
willing to pay positive prices for the subordinated debt as a result of the value imparted by the delayed
resolution. In fact the yield spreads at zero capital for the historically observed 1 year to 2 year range
of resolution time results in yields spreads that are well within the junk debt tolerance. Thus if
investors believe that past resolution delays are to be expected in the future, the subordinated debt
yield spread signal is not alarming high.
Moreover if investors believe that additional time will be given to those banks that fall deeply
into insolvency, that is a systematic increasing of forbearance expectation time with declining
solvency, this can be interpreted in the Figures as a switching from one pricing loci to another as
solvency declines. If the switching is to longer forbearance expectations as solvency declines, the
subordinated debt pricing signal is highly muted.
What this simulation exhibits is that forbearance, if priced by investors, blunts the pricing of
the actual and near insolvent banks’ securities and works at cross purposes with providing early
recognition of deteriorating financial condition. Even if investors believe that the PCA maximum
forbearance will be observed, it does not cause a dramatic yield spread to be priced. For banking
companies considered immune from regulatory closure, PCA time period expectations are very long
resulting in a subordinated debt signal that is “too weak” and, perhaps, “too late” to provide market
discipline either for the bank or the regulator.
20 These yield loci hold constant all other factors. However as the bank moves toward or deeper into insolvency, investorsmight believe that the riskiness of assets increase (moral hazard) or decrease (effective market discipline) or that τ declines
15
IV. Empirical Estimate of Forbearance Expectations and Bank Solvency
A. Data For Empirical Estimates
In this section we present empirical estimates of the market value of assets, V, the volatility of
asset returns, σV, and the measure of the forbearance expectations period, τ. These empirical estimates
are the values implied in the investors’ pricing of banking company subordinated debt and equity.
That is, we measure the investors’ view of the bank’s market value of assets and the investors’
simultaneous view of the forbearance that will occur. Using equations (3), (5) and (7), presented
above, we solve for each of these variables using market data for eleven banking companies for which
both market traded subordinated debt and equity were available during the l990s. These include some
that were considered by investors to be insolvent or nearly insolvent, whether or not they subsequently
failed or were acquired. The observed information used to structure these solutions is each company’s
market value of equity, E, the volatility of equity, σE, the spread on its subordinated debt over a
comparable maturity Treasury security, RSub – Rf, the value of promised or face value of subordinated
debt, BSub, and the value of deposits, BDep.21 From these estimates, we solve for the bank’s implied
asset value, V, from which we then back out the solvency ratio, ((V – B)/V), given the observed level
of the book value of debt, B. We are then able to examine the relationship of subordinated debt yield
spreads with solvency and the impact of forbearance expectations on those relationships.
The data sources for this study are Interactive Data Corporation for subordinated debt prices,
yields and equity values, the Federal Reserve Y-9C quarterly bank holding company reports of income
and expenses and balance sheet data subordinated and other debt obligations, and the Federal Reserve
Board H.15 release for constant maturity Treasury security yields to maturity for the risk-free rate. The
value of equity is the total market value capitalization of the banking company for each date;
if regulators respond in a shorter time frame per the PCA legislated mandate of early closure and least cost.
16
correspondingly, the volatility of equity return is based on the changes in total capitalization plus
dividends at annual rates. Solutions are computed monthly based on end-of-month weekly data so that
the volatility of equity returns is the end-of-month weekly value of the annualized volatility based on a
10-week rolling standard deviation of weekly returns. The corresponding equity market value is based
on the closing stock price for the end of the week at the end of each month. This timing keeps values
for the data consistent with the total assets, deposits and outstanding subordinated debt from the
quarterly balance sheet reports from the Federal Reserve Board’s Y-9C bank holding company report.
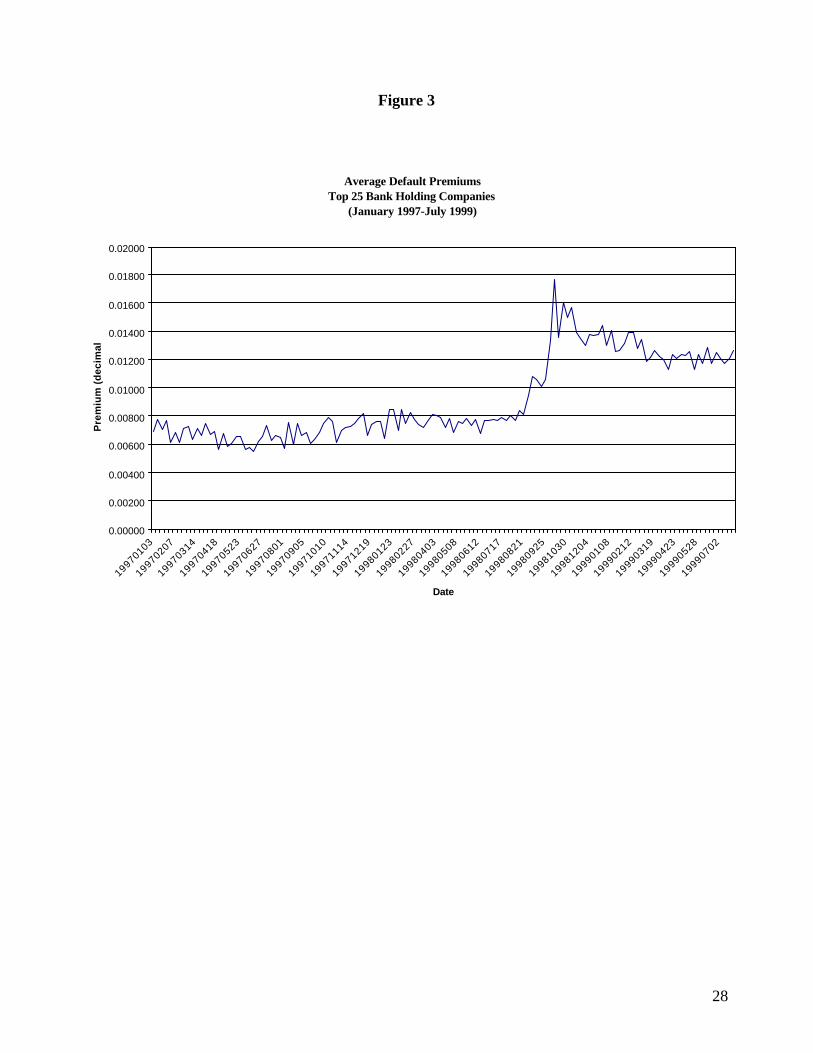
The period we chose to study is from November 1996 to March 1999. During this period, banks
went from little stress to highly stressed after the August 1998 Russian default and the subsequent
collapse of Long Term Capital Management (LTCM) in October 1998. The yield spreads for the
subordinated debt issues of the 25 largest banking companies show this pattern of stress over this
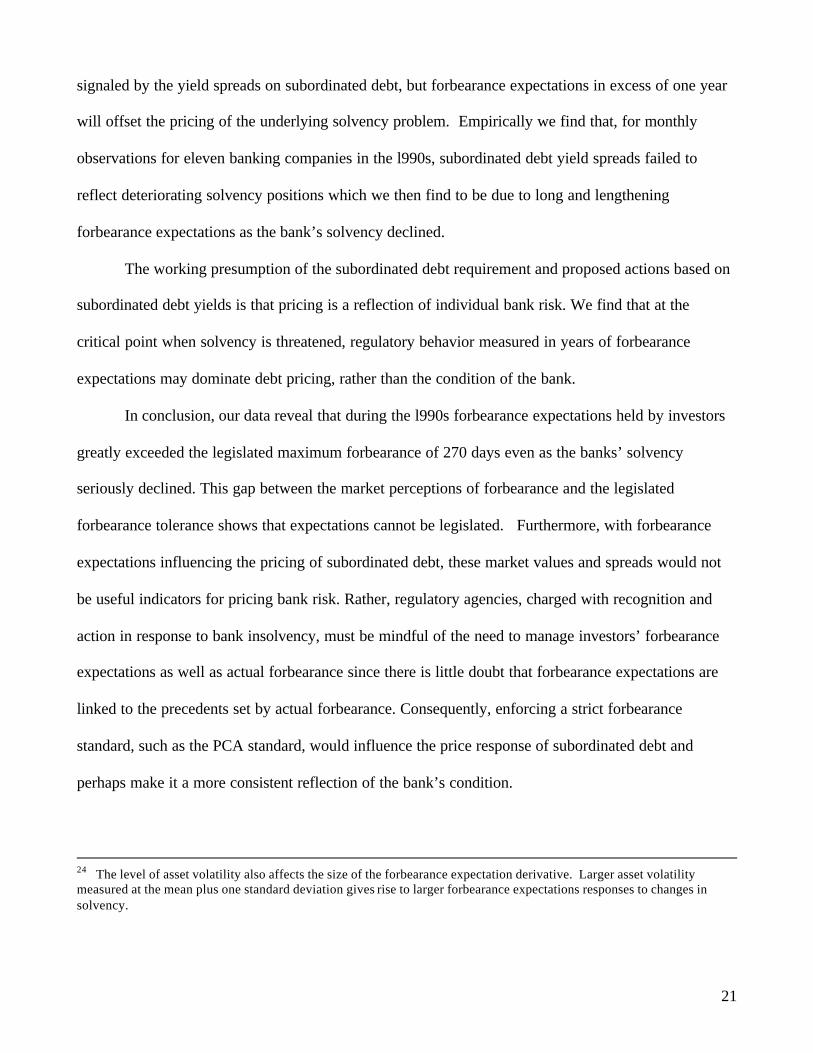
period (Figure 3). This pattern is also exhibited for individual banking companies in our sample. Table
1 shows a break down of the debt characteristics by banking company for the periods to May 1998 and
after May 1998. Without exception, the banking companies in our sample experienced rising
subordinated debt spreads that, as of this writing, have yet to return to the pre-May 1998 level. It is
important to realize, however, that the yield spreads for the banks in our sample are much smaller than
what can occur when a banking company is in serious financial condition. For example, the Bank of
New England was a case of such a bank when, from 1989 until its closing in 1991, it experienced
subordinated debt yields of up to 4000 basis points.
The selection of our period for analysis has the added benefit of minimizing the need for
extensive merger adjustment of the data for banking companies chosen for this analysis. As can be
seen from Table 1, the banking companies in the sample are among the largest companies in the U.S.
21 In these models, we assume that all non-deposit debt and senior secured debt of the banking company is of similarrecovery priority status if the banking company defaults.
17
In addition, with the exception of JP Morgan, Chase Manhattan and Bankers Trust, these companies
have survived independently until Fall-2002.
The number and size of the subordinated debt issues varied considerably among companies.
For the sample of 11 BHCs, the study includes 363 issues with a total outstanding amount, by original
issue, of $49.3 billion (Table 1). Based on September 30, 1998 FR-Y9C reports, the 11 companies
accounted for about 80 percent of reported subordinated debt on balance sheets of consolidated BHCs
in the U.S. in 1998 compared to the largest 34 companies that account for practically all traded
subordinated debt issued by banks and bank holding companies.
B. Descriptive Statistics
In Table 2 are presented descriptive statistics of the observed variables and the estimated
variables. The latter are obtained by solving the contingent claims model for these variables in terms
of the observed market data and debt promised values. It is interesting to note that the mean and
median of the book and market values of assets are similar and that the equity volatility is about five
times the implied asset volatility estimated from the model. The implied solvency ratio averaged 11
percent for the banks in the sample over the period, but was associated with a large standard deviation.
For example, a negative one standard deviation from the mean would reduce solvency to 4.6 percent, a
value approaching the 2 percent critical solvency value. Similarly, the average of forbearance
expectations is slightly more than a year, in line with the current bank examination cycle. Forbearance
expectations could lengthen, as a one-standard deviation increase from the mean would result in an
eight-month increase to nearly two years. These results suggest that the estimates of implied volatility,
solvency and forbearance are highly variable among banks and over time such that simple cross-
section averages for short periods of time (e.g., six months) may be insufficient to isolate a change in a
bank’s solvency or risk profile.
18
C. Yield Spreads and Forbearance Expectations
The average of yield spreads for all observations is 78 basis points and rarely does an
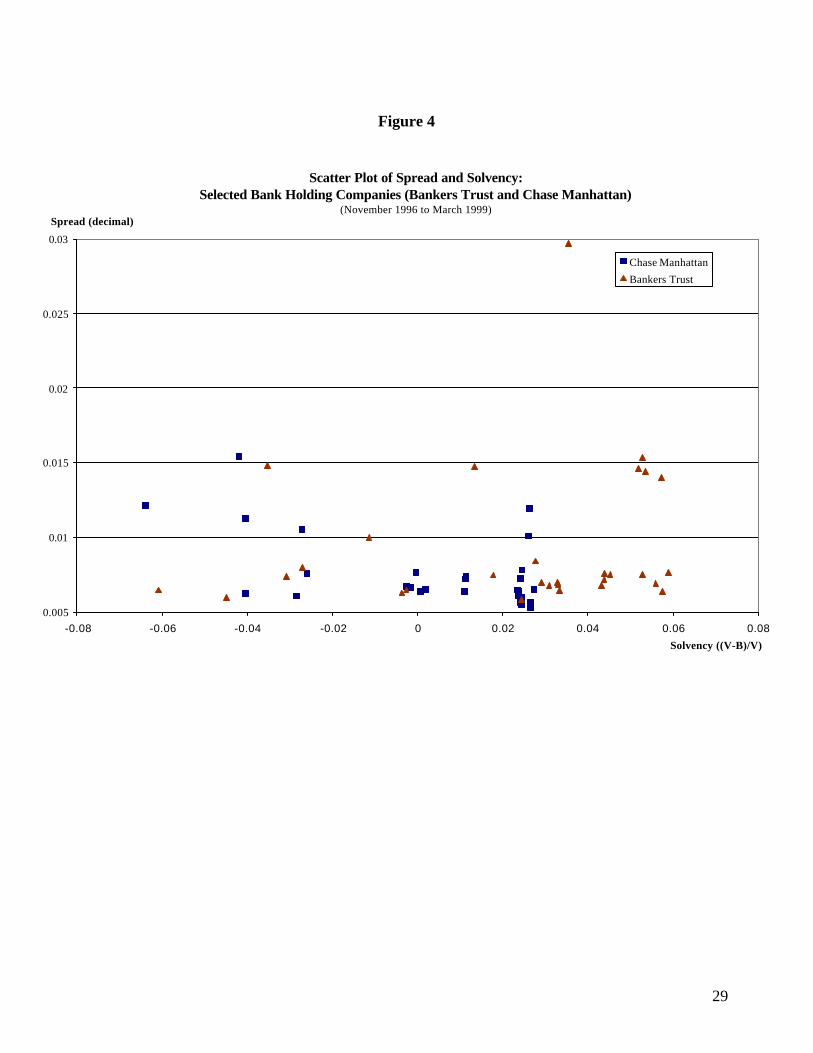
individual bank’s yield spread climb into the junk bond range. The relationship of yield spreads to
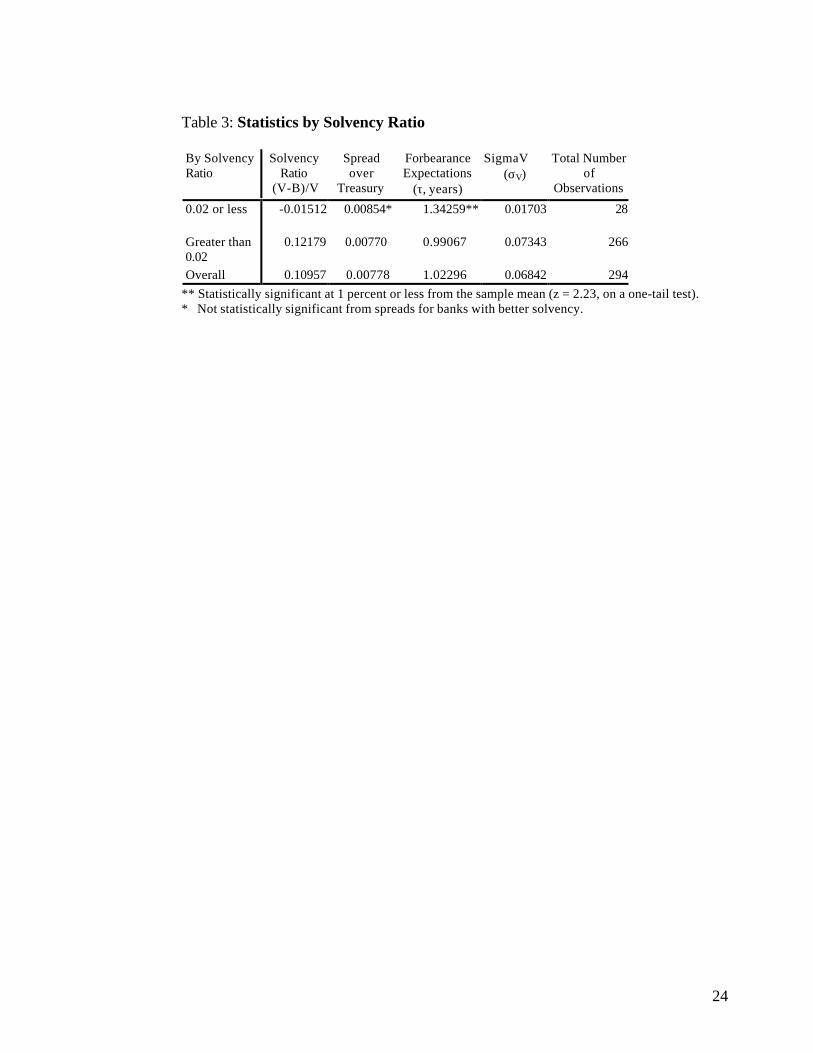
solvency is shown in Table 3. These statistics indicate that the subordinated debt yield spreads are
generally not responsive to declining bank solvency. Yield spreads of banks that investors believed to
have less than a 2 percent solvency ratio averaged 85 basis points or 8.4 basis points higher than for the
banks with greater solvency (Table 3, column 3). However, these differences in yield spreads for those
under and over 2 percent solvency are not statistically different. These results indicate that yield
spreads provide, on the face of it, little signaling effect of market value insolvency. The failure to
observe a relationship between yield spread and solvency is also apparent in Figure 4 that plots the
respective values for Bankers Trust and Chase Manhattan.
The lack of a clear subordinated debt yield signal is consistent with investors believing longer
forbearance will be the de facto response when large banks approach insolvency as analyzed in Section
III.22 Evidence of the possible role of forbearance expectations in influencing the subordinated debt
signal is contained in Table 3. We find that our estimates of forbearance expectations are longer when
the solvency ratio is 2 percent or less (1.34 years or 16 months) and statistically significant from the
overall mean and for those banks with solvency ratios greater than 2 percent (Table 3). The statistical
test is provided by computing a z value of 2.23 that is statistically significant at less than the 1 percent
level for a one-tailed test. This result is consistent with investors having longer forbearance
expectations as banks approach insolvency.
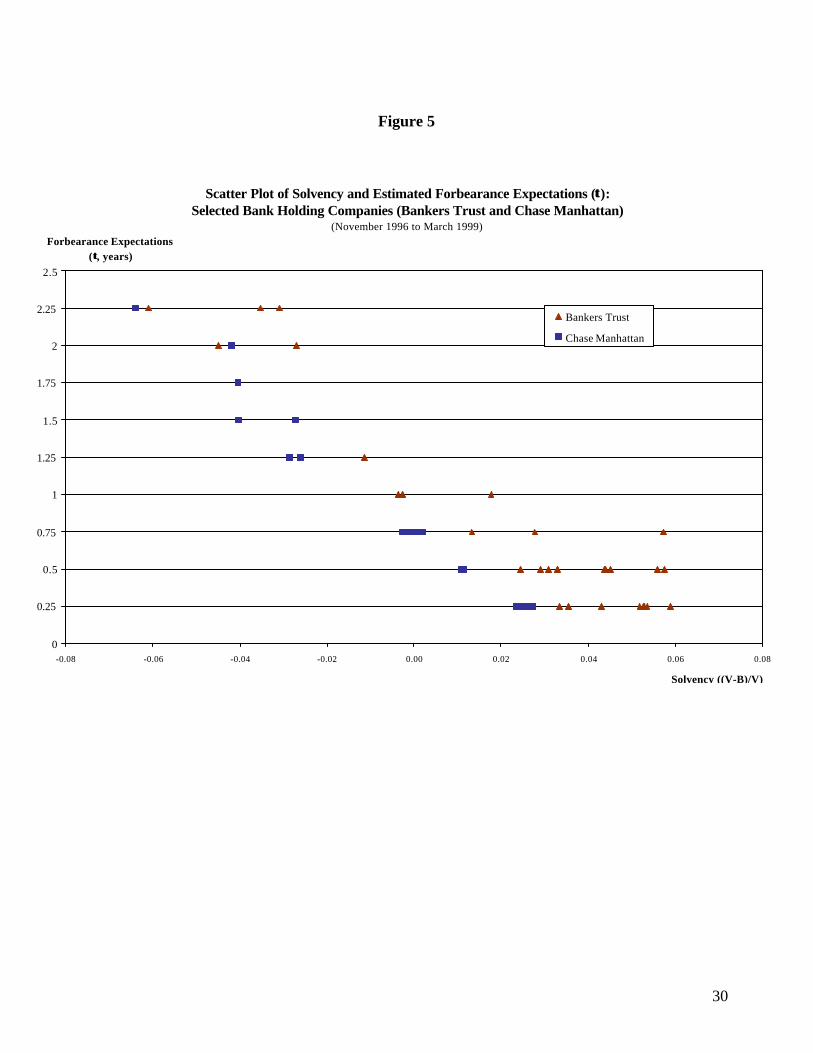
Further evidence of the apparent relationship between forbearance expectations and solvency
are provided from estimates for Bankers Trust and Chase Manhattan, the banks that exhibited the most
22 Under Prompt Corrective Action in FDICIA, a bank is considered to be "critically undercapitalized" when the ratio oftangible capital to total assets is 2.0 percent or less (12CFR, Ch. III, Subpart B, section 325.103(c), FDIC 1992). The capitaland asset values referred to in the law are in terms of book values, with no reference to market values. Thus, the 2.0 percentsolvency ratio in market value terms is likely to correspond to book capital ratios in excess of 2.0 percent.
19
numerous low solvency ratios in the time period studied. These relationships are shown as a scatter
plot in Figure 5 and unambiguously indicate that as solvency declines forbearance expectations
lengthen. For both of these companies, there was a jump in forbearance expectations as solvency
declined below 2 percent. We find that, for these banking companies, estimated forbearance
expectations were generally above 270 days or 0.75 years after their solvency was less than 2 percent.
That is, forbearance expectations levels were well in excess of the PCA maximum. Furthermore,
forbearance expectations were long enough to add sufficient value to blunt the effect of insolvency on
the pricing of bank subordinated debt and indeed lengthened with the bank’s insolvency. The extension
of forbearance expectations with reduced solvency indicates that investors held out little hope for early
regulatory intervention when banks were near insolvency and hence did not price this regulatory risk
of early resolution.
D. Multivariate Tests of Forbearance Expectations and Bank Solvency
To clarify the relationship of forbearance expectations and solvency, we regress forbearance
expectations on solvency for our sample of banking companies in a pooled time series-cross section
relationship.23 To do so we need to control for asset volatility. Furthermore, in order to account for
the non-linearity inherent in the model, the functional form for forbearance expectations is a quadratic
in solvency and asset volatility with an interaction term between these two variables. This is equivalent
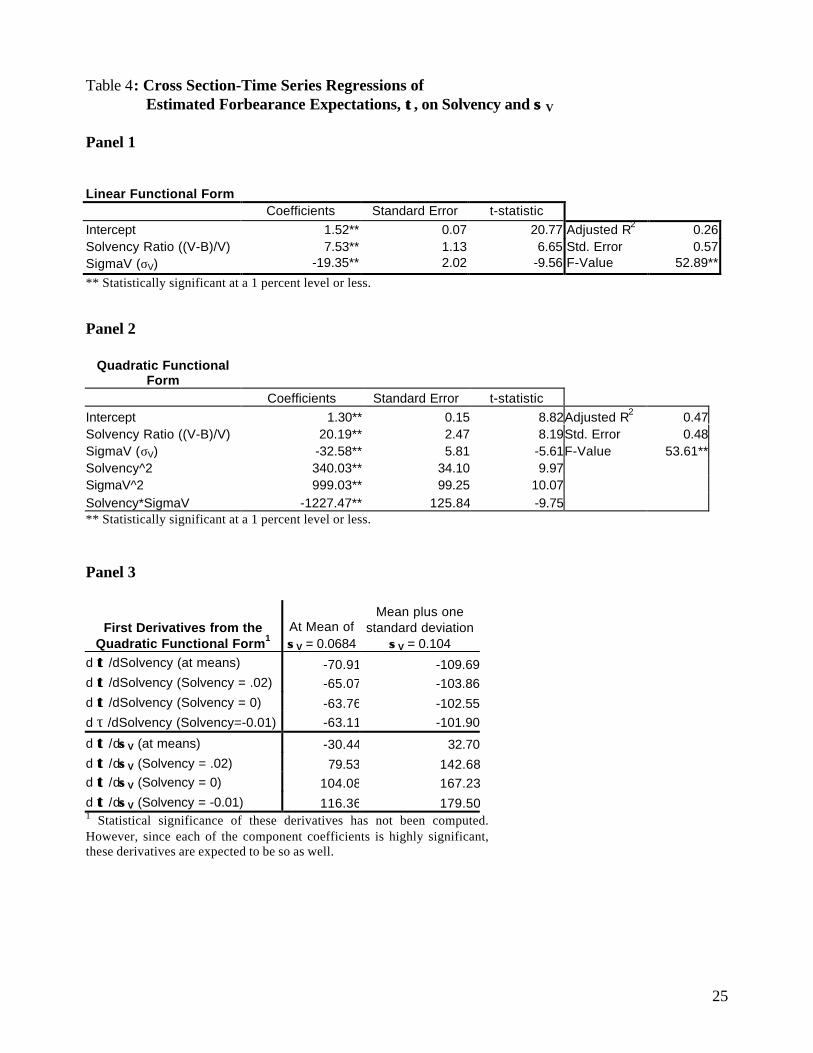
to a second order expansion of the functional relationship among these variables. In Table 4 are
presented the results of a simple linear regression (Panel 1) for comparison and the quadratic form
(Panel 2). The adjusted R2 for the quadratic form improves to 0.47 from 0.26 for the linear model
23 In these regressions each of the variables is computed from the model and is contemporaneous. Since they are computedand not observed, there should be no concern with simultaneity bias. If regressions were run with observed variables, suchas the subordinated debt spread, on the computed variables, there would be a simultaneous bias and questions ofconsistency would arise.
20
indicating that the nonlinear relationship is a superior form. The levels of statistical significance for
the variables are very high at probably levels of 0.0001 of being different from zero.
Using the quadratic form, the derivative values of forbearance expectations with respect to
solvency are evaluated at the means of the variables and for solvency ratios of 2 percent, 0 percent and
–1 percent with asset volatility set to its mean value and the mean plus one standard deviation. The
derivative values for each assumption are shown in Panel 3 of Table 4. The derivative values for
forbearance expectations with respect to solvency are all negative for different levels of solvency and
mean values of asset volatility. The magnitudes of the derivatives are between -0.63 and -0.71 at the
mean of σV and imply that each percentage decline in solvency from the initial assumed value results
in the lengthening of forbearance expectations by approximately seven to eight months.24 The
solvency derivatives for greater assumed values of σV are considerably larger (by about 2/3), indicating
that a one percent decrease in solvency will lead to an increase of up to twelve months in forbearance
expectations. These regression results suggest a very meaningful economic and numerically significant
relationship among forbearance expectations, solvency and asset volatility.
V. Summary and Conclusions
It has been proposed that bank subordinated debt yields be used as a signaling device to reflect
a bank’s deteriorating financial condition. Of particular interest to those charged with the bank safety
net is a reduction in the recognition lag of bank distress in order to promote self-correction by the bank
or for the regulator to prevent costly forbearance of an insolvent bank. Using the contingent claims
model, we relate the signaling device, the bank’s subordinated debt yield spread, to the investors’ view
of the bank’s solvency and forbearance expectations. Analytically we find that, if investors have
relatively short forbearance expectations, the bank’s poor solvency state will be unambiguously
21
signaled by the yield spreads on subordinated debt, but forbearance expectations in excess of one year
will offset the pricing of the underlying solvency problem. Empirically we find that, for monthly
observations for eleven banking companies in the l990s, subordinated debt yield spreads failed to
reflect deteriorating solvency positions which we then find to be due to long and lengthening
forbearance expectations as the bank’s solvency declined.
The working presumption of the subordinated debt requirement and proposed actions based on
subordinated debt yields is that pricing is a reflection of individual bank risk. We find that at the
critical point when solvency is threatened, regulatory behavior measured in years of forbearance
expectations may dominate debt pricing, rather than the condition of the bank.
In conclusion, our data reveal that during the l990s forbearance expectations held by investors
greatly exceeded the legislated maximum forbearance of 270 days even as the banks’ solvency
seriously declined. This gap between the market perceptions of forbearance and the legislated
forbearance tolerance shows that expectations cannot be legislated. Furthermore, with forbearance
expectations influencing the pricing of subordinated debt, these market values and spreads would not
be useful indicators for pricing bank risk. Rather, regulatory agencies, charged with recognition and
action in response to bank insolvency, must be mindful of the need to manage investors’ forbearance
expectations as well as actual forbearance since there is little doubt that forbearance expectations are
linked to the precedents set by actual forbearance. Consequently, enforcing a strict forbearance
standard, such as the PCA standard, would influence the price response of subordinated debt and
perhaps make it a more consistent reflection of the bank’s condition.
24 The level of asset volatility also affects the size of the forbearance expectation derivative. Larger asset volatilitymeasured at the mean plus one standard deviation gives rise to larger forbearance expectations responses to changes insolvency.
22
Table 1: Summary Statistics by Company
Company Name No. of Sub.Debt Issues
Face Amt12/18/98($000)
Average Yield Spread Average Stock Volatility Moody's Debt Rating*
Nov 1996 toMay 1998
May 1998 toMarch 1999
Nov 1996 toMay 1998
May 1998 to March 1999
Chase Manhattan 58 6,604,475 0.6367 1.0364 30.5346 42.9658 (50) A1; (5) Aa3
Citicorp 96 4,897,200 0.8040 1.2587 34.4208 49.5568 A1
Bank America 80 14,394,134 0.6324 0.9772 25.8979 37.7665 (2) A1; (4) Aa2; (76)Aa3
JP Morgan & Co. 13 2,655,000 0.5510 1.0194 24.1677 37.5140 (1) A1; (12) A2
First Union 31 5,525,000 0.5864 0.8923 22.1521 36.7355 (2) A1; (29) A2
Bankers Trust 15 2,050,000 0.6933 1.3485 23.8217 46.9745 A3
BankOne 30 5,630,000 0.6221 0.9159 30.6778 37.4383 (22) A1; (8) Aa3
Wells Fargo 16 2,950,000 0.6333 0.9606 25.3878 34.6540 A1
Fleet Financial 8 1,382,000 0.5985 0.8425 21.4809 36.3518 A3
PNC 7 1,550,000 0.6210 0.9143 24.7029 32.4525 A3
KeyCorp 9 1,675,000 0.6104 0.9573 22.3181 35.2185 (5) A1; (4) A2
Totals and Averages 363 49,312,809 0.6354 1.0112 25.9602 38.8753
* Rated bonds may not equal the number outstanding owing to unrated subordinated debt in some bank portfolios.Sources: Interactive Data Corporation and Bloomberg for debt and equity values and debt ratings. Yield spreads are computed using
the difference between the yield to maturity for a bond and the yield on a Treasury note or bond of similar maturity. Treasuryyield data are from the Federal Reserve Board, H.15 release.
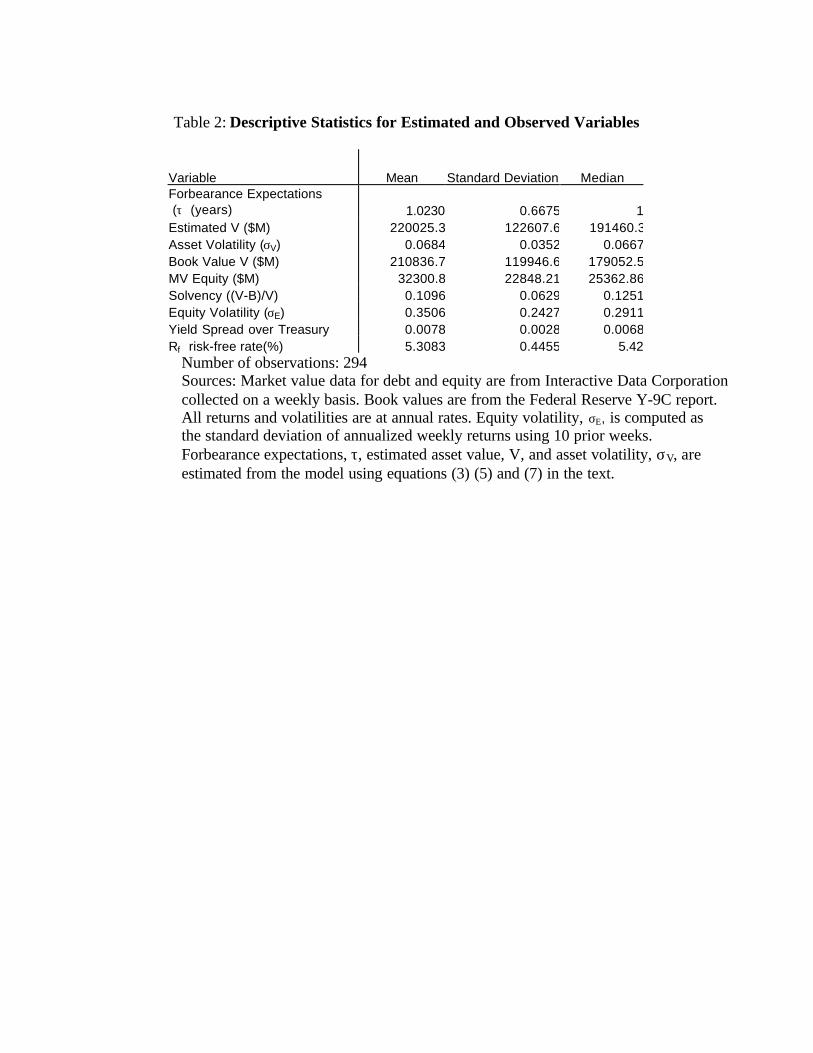
Table 2: Descriptive Statistics for Estimated and Observed Variables
Variable Mean Standard Deviation MedianForbearance Expectations (τ) (years) 1.0230 0.6675 1Estimated V ($M) 220025.3 122607.6 191460.3Asset Volatility (σV) 0.0684 0.0352 0.0667Book Value V ($M) 210836.7 119946.6 179052.5MV Equity ($M) 32300.8 22848.21 25362.86Solvency ((V-B)/V) 0.1096 0.0629 0.1251Equity Volatility (σE) 0.3506 0.2427 0.2911Yield Spread over Treasury 0.0078 0.0028 0.0068Rf risk-free rate(%) 5.3083 0.4455 5.42
Number of observations: 294Sources: Market value data for debt and equity are from Interactive Data Corporationcollected on a weekly basis. Book values are from the Federal Reserve Y-9C report.All returns and volatilities are at annual rates. Equity volatility, σE, is computed asthe standard deviation of annualized weekly returns using 10 prior weeks.Forbearance expectations, τ, estimated asset value, V, and asset volatility, σV, areestimated from the model using equations (3) (5) and (7) in the text.
24
Table 3: Statistics by Solvency Ratio
By SolvencyRatio
SolvencyRatio
(V-B)/V
Spreadover
Treasury
ForbearanceExpectations
(τ, years)
SigmaV(σV)
Total Numberof
Observations
0.02 or less -0.01512 0.00854* 1.34259** 0.01703 28
Greater than0.02
0.12179 0.00770 0.99067 0.07343 266
Overall 0.10957 0.00778 1.02296 0.06842 294** Statistically significant at 1 percent or less from the sample mean (z = 2.23, on a one-tail test).* Not statistically significant from spreads for banks with better solvency.
25
Table 4: Cross Section-Time Series Regressions of Estimated Forbearance Expectations, ττ , on Solvency and σσ V
Panel 1
Linear Functional FormCoefficients Standard Error t-statistic
Intercept 1.52** 0.07 20.77 Adjusted R2 0.26Solvency Ratio ((V-B)/V) 7.53** 1.13 6.65 Std. Error 0.57SigmaV (σV) -19.35** 2.02 -9.56 F-Value 52.89**** Statistically significant at a 1 percent level or less.
Panel 2
Quadratic FunctionalForm
Coefficients Standard Error t-statisticIntercept 1.30** 0.15 8.82Adjusted R2 0.47Solvency Ratio ((V-B)/V) 20.19** 2.47 8.19Std. Error 0.48SigmaV (σV) -32.58** 5.81 -5.61F-Value 53.61**Solvency^2 340.03** 34.10 9.97SigmaV^2 999.03** 99.25 10.07Solvency*SigmaV -1227.47** 125.84 -9.75** Statistically significant at a 1 percent level or less.
Panel 3
First Derivatives from theQuadratic Functional Form1
At Mean ofσσV = 0.0684
Mean plus onestandard deviation
σσV = 0.104d τ τ /dSolvency (at means) -70.91 -109.69d τ τ /dSolvency (Solvency = .02) -65.07 -103.86d τ τ /dSolvency (Solvency = 0) -63.76 -102.55d τ /dSolvency (Solvency=-0.01) -63.11 -101.90
d τ τ /dσσV (at means) -30.44 32.70d τ τ /dσσV (Solvency = .02) 79.53 142.68d τ τ /dσσV (Solvency = 0) 104.08 167.23d τ τ /dσσV (Solvency = -0.01) 116.36 179.501 Statistical significance of these derivatives has not been computed.However, since each of the component coefficients is highly significant,these derivatives are expected to be so as well.
26
Figure 1
These relationships are obtained from equation (7) in the text by varying the market value of assets, V, relative to totalpromised debt, B, thus varying solvency. Each loci is computed for an assumed R f value of 2.8 percent for 90-dayTreasury securities and 3.2 percent for 1-year, 2-year and 3-year Treasury debt and an assumed σV of 5 percent (Figure1) and 10 percent (Figure 2). These asset volatilities are within the range found in this study and are near the values inHanweck (2001). BSub is assumed to be 1.0 percent of BDep so that, like most banking companies issuing subordinateddebt, it is a minor portion of the bank’s capital structure. The promised yield spread-solvency loci are displayed fordifferent forbearance expectations periods: the PCA minimum 90 days and maximum of 270 days, and 1-year, 2-yearsand 3-years. In Figure 1 the yield spreads are computed using a σV of 5 percent and in Figure 2 the forbearance periodsare the same, but computed using a σV of 10 percent. Each curve is a locus of points of subordinated debt yield spreads
and bank solvency for different forbearance expectations periods.
Subordinated Debt Spread-Solvency Relationship for Selected Forbearance Expectations, ττ (σσV = 0.05)(by asset volatility (σV) and τ; a decimal spread of 0.5 is 5,000 basis points)
0.00
0.02
0.04
0.06
0.08
0.10
0.12
0.14
0.16
0.18
0.20
0.22
0.24
0.26
0.28
0.30
0.32
0.34
0.36
0.38
0.40
0.42
0.44
0.46
0.48
0.50
-0.06 -0.04 -0.02 0 0.02 0.04 0.06 0.08 0.1 0.12 0.14 0.16 0.18 0.2
Solvency ((V-B)/V)
Subordinated Debt Spread (decimal)
ττ: 270 days
ττ: 2-year
ττ: 90 days
ττ: 1-year
ττ: 3-year
27
Figure 2
In Figure 2 the yield spreads are computed using a σV of 10 percent and all other factors, including the forbearance
expectations periods, are the same as for Figure 1. Each curve is a locus of points of subordinated debt yield spreads andbank solvency for different forbearance expectations periods and has the same interpretation as in Figure 1.
0.00
0.02
0.04
0.06
0.08
0.10
0.12
0.14
0.16
0.18
0.20
0.22
0.24
0.26
0.28
0.30
0.32
0.34
0.36
0.38
0.40
0.42
0.44
0.46
0.48
0.50
-0.06 -0.05 -0.04 -0.03 -0.02 -0.01 0 0.01 0.02 0.03 0.04 0.05 0.06 0.07 0.08 0.09 0.1 0.11 0.12 0.13 0.14 0.15 0.16 0.17 0.18 0.19 0.2
Subordinated Debt Spread-Solvency Relationship for Selected Forbearance Expectations, ττ (σσV = 0.1)(by asset volatility (σV) and τ; a decimal spread of 0.5 is 5,000 basis points)
ττ: 90 dayττ: 1-yearττ: 270 day
ττ: 2 year
Solvency ((V-B)/V)
Subordinated Debt Spread (decimal)
ττ: 3-year
28
Figure 3
Average Default PremiumsTop 25 Bank Holding Companies
(January 1997-July 1999)
0.00000
0.00200
0.00400
0.00600
0.00800
0.01000
0.01200
0.01400
0.01600
0.01800
0.02000
19970103
19970207
19970314
19970418
19970523
19970627
19970801
19970905
19971010
19971114
19971219
19980123
19980227
19980403
19980508
19980612
19980717
19980821
19980925
19981030
19981204
19990108
19990212
19990319
19990423
19990528
19990702
Date
Pre
miu
m (
dec
imal
)
29
Figure 4
0.005
0.01
0.015
0.02
0.025
0.03
-0.08 -0.06 -0.04 -0.02 0 0.02 0.04 0.06 0.08
Solvency ((V-B)/V)
Spread (decimal)
Chase Manhattan
Bankers Trust
Scatter Plot of Spread and Solvency:Selected Bank Holding Companies (Bankers Trust and Chase Manhattan)
(November 1996 to March 1999)
30
Figure 5
Scatter Plot of Solvency and Estimated Forbearance Expectations (ττ):Selected Bank Holding Companies (Bankers Trust and Chase Manhattan)
(November 1996 to March 1999)
0
0.25
0.5
0.75
1
1.25
1.5
1.75
2
2.25
2.5
-0.08 -0.06 -0.04 -0.02 0.00 0.02 0.04 0.06 0.08
Bankers Trust
Chase Manhattan
Forbearance Expectations (ττ, years)
Solvency ((V-B)/V)
31
References
Allen, Linda and A. Saunders (1993) Forbearance and valuation of deposit insurance as a callableput” Journal of Banking and Finance Vol. 17, Issue 5, 629-643.
Altman, E. I. And A. Saunders, 2001. An analysis and critique of the BIS proposal on capitaladequacy and ratings. Journal of Banking and Finance 25, 25-46.
Avery, R. T., T. Belton and M. Goldberg, 1988. Market discipline in regulating bank risk: Newevidence from the capital markets, Journal of Money, Credit, and Banking, 20, 597-610.
Basel Committee on Bank Supervision, 1999, “A new capital adequacy framework,” consultativepaper, Basel, Switzerland, June.
Beaver, W. H., Datar, S. and Wolfson, M. A. (1992). “The role of market value accounting in theregulation of insured depository institutions” in The Reform of Federal Deposit Insurance, J. R.Barth and R. D. Brumbaugh, Jr. (Eds.) (pp.259-276). New York: Harper Collins Publishers, Inc.
Berger, Allen N., S. M. Davies, and M. J. Flannery, 2000. “Comparing market and regulatoryassessments of bank performance: who knows what when?” Journal of Money, Credit, andBanking.
Black, F. and J. Cox. 1976, "Valuing corporate securities: some effects of bond indentures," Journalof Finance, 31,351-367.
Bliss, R. R. (2001) “Market discipline and subordinated debt: A review of some salient issues,”Economic Perspective, Federal Reserve Bank of Chicago, Vol. XXV, Issue 1, p. 24-45.
Bliss, R. R. and M. Flannery (2000), "Market discipline in the governance of U. S. Bank HoldingCompanies: Monitoring vs. influencing," Federal Reserve Bank of Chicago, Working Paper, No.,WP-2000-03.
Calomiris, Charles (1999), "Building an incentive-compatible safety net," Journal of Banking andFinance
Cook, Douglas O., C. D. Schellhorn, and L. J. Spellman, (2002) "Lender certification premiums.”Journal of Banking and Finance, forthcoming.
Cox, John C. and Mark Rubinstein. 1985. Options Markets. Englewood Cliffs: Prentice Hall.
DeYoung, Robert, Mark J. Flannery, William W. Lang, and Sorin M. Sorescu, (2001), “TheInformation Content of Bank Exam Ratings and Subordinated Debt Prices,” Journal of Money,Credit and Banking, v. 33, n. 4, 900–925.
Evanoff, D. D. and L. D. Wall (2002) “Measures of the riskiness of banking organizations:Subordinated debt yields, risk-based capital, and examination ratings,” Journal of Banking andFinance, (May), 989-1009 .
32
Evanoff, D. D. and L. D. Wall, (2000) “Subordinated debt and bank capital reform,” in Kaufman, G(ed.) Research in Financial Services: Private and Public Policy, Volume 12, JAI Press, 53-120.
Evanoff, D. D. and L. D. Wall, (2000b) “Subordinated debt as bank capital: A proposal forregulatory reform,” Economic Perspectives, Federal Reserve Bank of Chicago, v. 24, 40-53.
Federal Deposit Insurance Corporation, “FDIC Adopts Final ‘Prompt Corrective Action’ Rule,”FDIC News Release, Washington D.C., September 15, 1992.
Federal Deposit Insurance Corporation, (1997) History of the Eighties: Lessons for the Future,Volume 1, Washington, D.C.
Flannery, M. J. (l994) "Debt maturity and the deadweight cost of leverage: Optimally financingbanking firms," American Economic Review, 320-31.
Flannery, Mark J., and Sorin M. Sorescu, (1996), "Evidence of Bank Market Discipline inSubordinated Debt Issues: 1983-1991," Journal of Finance, 51, 1347-1377.
Gorton, Gary and Anthony M. Santomero (1990) “Market Discipline and Bank Subordinated Debt,”Journal of Money, Credit, and Banking 22, 119-128.
Hannan, Timothy and Gerald A. Hanweck (1988), "Bank Insolvency Risk and the Market For LargeCertificates of Deposits," Journal of Money, Credit, and Banking, 20 (May), pp.203-211.
Hanweck, Gerald A., (1999) “The Issue of the Federal Safety Net Subsidy: Evidence From thePricing of Banking Company Subordinated Debt,” The Financial Services Roundtable, September1999.
Hanweck, Gerald A. (2001) “A Methodology for Using Market Information to Assess BankingCompany Insolvency Risk: The Simultaneous Use of Subordinated Debt and Equity MarketValues,” Working Paper, FDIC, October 2001.
Hull, John C. (2000) Options, Futures and Other Derivatives, fourth edition, Prentice Hall, NewJersey.
Jagtiani, J., G. Kaufman, and C. Lemieux, 2001 “Do Markets Discipline Banks and Bank HoldingCompanies? Evidence From Debt Pricing” Journal of Financial Research, forthcoming.
Kane, Edward 2000 "Incentives for bank megamergers: what motives might regulators infer fromevent-study evidence” Journal of Money, Credit and Banking Vol. 32 No. 3.
Merton, Robert C., (1974), "On the Pricing of Corporate Debt: The Risk Structure of InterestRates," Journal of Finance, 29, (May), p. 449-470.
Merton, Robert C., (1977), “An Analytical Derivation of the Cost of Deposit Insurance and LoanGuarantees: An Application of Modern Option Pricing Theory,” Journal of Banking and Finance,1, (June), p. 3-11.
33
Merton, Robert C., (1998), "Applications of Option-Pricing Theory: Twenty-five Years Later,"American Economic Review, June, v. 88, p. 323-349.
Morgan, D. P. and K. J. Stiroh, 2001. "Market discipline of banks: The asset test," Journal ofFinancial Services Research, 10, forthcoming
O’Hara M. and W. Shaw, 1990. "Deposit insurance and wealth effects: The value of being too bigto fail,” Journal of Finance, 45
Ronn, E. and A. Verma (1986) “Pricing Risk-Adjusted Deposit Insurance: An Option-BasedModel,” Journal of Finance, 41, 871-895.
Ronn, E. and A. Verma (1989) “Risk-Based Capital Adequacy Standards for a Sample of 43 MajorBanks,” Journal of Banking and Finance, 13, 21-29.
Schellhorn, Carolin D. and Lewis J. Spellman, (1996) “Subordinated Debt and Forward-LookingEstimates of Bank Asset Volatility,” Journal of Economics and Business, 48, 337-347.
Schellhorn Carolin D. and L. J. Spellman (2000) “Bank forbearance: A market-based explanation,”The Quarterly Review of Economics and Finance, 40, 451-466.
Shadow Financial Regulatory Committee, 1992, ”Statement No. 89: Standards for Safety andSoundness (Implementation of Section 132 of FDICIA).” Journal of Financial Services Research,Vol. 10, No. 4, Supplement, December, P. S-44.
Smith, Clifford. 1979. Pp. 79-121 in Handbook of Financial Economics, edited by James L.Bicksler. Amsterdam: North-Holland.
Shadow Financial Regulatory Committee 2000, Reforming Bank Capital Regulation, The AmericanEnterprise Institute Press, Washington, D. C.
Study Group on Subordinated Notes and Debentures, 1999 Using Subordinated Debt as anInstrument of Market Discipline. Board of Governors of the Federal Reserve System, Staff Study,172.
Penas, M and H. Unal (2000) "Bank mergers and subordinated debt yields," Proceeding of aConference on Bank Structure and Competition, Federal Reserve Bank of Chicago, Chicago.
White, Lawrence J. (1991) The S & L Debacle, The Oxford University Press, New York.