force-directed geographical load balancing and scheduling ... · force-directed geographical load...
TRANSCRIPT
Force-directed Geographical Load Balancing and Scheduling for Batch Jobs in Distributed Datacenters
Hadi Goudarzi and Massoud Pedram
University of Southern California
Department of Electrical Engineering - Systems
{hgoudarz, pedram }@usc.edu
Abstract - This work focuses on the load balancing
and scheduling problem for batch jobs considering a cloud
system comprised of geographically dispersed,
heterogeneous datacenters. Each batch job is modeled using
a directed acyclic graph of heterogeneous tasks. Load
balancing and scheduling of batch jobs with loose deadlines
results in operational cost reduction in the cloud system due
to availability of renewable energy sources in datacenters'
site and time of use dependent energy pricing in utility
companies. A solution for load balancing and scheduling
problem based on the force-directed scheduling approach is
presented that considers the online application workload
and limited resource and peak power capacity in each
datacenter. The simulation results demonstrate significant
operational cost decrease (up to 40%) using the proposed
algorithm with respect to a greedy solution.
I. INTRODUCTION AND RELATED WORK
Availability of affordable and sustainable electrical energy is the key to prosperity and continued socio-economic growth of nations and the world. Dynamic energy pricing [1] and demand response are the most effective ways to avoid expending large amount of capital for the expansion of the power generation capacity and distribution network.
Demand response can be described as the changes in the electric power usage in response to changes in energy price over the time. Based on dynamic energy pricing, electricity consumers are encouraged to consume electricity more prudently in order to minimize their electric bill. For this reason, the design of scheduling algorithms considering the energy price has attracted researchers in recent years, see for example [2, 3].
Demand for computing power has been increasing due to the penetration of information technologies in our daily interactions with the world. Datacenters provide the computing needs to clients with thousands to tens of thousands of server machines, see for example [4] and [5]. Resource management and scheduling problems in datacenters and server clusters have attracted a lot of attention in recent years, see for example [6, 7, 8, 9].
The energy consumption of datacenters is increasing and covers up to 2% of the total electrical energy consumption in the US in 20lO [lO]. To reduce the reliance on brown sources of electricity and supplement/diversifY the power generation sources for a datacenter, there is a trend to generate electricity from renewable sources such as wind and solar at the
*This research is sponsored in part by a grant from the Division of Computing and Communication Foundations of the National Science Foundation.
978-1-4799-0898-1/13/$31.00 ©2013 IEEE
datacenters' site [11, 12]. Processing jobs in datacenter can be classified in to two
categories: online or interactive applications and offline or batch jobs. In contrast to online applications which are response time sensitive and needs to be processed as soon as they arrive, batch jobs are usually schedulable and have loose deadline. Scheduling batch jobs in datacenters increases the chance of utilizing the power generated in renewable power plants and may decrease the electricity cost of the datacenter by using cheaper energy. Scheduling batch jobs is an example of demand response in datacenters [13].
Datacenters associated with a cloud system are typically geographically distributed, yet connected together with dedicated high-bandwidth communication links. This helps reduce the peak power demand of the datacenters on the local power grid, allows for more fault tolerant and reliable operation of the IT infrastructure, and even, lowers the cost of ownership.
Energy prices at different sites of a geographically distributed cloud system can be different due to local time differences and differences in local utility company's energy prices [14]. Geographically distributed datacenters associated with a cloud system create load balancing opportunities that can result in lowering the operational cost of each datacenter by purchasing cheaper electrical energy (considering dynamic energy prices at each site depending on the local time) and increasing the utilization of the renewable power generated in datacenters.
Geographical load balancing and scheduling (GLBS) for batch jobs can be defined as series of decisions about assignment of tasks (smaller components of jobs) to geographically distributed datacenters and scheduling the tasks with the goal of decreasing the operational cost of the cloud system while meeting the task dependencies and job deadlines.
Effectiveness of the geographical load balancing is shown in previous work in case of batch job load balancing and scheduling and online application load balancing.
Some of the prior work has focused on reducing the operational cost of the cloud system considering the online application load balancing opportunity - see [15, 16, 17, 18, 19, 20]. For instance, reference [19] proposes dynamic algorithms for load balancing of online applications in heterogeneous distributed datacenters.
There are some work that has focused on batch job load balancing and scheduling - see [21, 22]. Reference [21] solves the GLB problem considering online service and batch applications and cooling supply selection in datacenters. To model the batch jobs, the authors consider a constant maximum parallelization factor for each job but ignore the task
dependency graph. Reference [22] focuses on computation deferral to minimize the energy cost in datacenters. In this reference, authors simplify the scheduling problem by dividing the gap between start time and deadline of the job by the depth of the job's task graph and assigning each part to one task.
In this work, we focus on geographical load balancing and scheduling of large-scale computation jobs such as scientific computing and data mining. To the best of our knowledge, this is the first work that considers simultaneous batch job load balancing and scheduling considering a task dependency graph for each job.
In this work, we focus on the GLBS problem considering heterogeneous datacenters and jobs with heterogeneous task dependency graph and task specifications. The capacity of different resource types, peak power capacity, and power usage effectiveness are considered in modeling each datacenter. The GLBS problem is formulated and a static solution based on the force-directed scheduling approach [23] is proposed. This solution simultaneously determines the scheduling and placement solution for every task. Moreover, a dynamic solution is proposed by extending the static solution considering the prediction error for input parameters. The effectiveness of the proposed algorithms in reducing the operational cost of the cloud system is demonstrated by comparing the results of the proposed algorithms with the results of a greedy load balancing and scheduling method from prior work. The proposed solution results in significant operational cost reduction (up to 46%) with respect to the greedy approach.
This paper is organized as follows. Parameter definitions are given in section II. The problem formulation is presented in section III. The proposed static solution is presented in section IV. The dynamic solution is presented in section V. Simulation results are presented in section VI and paper is concluded at section VII.
II. PARAMETER DEFINITION AND PROBLEM FORMULATION
Workload in datacenters can be classified into two categories: i. online or interactive service applications, e.g. web services and ii. offline or batch jobs, e.g. scientific computation and data mining. Online service applications are usually 1/0-intensive and response time-sensitive. Due to sensitivity of these applications to response time, their requests are processed as soon as possible. Moreover, to reduce the impact of the communication latency on the response time, these applications are typically assigned to the nearest datacenter with available resources. In contrast, offline applications (batch jobs) are compute or memory-intensive applications. The run-time of batch jobs can be in the order of hours. Batch jobs are usually flexible in time and location of the execution. This fact creates an opportunity for demand response within each datacenter and between geographically distributed datacenters. In this work, we focus on scheduling batch jobs in geographically distributed datacenters and consider the workload of the online applications as the background workload.
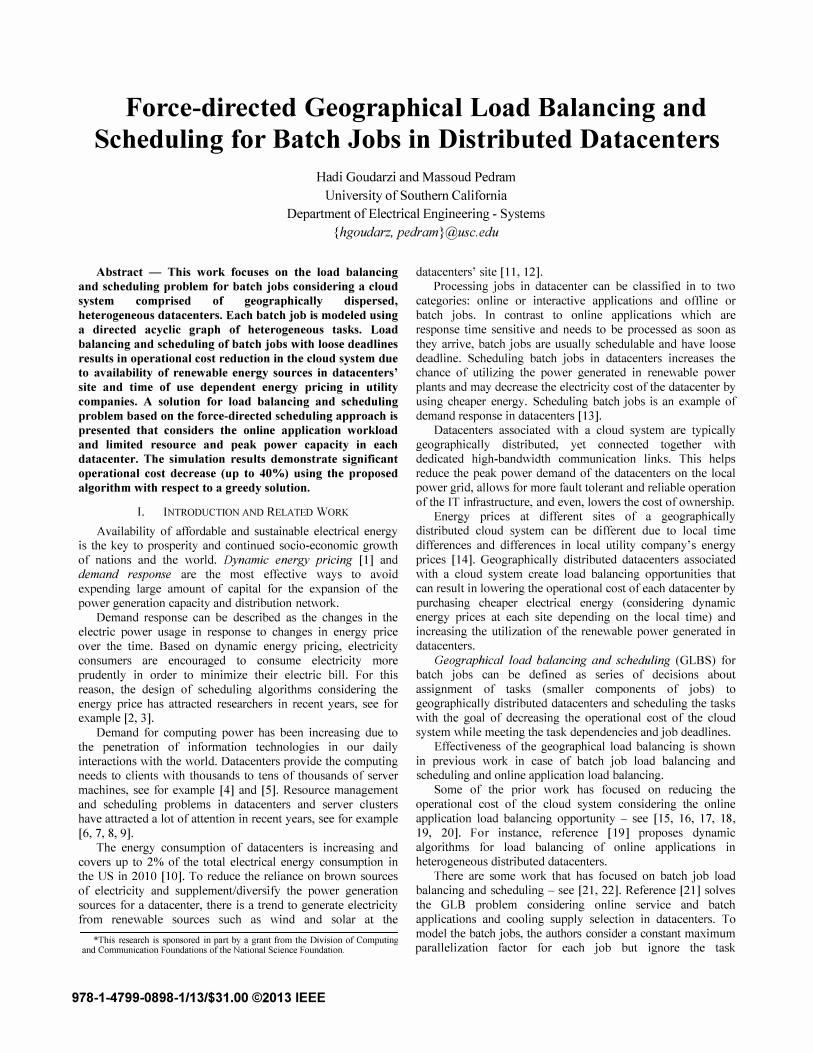
An exemplary figure for a geographically distributed datacenter is shown in Figure l.
Time axis in the GLBS problem is divided into time slots called epochs. Each epoch is identified by a unique id, denoted
Figure 1 - An exemplary figure for a geographically distributed cloud system
by r. e denotes the duration of each epoch, which is in the order of a few minutes to as much as one hour.
The solution to the GLBS problem involves information about (or prediction of) the dynamic energy prices, renewable power generation and online application workload. The quality of these predictions determines the quality of the load balancing and scheduling solution. In the static version of the problem, we consider prediction of these parameters in a long period of time in order to determine a complete batch job placement and scheduling for that period e.g., a full day. T denotes the set of consecutive epochs that we consider for the static version of the GLBS. In contrast, the dynamic version of the problem deals with placement and scheduling of the tasks at the beginning of each epoch based on the inexact prediction about the future parameters.
A time-of-use (TOU) dependent energy pricing scheme is considered for each utility company. The energy price is assumed to be fixed for at least one epoch. lJId(r) denotes the energy price in datacenter d during epoch T. TOU-dependent energy pricing scheme (in contrast to peak-power dependent energy pricing) enables one to ignore the time variation of renewable power generated in local renewable power facilities during an epoch and model the amount of generated renewable power by the average generated power in that epoch, which is denoted by Gd(r). The allowed peak power consumption of a datacenter is determined by the power delivery network in the datacenter and is denoted by pd,max. To translate the average power consumption to peak power consumption, peak to
average power ratio ( PARd(r) is used. This parameter depends on the resource capacity of the datacenter and the type of the workload assigned to the datacenter.
The PUE factor of a datacenter, which is defined as the ratio between total power consumption of the datacenter to the power consumed by the IT equipment in the datacenter, is captured by a constant factor (PUEd), which accounts for the uninterrupted power supply inefficiencies within the datacenter and the power consumption of the air conditioning units in the datacenter.
We consider only the processing capacity as the resource in each datacenter (consideration of other resource types such as the storage or network bandwidth falls outside the scope of present paper). To model each datacenter more accurately, we consider datacenters with heterogeneous servers. Each server type is identified by a unique id s in each datacenter and the set of server types in each datacenter is shown by Sd. Cd,s denotes the number of servers of type s in datacenter d. Different
server types have different characteristics in terms of their processing speed (CPU cycles per second) and power consumption. Operation frequency (f) of a server from server type s can be selected from a finite set of frequency FS• The background workload in each datacenter and server type is captured by the computation capacity needs for the online applications in time i, which is denoted by parameter (jjd,s,f (r).
Due to non-energy proportional behavior of the servers [24], it is important to translate the amount of resources required in the server pool to the number of active servers. To capture the packing effect, we assume that any active server of type s, is utilized by an average value (smaller than one, e.g., 0.8) denoted by ¢s. The rationale is that considering any resource requirement value, server-level power management strategies including server consolidation or dynamic voltage and frequency scaling methods are employed in the datacenter ensuring that an active server is utilized at a high level so that we avoid having to pay the penalty associated with the nonenergy proportionality behavior of the servers. This average utilization level for different server types may not be the same because the characteristics and configuration of each server type in terms of its power consumption vs. utilization level curve as well as the amount of memory, local disk size, network interface bandwidth are generally different.
The average power consumption of each of these resource types in datacenter can be found by multiplying the average power consumption of a typically utilized server of given type
(¢S p! + Pso) by the number of servers in that frequency needed to support the workload in the datacenter. In this formula, Pso and p! denote the idle and frequency and utilization-dependent power consumption of a server of type s. Even though the number of instructions per second executed in a server is
linearly related to the server frequency, dependency of p! to frequency is non-linear (between [2 and [3); e.g., see reference [25] for more details.
Each batch job is identified by a unique id, denoted by j. Each batch job has an earliest start time (Sj) and latest end time
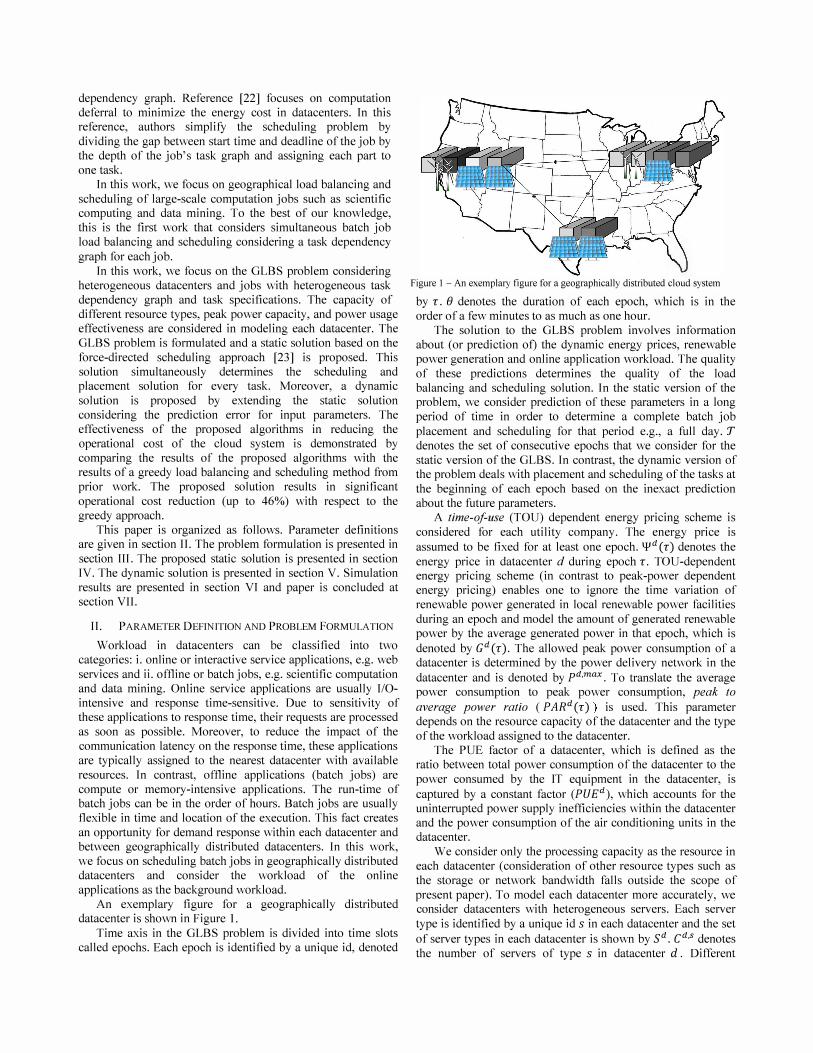
or deadline (ej)' Each job can be decomposed to smaller computational tasks denoted by t . We consider this decomposition to be fixed and well-characterized before the scheduling problem. The complete set of tasks for each job is denoted by '0. Data and control signal dependency between tasks in a job can be captured by a Directed Acyclic Graph (DAG). We consider the same data and control dependency between tasks in each DAG. An exemplary DAG for a map reduce job is shown in Figure 2.
Task I
Task 2
Task 3
Task 4
MAP task
_ REDUCE task
Figure 2 - An exemplary figure for a map-reduce task graph
Each task can be defined by the parent task set (l),t), amount of produced data by processing (dataJ,ft ) and
execution latency (If{) depending on the server type and
operation frequency. Moreover, child task set (Cj,t) can be defined as the set of tasks which have task t as one of their parents. Note that due to long execution latency for each task, we do not consider the effect of data transfer latency, but in order to consider the overhead of transferring data from one geographical location to another, we consider a data transfer cost in the cost function.
The scheduling parameter ej,t denotes the end time of task t from job j. The precision of ej,t is one epoch. To be able to schedule a task to be completed by the end of an epoch, tasks in parent task set need to be scheduled in the previous epochs or in the same epoch with the condition that the remaining time in the epoch from the end of the last parent task to be executed should be greater or equal to the latency of the child task in the selected server and frequency. Selected datacenter, server and frequency for each task is determined by resource allocation
parameter ¢1�S,f (i). For each task in a job, this parameter is
only non-zero for one combination of (d, s, f) when i = ej,t. We consider the input parameters to be fixed during an
epoch. Making this assumption means that the frequency of drastic changes in the system is considered to be greater than the frequency of applying the optimization solution.
III. GLBS PROBLEM FORMULATION
The role of the load balancing and scheduling is to determine the placement (datacenter, server type and frequency) and scheduling for each task to minimize the operational cost in distributed datacenters subject to the resource availability in each datacenter, task dependency and job deadline constraints.
The geographical load balancing and scheduling problem for batch jobs can be formulated as follows:
Min L 8 L qJd(i)(pd(i) - Cd(i))+
subject to:
rET dED + C � � zoutdataout
L L j,t J,t j tETj
pd(i) = PUEd LsESd L[EFS (( ¢s p! + PSO) ($d,s,f (i) +
/tET/¢itd,sJ(r}JI¢s
\:It E '0
ej,t � ej,t' \:It' E l),t L - '" . (A-.d,s,f( ))IS,f j,t - L...(d,s,f) sLgn 'f'j,t ej,t j,t L(t EPath &ej,t=r) Lj ,t ::; 8 \:Ii and \:Ipath c '0
d '" . (A-.d,s,f( )) yj,t = L...(s,f) sLgn 'f' j,t ej,t Ldyft = 1
\:It' E Cj,t out {O ej,t' - ej,t ::; 1 & yft = yft' Zj,t =
1 + Ie. I otherwise j,t L[EFS($ d.s.[ (i) + Lj LtETj ¢1�s,f (i)) ::; Cd,s \:I(d, S, i) pd(i)PARd(i)::; pd,max \:I(d,i)
(1 )
(2)
(3)
(4)
(5)
(6)
(7)
(8)
(9)
(10)
The input parameters in this problem are online application workload in each epoch, energy price and generated power in
renewable power plant for each datacenter. The optimization parameters in this problem include scheduling ( ej,t) and
allocation (if/tM (T)) parameters for each task in each batch j. job. Other parameters can be derived from these two parameters. There are two terms in the objective function: (i) Energy cost paid to the utility companies, (ii) Communication cost. The communication cost can be seen as the energy of storing and retrieving the data or the data transfer charge of the storage cloud used to keep the data. Parameter C denotes the communication cost per unit of data transfer.
Constraint (1) determines the average power consumption in each datacenter in each epoch. Constraint (2) determines the earliest start time and latest finish time of each job. Constraint (3) determines the data and control flow in each job DAG. Constraint (4) determines the latency of each task based on the type and amount of resource allocated to it. Constraint (5) makes sure that the latency of the task( s) assigned to one epoch belonging to a path is less than the length of the epoch. A path is defined as a subset of '0 in which every node except one (starting node) has only one of its parent nodes available in the set. Constraint (6) determines the pseudo-Boolean placement parameter Ylt which determines the task to datacenter
assignment (if task t is assigned to datacenter d, Ylt is equal to one, otherwise zero). Constraint (7) makes sure that the task is only assigned to one datacenter and resource type in its execution time. Constraint (8) determines whether the produced data from executing task t needs to be stored in the storage part of the cloud system and retrieved by the child tasks or not. Constraint (9) and (10) determines the resource capacity and peak power capacity in each datacenter.
The GLBS problem for batch jobs is an NP-hard problem. The work focused on load balancing and scheduling of the batch jobs [21, 22] ignored the task dependency graph to simplify the proposed solutions.
In static version of the GLBS problem, a complete placement and scheduling solutions for tasks belonging to the job set is determined. In dynamic cloud management scenario, considering highly accurate prediction of workload, energy price and renewable energy generation for a long period of time is not realistic. The dynamic version of the problem deals with placement and scheduling of the tasks at the beginning of each epoch. In this version of the problem, the input parameters for the current epoch is considered to be accurate but inexact prediction of the parameters for the future epochs is used in order to decide about placement and scheduling solution for the current epoch. A solution for static GLBS problem is presented in section IV. This solution is extended to a dynamic cloud management solution in section V.
IV. STATIC SOLUTION
The most important challenge in minimizing the operational cost in the GLBS problem is to consider the concurrency between different jobs. For example, if we do not consider the concurrency between jobs, resource and peak power pressure in datacenters may force some critical tasks (in terms of deadline) to be scheduled at datacenters and times with high energy price even with the possibility of deferring non-critical tasks. So the proposed solution for the GLBS problem needs to consider the concurrency between tasks from different jobs in order to
decide which tasks to schedule and which ones to defer to reach the lowest operational cost.
We propose Lorce-Directed .Load aalancing and �cheduling (FLBS) algorithm which determines task scheduling and placement solution based on the Force-Directed Scheduling (FDS) approach [23]. FDS is one of the significant scheduling techniques in high-level synthesis. It is a technique used to schedule directed acyclic task graphs so as to minimize the resource usage under a latency constraint. This technique maps the scheduling problem to the problem of minimizing forces in a physical system which is subsequently solved by iteratively reducing the total force by task movements between time slots. In reference [3], this technique has been applied to the household task scheduling in demand response problem.
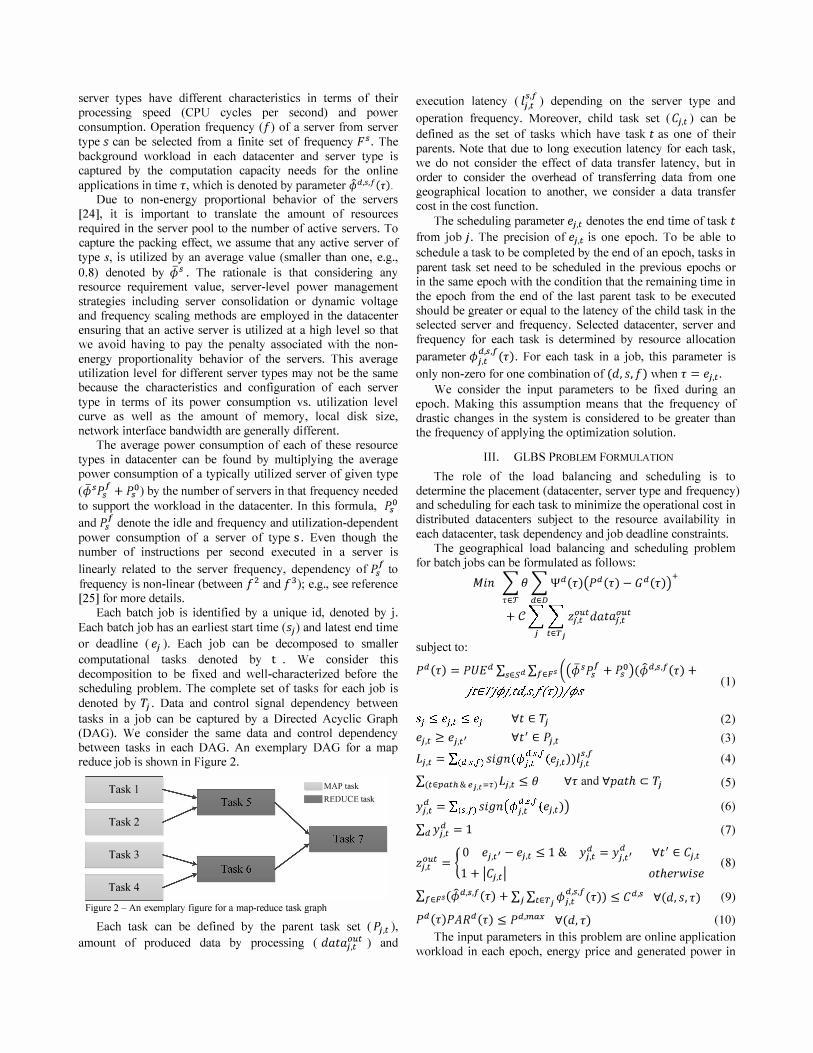
Possible execution times of a task can be determined by As Soon As Possible (ASAP) and As Late As Possible (ALAP) schedules of the DAG. As the names indicate, ASAP and ALAP schedules are the task schedules without any gap starting at Sj or ending at ej, respectively. For these schedules,
minimum If,! value for each task is considered as the latency of
executing the task. Each task can only be executed from its ASAP schedule time to its ALAP schedule time. Figure 3 shows an example of the ASAP and ALAP schedules for
Figure 2 DAG in which ej - Sj = 3 and minimum If,! is equal
to e for every task.
Task 1 Task 5
ASAP
Task 2 Task 7
Task 3 Task 6
Task 4
Sj ej Figure 3 - ASAP and ALAP schedules for Figure 2 DAG with ej - Sj = 3
In order to solve the GLBS problem using FDS technique, ITI instances of each datacenter (one for each epoch) and an instance of each task is created. Force in this system is defined between each task and datacenter instance that the task is assigned to and the parent and child tasks (if they exist). Each task needs to be assigned to one of the datacenter instances between ASAP and ALAP schedule of the task. These assignments are made in order to satisfy scheduling constraints for each job (constraint (2) to (5)).
In this setting, assigning a task to a datacenter instance creates a force with three terms. These terms represent the objective function and capacity constraints in the GLBS problem. The first term of the force represents the energy cost of the assignment. The second term of the force is between the task and dependent (child and parent) tasks and represents the communication cost between the tasks. The third term of the force represents the resource pressure in the assigned server type and power pressure in the assigned datacenter instance. This force term is captured by multiplying the allocated resource amount and power consumption of that assignment by negative exponential functions (e -X) of the remaining resource capacity in the selected server type and remaining peak power capacity in the assigned datacenter instance. Considering these
forces, minimizing the total force in FLBS setting is equivalent to minimizing the objective function of the GLBS problem subject to satistying the resource and scheduling constraints.
Starting from any feasible solution, we can identify the legal task instance movements (from an epoch and server type in a datacenter to another epoch and server type in a datacenter without violating the scheduling constraints) that results in reducing the force and execute them to reach a lower operational cost. The order to perform these movements affects the final results because changing a task assignment may change the forces applied to other task instances.
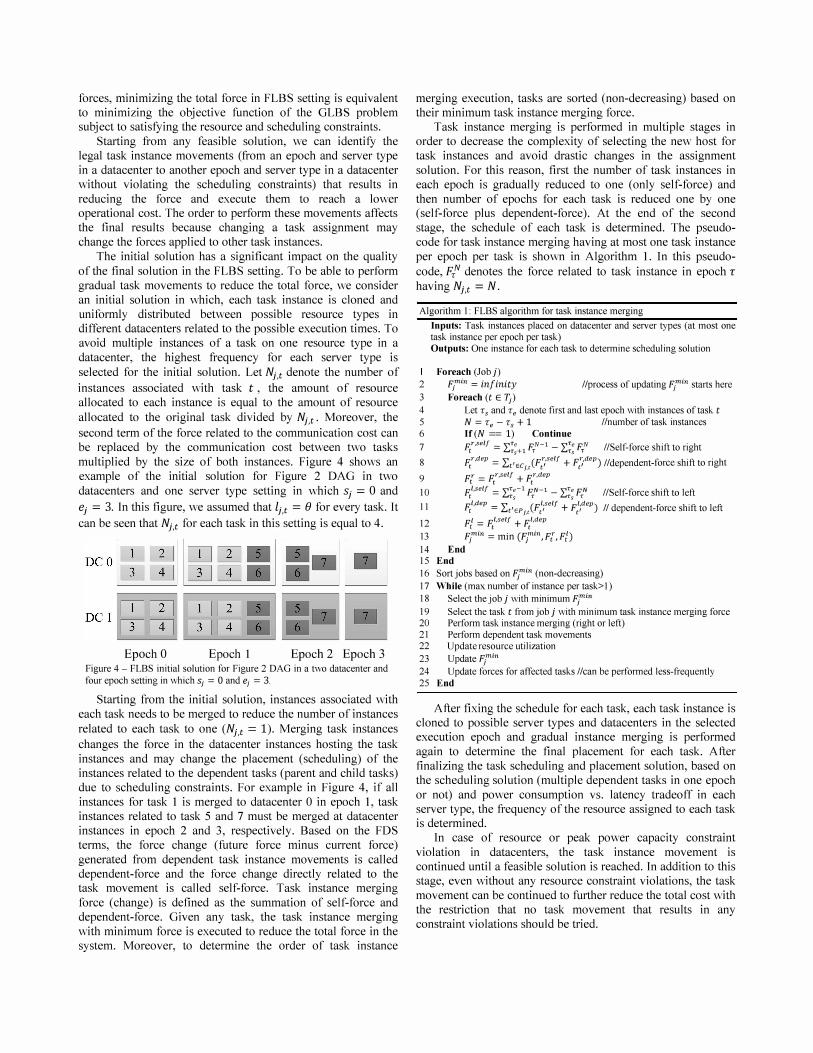
The initial solution has a significant impact on the quality of the final solution in the FLBS setting. To be able to perform gradual task movements to reduce the total force, we consider an initial solution in which, each task instance is cloned and uniformly distributed between possible resource types in different datacenters related to the possible execution times. To avoid multiple instances of a task on one resource type in a datacenter, the highest frequency for each server type is selected for the initial solution. Let Nj•t denote the number of instances associated with task t , the amount of resource allocated to each instance is equal to the amount of resource allocated to the original task divided by Nj•t. Moreover, the second term of the force related to the communication cost can be replaced by the communication cost between two tasks multiplied by the size of both instances. Figure 4 shows an example of the initial solution for Figure 2 DAG in two datacenters and one server type setting in which Sj = 0 and ej = 3. In this figure, we assumed that [j.t = e for every task. It
can be seen that Nj•t for each task in this setting is equal to 4.
Epoch 0 Epoch 1 Epoch 2 Epoch 3 Figure 4 - FLBS initial solution for Figure 2 DAG in a two datacenter and four epoch setting in which Sj = 0 and ej = 3.
Starting from the initial solution, instances associated with each task needs to be merged to reduce the number of instances related to each task to one (Nj•t = 1). Merging task instances changes the force in the datacenter instances hosting the task instances and may change the placement (scheduling) of the instances related to the dependent tasks (parent and child tasks) due to scheduling constraints. For example in Figure 4, if all instances for task 1 is merged to datacenter 0 in epoch 1, task instances related to task 5 and 7 must be merged at datacenter instances in epoch 2 and 3, respectively. Based on the FDS terms, the force change (future force minus current force) generated from dependent task instance movements is called dependent-force and the force change directly related to the task movement is called self-force. Task instance merging force (change) is defined as the summation of self-force and dependent-force. Given any task, the task instance merging with minimum force is executed to reduce the total force in the system. Moreover, to determine the order of task instance
merging execution, tasks are sorted (non-decreasing) based on their minimum task instance merging force.
Task instance merging is performed in multiple stages in order to decrease the complexity of selecting the new host for task instances and avoid drastic changes in the assignment solution. For this reason, first the number of task instances in each epoch is gradually reduced to one (only self-force) and then number of epochs for each task is reduced one by one (self-force plus dependent-force). At the end of the second stage, the schedule of each task is determined. The pseudocode for task instance merging having at most one task instance per epoch per task is shown in Algorithm 1. In this pseudocode, Fj' denotes the force related to task instance in epoch T having Nj,t = N. Algorithm I: FLBS algorithm for task instance merging
Inputs: Task instances placed on datacenter and server types (at most one task instance per epoch per task) Outputs: One instance for each task to determine scheduling solution
Foreach (Job j) 2 Fjmin = infinity Ilprocess of updating Fjmin starts here 3 Foreach (t E "0) 4 Let Ts and Te denote first and last epoch with instances of task t 5 N = Te - Ts + 1 Iinumber of task instances 6 If(N == 1) Continue 7 Ftr ,self = L;;+1
F.,N-l - L;; F,N IISelf-force shift to right
8 Ftr,dep = Lt'ECj.,(F?elf + F;"dep) Iidependent-force shift to right
9 Fi = Ftr.self + Ftr.dep 10 F/,sel{ = L�;-1 F:-1 - L�; F: IISelf-force shift to left
II F/,dep = Lt'EPj/F:;self + F:;dep) II dependent-force shift to left
12 Fi = F,1,Sel{ + F,l,dep 13 Fjmin = min CFr'n, Fi.Fi) 14 End 15 End 16 Sort jobs based on Fjmin (non-decreasing) 17 While (max number of instance per task> I ) 18 Select the job j with minimum Fjmin 19 Select the task t from job j with minimum task instance merging force 20 Perform task instance merging (right or left) 21 Perform dependent task movements 22 Update resource utilization 23 Update Fjmin 24 Update forces for affected tasks Ilcan be performed less-frequently 25 End
After fixing the schedule for each task, each task instance is cloned to possible server types and datacenters in the selected execution epoch and gradual instance merging is performed again to determine the final placement for each task. After finalizing the task scheduling and placement solution, based on the scheduling solution (multiple dependent tasks in one epoch or not) and power consumption vs. latency tradeoff in each server type, the frequency of the resource assigned to each task is determined.
In case of resource or peak power capacity constraint violation in datacenters, the task instance movement is continued until a feasible solution is reached. In addition to this stage, even without any resource constraint violations, the task movement can be continued to further reduce the total cost with the restriction that no task movement that results in any constraint violations should be tried.

V. DYNAMIC SOLUTION
The static solution to GLBS problem determines the task placement and scheduling solution for a big set of batch jobs in a long period of time, e.g. one day. This solution is based on the prediction of online application workload in each datacenter, energy price and green power generation in each epoch. These predictions are not lOO% accurate. So, the static solution to GLBS problem is not the best way of dealing with a dynamic system.
The implemented static solution has short run-time (in the order of a few minutes) with respect to practical duration of an epoch. Based on this observation, we propose a dynamic solution based on iteratively applying the static solution in the beginning of each epoch and scheduling the tasks in the first epoch and ignoring the placement and scheduling solution for the next epochs.
This approach is reasonable considering highly-accurate prediction of parameters in near-future which results in small probability of changes in task scheduling in current epoch. Moreover, due to less-accurate prediction of parameters in distant-future, it is not reasonable to apply the decision made in the current epoch to the distant-future epochs.
VI. SIMULATION RESULTS
To show the effectiveness of the proposed solutions for the GLBS problem, a simulation framework is implemented.
In this simulation framework, we considered a US-based cloud system that has five datacenters in California, Texas, Michigan, New York, and Florida. An arbitrary PUE factor between 1.1 and 1.3 is considered for each datacenter. Size of these datacenters ranges fTom 4,000 to 1,600 servers belonging to four different server types, selected from HP server types. Duration of epoch is set to one hour. The average utilization of servers is assumed to be 70%. A limited frequency set for each
server type is considered and p! in each server type is considered to be proportional to rzo4 [25]. Peak power capacity for each datacenter is set to 80% of the peak power consumption of the deployed servers. Based on the weather patterns, each datacenter has a combination of solar and wind power plant with power generation capacity of up to 20% of its peak power consumption. The renewable power generation changes during the day based on type of the power plant.
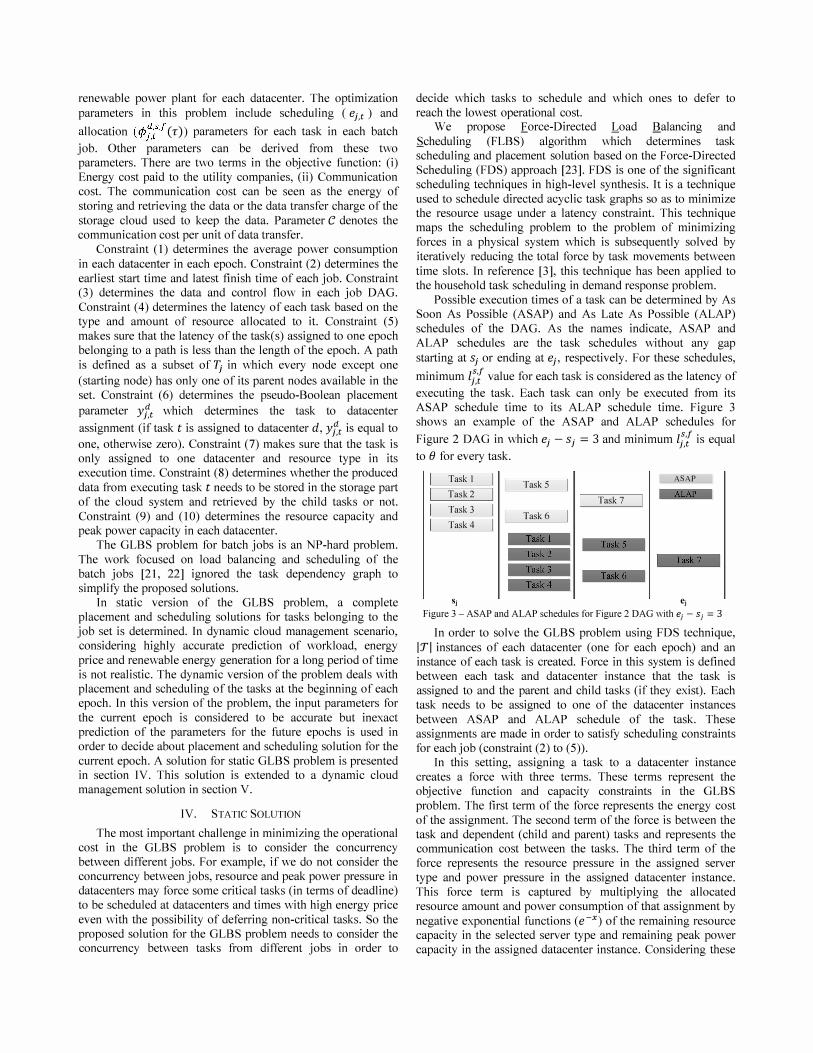
The average energy price in one day for each datacenter is set based on the reported average energy price [14] in datacenter's location. Dynamic energy price for each one of the datacenters is assumed to follow the dynamic energy pricing pattern in reference [26] related to 5/23/2013 with appropriate time shift and average energy price. Figure 5 shows the energy price pattern for the California datacenter with average energy price of 15.2 ¢ per KWhr.
"C'25 �20 � �15 �10 0;: Co
� 5 .
II I I I I I I II I I I I I I o:i 0
... � ... � �.,� ��,� b���"� �� ... "l· ...... � 1J-� '!-� f.� 4� �� <$� �� �� �� of.� ... <§'� ... ,!-� Time
Figure 5 - Energy price in California datacenter (time in PST)
We consider 24-hour long decision making in static GLBS problem. Based on population distribution in US, lOOK online applications are created in different time horizons and geographical locations. Application workload is changed according to the local time of its origination point. The application lifetime is set arbitrarily based on uniform distribution between one and 16 hours. The online application workload intensity, which is obtained by summing the resource requirement for the active online applications, is reported in Figure 6. Each online application is assigned to the nearest datacenters to its origination point. Moreover, online application workload is fairly distributed between server types in each datacenter considering the CPU cycles as the weight of each server type.
_ 6000 � 5000 � ·s �4000 r� � S 3000 � � § '; 2000 �" � -1000 z; �
/"" � /' "'-......
----=- � ....... ---
I 2 3 4 5 6 7 8 9 10 II 12 13 14 15 16 17 18 1920 21 22 23 24 Tim. (EST)
Figure 6 - The intensity of the online application workload as a function of time of the day
Batch jobs with different DAG and task characteristics are created to evaluate the proposed solutions. Depth of the created DAG for each job is between 3 and 5 and each DAG has 6 to 10 tasks. For each task, CPU cycle requirement and parallelization factor is generated arbitrarily. Moreover, an arbitrary ((0,1]) compatibility factor is generated for each task
and server type. 1ft is linearly proportional to CPU cycles and
inversely proportional to compatibility factor, frequency and parallelization factor. Compatibility factor, CPU cycles and parallelization factor for each task is selected based on a rule that the latency of completing the task in at least one of the server types should be less than 8. The amount of produced data for each task is also generated arbitrarily between 0 and 1GB. Communication cost parameter is set to 2¢ per GB data transfer based on Amazon EC2 pricing for data transfer between Amazon EC2 or S3 sites [27]. Start time for each batch job is selected arbitrarily between the first epoch and the last epoch minus the depth of the selected DAG for the job. End time is also arbitrarily selected between start time plus the depth of the selected DAG and the last epoch.
... 2500 � i -;; 2000 � � 1500 � � 1000 ... " � '-' 500
�
/ -......... /'
-
I 2 3 4 5 6 7 8 9 10 II 12 13 14 15 16 17 18 1920 21 22 23 24 Tim. (EST)
Figure 7 - The average workload intensity of the batch jobs as a function of time of the day
Different number of batch jobs is created for different parts of the simulation. To illustrate the workload intensity of generated batch jobs in this simulation setup, average resource requirement of lOK batch jobs as a function of time is shown in Figure 7. The average resource requirement for each batch job
in its active epoch (from Sj to ej) is calculated by dividing the summation of minimum resource requirement for its tasks by the number active epoch (ej - Sj + 1).
The baseline in our simulation for static solution is a greedy task placement and scheduling solution. In this solution, batch jobs are sorted (non-increasing) based on the summation of minimum resource requirement to perform all of the tasks belonging to '0. Starting from the job with the biggest resource requirement, the gap between start and end time is distributed evenly between the tasks and each task is assigned to the best available server type and datacenter in its scheduling window. This greedy static solution is also extended to a dynamic solution using a similar approach to the one presented in section V. Each comparison between FLBS and baseline method is the average results of at least ten tries of the same scenario with different randomly generated setup parameters.
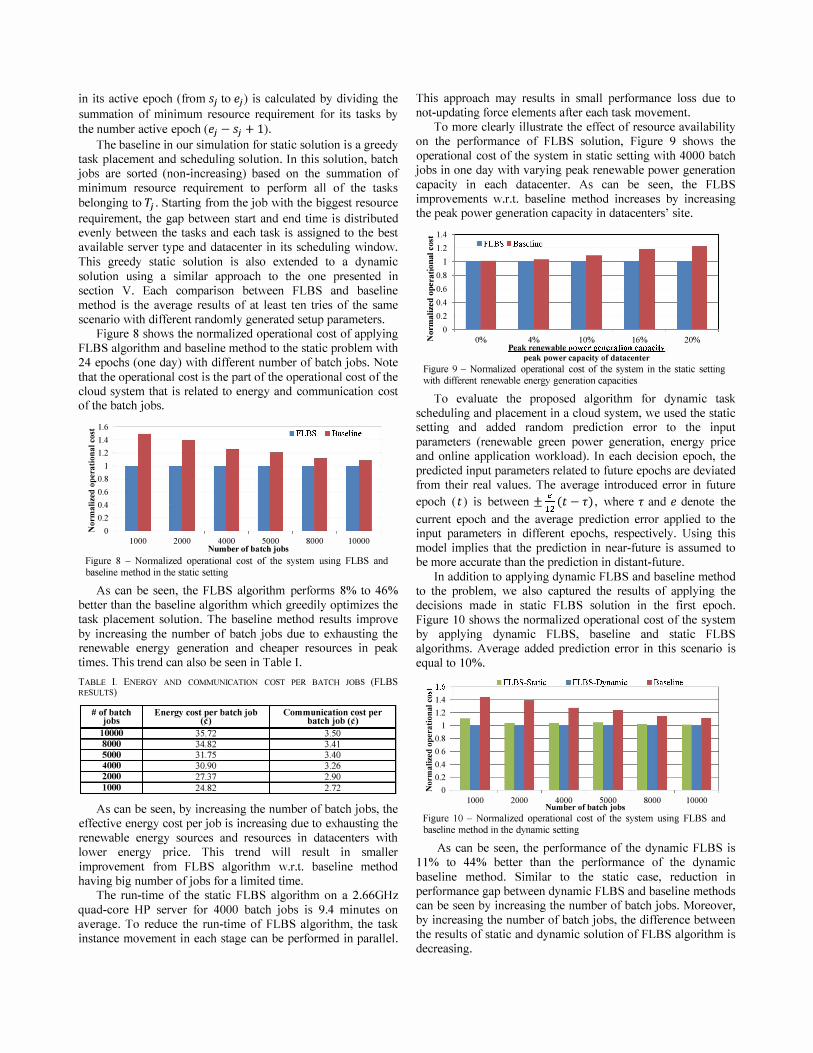
Figure 8 shows the normalized operational cost of applying FLBS algorithm and baseline method to the static problem with 24 epochs (one day) with different number of batch jobs. Note that the operational cost is the part of the operational cost of the cloud system that is related to energy and communication cost of the batch jobs.
�1.6 �---------------------------------------. 8 1.4 � 1.2 o .� 1 �O.8 o ] 0.6 " :; 0.4 E 0.2 o
Z 0 1000 2000 4000 5000 8000 10000 Number of batch jobs
Figure 8 - Nonnalized operational cost of the system using FLBS and baseline method in the static setting
As can be seen, the FLBS algorithm performs 8% to 46% better than the baseline algorithm which greedily optimizes the task placement solution. The baseline method results improve by increasing the number of batch jobs due to exhausting the renewable energy generation and cheaper resources in peak times. This trend can also be seen in Table I.
TABLE I. ENERGY AND COMMUNICATION COST PER BATCH JOBS (FLBS RESULTS)
# of batch Energy cost per batch job Communication cost per jobs (¢) batch job (¢) 10000 35.72 3.50 SOOO 34.82 3.41 SOOO 31.75 3.40 4000 30.90 3.26 2000 27.37 2.90 1000 24.82 2.72
As can be seen, by increasing the number of batch jobs, the effective energy cost per job is increasing due to exhausting the renewable energy sources and resources in datacenters with lower energy price. This trend will result in smaller improvement from FLBS algorithm W.r.t. baseline method having big number of jobs for a limited time.
The run-time of the static FLBS algorithm on a 2.66GHz quad-core HP server for 4000 batch jobs is 9.4 minutes on average. To reduce the run-time of FLBS algorithm, the task instance movement in each stage can be performed in parallel.
This approach may results in small performance loss due to not-updating force elements after each task movement.
To more clearly illustrate the effect of resource availability on the performance of FLBS solution, Figure 9 shows the operational cost of the system in static setting with 4000 batch jobs in one day with varying peak renewable power generation capacity in each datacenter. As can be seen, the FLBS improvements W.r.t. baseline method increases by increasing the peak power generation capacity in datacenters' site.
_ 1.4 -,--------------------, 3 1.2 +---"'-'-'''''''''-''-'''''''''''''''----------------] I o .� 0.8 �06 ] 0.4 -; 0.2 � 0
Z 0% 4% 10% 16% Peak renewable power generation capacity
peak power capacity of datacenter
20%
Figure 9 - Nonnalized operational cost of the system in the static setting with different renewable energy generation capacities
To evaluate the proposed algorithm for dynamic task scheduling and placement in a cloud system, we used the static setting and added random prediction error to the input parameters (renewable green power generation, energy price and online application workload). In each decision epoch, the predicted input parameters related to future epochs are deviated from their real values. The average introduced error in future
epoch (t) is between ± :2 (t - T), where T and e denote the
current epoch and the average prediction error applied to the input parameters in different epochs, respectively. Using this model implies that the prediction in near-future is assumed to be more accurate than the prediction in distant-future.
In addition to applying dynamic FLBS and baseline method to the problem, we also captured the results of applying the decisions made in static FLBS solution in the first epoch. Figure 10 shows the normalized operational cost of the system by applying dynamic FLBS, baseline and static FLBS algorithms. Average added prediction error in this scenario is equal to 10%.
�1.6 � ____ �.�F�L� B�S-�St�at�ic��.�����ic ___ .�Ba�s�el�in�e ____ �
13 1.4 +---_.t-----,...-----------------------------i ] 1.2 +---_.�---1�----��--�.r--------------i � 1 �O.8 o ] 06 :; 0.4 E 0.2 o
Z 0 1000 2000 4000 5000 8000 10000 Number of batch jobs Figure 10 - Normalized operational cost of the system using FLBS and baseline method in the dynamic setting
As can be seen, the performance of the dynamic FLBS is 11 % to 44% better than the performance of the dynamic baseline method. Similar to the static case, reduction in performance gap between dynamic FLBS and baseline methods can be seen by increasing the number of batch jobs. Moreover, by increasing the number of batch jobs, the difference between the results of static and dynamic solution of FLBS algorithm is decreasing.
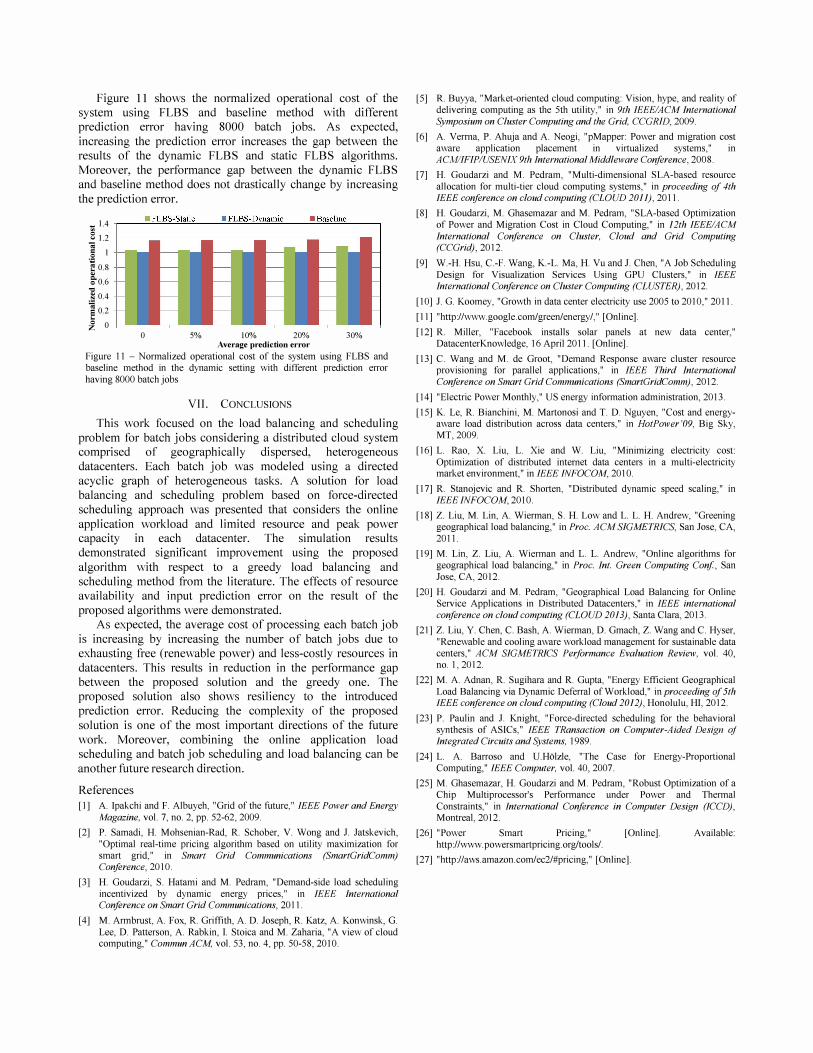
Figure 11 shows the normalized operational cost of the system using FLBS and baseline method with different prediction error having 8000 batch jobs. As expected, increasing the prediction error increases the gap between the results of the dynamic FLBS and static FLBS algorithms. Moreover, the performance gap between the dynamic FLBS and baseline method does not drastically change by increasing the prediction error.
_ 1.4 ,---����----""����'------'���-----, 8 12 +------0=----=0------==----
-; S 1
... � 0.8 §"0.6
.., .� 0.4 � 02 � 0
o 5% 10% 20% Average prediction error
30% Figure II - Normalized operational cost of the system using FLBS and baseline method in the dynamic setting with different prediction error having 8000 batch jobs
VII. CONCLUSIONS
This work focused on the load balancing and scheduling problem for batch jobs considering a distributed cloud system comprised of geographically dispersed, heterogeneous datacenters. Each batch job was modeled using a directed acyclic graph of heterogeneous tasks. A solution for load balancing and scheduling problem based on force-directed scheduling approach was presented that considers the online application workload and limited resource and peak power capacity in each datacenter. The simulation results demonstrated significant improvement using the proposed algorithm with respect to a greedy load balancing and scheduling method from the literature. The effects of resource availability and input prediction error on the result of the proposed algorithms were demonstrated.
As expected, the average cost of processing each batch job is increasing by increasing the number of batch jobs due to exhausting free (renewable power) and less-costly resources in datacenters. This results in reduction in the performance gap between the proposed solution and the greedy one. The proposed solution also shows resiliency to the introduced prediction error. Reducing the complexity of the proposed solution is one of the most important directions of the future work. Moreover, combining the online application load scheduling and batch job scheduling and load balancing can be another future research direction.
References [I] A Jpakchi and F. Albuyeh, "Grid of the future," IEEE Power and Energy
Magazine, vol. 7, no. 2, pp. 52-62,2009.
[2] P. Samadi, H. Mohsenian-Rad, R. Schober, V. Wong and J latskevich, "Optimal real-time pricing algorithm based on utility maximization for
smart grid," in Smart Grid Communications (SmartGridComm) Conforence,2010.
[3] H. Goudarzi, S. Hatami and M. Pedram, "Demand-side load scheduling incentivized by dynamic energy prices," in IEEE International Conforence on Smart Grid Communications, 2011.
[4] M. Armbrust, A Fox, R. Griffith, A. D. Joseph, R. Katz, A Konwinsk, G. Lee, D. Patterson, A Rabkin, L Stoica and M. Zaharia, "A view of cloud computing," Commun ACM. vol. 53, no. 4, pp. 50-58, 2010.
[5] R. Buyya, "Market-oriented cloud computing: Vision, hype, and reality of delivering computing as the 5th utility," in 9th IEEEIACM International Symposium on Cluster Computing and the Grid, CCGRlD,2009.
[6] A Verma, P. Ahuja and A. Neogi, "pMapper: Power and migration cost aware application placement in virtualized systems," in ACMJIFIPIUSENIX9th International Middleware Conference, 2008.
[7] H. Goudarzi and M. Pedram, "Multi-dimensional SLA-based resource allocation for multi-tier cloud computing systems," in proceeding of 4th IEEE conference on cloud computing (CLOUD 2011),2011.
[8] H. Goudarzi, M. Ghasemazar and M. Pedram, "SLA-based Optimization of Power and Migration Cost in Cloud Computing," in 12th 1EEEIACM International Conference on Cluster, Cloud and Grid Computing (CCGrid),2012.
[9] W.-H. Hsu, C.-F. Wang, K-1. Ma, H. Vu and J Chen, "A Job Scheduling Design for Visualization Services Using GPU Clusters," in IEEE International Conference on Cluster Computing (CLUSTER), 2012 .
[10]1 G Koomey, "Growth in data center electricity use 2005 to 2010," 2011.
[II] .. http://www.google.com/green/energy/ ... [Online].
[12] R. Miller, "Facebook installs solar panels at new data center," DatacenterKnowledge, 16 April 201 1. [Online].
[13] C. Wang and M. de Groot, "Demand Response aware cluster resource provisioning for parallel applications," in IEEE Third International Conference on Smart Grid Communications (SmartGridComm), 2012.
[14] "Electric Power Monthly," US energy information administration, 2013.
[15] K Le, R. Bianchini, M. Martonosi and T. D. Nguyen, "Cost and energyaware load distribution across data centers," in HotPower'09, Big Sky, MT,2009.
[16] L Rao, X. Liu, L Xie and W. Liu, "Minimizing electricity cost: Optimization of distributed internet data centers in a multi-electricity market environment," in IEEE INFOCOM, 2010.
[17] R. Stanojevic and R Shorten, "Distributed dynamic speed scaling," in IEEE INFOCOM, 2010.
[18] Z. Liu, M. Lin, A Wierman, S. H. Low and 1. L H. Andrew, "Greening geographical load balancing," in Proc. ACM S1GMETRlCS, San Jose, CA, 2011.
[19] M. Lin, Z. Liu, A. Wierman and 1. 1. Andrew, "Online algorithms for geographical load balancing," in Proc. Int. Green Computing Con!, San Jose, CA, 2012.
[20] H. Goudarzi and M. Pedram, "Geographical Load Balancing for Online Service Applications in Distributed Datacenters," in IEEE international conference on cloud computing (CLOUD 2013), Santa Clara, 2013.
[21] Z. Liu, Y. Chen, C. Bash, A Wierman, D. Gmach, Z. Wang and C. Hyser, "Renewable and cooling aware workload management for sustainable data
centers," ACM S1GMETRICS Performance Evaluation Review, vol. 40, no. 1,2012.
[22] M. A Adnan, R Sugihara and R Gupta, "Energy Efficient Geographical Load Balancing via Dynamic Deferral of Workload," in proceeding of 5th IEEE conference on cloud computing (Cloud 2012), Honolulu, HI, 2012.
[23] P. Paulin and J Knight, "Force-directed scheduling for the behavioral synthesis of ASICs," IEEE TRansaction on Computer-Aided Design oj Integrated Circuits and Systems, 1989.
[24] L A Barroso and U.Holzle, "The Case for Energy-Proportional Computing," IEEE Computer, vol. 40, 2007.
[25] M. Ghasemazar, H. Goudarzi and M. Pedram, "Robust Optimization of a Chip Multiprocessor 's Performance under Power and Thermal Constraints," in International Conference in Computer Design (ICCD), Montreal,2012.
[26] "Power Smart Pricing," [Online]. Available: http://www.powersmartpricing.org/tools/.
[27] ' 'http://aws.amazon.com/ec2/#pricing,' ' [Online l