forced entrepreneurs...entrepreneur in the sample, we collect firm-level information including...
TRANSCRIPT

Forced Entrepreneurs
Isaac Hacamo and Kristoph Kleiner †
January 2020
Abstract
How do labor market shocks impact the rate and quality of entrepreneurship? Ana-lyzing the employment histories of 650,000 workers, we document graduating collegeduring a period of high local unemployment increases entry to entrepreneurship. How-ever, based on multiple measures of success, including survival, growth, innovation,and venture capital, recession-driven entrepreneurs are equal to or more capable thanvoluntary entrepreneurs. Directly surveying a representative sample of workers onlottery-choice preferences, we confirm labor shocks encourage risk-averse individualstowards entrepreneurship. By documenting a novel channel relating business cyclefluctuations to entrepreneurial activity, we find labor shocks unlock entrepreneurialpotential among waged workers.
†Finance Department, Kelley School of Business, Indiana University. Address: 1309 E 10th St, 47405,Bloomington, IN. Email: [email protected] and [email protected]. A previous version of the papercirculated as “Finding Success in Tragedy: Forced Entrepreneurs after Corporate Bankruptcy”. We thank ourdiscussants John McConnell, Paige Ouimet, Jessica Jeffers, Tolga Caskurlu, and Murat Tasci, as well as HeitorAlmeida, Fernando Anjos, Brian Ayash, Matt Billett, Nicolas Bollen, Diana Bonfim, Igor Cunha, AndrewEllul, Miguel Ferreira, Peter Haslag, Mathias Hoffmann, Benjamin Golez, Eitan Goldman, Nandini Gupta,Bharadwaj Kannan, Pedro Matos, Chris Parsons, Noah Stoffman, Antoinette Schoar, Scott Smart, Amit Seru,Harry Turtle, Wenyu Wang, and Joshua T. White for very helpful suggestions. We also thank seminar andconference participants at the Bank of Portugal, Cal Poly San Luis Obispo, Colorado State University, DardenEntrepreneurship and Innovation Conference, European Finance Association Meetings, Federal DepositInsurance Corp, Financial Intermediation Research Society, Indiana University, ITAM Finance Conference,Mitsui Finance Symposium, NOVA School of Business and Economics, University of Virginia, Universityof Zurich, Vanderbilt University, and Wabash River Finance Conference in Illinois for their comments andsuggestions.

”Nobody offered me a job, I was probably too proud to go look for one, and I said well why not
start your own company.” —Michael Bloomberg
1 Introduction
Declining labor market opportunities leave lasting scars on the workforce. Displaced
workers are more likely to permanently exit the workforce (Yagan, 2019) and face lower
wages even years after displacement (Jacobson et al., 1993); workers who enter the la-
bor market during recessions experience long-term negative wage effects (Kahn, 2010).
Distressed labor markets may then push job seekers to pursue alternative career paths
such as entrepreneurship, as the opportunity cost to engage in entrepreneurial endeavors
may fall during distressed times. This hypothesis has empirical support as one-quarter of
Americans would create a new firm if not for the associated income risk (Gallup, 2014).
Perhaps less clear is whether workers forced into entrepreneurs by distressed labor
create low- or high-quality firms. As the returns to entrepreneurship are highly-skewed
to the superstar entrepreneurs,1 understanding the relationship between labor market
opportunities and firm creation ultimately depends on identifying which workers select into
entrepreneurship during distressed times. When individuals enter entrepreneurship based
on their expected performance, those with the greatest ability may have already selected
into entrepreneurship prior to any labor shocks (Lucas Jr, 1978).2 Forced entrepreneurs would
then disproportionally lead to the creation of low-quality firms.
Alternatively, when individuals are unable to observe their potential as an entrepreneur,3
local economic shocks may have a limited impact on the rate of entrepreneurial success. For
instance, individuals may instead select into entrepreneurship based on risk preferences
due to the risks intrinsic to entrepreneurial endeavors—including a significant failure rate1For instance, Shane (2008) estimates over fifty percent of new firms fail within five years, while 0.03
percent achieved more than $100 million in sales.2A separate view argues entrepreneurs who start during recessions are likely to face lower demand and
experience lower growth (Parker, 2009)3For instance, a large literature finds workers overstate their future abilities as an entrepreneur (Astebro
et al., 2007; Camerer and Lovallo, 1999; Holm et al., 2013)
1

(Hall and Woodward, 2010), low compensation compared to waged employment (Hamilton,
2000), and high exposure to nondiversified investments (Moskowitz and Vissing-Jørgensen,
2002). Assuming risk aversion is orthogonal to ability, declining labor opportunities will
then increase the rate of entrepreneurship without any effects on the average quality
of new firms (Kihlstrom and Laffont, 1979). Put simply, many individuals with great
entrepreneurial potential may be currently employed as waged workers.
This paper evaluates whether labor market shocks impact the rate and composition
of entrepreneurship. We find college educated individuals graduating in a weak local
labor market are not only more likely to be underemployed, but also more likely to start
a firm. We develop several measures of entrepreneurial success based on survival rates,
employment size, and the likelihood of receiving venture capital funding, being acquired,
producing patents, and successfully completing an IPO. Using these measures and their
time series when available, we find that businesses formed by entrepreneurs entering
weak labor markets perform identically, and sometimes better, than those who enter strong
labor markets. By surveying a representative sample of individuals in our dataset on
lottery-choices, we find that entrepreneurs graduating into a declining economy are more
risk and ambiguity averse despite no difference in their actual quality. As a result, our
findings support the Kihlstrom and Laffont (1979) view of entrepreneurship based on
risk preferences, while rejecting the argument that workers select into entrepreneurship
based on ability (Lucas Jr, 1978). Given innovative entrepreneurs have the potential to
dramatically enhance the productivity of firms and, consequentially, economic growth
(Aghion et al., 1998; Baumol, 1968; Lucas, 1988; Schoar, 2010), transitory labor shocks may
have long-term effects on local economic growth through the entrepreneurship channel.
To date, a large-scale analysis of the workers entering the entrepreneurial sector in the
U.S. has proved challenging due to a lack of high-quality data. Our particular analysis
requires access to detailed work histories on both salaried employees and entrepreneurs,
and measures of firm success over the life cycle of each new establishment, which have not
previously been available. We overcome this obstacle by developing a new hand-collected
2

dataset that merges individual employment histories obtained from LinkedIn with firm-
level data from Crunchbase, LinkedIn, and the USPTO. LinkedIn includes employment
histories for over 600 million users in over 200 countries.4 The employment histories come
from self-reported resumes that detail the career path of the individual and offer a snapshot
of each worker in any given year.
Our data sample covers detailed profiles for roughly 640,000 skilled U.S. workers. While
we collect workers from over 2,200 undergraduate institutions, we overdraw students from
highly-selective colleges and universities to guarantee entrepreneurs across the distribution
of talent, particularly those who have the potential to be superstar and transformational
founders. For instance, Massachusetts Institute of Technology, Stanford University, North-
western University, Cornell University, University of California at Berkeley, and University
of Michigan each graduate one percent or more of the employee sample. Similar to panels
of employee-employer linked data used in prior research, our data includes employment
histories over long periods of time (Jacobson et al., 1993). However, in contrast to alternative
datasets, LinkedIn includes information on small start-ups and self-employment (rather
than exclusively incorporated firms) and occupation (necessary to identify firm founders).
Within our employee sample, we identify over 35,000 founders of firms. As our dataset
covers individuals graduating from even the top undergraduate institutions, our sample
includes highly-successful entrepreneurs including the co-founders of Dropbox, Yelp,
Youtube, Khan Academy, Instagram, Square, Paypal, Airbnb, among others—141 startups
in our sample completed successfully an IPO. For each entrepreneurial endeavor we develop
a range of measures of entrepreneurial quality including (i) firm survival, (ii) current
employment, (iii) innovation, (iv) access to venture capital financing, and (v) exiting the
market through an acquisition or IPO. In addition, we directly survey a subset of the
individuals graduating in both recession and non-recession periods to develop measures4In contemporaneous work, Jeffers (2018) evaluates the effects of non-compete clauses on the rate of
entrepreneurship, while Gupta and Hacamo (2018) examine whether the growth of the financial sector led toa reduction in the number of high-talent students starting firms.
3

of risk and ambiguity preferences based on lottery-choices, as well as alternate behavioral
traits.
To study entry to entrepreneurship, our empirical design exploits exogenous time
of entry in the labor market of individuals who follow a very similar academic path.
Specifically, we compare a worker graduating from a U.S. undergraduate institution to a
separate student of the same gender graduating from the same institution with the same
major, but in the prior year. As college graduation dates are determined primarily based
on the year when students were born, the characteristics of the student population are
otherwise uncorrelated with the labor market opportunities at the time of graduation
(Kahn, 2010); therefore, we are able to exploit time-series variation in the year of college
graduation. In addition, as a large fraction of undergraduate students are in-state residents
(Wozniak, 2018) and are employed in-state following graduation (Foote, 2019), we are
able to exploit cross-sectional variation in the state-level labor markets—our identification
assumption is that the variation in unemployment rates in two consecutive graduation years
cannot be anticipated by students when they make their college choice.5 Our framework is
motivated by recent evidence demonstrating the cost of graduating in poor labor markets
(Altonji et al., 2016; Bell and Blanchflower, 2011; Liu et al., 2016; Moreira, 2016; Oreopoulos
et al., 2012; Oyer, 2006, 2008; Schoar and Zuo, 2017).6 Lastly, to examine how labor shocks
affect the composition of entrepreneurship, we compare the distribution of firm outcomes
of those who entered the labor market in good versus bad times.
Turning to our data, we first demonstrate that a 10 percentage point increase in the
state-level unemployment rate is associated with a (i) 4 percentage points decrease in
likelihood of employment with a top consulting or finance firm, (ii) 10 percentage points5As of 2018 the majority of students enrolled in four-year colleges in the US are within an hour’s drive
from home. In addition, the U.S. Census found 55% of recent graduates from the University of Wisconsingained employment in state, compared to 66% of graduates from the University of Colorado and 80% ofgraduates from the University of Texas.
6For instance, Oyer (2008) evaluates Stanford MBA graduates and estimates that not entering the investmentbanking industry due to poor market conditions leads to a decrease in lifetime earnings of $1.5 - $5 million.Given nearly 100,000 of the workers in our sample graduates from a top twenty undergraduate institution,we believe this measure is applicable to our own sample.
4

decline in the likelihood of employment with a firm in the Russell 1000 Index, and (iii)
5 percentage points decrease in a high-wage industry. In addition, weak labor markets
negatively impact all workers, including those who graduate from the most prestigious U.S.
universities. We can therefore causally exploit differences in graduation year as a shock to
labor market opportunities.
In our baseline analysis, we estimate a 10 percentage point increase in the state-level
unemployment rate increases the likelihood of entering entrepreneurship by 2.1 percentage
points compared to students of the same gender graduating from the same institution and
major in the prior year. Given a baseline entrepreneurship rate of 2.2% at graduation, a ten
percentage point increase in unemployment effectively doubles the rate of entrepreneurship
despite these areas experiencing lower consumer demand and decreased access to financing
(Hurst and Lusardi, 2004; Parker, 2009). In addition, as differences in entrepreneurship
rates remain steady years after graduation, transitory labor shocks result in the creation
of firms that would otherwise not exist in the economy. These results suggest that the
declines in firm creation during recessions would have been even larger in the absence of
this labor channel. Overall, our pseudo difference-in-difference strategy validates the role of
labor market opportunities as a driver of entrepreneurship.
We next examine whether labor shocks affect the entry of relevant firms. For each
entrepreneur in the sample, we collect firm-level information including industry, survival,
and current employment from Linkedin.7 Among the firms in our sample, 24% remain in
business as of 2019; among the those still in business the average firm has 21 employees.
We also match our new firms with venture capital data from Crunchbase and find 15%
receive venture capital—a rate nearly five times higher than than the average new firm in
the economy (Robb and Robinson, 2012)—and 4.5% were eventually acquired. We also
merge our sample with data provided by the USPTO, and verify that 6% of the firms in our
sample receive at least one patent. We return to our empirical framework and confirm that7To measure current employment for a given firm, we count every user on Linkedin that reports to be
working for the firm.
5

an increase in the local unemployment rate increases the rate of (i) large employer firms,
(ii) venture-backed firms, (iii) patent-holding firms and (iii) acquired firms. Due to the size
and survival of the firms in our sample, these results suggest that forced entrepreneurship
may partially alleviate the initial job losses of economic recessions.
Given temporary shocks to the labor market increase the rate of entrepreneurship,
the next question is which workers enter entrepreneurship. We hypothesize labor market
shocks may lead to lower quality new firms when workers sort into entrepreneurship base
on their actual or perceived entrepreneurial ability (Lucas Jr, 1978). To test this hypothesis,
we compare the ex-post success of entrepreneurial endeavors across ten separate measures
of firms as measured within 5 years after graduation from college or determined today.
Compared to firms started during periods of low local unemployment, we find forced
entrepreneurs have the same employment size, and identical probability of being acquired
or successfully completing an IPO. Strikingly, firms started by entrepreneurs who entered
the labor market during distressed labor markets are actually more likely to survive, obtain
venture capital financing, or produce a patent. These results are similar for entrepreneurs
starting a firm within two years of graduation, and also for those who started firms after
1998 and prior to 2005. All together, we find extremely limited evidence that workers facing
poor labor opportunities start lower quality firms on average.
To better explain these findings, we replicate our analysis on a subset of workers espe-
cially capable of entrepreneurial success. Specifically, we focus on workers graduating from
twenty of the most selective undergraduate institutions in the U.S. as we find entrepreneurs
from these college are significantly more likely to start high-quality firms relative to the rest
of the sample.8 We offer four findings. First, analyzing nearly 100,000 elite workers, we find
that individuals graduating from selective institutions continue to suffer increased rates
of underemployment after declining labor markets. Second, in response to a local labor
market, we find these workers are more likely to enter entrepreneurship than workers who8Our sample of twenty most selective colleges include University of Chicago, Harvard University,
Columbia University, Stanford University, Princeton, CalTech, UC Berkeley, MIT, Yale University, amongothers.
6

graduate from non-elite colleges. Third, graduates from the most prestigious universities
are more likely to create successful firms as measured by employment, survival, VC funding,
patent creation, and likelihood of being acquired. Fourth, we find no evidence that workers
from top institutions start worse firms when graduating in poor labor markets. Overall,
the results suggest that local labor shocks do not decrease the proportion of workers with
high ex-ante potential from entering entrepreneurship.
According to our results, local labor shocks increase the rate of entrepreneurship with no
effect on the rate of entrepreneurial quality. One possible explanation for this discrepancy
is that rather than ability, workers sort into entrepreneurship based on risk-aversion or
ambiguity aversion (Kihlstrom and Laffont, 1979). Under this hypothesis, local labor shocks
will then promote entrepreneurship among more risk-averse individuals without reducing
the likelihood of survival and growth. To test this prediction, we survey a representative
sample of over 1,100 entrepreneurs and non-entrepreneurs from our dataset. Following
the literature, we present lottery choices to participants and infer their risk- and ambiguity-
aversion based on their answers. We also pose several questions to infer their overconfidence
and optimism.
Analyzing these novel data, we present four findings. First, we confirm that even after
controlling for observable differences of ability, an increase in the state unemployment
rates increases the proportion of risk-averse and ambiguity-averse entrepreneurs.9 Second,
we argue the results on risk/ambiguity preferences are unique selection factor as we fail to
find differences in other behavioral factors including confidence and optimism. Third, we
argue risk-aversion is not impacted by graduating in a recession as we find no evidence
that non-entrepreneurs graduating in poor labor markets hold a lower tolerance for risk
and ambiguity. Fourth, we verify that on average entrepreneurs are more tolerant of risk
and ambiguity compared to the non-entrepreneurs in the sample.9In addition, we control for other behavioral characteristics of entrepreneurs, namely, entrepreneurial and
non-entrepreneurial overconfidence, and economic and non-economic optimist.
7
Overall, our results detail the prolonged employment effects of transitory aggregate
labor shocks on the rate and composition of entrepreneurship. While these findings suggest
there is a supply of potential entrepreneurs in the workforce today, this does not imply
policies should force workers out of waged employment and towards entrepreneurial en-
deavors. Rather, as workers forced into entrepreneurship due to declining job opportunities
are not worse entrepreneurs, our results offer support for policies promoting entrepreneur-
ship within economically-depressed communities. In particular, because workers appear
to sort into entrepreneurship based on risk preferences, policies that minimize the down-
side of entrepreneurship may be particularly effective in facilitating the underemployed
workforce towards firm creation.
2 Review of the Literature
Our paper contributes to four separate literatures: (i) the relationship between labor markets
and entrepreneurship, (ii) the interaction between business cycles and entrepreneurship,
(iii) the risk preferences of entrepreneurs, and (iv) the role of labor policies in promoting en-
trepreneurship. In regards to the first, Evans and Leighton (1989) and Evans and Leighton
(1990) find that unemployed workers are twice as likely to transition to self-employment,
while Farber (1999) argues individuals are less likely to enter into self-employment fol-
lowing a layoff. More recently, Babina (2015) evaluates linked employee-employer data
from the Census to document that financially-distressed firms are at risk of losing workers
to entrepreneurship or existing start-ups.10 Although understanding the impact on the
quality of entrepreneurship is the chief contribution of our paper, we contribute to this
literature by (i) focusing on a sample of individuals who have the potential to start trans-
formational and superstar firms, and (ii) considering an alternate identification strategy
that exploits time-variation in the labor market facing recent college graduates. By directly
comparing same-gender students graduating from the same institution and academic10More generally, Baghai et al. (2015) argue that firms lose their most talented employees during periods of
financial distress.
8

major, but in consecutive years, we show that adverse local labor markets increase the rate
entrepreneurship.
A second literature studies the relationship between business cycles and entrepreneur-
ship. Moscarini and Postel-Vinay (2012) documents that large firms exhibit a more pro-
nounced negative correlation between net job creation and the unemployment rate. In
contrast, Fort et al. (2013) claim that, since the gap between the net job creation rate of young
(small) and old (large) businesses shrinks during downturns, younger (and smaller) busi-
nesses are more sensitive to business cycle shocks. In line with this evidence, Moreira (2016)
shows that firms born in downturns start and remain small over their entire lifecycle.11
Our paper contributes to this literature by offering an alternate channel relating business
cycle fluctuations to entrepreneurial activity. Our findings suggest that the declines in
firm creation during recessions would have been even larger in the absence of this labor
channel.
A third literature examines the empirical link between risk or ambiguity preferences
and firm creation (Hall and Woodward, 2010; Knight, 1921). To date, however, the empirical
evidence that risk or ambiguity aversion is a primary determinant of entry to entrepreneur-
ship is mixed and may depend on the particular methodology (Parker, 2009). For instance,
Hvide and Panos (2014) find that individuals investing in the stock market are more likely
to be entrepreneurs; similarly, Ahn (2010) and Cramer et al. (2002) estimate lower risk
aversion predicts entrepreneurship. In contrast, (Holm et al., 2013) and Koudstaal et al.
(2015) show that entrepreneurs are no more likely to make risky choices than other workers
in an experimental setting.12 By combining survey data with the empirical framework
discussed above, we introduce a new methodology to confirm the relationship between
risk/ambiguity aversion and entry to entrepreneurship. Our result are bolstered by our
findings that employment shocks do not (i) impact the success rate of entrepreneurship,11In related work, Decker et al. (2014) show a declining trend in the last three decades on the share of US
employment accounted for by young firms.12For a more complete discussion of the literature, we refer readers to Astebro et al. (2014).
9

(ii) lead less confident or optimistic individuals to enter entrepreneurship, or (iii) alter the
risk preferences of workers.
By combining the three literatures above, we also contribute to a recent literature
evaluating the impacts of labor policies on the level and composition of entrepreneurship.
For instance, Gottlieb et al. (2016) find that a Canadian reform extending job-protected
leave to recent mothers increased entrepreneurship by 1.9 percentage points. In another
recent paper, Hombert et al. (2019) evaluate the implications of a French policy reform that
provided downside insurance to eligible unemployed workers who enter entrepreneurship.
They find the reform, which provides an insurance of 2000 euros a year for up to three years,
significantly increases entrepreneurship, primarily self-employment, without worsening
the quality of new entrants. However, whether policies impact the proportion of successful
entrepreneurial endeavors is less clear from this analysis, as small financial incentives may
not be enough to change the career paths of highly talented employees.13,14 To overcome
these limitations, we instead examine shocks to labor market opportunities, which can lead
to a large and long-lasting negative effect on wages, among even highly skilled workers.15
As we find no evidence that labor shocks impact the average quality of new firms, our
findings offer new support for policies minimizing the downside of entrepreneurship even
among the highly-talented workforce.
3 Data
We begin this section by detailing the data sources for our analysis, particularly the data
from LinkedIn, Crunchbase, and USPTO. We then summarize: (i) the complete LinkedIn13Specifically, while their paper focuses primarily on self-employment, we focus more on employer firms:
thirteen percent of the firms in our sample receive venture capital financing, nearly five percent are acquired,and 0.4 percent enter an initial public offering.
14Our sample includes the co-founders of Dropbox, Yelp, Youtube, Khan Academy, Instagram, Square,Paypal, Airbnb, among others.
15Oyer (2008) illustrates how weak labor markets may have large effects on earned wages. He evaluatesStanford MBA graduates and estimates that not entering the investment banking industry due to poor marketconditions leads to a decrease in lifetime earnings of $1.5 - $5 million. Given nearly 100,000 of the workersin our sample graduates from a top twenty undergraduate institution, we believe this measure is likelyapplicable to our own sample.
10

database, (ii) the subset of the workers included in our estimation, (iii) their prior under-
graduate institutions including local economic conditions, (iv) the new firms founded by
the workers in the sample, and (v) survey responses from a representative sample of the
population.
3.1 Data Sources
Online Business Networking Service Data. Our dataset is constructed from LinkedIn,
the largest online business networking service worldwide. LinkedIn includes employment
histories for over 600 million users in over 200 countries, including 160 million U.S. users,
suggesting that a large fraction of the U.S. workforce uses LinkedIn.16 Individuals self-report
their resumes, including educational background and employment history. Educational
background includes information on each degree, school attended, and, for some users,
their major. The history of employment includes the title, full name of the firm, start and
end dates, and, in many cases, the detailed job description and location. All users report
their current industry and current location. Users of this website have an incentive to
keep their profiles up to date since the site is valuable for professional networking: many
employers currently use it to recruit employees, either by posting job ads or through direct
headhunting.
To document the coverage of the full sample of LinkedIn, we match LinkedIn industry
categories to the industry definitions from the Bureau of Economic Analysis. We then
determine which industries are overrepresented and underrepresented in the complete
LinkedIn database. We find that all two-digit NAICS Industry Codes are represented
in the database. According to Figure 1, most workers in (i) professional services, (ii)
financial services, and (iii) information have a profile. In contrast, LinkedIn understates
the employment size in (i) construction, (ii) trade, transportation, and utilities, and (iii)
agriculture and mining. Importantly, more than 50% of the labor force in any industry uses
LinkedIn.16We note a portion of the 160 million US users may no longer, be in the labor force.
11

A separate concern is that workers may only periodically update LinkedIn profiles,
leading to the overstatement of job spans in our data. To assess the validity of this concern,
we compare in Figure A1 the average job tenure rates of workers in LinkedIn to all US
workers. To measure job tenure for US workers, we collect data from the US Current
Population Survey Job Tenure Supplement for respondents aged 15 years and older. To
measure job tenure from LinkedIn profiles, we collect a random sample of one million
workers employed at some point with a firm listed in the Russell 1000 Index. While this
choice may bias the results towards workers employed in larger firms, it allows us to match
the age distribution of workers surveyed by CPS, while excluding self-employed workers.
We then plot the cumulative job tenure for each worker in each year from 1996 to 2014 for
both data samples. We find minimal differences in job tenure rates, offering little evidence
that LinkedIn profiles hold outdated (or overstated job tenure) information.
From the universe of worker resumes available in the online business networks service,
we collect employment profiles for 641,144 workers graduating with a Bachelor’s degree
during the years 1998- 2012 from US universities. To create our dataset and to guarantee
a certain degree of randomization, we sample LinkedIn using a tool available in most
online search engines, such as Google and Yahoo. These websites allow search results to
be restricted to a specific website. We make use of this feature to search for profiles of
workers on LinkedIn. Specifically, we search for workers from a given college or university;
in addition to the university name, we append a random alphanumeric character. This
methodology generates a sample in which the degree of randomness depends on the
webpage ranking ordering created by the search engine crawler. While search engines
use sophisticated and non-random methods to order websites (i.e., linkedin.com versus
facebook.com), it less clear how they order webpages of the same website, especially when
random alphanumeric characters are added to the search term. Through this process
we aim to generate a sample that is representative of the population of college educated
workers.
12

First, we collect the employment history of each worker including: (i) firm name, (ii) job
title, and (iii) skillsets. Second, we collect the educational history of each worker including
(i) institution name, (ii) degree, and (iii) self-reported major. We then match each college
major to a major category based on a natural language processing algorithm. We then
compile the full worker employment history into a yearly panel dataset. An additional
benefit of LinkedIn is that organizations also have profiles, which are typically maintained
by firms (and institutions) themselves. After matching the names of each firm across
workers, we collect characteristics for each firm from LinkedIn. For each firm, we collect (i)
year founded, (ii) industry, (iii) description of firm activities, (iv) headquarters address, (v)
company size (measured by employment bins), and (vi) whether the company is public or
private.
For each educational institution mentioned in the resume data, we obtained informa-
tion on (i) exact location, (ii) annual tuition, (iii) acceptance rate, (iv) total enrollment, (v)
school website, (vi) type of institution (public or private), and (vii) founding year. However,
Linkedin users use different names to refer to their undergraduate educational institution.
For example, they may use different designations for the same university (M.I.T, MIT, Mas-
sachusetts Institute of Technology, etc.); or, instead, just refer to their college or department
within the university (i.e., MIT School of Engineering, MIT Sloan, MIT Department of
Mechanical Engineering, etc). To identify the main undergraduate institution, we first
use a search engine (i.e., Google.com or Yahoo.com) to search for the institution name
written on each employee’s resume. Through this method, we obtain the website address
of the university, school, or department. We then use the top domain of each school’s (or
department’s) website to determine the top domain (i.e., mit.edu). From the top domain
we identify the main undergraduate institution (i.e., MIT) as schools and departments
within the same university institution share the same top domains.
We define firm creation using the following criteria. First, we include individuals that
classify their job title as ’owner’, ’co-owner’, ’founder’, ’co-founder’, or ‘entrepreneur’ of
a firm. Each firm’s startup year is either directly observed in the firm’s profile on the
13

business networking website, or estimated using the earliest date any employee joined
the firm (as observed on LinkedIn). From this data source, we develop two measures of
entrepreneurial success. First, we calculate survival as the tenure of the entrepreneur at the
firm. This assumption underestimates survival, since founders may transfer the ownership
of their firms to other parties.17 Second, for each new firm in the sample, we measure
employment as the number of employees currently employed with the firm according to
the firm’s profile.
Overall, our data is similar to three related sources. First, it resembles the employee-
employer linked data from the U.S. Census Longitudinal Employer-Household Dynamics
or administrative datasets (Graham et al., 2013; Jacobson et al., 1993). These sources suffer
from three primary disadvantages: (i) limited information on young and small firms, (ii)
missing occupation information (further preventing the identification of firm founder),
and (iii) imputed information on educational backgrounds (limiting our ability to identify
college graduates).18 Second, employment histories are frequently studied using either
general datasets such as the Panel Study of Income Dynamics or more specialized sources
including the Survey of Displaced Workers (Ruhm, 1991); however, there is no survey
dataset that includes corresponding information on firm starts, limiting any analysis of
entrepreneurial quality. Third, our data is most similar to online job search websites as
discussed in Brown and Matsa (2012) and Agrawal and Tambe (2016). Yet, while (Agrawal
and Tambe, 2016) covers approximately 13% of the U.S. workforce, we cover between 50%
to 70%.
Entrepreneurial Financing Data. We obtain additional sources of information for the new
firms in our sample. First, we match each firm to its respective profile on Crunchbase.com,
an online data service. Crunchbase records information on founders and firms, venture
capital funding, and exits through acquisitions and IPOs. Crunchbase is a crowd-sourced17However, using the 2007 Survey of Business Owners (SBO) Public Use Microdata Sample (PUMS), we
estimate that even five years after formation, ninety percent of all firms are still owned by the initial owner.18Workers that leave the sample may have become unemployed, retired, or moved to another state. There-
fore, most analyses of US data has had to focus solely on wages.
14

database and its main source of data is TechCrunch, an online publisher of technology
industry news. For firms to be present on Crunchbase it is not required that they receive
venture capital financing; hence, Crunchbase may include start-ups that are financed
by angel investors or crowd-funding. Note that Crunchbase includes both self-reported
information and data collected from TechCrunch and the greater web. From this data, we
are able to observe whether a firm has received venture capital funding (VC), the money
invested by each VC investor, whether the company has been acquired, and whether the
firm has successfully completed an IPO.
Patent and Citations Data. We obtain patent data directly from the United States Patent
and Trademark Office (USPTO). The USPTO maintains a permanent and historical record
of all US patent applications and provides a search engine on their website. We search for
the name of each company founded by an entrepreneur in our dataset. We opted to collect
patents by firm instead of personal patents since (i) they account for patents created by
other inventors besides the founder, and (ii) they are the property of the firm rather than
the founder.
Local Data. In addition to the data sources summarized above, we collect annual data on
the unemployment rate at the state-level. All measures are collected from the Bureau of
Labor Statistics.
Survey Data of Workers. Compared to data sources analyzed in prior research, a unique
feature of our environment is that we are able to directly contact the individuals in our
sample. Therefore, for a subsample of the population, we e-message the users of LinkedIn
with a request to respond to a quick survey on SurveyMonkey.com. Each survey response
can be matched to the worker profile and added to the database. In total, we contact a
total of approximately 4,000 entrepreneurs through the OBNS and receive 622 replies,
resulting in a 16% response rate. While one might be concerned that the individuals who
responded might misrepresent the sample of entrepreneurs in our sample, we confirm
that the observable characteristics of the survey responded match the characteristics of
15

the full sample of entrepreneurs in our sample, which contains over 35,000 entrepreneurs.
We report this differences in Table A2 of the appendix. We also survey a total of 4,000
non-entrepreneurs within our sample, and received 508 responses.
The primary questions of the survey evaluate an individual’s risk preferences based on
prior evidence that entrepreneurs hold a higher tolerance for risk and ambiguity (Knight,
1921; Parker, 2009). In particular, the first question (Q1) measures risk aversion, defined as
the willingness to accept risk for a potential reward. The second question (Q2) measures
ambiguity aversion, defined as the willingness to accept ambiguity for a potential reward.
Q1: How much would you pay for a lottery ticket that gives you a 50% probability of
winning $500 and 50% of winning nothing?
Q2: How much would you pay for a lottery ticket that gives you a x% probability of
winning $500? (x is between 25% and 75%)
In regards to both the first and second question (Q1 and Q2), we offer six possible answers
(i) Less than $50, (ii) $50-$100, (iii) $100-$150, (iv) $150-$200, (v) $200-$250, and (vi) more
than $250. We then create a binary variable equal to one for those individuals who are
in the top quartile of our risk (ambiguity) aversion categorical measure. This approach
divides individuals into two groups, those who are risk averse and those are less risk-
averse, neutral, or risk seeking. According to this definition, we classify individuals who
are willing to pay less than $50 as the most risk (ambiguity) averse, and those who are
willing to pay more than $50 as the least risk (ambiguity) averse. The classification implies
that 35 (40%) of the sample is classified risk (ambiguity) averse.
In addition, measures of risk and ambiguity tolerance, we include six other questions
in the survey; each question is a binary measure and answers are provided in more detail
in the appendix. These questions evaluate the confidence and optimism of the workers in
the sample. First, our focus on entrepreneurial confidence as a predictor of entry is based
on a significant literature including (Holm et al., 2013). The third question (Q3) develops a
measure of entrepreneurial confidence based on the likelihood of being acquired, while
16

the fourth question (Q4) measures confidence in employing at least ten workers. Second,
prior research including Astebro et al. (2007) argues that an individual’s general confidence
is a primary predictor into entrepreneurship. Therefore, question five (Q5) measures an
individual’s confidence in their future salary growth. Question six (Q6) instead develops an
indirect measure of confidence based on their willingness to compete based on the findings
of Camerer and Lovallo (1999). Third, we attempt to measure a worker’s optimism. While
optimism and confidence are related, confidence is concerned with ability, as opposed to
luck. Question seven (Q7) develops a measure of economic optimism based on the findings
of Bengtsson and Ekeblom (2014), while the eighth question (Q8) considers the role of
non-economic optimism (Puri and Robinson, 2007). We provide the questions below and
the possible answers for each question in the appendix.
Q3: Among firms started by college graduates, 5% are eventually acquired by a larger firm.
If you started a company today, what is the likelihood your firm would eventually be
acquired?
Q4: Among firms started by college graduates, 12% grow to employ ten or more workers
within five years. If you started a company today, what is the likelihood your firm
would employ ten or more workers within five years?
Q5: What is the likelihood your salary doubles in the next five years?
Q6: Do you view yourself as a competitive person?
Q7: Over the past 90 years, the US stock market has observed an average return of 9% a
year. What will be the average annual US stock market return over the next ten years?
Q8: Among people born in the US in 1919, 1.4% are still alive in 2019. What is the
likelihood you live to age 100?
We create binary measures that aggregate the answers similarly to our procedure for
risk and ambiguity aversion. For Q3 and Q4, we create a binary variable equal to one for
17

respondents who are in the top quartile in their belief of entrepreneurial success. For Q5,
we create a binary equal to one for individuals in the top quartile of expectations of salary
growth. For Q6, we compute a binary variable equal to one for those who are in the top
quartile in their willingness to compete. For Q7, we generate a binary variable that equals
one for individuals in the top quartile in their expectations of highest stock market return
growth. And lastly, for Q8, we create a binary variable equal to one for individuals who
are in the top quartile in their belief that they will live until age 100. We use these binary
variables in our analysis.
3.2 Data Summary
Summary of Workers. From the universe of worker resumes available on LinkedIn, we
collect employment profiles for 641,144 workers graduating with a Bachelor’s degree during
the years 1998- 2012 from US universities. We first compare our data sample to the full set
of college graduates. According to data from the National Center for Education Statistics
(National Center for Education Statistics, 2018), a total of 21.7 million students graduated
from an undergraduate institution between 1998-2012, leading to a mean of 1.45 million
students annually. Therefore, our sample includes information on 3% of the entire sample
of college graduates during this time period. Comparing the national data to our own
sample in Figure 2, we note our data over-represents the earlier years in the sample and
under-reports the later years of the sample. Specifically, our sample covers roughly 3.5%
of all college graduates between 1998 and 2009, but closer to 2% of graduates between
2010-2012.
Panel A in Table 1 reports the average probability that a student in our sample becomes
an entrepreneur. We estimate 2.2% of students found a new firm directly after graduation,
2.8% within two years, 3.3% within three years, and 3.9% within four years. For comparison,
the Kauffman Foundation estimates that on average, between 1998 and 2018, only 0.32%
of the U.S. population started a business every year. In line with our hypothesis, we
18

note entrepreneurship rates are counter-cyclical: for instance, over five percent of workers
graduating in 2010 enter entrepreneurship within two years of graduation.
We also summarize the worker characteristics in our sample. Recall all students included
in our sample have earned a Bachelor’s degree;19 in addition, 20% of our sample obtains a
graduate degree within 5 after graduation. For comparison, according to 2014 estimates
from the National Center for Education Statistics, 22% of the US population aged 25-29
with a Bachelor’s degree also hold a graduate degree. To ensure we include entrepreneurs
in the top of the talent distribution, we over-select from the top undergraduate institutions;
in our data, 18% of workers graduate from a top twenty institution based on U.S. News
and World Report Rankings.
To measure gender, we match names from GenderCheck: 36% of the sample is female.
Given our interest in entrepreneurship, we also focus on two fields that may offer particular
skillsets to facilitate firm creation. We estimate 16% of the sample graduates with a degree
in business or economics, while 27% of students graduated with a degree in engineering,
computer science, or mathematical sciences.
We develop three measures to assess the quality of employment at graduation. First, we
estimate the likelihood of obtaining a job at a top consulting or finance firm at graduation.
Our list of top finance firms include Goldman Sachs, Morgan Stanley, JPMorgan Chase,
Citigroup, and Credit Suisse;20 while our list of top consulting firms only includes five
firms: McKinsey & Company, The Boston Consulting Group, Booz Allen Hamilton, Bain &
Company, and A.T. Kearney. Second, we estimate the likelihood of joining a firm listed
in the Russell 1000. Third, we compute the likelihood that a worker joins a high wage
industry after graduating from college.
To define a high-wage industry, we first estimate the hourly wage for each industry in
the following top occupations: Top Executives, Management Occupations, and Architecture19For comparison, 34% of the US population aged 25-29 had completed a Bachelor’s degree20The full list of top finance firms are Goldman Sachs, Morgan Stanley, JPMorgan Chase, Citigroup, Credit
Suisse, Wells Fargo, Merrill Lynch, Deutsche Bank, Lehman Brothers, Capital One, BlackRock, Bloomberg,and Barclays Capital.
19

and Engineering Occupations. We focus on these occupations as all workers in our sample
are college graduates, over a quarter acquire graduate degrees, and 18% graduate from a
top twenty undergraduate institution. We then define high wage industries as those above
the median in income within the three occupations listed above. Following graduation
from college, 5% of workers in our sample join a top finance or consulting, and 25% join a
firm listed in the Russell 1000. The average worker in our sample joins an industry where
the mean wage in top occupations is $61.80 per hour.21
Last, we match each institution to the corresponding zip code to determine the local
economic conditions facing workers in the sample. Workers face a mean state-level un-
employment rate of 6.3% at the time of graduation. We document both time-series and
cross-sectional variation in unemployment rates during our period. For instance, unem-
ployment was measured at 4% in 2000, but 10% at the start of 2010. However, even in
2010 we note significant variation: Nevada suffered a rate of 15%, while North Dakota re-
mained below 4%. We exploit these differences across both time and space in our empirical
framework.
Summary of Undergraduate Institutions and Local Economies. As discussed above, all
workers in our data graduated from an undergraduate institution between 1998 and 2012.
Therefore, we next summarize the set of undergraduate institutions represented in the
data in Panel B of Table 1. In total, the workers in our sample have graduated from over
2200 different institutions. Individuals in our sample graduated from an institution with
an average acceptance rate of 51% and average total enrollment of 30,327 students. On
average, the institution was founded in 1889 and annual tuition was $22,269. Last, 75% are
public institutions.
For additional information, in Table A1 of the online appendix we list the institutions
composing the largest proportion of our sample. In order, we find that the University of
California at Berkeley and the University of Illinois at Urbana-Champaign each compose21We define the following as top occupations: “Top Executives”, “Management Occupations”, “Architecture
and Engineering Occupations”
20

3.11% of the entire sample, University of Texas at Austin composes 2.92%, University of
California in Los Angeles is fourth at 2.67% and the University of Wisconsin rounds out the
top five at 2.49%. Combined, these five institutions graduate 11.82% of the entire sample,
while the ten largest compose a total of 22.8%.
Summary of Entrepreneurs. We summarize data on the new firm demographics in
Panel A of Table 2. Our analysis includes a total of 36,316 entrepreneurs. Compared to
the full sample of workers, we note three differences. First, entrepreneurs are twice as
likely to graduate from a top twenty undergraduate institution. Second, entrepreneurs are
more likely to study engineering and computer-related fields. Third, entrepreneurs are
significantly less likely to be female.
By focusing our analysis on workers with college degrees (especially degrees from
selective institutions), a significant proportion of these firms are particularly successful. We
estimate 24% remain in business as of 2019, while 14% also employ at least ten workers. In
addition 9.4% (5.1%) currently employ at least twenty (fifty) workers. We estimate at least
6% of the firms created at least one patent, our measure of innovation, including 2.5% that
patent within five years of establishment. Turning to our data on financing, we estimate
15% received venture capital funding throughout their firm life, and 12% receive venture
capital funding within five years of establishment; additionally, we estimate that 4.5% were
acquired by a separate firm. Lastly, 141 startups in our sample completed successfully
an Initial Public Offering (IPO), representing 5.7% of all startups that completed an IPO
between 1999 and 2012.22
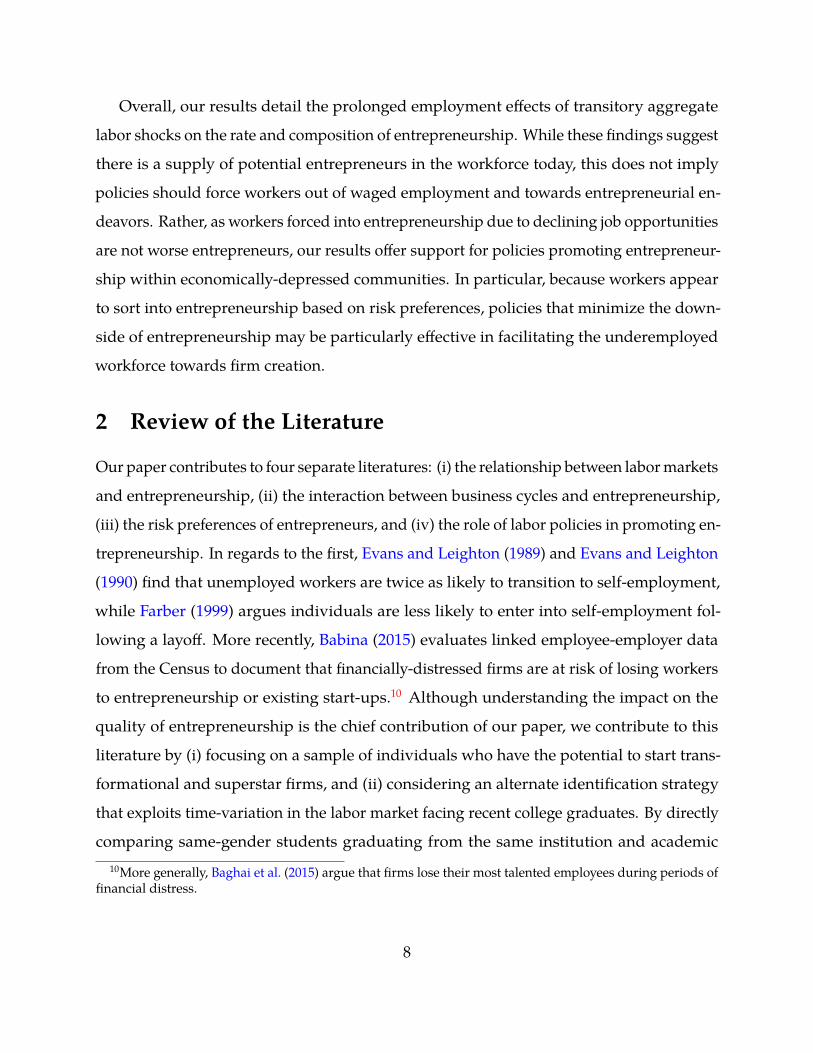
Finally, we also match each new firm to a two-digit NAICS code and present the results
in Figure 3. New firms predominantly arise in the industries: Professional, Scientific,
and Technical Services (33%), Information (27%), Manufacturing (12%), and Finance and
Insurance (9%). In Table A7 of the online appendix, we distinguish the sample between
firms started by workers during periods of high local unemployment (defined as a rate above
the sample median) and firms started by workers in low unemployment markets (defined as22According to Statista.com, 2462 startups successfully completed an IPO between 1999 and 2012.
21

a rate below the sample median). We find almost no differences in the industry breakdown.
In addition, we compare these estimates to the industry breakdown of all new firms founded
by college graduates according to the 2007 Census Survey of Business Owners. We note
our sample of new firms is biased towards firms in Information, Manufacturing, and
Professional, Scientific, and Professional Services; in contrast, the firms under-represent
the proportion of new firms in Trade (both retail and wholesale), Administrative Services,
and Accommodation and Food Services.
Summary of Survey Responses from Entrepreneurs. We summarize the survey re-
sponses in Panel A of Table 3. We identify 35% of the respondents as highly risk-averse
and 40% highly ambiguity-averse. In addition, we develop two measures of confidence in
entrepreneurial abilities: conditional on founding a new firm, 31% of respondents believe
there is a significant chance in the likelihood of starting a firm that is ultimately acquired,
while 44% believe there is a significant chance of employing at least ten workers. Next, we
develop two definitions of general confidence based on (i) future expected salary growth
and (ii) preference for competition. Based on these measures, 41% of respondents are
confident in their salary growth and 27% hold a preference for competitive environments.
Third, we consider two definitions of optimism based on (i) life expectancy and (ii) future
stock market returns. We find 41% of entrepreneurs are defined as optimistic about the
future stock market and 10% are optimistic about their life expectancy.
As we are not able to survey the full population, a primary concern is that entrepreneurs
answering the survey differ from the other entrepreneurs in the sample.23 Therefore in
Table A2 of the online appendix, we confirm the entrepreneurs in our survey sample
start similar firms to those in the larger sample; the only exception is that the surveyed
population is 1.9% more likely to found a firm with at least one patent and this difference
is statistically significant at the ten percent level. As a result, we believe the entrepreneurs
included in the survey are representative of the larger set of entrepreneurs.23To overcome this concern, we control for personal and firm characteristics in our regression analysis of
the survey data.
22

Summary of Survey Responses from Non-Entrepreneurs. For comparison, we also sur-
vey a set of 508 workers from our full sample that have not entered entrepreneurship. This
data provides two benefits. First, we can test whether risk and ambiguity preferences
predict entry to entrepreneurship. Second, we can verify non-entrepreneurs graduating
during periods of poor labor opportunities are not more risk or ambiguity-averse. We
summarize the data in Panel B of Table 3.
4 Methodology
In this section we first outline our three hypotheses and then describe the empirical frame-
work to test each hypothesis.
4.1 Empirical Setting
This paper tests three hypotheses. First, we analyze how job market opportunities impact
the rate and composition of entrepreneurship in the economy. The argument that local
labor markets are related to entry to entrepreneurship is straightforward: sudden increases
in local unemployment creates an excess supply of labor. Job searches impose heavy
constraints on time (Aguiar et al., 2013), and the mismatch between vacancies and job
seekers across sectors might affect the likelihood of finding a job (Sahin et al., 2012). Past
research has also demonstrated the long-term costs of unemployment: for instance, job
displacement is followed by a long-term decrease in wages as well as an increase in wage
volatility (Jacobson et al., 1993). Since prospective entrepreneurs weigh employment risks
against entrepreneurship risks (Hamilton, 2000; Hombert et al., 2019; Scott et al., 2015),
local employment shocks may potentially impact the rate of new firm creation.
Though this argument relating labor market conditions and entrepreneurship may
be quite convincing, macroeconomic research offers little evidence of this channel. For
instance, as the unemployment rate rose from under four percent in 2006 to peak at ten
percent by 2010, the number of new firms declined by twenty-two percentage points and
23

has failed to return to pre-recession levels as of 2019. One likely explanation for this
discrepancy is that areas suffering from poor labor market conditions are also more likely
to suffer from decreased access to entrepreneurial finance (Hurst and Lusardi, 2004) and
decreased customer demand (Fort et al., 2013; Parker, 2009). Assuming these channels
are more relevant than the labor market channel discussed above, it is not surprising that
recessions decrease the overall rate of entrepreneurship in the economy.
Second, we analyze how local employment opportunities impact the quality of en-
trepreneurs. The standard argument in the literature is that individuals with the greatest
ability have already chosen to enter entrepreneurship prior to changes in local employment
opportunities (Lucas Jr, 1978). Any firms created due to local employment shocks will
therefore instead be a stop-gap measure until the founder can rejoin the workforce (Delmar
and Davidsson, 2000), resulting in few implications for long-term entrepreneurial dynamics.
Based on these arguments, we expect that increases in the local unemployment rate lead
workers with lower entrepreneurial ability to start firms. While direct evidence supporting
this hypothesis is limited, Moreira (2016) illustrates that firms started during recessions are
smaller in initial size and experience limited growth compared to firms founded in more
favorable environments. However, the precise channel is again not obvious as the effects
may instead be driven by decreased customer demand and lack of financing supply.
Third, we examine the relationship between opportunities in the labor market and
risk preferences of entrepreneurs. Based on Kihlstrom and Laffont (1979), workers may
sort into entrepreneurship based on risk or ambiguity aversion. In this environment,
individuals with the greatest risk tolerance enter entrepreneurship regardless of the local
employment opportunities; as a result, entrepreneurs entering the market during periods of
high unemployment will be more risk-averse on average. Past empirical research has found
evidence that entrepreneurs are more tolerant of risk (Ahn, 2010; Cramer et al., 2002; Hvide
and Panos, 2014); however, no paper has previously evaluated whether entrepreneurs
entering the market during recessions are more risk or ambiguity-averse.
24

Based on the arguments above, our analysis requires a setting where individuals are
directly impacted by fluctuations in labor market opportunities. We follow a notable
literature including Altonji et al. (2016); Bell and Blanchflower (2011); Kahn (2010); Liu
et al. (2016); Oreopoulos et al. (2012); Oyer (2006, 2008); and Schoar and Zuo (2017). As
such, we exploit exogenous time of entry in the labor market among individuals with very
similar academic paths.24 More concretely, we compare a worker graduating from a U.S.
undergraduate institution to a separate student of the same gender graduating from the
same institution with the same major, but in the prior year. We believe this setting provides
three primary advantages.
First, the time of initial enrollment is unlikely to be correlated with local economic con-
ditions at the time of graduation. According to the National Center for Education Statistics
(NCES), ninety percent of students enrolled in a Bachelor’s program at four-year public
institutions are under 25 years of age; the number decreases slightly to 87% of students at
non-profit four year private institutions (National Center for Education Statistics, 2017).
Therefore, the timing of college entrance is not dependent on local economic conditions,
but rather their year of birth. By comparing two same-gender workers who graduate from
the same undergraduate institution with the same major, but in consecutive years, we are
able to identify the impact of local economic conditions on entrepreneurship.
Second, past research has found shocks to labor market opportunities have significant
and persistent implications on graduating students. For instance, Oreopoulos et al. (2012)
estimate that students graduating during a recession earn nine percent less than other
student; Altonji et al. (2016) estimate a similar ten percent decline, though the effect is
two to three times larger during the Great Recession. Oyer (2008) evaluates Stanford MBA24At first, it may seem desirable to analyze workers facing turnover. However, it is generally difficult to
distinguish between unforced turnover (i.e. worker quits) and forced turnover due to worker ability (i.e.worker firings).
To identify the effect of job displacement on the propensity of starting a new firm, one then needs toaddress several endogeneity concerns. In particular, it is necessary to distinguish worker displacement fromvoluntary exit or personal firings. Workers that voluntarily exit a firm have a reason for the decision: apreferable job opportunity, retirement, family needs, etc. Similarly, workers that exit a firm due to a firing aredifferent from workers that stay: in particular, they are likely to be worse employees.
25

graduates and estimates that not entering the investment banking industry due to poor
market conditions leads to a decrease in lifetime earnings of $1.5 - $5 million. Liu et al.
(2016) argues these losses are driven primarily by a thirty percent increase in the rate of job
mismatch as students are unable to find employment in their field of study. Therefore, this
setting allows us to isolate the impact of a decline in job opportunities on entrepreneurship.
Third, young and college-educated workers are critical to the entrepreneurial sector.
For instance, past research has found a positive correlation between city-level education
and entrepreneurship rates, as well as entrepreneurial success (Doms et al., 2010). One
potential explanation is that education is associated not only with greater knowledge and
training, but also a higher income (Grogger and Eide, 1995) and greater access to family
wealth (Belley and Lochner, 2007). In addition, prior evidence has found that start-ups
disproportionately employ younger workers due to both their skillsets and risk tolerance
(Ouimet and Zarutskie, 2014).
4.2 Framework
We outline the empirical methodology to test the three hypotheses outlined above. To test
the first hypothesis, we estimate the impact of changes in the state-level unemployment
rate on the likelihood that worker i graduating from an undergraduate institution in year t
enters entrepreneurship with x years of graduation. Specifically, we estimate the following
linear probability cross-sectional model:
Entrepreneurxi,t = β × Local Unemploymenti,t→t+1 (1)
+ University × Cohort FE × Gender FE + ηi,t
The dependent variable(Entrepreneurxi,t
)is a binary variable denoting individual i grad-
uating in year t entered entrepreneurship within x years after graduation. We focus on
entering entrepreneurship within 1 to 4 years following graduation. The independent
26

variable of interest is Local Unemploymenti,t→t+1, and measures the average unemploy-
ment rate in years t and t+ 1 in the state where the college of individual i is located. We
focus on multiple years as a portion of workers in our sample are likely graduating at the
end of the calendar year and searching for positions in the beginning of the following
year; as we are not able observe the month of graduation within our data, we are not
able to differentiate these students.25 We focus on state-level conditions as the majority of
undergraduate students are in-state residents (Wozniak, 2018) and are employed in-state
following graduation (Foote, 2019).26
The regressions include a set of fixed effects that interact university, graduation cohort,
and gender. The cohort is defined as a two-year rolling window; for instance workers
graduating in 1998 and 1999 and in the same academic major compose a cohort.27 These
set of fixed effects ensures that we only compare individuals who graduate from the same
university, major, and gender, but in consecutive years. As a result, our inferences remain
valid even if colleges are not equally represented in each year of the sample. The coefficient
β then measures the impact of the local employment shock on entry to entrepreneurship;
according to our hypothesis, β > 0. We cluster standard errors at the state-year level.
To test this second hypothesis, we use a strategy that directly measures the quality of
firms founded by the workers in the sample and estimates whether mean quality declines
following increases in the local unemployment rate. In contrast to the prior test, we start
by estimating our specification with no fixed effects, and then introduce the full battery of
fixed effects introduced above. We follow this approach to compare the full distribution of
individuals who become entrepreneurs during good and bad labor markets. We therefore
estimate the linear probability model:25In robustness tests, we also test the model with the unemployment rate in year t and t+ 1 separately.26The results similarly hold if we define local unemployment at the county-level or the national level.27The results remain quantitatively similar if we instead include three-year or four-year rolling windows.
27

Firm Qualityi,t = β × Local Unemploymenti,t→t+1 (2)
+ University × Cohort FE× Gender FE
+ Industry FE + ηi,t
whereFirmQualityi,t is a binary variable measuring the success of the given entrepreneurial
venture started by student i graduating in year t. We develop multiple measures of en-
trepreneurial quality based on: (i) firm survival, (ii) firm employment size, (iii) patent
creation, (iv) access to venture capital financing, (v) acquisition by another firm, and (vi)
successful Initial Public Offering (IPO). As before, the independent variable of interest is
Local Unemploymenti,t→t+1, and measures the average unemployment rate in year t and
t+ 1 in the state where the college of individual i is located. The coefficient β then mea-
sures the impact of the local employment shock on the mean quality of entrepreneurship;
according to our hypothesis, β < 0. As in the prior specification, we include a university
fixed effect interacted with a cohort fixed effect and a gender fixed effect. We now also
include an industry fixed effect for each two-digit NAICS code. Finally, we cluster standard
errors at the state-year level.
We follow a similar framework to test our third hypothesis: focusing on a subset of
entrepreneurs in the sample that responded to an online survey, we evaluate whether the
proportion of risk (or ambiguity) averse entrepreneurs declines following increases in the
local unemployment rate. We therefore estimate the linear probability model:
Risk-Averse Entrepreneuri,t = β × Local Unemploymenti,t→t+1 (3)
+ University FE + Cohort FE + Gender FE
+ θ ×Worker Controlsi
+ φ× Firm Controlsi + Industry FE + ηi,t
28

where Risk −Averse Entrepreneuri,t is a binary variable denoting whether worker i grad-
uating in year t is risk-averse. We consider a related measure of ambiguity preferences. The
independent variable of interest is again Local Unemploymenti,t→t+1, and measures the
average unemployment rate in year t and t+ 1 in the state where the college of individual i
is located. The coefficient β then measures the impact of the local employment shock on
the mean level of risk-aversion; according to our hypothesis, β > 0. In contrast to before,
we no longer interact fixed effects due to the smaller sample size; instead we include cohort,
university, and gender fixed effects independently. As before, we include industry fixed
effects for the industry of the start-up. In addition, we now control for other behavioral
characteristics, namely the confidence and optimism of each worker. We also control for the
firm’s characteristics as risk and ambiguity aversion may be driven by the entrepreneurial
experiences of the workers in the sample. Finally, we cluster standard errors at the state-year
level.
5 Results
We divide the discussion of our results into four parts. First, we confirm an increase in
local unemployment leads to an increased likelihood of underemployment among workers
in the sample. Second, we estimate the impact of labor market shocks on firm creation.
Third, we evaluate whether these shocks also impact the quality of entrepreneurship.
Fourth, we consider the relationship between the risk aversion of entrepreneurs and local
unemployment shocks.
5.1 Local Employment Shocks and Labor Outcomes
The underlying assumption motivating our empirical framework is that labor market
outcomes impact the job outcomes of recent college graduates. Therefore, we first offer em-
pirical evidence of this assumption within our student population. Our primary measure
defines underemployment based on the percent of workers entering top financial and con-
sulting firms. We have two motivations for this measure. First, evaluating the labor market
29

of Stanford MBA graduates, Oyer (2008) estimates that not entering the financial sector due
to poor market conditions leads to a decrease in lifetime earnings of $1.5 - $5 million. Given
nearly 100,000 of the workers in our sample graduates from a top twenty undergraduate
institution, we believe this measure is applicable to our own sample and highlights the
cost imposed on high-skill workers. Second, recent evidence by Gupta and Hacamo (2018)
argues that the rise of the financial and consulting sector had a significant impact on the
rate of entrepreneurship and innovation among workers completing engineering degrees
at high-ranking institutions.
In addition, we offer two alternative definitions of underemployment. Our second
measure is based on prior evidence that recessions lead college graduates to join less
desirable employers even within the same occupation (Oreopoulos et al., 2012; Oyer, 2006;
Schoar and Zuo, 2017). We identify desirable employers in our setting as firms listed
in the Russell 1000 Index, which allows for employers across a variety of industries and
occupations. Motivated by Kahn (2010) and Bell and Blanchflower (2011), our third measure
focuses directly on the wage impacts of graduating in a poor labor market. Though we
cannot directly observe individual-level wages in our setting, we develop proxies based on
mean salary in top occupations at the industry-level.28 These estimates are based on data
available from the Bureau of Labor Statistics.
We present our findings in Panel A of Table 4. The independent variable is the un-
employment rate at the time of graduation and located in the state of the undergraduate
institution. In the odd columns, we include university fixed effects, gender, and cohort
fixed effects separately; in the even columns, we interact university, gender, and cohort
fixed effects. Recall a cohort fixed effect is a fixed effect for all students in the same academic
major and graduating within a two-year window. Across all measures, we find significant
evidence that local unemployment shocks lead to lower job quality among college gradu-
ates. Specifically, a ten percentage point increase in the local unemployment rate decreases
the likelihood of employment in the finance or consulting sector by 3.5%, the likelihood28We provide additional details concerning these occupations in the data section.
30

of a job in a desirable firm (defined as employers in the Russell 1000 Index) by 9.8%, and
the chance of joining a high-wage industry by 4.6%. The results offer strong support our
empirical setting.
5.2 Local Employment Shocks and Entrepreneurship
Linear Specification. Panel A of Table 5 reports the linear relationship between local
unemployment and entry to entrepreneurship. Our dependent variable is a binary variable
taking a value of one when the student becomes an entrepreneur within a certain number
of years following graduation. The first two columns consider firms started within one
year of graduation from the Bachelor’s Degree, while the following columns consider firms
started within two, three, and four years post graduation. We consider two specifications.
The specifications in the odd columns include a fixed effect for each academic institution,
gender, and cohort; the specification in the odd columns interacts these fixed effects. This
way we only compare graduates from consecutive years with the same major and of the
same gender. For example, we only compare a female Stanford engineering graduate from
the class of 1998 with a female Stanford engineering graduate from the class of 1999. Within
our more restrictive specification, 9,004 observations (out of 641,144) are absorbed by the
fixed effects, and the average comparison group contains 17.54 individuals.
According to the first and second column, a 10 percentage point increase in the un-
employment rate increases the rate of entrepreneurship by 2.14 percentage points in the
year following graduation and the coefficient is statistically significant at the one percent
level. Relative to a baseline entrepreneurship rate of 2.2% within the year following grad-
uation, we observe the entrepreneurship rate nearly doubles following a 10 percentage
point increase in unemployment. For comparison, Evans and Leighton (1989) and Evans
31

and Leighton (1990) find that unemployed workers are twice as likely to transition to
self-employment.29
One potential concern is that unemployment shocks alter the timing of firm creation;
in other words, poor labor market opportunities may encourage future entrepreneurs to
start their firm right after graduation. To address this issue, we evaluate whether the
relationship between unemployment shocks and entrepreneurship decreases as the time
horizon increases. According to Panel A of Table 5, a 10 percentage point increase in the
unemployment rate increases the cumulative rate of entrepreneurship by 2.36 percentage
points within two years, 2.37 percentage points within three years, and 2.4 percentage
points within four years. Therefore, we document that unemployment shocks lead to a
permanent increase in the rate of entrepreneurship as the non-treated group fails to catch
up with the treated group.
Nonlinear Specification. Given the likelihood of firm creation within four years of grad-
uation is only 3.9% according to Table 1, the binary dependent variable takes a value
of one for only a small set of students. This potentially raises concerns that the linear
probability model is a misfit for this application. To mitigate these concerns, we also
estimate our results under a probit regression model to ensure the results are robust to the
modeling choice in the baseline estimation. Table A3 of the online appendix reports these
estimates. We confirm that an increase in the state unemployment rate increases the rate of
entrepreneurship within the year following graduation; in addition, this effect continues
to hold through the four years after graduation. The results suggest our prior estimates
under the linear probability model do not depend on the particular empirical specification.
Robustness to Sample. In Table A4 of the online appendix, we also evaluate whether
the results are driven by a small sample of the workers in our data. We test this in four
ways. First, we exclude workers graduating in the peak of the two recessions in our29In unreported results we also find female workers are 1.4% less likely to enter entrepreneurship than
comparable men in the first year following graduation and 2.1% less likely within four years. Our resultsreinforce prior evidence of low rates of female entrepreneurship (Fairlie and Robb, 2009; Jennings and Brush,2013).
32
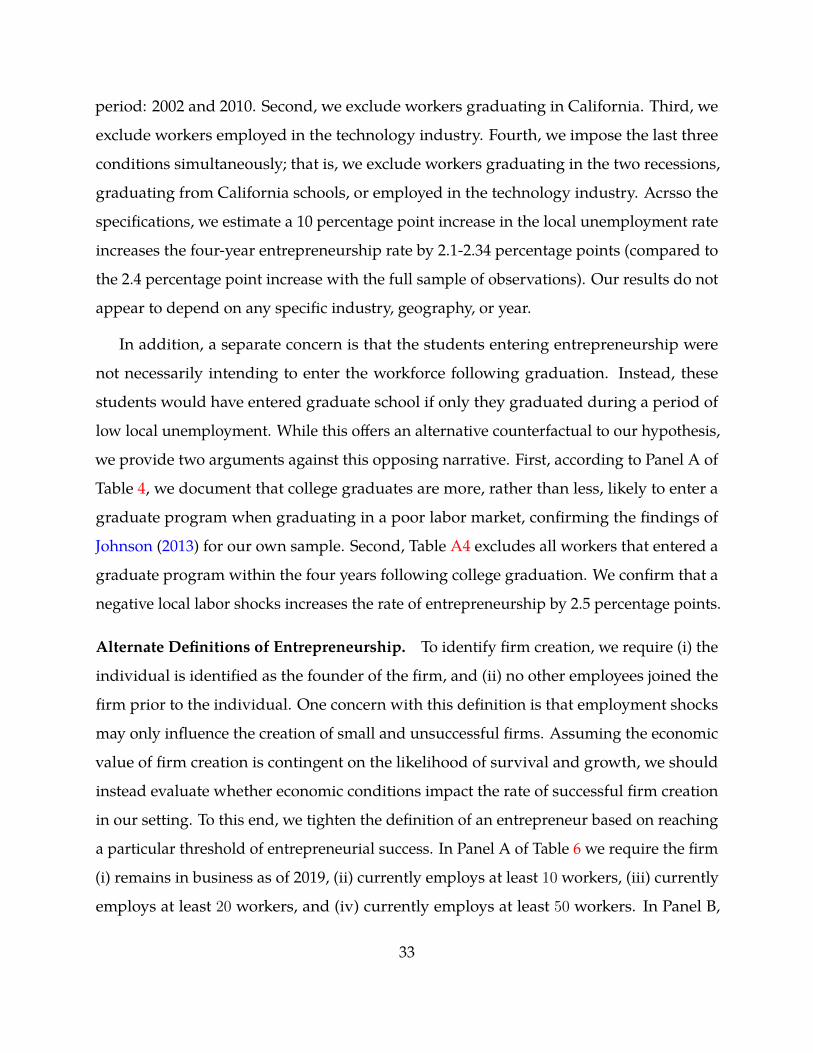
period: 2002 and 2010. Second, we exclude workers graduating in California. Third, we
exclude workers employed in the technology industry. Fourth, we impose the last three
conditions simultaneously; that is, we exclude workers graduating in the two recessions,
graduating from California schools, or employed in the technology industry. Acrsso the
specifications, we estimate a 10 percentage point increase in the local unemployment rate
increases the four-year entrepreneurship rate by 2.1-2.34 percentage points (compared to
the 2.4 percentage point increase with the full sample of observations). Our results do not
appear to depend on any specific industry, geography, or year.
In addition, a separate concern is that the students entering entrepreneurship were
not necessarily intending to enter the workforce following graduation. Instead, these
students would have entered graduate school if only they graduated during a period of
low local unemployment. While this offers an alternative counterfactual to our hypothesis,
we provide two arguments against this opposing narrative. First, according to Panel A of
Table 4, we document that college graduates are more, rather than less, likely to enter a
graduate program when graduating in a poor labor market, confirming the findings of
Johnson (2013) for our own sample. Second, Table A4 excludes all workers that entered a
graduate program within the four years following college graduation. We confirm that a
negative local labor shocks increases the rate of entrepreneurship by 2.5 percentage points.
Alternate Definitions of Entrepreneurship. To identify firm creation, we require (i) the
individual is identified as the founder of the firm, and (ii) no other employees joined the
firm prior to the individual. One concern with this definition is that employment shocks
may only influence the creation of small and unsuccessful firms. Assuming the economic
value of firm creation is contingent on the likelihood of survival and growth, we should
instead evaluate whether economic conditions impact the rate of successful firm creation
in our setting. To this end, we tighten the definition of an entrepreneur based on reaching
a particular threshold of entrepreneurial success. In Panel A of Table 6 we require the firm
(i) remains in business as of 2019, (ii) currently employs at least 10 workers, (iii) currently
employs at least 20 workers, and (iv) currently employs at least 50 workers. In Panel B,
33

we instead require the firm (i) developed at least one patent, (ii) received venture capital
funding, (iii) was acquired, or (iv) successfully completed an Initial Public Offering.
In the first and second columns of Panel A of Table 6, we estimate the impact of peers
on establishing firms still present in 2019. Combined with the results from Table 5, these
estimates find that 23% of the firms started due to heightened unemployment risk remain
in business today. In the third and fourth columns we require the firm is still in business
and employs at least ten employees. In the fifth and sixth (seventh and eighth) columns we
require the firm is still in business and employs at least twenty (fifty) employees. Among
the firms created due to weak labor markets, nearly 5% employ at least fifty employees
today.
In the first and second column of Panel B of Table 6, we estimate that 5% of the firms
founded due to local labor shocks in our sample hold at least one patent. In the third and
fourth column, we estimate 15% of the firms founded in the sample due to depressed labor
opportunities receive venture funding. In the fifth and sixth column, we estimate that
3.3% of the firms created during distressed labor markets are acquired by other firms. In
sum, local labor opportunities influence the likelihood of significant and resilient firms,
highlighting the potential for real effects on the economy.
5.3 Local Employment Shocks and Entrepreneurial Quality
Cross-Sectional Comparison of Entrepreneurial Quality. The results above confirm
our first hypothesis: decreased employment opportunities lead to increased entry to en-
trepreneurship among recent college graduates. We next evaluate the second hypothesis:
local employment shocks impact the relative quality of entrepreneurial firms. Testing this
hypothesis depends on directly observing the success of entrepreneurial endeavors. Similar
to Table 6, we measure quality across several measures: (i) remains in business as of 2019,
(ii) currently employs at least x workers, (iii) developed a new patent, (iv) received venture
capital financing, (v) was acquired, or (vi) completed an Initial Public Offering. We define
each measure as a binary variable.
34

We first present a simple comparison of firm outcomes in Panel A of Figures 6 through
8. For each year of graduation, we split students based on whether the state experiences
unemployment above or below the median state. We then classify entrepreneurs graduating
in states with above median unemployment in that year as “forced” and other entrepreneurs
as “voluntary”. In Figure 6 we estimate the percent of firms still in business separately for
each year t following establishment from year one to year ten. In Figure 7 we estimate the
cumulative percent of firms creating at least one patent by year t following establishment;
in Figure 8 we estimate the cumulative percent of firms that received venture capital by
year t.30
First, in Panel A of Figure 6 we estimate largely identical survival rates for both “forced”
entrepreneurs and “voluntary” entrepreneurs; in other words, the local unemployment
rate has little explanatory power in the survival of the entrepreneurial endeavor. Second, in
Panel A of Figure 7 we find similar patenting rates across both sets of entrepreneurs. Third,
in Panel A of Figure 8 we actually find evidence that entrepreneurs graduating in a poor
local labor market are roughly two percent more likely to obtain venture capital financing
relative to entrepreneurs graduating in the same year in a better local labor market and
this difference holds across the lifecycle of the firm.
Regression Analysis of Entrepreneurial Quality. The figures discussed above offer little
evidence that workers entering entrepreneurship during periods of high local unemploy-
ment are worse entrepreneurs. However, the downside with this analysis is that systematic
differences across states may confound the comparison between “force” and “voluntary”
entrepreneurs. To offer a comparison free of selection biases, we compare same gender
entrepreneurs who graduated from the same university and major, but in consecutive
years. Specifically, we estimate the regression model introduced in Equation 2 of section30We acknowledge we are not able to conduct this analysis for employment as we are only able to observe
the employment of the firm as of 2019. While we are able to conduct this analysis for the acquisition andIPO rate; only a few firms in our sample undergo an acquisition or IPO within the first several years afterestablishment, dramatically lowering the power of the statistical test.
35

4.2. Within this restrictive specification we have 2,567 observations absorbed by the fixed
effects; on average, the comparison group contains 2.81 entrepreneurs.
We present the results in Table 7. As we limit this analysis to entrepreneurs founding
firms within five years of graduation, our sample drops to 12,059 total observations. We
consider two separate specifications. In the odd columns, we only include cohort fixed
effects; in the even columns we interact cohort, university, and gender fixed effects and
separately include industry fixed effects. In contrast with the tests for the first hypothesis,
it is necessary to estimate our regressions without any fixed effects before saturating the
regression with fixed effects. If one of the characteristics absorbed by the fixed effects
explains entrepreneurial success, we might find a spurious null result. For example,
some universities may equip individuals to be become better entrepreneurs. In such case,
university fixed effects would absorb important variation as it would not allow us to learn
whether negative labor shocks push less of these individuals into entrepreneurship. The
inclusion of university fixed effects would then incorrectly lead us to conclude that there is
no difference in quality between force and voluntary entrepreneurs.
Across both Panel A and B, we find limited statistical evidence that local employment
shocks decrease the quality of entrepreneurship. In contrast to the hypothesis, we estimate
a 10 percentage point increase in unemployment leads to a 12-16 percentage point increase
in likelihood of survival, an 11-14 percentage point increase in the likelihood of receiving
venture capital within five years of establishment, and a 1-2 percentage point increase in
the likelihood of patent creation within five years of establishment. In addition, we find no
relationship between the unemployment rate and (i) employment, (ii) acquisition, or (iii) an
initial pubic offering. Taken together, this evidence refutes the hypothesis that individuals
sort into entrepreneurship based on entrepreneurial ability.
The results are in contrast to recent evidence by Moreira (2016), who offers convincing
evidence that firms started during recessions are both small in initial size and experience
limited growth compared to firms founded in more favorable environments. One likely
explanation for this discrepancy is that by (i) focusing exclusively on firms founded by
36

recent college graduates and (ii) more cleanly isolating the effect of labor market shocks,
we are able to better analyze the implications of job market opportunities as opposed to
decreased demand and financing.31
Quality across the Firm Lifecycle. Overall, the results highlight limited differences in
entrepreneurial quality between entrepreneurs graduating in weak and tight local labor
markets. A potential downside of the specification above is that we cannot easily compare
differences in entrepreneurial quality across the lifecycle of the firm. For instance, en-
trepreneurs graduating in a weak labor market may start smaller firms upon establishment;
however, these firms grow more quickly and eventually reach the employment size of
their competitors. In this section we compare firm quality across multiple points in time.
Specifically, we estimate the relationship between the state-unemployment rate and firm
outcomes for each year since establishment. As before, compare firms within the same
industry and year of establishment. We also continue to interact university fixed effects
with cohort fixed effects.
We present the findings in Panel B of Figures 6 through 8. In Figure 6 we estimate the
percent of firms still in business in year t, where t = 1, .., 10. In Figure 7 we estimate the
cumulative percent of firms creating at least one patent by year t; in Figure 8 we estimate
the cumulative percent of firms that received venture capital by year t. We plot both the
estimated coefficient along with the 95% confidence intervals.
First, in Panel B of Figure 6 we estimate that graduating during a period of high local
unemployment decreases the likelihood of surviving for the first four years following
establishment, slightly increases the likelihood of surviving to years five through seven,
and then has limited effects on surviving eight years of more. Given the lack of any specific
pattern, we find limited evidence labor market opportunities decrease the rate of survival.
Second, in Panel B of Figure 7 we find evidence that graduating during a poor labor market
leads to higher rates of patent creation, though the results are not always statistically31Note that in our setting we exploit variation in unemployment rates even during non-recession periods
at the national level.
37

significant at the 5% level. Third, according to Panel B of Figure 8 entrepreneurs graduating
during a period of high local unemployment are more likely to receive venture capital for
every year after establishment. Across the lifecycle of the firm, we find no evidence that
local labor market opportunities lead to a decline in average entrepreneurial quality.
Entrepreneurs Entering within Two Years of Graduation. In Table 7 we include all firms
founded by workers within five years of college graduation. However, if the costs of gradu-
ating during a recession decline over time, workers entering entrepreneurship several years
following graduation may no longer be limited by labor market opportunities. To overcome
this concern, we augment the analysis above by considering only firms started within two
years following graduation in Table 8, reducing the sample to 6,335 observations. Within
this subsample of workers, we continue to find evidence that unemployment rate increases
(rather than decreases) the likelihood of survival and venture-capital funding; however,
we no longer document any effect on patent creation. Other measures are not statistically
different from zero. Overall, we again find no support of a decrease in entrepreneurial
quality.
Entrepreneurs Graduating prior to 2005. A separate concern with our empirical frame-
work is that graduating in a poor labor market will encourage potential entrepreneurs to
more quickly start a new firm; these workers will then have more time to expand the busi-
ness and reach significant milestones. Given this concern, we next consider the subset of
workers graduating in the first half of the sample (prior to 2005) to allow all entrepreneurial
ventures the time necessary to access financing, innovate, and grow. We present the results
in Table 9: again, poor labor market opportunities do not appear to impact the mean quality
of new firms.
Entrepreneurs without Graduate Degrees (MS, JD, MBA and PhD). We have previ-
ously confirmed that students facing a tough labor market are more likely to apply and
enter graduate programs according to Panel A of Table 4. If these programs increase human
capital and improve the entrepreneurial ability of the student, firms founded by workers
38

graduating during a period of high unemployment may actually have a greater chance of
success. While this does not necessarily disqualify the results, it does limit the external
validity of the results for older workers. Therefore in Table A6, we exclude all workers
holding a graduate degree (i.e., Masters, MBA, JD, and PhD); we then include all firms
founded within five years following the entrepreneur’s graduation from college. After this
restriction, we are left with 9,296 new firms. We find evidence that workers graduating in
a weak labor market start firms that are more likely to survive and receive venture capital
funding. We find no other evidence that the labor market impacts alternative measures of
success.
5.4 Local Employment Shocks and Ex-Ante Entrepreneurial Ability
Identifying Ex-Ante Entrepreneurial Ability. Overall, we find limited evidence that
workers select into entrepreneurship based on potential ability. A potential explanation
of our findings is that even workers with the greatest entrepreneurial skills are impacted
by local employment shocks, leading to increased rates of entrepreneurship without any
decline in average quality. Testing this argument directly is challenging as it requires
identifying ex-ante predictors of entrepreneurial ability across all workers, not just those
entering entrepreneurship. In this section, we replicate our analysis on a subset of workers
especially likely to hold significant entrepreneurial abilities.
Specifically, we focus on the 115,249 workers in our sample that graduated from a
top twenty institution as defined by U.S. News and World Report. Our focus on workers
graduating from top institutions is motivated by prior evidence that city-level education
predicts both the rate and quality of entrepreneurship (Doms et al., 2010) as well as worker-
level results confirming entrepreneurial quality is related to academic achievement (Gupta
and Hacamo, 2018; Walsh and Nagaoka, 2009). In addition, we offer our own evidence that
successful entrepreneurs disproportionately graduate from one of these highly-selective
institutions. In Table 10, we analyze the set of all entrepreneurs in the sample. Across all
measures of entrepreneurial quality—survival, employment growth, access to venture-
39

capital, exit through acquisition, entering an IPO, and patent creation—we estimate that
entrepreneurs graduating from one of the top-ranked institutions are more likely to achieve
success. For instance, relative to firms created by entrepreneurs from non-elite universities,
these firms are 9% more likely to survive, 7% more likely to be financed through venture-
capital, 3% more likely to employ at least fifty workers, 2% more likely be acquired, and 2%
more likely to develop a patent.
Impact of Local Employment Shocks. Next, in Panel B of Table 4 we estimate the impact
of local employment opportunities on the underemployment rate of workers graduating
from selective institutions. We estimate that a 10 percentage point increase in the local
unemployment rate decreases the rate of employment with top finance or consulting firm
by 5 percentage points; in comparison, we estimate a 3 percentage points decline for all
other workers, and this difference is statistically significant at the one percent level. In
addition, we estimate a 10 percentage point decrease in the likelihood of joining a Russell
100 employer (compared to a similar 10 percentage point decline for all other workers)
and a 5 percentage point decrease in employment within a high-wage industry (compared
to a 4 percentage point decrease for other workers). The results offer no evidence that
employment shocks are less costly for graduates of high-ranked undergraduate institutions.
Given the results above, we expect these workers may be more likely to enter en-
trepreneurship when graduating into a poor labor market. In Panel B of Table 5, we estimate
a 10 percentage point increase in the local unemployment rate leads to a 3.1 percentage
point increase in the rate of entrepreneurship among workers graduating from top-ranked
institutions. For comparison, we estimate a 1.9 percentage point increase among all other
workers in the sample, and this difference is statistically significant at the one percent
level. In addition, we confirm the effect remains greater among graduates of high-ranked
undergraduate institutions four-years after graduation (3.6 percentage points compared
to 2.1 percentage points). Therefore, we find no evidence that increasing unemployment
rates decrease the proportion of high-performing students entering entrepreneurship.
40

Finally, in Table A5 of the online appendix, we examine whether local employment
opportunities decrease the average quality of firms founded by workers graduating from
top-ranked institutions. We consider the set of entrepreneurs starting a firm within five
years of graduation, though the results are similar if we do not place a restriction on the
time until firm creation. Across all specifications, we find graduating in a poor labor
market is associated with a greater rate of survival and venture capital, but a lower rate of
acquisition. By all other measures, we find no statistically significant effects. The results
help further confirm that local unemployment shocks have limited impacts on the quality
of entrepreneurship in the economy.
The value of this analysis is to compare workers across different institutions. Our
empirical framework explicitly compares workers graduating from the same institution,
but in the prior year. While this allows us to isolate the impact of an employment shock,
it also excludes the possibility of comparing workers across institutions. For instance, as
we have just illustrated, highly selective institutions disproportionately graduate workers
with high entrepreneurial potential; in this environment, local employment opportunities
may still reduce average entrepreneurial quality if workers from these institutions are less
impacted by the cost of employment shocks. As evidence against this argument, we have
found that workers graduating from highly-selective institutions are equally affected by
local labor market shocks and slightly more likely to enter entrepreneurship following
these shocks relative to other workers in the sample. Therefore, we find no evidence that
local employment shocks impact the entrepreneurship rates across institutions.
5.5 Local Employment Shocks and the Risk Preferences of Entrepreneurs
Risk And Ambiguity Aversion. When workers enter entrepreneurship based on their
known entrepreneurial ability, decreased labor market opportunities lower the quality
of entrepreneurship in the economy. However, the results above offer little evidence of
this hypothesis. The purpose of this next section of the paper is to offer evidence for an
alternate theory of entrepreneurship. Specifically, we test whether the decision to enter
41

entrepreneurship may depend on an individual’s risk or ambiguity preferences as opposed
to known abilities. Testing this relationship is challenging as measures of risk preferences
are generally difficult to directly observe. Due to these obstacles, we directly survey a
representative sample of the entrepreneurs included in our analysis.
We present the initial results of the survey in Panel A of Figure 5. For each year of
graduation, we plot the percent of surveyed entrepreneurs reporting high risk aversion.
In line with our hypothesis, we find entrepreneurs graduating during periods of high
unemployment (in particular 2002 and 2010) are more risk averse than entrepreneurs
graduating during other years. The results support the argument that workers sort into
entrepreneurship based on risk preferences.
For a more careful examination of the survey responses, we analyze the data under
three separate regression specifications in Table 11. First, we include separate fixed ef-
fects for each cohort and university. In the second specification, we add fixed effects for
gender and industry. We also control for the workers general confidence, confidence in
entrepreneurship, and optimism, as these traits may predict a worker’s inclination to-
wards entrepreneurship and be correlated with risk aversion. In the final specification, we
also control for the characteristics of the new firm as entrepreneurs graduating during a
recession may be more risk and ambiguity averse due to their entrepreneurial experience.
The first, second, and third column consider the responses concerning risk aversion
(Q1), while fourth through sixth columns consider ambiguity aversion (Q2). According
to our findings, an increase in the state unemployment rate leads to an increase in the
rate of risk-averse entrepreneurs. Across all three specifications, the result is statistically
significant at the one percent level. We also estimate an increase in unemployment increases
the rate of ambiguity averse entrepreneurs and the result is statistically significant at the
five percent level.
One possible concern is that risk and ambiguity aversion are not static measures, but
instead driven by entrepreneurial experiences. If this is the case, then successful en-
42

trepreneurs may be less risk and ambiguity averse. However, we find no evidence that
an entrepreneur’s risk aversion or ambiguity aversion is correlated with the success of
the new venture across any definition of success. The results helps support our argument
these preference measures are unique to the individual and do not vary across time.
Risk Tolerance of Non-Entrepreneurs. As we acknowledge above, we are only able
to observe risk and ambiguity tolerance as of 2019, rather than prior to entry into the
workforce. This is a potential concern if risk and ambiguity vary across time (Cohn et al.,
2015; Guiso et al., 2018); in our setting, workers graduating in a period of weak labor market
opportunities may then develop a preference against risk and ambiguity. This will lead all
workers, including entrepreneurs, to report higher risk and ambiguity aversion. This can
offer an alternative explanation of Table 11.
To overcome this concern, we also survey 508 workers that have never started a firm. We
argue that if risk and ambiguity preferences are influenced by business cycle dynamics, this
effect will likely be present among both entrepreneurs and non-entrepreneurs. According
to Figure 4, we estimate a higher rate of risk and ambiguity-aversion of non-entrepreneurs
compared to entrepreneurs. In particular, we estimate 46% of non-entrepreneurs are defined
as risk-averse according to our measure (compared to 35% of entrepreneurs). Similarly,
we estimate 53% of non-entrepreneurs have are ambiguity-averse (compared to 40% of
entrepreneurs). As these differences are statistically different, the results further support
the argument that workers sort into entrepreneurship based on risk preferences.
We offer two pieces of evidence that non-entrepreneurs graduating in a poor labor
market are not more risk or ambiguity-averse. First, we plot the proportion of risk-averse
non-entrepreneurs by year of graduation in Panel B of Figure 5. According to the figure, we
first note a high percentage of non-entrepreneurs are risk-averse compared to entrepreneurs
graduating in the same year. Second, we note the risk-aversion of non-entrepreneurs does
not increase during periods of high unemployment; if anything, we estimate risk-aversion
is greatest among workers graduating during a period of low unemployment.
43

Second, we present these results in regression-form in Table 12. In the first and second
column we evaluate risk-aversion, while the third and fourth column evaluate ambiguity-
aversion. In addition, we include cohort fixed effects in all specifications as well as university
fixed effects in the second and fourth column. We estimate that an increase in the local
unemployment rate decreases the proportion of risk-aversion and ambiguity-averse work-
ers, though the result is not statistically significant once we include university fixed effects.
This is at odds with prior arguments that risk aversion increases following periods of poor
labor market opportunities. Overall, we find limited evidence that recessions lead to more
risk-averse workers in our sample.
Alternate Behavioral Explanations. Confirming that workers select into entrepreneur-
ship based on risk and ambiguity tolerance is difficult as we are not able to observe and
control for all other selection factors, especially behavioral factors. To partially alleviate
this concern, we next verify that the workers in our sample do not appear to select into
entrepreneurship based on alternative behavioral characteristics. In Panel A and B of
Table 13 we examine the relationship between local employment opportunities and the
behavioral traits of entrepreneurs. In contrast with our hypothesis, we find a positive
relationship between local unemployment rates and future salary expectations. Across all
other measures, we find no evidence that entrepreneurs graduating in poor labor markets
are less confident in their entrepreneurial abilities, less confident in their general abilities,
or less optimistic. The results offer an additional confirmation that risk and ambiguity
aversion are unique and valid predictors of entry to entrepreneurship.
6 Conclusion
This paper evaluates whether local labor market opportunities impact the rate and compo-
sition of entrepreneurship. We find individuals graduating in a weak local labor market
are not only more likely to be underemployed, but also more likely to start a firm. How-
ever, developing multiple measures of entrepreneurial success, we find no evidence that
44

business formed during recession years perform worse than non-recession firms. Instead,
entrepreneurs graduating during a recession are more risk and ambiguity averse despite
no difference in their actual quality. As a result, our findings support the (Kihlstrom and
Laffont, 1979) view of entrepreneurship based on risk preferences, while rejecting the
argument that workers select into entrepreneurship based on ability (Lucas Jr, 1978).
More broadly, this paper highlights the current data limitations researchers face when
studying firm creation. Current datasets lack detailed information on both founder char-
acteristics (such as occupation and education) as well as the attributes of small firms
(employment size, revenue, financial access). By relying on newly hand-collected data from
LinkedIn, we have developed a unique dataset covering over 640,000 college graduates
across the United States. This dataset represents over 3% of all students graduating from an
undergraduate institution during this period. We then combine this data with worker-level
surveys detailing behavioral preferences not otherwise observable. Collectively, this paper
illustrates the value of this data for research purposes, especially to understand dynamics
and preferences of workers entering entrepreneurship.
45

ReferencesP. Aghion, P. Howitt, M. Brant-Collett, and C. Garcia, D.a-Penalosa. Endogenous growth theory. MIT press,
1998.
A. Agrawal and P. Tambe. Private equity and workers’ career paths: the role of technological change. The
Review of Financial Studies, 29(9):2455–2489, 2016.
M. Aguiar, E. Hurst, and L. Karabarbounis. Time use during the great recession. The American Economic
Review, 103(5):1664–1696, 2013.
T. Ahn. Attitudes toward risk and self-employment of young workers. Labour Economics, 17(2):434–442, 2010.
J. G. Altonji, L. B. Kahn, and J. D. Speer. Cashier or consultant? Entry labor market conditions, field of study,
and career success. Journal of Labor Economics, 34(S1):S361–S401, 2016.
T. Astebro, S. A. Jeffrey, and G. K. Adomdza. Inventor perseverance after being told to quit: The role of
cognitive biases. Journal of Behavioral Decision Making, 20(3):253–272, 2007.
T. Astebro, H. Herz, R. Nanda, and R. A. Weber. Seeking the roots of entrepreneurship: Insights from
behavioral economics. Journal of Economic Perspectives, 28(3):49–70, 2014.
T. Babina. Destructive creation at work: How financial distress spurs entrepreneurship. Available at SSRN,
2015.
R. Baghai, R. Silva, V. Thell, and V. Vig. Talent in distressed firms: Labor fragility and capital structure.
Technical report, Working paper, Stockholm School of Economics and London Business School, 2015.
W. J. Baumol. Entrepreneurship in economic theory. The American Economic Review, pages 64–71, 1968.
D. N. Bell and D. G. Blanchflower. Young people and the great recession. Oxford Review of Economic Policy, 27
(2):241–267, 2011.
P. Belley and L. Lochner. The changing role of family income and ability in determining educational
achievement. Technical report, National Bureau of Economic Research, 2007.
O. Bengtsson and D. Ekeblom. The bright but right view? A new type of evidence on entrepreneurial
optimism. 2014.
J. Brown and D. A. Matsa. Boarding a sinking ship? An investigation of job applications to distressed firms.
Technical report, National Bureau of Economic Research, 2012.
46

C. Camerer and D. Lovallo. Overconfidence and excess entry: An experimental approach. American Economic
Review, 89(1):306–318, 1999.
A. Cohn, J. Engelmann, E. Fehr, and M. A. Marechal. Evidence for countercyclical risk aversion: An experiment
with financial professionals. American Economic Review, 105(2):860–85, 2015.
J. S. Cramer, J. Hartog, N. Jonker, and C. M. Van Praag. Low risk aversion encourages the choice for
entrepreneurship: An empirical test of a truism. Journal of Economic Behavior & Organization, 48(1):29–36,
2002.
R. Decker, J. Haltiwanger, R. Jarmin, and J. Miranda. The role of entrepreneurship in US job creation and
economic dynamism. The Journal of Economic Perspectives, pages 3–24, 2014.
F. Delmar and P. Davidsson. Where do they come from? Prevalence and characteristics of nascent en-
trepreneurs. Entrepreneurship & regional development, 12(1):1–23, 2000.
M. Doms, E. Lewis, and A. Robb. Local labor force education, new business characteristics, and firm
performance. Journal of Urban Economics, 67(1):61–77, 2010.
D. S. Evans and L. S. Leighton. Some empirical aspects of entrepreneurship. The American Economic Review,
pages 519–535, 1989.
D. S. Evans and L. S. Leighton. Small business formation by unemployed and employed workers. Small
business economics, 2(4):319–330, 1990.
R. W. Fairlie and A. M. Robb. Gender differences in business performance: Evidence from the characteristics
of business owners survey. Small Business Economics, 33(4):375, 2009.
H. S. Farber. Alternative and part-time employment arrangements as a response to job loss. Technical report,
National Bureau of Economic Research, 1999.
A. Foote. Where do college graduates go for jobs? U.S. Census Bureau America Counts; Behind the Numbers,
2019.
T. C. Fort, J. Haltiwanger, R. S. Jarmin, and J. Miranda. How firms respond to business cycles: The role of
firm age and firm size. IMF Economic Review, 61(3):520–559, 2013.
Gallup. Many potential entrepreneurs aren’t taking the plunge. Business Journal, 2014.
J. D. Gottlieb, R. R. Townsend, and T. Xu. Experimenting with entrepreneurship: The effect of job-protected
leave. 2016.
47

J. R. Graham, H. Kim, S. Li, and J. Qiu. Human capital loss in corporate bankruptcy. Available at SSRN
2276753, 2013.
J. Grogger and E. Eide. Changes in college skills and the rise in the college wage premium. Journal of Human
Resources, pages 280–310, 1995.
L. Guiso, P. Sapienza, and L. Zingales. Time varying risk aversion. Journal of Financial Economics, 128(3):
403–421, 2018.
N. Gupta and I. Hacamo. Superstar (and entrepreneurial) engineers in finance jobs. Technical report, Kelley
School of Business, Indiana University, 2018.
R. E. Hall and S. E. Woodward. The burden of the nondiversifiable risk of entrepreneurship. American
Economic Review, 100(3):1163–94, 2010.
B. H. Hamilton. Does entrepreneurship pay? An empirical analysis of the returns to self-employment. Journal
of Political Economy, 108(3):604–631, 2000.
H. J. Holm, S. Opper, and V. Nee. Entrepreneurs under uncertainty: An economic experiment in china.
Management Science, 59(7):1671–1687, 2013.
J. Hombert, A. Schoar, D. A. Sraer, and D. Thesmar. Can unemployment insurance spur entrepreneurial
activity? Evidence from france. HEC Paris Research Paper No. FIN-2013-1020, 2019.
E. Hurst and A. Lusardi. Liquidity constraints, household wealth, and entrepreneurship. Journal of Political
Economy, 112(2):319–347, 2004.
H. K. Hvide and G. A. Panos. Risk tolerance and entrepreneurship. Journal of Financial Economics, 111(1):
200–223, 2014.
L. S. Jacobson, R. J. LaLonde, and D. G. Sullivan. Earnings losses of displaced workers. The American Economic
Review, pages 685–709, 1993.
J. Jeffers. The impact of restricting labor mobility on corporate investment and entrepreneurship. Working
Paper, 2018.
J. E. Jennings and C. G. Brush. Research on women entrepreneurs: challenges to (and from) the broader
entrepreneurship literature? The Academy of Management Annals, 7(1):663–715, 2013.
M. T. Johnson. The impact of business cycle fluctuations on graduate school enrollment. Economics of education
review, 34:122–134, 2013.
48

L. B. Kahn. The long-term labor market consequences of graduating from college in a bad economy. Labour
Economics, 17(2):303–316, 2010.
R. E. Kihlstrom and J.-J. Laffont. A general equilibrium entrepreneurial theory of firm formation based on
risk aversion. Journal of political economy, 87(4):719–748, 1979.
F. H. Knight. Cost of production and price over long and short periods. Journal of Political Economy, 29(4):
304–335, 1921.
M. Koudstaal, R. Sloof, and M. Van Praag. Risk, uncertainty, and entrepreneurship: Evidence from a
lab-in-the-field experiment. Management Science, 62(10):2897–2915, 2015.
K. Liu, K. G. Salvanes, and E. Ø. Sørensen. Good skills in bad times: Cyclical skill mismatch and the long-term
effects of graduating in a recession. European Economic Review, 84:3–17, 2016.
R. E. Lucas. On the mechanics of economic development. Journal of monetary economics, 22(1):3–42, 1988.
R. E. Lucas Jr. On the size distribution of business firms. The Bell Journal of Economics, pages 508–523, 1978.
S. Moreira. Firm dynamics, persistent effects of entry conditions, and business cycles. 2016.
G. Moscarini and F. Postel-Vinay. The contribution of large and small employers to job creation in times of
high and low unemployment. American Economic Review, 102(6):2509–39, 2012.
T. J. Moskowitz and A. Vissing-Jørgensen. The returns to entrepreneurial investment: A private equity
premium puzzle? American Economic Review, 92(4):745–778, 2002.
National Center for Education Statistics. Characteristics of postsecondary students. The Condition of Education,
2017.
National Center for Education Statistics. Digest of education statistics, 2018.
P. Oreopoulos, T. Von Wachter, and A. Heisz. The short-and long-term career effects of graduating in a
recession. American Economic Journal: Applied Economics, 4(1):1–29, 2012.
P. Ouimet and R. Zarutskie. Who works for startups? the relation between firm age, employee age, and
growth. Journal of Financial economics, 112(3):386–407, 2014.
P. Oyer. Initial labor market conditions and long-term outcomes for economists. Journal of Economic Perspectives,
20(3):143–160, 2006.
49

P. Oyer. The making of an investment banker: Stock market shocks, career choice, and lifetime income. The
Journal of Finance, 63(6):2601–2628, 2008.
S. C. Parker. The economics of entrepreneurship. Cambridge University Press, 2009.
M. Puri and D. T. Robinson. Optimism and economic choice. Journal of Financial economics, 86(1):71–99, 2007.
A. M. Robb and D. T. Robinson. The capital structure decisions of new firms. Review of Financial Studies,
pages 153–179, 2012.
C. J. Ruhm. Are workers permanently scarred by job displacements? The American Economic Review, pages
319–324, 1991.
A. Sahin, J. Song, G. Topa, and G. L. Violante. Mismatch unemployment. 2012.
A. Schoar. The divide between subsistence and transformational entrepreneurship. Innovation policy and the
economy, 10(1):57–81, 2010.
A. Schoar and L. Zuo. Shaped by booms and busts: How the economy impacts ceo careers and management
styles. The Review of Financial Studies, 30(5):1425–1456, 2017.
E. L. Scott, P. Shu, R. M. Lubynsky, et al. Are better ideas more likely to succeed? An empirical analysis of
startup evaluation. Harvard Business School Technology & Operations Mgt. Unit Working Paper, 45(16-013),
2015.
S. Shane. Fool’s Gold?: The truth behind angel investing in America. Oxford University Press, 2008.
J. P. Walsh and S. Nagaoka. Who invents? Evidence from the Japan & US inventor survey. RIETI Discussion
papers, 2009.
A. Wozniak. Going away to college? School distance as a barrier to higher education. Econofact, 2018.
D. Yagan. Employment hysteresis from the great recession. Journal of Political Economy, 2019.
50

Figure 1: LinkedIn Coverage across IndustriesThis figure presents the industry composition of (i) the U.S. workforce and (ii) U.S. Linkedin users. We use data from LinkedIn’s website
as of October 2019 to estimate the employment figures in each industry for all users on the platform. The industry distribution for the
U.S. workforce is estimated using the BEA employment data in 2018. The x-axis plots the 2-digit NAICS industry classifications, and
the y-axis reports the employment numbers in millions.
010
2030
40N
um E
mpl
oyee
s on
Link
edin
(mill
ions
)
Agricultu
re & M
ining
Constructi
on
Education an
d Heal
th
Financia
l Acti
vities
Informati
on
Leisure,
Hosp
itality
Manufac
turing
Other Se
rvices
Professio
nal & Se
rvices
Public Administ
ration
Trade, T
rans, U
tilitie
s
Linkedin Census
51

Figure 2: Coverage of US College GraduatesThis figure reports the fraction of all students graduating from a U.S. undergraduate institution covered by our sample in each year
between 1998 and 2012. The figures for the population of U.S. college graduates are collected from National Center for Education
Statistics. The y-axis reports the coverage ratio in percentages.
01
23
45
Cov
erag
e R
atio
(%)
1998 2000 2002 2004 2006 2008 2010 2012Graduation Year
52
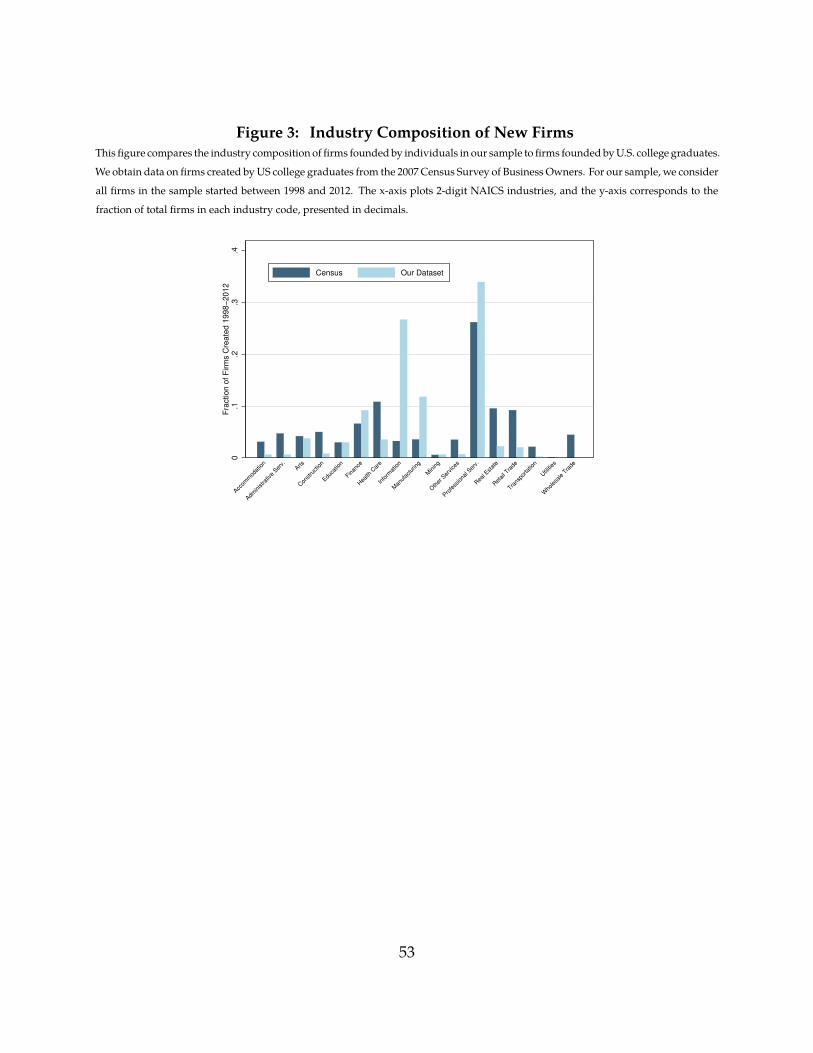
Figure 3: Industry Composition of New FirmsThis figure compares the industry composition of firms founded by individuals in our sample to firms founded by U.S. college graduates.
We obtain data on firms created by US college graduates from the 2007 Census Survey of Business Owners. For our sample, we consider
all firms in the sample started between 1998 and 2012. The x-axis plots 2-digit NAICS industries, and the y-axis corresponds to the
fraction of total firms in each industry code, presented in decimals.
0.1
.2.3
.4F
ractio
n o
f F
irm
s C
rea
ted
19
98
−2
01
2
Accom
mod
ation
Administra
tive
Serv.
Arts
Con
stru
ction
Educa
tion
Finan
ce
Hea
lth C
are
Info
rmat
ion
Man
ufac
turin
g
Mining
Oth
er S
ervice
s
Profe
ssiona
l Ser
v.
Rea
l Estat
e
Ret
ail T
rade
Trans
porta
tion
Utilities
Who
lesa
le T
rade
Census Our Dataset
53

Figure 4: Risk Preferences of Entrepreneurs and Waged WorkersThis figure presents the fraction of entrepreneurs and waged workers classified as risk-averse and ambiguity-averse. Individuals are
classified as risk- and ambiguity-averse according to their response to survey questions as described in the Data section. Entrepreneurs
and waged workers workers included in the survey are a subsample of workers in the full dataset. The figure also includes the 95%
confidence intervals..3
.35
.4.4
5.5
.55
Risk aversion Risk ambiguity
Employees Entrepreneurs
54
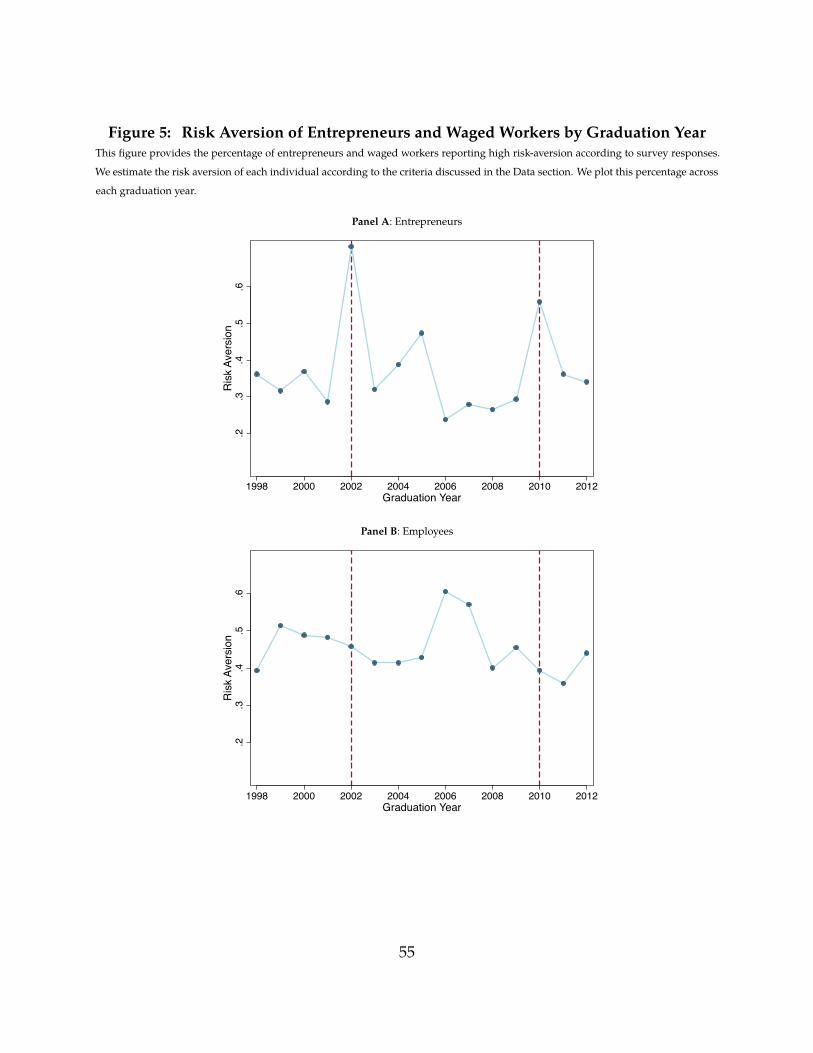
Figure 5: Risk Aversion of Entrepreneurs and Waged Workers by Graduation YearThis figure provides the percentage of entrepreneurs and waged workers reporting high risk-aversion according to survey responses.
We estimate the risk aversion of each individual according to the criteria discussed in the Data section. We plot this percentage across
each graduation year.
Panel A: Entrepreneurs.2
.3.4
.5.6
Ris
k Av
ersi
on
1998 2000 2002 2004 2006 2008 2010 2012Graduation Year
Panel B: Employees
.2.3
.4.5
.6R
isk
Aver
sion
1998 2000 2002 2004 2006 2008 2010 2012Graduation Year
55

Figure 6: Survival Rate of New FirmsIn Panel A, we compare survival rates for firms created by “voluntary” and “forced” entrepreneurs. For each year of graduation, we
split workers based on whether the U.S. state where their undergraduate institution is located experienced unemployment above or
below the median across all U.S. states in that year. We classify entrepreneurs graduating in states with above median unemployment
as “forced” and those below the median unemployment rate as “voluntary”. We then estimate the mean survival rate for each group
at each point in the firm lifecycle. In Panel B, we plot the estimated regression coefficients of local labor market opportunities on the
firm survival rate. We estimate this relationship separately for each year x following firm establishment:
Survival Ratexi,t = β × Unemploymenti,t→t+1 + University × Gender × Cohort FE + Industry FE + ηi,t
Unemployment measures the unemployment rate in the state where the undergraduate institution is located. Cohort FE is a fixed effect
for all students graduating in the same major and in a two-year span. University FE is a fixed effect for each undergraduate institution.
Gender FE is a fixed effect for gender. Industry FE is a fixed effect for the industry of the new firm. We cluster standard errors at the
state-year level and we provide the 95% confidence intervals.
Panel A: Cross-Sectional Means Comparison
20
40
60
80
100
Surv
ived (
%)
0 2 4 6 8 10Years Since Firm Creation
Voluntary Forced
Panel B: Regression Coefficients
-3-2
-10
12
3Es
timat
ed C
oeffi
ent o
n Su
rviv
al
0 2 4 6 8 10Years Since Firm Creation
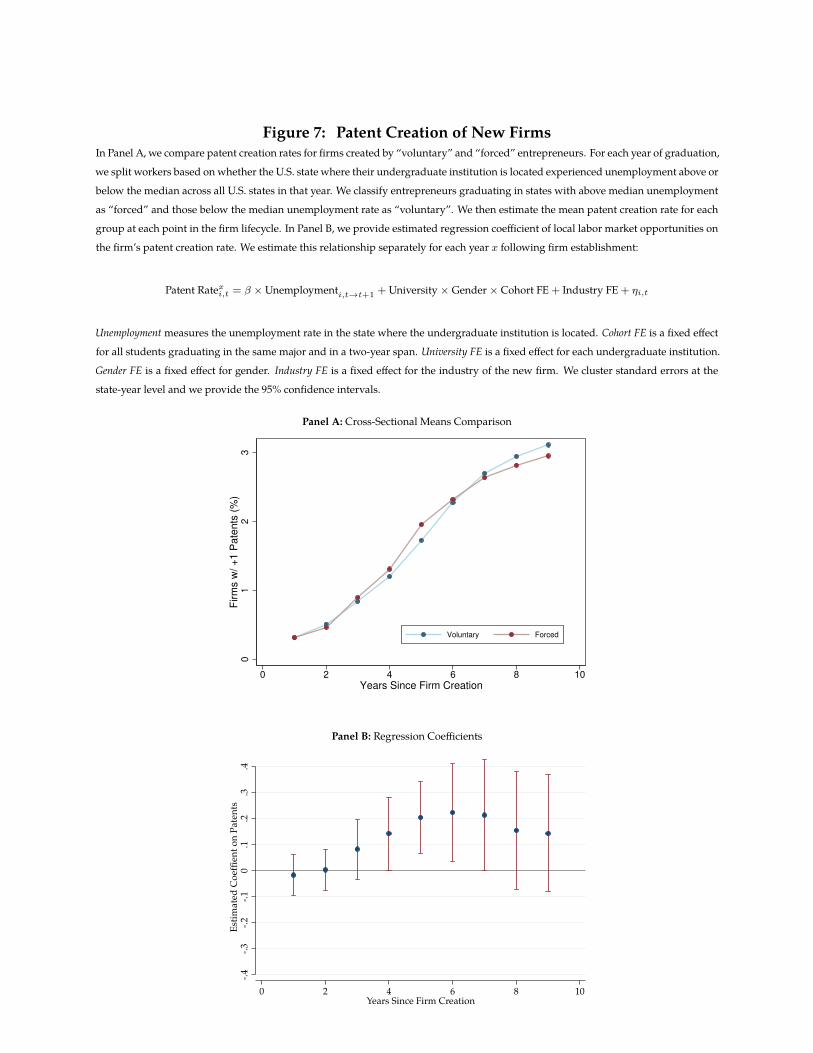
Figure 7: Patent Creation of New FirmsIn Panel A, we compare patent creation rates for firms created by “voluntary” and “forced” entrepreneurs. For each year of graduation,
we split workers based on whether the U.S. state where their undergraduate institution is located experienced unemployment above or
below the median across all U.S. states in that year. We classify entrepreneurs graduating in states with above median unemployment
as “forced” and those below the median unemployment rate as “voluntary”. We then estimate the mean patent creation rate for each
group at each point in the firm lifecycle. In Panel B, we provide estimated regression coefficient of local labor market opportunities on
the firm’s patent creation rate. We estimate this relationship separately for each year x following firm establishment:
Patent Ratexi,t = β × Unemploymenti,t→t+1 + University × Gender × Cohort FE + Industry FE + ηi,t
Unemployment measures the unemployment rate in the state where the undergraduate institution is located. Cohort FE is a fixed effect
for all students graduating in the same major and in a two-year span. University FE is a fixed effect for each undergraduate institution.
Gender FE is a fixed effect for gender. Industry FE is a fixed effect for the industry of the new firm. We cluster standard errors at the
state-year level and we provide the 95% confidence intervals.
Panel A: Cross-Sectional Means Comparison
01
23
Firm
s w
/ +
1 P
ate
nts
(%
)
0 2 4 6 8 10Years Since Firm Creation
Voluntary Forced
Panel B: Regression Coefficients
-.4-.3
-.2-.1
0.1
.2.3
.4Es
timat
ed C
oeffi
ent o
n Pa
tent
s
0 2 4 6 8 10Years Since Firm Creation

Figure 8: Venture Capital Financing of New FirmsIn Panel A, we compare access to venture capital between “voluntary” and “forced” entrepreneurs”. For each year of graduation, we
split workers based on whether the U.S. state where their undergraduate institution is located experienced unemployment above or
below the median across all U.S. states in that year. We classify entrepreneurs graduating in states with above median unemployment
as “forced” and those below the median unemployment rate as “voluntary”. We then estimate the mean access to venture capital for
each group at each point in the firm lifecycle. In Panel B, we provide estimated regression coefficient of local labor market opportu-
nities on the likelihood of receiving venture capital financing. We estimate this relationship separately for each year x following firm
establishment:
VC Funding Ratexi,t = β × Unemploymenti,t→t+1 + University × Gender × Cohort FE + Industry FE + ηi,t
Unemployment measures the unemployment rate in the state where the undergraduate institution is located. Cohort FE is a fixed effect
for all students graduating in the same major and in a two-year span. University FE is a fixed effect for each undergraduate institution.
Gender FE is a fixed effect for gender. Industry FE is a fixed effect for the industry of the new firm. We cluster standard errors at the
state-year level and we provide the 95% confidence intervals.
Panel A: Cross-Sectional Means Comparison
24
68
10
12
Firm
s w
/ V
C F
undin
g >
0 (
%)
0 2 4 6 8 10Years Since Firm Creation
Voluntary Forced
Panel B: Regression Coefficients
-1-.5
0.5
11.
52
Estim
ated
Coe
ffien
t on
VC
Fun
ding
0 2 4 6 8 10Years Since Firm Creation

Table 1: Data Summary of WorkersThis table reports the summary statistics of all individuals in our sample. Panel A summarizes the individual-level characteristics.
Panel B summarizes their undergraduate institutions.
Panel A: Summary Statistics of All Individuals
N Mean Std 50th 90th
Unemployment at Graduation 641144 0.063 0.021 0.057 0.095
Graduation Year 641144 2004.9 4.11 2005 2011
Top 20 College 641144 0.18 0.38 0 1
Female 641144 0.36 0.48 0 1
Engineering Major 641144 0.27 0.44 0 1
Business/Econ Major 641144 0.16 0.36 0 1
Grad. School within 5 years 641144 0.20 0.40 0 1
Top Finance/Consulting Job 641144 0.049 0.22 0 0
Russell 1000 Job 641144 0.25 0.44 0 1
Avg Industry Wage 617714 61.8 9.97 65.2 69.1
Founder within 1 Year 641144 0.022 0.15 0 0
Founder within 2 Years 641144 0.028 0.16 0 0
Founder within 3 Years 641144 0.033 0.18 0 0
Founder within 4 Years 641144 0.039 0.19 0 0
Panel B: Summary Statistics of Undergraduate Institutions
N Mean Std 50th 90th
Annual Tuition in USD 639782 22269.2 16352.6 13509 50494.8
Year Founded 638142 1889.1 97.2 1885.0 1944.4
Total Enrollment 632803 30327.4 24556.3 25006.8 65085.2
Acceptance Rate (%) 633383 50.8 24.1 53.3 80.2
Public University 641144 0.75 0.43 1 1
59

Table 2: Data Summary of EntrepreneursThis table reports the summary statistics for all entrepreneurs in the sample. The first four rows present characteristics of the individuals
who became entrepreneurs, while the remainder of the rows present properties of the firms created by them.
N Mean Std 50th 90th
Top 20 College 36316 0.36 0.48 0 1
Engineering Major 36316 0.35 0.48 0 1
Business/Econ Major 36316 0.16 0.37 0 1
Female 36316 0.21 0.41 0 1
Firm Survival to 2019 36316 0.24 0.42 0 1
> 10 Employees 36316 0.14 0.35 0 1
> 20 Employees 36316 0.094 0.29 0 0
> 50 Employees 36316 0.051 0.22 0 0
Log(# Current Employees) 36316 0.78 1.41 0 2.89
Log(VC Funding) 36316 1.80 4.97 0 12.7
VC Funding > 0 36316 0.15 0.36 0 1
VC Funding > 0 in 5 years 36316 0.12 0.33 0 1
Num Patents > 0 36316 0.060 0.24 0 0
Patents > 0 in 5y 36316 0.025 0.16 0 0
Acquired 36316 0.045 0.21 0 0
Initial Public Offering 36316 0.0039 0.062 0 0
60

Table 3: Data Summary of Survey ResponsesThis table reports the summary statistics of all survey responses. Panel A summarizes the survey responses of the 622 entrepreneurs
surveyed. Panel B summarizes the survey responses of the 508 non-entrepreneurs surveyed. The survey questions are detailed in the
Data section. Panel B also provides individual characteristics observed in our dataset. Table A2 presents the characteristics of firms
created by the surveyed entrepreneurs and compares them to the full population of entrepreneurs in our sample.
Panel A: Survey Responses of Entrepreneurs
N Mean Std 50th 90th
Risk Aversion 622 0.35 0.48 0 1
Ambiguity Aversion 622 0.40 0.49 0 1
Entre. Overconfidence (Acquired) 622 0.31 0.46 0 1
Entre. Overconfidence (Employment) 622 0.44 0.50 0 1
Salary Overconfidence 622 0.41 0.49 0 1
Preference for Competition 622 0.27 0.45 0 1
Stock Market Optimism 622 0.41 0.49 0 1
Life Expectancy Overoptimism 622 0.10 0.31 0 1
Panel B: Survey Responses of Non-Entrepreneurs
N Mean Std 50th 90th
Top 20 College 508 0.21 0.41 0 1
Female 508 0.27 0.45 0 1
Engineering Major 508 0.25 0.43 0 1
Business/Econ Major 508 0.19 0.39 0 1
Risk Aversion 508 0.46 0.50 0 1
Ambiguity Aversion 508 0.53 0.50 1 1
61

Table 4: Do Labor Shocks Impact the Rate of Underemployment?This table reports the impact of a change in the local unemployment rate on the job outcomes of college graduates. Panel A analyzes the set of all workers in our sample. PanelB separately analyzes the subset of workers graduating from a top twenty ranked undergraduate institution, and workers graduating from all other institutions. The dependentvariable is a binary variable measuring career outcomes following graduation. We examine four career outcomes. First, Top Finance/Consulting measures the percent of workersgaining employment with a top finance or consulting firm; second, Russell 1000 measures the percent of workers gaining employment with a firm listed in the Russell 1000 Index;third, High-wage Industry measures the percent of workers gaining employment within a high-wage industry; and Graduate School measures the percent of workers entering agraduate program (MS, MBA, JD, or PhD) following college graduation. Unemployment at Graduation measures the unemployment rate in the state where the undergraduateinstitution is located. Cohort FE is a fixed effect for all students graduating in the same major and in a two-year span. University FE is a fixed effect for each undergraduateinstitution.Gender FE is a fixed effect for each gender. The variable diff in Panel B corresponds to the difference between the estimated coefficients in the two subsamples (Top-20versus Non-Top 20). We use * to denote significance at the 10% level, ** to denote significance at the 5% level, and *** to denote significance at the 1% level. We cluster standarderrors at the state-year level.
Panel A: All Workers
Top Finance/Consulting Russell 1000 High-wage Industry Graduate School
Unemployment at Graduation -0.294*** -0.350*** -0.861*** -0.976*** -3.850*** -4.581*** 0.801*** 0.845***(-8.47) (-10.70) (-10.98) (-13.49) (-3.59) (-4.85) (9.48) (9.70)
Cohort FE Yes No Yes No Yes No Yes NoGender FE Yes No Yes No Yes No Yes NoUniversity FE Yes No Yes No Yes Yes NoUniversity × Gender × Cohort FE No Yes No Yes No Yes No YesN 641144 641144 641144 641144 617714 617714 641144 641144R-squared .062 .12 .031 .087 .062 .12 .035 .094
Panel B: Workers from Top-20 Schools versus Non Top-20 Universities
Top Finance/Consulting Russell 1000 High-wage Industry Graduate School
Top 20 Non-Top 20 diff Top 20 Non-Top 20 diff Top 20 Non-Top 20 diff Top 20 Non-Top 20 diffUnemployment at Graduation -0.532*** -0.299*** -0.233*** -0.960*** -0.981*** 0.020 -5.131*** -4.427*** -0.704 0.929*** 0.821*** 0.108
(-6.38) (-8.98) (-2.71) (-8.41) (-12.64) (0.17) (-3.70) (-3.65) (-0.35) (5.07) (10.71) (0.68)University × Gender × Cohort FE Yes Yes Yes Yes Yes Yes Yes Yes Yes Yes Yes YesN 115249 525895 641144 115249 525895 641144 111089 506625 617714 115249 525895 641144R-squared .09 .12 .12 .048 .096 .087 .049 .13 .12 .038 .11 .094

Table 5: Do Labor Shocks Impact the Rate of Entrepreneurship?This table reports the impact of a change in the local unemployment rate on the likelihood that individuals become entrepreneurs. Panel A analyzes the set of all workers in oursample. Panel B separately analyzes the subset of workers graduating from a top twenty ranked undergraduate institution, and workers graduating from all other institutions.The dependent variable is a binary variable measuring whether the worker founded a firm with x years following graduation. We examine x varying from 1 to 4 years aftergraduation. Unemployment at Graduation measures the unemployment rate in the state where the undergraduate institution is located. Cohort FE is a fixed effect for all studentsgraduating in the same major and in a two-year span. University FE is a fixed effect for each undergraduate institution. Gender FE is a fixed effect for each gender. The variable diffin Panel B corresponds to the difference between the estimated coefficients in the two subsamples (Top-20 versus Non-Top 20). We use * to denote significance at the 10% level, **to denote significance at the 5% level, and *** to denote significance at the 1% level. We cluster standard errors at the state-year level.
Panel A: All Workers
1-y post college 2-y post college 3-y post college 4-y post college
(i) (ii) (i) (ii) (i) (ii) (i) (ii)Unemployment at Graduation 0.183*** 0.214*** 0.199** 0.236*** 0.194** 0.237*** 0.194** 0.240***
(3.13) (4.23) (2.88) (3.91) (2.47) (3.43) (2.47) (3.23)Cohort FE Yes No Yes No Yes No Yes NoGender FE Yes No Yes No Yes No Yes NoUniversity FE Yes No Yes No Yes No Yes NoUniversity × Gender × Cohort FE No Yes No Yes No Yes No YesN 641144 641144 641144 641144 641144 641144 641144 641144R-squared .014 .071 .014 .072 .014 .07 .014 .069
Panel B: Workers from Top-20 vs Non-Top 20 Universities
1-y post college 2-y post college 3-y post college 4-y post college
Top 20 Non-Top 20 diff Top 20 Non-Top 20 diff Top 20 Non-Top 20 diff Top 20 Non-Top 20 diffUnemployment at Graduation 0.313*** 0.186*** 0.127*** 0.303*** 0.217*** 0.086** 0.314*** 0.215*** 0.099* 0.358*** 0.207*** 0.151**
(6.34) (3.66) (4.46) (4.14) (3.82) (2.53) (3.28) (3.50) (2.08) (3.25) (3.22) (2.51)University × Gender × Cohort FE Yes Yes Yes Yes Yes Yes Yes Yes Yes Yes Yes YesN 115249 525895 641144 115249 525895 641144 115249 525895 641144 115249 525895 641144R-squared .019 .086 .071 .02 .087 .072 .019 .084 .07 .021 .083 .069

Table 6: Do Labor Shocks Impact the Rate of (Good) Entrepreneurship?This table reports the impact of a change in the local unemployment rate on the likelihood that individuals create good firms. Relative
to the previous table, we restrict the definition of entrepreneurship to exclude self-employment and firms that are small, subsistence,
and non-transformational. In Panel A, we measure whether a firm is good based on firm survival and current employment of at least
x workers. More concretely, the first and second columns define success based on survival; the third and fourth columns measure
success as currently employing at least 10 workers; the fifth and sixth columns measure success as currently employing at least 20
workers; the seventh and eighth columns measure success as currently employing at least 50 workers. In Panel B, we assess whether
a firm is good based on patent creation, access to capital through venture-capital and public offerings, exit through acquisition, and
exit through successful completion of an IPO. Specifically, in the first and second columns, we measure success as creating at least one
patent within five years of founding; in the third and fourth columns, we measure success based on access to venture capital funding
within five years of founding; in the fifth and sixth columns, we measure success as exit through acquisition; and, in the seventh and
eighth columns, we measure success as entering an initial public offering. Unemployment at Graduation measures the unemployment
rate in the state where the undergraduate institution is located. Cohort FE is a fixed effect for all students graduating in the same major
and in a two-year span. University FE is a fixed effect for each undergraduate institution. Gender FE is a fixed effect for each gender. We
use * to denote significance at the 10% level, ** to denote significance at the 5% level, and *** to denote significance at the 1% level. We
cluster standard errors at the state-year level.
Panel A: Survival and Employment
Survived > 10 emp > 20 emp > 50 emp
Unemployment at Graduation 0.043*** 0.048*** 0.012** 0.015** 0.010** 0.011** 0.007** 0.009***
(3.39) (4.33) (2.19) (2.86) (2.55) (2.97) (2.82) (3.74)
Cohort FE Yes No Yes No Yes No Yes No
Gender FE Yes No Yes No Yes No Yes No
University FE Yes No Yes No Yes No Yes No
University × Gender × Cohort FE No Yes No Yes No Yes No Yes
N 641144 641144 641144 641144 641144 641144 641144 641144
R-squared .0075 .038 .0061 .033 .0046 .027 .0032 .027
Panel B: Patents, Access to Financing, Acquisition, and IPO
Patents > 0 VC Funding > 0 Acquired IPO
Unemployment at Graduation 0.008* 0.010** 0.027*** 0.029*** 0.007** 0.007** 0.000 0.001
(2.08) (2.58) (3.19) (3.39) (2.75) (2.73) (0.60) (0.98)
Cohort FE Yes No Yes No Yes No Yes No
Gender FE Yes No Yes No Yes No Yes No
University FE Yes No Yes No Yes No Yes No
University × Gender × Cohort FE No Yes No Yes No Yes No Yes
N 641144 641144 641144 641144 641144 641144 641144 641144
R-squared .0044 .043 .0057 .031 .0028 .024 .0018 .028
64
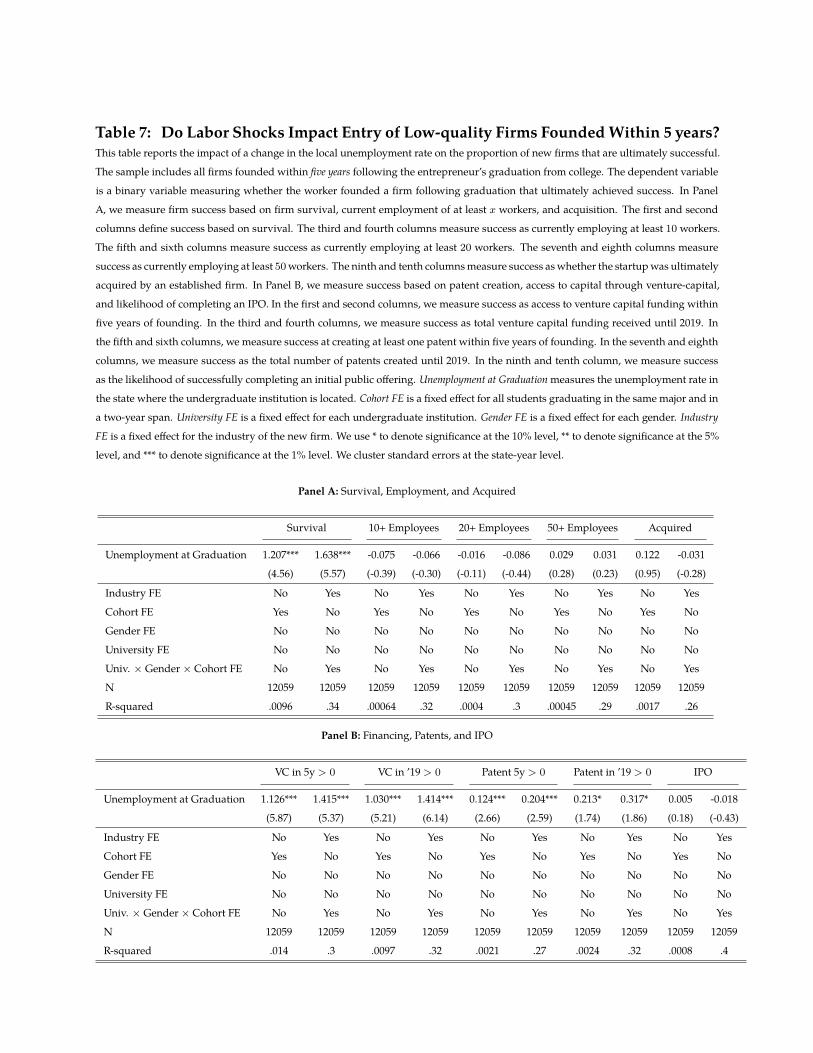
Table 7: Do Labor Shocks Impact Entry of Low-quality Firms Founded Within 5 years?This table reports the impact of a change in the local unemployment rate on the proportion of new firms that are ultimately successful.
The sample includes all firms founded within five years following the entrepreneur’s graduation from college. The dependent variable
is a binary variable measuring whether the worker founded a firm following graduation that ultimately achieved success. In Panel
A, we measure firm success based on firm survival, current employment of at least x workers, and acquisition. The first and second
columns define success based on survival. The third and fourth columns measure success as currently employing at least 10 workers.
The fifth and sixth columns measure success as currently employing at least 20 workers. The seventh and eighth columns measure
success as currently employing at least 50workers. The ninth and tenth columns measure success as whether the startup was ultimately
acquired by an established firm. In Panel B, we measure success based on patent creation, access to capital through venture-capital,
and likelihood of completing an IPO. In the first and second columns, we measure success as access to venture capital funding within
five years of founding. In the third and fourth columns, we measure success as total venture capital funding received until 2019. In
the fifth and sixth columns, we measure success at creating at least one patent within five years of founding. In the seventh and eighth
columns, we measure success as the total number of patents created until 2019. In the ninth and tenth column, we measure success
as the likelihood of successfully completing an initial public offering. Unemployment at Graduation measures the unemployment rate in
the state where the undergraduate institution is located. Cohort FE is a fixed effect for all students graduating in the same major and in
a two-year span. University FE is a fixed effect for each undergraduate institution. Gender FE is a fixed effect for each gender. Industry
FE is a fixed effect for the industry of the new firm. We use * to denote significance at the 10% level, ** to denote significance at the 5%
level, and *** to denote significance at the 1% level. We cluster standard errors at the state-year level.
Panel A: Survival, Employment, and Acquired
Survival 10+ Employees 20+ Employees 50+ Employees Acquired
Unemployment at Graduation 1.207*** 1.638*** -0.075 -0.066 -0.016 -0.086 0.029 0.031 0.122 -0.031
(4.56) (5.57) (-0.39) (-0.30) (-0.11) (-0.44) (0.28) (0.23) (0.95) (-0.28)
Industry FE No Yes No Yes No Yes No Yes No Yes
Cohort FE Yes No Yes No Yes No Yes No Yes No
Gender FE No No No No No No No No No No
University FE No No No No No No No No No No
Univ. × Gender × Cohort FE No Yes No Yes No Yes No Yes No Yes
N 12059 12059 12059 12059 12059 12059 12059 12059 12059 12059
R-squared .0096 .34 .00064 .32 .0004 .3 .00045 .29 .0017 .26
Panel B: Financing, Patents, and IPO
VC in 5y > 0 VC in ’19 > 0 Patent 5y > 0 Patent in ’19 > 0 IPO
Unemployment at Graduation 1.126*** 1.415*** 1.030*** 1.414*** 0.124*** 0.204*** 0.213* 0.317* 0.005 -0.018
(5.87) (5.37) (5.21) (6.14) (2.66) (2.59) (1.74) (1.86) (0.18) (-0.43)
Industry FE No Yes No Yes No Yes No Yes No Yes
Cohort FE Yes No Yes No Yes No Yes No Yes No
Gender FE No No No No No No No No No No
University FE No No No No No No No No No No
Univ. × Gender × Cohort FE No Yes No Yes No Yes No Yes No Yes
N 12059 12059 12059 12059 12059 12059 12059 12059 12059 12059
R-squared .014 .3 .0097 .32 .0021 .27 .0024 .32 .0008 .4

Table 8: Do Labor Shocks Impact Entry of Low-quality Firms Founded Within 2 years?This table reports the impact of a change in the local unemployment rate on the proportion of new firms that are ultimately successful.
The sample includes all firms founded within two years following the entrepreneur’s graduation from college. The dependent variable
is a binary variable measuring whether the worker founded a firm following graduation that ultimately achieved success. In Panel
A, we measure firm success based on firm survival, current employment of at least x workers, and acquisition. The first and second
columns define success based on survival. The third and fourth columns measure success as currently employing at least 10 workers.
The fifth and sixth columns measure success as currently employing at least 20 workers. The seventh and eighth columns measure
success as currently employing at least 50workers. The ninth and tenth columns measure success as whether the startup was ultimately
acquired by an established firm. In Panel B, we measure success based on patent creation, access to capital through venture-capital,
and likelihood of completing an IPO. In the first and second columns, we measure success as access to venture capital funding within
five years of founding. In the third and fourth columns, we measure success as total venture capital funding received until 2019. In
the fifth and sixth columns, we measure success at creating at least one patent within five years of founding. In the seventh and eighth
columns, we measure success as the total number of patents created until 2019. In the ninth and tenth column, we measure success
as the likelihood of successfully completing an initial public offering. Unemployment at Graduation measures the unemployment rate in
the state where the undergraduate institution is located. Cohort FE is a fixed effect for all students graduating in the same major and in
a two-year span. University FE is a fixed effect for each undergraduate institution. Gender FE is a fixed effect for each gender. Industry
FE is a fixed effect for the industry of the new firm. We use * to denote significance at the 10% level, ** to denote significance at the 5%
level, and *** to denote significance at the 1% level. We cluster standard errors at the state-year level.
Panel A: Survival, Employment, and Acquired
Survival 10+ Employees 20+ Employees 50+ Employees Acquired
Unemployment at Graduation 1.053*** 2.025*** -0.153 0.133 -0.032 0.052 0.046 0.286 0.206 0.108
(3.44) (5.67) (-0.66) (0.39) (-0.19) (0.16) (0.36) (1.29) (1.15) (0.57)
Industry FE No Yes No Yes No Yes No Yes No Yes
Cohort FE Yes No Yes No Yes No Yes No Yes No
Gender FE No No No No No No No No No No
University FE No No No No No No No No No No
Univ. × Gender × Cohort FE No Yes No Yes No Yes No Yes No Yes
N 6335 6335 6335 6335 6335 6335 6335 6335 6335 6335
R-squared .0095 .43 .00083 .42 .0012 .39 .0015 .38 .0022 .34
Panel B: Financing, Patents, and IPO
VC in 5y > 0 VC in ’19 > 0 Patent 5y > 0 Patent in ’19 > 0 IPO
Unemployment at Graduation 0.842*** 1.294*** 0.692*** 1.341*** 0.028 0.008 -0.012 0.155 -0.044 -0.050
(3.33) (4.19) (2.68) (3.96) (0.34) (0.05) (-0.09) (0.46) (-1.02) (-0.65)
Industry FE No Yes No Yes No Yes No Yes No Yes
Cohort FE Yes No Yes No Yes No Yes No Yes No
Gender FE No No No No No No No No No No
University FE No No No No No No No No No No
Univ. × Gender × Cohort FE No Yes No Yes No Yes No Yes No Yes
N 6335 6335 6335 6335 6335 6335 6335 6335 6335 6335
R-squared .014 .37 .0086 .4 .0023 .4 .0029 .41 .0016 .57
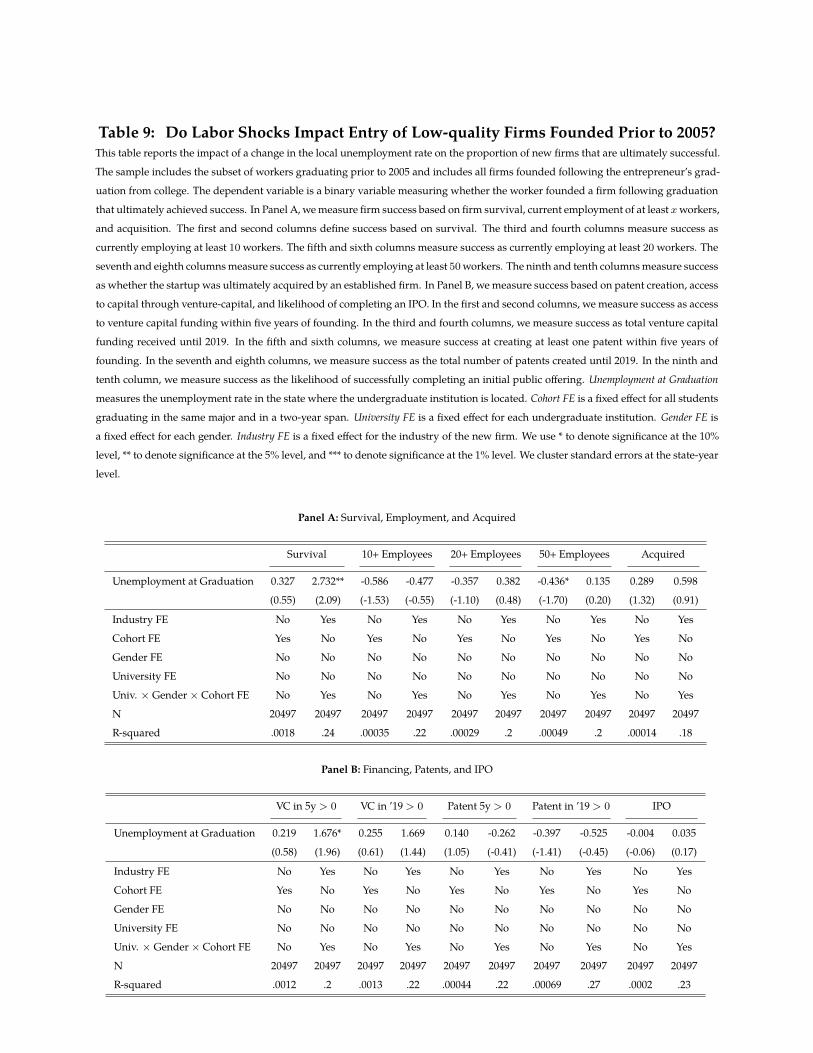
Table 9: Do Labor Shocks Impact Entry of Low-quality Firms Founded Prior to 2005?This table reports the impact of a change in the local unemployment rate on the proportion of new firms that are ultimately successful.
The sample includes the subset of workers graduating prior to 2005 and includes all firms founded following the entrepreneur’s grad-
uation from college. The dependent variable is a binary variable measuring whether the worker founded a firm following graduation
that ultimately achieved success. In Panel A, we measure firm success based on firm survival, current employment of at least xworkers,
and acquisition. The first and second columns define success based on survival. The third and fourth columns measure success as
currently employing at least 10 workers. The fifth and sixth columns measure success as currently employing at least 20 workers. The
seventh and eighth columns measure success as currently employing at least 50workers. The ninth and tenth columns measure success
as whether the startup was ultimately acquired by an established firm. In Panel B, we measure success based on patent creation, access
to capital through venture-capital, and likelihood of completing an IPO. In the first and second columns, we measure success as access
to venture capital funding within five years of founding. In the third and fourth columns, we measure success as total venture capital
funding received until 2019. In the fifth and sixth columns, we measure success at creating at least one patent within five years of
founding. In the seventh and eighth columns, we measure success as the total number of patents created until 2019. In the ninth and
tenth column, we measure success as the likelihood of successfully completing an initial public offering. Unemployment at Graduation
measures the unemployment rate in the state where the undergraduate institution is located. Cohort FE is a fixed effect for all students
graduating in the same major and in a two-year span. University FE is a fixed effect for each undergraduate institution. Gender FE is
a fixed effect for each gender. Industry FE is a fixed effect for the industry of the new firm. We use * to denote significance at the 10%
level, ** to denote significance at the 5% level, and *** to denote significance at the 1% level. We cluster standard errors at the state-year
level.
Panel A: Survival, Employment, and Acquired
Survival 10+ Employees 20+ Employees 50+ Employees Acquired
Unemployment at Graduation 0.327 2.732** -0.586 -0.477 -0.357 0.382 -0.436* 0.135 0.289 0.598
(0.55) (2.09) (-1.53) (-0.55) (-1.10) (0.48) (-1.70) (0.20) (1.32) (0.91)
Industry FE No Yes No Yes No Yes No Yes No Yes
Cohort FE Yes No Yes No Yes No Yes No Yes No
Gender FE No No No No No No No No No No
University FE No No No No No No No No No No
Univ. × Gender × Cohort FE No Yes No Yes No Yes No Yes No Yes
N 20497 20497 20497 20497 20497 20497 20497 20497 20497 20497
R-squared .0018 .24 .00035 .22 .00029 .2 .00049 .2 .00014 .18
Panel B: Financing, Patents, and IPO
VC in 5y > 0 VC in ’19 > 0 Patent 5y > 0 Patent in ’19 > 0 IPO
Unemployment at Graduation 0.219 1.676* 0.255 1.669 0.140 -0.262 -0.397 -0.525 -0.004 0.035
(0.58) (1.96) (0.61) (1.44) (1.05) (-0.41) (-1.41) (-0.45) (-0.06) (0.17)
Industry FE No Yes No Yes No Yes No Yes No Yes
Cohort FE Yes No Yes No Yes No Yes No Yes No
Gender FE No No No No No No No No No No
University FE No No No No No No No No No No
Univ. × Gender × Cohort FE No Yes No Yes No Yes No Yes No Yes
N 20497 20497 20497 20497 20497 20497 20497 20497 20497 20497
R-squared .0012 .2 .0013 .22 .00044 .22 .00069 .27 .0002 .23

Table 10: Are Graduates from Elite Universities Better Entrepreneurs?This table shows whether entrepreneurs graduating from top-ranked undergraduate institutions are more likely to reach benchmarks
of entrepreneurial success. In the first column, the outcome variable is a binary indicating whether the firm remains in business as of
2019. In the second, third, and fourth columns, the outcome variable is a binary indicating whether the firm currently employs at least
10, 20, or 50 employees, respectively. In the fifth column, the outcome variable is a binary indicating whether the firm ever received
venture capital financing as of 2019. In the sixth column, the outcome variable is a binary indicating whether the firm was eventually
acquired by an established firm. In the seventh column, the outcome variable is a binary indicating whether the firm successfully
completed an IPO. In the last column, the outcome variable is a binary indicating whether the firm developed at least one patent as of
2019. Time FE is a fixed effect for each year of graduation. We use * to denote significance at the 10% level, ** to denote significance at
the 5% level, and *** to denote significance at the 1% level. We cluster standard errors at the state-year level.
Survival 10+ Emp 20+ Emp 50+ Emp VC in ’19 >0 Acquired IPO Patent in ’19 > 0
Top 20 College 0.090*** 0.056*** 0.042*** 0.025*** 0.073*** 0.023*** 0.001 0.018***
(12.46) (11.64) (10.29) (8.72) (14.49) (10.15) (1.38) (4.82)
Female -0.072*** -0.032*** -0.024*** -0.013*** -0.047*** -0.025*** -0.000 -0.020***
(-14.08) (-6.82) (-6.21) (-4.90) (-11.32) (-11.51) (-0.27) (-6.03)
Engineering Major 0.086*** 0.019*** 0.017*** 0.014*** 0.075*** 0.028*** -0.000 0.037***
(14.64) (4.37) (4.41) (4.81) (15.55) (11.22) (-0.20) (9.10)
Business/Econ Major 0.034*** 0.031*** 0.024*** 0.017*** 0.021*** 0.004 0.002* -0.005
(4.96) (5.73) (5.22) (4.75) (3.95) (1.18) (1.82) (-1.09)
Time FE Yes Yes Yes Yes Yes Yes Yes Yes
N 36467 36467 36467 36467 36467 36467 36467 36467
R-squared .031 .01 .0088 .0062 .028 .013 .00054 .011
68

Table 11: Do Labor Shocks Encourage Risk-Averse Workers into Entrepreneurship?This table reports the impact of a change in the local unemployment rate on the proportion of risk-averse and ambiguity-averse en-
trepreneurs. The dependent variable in the first through third columns is a binary variable indicating high risk-aversion; the dependent
variable in the fourth through sixth columns is a binary variable indicating high ambiguity-aversion. Risk and ambiguity aversion are
defined according to the survey questions introduced in the Data section. Unemployment at Graduation measures the unemployment
rate in the state hosting the undergraduate institution. Behavioral Controls are the behavioral characteristics of the worker including
(i) two measures of entrepreneurial confidence, (ii) two measures of general confidence, and (iii) two measures of optimism. These
measures are defined using the survey questions introduced in the Data section. Industry FE is a fixed effect for the industry of the
new firm. Cohort FE is a fixed effect for all students graduating in the same major and in a two-year span. Gender FE is a fixed effect for
gender. University FE is a fixed effect for each undergraduate institution. We use * to denote significance at the 10% level, ** to denote
significance at the 5% level, and *** to denote significance at the 1% level. We cluster standard errors at the state-year level.
Risk Aversion Ambiguity Aversion
Unemployment at Graduation 6.057** 5.860** 5.854** 4.396* 4.237* 4.326*
(2.54) (2.53) (2.54) (1.70) (1.79) (1.84)
Log(# Current Employees) 0.002 0.002
(0.11) (0.12)
Firm Survival to 2019 -0.050 -0.078
(-0.64) (-1.08)
Initial Public Offering 0.051 0.084
(0.36) (0.54)
VC Funding > 0 in 5 years -0.042 0.023
(-0.48) (0.30)
Patents > 0 in 5y 0.138 0.157
(0.99) (1.10)
Acquired 0.033 -0.011
(0.35) (-0.12)
Industry FE No Yes Yes No Yes Yes
Cohort FE Yes Yes Yes Yes Yes Yes
Gender FE No Yes Yes No Yes Yes
University FE Yes Yes Yes Yes Yes Yes
Behavioral Controls No Yes Yes No Yes Yes
N 622 622 622 622 622 622
R-squared .51 .58 .58 .52 .57 .58
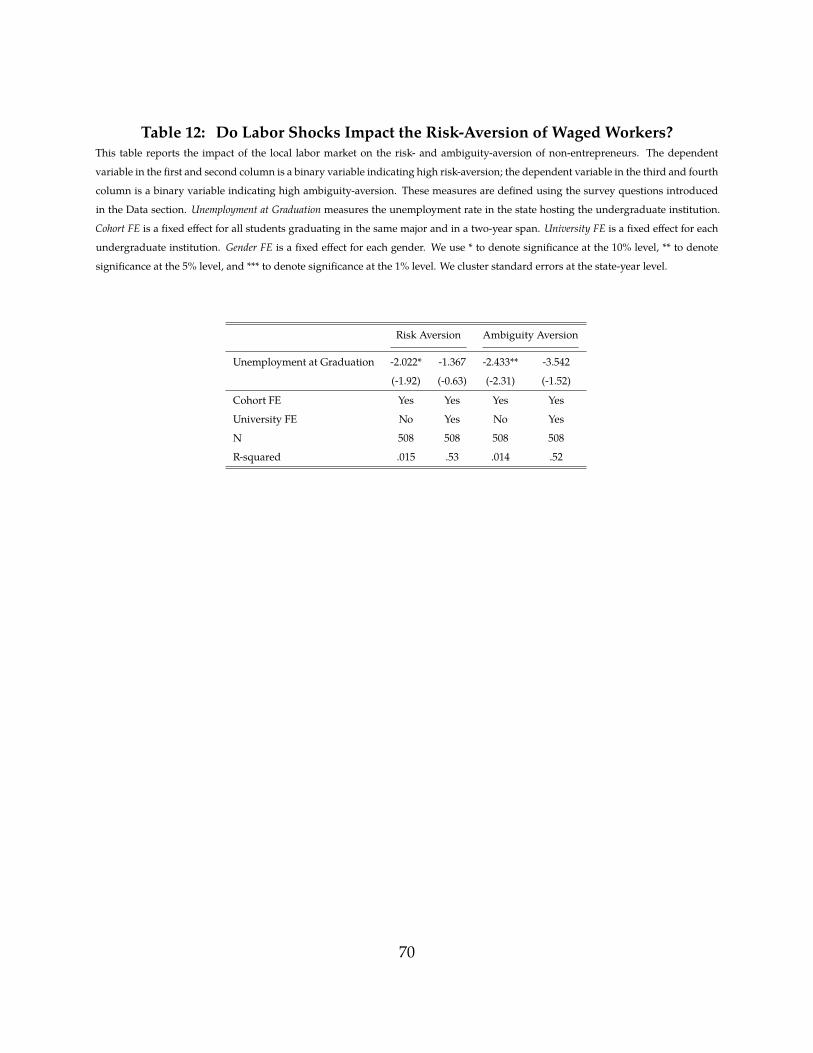
Table 12: Do Labor Shocks Impact the Risk-Aversion of Waged Workers?This table reports the impact of the local labor market on the risk- and ambiguity-aversion of non-entrepreneurs. The dependent
variable in the first and second column is a binary variable indicating high risk-aversion; the dependent variable in the third and fourth
column is a binary variable indicating high ambiguity-aversion. These measures are defined using the survey questions introduced
in the Data section. Unemployment at Graduation measures the unemployment rate in the state hosting the undergraduate institution.
Cohort FE is a fixed effect for all students graduating in the same major and in a two-year span. University FE is a fixed effect for each
undergraduate institution. Gender FE is a fixed effect for each gender. We use * to denote significance at the 10% level, ** to denote
significance at the 5% level, and *** to denote significance at the 1% level. We cluster standard errors at the state-year level.
Risk Aversion Ambiguity Aversion
Unemployment at Graduation -2.022* -1.367 -2.433** -3.542
(-1.92) (-0.63) (-2.31) (-1.52)
Cohort FE Yes Yes Yes Yes
University FE No Yes No Yes
N 508 508 508 508
R-squared .015 .53 .014 .52
70

Table 13: Do Labor Shocks Encourage Less Confident Workers into Entrepreneurship?This table reports the impact of a change in the local unemployment rate on the proportion of confident and optimistic entrepreneurs.
In Panel A, the dependent variable is a binary variable denoting confidence in founding a firm that is acquired (first and second
column) or confidence in starting a firm employing at least ten workers (third and fourth column). In Panel B, the dependent variable
is a binary variable denoting confidence in future salary growth (first and second column), willingness to compete (third and fourth
column), optimism about life expectancy (fifth and sixth column), and optimism about future stock returns (seventh and eighth column).
Unemployment at Graduation measures the unemployment rate in the state hosting the undergraduate institution. Cohort FE is a fixed
effect for all students graduating in the same major and in a two-year span. University FE is a fixed effect for each undergraduate
institution. Gender FE is a fixed effect for gender. We use * to denote significance at the 10% level, ** to denote significance at the 5%
level, and *** to denote significance at the 1% level. We cluster standard errors at the state-year level.
Panel A: Entrepreneurial Confidence
Entrepreneurial Confidence
Acquir. Acquir. Emp. Emp.
Unemployment at Graduation 1.761 1.923 0.088 0.505
(0.81) (0.76) (0.04) (0.22)
Cohort FE Yes Yes Yes Yes
Gender FE No Yes No Yes
University FE Yes Yes Yes Yes
Industry FE No Yes No Yes
N 622 622 622 622
R-squared .49 .62 .44 .6
Panel B: General Confidence and Optimism
General Confidence Optimism
Salary Salary Compet. Compet. Life Life Stock Stock
Unemployment at Graduation 4.514* 5.355* 0.328 1.675 0.081 0.591 -1.413 -1.373
(1.92) (1.73) (0.17) (0.74) (0.06) (0.35) (-0.62) (-0.50)
Cohort FE Yes Yes Yes Yes Yes Yes Yes Yes
Gender FE No Yes No Yes No Yes No Yes
University FE Yes Yes Yes Yes Yes Yes Yes Yes
Industry FE No Yes No Yes No Yes No Yes
N 622 622 622 622 622 622 622 622
R-squared .45 .63 .46 .59 .46 .6 .44 .6
71

ONLINE APPENDIX
72
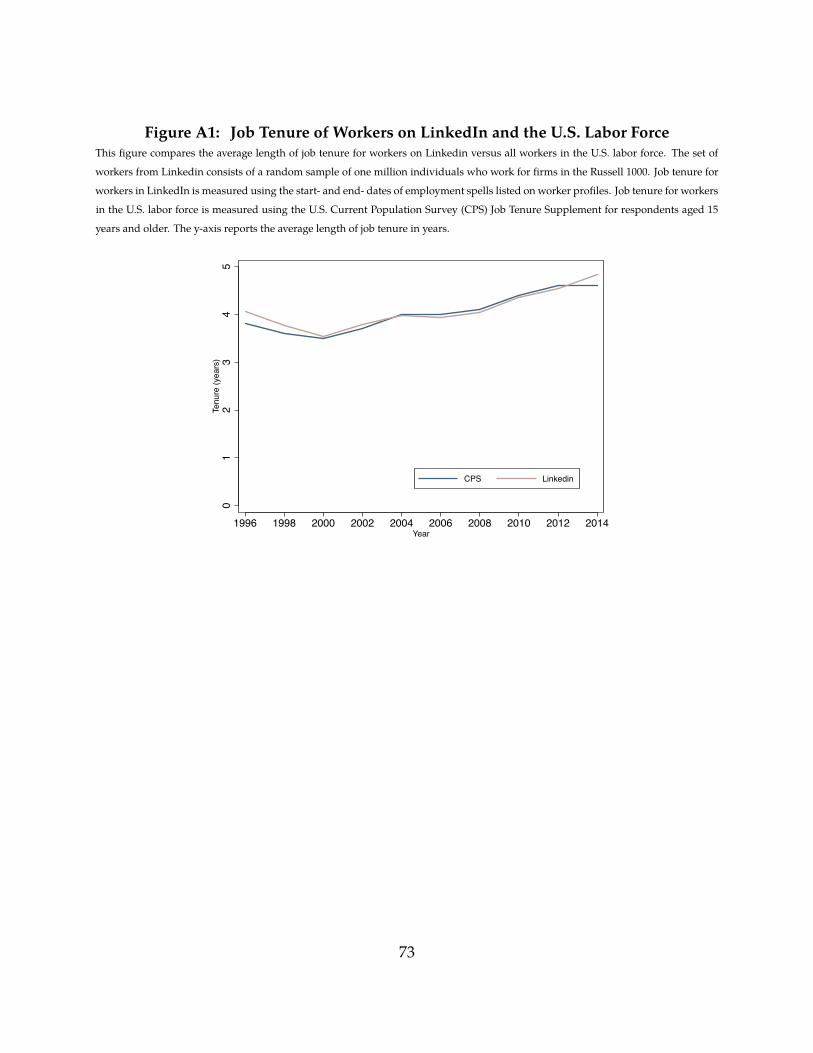
Figure A1: Job Tenure of Workers on LinkedIn and the U.S. Labor ForceThis figure compares the average length of job tenure for workers on Linkedin versus all workers in the U.S. labor force. The set of
workers from Linkedin consists of a random sample of one million individuals who work for firms in the Russell 1000. Job tenure for
workers in LinkedIn is measured using the start- and end- dates of employment spells listed on worker profiles. Job tenure for workers
in the U.S. labor force is measured using the U.S. Current Population Survey (CPS) Job Tenure Supplement for respondents aged 15
years and older. The y-axis reports the average length of job tenure in years.0
12
34
5Te
nure
(yea
rs)
1996 1998 2000 2002 2004 2006 2008 2010 2012 2014Year
CPS Linkedin
73

Table A1: List of Undergraduate InstitutionsThis table lists the set of undergraduate institutions graduating at least 0.4% of our worker sample. The list shows the breakdown of
the most represented universities in our dataset. In total, this list comprises over 40% of the sample of universities in our dataset. The
first column of the list reports the abbreviated institution name, the second column reports the website of the institution, and the third
column reports the number of workers in our sample that graduated from these institutions. The fourth column reports the fraction
of sample of workers that graduated from the institution, and the last column reports the cumulative percentage.
School Name Website Count Fraction (%) Cumulative (%)
UC Berkeley berkeley.edu 19971 3.11 3.11
UIUC illinois.edu 19950 3.11 6.23
U of Texas utexas.edu 18693 2.92 9.14
UCLA ucla.edu 17140 2.67 11.82
U of Wisconsin wisc.edu 15953 2.49 14.3
Cornell University cornell.edu 14819 2.31 16.61
Georgia Tech gatech.edu 14074 2.2 18.81
Stanford stanford.edu 9142 1.43 20.24
Northerwestern U northwestern.edu 8269 1.29 21.53
U of Michigan umich.edu 8148 1.27 22.8
Phoenix phoenix.edu 8077 1.26 24.06
Carnegie Mellon cmu.edu 7328 1.14 25.2
MIT mit.edu 7324 1.14 26.34
Purdue U purdue.edu 7029 1.1 27.44
Texas A and M tamu.edu 6595 1.03 28.47
PennState psu.edu 5452 0.85 29.32
UCSD ucsd.edu 5355 0.84 30.15
Upenn upenn.edu 4804 0.75 30.9
NYU nyu.edu 4519 0.7 31.61
MSU msu.edu 4152 0.65 32.25
Harvard U harvard.edu 4042 0.63 32.88
USC usc.edu 3796 0.59 33.48
ASU asu.edu 3716 0.58 34.06
U of Minnesota umn.edu 3689 0.58 34.63
OSU osu.edu 3427 0.53 35.17
U of Florida ufl.edu 3390 0.53 35.69
U of Maryland umd.edu 3331 0.52 36.21
Princeton princeton.edu 3133 0.49 36.7
Rutgers U rutgers.edu 3125 0.49 37.19
BYU byu.edu 3032 0.47 37.66
Virginia Tech vt.edu 2952 0.46 38.12
CUNY cuny.edu 2910 0.45 38.58
UC at Santa Barbara ucsb.edu 2910 0.45 39.03
Washington U washington.edu 2845 0.44 39.48
UVA virginia.edu 2830 0.44 39.92
Indiana U indiana.edu 2748 0.43 40.35
Columbia U columbia.edu 2636 0.41 40.76
Boston U bu.edu 2617 0.41 41.16
Duke U duke.edu 2562 0.4 41.56

Table A2: Are Surveyed Entrepreneurs Representative?This table reports the summary statistics for the firms created by entrepreneurs in the full dataset and the summary statistics for the
firms created by the surveyed entrepreneurs. The eighth column compares the differences in means and the last column reports the
t-statistic evaluating whether these means are statistically different from each other.
All Entrepreneurs Surveyed Difference
N Mean Std 90th N Mean Std Diff t-stat
Firm Survival to 2019 36316 0.24 0.42 1 622 0.24 0.43 -0.0010 (-0.058)
> 10 Employees 36316 0.14 0.35 1 622 0.13 0.34 0.0061 (0.44)
> 20 Employees 36316 0.094 0.29 0 622 0.087 0.28 0.0070 (0.61)
> 50 Employees 36316 0.051 0.22 0 622 0.040 0.20 0.011 (1.41)
Log(# Current Employees) 36316 0.78 1.41 2.89 622 0.74 1.31 0.033 (0.63)
Log(VC Funding) 36316 1.80 4.97 12.7 622 1.67 4.74 0.14 (0.72)
VC Funding > 0 36316 0.15 0.36 1 622 0.14 0.35 0.0040 (0.28)
VC Funding > 0 in 5 years 36316 0.12 0.33 1 622 0.12 0.32 0.0077 (0.59)
Num Patents > 0 36316 0.060 0.24 0 622 0.079 0.27 -0.019 (-1.74)
Patents > 0 in 5y 36316 0.025 0.16 0 622 0.024 0.15 0.00090 (0.15)
Acquired 36316 0.045 0.21 0 622 0.035 0.18 0.010 (1.35)
Initial Public Offering 36316 0.0039 0.062 0 622 0.0032 0.057 0.00071 (0.31)
75

Table A3: Do Labor Shocks Impact the Rate of Entrepreneurship?This table reports the impact of a change in the local unemployment rate on the likelihood of becoming an entrepreneur under a probit
model. In first through the fourth columns, the outcome variable is the likelihood of creating a firm from one to four years after college
graduation. Unemployment at Graduation measures the unemployment rate in the state where the undergraduate institution is located.
Cohort FE is a fixed effect for all students graduating in the same major and in a two-year span. University FE is a fixed effect for each
undergraduate institution. We use * to denote significance at the 10% level, ** to denote significance at the 5% level, and *** to denote
significance at the 1% level. We cluster standard errors at the state-year level.
1-y post coll. 2-y post coll. 3-y post coll. 4-y post coll.
Unemployment at Graduation 2.981*** 2.693*** 2.313*** 2.177***
(3.20) (2.98) (2.73) (2.98)
Cohort FE Yes Yes Yes Yes
Gender FE Yes Yes Yes Yes
University FE No No No No
N 641144 641144 641144 641144
R-squared .019 .016 .014 .012
76

Table A4: Is the Impact of Labor Shocks on the Rate of Entrepreneurship Robust?This table reports the impact of a change in the local unemployment rate on the likelihood of becoming an entrepreneur across several
subsamples of the data. The sample in the first column excludes workers graduating in 2002 and 2010, the second column excludes
workers graduating from colleges located in California, and the third column excludes workers and entrepreneurs in the tech industry.
The fourth column estimates our baseline model in a sample that excludes workers who (i) graduated in 2002 and 2010, (ii) graduated
from a California school, or (iii) work in the tech industry. The fifth column excludes all workers that entered a graduate program within
four years following graduation. The dependent variable is a binary variable measuring whether the worker founded a firm within
4 years following graduation. Unemployment at Graduation measures the unemployment rate in the state where the undergraduate
institution is located. Cohort FE is a fixed effect for all students graduating in the same major and in a two-year span. University FE is
a fixed effect for each undergraduate institution. We use * to denote significance at the 10% level, ** to denote significance at the 5%
level, and *** to denote significance at the 1% level. We cluster standard errors at the state-year level.
Exclude ’02 & ’10 Exclude CA Exclude Tech Exclude All No Graduate School
Unemployment at Graduation 0.234** 0.218** 0.210*** 0.202** 0.254***
(3.00) (2.61) (3.18) (2.66) (3.48)
Cohort FE No No No No No
Gender FE No No No No No
University FE No No No No No
University × Gender × Cohort FE Yes Yes Yes Yes Yes
N 565663 546192 532765 406122 512217
R-squared .073 .073 .077 .086 .079
77

Table A5: Do Labor Shocks Impact Entry of Low-quality Firms for Elite Workers?This table reports the impact of a change in the local unemployment rate on the proportion of new firms that are ultimately successful.
The sample includes the subset of workers graduating form a top twenty undergraduate institution and includes all firms founded
within five years following the entrepreneur’s graduation from college. The dependent variable is a binary variable measuring whether
the worker founded a firm following graduation that ultimately achieved success. In Panel A, we measure firm success based on firm
survival, current employment of at least xworkers, and acquisition. The first and second columns define success based on survival. The
third and fourth columns measure success as currently employing at least 10 workers. The fifth and sixth columns measure success as
currently employing at least 20 workers. The seventh and eighth columns measure success as currently employing at least 50 workers.
The ninth and tenth columns measure success as whether the startup was ultimately acquired by an established firm. In Panel B, we
measure success based on patent creation, access to capital through venture-capital, and likelihood of completing an IPO. In the first
and second columns, we measure success as access to venture capital funding within five years of founding. In the third and fourth
columns, we measure success as total venture capital funding received until 2019. In the fifth and sixth columns, we measure success at
creating at least one patent within five years of founding. In the seventh and eighth columns, we measure success as the total number
of patents created until 2019. In the ninth and tenth column, we measure success as the likelihood of successfully completing an
initial public offering. Unemployment at Graduation measures the unemployment rate in the state where the undergraduate institution
is located. Cohort FE is a fixed effect for all students graduating in the same major and in a two-year span. University FE is a fixed effect
for each undergraduate institution. Gender FE is a fixed effect for each gender. Industry FE is a fixed effect for the industry of the new
firm. We use * to denote significance at the 10% level, ** to denote significance at the 5% level, and *** to denote significance at the 1%
level. We cluster standard errors at the state-year level.
Panel A: Survival, Employment, and Acquired
Survival 10+ Employees 20+ Employees 50+ Employees Acquired
Unemployment at Graduation 0.676** 1.094*** -0.154 0.006 0.043 0.165 0.125 0.160 -0.145 -0.293**
(2.38) (2.62) (-0.47) (0.02) (0.16) (0.55) (0.70) (0.85) (-0.79) (-2.33)
Industry FE No Yes No Yes No Yes No Yes No Yes
Cohort FE Yes No Yes No Yes No Yes No Yes No
Gender FE No No No No No No No No No No
University FE No No No No No No No No No No
Univ. × Gender × Cohort FE No Yes No Yes No Yes No Yes No Yes
N 4336 4336 4336 4336 4336 4336 4336 4336 4336 4336
R-squared .016 .2 .0015 .15 .0015 .15 .0016 .14 .0012 .13
Panel B: Financing, Patents, and IPO
VC in 5y > 0 VC in ’19 > 0 Patent 5y > 0 Patent in ’19 > 0 IPO
Unemployment at Graduation 0.955*** 1.412*** 0.818** 1.264*** -0.011 -0.063 0.166 0.207 0.009 -0.035
(3.09) (4.14) (2.52) (4.49) (-0.09) (-0.49) (0.86) (0.93) (0.16) (-0.77)
Industry FE No Yes No Yes No Yes No Yes No Yes
Cohort FE Yes No Yes No Yes No Yes No Yes No
Gender FE No No No No No No No No No No
University FE No No No No No No No No No No
Univ. × Gender × Cohort FE No Yes No Yes No Yes No Yes No Yes
N 4336 4336 4336 4336 4336 4336 4336 4336 4336 4336
R-squared .021 .2 .016 .2 .0044 .16 .0034 .18 .002 .1

Table A6: Do Labor Shocks Impact Entry of Low-quality Firms due to Graduate De-
grees?This table reports the impact of a change in the local unemployment rate on the proportion of new firms that are ultimately successful.
The sample includes the subset of workers without graduate degrees (i.e., Masters, MBA, JD, and PhD) and includes all firms founded
within five years following the entrepreneur’s graduation from college. The dependent variable is a binary variable measuring whether
the worker founded a firm following graduation that ultimately achieved success. In Panel A, we measure firm success based on firm
survival, current employment of at least xworkers, and acquisition. The first and second columns define success based on survival. The
third and fourth columns measure success as currently employing at least 10 workers. The fifth and sixth columns measure success as
currently employing at least 20 workers. The seventh and eighth columns measure success as currently employing at least 50 workers.
The ninth and tenth columns measure success as whether the startup was ultimately acquired by an established firm. In Panel B, we
measure success based on patent creation, access to capital through venture-capital, and likelihood of completing an IPO. In the first
and second columns, we measure success as access to venture capital funding within five years of founding. In the third and fourth
columns, we measure success as total venture capital funding received until 2019. In the fifth and sixth columns, we measure success at
creating at least one patent within five years of founding. In the seventh and eighth columns, we measure success as the total number
of patents created until 2019. In the ninth and tenth column, we measure success as the likelihood of successfully completing an
initial public offering. Unemployment at Graduation measures the unemployment rate in the state where the undergraduate institution
is located. Cohort FE is a fixed effect for all students graduating in the same major and in a two-year span. University FE is a fixed effect
for each undergraduate institution. Gender FE is a fixed effect for each gender. Industry FE is a fixed effect for the industry of the new
firm. We use * to denote significance at the 10% level, ** to denote significance at the 5% level, and *** to denote significance at the 1%
level. We cluster standard errors at the state-year level.
Panel A: Survival, Employment, and Acquired
Survival 10+ Employees 20+ Employees 50+ Employees Acquired
Unemployment at Graduation 1.090*** 1.382*** -0.117 -0.198 -0.074 -0.163 -0.041 0.138 0.130 0.036
(4.32) (4.04) (-0.59) (-0.64) (-0.47) (-0.57) (-0.32) (0.69) (1.16) (0.27)
Industry FE No Yes No Yes No Yes No Yes No Yes
Cohort FE Yes No Yes No Yes No Yes No Yes No
Gender FE No No No No No No No No No No
University FE No No No No No No No No No No
Univ. × Gender × Cohort FE No Yes No Yes No Yes No Yes No Yes
N 9296 9296 9296 9296 9296 9296 9296 9296 9296 9296
R-squared .01 .41 .00078 .38 .00039 .36 .0007 .35 .0016 .32
Panel B: Financing, Patents, and IPO
VC in 5y > 0 VC in ’19 > 0 Patent 5y > 0 Patent in ’19 > 0 IPO
Unemployment at Graduation 1.106*** 1.426*** 1.032*** 1.373*** -0.011 -0.031 0.094 0.184 -0.000 -0.008
(6.39) (5.28) (5.51) (5.04) (-0.18) (-0.24) (0.84) (0.87) (-0.00) (-0.12)
Industry FE No Yes No Yes No Yes No Yes No Yes
Cohort FE Yes No Yes No Yes No Yes No Yes No
Gender FE No No No No No No No No No No
University FE No No No No No No No No No No
Univ. × Gender × Cohort FE No Yes No Yes No Yes No Yes No Yes
N 9296 9296 9296 9296 9296 9296 9296 9296 9296 9296
R-squared .016 .36 .012 .37 .0016 .36 .0018 .38 .0012 .39

Table A7: What is the Industry Composition of New Firms?This table reports the industry composition of all new firms in the sample. Panel A focuses on one-digit NAICS and Panel B focuses
on three-digit NAICS within the 500-599 NAICS range. Forced Entrepreneurs are defined as all workers graduating in a state above
the median unemployment rate in the given year; Voluntary Entrepreneurs are defined as all workers graduating in a state below the
median unemployment rate in the given year.
Panel A: Composition of All Firms
(1) (2) (3)
All Entrep. Forced Entrep. Voluntary Entrep.
NAICS 1-dig #Firms Fraction #Firms Fraction #Firms Fraction
Agriculture 1026 2.81 533 3.08 493 2.57
Mining, Utilities, and Construction 568 1.56 262 1.51 306 1.60
Manufacturing 4180 11.46 1996 11.53 2184 11.40
Trade and Transportation 834 2.29 379 2.19 455 2.38
Information, Finance, and Professional Serv. 25752 70.62 12162 70.24 13590 70.95
Education and Health 2311 6.34 1123 6.49 1188 6.20
Arts, Accommodation, and Food 1553 4.26 742 4.29 811 4.23
Other Services 243 0.67 117 0.68 126 0.66
Total 36467 100.00 17314 100.00 19153 100.00
Panel B: Breakdown of Firms in the Information, Finance, and Professional Services Industries
(1) (2) (3)
All Entrep. Forced Entrep. Voluntary Entrep.
NAICS 3-dig #Firms Fraction #Firms Fraction #Firms Fraction
Publishing 7879 30.60 3915 32.19 3964 29.17
Motion Picture and Sound Recording 305 1.18 172 1.41 133 0.98
Broadcasting 82 0.32 42 0.35 40 0.29
Telecommunications 300 1.16 130 1.07 170 1.25
Data Processing and Hosting 890 3.46 385 3.17 505 3.72
Other Information Services 8 0.03 4 0.03 4 0.03
Credit Intermediation 1631 6.33 764 6.28 867 6.38
Securities and Investments 1548 6.01 633 5.20 915 6.73
Insurance 75 0.29 32 0.26 43 0.32
Real Estate 596 2.31 243 2.00 353 2.60
Rental and Leasing 192 0.75 95 0.78 97 0.71
Professional, Scientific, and Technical 12027 46.70 5632 46.31 6395 47.06
Administrative and Support Services 219 0.85 115 0.95 104 0.77
Total 25752 100.00 12162 100.00 13590 100.00
80

Survey to Entrepreneurs• How important is it for you to be in control of your daily schedule?
– 1 (Not at all important)
– 2 (A little important)
– 3 (Somewhat important)
– 4 (Important)
– 5 (Very Important)
• How important is it for you to have a job providing a variety of different tasks?
– 1 (Not at all important)
– 2 (A little important)
– 3 (Somewhat important)
– 4 (Important)
– 5 (Very Important)
• Do you view yourself as a competitive person?
– 1 (Not at all competitive)
– 2 (A little competitive)
– 3 (Somewhat competitive)
– 4 (Competitive)
– 5 (Very competitive)
• Over the past 90 years, the US stock market has observed an average return of 9% a year. What will be
the average annual US stock market return over the next ten years?
– 2-4% each year
– 4-6% each year
– 6-8% each year
– 8-10% each year
81

– 10-12% each year
– 12-14% each year
– 14-16% each year
– above 16% each year
• Among people born in the US in 1919, 1.4% are still alive in 2019. What is the likelihood you live to
age 100?
– 0-1%
– 1-2%
– 2-5%
– 5-10%
– 10%-15%
– 15-20%
– 20-30%
– 30-50%
– >50%
• What is the likelihood your salary doubles in the next five years?
– 0-1%
– 1-2%
– 2-5%
– 5-10%
– 10%-15%
– 15-20%
– 20-30%
– 30-50%
– >50%
• Among firms started by college graduates, 15% grow to employ ten or more workers within five years.
If you started a company today, what is the likelihood your firm would employ ten or more workers
within five years?
82

– 0-1%
– 1-2%
– 2-5%
– 5-10%
– 10%-15%
– 15-20%
– 20-30%
– 30-50%
– >50%
• Among firms started by college graduates, 5% are eventually acquired by a larger firm. If you started
a company today, what is the likelihood your firm would eventually be acquired?
– 0-1%
– 1-2%
– 2-4%
– 4-6%
– 6%-8%
– 8-10%
– 10-15%
– 15-20%
– >20%
• How much would you pay for a lottery ticket that gives you a 50% probability of winning $500 and
50% of winning nothing?
– Less than $50
– 50-$100
– 100-$150
– 150-$200
– 200-$250
83

– More than $250
• How much would you pay for a lottery ticket that gives you an x% probability of winning $500? (x is
between 25% and 75%)
– Less than $50
– 50-$100
– 100-$150
– 150-$200
– 200-$250
– More than $250
• How much would you pay for a lottery ticket that gives you a 50% probability winning $500 and a
50% probability of losing $250?
– Less than $50
– 50-$100
– 100-$150
– 150-$200
– 200-$250
– More than $250
84