forced pitch motion of wind turbines - enlighteneprints.gla.ac.uk/129422/1/129422.pdf · installed...
TRANSCRIPT

This content has been downloaded from IOPscience. Please scroll down to see the full text.
Download details:
IP Address: 130.209.115.202
This content was downloaded on 03/10/2016 at 11:56
Please note that terms and conditions apply.
You may also be interested in:
Generation of thrust and lift with airfoils in plunging and pitching motion
M Moriche, O Flores and M García-Villalba
Current status of Japanese detectors
Daisuke Tatsumi, Ryutaro Takahashi, Koji Arai et al.
Development of a twin-flapping-foils unit to generate hydroelectric power from a water current
H Abiru, A Yoshitake and M Nishi
Analysis of the pendular and pitch motions of a driven three-dimensional pendulum
T Findley, S Yoshida and D P Norwood
Bifurcation and chaos analysis for aeroelastic airfoil with freeplay structural nonlinearity in
pitch
Zhao De-Min and Zhang Qi-Chang
Free flight simulations of a dragonfly-like flapping wing-body model by the immersed
boundary-lattice Boltzmann method
Keisuke Minami, Kosuke Suzuki and Takaji Inamuro
Forced pitch motion of wind turbines
View the table of contents for this issue, or go to the journal homepage for more
2016 J. Phys.: Conf. Ser. 753 022042
(http://iopscience.iop.org/1742-6596/753/2/022042)
Home Search Collections Journals About Contact us My IOPscience

Forced pitch motion of wind turbines
V Leble1 and G Barakos2
1 Ph.D. Student, School of Engineering, University of Glasgow, Glasgow, UK2 Professor, School of Engineering, University of Glasgow, Glasgow, UK
E-mail: [email protected]
Abstract. The possibility of a wind turbine entering vortex ring state during pitchingoscillations is explored in this paper. The aerodynamic performance of the rotor was computedusing the Helicopter Multi-Block flow solver. This code solves the Navier-Stokes equations inintegral form using the arbitrary Lagrangian-Eulerian formulation for time-dependent domainswith moving boundaries. A 10-MW wind turbine was put to perform yawing and pitchingoscillations suggesting the partial vortex ring state during pitching motion. The results also showthe strong effect of the frequency and amplitude of oscillations on the wind turbine performance.
Nomenclature
LatinA Amplitude [deg] t Time [s]M Mach number [-] U Velocity [m/s]L Vertical temperature gradient [K/m] vi Induced velocity [m/s]Re Reynolds number [-] Vc Inflow velocity [m/s]T Period [s]Greekα Angle [deg] λ Tip speed ratio [-]β Wind profile power coefficient [-]AbbreviationsBEM Blade Element Momentum method RWT Reference Wind TurbineCFD Computational Fluid Dynamics
SSTShear Stress Transportturbulence modelFOWT Floating Off-shore Wind Turbine
FVM Free Vortex methodURANS
Unsteady Reynolds-AveragedNavier-Stokes methodGDW Generalised Dynamic Wake model
rpm Revolutions per minute VLM Vortex Lattice methodVRS Vortex Ring State
1. Introduction
According to the European Wind Energy Association (EWEA), at the end of 2012, the total,installed offshore wind power was 5GW. During the first half of 2015, the European gridconnected 584 commercial offshore wind turbines with a combined capacity of 2.3GW [1, 2].
The Science of Making Torque from Wind (TORQUE 2016) IOP PublishingJournal of Physics: Conference Series 753 (2016) 022042 doi:10.1088/1742-6596/753/2/022042
Content from this work may be used under the terms of the Creative Commons Attribution 3.0 licence. Any further distributionof this work must maintain attribution to the author(s) and the title of the work, journal citation and DOI.
Published under licence by IOP Publishing Ltd 1
Estimates for the year 2030 predict up to 11.3% coverage of total European electricity demandby offshore wind[3]. Similar trends are seen in the US, where onshore and offshore wind energycan provide up to 20% of the US electricity by 2030[4].
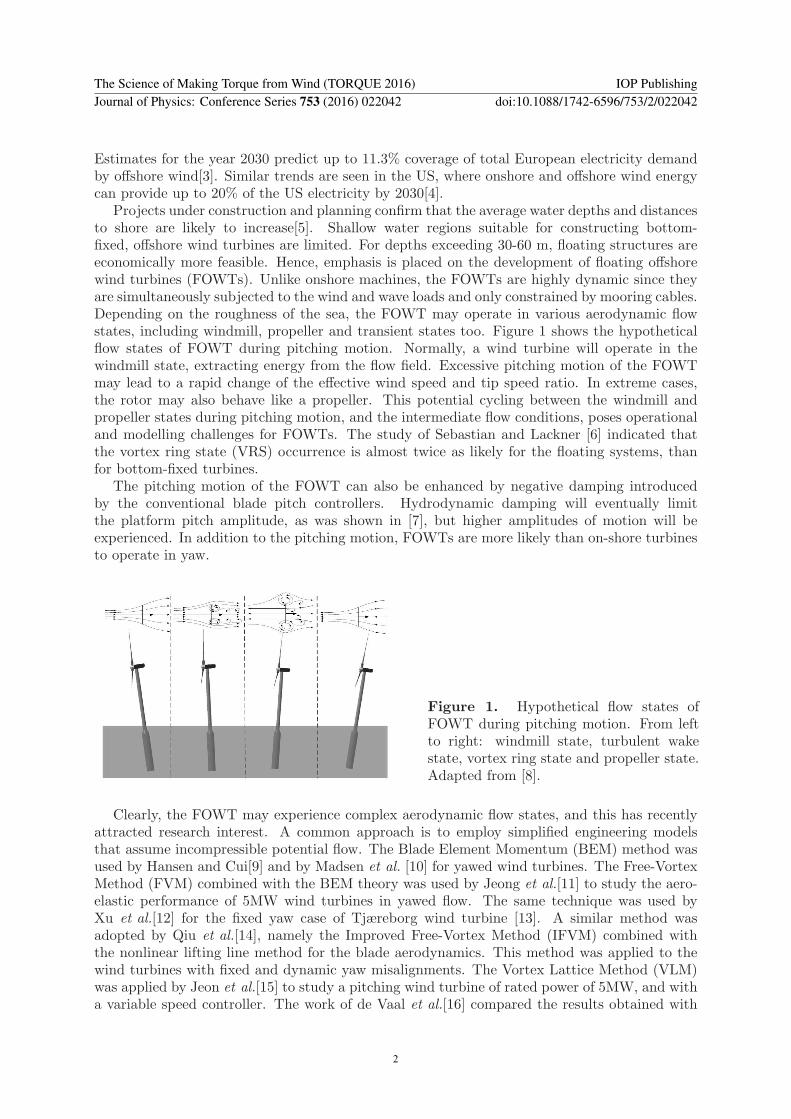
Projects under construction and planning confirm that the average water depths and distancesto shore are likely to increase[5]. Shallow water regions suitable for constructing bottom-fixed, offshore wind turbines are limited. For depths exceeding 30-60 m, floating structures areeconomically more feasible. Hence, emphasis is placed on the development of floating offshorewind turbines (FOWTs). Unlike onshore machines, the FOWTs are highly dynamic since theyare simultaneously subjected to the wind and wave loads and only constrained by mooring cables.Depending on the roughness of the sea, the FOWT may operate in various aerodynamic flowstates, including windmill, propeller and transient states too. Figure 1 shows the hypotheticalflow states of FOWT during pitching motion. Normally, a wind turbine will operate in thewindmill state, extracting energy from the flow field. Excessive pitching motion of the FOWTmay lead to a rapid change of the effective wind speed and tip speed ratio. In extreme cases,the rotor may also behave like a propeller. This potential cycling between the windmill andpropeller states during pitching motion, and the intermediate flow conditions, poses operationaland modelling challenges for FOWTs. The study of Sebastian and Lackner [6] indicated thatthe vortex ring state (VRS) occurrence is almost twice as likely for the floating systems, thanfor bottom-fixed turbines.
The pitching motion of the FOWT can also be enhanced by negative damping introducedby the conventional blade pitch controllers. Hydrodynamic damping will eventually limitthe platform pitch amplitude, as was shown in [7], but higher amplitudes of motion will beexperienced. In addition to the pitching motion, FOWTs are more likely than on-shore turbinesto operate in yaw.
Figure 1. Hypothetical flow states ofFOWT during pitching motion. From leftto right: windmill state, turbulent wakestate, vortex ring state and propeller state.Adapted from [8].
Clearly, the FOWT may experience complex aerodynamic flow states, and this has recentlyattracted research interest. A common approach is to employ simplified engineering modelsthat assume incompressible potential flow. The Blade Element Momentum (BEM) method wasused by Hansen and Cui[9] and by Madsen et al. [10] for yawed wind turbines. The Free-VortexMethod (FVM) combined with the BEM theory was used by Jeong et al.[11] to study the aero-elastic performance of 5MW wind turbines in yawed flow. The same technique was used byXu et al.[12] for the fixed yaw case of Tjæreborg wind turbine [13]. A similar method wasadopted by Qiu et al.[14], namely the Improved Free-Vortex Method (IFVM) combined withthe nonlinear lifting line method for the blade aerodynamics. This method was applied to thewind turbines with fixed and dynamic yaw misalignments. The Vortex Lattice Method (VLM)was applied by Jeon et al.[15] to study a pitching wind turbine of rated power of 5MW, and witha variable speed controller. The work of de Vaal et al.[16] compared the results obtained with
The Science of Making Torque from Wind (TORQUE 2016) IOP PublishingJournal of Physics: Conference Series 753 (2016) 022042 doi:10.1088/1742-6596/753/2/022042
2

unsteady BEM method and an actuator disc CFD approach for 5MW wind turbine undergoingsurge motion. It was concluded that the BEM method agreed well with the actuator disc model,with differences when the wind turbine was enetring the turbulent wake state for part of thesurging cycle. It was also suggested in this work to study yawing and pitching motions, since thiscan lead to improvements of BEM based methods. Sant and Cuschieri [17] made a comparisonof BEM, Generalised Dynamic Wake (GDW) and FVM aerodynamic models. For the fixedyaw configurations of 5MW machine, the BEM model predicted considerably different changesin power and thrust as compared to other two models. The difference was contributed to thelimitation of the BEM method.
The assumptions of those simplified models do not always hold for the complex aerodynamicflow states that can be encountered by FOWTs. For instance the assumptions of BEM and GDWmodels are violated when the wind turbine undergoes large pitching motion[6, 18]. Therefore,very recent works employed Navier-Stokes CFD solvers to study pitching wind turbines[8, 18].Considerable differences were reported between predictions of BEM, GDW and URANS CFDmethods. The papers relevant to the yaw and pitch conditions of the wind turbines are presentedin Table 1.
Table 1. Some of the papers relevant for the analysis of yawing and pitching wind turbines.Authors (Year) Configuration Structure Numerical methodsHansen and Cui[9] (1989) Fixed/Dynamic
YawRigid BEM
Madsen et al.[10] (2003) Fixed Yaw Rigid/Elastic BEM,URANSJeong et al.[11] (2013) Fixed Yaw Elastic FVMQiu et al.[14] (2014) Fixed/Dynamic
YawRigid IFVM
Jeon et al.[15] (2014) Dynamic Pitch Rigid VLMTran and Kim[8, 18] (2015) Dynamic Pitch Rigid BEM,GDW,URANS
In view of the above, the purpose of this paper is to present results of numericalcomputations for a 10-MW wind turbine undergoing prescribed pitching and yawing motions.The aerodynamic loads are computed using the Helicopter Multi-Block (HMB3) flow solver ofGlasgow University[19]. The comparison to the aligned and fixed yaw cases is performed, andconclusions are drawn.
2. Test cases
The HMB3 flow solver of Glasgow University[19] and the DTU 10MW reference wind turbine(RWT) designed by Bak et al.[20] were employed in this paper. The wind turbine blade uses theFFA-W3 aerofoil family [21] with relative thickness ranging from 24% to 60%. The blade hasnon-linear distribution of the chord, relative thickness and twist. The rotor diameter is 178.3m,and the wind turbine operates at a wind speed of 11m/s with a rotational speed of 8.8rpm,resulting in the tip speed ration λ = 7.5. The blades have a pre-coning of 2.5◦ and nonlinearpre-bending with 3.3m displacement at the blade tip.
The test cases considered in this work are the wind turbine with constant yaw misalignment,and with sinusoidal yawing and pitching motions. The inflow was considered uniform for thosecases, and the blades were assumed rigid. The list of all test cases is shown in Table 2.
2.1. Grid and computational parameters
The DTU 10MW RWT rotor was modelled including the nacelle, but without the tower. Thegrid consisted of 16.1M cells, giving 5.4M cells per blade. The normal distance for the first
The Science of Making Torque from Wind (TORQUE 2016) IOP PublishingJournal of Physics: Conference Series 753 (2016) 022042 doi:10.1088/1742-6596/753/2/022042
3

Table 2. Description of presented test cases.Name Wind Turbine Configuration Angle/Amplitude Period Inflow BladesY0 DTU Aligned 0◦ - Uniform RigidY1 DTU Fixed Yaw −3◦ - Uniform RigidY2 DTU Fixed Yaw 3◦ - Uniform RigidY3 DTU Sinusoidal Yaw 3◦ 8.8s Uniform RigidP1 DTU Sinusoidal Pitch 3◦ 8.8s Uniform RigidP2 DTU Sinusoidal Pitch 5◦ 8.8s Uniform Rigid
40 cellsExponential 5x10
6
256 cells aroundthe aerofoil
0.60.40.200.20.4
(a) Slice through the volume close tothe blade surface.
(b) Surface mesh. (c) Computational domain.
Figure 2. Grid employed for the DTU 10MW RWT rotor without the tower - (a) slicethrough the volume, (b) surface mesh, (c) computational domain for most of the cases, and(d) computational domain for case A2.
cells of the blocks adjacent to the blade surface was 5 · 10−6c, where c is a maximum chordof the blade, 6.205m. Based on the free-stream condition and the size of the first cell, the y+
parameter was y+ = 0.9. The first layer consisted of 40 cells in the normal direction to theblade surface, and 256 cells were distributed around the aerofoil section. The blade surface wasresolved with 121 cells along the span. The domain consisted of the rotor that was attached tothe nacelle through a sliding mesh plane [22]. An inflow boundary condition was placed threeblade radii upstream of the rotor, and outflow was placed six blade radii downstream. Thefar-field was assigned three blade radii from the centre of rotation. The computational domainwith the corresponding boundaries, a slice through the mesh close to the blade surface, and thesurface mesh of the blade are shown in Figure 2.
The free-stream was kept to the level of turbulence of 2.6%, and the k−ω SST [23] turbulencemodel was employed. The time step for the unsteady computations was set to ∆t = 1.8 · 10−2s,and corresponds to the time required for rotor to perform one degree of revolution. This step isthought to be adequate for the studied wind turbine. Work of Tran and Kim [8] employed 2.0degree increment of azimuth angle.
3. Results and discussion
3.1. Static and dynamic yawing of DTU 10MW reference wind turbine
This section presents the results obtained for DTU 10MW reference wind turbine with staticand dynamic yaw misalignments. First, the comparison of the aligned and static yaw cases isperformed in this section. This involves comparison of the aligned case Y0 and fixed yaw caseof 3◦ (Y2 in Table 2). Next, the sinusoidal yawing case Y3 with yaw amplitude A = 3◦ andperiod Tyaw = 8.8s is compared to the fixed yaw cases Y1 and Y2. The frequency of motion waschosen based on the most probable frequency of the sea waves for the wind speed of 11m/s [24].
The employed notation for yaw angles is shown in Figure 3(a). Positive yaw angle corresponds
The Science of Making Torque from Wind (TORQUE 2016) IOP PublishingJournal of Physics: Conference Series 753 (2016) 022042 doi:10.1088/1742-6596/753/2/022042
4

to a reduced inflow angle for the blade at 12 o’clock or 0◦ of azimuth. Contrary, the blade at180◦ of azimuth has increased inflow angle for positive yaw.
(a) Employed notation for yawangle.
Rotor revolution []
Azimuth angle [deg]
Th
rus
t [k
N]
Po
we
r [k
W]
5.4 5.6 5.8 6 6.2 6.4 6.6
1944 2016 2088 2160 2232 2304 2376
1630
1640
1650
1660
1670
10750
10800
10850
10900
10950ThrustPowerThrust alignedPower aligned
(b) Thrust and power.
Figure 3. Fixed yaw test cases: (a) employed notation for yaw angles, and (b) thrust andpower as function of the rotor revolution.
The results for the fixed yaw case are shown in Figure 3(b). The periodic variation of thrustand power with the blade passing frequency is evident, and is caused by the advancing andretreating blade effect [25]. To be more specific, the blade is advancing in the upper half planeand retreating in the lower half plane with respect to the in-plane wind component. The resultssuggest average reduction of thrust by 0.8% and power by 0.5% due to the yaw misalignment.This agrees with observation of Krodstat and Adaramola[26] that the loss in power output issmall (less than 3%) when the yaw angle is less than 10◦.
Next, the DTU 10-MW RWT was forced to a yawing motion about a mean angle of 0◦. Theyaw amplitude was set to A = 3◦, and the period of oscillation was Tyaw = 8.8s. The resultsin terms of power are shown in Figure 4. A periodic variation of power with the frequency of
Time/Yaw period []
Rotor revolution []
Po
we
r [k
W]
7 7.5 8 8.5 9
9.5 10 10.5 11 11.5
10700
10800
10900
11000
11100
11200
(a) Power as function of time.
Yaw angle [deg]
Po
we
r [k
W]
3 2 1 0 1 2 310700
10800
10900
11000
11100
11200
11300SinusoidalFixedcos
3
(b) Power as function of yaw angle.
Figure 4. Power as function of time (a) and yawing amplitude (b).
yawing is visible. In this case, the frequency of rotation does not coincide with the frequency ofyawing motion. This results in the asymmetries observed in Figure 4 due to the advancing andretreating blade effect [25]. Further, the power obtained for the fixed yaw cases is presented in
The Science of Making Torque from Wind (TORQUE 2016) IOP PublishingJournal of Physics: Conference Series 753 (2016) 022042 doi:10.1088/1742-6596/753/2/022042
5

Figure 4(b) for comparison. The power variation with the yaw angle α may be approximatedby P (0◦) cosx(α), given that the yaw angle is fixed for each point [27]. The exponent x is oftenthought to be equal to 3. Experimental evidences suggest that the exponent x may vary between1.8 and 5 [25]. Recent wind tunnel measurements shown that the curve based on x = 3 followswell measured data [26]. In this case, the exponent x = 3 shows good agreement with thecomputed power loss for fixed yaw misalignments, as can be seen in Figure 4(b). Error barsindicate the minimum and maximum value over the revolution.
The power production agrees between static and dynamic yaw cases for the maximum yawangles. This is expected result, since the rotor has zero yawing velocity at maximum angle.However, the power variation due to the dynamic yaw motion shows larger amplitude, with themaximum value in the middle of the cycle. The increase in power production is about 2.5%, ascompared to the aligned rotor case.
(a) Yaw −3◦. (b) Yaw 0◦. (c) Yaw 3◦. (d) Yaw 0◦.
Figure 5. Instantaneous vortices visualised with the iso-surfaces of Q = 0.05 criterion colouredby the pressure coefficient CP . Yawing amplitude 3◦, and yawing period 8.8s.
Time [s]
Ya
w a
ng
le [
de
g]
Ya
w a
ng
ula
r v
elo
cit
y [
de
g/s
]
40 45 50 55 60 65
4
2
0
2
4
5
3
1
1
3
5
Yaw angleAngular velocity
T1
T2
T3
T4
Figure 6. Yaw angle and yaw angular velocity as function of time.
Finally, Figure 5 shows the wake of the wind turbine at various instances visualised with theiso-surfaces of Q = 0.05 criterion. The presented instances correspond to the times shown inFigure 6, where the positive and negative yaw angles are defined in Figure 3(a).
3.2. Dynamic pitching of DTU 10MW reference wind turbine
The DTU 10MW RWT was forced to perform a sinusoidal pitching motion about the pointlocated 119m below the rotor, and corresponds to the hub height in Bak et al.[20] The pitchingamplitude was set to A = 3◦ for the first test case (Test case P1), and to A = 5◦ for the secondtest case (Test case P2). The mean pitch angle was zero degrees, and the period of motion forboth cases was set to Tpitch = 8.8s. The frequency of the pitching motion was chosen based onthe most probable frequency of the waves for the wind speed of 11m/s [24]. The results in terms
The Science of Making Torque from Wind (TORQUE 2016) IOP PublishingJournal of Physics: Conference Series 753 (2016) 022042 doi:10.1088/1742-6596/753/2/022042
6

of thrust and power for both cases are compared in Figure 7. The results show large variations ofthe thrust and power. This agrees with the results presented in [18], where 5MW wind turbineundergoing pitching motion experienced from 0MW to 15MW of instantaneous aerodynamicpower. Interestingly, the average thrust for both cases is close to the value obtained without thepitching i.e. about 1650kN of thrust. However, the mean power is about 12.3MW and 14.4MWfor the pitching amplitudes of 3◦ and 5◦, respectively. This corresponds to an increase of powerby 13.4% and 32.8%, as compared to the power output of an aligned rotor not undergoingpitching motion.
Time/Pitch period []
Rotor revolution []
Th
rus
t [k
N]
Po
we
r [k
W]
3.25 3.5 3.75 4 4.25 4.5 4.75 5 5.25
4.5 5 5.5 6 6.5
0
500
1000
1500
2000
2500
3000
3500
4000
5000
5000
15000
25000
35000
45000
55000Thrust A=3o
Power A=3o
Thrust A=5o
Power A=5o
(a) Thrust and power as function of time
Pitch angle [deg]
Th
rus
t [k
N]
Po
we
r [k
W]
6 4 2 0 2 4 60
500
1000
1500
2000
2500
3000
3500
4000
5000
5000
15000
25000
35000
45000
55000Thrust A=3
o
Power A=3o
Thrust A=5o
Power A=5o
Power fixedThrust fixed
(b) Thrust and power as function of pitch angle
Figure 7. Thrust and power as function of time (a) and pitching amplitude (b).
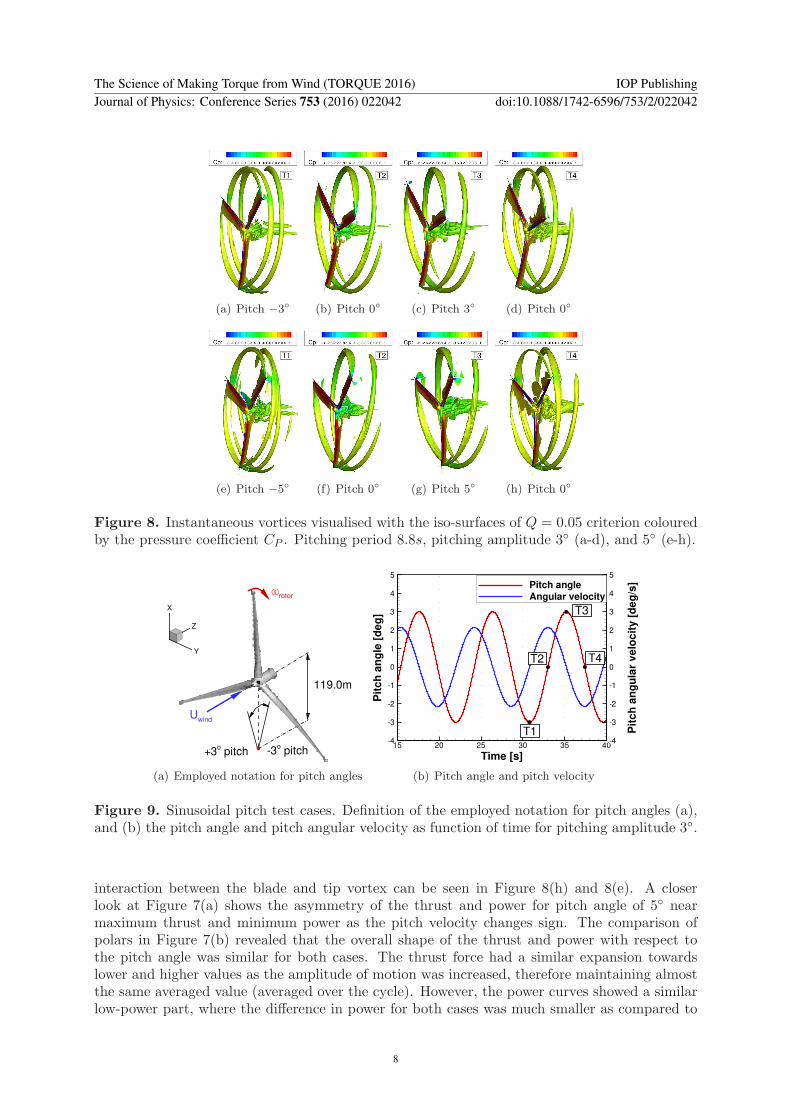
Figure 7(b) shows the thrust and power as functions of the pitch angle, where a hysteresisloop is observed. Figure 8 shows the wake of the wind turbine at various instances visualisedwith iso-surfaces of Q = 0.05 criterion. The presented instances correspond to the times shownin Figure 9, where negative pitch angle represents a wind turbine pitching towards the directionof the wind, while positive pitch angle represents the wind turbine pitching away of the wind.
Estimates of the induced velocity vi were used to show that the wind turbine enteredthe turbulent wake or the vortex ring states. The induced velocity was estimated from themomentum theory in the applicable range, and the formula of Rand[28] was used otherwise,leading to the following expression for the rate of induced velocity
vi/vh =
−Vc
2vh−
√
( Vc
2vh)2 − v2h for Vc/vh ≤ −2
1− Vc
2vh+ 25V 2
c
12v2h
+ 7V 3c
6v3h
for − 2 < Vc/vh < 0, (1)
where vi is the induced velocity, vh =√
T/2ρS is the induced velocity in ”hover” for the giventhrust T and the rotor area S, and Vc is the inflow velocity normal to the rotor plane. Theinflow velocity was computed from the wind speed Uwind, the linear velocity of the hub in thedirection of the wind Uhub, and the pitch angle α as:
Vc = −(Uwind cos(α) + Uhub/ cos(α)), (2)
where the negative sign of inflow velocity was introduced to agree with the notation used forhelicopters[28, 29]. The results are presented in Figure 10. As can be seen, the wind turbinedid not encounter a vortex ring state for 3◦ of amplitude. This agrees with the fluctuationsof thrust and power, where variations were almost symmetric with respect to the pitch angle.However, for the second test case (A = 5◦) the rotor partially entered vortex ring state. The
The Science of Making Torque from Wind (TORQUE 2016) IOP PublishingJournal of Physics: Conference Series 753 (2016) 022042 doi:10.1088/1742-6596/753/2/022042
7
(a) Pitch −3◦ (b) Pitch 0◦ (c) Pitch 3◦ (d) Pitch 0◦
(e) Pitch −5◦ (f) Pitch 0◦ (g) Pitch 5◦ (h) Pitch 0◦
Figure 8. Instantaneous vortices visualised with the iso-surfaces of Q = 0.05 criterion colouredby the pressure coefficient CP . Pitching period 8.8s, pitching amplitude 3◦ (a-d), and 5◦ (e-h).
Uwind
3o pitch+3
o pitch
rotor
119.0m
Z
X
Y
(a) Employed notation for pitch angles
Time [s]
Pit
ch
an
gle
[d
eg
]
Pit
ch
an
gu
lar
ve
loc
ity
[d
eg
/s]
15 20 25 30 35 404
3
2
1
0
1
2
3
4
5
4
3
2
1
0
1
2
3
4
5
Pitch angleAngular velocity
T1
T2
T3
T4
(b) Pitch angle and pitch velocity
Figure 9. Sinusoidal pitch test cases. Definition of the employed notation for pitch angles (a),and (b) the pitch angle and pitch angular velocity as function of time for pitching amplitude 3◦.
interaction between the blade and tip vortex can be seen in Figure 8(h) and 8(e). A closerlook at Figure 7(a) shows the asymmetry of the thrust and power for pitch angle of 5◦ nearmaximum thrust and minimum power as the pitch velocity changes sign. The comparison ofpolars in Figure 7(b) revealed that the overall shape of the thrust and power with respect tothe pitch angle was similar for both cases. The thrust force had a similar expansion towardslower and higher values as the amplitude of motion was increased, therefore maintaining almostthe same averaged value (averaged over the cycle). However, the power curves showed a similarlow-power part, where the difference in power for both cases was much smaller as compared to
The Science of Making Torque from Wind (TORQUE 2016) IOP PublishingJournal of Physics: Conference Series 753 (2016) 022042 doi:10.1088/1742-6596/753/2/022042
8
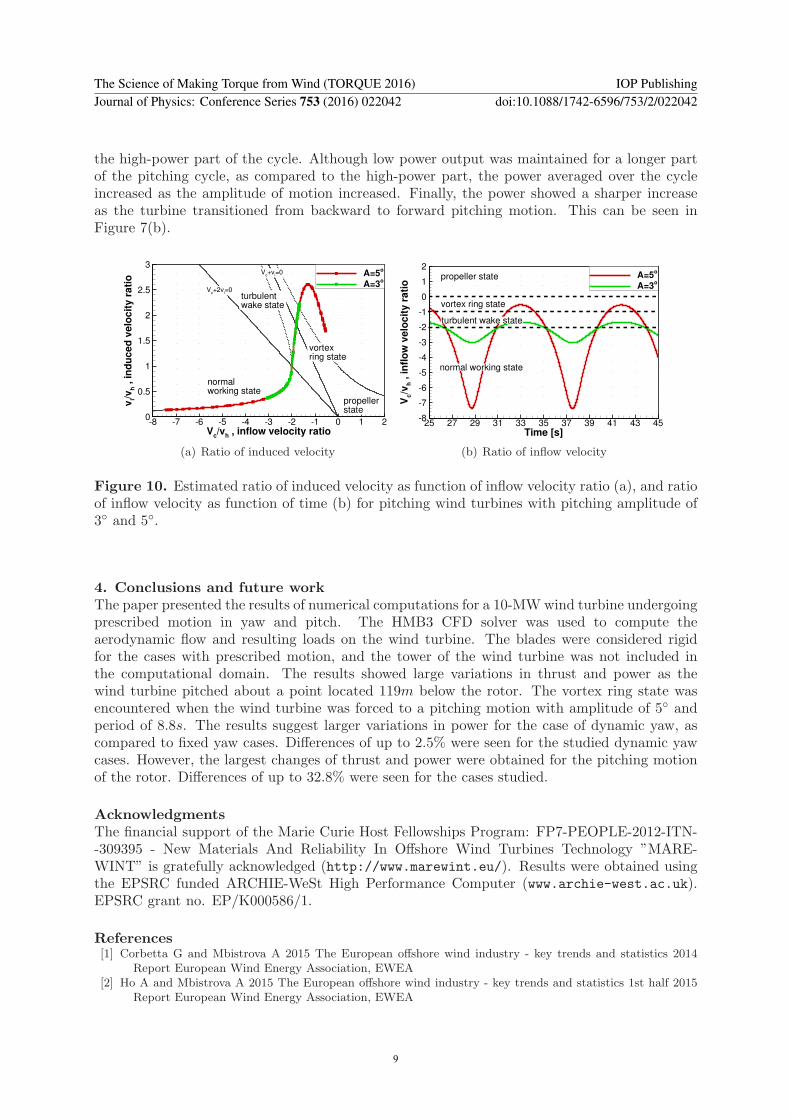
the high-power part of the cycle. Although low power output was maintained for a longer partof the pitching cycle, as compared to the high-power part, the power averaged over the cycleincreased as the amplitude of motion increased. Finally, the power showed a sharper increaseas the turbine transitioned from backward to forward pitching motion. This can be seen inFigure 7(b).
Vc/v
h , inflow velocity ratio
vi/v
h , in
du
ce
d v
elo
cit
y r
ati
o
8 7 6 5 4 3 2 1 0 1 20
0.5
1
1.5
2
2.5
3A=5
o
A=3o
normalworking state
propellerstate
Vc+v
i=0
Vc+2v
i=0
turbulentwake state
vortexring state
(a) Ratio of induced velocity
Time [s]
Vc/v
h , in
flo
w v
elo
cit
y r
ati
o
25 27 29 31 33 35 37 39 41 43 458
7
6
5
4
3
2
1
0
1
2A=5
o
A=3o
propeller state
vortex ring state
turbulent wake state
normal working state
(b) Ratio of inflow velocity
Figure 10. Estimated ratio of induced velocity as function of inflow velocity ratio (a), and ratioof inflow velocity as function of time (b) for pitching wind turbines with pitching amplitude of3◦ and 5◦.
4. Conclusions and future work
The paper presented the results of numerical computations for a 10-MWwind turbine undergoingprescribed motion in yaw and pitch. The HMB3 CFD solver was used to compute theaerodynamic flow and resulting loads on the wind turbine. The blades were considered rigidfor the cases with prescribed motion, and the tower of the wind turbine was not included inthe computational domain. The results showed large variations in thrust and power as thewind turbine pitched about a point located 119m below the rotor. The vortex ring state wasencountered when the wind turbine was forced to a pitching motion with amplitude of 5◦ andperiod of 8.8s. The results suggest larger variations in power for the case of dynamic yaw, ascompared to fixed yaw cases. Differences of up to 2.5% were seen for the studied dynamic yawcases. However, the largest changes of thrust and power were obtained for the pitching motionof the rotor. Differences of up to 32.8% were seen for the cases studied.
Acknowledgments
The financial support of the Marie Curie Host Fellowships Program: FP7-PEOPLE-2012-ITN--309395 - New Materials And Reliability In Offshore Wind Turbines Technology ”MARE-WINT” is gratefully acknowledged (http://www.marewint.eu/). Results were obtained usingthe EPSRC funded ARCHIE-WeSt High Performance Computer (www.archie-west.ac.uk).EPSRC grant no. EP/K000586/1.
References[1] Corbetta G and Mbistrova A 2015 The European offshore wind industry - key trends and statistics 2014
Report European Wind Energy Association, EWEA[2] Ho A and Mbistrova A 2015 The European offshore wind industry - key trends and statistics 1st half 2015
Report European Wind Energy Association, EWEA
The Science of Making Torque from Wind (TORQUE 2016) IOP PublishingJournal of Physics: Conference Series 753 (2016) 022042 doi:10.1088/1742-6596/753/2/022042
9

[3] Corbetta G, Ho A, Pineda I, Ruby K, Van de Velde L and Bickley J 2015 Wind energy scenarios for 2030Report European Wind Energy Association, EWEA
[4] Fried L, Qiao L, Sawyer S, Shukla S and Bitter L 2014 Global wind report 2014: Annual market updateOnline Global Wind Energy Council, GWEC
[5] Arapogianni A, Genachte A B, Ochagavia R M, Vergara J P, Castell D, Tsouroukdissian A R, Korbijn J,Bolleman N C, Huera-Huarte F J, Schuon F, Ugarte A, Sandberg J, de Laleu V, Maciel J, Tunbjer A, RothR, de la Gueriviere P, Coulombeau P, Jedrec S, Philippe C, Voutsinas S, Weinstein A, Vita L, Byklum E,Hurley W L and Grubel H 2013 Deep water - The next step for offshore wind energy Report EuropeanWind Energy Association, EWEA
[6] Sebastian T and Lackner M A 2011 Proceedings of 49th AIAA Aerospace Sciences Meeting (Orlando, Florida)[7] Koyanagi T, Karikomi K, Iwasaki S and Nakamura A 2015 Proceedings of DEWEK 2015 conference (Bremen,
Germany)[8] Tran T T and Kim D H 2015 Journal of Wind Engineering and Industrial Aerodynamics 142 65–81 ISSN
0167-6105 URL http://dx.doi.org/10.1016/j.jweia.2015.03.009
[9] Hansen A C and Cui X 1989 Journal of Solar Energy Engineering 111 367–371 ISSN 0199-6231 URLhttp://dx.doi.org/10.1115/1.3268336
[10] Madsen H A, Sorensen N N and Schreck S 2003 ASME 2003 Wind Energy Symposium (ASME) pp 94–103ISBN 1-56347-594-4 URL http://dx.doi.org/10.1115/wind2003-519
[11] Jeong M S, Kim S W, Lee I, Yoo S J and Park K 2013 Renewable Energy 60 256–268 ISSN 0960-1481 URLhttp://dx.doi.org/10.1016/j.renene.2013.05.014
[12] Xu B F, Wang T G, Yuan Y and Cao J F 2015 Philosophical Transactions of the Royal
Society of London A: Mathematical, Physical and Engineering Sciences 373 ISSN 1364-503X URLhttp://dx.doi.org/10.1098/rsta.2014.0080
[13] Snel H and Schepers J 1995 Joint investigation of dynamic inow effects and implementation of an engineeringmethod Technical Report ECN-C-94107 Energy research Center of the Netherlands, ECN
[14] Qiu Y X, Wang X D, Kang S, Zhao M and Liang J Y 2014 Renewable Energy 70 93 – 106 ISSN 0960-1481URL http://dx.doi.org/10.1016/j.renene.2014.03.071
[15] Jeon M, Lee S and Lee S 2014 Renewable Energy 65 207 – 212 ISSN 0960-1481 URLhttp://dx.doi.org/10.1016/j.renene.2013.09.009
[16] de Vaal J, Hansen M and Moan T 2014 Wind Energy 17 105–121 ISSN 1099-1824 URLhttp://dx.doi.org/10.1002/we.1562
[17] Sant T and Cuschieri K 2016 Journal of Solar Energy Engineering 138 031004–031004 ISSN 0199-6231 URLhttp://dx.doi.org/10.1115/1.4032684
[18] Tran T and Kim D 2015 Journal of Mechanical Science and Technology 29 549–561 ISSN 1738-494X URLhttp://dx.doi.org/10.1007/s12206-015-0115-0
[19] Brocklehurst A, Steijl R and Barakos G 2008 34th European Rotorcraft Forum (ERF)[20] Bak C, Zhale F, Bitsche R, Kim T, Yde A, Henriksen L C, Andersen P B, Natarajan A and MH H 2013
Description of the dtu 10 mw reference wind turbin Technical Report I-0092 DTU Wind Energy[21] Bjorck A Coordinates and caluclations for the FFA-W1-xxx, FFA-W2-xxx and FFA-W3-xxx series of airfoils
for horizontal axis wind turbines Technical Report FFA TN 1990-15 The Aeronautical Research Instituteof Sweden, FFA
[22] Steijl R and Barakos G 2008 International Journal for Numerical Methods in Fluids 58 527–549 ISSN 1097-0363 URL http://dx.doi.org/10.1002/fld.1757
[23] Menter F 1994 AIAA Journal 32 1598–1605 ISSN 0001-1452 URL http://dx.doi.org/10.2514/3.12149
[24] Lee W T, Bales S L and Sowby S E 1985 Standardized Wind and Wave Environments for North Pacific
Ocean Areas (David W. Taylor Naval Ship Research and Development Center)[25] Schepers J G 2012 Engineering models in wind energy aerodynamics: Development, implementation
and analysis using dedicated aerodynamic measurements Ph.D. thesis Wind Energy Department DelftUniversity of Technology
[26] Krogstad P A and Adaramola M S 2012 Wind Energy 15 743–756 ISSN 1099-1824 URLhttp://dx.doi.org/10.1002/we.502
[27] Burton T, Sharpe D, Jenkins N and Bossanyi E 2002 Wind Energy Handbook (Chichester, UK: John Wiley& Sons, Ltd) ISBN 9780470846063
[28] Rand O 2006 Journal of the American Helicopter Society 51 279–282[29] Leishman J G 2006 Principles of Helicopter Aerodynamics 2nd ed (Cambridge University Press) ISBN
9780521858601
The Science of Making Torque from Wind (TORQUE 2016) IOP PublishingJournal of Physics: Conference Series 753 (2016) 022042 doi:10.1088/1742-6596/753/2/022042
10