forecasting 2020 u.s. county and msa...
TRANSCRIPT

Forecasting 2020 U.S. County and MSA Populations
April 2006
ABSTRACT
Population growth at the county level can be predicted using widely available demographic and
economic data. Past recent growth, the presence of immigrants, the fraction of population older than
25 and younger than 65, low taxes, and good weather are all positively associated with population
growth. Our forecasts reveal that most growth and real estate development will occur in the West,
Sunbelt, and along the Southern I-85 route. However, our model only accounts for 75 percent of the
variance in growth experiences between 1980 and 2000, with the other 25 percent explained by
“surprise” events. Many unexpected places will be winners or losers in the game of future local real
estate development. A companion spreadsheet of our population predictions at the county level
(metropolitan counties) can be found following the last page of this working paper.
Peter Linneman The Wharton School University of Pennsylvania Real Estate Department 1470 Steinberg Hall-Dietrich Hall 3620 Locust Walk Philadelphia, PA 19104-6302 [email protected]
Albert Saiz The Wharton School University of Pennsylvania Real Estate Department 1466 Steinberg Hall-Dietrich Hall 3620 Locust Walk Philadelphia, PA 19104-6302 [email protected]

2
Whether using explicit statistical models, recent information on the evolution of local markets,
conversations with friends, the latest headlines in the local newspaper, or gut feelings, real estate
entrepreneurs are constantly guessing the future demand for their product. Population growth is
associated with increased residential demand, increased demand in the office and distribution
sectors, and more shoppers to patronize local retail. In short, population growth drives real estate
development opportunities.
We examine the key statistical determinants of population growth in U.S. metropolitan
counties, identifying characteristics that are important predictors of subsequent population growth.
From our statistical analysis we gain a better understanding of the conceptual underpinnings of the
population growth across U.S. metropolitan counties during the last 30 years. In addition to learning
what makes cities “tick,” we are also able to make predictions of population growth for all
metropolitan counties in the U.S.
It is perilous to predict the future. However, our model accurately describes the population
growth that took place from 1980 to 2000, and past growth forecasts future growth relatively
accurately. We therefore believe that our estimates for 2000-2020 population growth will prove to be
not too far off the mark. Nevertheless, our statistical work fails to account for about a quarter of all
the variation in county population growth. That is, growth surprises do occur, and in some cases they
matter a lot. In the 1950s, who would have predicted that Benton County, Arkansas, would emerge
as the center of the biggest commercial empire in world history? Spurred by the phenomenal growth
of Wal-Mart, Benton County makes the Census list of top 70 counties by population growth. The
point is that our statistical analysis cannot predict who the next Sam Walton will be, and where he or
she will be based.

3
POPULATION GROWTH 1980-2000
Regression analysis allows us to identify some of the key variables that predict future population
growth. We explore a variety of variables at the county level. Examples include demographic
variables (such as the percentage of individuals older than 65), fiscal variables (such as taxes) and
geographic factors (such as local weather and elevation). These variables have predictive power for
several reasons. First, they capture attributes of an area that cause it to grow economically, and
therefore attract employees. Firm productivity varies across locales for several reasons: the skills and
education of their population; accessibility to markets and transportation nodes; the impact of local
public finances (taxes and expenditures); and agglomeration economies. The latter refers to firms
becoming more productive if they locate closer to similar firms, enabling them to share information,
infrastructures, and a pool of relevant workers, and to reduce the transportation costs of their
common input and output transactions.
Other variables predict how attractive an area is for prospective inhabitants due to local
amenities. Research by Edward Glaeser, Jed Kolko, and Albert Saiz (2001) demonstrates that cities
are becoming as important in terms of consumption as they used to be in terms of traditional
productivity. The capacity to generate and retain amenities adds considerably to the appeal of a city.
Some cities will attract high-income residents with varied shopping experiences, proximity to
attractive activities, good schools, and a strong social milieu that is conductive to both work and
play. The attraction to a city on the basis of its physical and social environment represents a major
paradigm shift; whereas people formerly followed jobs, jobs now also follow workers.
Thanks to information and ethnic networks, people tend to move to areas where they have
social contacts. Thus, metropolitan areas with large immigrant populations, for example, tend to
attract yet more immigrants. In addition, the characteristics of the population of a county can predict
population growth for simple biological reasons: younger populations tend to be more fertile, while
the elderly experience higher mortality rates. Finally, some variables are good predictors of

4
population growth even though they are difficult to measure: a vibrant lifestyle, an openness to
entrepreneurs, a good climate, and so on.
This study focuses on “metropolitan counties” as defined by the Office of Management and
Budget (OMB) in 2000. These are counties that belong to OMB-defined metropolitan areas which
are major population centers. We limit ourselves to the continental U.S., excluding Hawaii, Alaska
and Puerto Rico. The 804 counties that we examine in our analysis represent 76 percent of all U.S.
population in 2000.
The U.S. population has grown by about 10 percent every decade since 1970, and is
predicted to continue doing so through 2020. In the 2000, the population was estimated to be 282
million, and by 2020 it is expected to grow to 336 million. This means that
Figure 1. US Population, 1970 - 2020
050
100150200250300350400
1970 1980 1990 2000 2010 2020
Year
Popu
latio
n (M
illio
ns o
f Peo
ple)
between 2000 and 2020 the population will increase by a staggering 53.7 million. Where will these
people live? Our statistical model addresses this question by analyzing county population growth
across all metropolitan counties between 1980 and 2000. The focus is on long term urban population
growth.
Whereas most of the previous research on city growth has focused on percentage population
growth, we use a more relevant growth metric that recognizes that in very small counties, growth
rates can be extremely high although the actual number of new people moving into the area is very

5
small. We calculate the share of county population as a percentage of total U.S. population, and use
the change in that share between 1980 and 2000 in our statistical analysis. To the best of our
knowledge, this is the first time this particular variable has been used in the context of long term
growth. Since this measure is relative to the total size of the population, we combine our regression
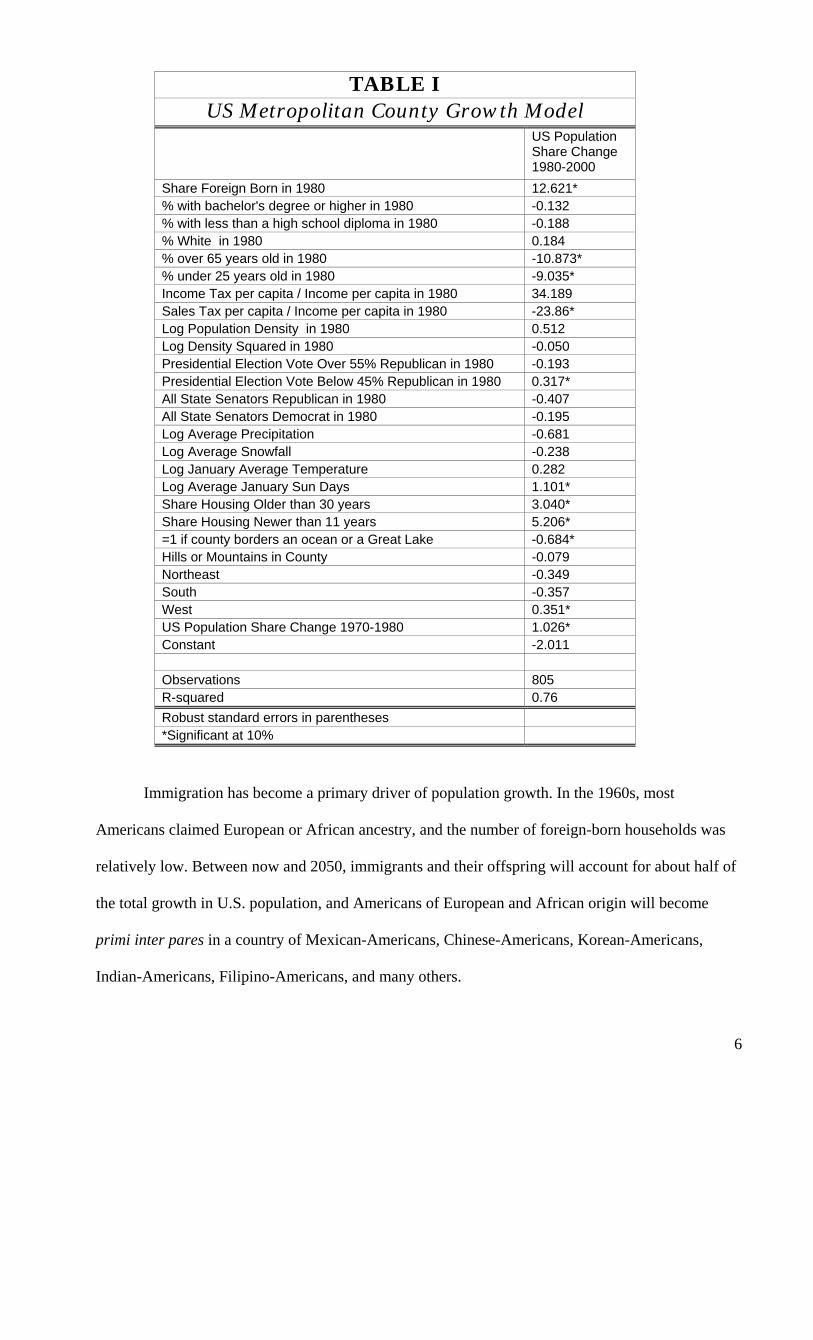
results with Census projections of future population growth to forecast local growth. Table I shows
the results of a regression analysis of the change in total population share 1980-2000 as a function of
a number of county characteristics in 1980.
The dependent variable in the regressions is multiplied by 10,000 so that our regression
coefficients do not display an inordinate number of decimal positions. Table I presents the results,
including a variable that has high forecasting power: the “population market share capture” of the
county during the period 1970-1980 (growth in the recent past). Thus, we find that recent past
growth forecasts future growth. This regression accounts for 75 percent of the variability in county
growth.
Our model is rich in specification, including 26 local economic, demographic, political,
climatologic, geological, and housing variables. We will focus primarily on describing the impacts
of the variables that are most statistically significant, although we will comment on a few variables
that we expected to be more important. We begin by noting the importance of recent growth. Our
results confirm this result of previous research that used data from different countries, and different
geographic definitions (for example, city level forecasts), population growth definitions, and time
periods. Everyone (including us) finds that even after controlling for a variety of other variables
population growth is extremely persistent; absent other information, the best way to predict a
county’s population growth is to look at how much it grew in the past decade. It appears that the
forces that shape an area’s attractiveness have persistent impacts.
6
TABLE I US Metropolitan County Growth Model
US Population Share Change 1980-2000
Share Foreign Born in 1980 12.621* % with bachelor's degree or higher in 1980 -0.132 % with less than a high school diploma in 1980 -0.188 % White in 1980 0.184 % over 65 years old in 1980 -10.873* % under 25 years old in 1980 -9.035* Income Tax per capita / Income per capita in 1980 34.189 Sales Tax per capita / Income per capita in 1980 -23.86* Log Population Density in 1980 0.512 Log Density Squared in 1980 -0.050 Presidential Election Vote Over 55% Republican in 1980 -0.193 Presidential Election Vote Below 45% Republican in 1980 0.317* All State Senators Republican in 1980 -0.407 All State Senators Democrat in 1980 -0.195 Log Average Precipitation -0.681 Log Average Snowfall -0.238 Log January Average Temperature 0.282 Log Average January Sun Days 1.101* Share Housing Older than 30 years 3.040* Share Housing Newer than 11 years 5.206* =1 if county borders an ocean or a Great Lake -0.684* Hills or Mountains in County -0.079 Northeast -0.349 South -0.357 West 0.351* US Population Share Change 1970-1980 1.026* Constant -2.011 Observations 805 R-squared 0.76 Robust standard errors in parentheses *Significant at 10%
Immigration has become a primary driver of population growth. In the 1960s, most
Americans claimed European or African ancestry, and the number of foreign-born households was
relatively low. Between now and 2050, immigrants and their offspring will account for about half of
the total growth in U.S. population, and Americans of European and African origin will become
primi inter pares in a country of Mexican-Americans, Chinese-Americans, Korean-Americans,
Indian-Americans, Filipino-Americans, and many others.

7
It is obvious that immigration will be a key element of county-level growth, but can we
forecast where immigrants will settle? The answer to the question is a qualified yes. Immigrants tend
to concentrate wherever previous immigrants have settled. Kinship ties, shared language, and the
existence of common amenities and public goods, make “immigrant enclaves” attractive to
subsequent immigrants. Thus, a county’s share of the foreign-born in 1980 was an important
predictor of population growth from 1980-2000. And so it will be in the future.
Previous research by Edward Glaeser and Albert Saiz (2003) has shown that during the last
century local educational achievement has been an important explanatory factor for population
growth in cities. In short, smart cities grow faster. We find the same to be true at the county level.
Specifically, counties with lower shares of high-school dropouts grew more quickly. However,
education is a weaker predictor of county growth than metropolitan growth, especially when one
includes previous growth trends. This means that education has an important long-run impact, but
that short-term changes in education levels are not powerful predictors of short-term changes in
growth patterns. Metropolitan areas with highly educated individuals are more productive, allowing
them to pay higher wages, which attracts population inflows. On the other hand, highly educated
populations are typically more effective in curtailing local residential development at the local level,
and may be a counter influence on population growth.
The age distribution of the population is another predictor of future growth, that is, very
young and very old populations tend to grow more slowly. Specifically, we find that population
growth is negatively related to both the share of people younger than 25, and older than 65,
reflecting the fact that households in their prime earning years are typically older than 25, and
younger than 65. Moreover, areas with a major proportion of older residents are less attractive to
younger generations.
Tax rates are not uniform for different municipalities. We use data from the Census of
Governments on local taxation (municipal and county) to create two measures of fiscal burden,
income taxes and the sales tax. Furthermore, since different individuals typically face different tax

8
rates depending on their location, income, and type of business, we use total tax revenues per capita
divided by income per capita to measure a county’s tax burden. A high degree of taxation may make
a county less attractive to taxpayers and entrepreneurs. On the other hand, higher tax revenues may
be associated with a better public schools and public services. Our statistical analysis reveals that the
local sales tax burden is generally associated with slower population growth. Since all tax measures
are strongly associated, we tentatively conclude that higher taxation discourages local growth. We
suspect, however, that the efficiency of local government in spending sensibly, and government
efficiency in providing key public services are also important. Studying the factors that are
associated with local mismanagement or good government remains a topic for future research.
We find that population density also matters, although in a complex way. Counties with very
low densities tended to grow more slowly. But above a certain threshold, higher density is associated
with slower growth. This threshold population density corresponds with a median county density of
60 persons per square mile. Therefore, density increases growth up to about 60 people per square
mile, after which amenity levels drop and population growth diminishes.
The impact of demography on politics is a hotly debated topic by political scientists and
media pundits. Observations on the growth of “red” states and the demise of “blue” states are
commonplace. If we run our analysis with politics as the only variable, we find that Republican-
dominated counties (based upon presidential and senatorial election data from early 1980s) do tend
to grow faster. However, this can be explained by other variables. Republican-dominated counties
were already rapidly growing, so it is possible that the new rapidly growing areas are attracting
individuals with a more libertarian or conservative outlook. Moreover, many of the metropolitan
areas in “red” states have geographic attributes that are associated with growth. When we control for
these other factors, we find that political orientation is not strongly associated with growth. There is
a weak link, however, between the 1980 presidential results and subsequent county growth. Almost
half of the counties in our sample of 804 metropolitan counties had between 45 - 55 percent support
for Ronald Reagan. A number of counties were more polarized, with more than a 55 percent share
9
for either Reagan (about 40 percent) or Carter (about 12 percent). These strongly Democratic
counties grew significantly faster during the 1980-2000 period, controlling for a host of other
variables. It is unclear why.
Some of the most powerful predictors of county population growth during our sample years
are weather-related. Briefly put, Americans are rapidly leaving cold, damp, and snowy areas for
sunnier and drier climates. Both a West regional indicator and “good weather” variables are strong
predictors of population growth. All of the weather variables (snowfall, precipitation, temperature,
and sun days) are interrelated, with the number of sun days in January being the variable that comes
out more strongly in our analysis. In short, people are moving to “the bright side.” We speculate that
there may be a geopolitical economic shift from the Atlantic to the Pacific area, motivated by
changing trade links and the emergence of China and India as global powerhouses. The impact of
globalization on population growth remains an understudied topic for future exploration.
The age distribution of the county’s housing stock also has some predictive power,
confirming previous research by Edward Glaeser and Joseph Gyourko (2005). Areas with large
amounts of new housing have three important attributes that favor growth: they are favorably
inclined to development; they have a large recent demand relative to pre-existing housing; and their
housing stock is more in line with modern housing preferences. Interestingly, there is some (weak)
evidence that having a very old housing stock is mildly correlated with relatively faster growth than
would otherwise be the case. The very old housing stock that has survived was generally built for
high-income families, hence are of good quality. Since declining cities such as New Orleans, Detroit,
and Buffalo have massive and valuable housing stocks, reduced housing demand translated into
lower housing prices, and made these cities a bit less unattractive. All things equal, areas with older
housing stocks experienced slower decline than expected.
Counties that are adjacent to the coastlines of the Atlantic, Pacific, and Great Lakes, tend to
grow more slowly than inland counties. Coastal areas in the west and northeast often have restrictive
zoning, which raises prices and discourages growth. However, there appears to be no relationship

10
between the altitude of a county and its growth. This is a somewhat surprising findings, as mountain
areas are generally popular.
A LOOK AT 2020
Combining county characteristics with our statistical growth model and Census projections of total
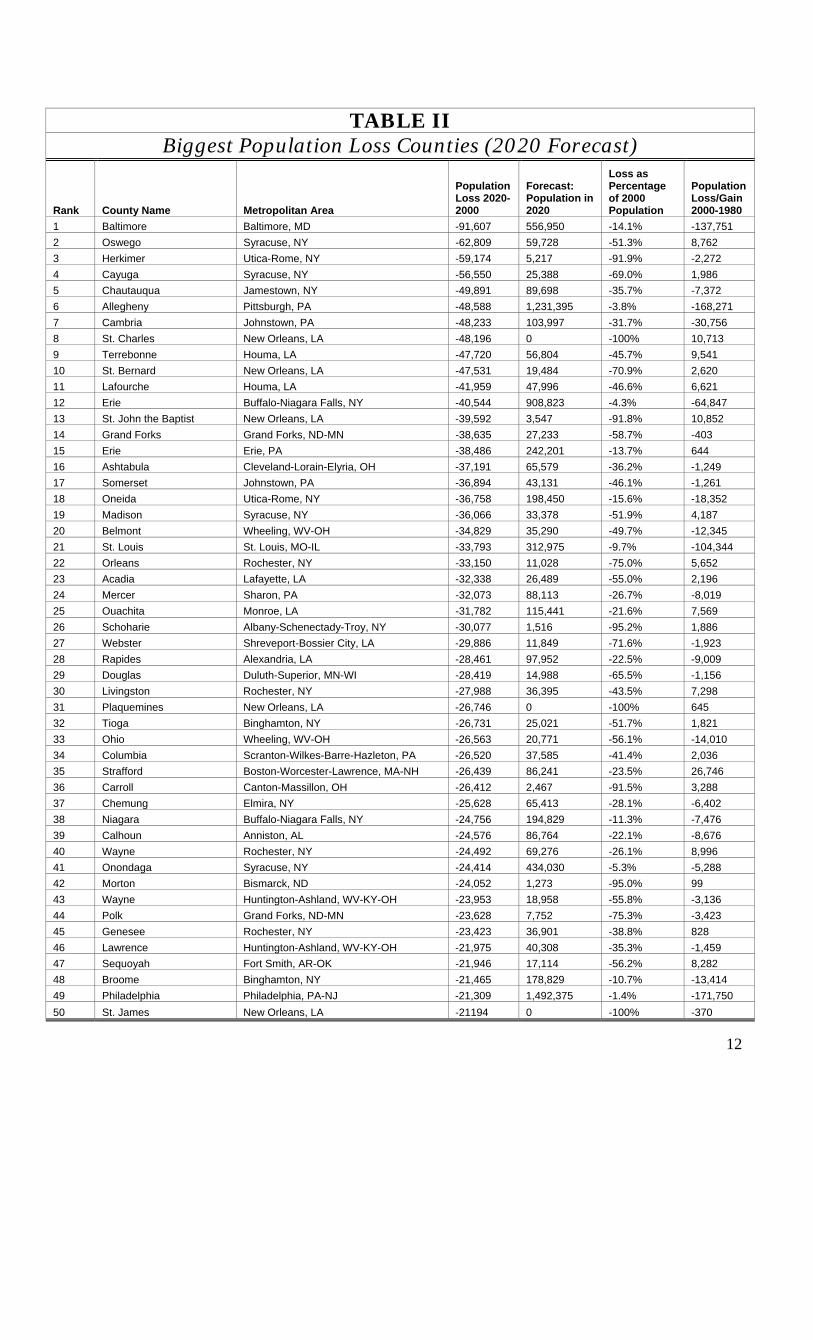
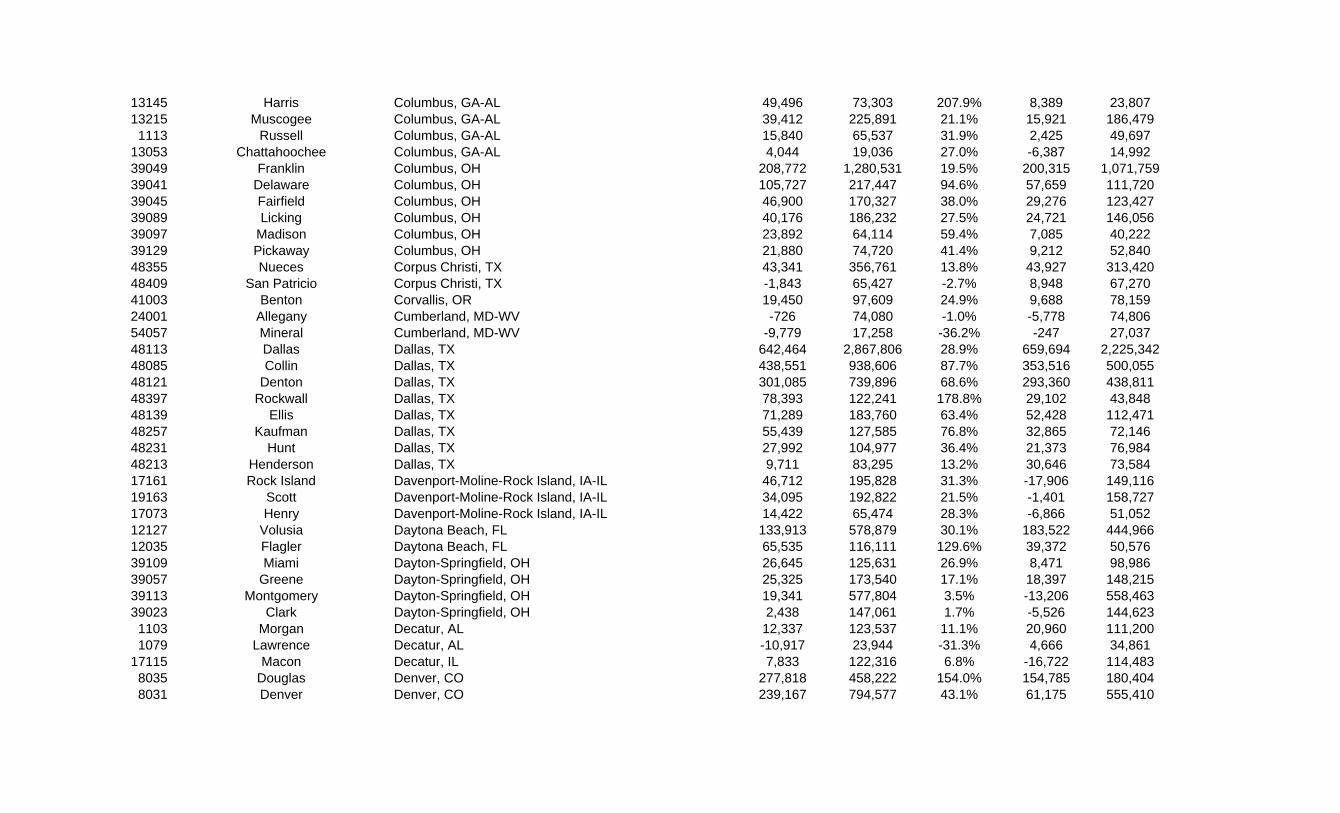
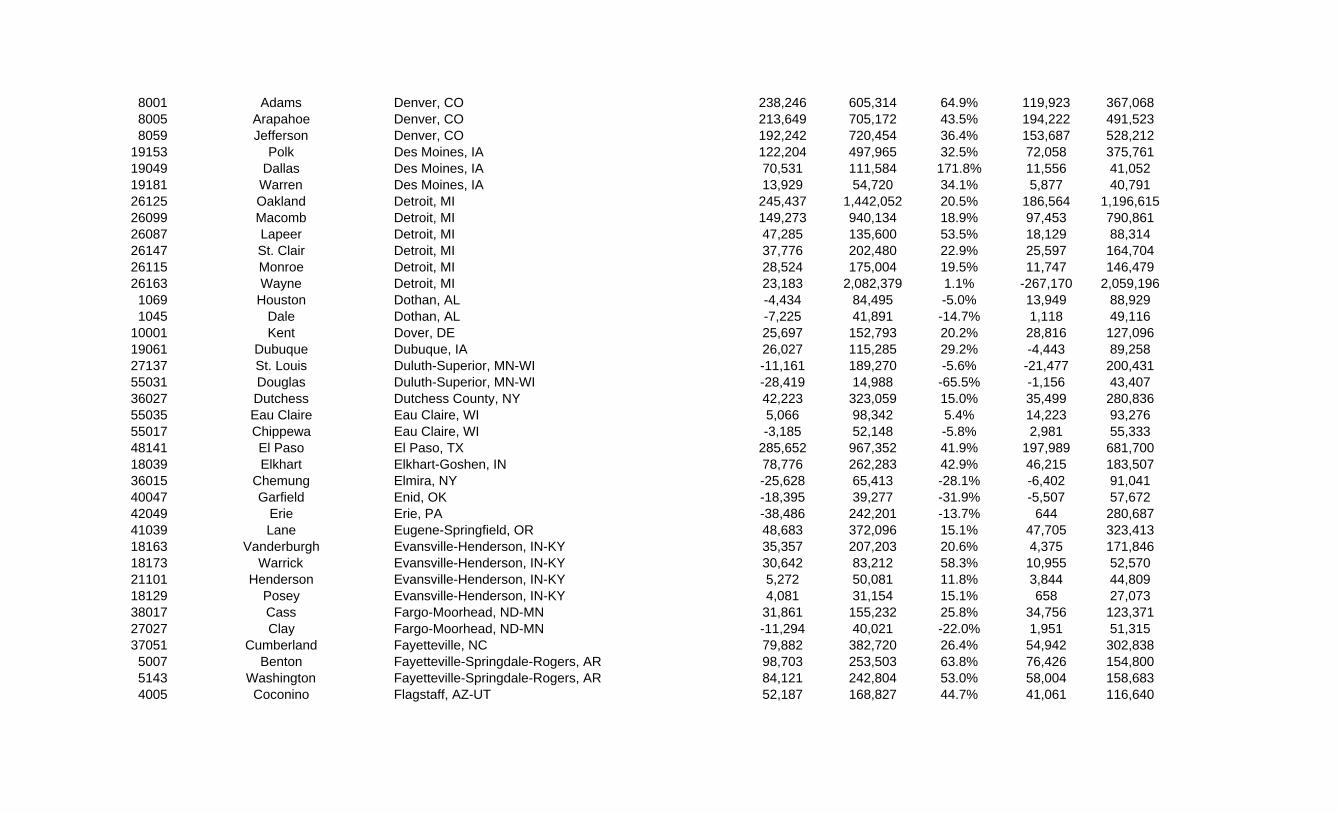
population in 2020, we obtain county and MSA population forecasts for 2020. Table II details the
counties which are the biggest projected population losers. Also displayed are their MSAs, our
estimate of population losses (expressed in both levels and as a percentage of the 2000 population),
our estimate of population levels in 2020, and previous population gains or losses over the 1980-
2000 period. Due to the fact that we used the change in the shares of the total population, 5 counties
display negative population predictions for 2020, which we replace by zero. Our expectations for
these counties are bleak, notwithstanding the fact that we do not know exactly what number of
people will actually be living there.
Baltimore has the dubious honor of being ranked the biggest loser by 2020. That city (which
is also a county) is forecast to lose about 100,000 residents, or about 15 percent of its year 2000
population. Most other counties that we expect to decline are in the Rustbelt.
Interestingly, 10 percent (5 out of 50) of the bottom counties are in the New Orleans
metropolitan area. (And this is without factoring in the impact of Katrina.) In other words, New
Orleans was the rare case of a Sunbelt area that was losing population like a Rustbelt area.
According to research by Donald Davis and David Weinstein (2002), who used data from the
bombing of Japanese cities during World War II, the impact of major disasters on a city’s population
growth tends to dissipate over time. Remarkably, they found that the cities that lost more population
during the war grew faster after, and their populations after 20 years were at the point that one would
have predicted by looking at pre-War growth trends. Thus, we are very pessimistic about New
Orleans’ growth over the next 20 years, irrespective of what aid flows to this area.

11
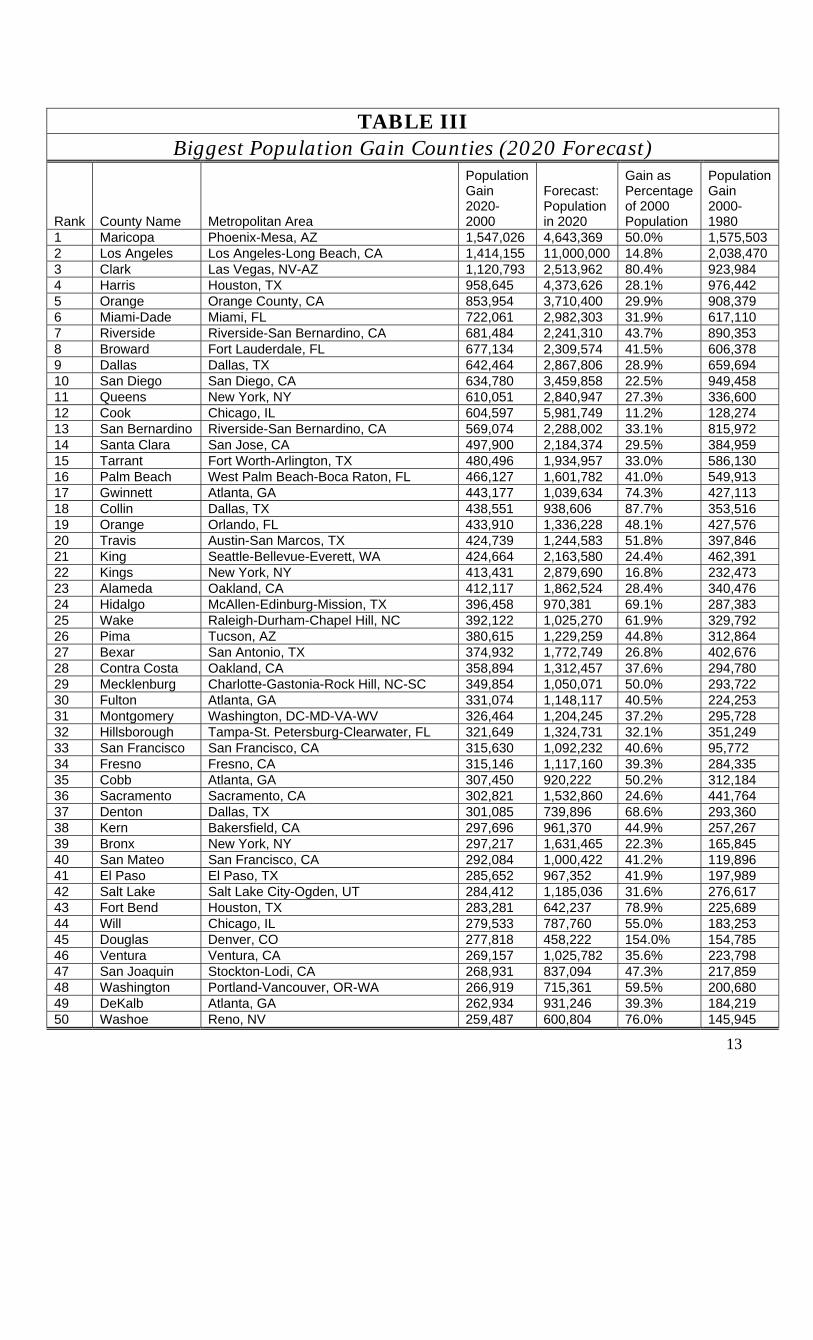
Table III displays the “winners” in terms of forecasted county growth. Big counties in major
metropolitan areas tend to dominate. Insofar as the U.S. population is growing, and the share of
population captured by a county is not declining too quickly, big counties are expected to grow
because of general population growth trends. However, Table III also captures the massive expected
growth of relatively new areas, such as Maricopa County, the top county in terms of expected
population growth in 2020. It is apparent that most of the big growth counties are in the West, the
Sunbelt, and the Southern I-85 corridor linking Atlanta with Raleigh, N.C. Our results reveal that
prospective real estate developers had better buy a good pair of sunglasses and some sunblock.
12
TABLE II Biggest Population Loss Counties (2020 Forecast)
Rank County Name Metropolitan Area
Population Loss 2020-2000
Forecast: Population in 2020
Loss as Percentage of 2000 Population
Population Loss/Gain 2000-1980
1 Baltimore Baltimore, MD -91,607 556,950 -14.1% -137,751 2 Oswego Syracuse, NY -62,809 59,728 -51.3% 8,762 3 Herkimer Utica-Rome, NY -59,174 5,217 -91.9% -2,272 4 Cayuga Syracuse, NY -56,550 25,388 -69.0% 1,986 5 Chautauqua Jamestown, NY -49,891 89,698 -35.7% -7,372 6 Allegheny Pittsburgh, PA -48,588 1,231,395 -3.8% -168,271 7 Cambria Johnstown, PA -48,233 103,997 -31.7% -30,756 8 St. Charles New Orleans, LA -48,196 0 -100% 10,713 9 Terrebonne Houma, LA -47,720 56,804 -45.7% 9,541 10 St. Bernard New Orleans, LA -47,531 19,484 -70.9% 2,620 11 Lafourche Houma, LA -41,959 47,996 -46.6% 6,621 12 Erie Buffalo-Niagara Falls, NY -40,544 908,823 -4.3% -64,847 13 St. John the Baptist New Orleans, LA -39,592 3,547 -91.8% 10,852 14 Grand Forks Grand Forks, ND-MN -38,635 27,233 -58.7% -403 15 Erie Erie, PA -38,486 242,201 -13.7% 644 16 Ashtabula Cleveland-Lorain-Elyria, OH -37,191 65,579 -36.2% -1,249 17 Somerset Johnstown, PA -36,894 43,131 -46.1% -1,261 18 Oneida Utica-Rome, NY -36,758 198,450 -15.6% -18,352 19 Madison Syracuse, NY -36,066 33,378 -51.9% 4,187 20 Belmont Wheeling, WV-OH -34,829 35,290 -49.7% -12,345 21 St. Louis St. Louis, MO-IL -33,793 312,975 -9.7% -104,344 22 Orleans Rochester, NY -33,150 11,028 -75.0% 5,652 23 Acadia Lafayette, LA -32,338 26,489 -55.0% 2,196 24 Mercer Sharon, PA -32,073 88,113 -26.7% -8,019 25 Ouachita Monroe, LA -31,782 115,441 -21.6% 7,569 26 Schoharie Albany-Schenectady-Troy, NY -30,077 1,516 -95.2% 1,886 27 Webster Shreveport-Bossier City, LA -29,886 11,849 -71.6% -1,923 28 Rapides Alexandria, LA -28,461 97,952 -22.5% -9,009 29 Douglas Duluth-Superior, MN-WI -28,419 14,988 -65.5% -1,156 30 Livingston Rochester, NY -27,988 36,395 -43.5% 7,298 31 Plaquemines New Orleans, LA -26,746 0 -100% 645 32 Tioga Binghamton, NY -26,731 25,021 -51.7% 1,821 33 Ohio Wheeling, WV-OH -26,563 20,771 -56.1% -14,010 34 Columbia Scranton-Wilkes-Barre-Hazleton, PA -26,520 37,585 -41.4% 2,036 35 Strafford Boston-Worcester-Lawrence, MA-NH -26,439 86,241 -23.5% 26,746 36 Carroll Canton-Massillon, OH -26,412 2,467 -91.5% 3,288 37 Chemung Elmira, NY -25,628 65,413 -28.1% -6,402 38 Niagara Buffalo-Niagara Falls, NY -24,756 194,829 -11.3% -7,476 39 Calhoun Anniston, AL -24,576 86,764 -22.1% -8,676 40 Wayne Rochester, NY -24,492 69,276 -26.1% 8,996 41 Onondaga Syracuse, NY -24,414 434,030 -5.3% -5,288 42 Morton Bismarck, ND -24,052 1,273 -95.0% 99 43 Wayne Huntington-Ashland, WV-KY-OH -23,953 18,958 -55.8% -3,136 44 Polk Grand Forks, ND-MN -23,628 7,752 -75.3% -3,423 45 Genesee Rochester, NY -23,423 36,901 -38.8% 828 46 Lawrence Huntington-Ashland, WV-KY-OH -21,975 40,308 -35.3% -1,459 47 Sequoyah Fort Smith, AR-OK -21,946 17,114 -56.2% 8,282 48 Broome Binghamton, NY -21,465 178,829 -10.7% -13,414 49 Philadelphia Philadelphia, PA-NJ -21,309 1,492,375 -1.4% -171,750 50 St. James New Orleans, LA -21194 0 -100% -370
13
TABLE III Biggest Population Gain Counties (2020 Forecast)
Rank County Name Metropolitan Area
Population Gain 2020-2000
Forecast: Population in 2020
Gain as Percentage of 2000 Population
Population Gain 2000-1980
1 Maricopa Phoenix-Mesa, AZ 1,547,026 4,643,369 50.0% 1,575,503 2 Los Angeles Los Angeles-Long Beach, CA 1,414,155 11,000,000 14.8% 2,038,470 3 Clark Las Vegas, NV-AZ 1,120,793 2,513,962 80.4% 923,984 4 Harris Houston, TX 958,645 4,373,626 28.1% 976,442 5 Orange Orange County, CA 853,954 3,710,400 29.9% 908,379 6 Miami-Dade Miami, FL 722,061 2,982,303 31.9% 617,110 7 Riverside Riverside-San Bernardino, CA 681,484 2,241,310 43.7% 890,353 8 Broward Fort Lauderdale, FL 677,134 2,309,574 41.5% 606,378 9 Dallas Dallas, TX 642,464 2,867,806 28.9% 659,694 10 San Diego San Diego, CA 634,780 3,459,858 22.5% 949,458 11 Queens New York, NY 610,051 2,840,947 27.3% 336,600 12 Cook Chicago, IL 604,597 5,981,749 11.2% 128,274 13 San Bernardino Riverside-San Bernardino, CA 569,074 2,288,002 33.1% 815,972 14 Santa Clara San Jose, CA 497,900 2,184,374 29.5% 384,959 15 Tarrant Fort Worth-Arlington, TX 480,496 1,934,957 33.0% 586,130 16 Palm Beach West Palm Beach-Boca Raton, FL 466,127 1,601,782 41.0% 549,913 17 Gwinnett Atlanta, GA 443,177 1,039,634 74.3% 427,113 18 Collin Dallas, TX 438,551 938,606 87.7% 353,516 19 Orange Orlando, FL 433,910 1,336,228 48.1% 427,576 20 Travis Austin-San Marcos, TX 424,739 1,244,583 51.8% 397,846 21 King Seattle-Bellevue-Everett, WA 424,664 2,163,580 24.4% 462,391 22 Kings New York, NY 413,431 2,879,690 16.8% 232,473 23 Alameda Oakland, CA 412,117 1,862,524 28.4% 340,476 24 Hidalgo McAllen-Edinburg-Mission, TX 396,458 970,381 69.1% 287,383 25 Wake Raleigh-Durham-Chapel Hill, NC 392,122 1,025,270 61.9% 329,792 26 Pima Tucson, AZ 380,615 1,229,259 44.8% 312,864 27 Bexar San Antonio, TX 374,932 1,772,749 26.8% 402,676 28 Contra Costa Oakland, CA 358,894 1,312,457 37.6% 294,780 29 Mecklenburg Charlotte-Gastonia-Rock Hill, NC-SC 349,854 1,050,071 50.0% 293,722 30 Fulton Atlanta, GA 331,074 1,148,117 40.5% 224,253 31 Montgomery Washington, DC-MD-VA-WV 326,464 1,204,245 37.2% 295,728 32 Hillsborough Tampa-St. Petersburg-Clearwater, FL 321,649 1,324,731 32.1% 351,249 33 San Francisco San Francisco, CA 315,630 1,092,232 40.6% 95,772 34 Fresno Fresno, CA 315,146 1,117,160 39.3% 284,335 35 Cobb Atlanta, GA 307,450 920,222 50.2% 312,184 36 Sacramento Sacramento, CA 302,821 1,532,860 24.6% 441,764 37 Denton Dallas, TX 301,085 739,896 68.6% 293,360 38 Kern Bakersfield, CA 297,696 961,370 44.9% 257,267 39 Bronx New York, NY 297,217 1,631,465 22.3% 165,845 40 San Mateo San Francisco, CA 292,084 1,000,422 41.2% 119,896 41 El Paso El Paso, TX 285,652 967,352 41.9% 197,989 42 Salt Lake Salt Lake City-Ogden, UT 284,412 1,185,036 31.6% 276,617 43 Fort Bend Houston, TX 283,281 642,237 78.9% 225,689 44 Will Chicago, IL 279,533 787,760 55.0% 183,253 45 Douglas Denver, CO 277,818 458,222 154.0% 154,785 46 Ventura Ventura, CA 269,157 1,025,782 35.6% 223,798 47 San Joaquin Stockton-Lodi, CA 268,931 837,094 47.3% 217,859 48 Washington Portland-Vancouver, OR-WA 266,919 715,361 59.5% 200,680 49 DeKalb Atlanta, GA 262,934 931,246 39.3% 184,219 50 Washoe Reno, NV 259,487 600,804 76.0% 145,945

14
Figure 2: Map: Expected Population Growth in Metropolitan Counties 2000-2020
Tucson, AZ
Bakersfield, CA
Las Vegas, NV-AZ
Reno, NV
Yuma, AZ
Fresno, CA
Casper, WY
Phoenix-Mesa, AZ
Yakima, WA
Greeley, CO
Bangor, ME
Duluth-Superior, MN-WI
Redding, CA
Salinas, CA
Laredo, TX
San Diego, CA
Billings, MT
Flagstaff, AZ-UT
Riverside-San Bernardino, CA
Missoula, MT
Las Cruces, NM
Rapid City, SDEugene-Springfield, OR
Pueblo, CO
Albuquerque, NM
Great Falls, MT
Cheyenne, WY
Miami, FL
Grand Junction, CO
Merced, CA
Bellingham, WA
Visalia-Tulare-Porterville, CA
Naples, FL
Ocala, FL
Spokane, WA
Wausau, WI
Ventura, CA
Tacoma, WA Bismarck, ND
Medford-Ashland, OR
Provo-Orem, UT
Los Angeles-Long Beach, CA
Yolo, CA
Modesto, CA
Enid, OK
Orlando, FL
York, PA
Mobile, AL
Madison, WI
Erie, PA
Fort Collins-Loveland, CO
Brazoria, TX
Denver, CO
Waco, TX
Santa Rosa, CA
Houma, LA
Tyler, TX
Colorado Springs, CO
Pocatello, ID
San Angelo, TX
San Jose, CA
Sacramento, CA
Lawton, OK
Flint, MI
Chico-Paradise, CA
Alexandria, LA
Dallas, TX
Boise City, ID
Tuscaloosa, AL
Utica-Rome, NY
Williamsport, PA
Syracuse, NY
Grand Forks, ND-MN
Stockton-Lodi, CA
El Paso, TX
Portland, ME
Pittsfield, MA
Lincoln, NE
Salem, OR
Johnstown, PA
Abilene, TX
Jamestown, NY
Amarillo, TX
Reading, PALancaster, PA
Victoria, TX
San Antonio, TX
San Luis Obispo-Atascadero-Paso Robles, CA
Lubbock, TX
Pensacola, FL
Lakeland-Winter Haven, FL
Jackson, MI
State College, PA
Lafayette, LA
Sharon, PA
Pine Bluff, ARMyrtle Beach, SC
Olympia, WA
Glens Falls, NY
Dover, DE
Gainesville, FL
Decatur, ALFlorence, SC
Tulsa, OK
Chicago, IL
Huntsville, AL
Oakland, CA
Joplin, MO
Lake Charles, LA
Pittsburgh, PA
Corvallis, OR
Sioux Falls, SD
Decatur, IL
West Palm Beach-Boca Raton, FL
Sumter, SC
Gary, IN
Sioux City, IA-NE
Kankakee, IL
Dubuque, IA
Fort Lauderdale, FL
Jackson, MS
Killeen-Temple, TX
Burlington, VT
Wichita Falls, TX Columbia, SC
Iowa City, IA
Bloomington-Normal, IL
Dothan, AL
Monroe, LA
Wilmington, NC
Nassau-Suffolk, NY
Eau Claire, WI
Detroit, MI
Topeka, KS Columbia, MO
Akron, OH
Rochester, MN
Fargo-Moorhead, ND-MN
Jonesboro, AR
Newark, NJ
Florence, AL
McAllen-Edinburg-Mission, TX
Fort Wayne, IN
Altoona, PA
Binghamton, NY
Oklahoma City, OK
Wichita, KS
Montgomery, AL
Rockford, IL
Richland-Kennewick-Pasco, WA
Anniston, AL
Cedar Rapids, IA
Rochester, NY
Ann Arbor, MI
Champaign-Urbana, IL
Yuba City, CA
Jacksonville, NC
Buffalo-Niagara Falls, NY
Lima, OH
Baltimore, MD
Greenville, NC
Philadelphia, PA-NJ
Sherman-Denison, TXGadsden, AL
Roanoke, VA
Dutchess County, NY
Peoria-Pekin, IL
Des Moines, IA
Fayetteville, NC
Nashville, TN
Green Bay, WI
Odessa-Midland, TX
Birmingham, AL
Muncie, IN
Orange County, CA
Knoxville, TN
Janesville-Beloit, WI
Atlanta, GA
Longview-Marshall, TX
Panama City, FLHouston, TX
Springfield, MA
Sheboygan, WI
Springfield, MO
Memphis, TN-AR-MS
Jacksonville, FL
Columbus, OH
Fort Worth-Arlington, TX
Lawrence, KS
Charleston-North Charleston, SC
Benton Harbor, MI
Beaumont-Port Arthur, TX
Newburgh, NY-PA
Corpus Christi, TX
La Crosse, WI-MN
Asheville, NC
Boulder-Longmont, CO
Lynchburg, VA
St. Cloud, MN
Hartford, CTToledo, OH
Vallejo-Fairfield-Napa, CA
Rocky Mount, NC
Tallahassee, FL
Bremerton, WA
Owensboro, KY
St. Joseph, MO
Louisville, KY-IN
Hagerstown, MD
New London-Norwich, CT
Auburn-Opelika, AL
Albany, GA
Punta Gorda, FL
Mansfield, OH
Fort Smith, AR-OK
Omaha, NE-IA
Portland-Vancouver, OR-WA
Savannah, GA
Sarasota-Bradenton, FL
Hattiesburg, MS
Fayetteville-Springdale-Rogers, AR
Salt Lake City-Ogden, UT
Bloomington, IN
Waterloo-Cedar Falls, IA
Lewiston-Auburn, ME
Columbus, GA-AL
Terre Haute, IN
Little Rock-North Little Rock, AR
Davenport-Moline-Rock Island, IA-IL
Athens, GA
Springfield, IL
St. Louis, MO-IL
Daytona Beach, FL
Clarksville-Hopkinsville, TN-KY
Jackson, TN
Melbourne-Titusville-Palm Bay, FL
Charleston, WV
Monmouth-Ocean, NJ
Parkersburg-Marietta, WV-OH
Austin-San Marcos, TX
Bryan-College Station, TX
Brownsville-Harlingen-San Benito, TX
Greenville-Spartanburg-Anderson, SC
Shreveport-Bossier City, LATexarkana, TX-Texarkana AR
Fort Pierce-Port St. Lucie, FL
Canton-Massillon, OH
Milwaukee-Waukesha, WI
Dayton-Springfield, OH
Barnstable-Yarmouth, MA
Biloxi-Gulfport-Pascagoula, MS
Saginaw-Bay City-Midland, MI
Santa Cruz-Watsonville, CA
Raleigh-Durham-Chapel Hill, NC
Albany-Schenectady-Troy, NY
Huntington-Ashland, WV-KY-OH
Minneapolis-St. Paul, MN-WI
Appleton-Oshkosh-Neenah, WI
Augusta-Aiken, GA-SC
Lexington, KYWashington, DC-MD-VA-WV
Macon, GA
New Orleans, LA
Greensboro-Winston-Salem-High Point, NC
Atlantic-Cape May, NJ
Richmond-Petersburg, VA
Charlotte-Gastonia-Rock Hill, NC-SC
Evansville-Henderson, IN-KY
Seattle-Bellevue-Everett, WA
Tampa-St. Petersburg-Clearwater, FL
Santa Fe, NM
Norfolk-Virginia Beach-Newport News, VA-NC
Panama City, FL
Melbourne-Titusville-Palm Bay, FL
Population Gain

15
The map (Figure 2) displays the expected population growth for all metropolitan counties.
Since we are measuring overall population growth numbers, rather than percentage growth, the
Northeastern metropolitan counties are shown to expect considerable growth in numbers even if
percentage growth there will be relatively slow. Otherwise, growth will be concentrated in
California, Arizona, New Mexico, Florida, the greater Seattle metropolitan area, Salt Lake City, the
Denver North-South corridor, Texas, the Atlanta-Charlotte-Raleigh corridor, and the Chicago-
Madison region.
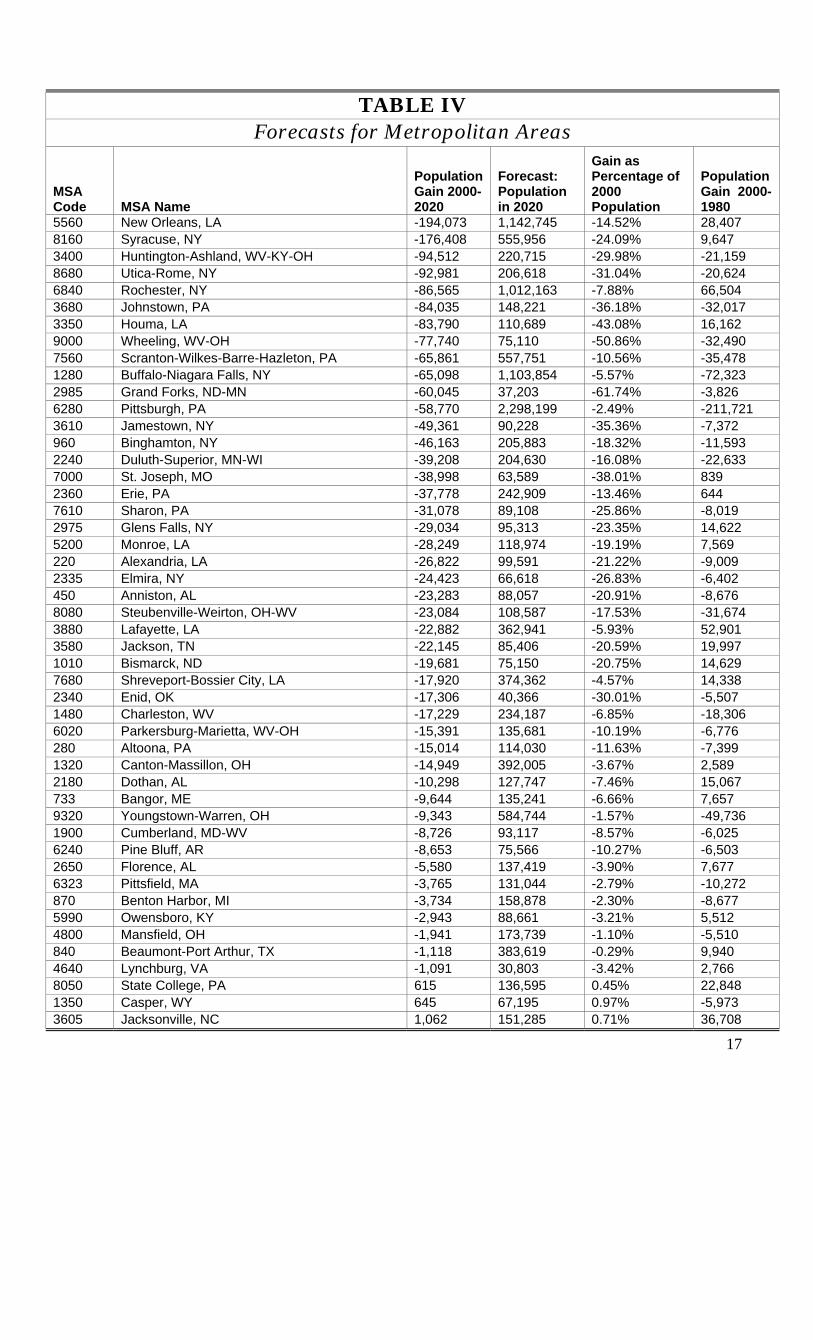
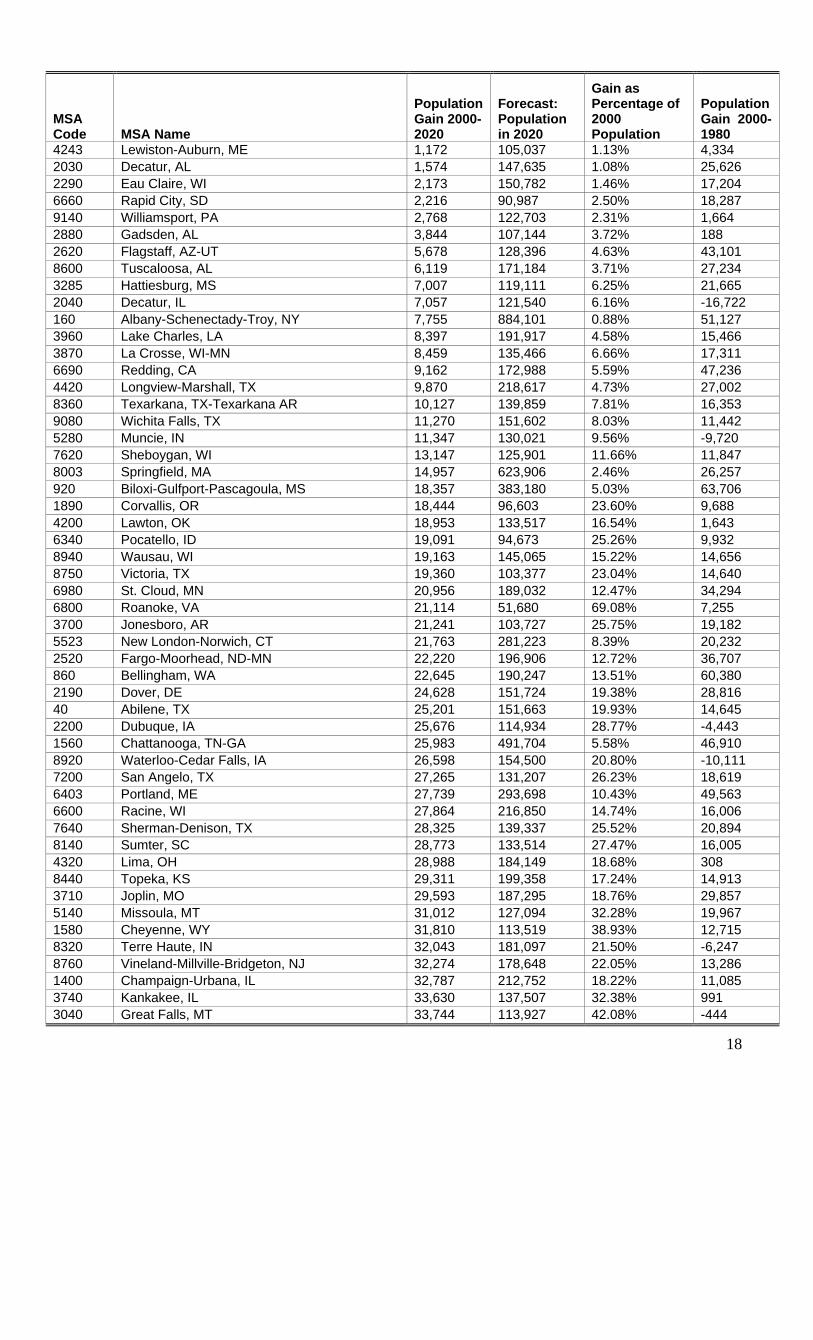
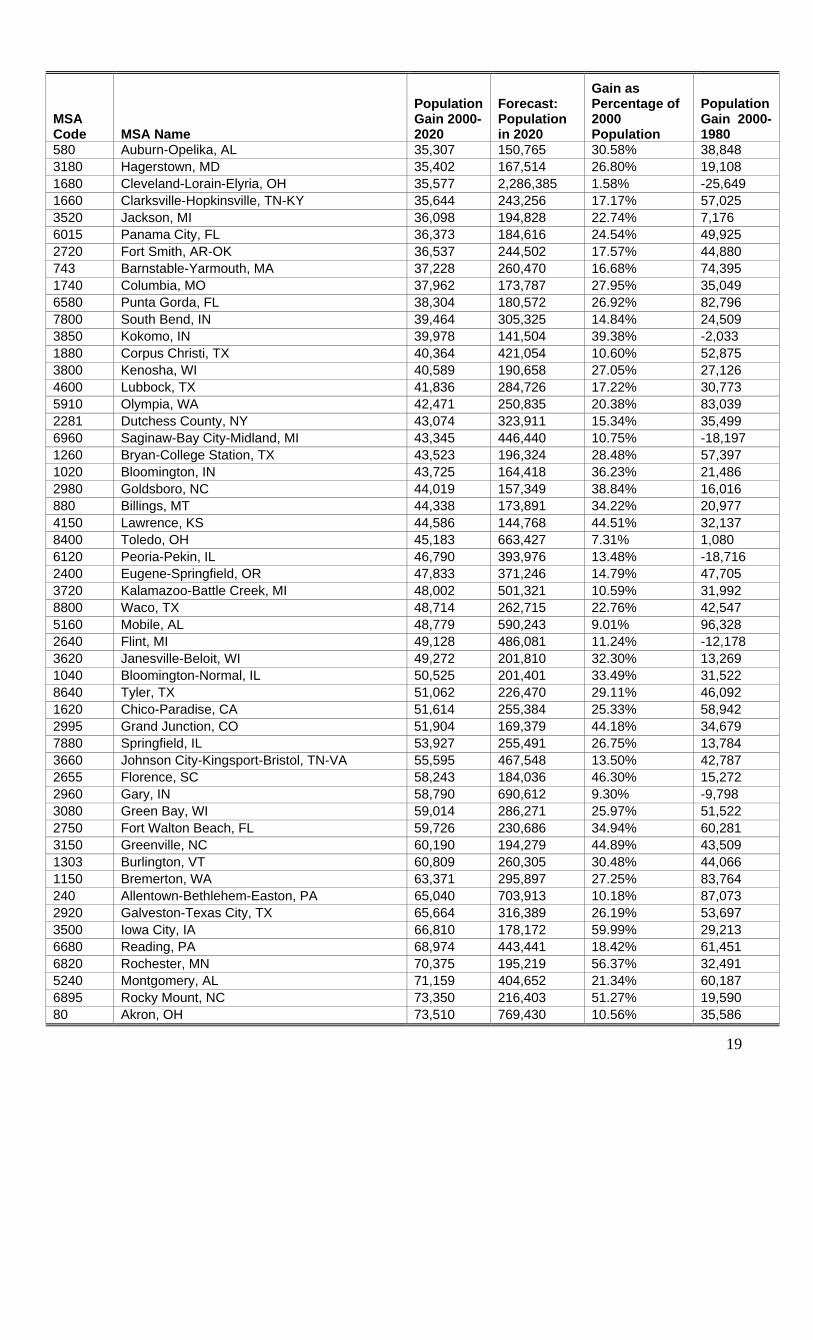
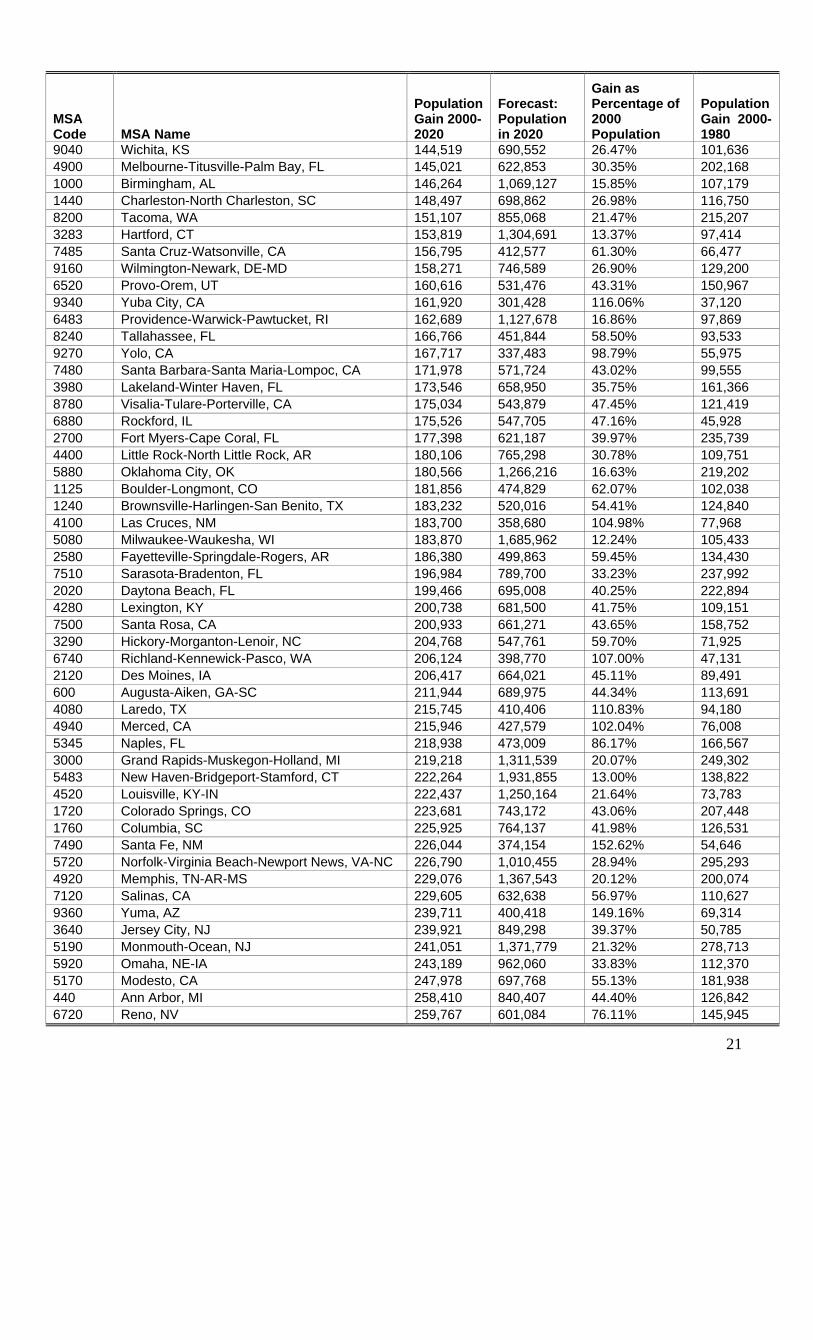
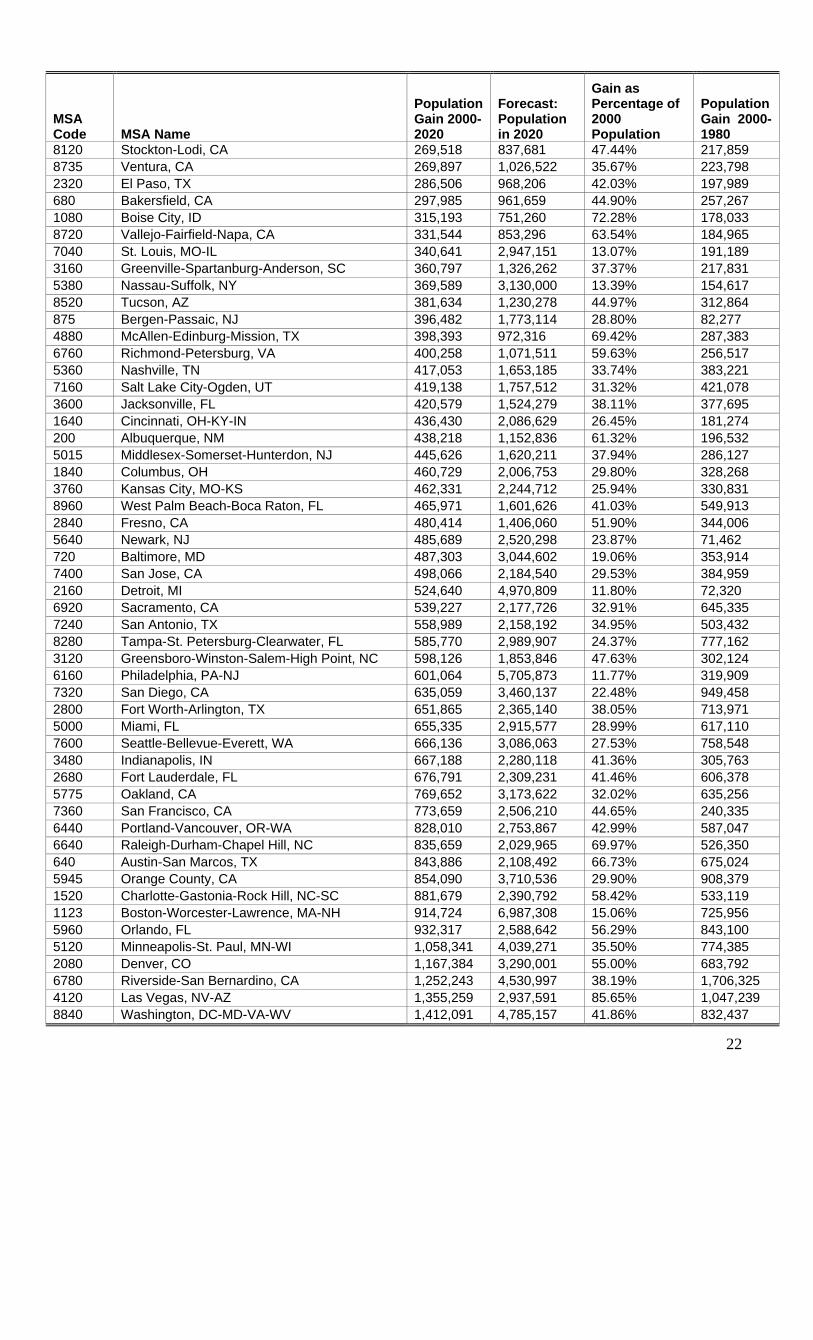
Lastly, Table IV displays our population growth forecasts for all U.S. metropolitan areas
used in our analysis, based upon our county level forecasts and year 2000 MSA definitions. In this
case, we rank metropolitan areas according to their expected population gains (or losses). A small
number of major metropolitan areas are forecasted to lose population by 2020: New Orleans,
Syracuse, Rochester, Buffalo, Pittsburgh, and Youngstoung-Warren.
The central cities of many other Rustbelt MSAs will continue to lose population. However,
modest gains in their suburbs will offset further population decline from their MSAs.
Notwithstanding mild positive metropolitan area growth, the cities of Cleveland, Philadelphia,
Detroit, Milwaukee, New Haven, and Saint Louis are all expected to lag behind general U.S.
population growth patterns through 2020.
Atlanta, Chicago, Phoenix, New York, Dallas, Houston, Los Angeles, Orlando, and Denver,
are all predicted to experience substantial population inflows. However, if we look at percentage
growth in the biggest metropolitan areas, the forecasts single out Las Vegas, driven by good weather,
gambling, tourism and an easy lifestyle. The group of major metropolitan areas with very high
expected growth rates includes Phoenix, Dallas, Houston, Denver, Orlando, Charlotte, Austin, and
Raleigh-Durham-Chapel Hill, all of them in the Sunbelt.
16
CONCLUSION
Population growth at the county level can be predicted using widely available demographic and
economic data. Past recent growth, the presence of immigrants, the fraction of population older than
25 and younger than 65, low taxes, and good weather are all positively associated with population
growth. Our forecasts reveal that most growth and real estate development will occur in the West,
Sunbelt, and along the Southern I-85 route. However, our model only accounts for 75 percent of the
variance in growth experiences between 1980 and 2000, with the other 25 percent explained by
“surprise” events. Many unexpected places will be winners or losers in the game of future local real
estate development.
[A companion spreadsheet of our population predictions at the county level (metropolitan counties) is available in the Working Paper section of the Zell-Lurie Real Estate Center Website]
17
TABLE IV
Forecasts for Metropolitan Areas
MSA Code MSA Name
Population Gain 2000-2020
Forecast: Population in 2020
Gain as Percentage of 2000 Population
Population Gain 2000-1980
5560 New Orleans, LA -194,073 1,142,745 -14.52% 28,407 8160 Syracuse, NY -176,408 555,956 -24.09% 9,647 3400 Huntington-Ashland, WV-KY-OH -94,512 220,715 -29.98% -21,159 8680 Utica-Rome, NY -92,981 206,618 -31.04% -20,624 6840 Rochester, NY -86,565 1,012,163 -7.88% 66,504 3680 Johnstown, PA -84,035 148,221 -36.18% -32,017 3350 Houma, LA -83,790 110,689 -43.08% 16,162 9000 Wheeling, WV-OH -77,740 75,110 -50.86% -32,490 7560 Scranton-Wilkes-Barre-Hazleton, PA -65,861 557,751 -10.56% -35,478 1280 Buffalo-Niagara Falls, NY -65,098 1,103,854 -5.57% -72,323 2985 Grand Forks, ND-MN -60,045 37,203 -61.74% -3,826 6280 Pittsburgh, PA -58,770 2,298,199 -2.49% -211,721 3610 Jamestown, NY -49,361 90,228 -35.36% -7,372 960 Binghamton, NY -46,163 205,883 -18.32% -11,593 2240 Duluth-Superior, MN-WI -39,208 204,630 -16.08% -22,633 7000 St. Joseph, MO -38,998 63,589 -38.01% 839 2360 Erie, PA -37,778 242,909 -13.46% 644 7610 Sharon, PA -31,078 89,108 -25.86% -8,019 2975 Glens Falls, NY -29,034 95,313 -23.35% 14,622 5200 Monroe, LA -28,249 118,974 -19.19% 7,569 220 Alexandria, LA -26,822 99,591 -21.22% -9,009 2335 Elmira, NY -24,423 66,618 -26.83% -6,402 450 Anniston, AL -23,283 88,057 -20.91% -8,676 8080 Steubenville-Weirton, OH-WV -23,084 108,587 -17.53% -31,674 3880 Lafayette, LA -22,882 362,941 -5.93% 52,901 3580 Jackson, TN -22,145 85,406 -20.59% 19,997 1010 Bismarck, ND -19,681 75,150 -20.75% 14,629 7680 Shreveport-Bossier City, LA -17,920 374,362 -4.57% 14,338 2340 Enid, OK -17,306 40,366 -30.01% -5,507 1480 Charleston, WV -17,229 234,187 -6.85% -18,306 6020 Parkersburg-Marietta, WV-OH -15,391 135,681 -10.19% -6,776 280 Altoona, PA -15,014 114,030 -11.63% -7,399 1320 Canton-Massillon, OH -14,949 392,005 -3.67% 2,589 2180 Dothan, AL -10,298 127,747 -7.46% 15,067 733 Bangor, ME -9,644 135,241 -6.66% 7,657 9320 Youngstown-Warren, OH -9,343 584,744 -1.57% -49,736 1900 Cumberland, MD-WV -8,726 93,117 -8.57% -6,025 6240 Pine Bluff, AR -8,653 75,566 -10.27% -6,503 2650 Florence, AL -5,580 137,419 -3.90% 7,677 6323 Pittsfield, MA -3,765 131,044 -2.79% -10,272 870 Benton Harbor, MI -3,734 158,878 -2.30% -8,677 5990 Owensboro, KY -2,943 88,661 -3.21% 5,512 4800 Mansfield, OH -1,941 173,739 -1.10% -5,510 840 Beaumont-Port Arthur, TX -1,118 383,619 -0.29% 9,940 4640 Lynchburg, VA -1,091 30,803 -3.42% 2,766 8050 State College, PA 615 136,595 0.45% 22,848 1350 Casper, WY 645 67,195 0.97% -5,973 3605 Jacksonville, NC 1,062 151,285 0.71% 36,708
18
MSA Code MSA Name
Population Gain 2000-2020
Forecast: Population in 2020
Gain as Percentage of 2000 Population
Population Gain 2000-1980
4243 Lewiston-Auburn, ME 1,172 105,037 1.13% 4,334 2030 Decatur, AL 1,574 147,635 1.08% 25,626 2290 Eau Claire, WI 2,173 150,782 1.46% 17,204 6660 Rapid City, SD 2,216 90,987 2.50% 18,287 9140 Williamsport, PA 2,768 122,703 2.31% 1,664 2880 Gadsden, AL 3,844 107,144 3.72% 188 2620 Flagstaff, AZ-UT 5,678 128,396 4.63% 43,101 8600 Tuscaloosa, AL 6,119 171,184 3.71% 27,234 3285 Hattiesburg, MS 7,007 119,111 6.25% 21,665 2040 Decatur, IL 7,057 121,540 6.16% -16,722 160 Albany-Schenectady-Troy, NY 7,755 884,101 0.88% 51,127 3960 Lake Charles, LA 8,397 191,917 4.58% 15,466 3870 La Crosse, WI-MN 8,459 135,466 6.66% 17,311 6690 Redding, CA 9,162 172,988 5.59% 47,236 4420 Longview-Marshall, TX 9,870 218,617 4.73% 27,002 8360 Texarkana, TX-Texarkana AR 10,127 139,859 7.81% 16,353 9080 Wichita Falls, TX 11,270 151,602 8.03% 11,442 5280 Muncie, IN 11,347 130,021 9.56% -9,720 7620 Sheboygan, WI 13,147 125,901 11.66% 11,847 8003 Springfield, MA 14,957 623,906 2.46% 26,257 920 Biloxi-Gulfport-Pascagoula, MS 18,357 383,180 5.03% 63,706 1890 Corvallis, OR 18,444 96,603 23.60% 9,688 4200 Lawton, OK 18,953 133,517 16.54% 1,643 6340 Pocatello, ID 19,091 94,673 25.26% 9,932 8940 Wausau, WI 19,163 145,065 15.22% 14,656 8750 Victoria, TX 19,360 103,377 23.04% 14,640 6980 St. Cloud, MN 20,956 189,032 12.47% 34,294 6800 Roanoke, VA 21,114 51,680 69.08% 7,255 3700 Jonesboro, AR 21,241 103,727 25.75% 19,182 5523 New London-Norwich, CT 21,763 281,223 8.39% 20,232 2520 Fargo-Moorhead, ND-MN 22,220 196,906 12.72% 36,707 860 Bellingham, WA 22,645 190,247 13.51% 60,380 2190 Dover, DE 24,628 151,724 19.38% 28,816 40 Abilene, TX 25,201 151,663 19.93% 14,645 2200 Dubuque, IA 25,676 114,934 28.77% -4,443 1560 Chattanooga, TN-GA 25,983 491,704 5.58% 46,910 8920 Waterloo-Cedar Falls, IA 26,598 154,500 20.80% -10,111 7200 San Angelo, TX 27,265 131,207 26.23% 18,619 6403 Portland, ME 27,739 293,698 10.43% 49,563 6600 Racine, WI 27,864 216,850 14.74% 16,006 7640 Sherman-Denison, TX 28,325 139,337 25.52% 20,894 8140 Sumter, SC 28,773 133,514 27.47% 16,005 4320 Lima, OH 28,988 184,149 18.68% 308 8440 Topeka, KS 29,311 199,358 17.24% 14,913 3710 Joplin, MO 29,593 187,295 18.76% 29,857 5140 Missoula, MT 31,012 127,094 32.28% 19,967 1580 Cheyenne, WY 31,810 113,519 38.93% 12,715 8320 Terre Haute, IN 32,043 181,097 21.50% -6,247 8760 Vineland-Millville-Bridgeton, NJ 32,274 178,648 22.05% 13,286 1400 Champaign-Urbana, IL 32,787 212,752 18.22% 11,085 3740 Kankakee, IL 33,630 137,507 32.38% 991 3040 Great Falls, MT 33,744 113,927 42.08% -444
19
MSA Code MSA Name
Population Gain 2000-2020
Forecast: Population in 2020
Gain as Percentage of 2000 Population
Population Gain 2000-1980
580 Auburn-Opelika, AL 35,307 150,765 30.58% 38,848 3180 Hagerstown, MD 35,402 167,514 26.80% 19,108 1680 Cleveland-Lorain-Elyria, OH 35,577 2,286,385 1.58% -25,649 1660 Clarksville-Hopkinsville, TN-KY 35,644 243,256 17.17% 57,025 3520 Jackson, MI 36,098 194,828 22.74% 7,176 6015 Panama City, FL 36,373 184,616 24.54% 49,925 2720 Fort Smith, AR-OK 36,537 244,502 17.57% 44,880 743 Barnstable-Yarmouth, MA 37,228 260,470 16.68% 74,395 1740 Columbia, MO 37,962 173,787 27.95% 35,049 6580 Punta Gorda, FL 38,304 180,572 26.92% 82,796 7800 South Bend, IN 39,464 305,325 14.84% 24,509 3850 Kokomo, IN 39,978 141,504 39.38% -2,033 1880 Corpus Christi, TX 40,364 421,054 10.60% 52,875 3800 Kenosha, WI 40,589 190,658 27.05% 27,126 4600 Lubbock, TX 41,836 284,726 17.22% 30,773 5910 Olympia, WA 42,471 250,835 20.38% 83,039 2281 Dutchess County, NY 43,074 323,911 15.34% 35,499 6960 Saginaw-Bay City-Midland, MI 43,345 446,440 10.75% -18,197 1260 Bryan-College Station, TX 43,523 196,324 28.48% 57,397 1020 Bloomington, IN 43,725 164,418 36.23% 21,486 2980 Goldsboro, NC 44,019 157,349 38.84% 16,016 880 Billings, MT 44,338 173,891 34.22% 20,977 4150 Lawrence, KS 44,586 144,768 44.51% 32,137 8400 Toledo, OH 45,183 663,427 7.31% 1,080 6120 Peoria-Pekin, IL 46,790 393,976 13.48% -18,716 2400 Eugene-Springfield, OR 47,833 371,246 14.79% 47,705 3720 Kalamazoo-Battle Creek, MI 48,002 501,321 10.59% 31,992 8800 Waco, TX 48,714 262,715 22.76% 42,547 5160 Mobile, AL 48,779 590,243 9.01% 96,328 2640 Flint, MI 49,128 486,081 11.24% -12,178 3620 Janesville-Beloit, WI 49,272 201,810 32.30% 13,269 1040 Bloomington-Normal, IL 50,525 201,401 33.49% 31,522 8640 Tyler, TX 51,062 226,470 29.11% 46,092 1620 Chico-Paradise, CA 51,614 255,384 25.33% 58,942 2995 Grand Junction, CO 51,904 169,379 44.18% 34,679 7880 Springfield, IL 53,927 255,491 26.75% 13,784 3660 Johnson City-Kingsport-Bristol, TN-VA 55,595 467,548 13.50% 42,787 2655 Florence, SC 58,243 184,036 46.30% 15,272 2960 Gary, IN 58,790 690,612 9.30% -9,798 3080 Green Bay, WI 59,014 286,271 25.97% 51,522 2750 Fort Walton Beach, FL 59,726 230,686 34.94% 60,281 3150 Greenville, NC 60,190 194,279 44.89% 43,509 1303 Burlington, VT 60,809 260,305 30.48% 44,066 1150 Bremerton, WA 63,371 295,897 27.25% 83,764 240 Allentown-Bethlehem-Easton, PA 65,040 703,913 10.18% 87,073 2920 Galveston-Texas City, TX 65,664 316,389 26.19% 53,697 3500 Iowa City, IA 66,810 178,172 59.99% 29,213 6680 Reading, PA 68,974 443,441 18.42% 61,451 6820 Rochester, MN 70,375 195,219 56.37% 32,491 5240 Montgomery, AL 71,159 404,652 21.34% 60,187 6895 Rocky Mount, NC 73,350 216,403 51.27% 19,590 80 Akron, OH 73,510 769,430 10.56% 35,586

20
MSA Code MSA Name
Population Gain 2000-2020
Forecast: Population in 2020
Gain as Percentage of 2000 Population
Population Gain 2000-1980
560 Atlantic-Cape May, NJ 73,862 429,212 20.79% 78,030 1540 Charlottesville, VA 74,431 110,026 209.10% 17,614 2440 Evansville-Henderson, IN-KY 74,736 371,034 25.22% 19,832 760 Baton Rouge, LA 75,553 679,812 12.50% 107,056 120 Albany, GA 77,362 198,150 64.05% 7,942 4040 Lansing-East Lansing, MI 77,628 526,052 17.31% 28,315 9280 York, PA 77,939 460,659 20.36% 69,121 3440 Huntsville, AL 78,577 422,072 22.88% 99,875 2560 Fayetteville, NC 78,808 381,647 26.02% 54,942 1360 Cedar Rapids, IA 79,189 271,411 41.20% 22,572 2330 Elkhart-Goshen, IN 79,678 263,185 43.42% 46,215 3240 Harrisburg-Lebanon-Carlisle, PA 80,026 709,815 12.71% 72,233 2000 Dayton-Springfield, OH 81,640 1,031,927 8.59% 8,136 3200 Hamilton-Middletown, OH 81,857 415,542 24.53% 74,153 6560 Pueblo, CO 82,872 224,710 58.43% 15,826 5660 Newburgh, NY-PA 84,235 473,912 21.62% 110,789 480 Asheville, NC 84,289 310,959 37.19% 48,544 7920 Springfield, MO 87,645 414,470 26.82% 98,242 1145 Brazoria, TX 89,766 332,986 36.91% 72,371 8560 Tulsa, OK 90,525 895,461 11.25% 143,935 320 Amarillo, TX 90,848 309,233 41.60% 43,855 7760 Sioux Falls, SD 92,008 265,546 53.02% 49,967 3920 Lafayette, IN 93,301 276,612 50.90% 29,799 1960 Davenport-Moline-Rock Island, IA-IL 93,670 452,565 26.10% -26,173 3840 Knoxville, TN 95,254 784,388 13.82% 140,732 7460 San Luis Obispo-Atascadero-Paso Robles, CA 97,019 344,697 39.17% 90,892 4360 Lincoln, NE 97,584 348,774 38.85% 57,591 4000 Lancaster, PA 97,586 569,240 20.69% 108,234 4890 Medford-Ashland, OR 102,014 283,854 56.10% 48,911 1800 Columbus, GA-AL 106,463 381,438 38.72% 20,348 2900 Gainesville, FL 106,551 324,846 48.81% 66,072 3560 Jackson, MS 110,230 552,061 24.95% 78,649 8480 Trenton, NJ 111,669 463,249 31.76% 43,784 5800 Odessa-Midland, TX 113,750 349,982 48.15% 35,223 5330 Myrtle Beach, SC 114,725 312,752 57.93% 95,558 7840 Spokane, WA 116,984 535,657 27.94% 75,734 9200 Wilmington, NC 117,653 352,066 50.19% 94,427 7520 Savannah, GA 121,581 414,895 41.45% 61,623 9260 Yakima, WA 122,744 345,453 55.11% 49,591 6080 Pensacola, FL 124,163 536,914 30.08% 120,921 5790 Ocala, FL 126,132 386,422 48.46% 136,072 460 Appleton-Oshkosh-Neenah, WI 126,594 486,140 35.21% 67,908 7720 Sioux City, IA-NE 129,196 253,323 104.08% 6,502 500 Athens, GA 132,876 286,920 86.26% 48,677 3060 Greeley, CO 135,094 318,258 73.76% 59,397 2710 Fort Pierce-Port St. Lucie, FL 135,410 455,970 42.24% 166,790 7080 Salem, OR 136,553 484,783 39.21% 97,381 2670 Fort Collins-Loveland, CO 136,918 389,856 54.13% 102,847 4680 Macon, GA 136,962 460,173 42.38% 49,550 2760 Fort Wayne, IN 138,998 642,146 27.63% 58,955 4720 Madison, WI 139,879 568,278 32.65% 104,045 3810 Killeen-Temple, TX 143,104 457,306 45.55% 98,244
21
MSA Code MSA Name
Population Gain 2000-2020
Forecast: Population in 2020
Gain as Percentage of 2000 Population
Population Gain 2000-1980
9040 Wichita, KS 144,519 690,552 26.47% 101,636 4900 Melbourne-Titusville-Palm Bay, FL 145,021 622,853 30.35% 202,168 1000 Birmingham, AL 146,264 1,069,127 15.85% 107,179 1440 Charleston-North Charleston, SC 148,497 698,862 26.98% 116,750 8200 Tacoma, WA 151,107 855,068 21.47% 215,207 3283 Hartford, CT 153,819 1,304,691 13.37% 97,414 7485 Santa Cruz-Watsonville, CA 156,795 412,577 61.30% 66,477 9160 Wilmington-Newark, DE-MD 158,271 746,589 26.90% 129,200 6520 Provo-Orem, UT 160,616 531,476 43.31% 150,967 9340 Yuba City, CA 161,920 301,428 116.06% 37,120 6483 Providence-Warwick-Pawtucket, RI 162,689 1,127,678 16.86% 97,869 8240 Tallahassee, FL 166,766 451,844 58.50% 93,533 9270 Yolo, CA 167,717 337,483 98.79% 55,975 7480 Santa Barbara-Santa Maria-Lompoc, CA 171,978 571,724 43.02% 99,555 3980 Lakeland-Winter Haven, FL 173,546 658,950 35.75% 161,366 8780 Visalia-Tulare-Porterville, CA 175,034 543,879 47.45% 121,419 6880 Rockford, IL 175,526 547,705 47.16% 45,928 2700 Fort Myers-Cape Coral, FL 177,398 621,187 39.97% 235,739 4400 Little Rock-North Little Rock, AR 180,106 765,298 30.78% 109,751 5880 Oklahoma City, OK 180,566 1,266,216 16.63% 219,202 1125 Boulder-Longmont, CO 181,856 474,829 62.07% 102,038 1240 Brownsville-Harlingen-San Benito, TX 183,232 520,016 54.41% 124,840 4100 Las Cruces, NM 183,700 358,680 104.98% 77,968 5080 Milwaukee-Waukesha, WI 183,870 1,685,962 12.24% 105,433 2580 Fayetteville-Springdale-Rogers, AR 186,380 499,863 59.45% 134,430 7510 Sarasota-Bradenton, FL 196,984 789,700 33.23% 237,992 2020 Daytona Beach, FL 199,466 695,008 40.25% 222,894 4280 Lexington, KY 200,738 681,500 41.75% 109,151 7500 Santa Rosa, CA 200,933 661,271 43.65% 158,752 3290 Hickory-Morganton-Lenoir, NC 204,768 547,761 59.70% 71,925 6740 Richland-Kennewick-Pasco, WA 206,124 398,770 107.00% 47,131 2120 Des Moines, IA 206,417 664,021 45.11% 89,491 600 Augusta-Aiken, GA-SC 211,944 689,975 44.34% 113,691 4080 Laredo, TX 215,745 410,406 110.83% 94,180 4940 Merced, CA 215,946 427,579 102.04% 76,008 5345 Naples, FL 218,938 473,009 86.17% 166,567 3000 Grand Rapids-Muskegon-Holland, MI 219,218 1,311,539 20.07% 249,302 5483 New Haven-Bridgeport-Stamford, CT 222,264 1,931,855 13.00% 138,822 4520 Louisville, KY-IN 222,437 1,250,164 21.64% 73,783 1720 Colorado Springs, CO 223,681 743,172 43.06% 207,448 1760 Columbia, SC 225,925 764,137 41.98% 126,531 7490 Santa Fe, NM 226,044 374,154 152.62% 54,646 5720 Norfolk-Virginia Beach-Newport News, VA-NC 226,790 1,010,455 28.94% 295,293 4920 Memphis, TN-AR-MS 229,076 1,367,543 20.12% 200,074 7120 Salinas, CA 229,605 632,638 56.97% 110,627 9360 Yuma, AZ 239,711 400,418 149.16% 69,314 3640 Jersey City, NJ 239,921 849,298 39.37% 50,785 5190 Monmouth-Ocean, NJ 241,051 1,371,779 21.32% 278,713 5920 Omaha, NE-IA 243,189 962,060 33.83% 112,370 5170 Modesto, CA 247,978 697,768 55.13% 181,938 440 Ann Arbor, MI 258,410 840,407 44.40% 126,842 6720 Reno, NV 259,767 601,084 76.11% 145,945
22
MSA Code MSA Name
Population Gain 2000-2020
Forecast: Population in 2020
Gain as Percentage of 2000 Population
Population Gain 2000-1980
8120 Stockton-Lodi, CA 269,518 837,681 47.44% 217,859 8735 Ventura, CA 269,897 1,026,522 35.67% 223,798 2320 El Paso, TX 286,506 968,206 42.03% 197,989 680 Bakersfield, CA 297,985 961,659 44.90% 257,267 1080 Boise City, ID 315,193 751,260 72.28% 178,033 8720 Vallejo-Fairfield-Napa, CA 331,544 853,296 63.54% 184,965 7040 St. Louis, MO-IL 340,641 2,947,151 13.07% 191,189 3160 Greenville-Spartanburg-Anderson, SC 360,797 1,326,262 37.37% 217,831 5380 Nassau-Suffolk, NY 369,589 3,130,000 13.39% 154,617 8520 Tucson, AZ 381,634 1,230,278 44.97% 312,864 875 Bergen-Passaic, NJ 396,482 1,773,114 28.80% 82,277 4880 McAllen-Edinburg-Mission, TX 398,393 972,316 69.42% 287,383 6760 Richmond-Petersburg, VA 400,258 1,071,511 59.63% 256,517 5360 Nashville, TN 417,053 1,653,185 33.74% 383,221 7160 Salt Lake City-Ogden, UT 419,138 1,757,512 31.32% 421,078 3600 Jacksonville, FL 420,579 1,524,279 38.11% 377,695 1640 Cincinnati, OH-KY-IN 436,430 2,086,629 26.45% 181,274 200 Albuquerque, NM 438,218 1,152,836 61.32% 196,532 5015 Middlesex-Somerset-Hunterdon, NJ 445,626 1,620,211 37.94% 286,127 1840 Columbus, OH 460,729 2,006,753 29.80% 328,268 3760 Kansas City, MO-KS 462,331 2,244,712 25.94% 330,831 8960 West Palm Beach-Boca Raton, FL 465,971 1,601,626 41.03% 549,913 2840 Fresno, CA 480,414 1,406,060 51.90% 344,006 5640 Newark, NJ 485,689 2,520,298 23.87% 71,462 720 Baltimore, MD 487,303 3,044,602 19.06% 353,914 7400 San Jose, CA 498,066 2,184,540 29.53% 384,959 2160 Detroit, MI 524,640 4,970,809 11.80% 72,320 6920 Sacramento, CA 539,227 2,177,726 32.91% 645,335 7240 San Antonio, TX 558,989 2,158,192 34.95% 503,432 8280 Tampa-St. Petersburg-Clearwater, FL 585,770 2,989,907 24.37% 777,162 3120 Greensboro-Winston-Salem-High Point, NC 598,126 1,853,846 47.63% 302,124 6160 Philadelphia, PA-NJ 601,064 5,705,873 11.77% 319,909 7320 San Diego, CA 635,059 3,460,137 22.48% 949,458 2800 Fort Worth-Arlington, TX 651,865 2,365,140 38.05% 713,971 5000 Miami, FL 655,335 2,915,577 28.99% 617,110 7600 Seattle-Bellevue-Everett, WA 666,136 3,086,063 27.53% 758,548 3480 Indianapolis, IN 667,188 2,280,118 41.36% 305,763 2680 Fort Lauderdale, FL 676,791 2,309,231 41.46% 606,378 5775 Oakland, CA 769,652 3,173,622 32.02% 635,256 7360 San Francisco, CA 773,659 2,506,210 44.65% 240,335 6440 Portland-Vancouver, OR-WA 828,010 2,753,867 42.99% 587,047 6640 Raleigh-Durham-Chapel Hill, NC 835,659 2,029,965 69.97% 526,350 640 Austin-San Marcos, TX 843,886 2,108,492 66.73% 675,024 5945 Orange County, CA 854,090 3,710,536 29.90% 908,379 1520 Charlotte-Gastonia-Rock Hill, NC-SC 881,679 2,390,792 58.42% 533,119 1123 Boston-Worcester-Lawrence, MA-NH 914,724 6,987,308 15.06% 725,956 5960 Orlando, FL 932,317 2,588,642 56.29% 843,100 5120 Minneapolis-St. Paul, MN-WI 1,058,341 4,039,271 35.50% 774,385 2080 Denver, CO 1,167,384 3,290,001 55.00% 683,792 6780 Riverside-San Bernardino, CA 1,252,243 4,530,997 38.19% 1,706,325 4120 Las Vegas, NV-AZ 1,355,259 2,937,591 85.65% 1,047,239 8840 Washington, DC-MD-VA-WV 1,412,091 4,785,157 41.86% 832,437

23
MSA Code MSA Name
Population Gain 2000-2020
Forecast: Population in 2020
Gain as Percentage of 2000 Population
Population Gain 2000-1980
4480 Los Angeles-Long Beach, CA 1,413,782 11,000,000 15.24% 2,038,470 3360 Houston, TX 1,552,646 5,753,782 36.96% 1,414,017 1920 Dallas, TX 1,626,358 5,169,599 45.90% 1,472,984 5600 New York, NY 1,682,468 9,699,546 20.99% 939,201 6200 Phoenix-Mesa, AZ 1,743,442 5,021,217 53.19% 1,665,593 1600 Chicago, IL 1,904,990 10,200,000 23.01% 1,044,858 520 Atlanta, GA 2,671,813 6,817,025 64.46% 1,898,202
REFERENCES
Davis, Donald R., and David E. Weinstein (2002). “Bones, Bombs, and Break Points: The
Geography of Economic Activity,” American Economic Review 92(5): 1269–1289.
Glaeser, Edward L., and Joseph Gyourko (2005). “Urban Decline and Durable Housing,” Journal of
Political Economy 113: 345-375.
Glaeser, Edward L., Jed Kolko, and Albert Saiz (2001). “Consumer City,” Journal of Economic
Geography 1: 27-50.
Glaeser, Edward L., and Albert Saiz (2003). “The Rise of the Skilled City,” Discussion Paper #2050,
Harvard Institute of Economic Research, Harvard University.

County FIPS County Name Metropolitan Area
Population Gain 2020-
2000Population
in 2020% Growth 2020-2000
Population Gain 2000-
1980Population
in 200048441 Taylor Abilene, TX 25,700 152,162 20.3% 14,645 126,46239153 Summit Akron, OH 62,624 606,176 11.5% 19,457 543,55239133 Portage Akron, OH 6,882 159,250 4.5% 16,129 152,36813177 Lee Albany, GA 61,622 86,511 247.6% 13,046 24,88913095 Dougherty Albany, GA 13,635 109,534 14.2% -5,104 95,89936091 Saratoga Albany-Schenectady-Troy, NY 34,999 236,450 17.4% 47,413 201,45136001 Albany Albany-Schenectady-Troy, NY 13,482 308,059 4.6% 8,404 294,57736083 Rensselaer Albany-Schenectady-Troy, NY 4,866 157,473 3.2% 610 152,60736093 Schenectady Albany-Schenectady-Troy, NY 246 146,687 0.2% -3,467 146,44136057 Montgomery Albany-Schenectady-Troy, NY -21,073 28,604 -42.4% -3,719 49,67736095 Schoharie Albany-Schenectady-Troy, NY -30,077 1,516 -95.2% 1,886 31,59335001 Bernalillo Albuquerque, NM 213,425 770,970 38.3% 135,250 557,54535061 Valencia Albuquerque, NM 112,412 178,867 169.2% 5,327 66,45535043 Sandoval Albuquerque, NM 111,486 202,104 123.0% 55,955 90,61822079 Rapides Alexandria, LA -28,461 97,952 -22.5% -9,009 126,41342077 Lehigh Allentown-Bethlehem-Easton, PA 41,801 354,376 13.4% 39,797 312,57542095 Northampton Allentown-Bethlehem-Easton, PA 36,432 303,900 13.6% 41,814 267,46842025 Carbon Allentown-Bethlehem-Easton, PA -16,356 42,474 -27.8% 5,462 58,83042013 Blair Altoona, PA -15,994 113,050 -12.4% -7,399 129,04448375 Potter Amarillo, TX 57,655 171,371 50.7% 14,636 113,71648381 Randall Amarillo, TX 33,146 137,815 31.7% 29,219 104,66926161 Washtenaw Ann Arbor, MI 131,777 456,195 40.6% 60,018 324,41826093 Livingston Ann Arbor, MI 95,069 253,539 60.0% 57,809 158,47026091 Lenawee Ann Arbor, MI 34,858 133,967 35.2% 9,015 99,1091015 Calhoun Anniston, AL -24,576 86,764 -22.1% -8,676 111,340
55087 Outagamie Appleton-Oshkosh-Neenah, WI 54,423 216,214 33.6% 32,858 161,79155139 Winnebago Appleton-Oshkosh-Neenah, WI 44,912 201,940 28.6% 25,282 157,02855015 Calumet Appleton-Oshkosh-Neenah, WI 28,842 69,569 70.8% 9,768 40,72737021 Buncombe Asheville, NC 80,248 287,217 38.8% 45,737 206,96937115 Madison Asheville, NC 3,932 23,633 20.0% 2,807 19,70113059 Clarke Athens, GA 53,135 154,915 52.2% 26,747 101,78013219 Oconee Athens, GA 47,667 74,073 180.5% 13,881 26,40613195 Madison Athens, GA 31,341 57,199 121.2% 8,049 25,85813135 Gwinnett Atlanta, GA 443,177 1,039,634 74.3% 427,113 596,457

13121 Fulton Atlanta, GA 331,074 1,148,117 40.5% 224,253 817,04313067 Cobb Atlanta, GA 307,450 920,222 50.2% 312,184 612,77213089 DeKalb Atlanta, GA 262,934 931,246 39.3% 184,219 668,31213117 Forsyth Atlanta, GA 165,304 265,820 164.5% 72,382 100,51613151 Henry Atlanta, GA 152,220 273,848 125.2% 85,140 121,62813063 Clayton Atlanta, GA 137,344 375,844 57.6% 87,252 238,50013057 Cherokee Atlanta, GA 133,534 277,317 92.9% 91,538 143,78313223 Paulding Atlanta, GA 111,802 194,837 134.6% 56,736 83,03513077 Coweta Atlanta, GA 101,088 191,230 112.1% 50,656 90,14213113 Fayette Atlanta, GA 84,901 177,014 92.2% 62,575 92,11313013 Barrow Atlanta, GA 60,800 107,354 130.6% 25,072 46,55413297 Walton Atlanta, GA 59,097 120,720 95.9% 30,420 61,62313097 Douglas Atlanta, GA 58,985 151,693 63.6% 37,845 92,70813217 Newton Atlanta, GA 58,668 121,579 93.3% 27,937 62,91113247 Rockdale Atlanta, GA 51,826 122,369 73.5% 33,698 70,54313015 Bartow Atlanta, GA 50,389 127,092 65.7% 35,802 76,70313227 Pickens Atlanta, GA 45,633 69,000 195.3% 11,666 23,36713045 Carroll Atlanta, GA 29,265 117,292 33.2% 31,366 88,02713255 Spalding Atlanta, GA 8,225 66,700 14.1% 10,348 58,47534001 Atlantic Atlantic-Cape May, NJ 82,198 335,247 32.5% 58,483 253,04934009 Cape May Atlantic-Cape May, NJ -6,977 95,324 -6.8% 19,547 102,3011081 Lee Auburn-Opelika, AL 33,587 149,045 29.1% 38,848 115,458
13073 Columbia Augusta-Aiken, GA-SC 76,074 165,904 84.7% 49,361 89,83045003 Aiken Augusta-Aiken, GA-SC 67,878 210,658 47.5% 36,823 142,78045037 Edgefield Augusta-Aiken, GA-SC 37,350 61,949 151.8% 7,042 24,59913245 Richmond Augusta-Aiken, GA-SC 34,780 234,325 17.4% 17,777 199,54513189 McDuffie Augusta-Aiken, GA-SC -3,045 18,232 -14.3% 2,688 21,27748453 Travis Austin-San Marcos, TX 424,739 1,244,583 51.8% 397,846 819,84448491 Williamson Austin-San Marcos, TX 243,679 498,647 95.6% 177,338 254,96848021 Bastrop Austin-San Marcos, TX 81,805 140,116 140.3% 33,229 58,31148209 Hays Austin-San Marcos, TX 62,752 161,754 63.4% 57,908 99,00148055 Caldwell Austin-San Marcos, TX 30,194 62,676 93.0% 8,703 32,4826029 Kern Bakersfield, CA 297,696 961,370 44.9% 257,267 663,674
24027 Howard Baltimore, MD 168,351 417,918 67.5% 129,712 249,56724005 Baltimore Baltimore, MD 138,606 894,523 18.3% 100,039 755,91724003 Anne Arundel Baltimore, MD 120,320 611,703 24.5% 118,968 491,38324025 Harford Baltimore, MD 64,402 283,893 29.3% 73,097 219,491

24013 Carroll Baltimore, MD 58,544 210,156 38.6% 54,759 151,61224035 Queen Anne's Baltimore, MD 8,511 49,283 20.9% 15,090 40,77224510 Baltimore (Independent City) Baltimore, MD -91,607 556,950 -14.1% -137,751 648,55723019 Penobscot Bangor, ME -9,402 135,483 -6.5% 7,657 144,88525001 Barnstable Barnstable-Yarmouth, MA 38,089 261,331 17.1% 74,395 223,24222033 East Baton Rouge Baton Rouge, LA 31,719 444,485 7.7% 44,483 412,76622063 Livingston Baton Rouge, LA 24,578 117,149 26.6% 33,215 92,57122005 Ascension Baton Rouge, LA 18,391 95,748 23.8% 26,933 77,35722121 West Baton Rouge Baton Rouge, LA -10,469 11,096 -48.5% 2,425 21,56548245 Jefferson Beaumont-Port Arthur, TX 10,356 261,996 4.1% 2,121 251,63948199 Hardin Beaumont-Port Arthur, TX 5,787 53,923 12.0% 7,245 48,13648361 Orange Beaumont-Port Arthur, TX -16,536 68,426 -19.5% 574 84,96253073 Whatcom Bellingham, WA 22,245 189,847 13.3% 60,380 167,60226021 Berrien Benton Harbor, MI -2,459 160,152 -1.5% -8,677 162,61134003 Bergen Bergen-Passaic, NJ 231,466 1,117,196 26.1% 39,826 885,73034031 Passaic Bergen-Passaic, NJ 168,252 659,154 34.3% 42,451 490,90230111 Yellowstone Billings, MT 45,375 174,928 35.0% 20,977 129,55328047 Harrison Biloxi-Gulfport-Pascagoula, MS 25,789 215,452 13.6% 31,401 189,66328059 Jackson Biloxi-Gulfport-Pascagoula, MS 5,059 136,939 3.8% 13,733 131,88028045 Hancock Biloxi-Gulfport-Pascagoula, MS -9,791 33,489 -22.6% 18,572 43,28036007 Broome Binghamton, NY -21,465 178,829 -10.7% -13,414 200,29436107 Tioga Binghamton, NY -26,731 25,021 -51.7% 1,821 51,7521117 Shelby Birmingham, AL 83,802 228,326 58.0% 77,607 144,5241073 Jefferson Birmingham, AL 23,234 685,253 3.5% -8,915 662,0191115 St. Clair Birmingham, AL 18,539 83,650 28.5% 23,786 65,1111009 Blount Birmingham, AL 18,081 69,290 35.3% 14,701 51,209
38015 Burleigh Bismarck, ND 3,363 72,869 4.8% 14,530 69,50638059 Morton Bismarck, ND -24,052 1,273 -95.0% 99 25,32518105 Monroe Bloomington, IN 42,526 163,219 35.2% 21,486 120,69317113 McLean Bloomington-Normal, IL 50,680 201,556 33.6% 31,522 150,87616001 Ada Boise City, ID 194,897 497,889 64.3% 128,902 302,99216027 Canyon Boise City, ID 122,341 255,416 91.9% 49,131 133,07525017 Middlesex Boston-Worcester-Lawrence-Lowell-Brocktn, MA-NH 211,526 1,680,561 14.4% 100,238 1,469,03525025 Suffolk Boston-Worcester-Lawrence-Lowell-Brocktn, MA-NH 139,034 829,081 20.1% 38,372 690,04725009 Essex Boston-Worcester-Lawrence-Lowell-Brocktn, MA-NH 127,492 852,925 17.6% 90,192 725,43325027 Worcester Boston-Worcester-Lawrence-Lowell-Brocktn, MA-NH 109,305 861,947 14.5% 105,636 752,64225021 Norfolk Boston-Worcester-Lawrence-Lowell-Brocktn, MA-NH 96,337 747,585 14.8% 44,277 651,248

25005 Bristol Boston-Worcester-Lawrence-Lowell-Brocktn, MA-NH 86,318 622,337 16.1% 60,700 536,01933011 Hillsborough Boston-Worcester-Lawrence-Lowell-Brocktn, MA-NH 78,617 460,945 20.6% 104,139 382,32825023 Plymouth Boston-Worcester-Lawrence-Lowell-Brocktn, MA-NH 77,509 551,951 16.3% 68,316 474,44233015 Rockingham Boston-Worcester-Lawrence-Lowell-Brocktn, MA-NH 28,135 306,845 10.1% 87,340 278,71033017 Strafford Boston-Worcester-Lawrence-Lowell-Brocktn, MA-NH -26,439 86,241 -23.5% 26,746 112,6808013 Boulder Boulder-Longmont, CO 180,944 473,917 61.8% 102,038 292,973
48039 Brazoria Brazoria, TX 89,454 332,674 36.8% 72,371 243,22053035 Kitsap Bremerton, WA 64,615 297,141 27.8% 83,764 232,52648061 Cameron Brownsville-Harlingen-San Benito, TX 181,585 518,369 53.9% 124,840 336,78448041 Brazos Bryan-College Station, TX 43,073 195,875 28.2% 57,397 152,80136063 Niagara Buffalo-Niagara Falls, NY -24,756 194,829 -11.3% -7,476 219,58536029 Erie Buffalo-Niagara Falls, NY -40,544 908,823 -4.3% -64,847 949,36750007 Chittenden Burlington, VT 34,689 181,655 23.6% 31,011 146,96650013 Grand Isle Burlington, VT 17,085 24,020 246.4% 2,293 6,93550011 Franklin Burlington, VT 9,217 54,812 20.2% 10,762 45,59539151 Stark Canton-Massillon, OH 10,307 388,382 2.7% -699 378,07539019 Carroll Canton-Massillon, OH -26,412 2,467 -91.5% 3,288 28,87956025 Natrona Casper, WY 703 67,253 1.1% -5,973 66,55019113 Linn Cedar Rapids, IA 80,226 272,448 41.7% 22,572 192,22217019 Champaign Champaign-Urbana, IL 33,029 212,994 18.4% 11,085 179,96554079 Putnam Charleston, WV 1,403 53,147 2.7% 13,492 51,74454039 Kanawha Charleston, WV -15,848 183,824 -7.9% -31,798 199,67245035 Dorchester Charleston-North Charleston, SC 65,286 161,994 67.5% 37,019 96,70845019 Charleston Charleston-North Charleston, SC 43,731 354,400 14.1% 32,472 310,66945015 Berkeley Charleston-North Charleston, SC 42,179 185,167 29.5% 47,259 142,98837119 Mecklenburg Charlotte-Gastonia-Rock Hill, NC-SC 349,854 1,050,071 50.0% 293,722 700,21737179 Union Charlotte-Gastonia-Rock Hill, NC-SC 124,502 250,148 99.1% 54,851 125,64645091 York Charlotte-Gastonia-Rock Hill, NC-SC 105,425 271,122 63.6% 58,353 165,69737025 Cabarrus Charlotte-Gastonia-Rock Hill, NC-SC 101,448 233,662 76.7% 45,912 132,21437109 Lincoln Charlotte-Gastonia-Rock Hill, NC-SC 74,144 138,183 115.8% 21,538 64,03937071 Gaston Charlotte-Gastonia-Rock Hill, NC-SC 66,664 257,316 35.0% 27,568 190,65237159 Rowan Charlotte-Gastonia-Rock Hill, NC-SC 62,413 193,061 47.8% 31,175 130,64851065 Fluvanna Charlottesville, VA 44,608 64,841 220.5% 9,950 20,23351079 Greene Charlottesville, VA 31,052 46,414 202.1% 7,664 15,36247065 Hamilton Chattanooga, TN-GA 28,334 336,314 9.2% 19,605 307,98013047 Catoosa Chattanooga, TN-GA 21,716 75,376 40.5% 16,546 53,66013295 Walker Chattanooga, TN-GA 1,900 63,022 3.1% 4,555 61,122

13083 Dade Chattanooga, TN-GA -9,154 6,034 -60.3% 2,895 15,18847115 Marion Chattanooga, TN-GA -21,010 6,761 -75.7% 3,309 27,77156021 Laramie Cheyenne, WY 30,914 112,623 37.8% 12,715 81,70917031 Cook Chicago, IL 604,597 5,981,749 11.2% 128,274 5,377,15217197 Will Chicago, IL 279,533 787,760 55.0% 183,253 508,22717043 DuPage Chicago, IL 253,679 1,160,361 28.0% 245,392 906,68217097 Lake Chicago, IL 249,616 898,216 38.5% 206,168 648,60017089 Kane Chicago, IL 216,569 624,211 53.1% 128,790 407,64217111 McHenry Chicago, IL 172,830 434,470 66.1% 113,508 261,64017093 Kendall Chicago, IL 70,886 126,080 128.4% 17,850 55,19417037 DeKalb Chicago, IL 33,744 123,048 37.8% 14,605 89,30417063 Grundy Chicago, IL 30,957 68,640 82.2% 7,018 37,6836007 Butte Chico-Paradise, CA 51,120 254,890 25.1% 58,942 203,770
39165 Warren Cincinnati, OH-KY-IN 105,865 266,608 65.9% 61,287 160,74321015 Boone Cincinnati, OH-KY-IN 81,464 168,470 93.6% 40,895 87,00639025 Clermont Cincinnati, OH-KY-IN 52,168 230,809 29.2% 49,609 178,64121117 Kenton Cincinnati, OH-KY-IN 34,496 186,134 22.7% 14,485 151,63818029 Dearborn Cincinnati, OH-KY-IN 34,235 80,582 73.9% 11,980 46,34739015 Brown Cincinnati, OH-KY-IN 24,189 66,763 56.8% 10,592 42,57421037 Campbell Cincinnati, OH-KY-IN 22,805 111,449 25.7% 5,460 88,64421081 Grant Cincinnati, OH-KY-IN 18,869 41,418 83.7% 9,212 22,54921077 Gallatin Cincinnati, OH-KY-IN 18,711 26,569 238.1% 3,018 7,85818115 Ohio Cincinnati, OH-KY-IN 15,801 21,443 280.1% 522 5,64239061 Hamilton Cincinnati, OH-KY-IN 13,296 857,350 1.6% -29,308 844,05421191 Pendleton Cincinnati, OH-KY-IN 4,006 18,509 27.6% 3,522 14,50347125 Montgomery Clarksville-Hopkinsville, TN-KY 48,982 184,412 36.2% 51,764 135,43021047 Christian Clarksville-Hopkinsville, TN-KY -13,768 58,414 -19.1% 5,261 72,18239103 Medina Cleveland-Lorain-Elyria, OH 60,233 212,087 39.7% 38,420 151,85439055 Geauga Cleveland-Lorain-Elyria, OH 4,415 95,650 4.8% 16,673 91,23539093 Lorain Cleveland-Lorain-Elyria, OH 3,709 288,924 1.3% 10,529 285,21539085 Lake Cleveland-Lorain-Elyria, OH 911 228,541 0.4% 14,489 227,63039035 Cuyahoga Cleveland-Lorain-Elyria, OH -4,354 1,387,750 -0.3% -104,511 1,392,10439007 Ashtabula Cleveland-Lorain-Elyria, OH -37,191 65,579 -36.2% -1,249 102,7708041 El Paso Colorado Springs, CO 222,520 742,011 42.8% 207,448 519,491
29019 Boone Columbia, MO 36,451 172,276 26.8% 35,049 135,82545063 Lexington Columbia, SC 135,240 352,096 62.4% 75,697 216,85645079 Richland Columbia, SC 94,056 415,412 29.3% 50,834 321,356
13145 Harris Columbus, GA-AL 49,496 73,303 207.9% 8,389 23,80713215 Muscogee Columbus, GA-AL 39,412 225,891 21.1% 15,921 186,4791113 Russell Columbus, GA-AL 15,840 65,537 31.9% 2,425 49,697
13053 Chattahoochee Columbus, GA-AL 4,044 19,036 27.0% -6,387 14,99239049 Franklin Columbus, OH 208,772 1,280,531 19.5% 200,315 1,071,75939041 Delaware Columbus, OH 105,727 217,447 94.6% 57,659 111,72039045 Fairfield Columbus, OH 46,900 170,327 38.0% 29,276 123,42739089 Licking Columbus, OH 40,176 186,232 27.5% 24,721 146,05639097 Madison Columbus, OH 23,892 64,114 59.4% 7,085 40,22239129 Pickaway Columbus, OH 21,880 74,720 41.4% 9,212 52,84048355 Nueces Corpus Christi, TX 43,341 356,761 13.8% 43,927 313,42048409 San Patricio Corpus Christi, TX -1,843 65,427 -2.7% 8,948 67,27041003 Benton Corvallis, OR 19,450 97,609 24.9% 9,688 78,15924001 Allegany Cumberland, MD-WV -726 74,080 -1.0% -5,778 74,80654057 Mineral Cumberland, MD-WV -9,779 17,258 -36.2% -247 27,03748113 Dallas Dallas, TX 642,464 2,867,806 28.9% 659,694 2,225,34248085 Collin Dallas, TX 438,551 938,606 87.7% 353,516 500,05548121 Denton Dallas, TX 301,085 739,896 68.6% 293,360 438,81148397 Rockwall Dallas, TX 78,393 122,241 178.8% 29,102 43,84848139 Ellis Dallas, TX 71,289 183,760 63.4% 52,428 112,47148257 Kaufman Dallas, TX 55,439 127,585 76.8% 32,865 72,14648231 Hunt Dallas, TX 27,992 104,977 36.4% 21,373 76,98448213 Henderson Dallas, TX 9,711 83,295 13.2% 30,646 73,58417161 Rock Island Davenport-Moline-Rock Island, IA-IL 46,712 195,828 31.3% -17,906 149,11619163 Scott Davenport-Moline-Rock Island, IA-IL 34,095 192,822 21.5% -1,401 158,72717073 Henry Davenport-Moline-Rock Island, IA-IL 14,422 65,474 28.3% -6,866 51,05212127 Volusia Daytona Beach, FL 133,913 578,879 30.1% 183,522 444,96612035 Flagler Daytona Beach, FL 65,535 116,111 129.6% 39,372 50,57639109 Miami Dayton-Springfield, OH 26,645 125,631 26.9% 8,471 98,98639057 Greene Dayton-Springfield, OH 25,325 173,540 17.1% 18,397 148,21539113 Montgomery Dayton-Springfield, OH 19,341 577,804 3.5% -13,206 558,46339023 Clark Dayton-Springfield, OH 2,438 147,061 1.7% -5,526 144,6231103 Morgan Decatur, AL 12,337 123,537 11.1% 20,960 111,2001079 Lawrence Decatur, AL -10,917 23,944 -31.3% 4,666 34,861
17115 Macon Decatur, IL 7,833 122,316 6.8% -16,722 114,4838035 Douglas Denver, CO 277,818 458,222 154.0% 154,785 180,4048031 Denver Denver, CO 239,167 794,577 43.1% 61,175 555,410
8001 Adams Denver, CO 238,246 605,314 64.9% 119,923 367,0688005 Arapahoe Denver, CO 213,649 705,172 43.5% 194,222 491,5238059 Jefferson Denver, CO 192,242 720,454 36.4% 153,687 528,212
19153 Polk Des Moines, IA 122,204 497,965 32.5% 72,058 375,76119049 Dallas Des Moines, IA 70,531 111,584 171.8% 11,556 41,05219181 Warren Des Moines, IA 13,929 54,720 34.1% 5,877 40,79126125 Oakland Detroit, MI 245,437 1,442,052 20.5% 186,564 1,196,61526099 Macomb Detroit, MI 149,273 940,134 18.9% 97,453 790,86126087 Lapeer Detroit, MI 47,285 135,600 53.5% 18,129 88,31426147 St. Clair Detroit, MI 37,776 202,480 22.9% 25,597 164,70426115 Monroe Detroit, MI 28,524 175,004 19.5% 11,747 146,47926163 Wayne Detroit, MI 23,183 2,082,379 1.1% -267,170 2,059,1961069 Houston Dothan, AL -4,434 84,495 -5.0% 13,949 88,9291045 Dale Dothan, AL -7,225 41,891 -14.7% 1,118 49,116
10001 Kent Dover, DE 25,697 152,793 20.2% 28,816 127,09619061 Dubuque Dubuque, IA 26,027 115,285 29.2% -4,443 89,25827137 St. Louis Duluth-Superior, MN-WI -11,161 189,270 -5.6% -21,477 200,43155031 Douglas Duluth-Superior, MN-WI -28,419 14,988 -65.5% -1,156 43,40736027 Dutchess Dutchess County, NY 42,223 323,059 15.0% 35,499 280,83655035 Eau Claire Eau Claire, WI 5,066 98,342 5.4% 14,223 93,27655017 Chippewa Eau Claire, WI -3,185 52,148 -5.8% 2,981 55,33348141 El Paso El Paso, TX 285,652 967,352 41.9% 197,989 681,70018039 Elkhart Elkhart-Goshen, IN 78,776 262,283 42.9% 46,215 183,50736015 Chemung Elmira, NY -25,628 65,413 -28.1% -6,402 91,04140047 Garfield Enid, OK -18,395 39,277 -31.9% -5,507 57,67242049 Erie Erie, PA -38,486 242,201 -13.7% 644 280,68741039 Lane Eugene-Springfield, OR 48,683 372,096 15.1% 47,705 323,41318163 Vanderburgh Evansville-Henderson, IN-KY 35,357 207,203 20.6% 4,375 171,84618173 Warrick Evansville-Henderson, IN-KY 30,642 83,212 58.3% 10,955 52,57021101 Henderson Evansville-Henderson, IN-KY 5,272 50,081 11.8% 3,844 44,80918129 Posey Evansville-Henderson, IN-KY 4,081 31,154 15.1% 658 27,07338017 Cass Fargo-Moorhead, ND-MN 31,861 155,232 25.8% 34,756 123,37127027 Clay Fargo-Moorhead, ND-MN -11,294 40,021 -22.0% 1,951 51,31537051 Cumberland Fayetteville, NC 79,882 382,720 26.4% 54,942 302,8385007 Benton Fayetteville-Springdale-Rogers, AR 98,703 253,503 63.8% 76,426 154,8005143 Washington Fayetteville-Springdale-Rogers, AR 84,121 242,804 53.0% 58,004 158,6834005 Coconino Flagstaff, AZ-UT 52,187 168,827 44.7% 41,061 116,640

49025 Kane Flagstaff, AZ-UT -6,078 0 -100.0% 2,040 6,07826049 Genesee Flint, MI 51,640 488,593 11.8% -12,178 436,9531077 Lauderdale Florence, AL -1,003 86,973 -1.1% 7,234 87,9761033 Colbert Florence, AL -6,270 48,753 -11.4% 443 55,023
45041 Florence Florence, SC 59,507 185,300 47.3% 15,272 125,7938069 Larimer Fort Collins-Loveland, CO 134,548 387,486 53.2% 102,847 252,938
12011 Broward Fort Lauderdale, FL 677,134 2,309,574 41.5% 606,378 1,632,44012071 Lee Fort Myers-Cape Coral, FL 177,526 621,315 40.0% 235,739 443,78912111 St. Lucie Fort Pierce-Port St. Lucie, FL 89,200 282,659 46.1% 104,624 193,45912085 Martin Fort Pierce-Port St. Lucie, FL 45,751 172,852 36.0% 62,166 127,1015131 Sebastian Fort Smith, AR-OK 38,115 153,633 33.0% 20,155 115,5185033 Crawford Fort Smith, AR-OK 18,087 71,473 33.9% 16,443 53,386
40135 Sequoyah Fort Smith, AR-OK -21,946 17,114 -56.2% 8,282 39,06012091 Okaloosa Fort Walton Beach, FL 60,088 231,048 35.1% 60,281 170,96018003 Allen Fort Wayne, IN 75,560 408,233 22.7% 38,839 332,67318033 De Kalb Fort Wayne, IN 26,807 67,205 66.4% 6,884 40,39818183 Whitley Fort Wayne, IN 22,030 52,775 71.7% 4,512 30,74518069 Huntington Fort Wayne, IN 13,644 51,742 35.8% 2,553 38,09818179 Wells Fort Wayne, IN 5,065 32,681 18.3% 2,203 27,61618001 Adams Fort Wayne, IN -6,593 27,025 -19.6% 3,964 33,61848439 Tarrant Fort Worth-Arlington, TX 480,496 1,934,957 33.0% 586,130 1,454,46148251 Johnson Fort Worth-Arlington, TX 92,940 220,974 72.6% 59,869 128,03448367 Parker Fort Worth-Arlington, TX 57,257 146,530 64.1% 44,324 89,27348221 Hood Fort Worth-Arlington, TX 22,103 63,610 53.3% 23,648 41,5076019 Fresno Fresno, CA 315,146 1,117,160 39.3% 284,335 802,0146039 Madera Fresno, CA 163,364 286,996 132.1% 59,671 123,6321055 Etowah Gadsden, AL 1,475 104,775 1.4% 188 103,300
12001 Alachua Gainesville, FL 107,987 326,282 49.5% 66,072 218,29548167 Galveston Galveston-Texas City, TX 66,336 317,061 26.5% 53,697 250,72518089 Lake Gary, IN 32,723 517,314 6.8% -37,044 484,59118127 Porter Gary, IN 28,643 175,873 19.5% 27,246 147,23036115 Washington Glens Falls, NY -14,282 46,721 -23.4% 6,232 61,00336113 Warren Glens Falls, NY -18,310 45,034 -28.9% 8,390 63,34437191 Wayne Goldsboro, NC 44,584 157,914 39.3% 16,016 113,33027119 Polk Grand Forks, ND-MN -23,628 7,752 -75.3% -3,423 31,38038035 Grand Forks Grand Forks, ND-MN -38,635 27,233 -58.7% -403 65,8688077 Mesa Grand Junction, CO 49,649 167,124 42.3% 34,679 117,475
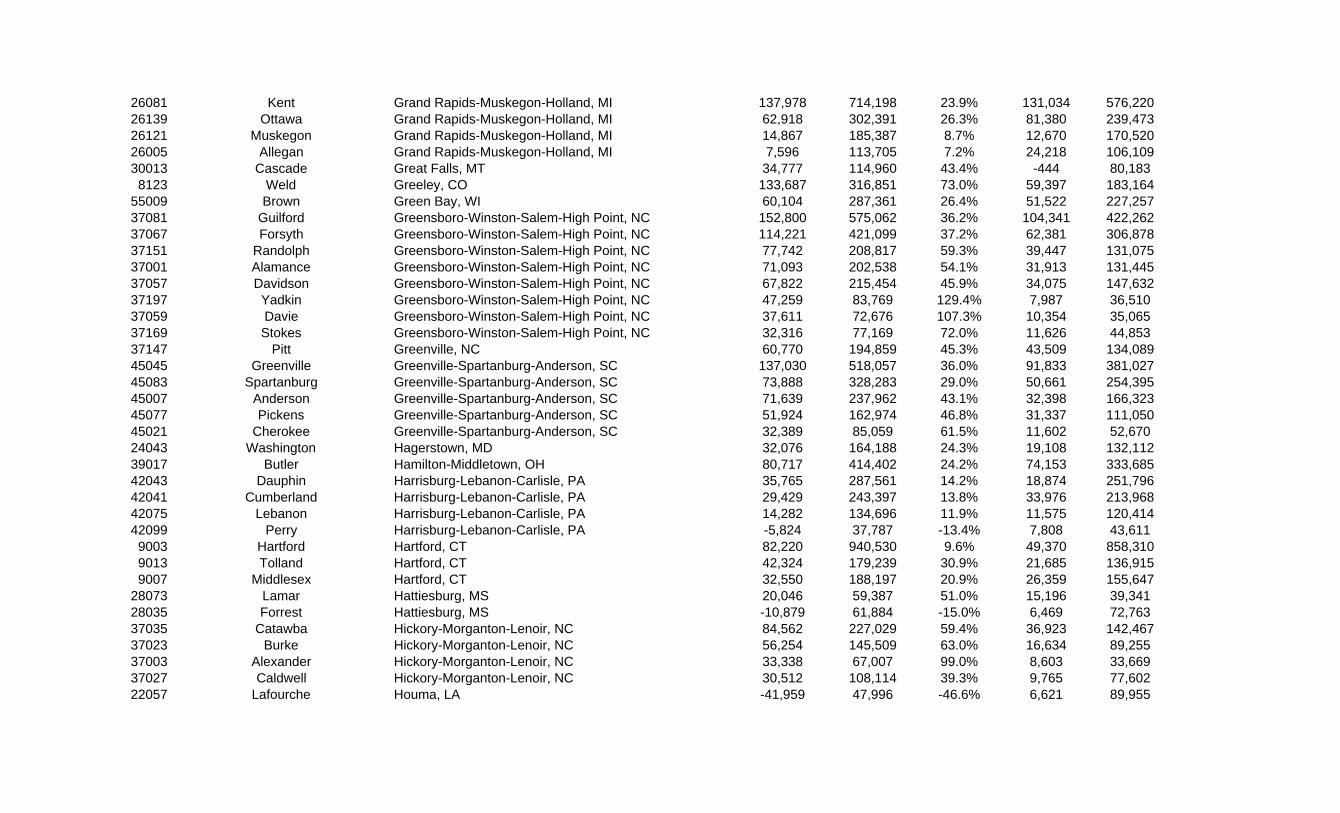
26081 Kent Grand Rapids-Muskegon-Holland, MI 137,978 714,198 23.9% 131,034 576,22026139 Ottawa Grand Rapids-Muskegon-Holland, MI 62,918 302,391 26.3% 81,380 239,47326121 Muskegon Grand Rapids-Muskegon-Holland, MI 14,867 185,387 8.7% 12,670 170,52026005 Allegan Grand Rapids-Muskegon-Holland, MI 7,596 113,705 7.2% 24,218 106,10930013 Cascade Great Falls, MT 34,777 114,960 43.4% -444 80,1838123 Weld Greeley, CO 133,687 316,851 73.0% 59,397 183,164
55009 Brown Green Bay, WI 60,104 287,361 26.4% 51,522 227,25737081 Guilford Greensboro-Winston-Salem-High Point, NC 152,800 575,062 36.2% 104,341 422,26237067 Forsyth Greensboro-Winston-Salem-High Point, NC 114,221 421,099 37.2% 62,381 306,87837151 Randolph Greensboro-Winston-Salem-High Point, NC 77,742 208,817 59.3% 39,447 131,07537001 Alamance Greensboro-Winston-Salem-High Point, NC 71,093 202,538 54.1% 31,913 131,44537057 Davidson Greensboro-Winston-Salem-High Point, NC 67,822 215,454 45.9% 34,075 147,63237197 Yadkin Greensboro-Winston-Salem-High Point, NC 47,259 83,769 129.4% 7,987 36,51037059 Davie Greensboro-Winston-Salem-High Point, NC 37,611 72,676 107.3% 10,354 35,06537169 Stokes Greensboro-Winston-Salem-High Point, NC 32,316 77,169 72.0% 11,626 44,85337147 Pitt Greenville, NC 60,770 194,859 45.3% 43,509 134,08945045 Greenville Greenville-Spartanburg-Anderson, SC 137,030 518,057 36.0% 91,833 381,02745083 Spartanburg Greenville-Spartanburg-Anderson, SC 73,888 328,283 29.0% 50,661 254,39545007 Anderson Greenville-Spartanburg-Anderson, SC 71,639 237,962 43.1% 32,398 166,32345077 Pickens Greenville-Spartanburg-Anderson, SC 51,924 162,974 46.8% 31,337 111,05045021 Cherokee Greenville-Spartanburg-Anderson, SC 32,389 85,059 61.5% 11,602 52,67024043 Washington Hagerstown, MD 32,076 164,188 24.3% 19,108 132,11239017 Butler Hamilton-Middletown, OH 80,717 414,402 24.2% 74,153 333,68542043 Dauphin Harrisburg-Lebanon-Carlisle, PA 35,765 287,561 14.2% 18,874 251,79642041 Cumberland Harrisburg-Lebanon-Carlisle, PA 29,429 243,397 13.8% 33,976 213,96842075 Lebanon Harrisburg-Lebanon-Carlisle, PA 14,282 134,696 11.9% 11,575 120,41442099 Perry Harrisburg-Lebanon-Carlisle, PA -5,824 37,787 -13.4% 7,808 43,6119003 Hartford Hartford, CT 82,220 940,530 9.6% 49,370 858,3109013 Tolland Hartford, CT 42,324 179,239 30.9% 21,685 136,9159007 Middlesex Hartford, CT 32,550 188,197 20.9% 26,359 155,647
28073 Lamar Hattiesburg, MS 20,046 59,387 51.0% 15,196 39,34128035 Forrest Hattiesburg, MS -10,879 61,884 -15.0% 6,469 72,76337035 Catawba Hickory-Morganton-Lenoir, NC 84,562 227,029 59.4% 36,923 142,46737023 Burke Hickory-Morganton-Lenoir, NC 56,254 145,509 63.0% 16,634 89,25537003 Alexander Hickory-Morganton-Lenoir, NC 33,338 67,007 99.0% 8,603 33,66937027 Caldwell Hickory-Morganton-Lenoir, NC 30,512 108,114 39.3% 9,765 77,60222057 Lafourche Houma, LA -41,959 47,996 -46.6% 6,621 89,955

22109 Terrebonne Houma, LA -47,720 56,804 -45.7% 9,541 104,52448201 Harris Houston, TX 958,645 4,373,626 28.1% 976,442 3,414,98148157 Fort Bend Houston, TX 283,281 642,237 78.9% 225,689 358,95648339 Montgomery Houston, TX 216,453 513,984 72.7% 168,377 297,53148291 Liberty Houston, TX 43,361 114,002 61.4% 23,140 70,64148473 Waller Houston, TX 43,043 75,896 131.0% 12,799 32,85348071 Chambers Houston, TX 7,624 33,798 29.1% 7,570 26,17454011 Cabell Huntington-Ashland, WV-KY-OH -300 96,367 -0.3% -10,257 96,66721019 Boyd Huntington-Ashland, WV-KY-OH -8,919 40,735 -18.0% -5,799 49,65421089 Greenup Huntington-Ashland, WV-KY-OH -16,242 20,597 -44.1% -2,266 36,83921043 Carter Huntington-Ashland, WV-KY-OH -17,244 9,629 -64.2% 1,758 26,87339087 Lawrence Huntington-Ashland, WV-KY-OH -21,975 40,308 -35.3% -1,459 62,28354099 Wayne Huntington-Ashland, WV-KY-OH -23,953 18,958 -55.8% -3,136 42,9111089 Madison Huntsville, AL 63,028 340,585 22.7% 79,925 277,5571083 Limestone Huntsville, AL 14,965 80,903 22.7% 19,950 65,938
18057 Hamilton Indianapolis, IN 168,978 354,358 91.2% 102,908 185,38018097 Marion Indianapolis, IN 142,517 1,002,902 16.6% 94,695 860,38518063 Hendricks Indianapolis, IN 84,651 190,039 80.3% 35,430 105,38818081 Johnson Indianapolis, IN 68,745 184,719 59.3% 38,410 115,97418059 Hancock Indianapolis, IN 48,466 104,119 87.1% 11,693 55,65318109 Morgan Indianapolis, IN 44,191 111,079 66.1% 14,714 66,88818011 Boone Indianapolis, IN 37,163 83,548 80.1% 9,787 46,38518145 Shelby Indianapolis, IN 36,236 79,836 83.1% 3,667 43,60018095 Madison Indianapolis, IN 31,281 164,558 23.5% -5,541 133,27719103 Johnson Iowa City, IA 67,275 178,637 60.4% 29,213 111,36226075 Jackson Jackson, MI 36,797 195,527 23.2% 7,176 158,73028121 Rankin Jackson, MS 66,264 182,446 57.0% 46,344 116,18228089 Madison Jackson, MS 45,492 120,550 60.6% 33,292 75,05828049 Hinds Jackson, MS 2,952 253,543 1.2% -987 250,59147113 Madison Jackson, TN -1,258 90,748 -1.4% 17,173 92,00647023 Chester Jackson, TN -15,545 0 -100.0% 2,824 15,54512031 Duval Jacksonville, FL 192,699 972,317 24.7% 206,448 779,61812019 Clay Jacksonville, FL 96,242 237,914 67.9% 73,856 141,67112109 St. Johns Jacksonville, FL 94,747 219,205 76.1% 72,508 124,45812089 Nassau Jacksonville, FL 38,112 96,065 65.8% 24,883 57,95337133 Onslow Jacksonville, NC 1,881 152,104 1.3% 36,708 150,22336013 Chautauqua Jamestown, NY -49,891 89,698 -35.7% -7,372 139,589

55105 Rock Janesville-Beloit, WI 49,866 202,404 32.7% 13,269 152,53834017 Hudson Jersey City, NJ 242,171 851,548 39.7% 50,785 609,37747179 Washington Johnson City-Kingsport-Bristol, TN-VA 29,181 136,647 27.2% 18,355 107,46547163 Sullivan Johnson City-Kingsport-Bristol, TN-VA 21,933 174,863 14.3% 8,633 152,93047073 Hawkins Johnson City-Kingsport-Bristol, TN-VA 5,053 58,748 9.4% 9,762 53,69547171 Unicoi Johnson City-Kingsport-Bristol, TN-VA 4,933 22,583 27.9% 1,235 17,65047019 Carter Johnson City-Kingsport-Bristol, TN-VA 4,383 61,221 7.7% 6,438 56,83851169 Scott Johnson City-Kingsport-Bristol, TN-VA -8,743 14,632 -37.4% -1,636 23,37542111 Somerset Johnstown, PA -36,894 43,131 -46.1% -1,261 80,02542021 Cambria Johnstown, PA -48,233 103,997 -31.7% -30,756 152,2305031 Craighead Jonesboro, AR 20,235 102,721 24.5% 19,182 82,486
29097 Jasper Joplin, MO 21,045 126,009 20.0% 17,757 104,96429145 Newton Joplin, MO 6,951 59,689 13.2% 12,100 52,73826077 Kalamazoo Kalamazoo-Battle Creek, MI 33,512 272,389 14.0% 26,271 238,87726025 Calhoun Kalamazoo-Battle Creek, MI 20,184 158,277 14.6% -3,608 138,09326159 Van Buren Kalamazoo-Battle Creek, MI -3,462 72,887 -4.5% 9,329 76,34917091 Kankakee Kankakee, IL 34,494 138,371 33.2% 991 103,87720091 Johnson Kansas City, MO-KS 172,387 626,901 37.9% 183,156 454,51429095 Jackson Kansas City, MO-KS 81,119 736,678 12.4% 26,023 655,55929047 Clay Kansas City, MO-KS 66,098 250,875 35.8% 48,208 184,77729165 Platte Kansas City, MO-KS 46,923 121,130 63.2% 27,681 74,20720209 Wyandotte Kansas City, MO-KS 37,557 195,386 23.8% -14,446 157,82829037 Cass Kansas City, MO-KS 31,672 114,302 38.3% 31,340 82,63020103 Leavenworth Kansas City, MO-KS 28,053 96,964 40.7% 13,917 68,91120121 Miami Kansas City, MO-KS 10,570 39,067 37.1% 6,837 28,49729107 Lafayette Kansas City, MO-KS -3,521 29,505 -10.7% 3,062 33,02629049 Clinton Kansas City, MO-KS -3,798 15,252 -19.9% 3,081 19,05029177 Ray Kansas City, MO-KS -11,377 12,005 -48.7% 1,972 23,38255059 Kenosha Kenosha, WI 41,300 191,369 27.5% 27,126 150,06948027 Bell Killeen-Temple, TX 108,497 347,494 45.4% 79,980 238,99748099 Coryell Killeen-Temple, TX 35,381 110,586 47.0% 18,264 75,20547093 Knox Knoxville, TN 56,621 439,430 14.8% 61,998 382,80847009 Blount Knoxville, TN 25,550 131,794 24.0% 28,298 106,24447105 Loudon Knoxville, TN 17,554 56,777 44.8% 10,513 39,22347155 Sevier Knoxville, TN 6,190 77,897 8.6% 30,007 71,70747173 Union Knoxville, TN -6,834 11,033 -38.3% 6,098 17,86747001 Anderson Knoxville, TN -9,206 62,079 -12.9% 3,818 71,285

18067 Howard Kokomo, IN 27,451 112,421 32.3% -1,804 84,97018159 Tipton Kokomo, IN 11,502 28,058 69.5% -229 16,55655063 La Crosse La Crosse, WI-MN 12,610 119,866 11.8% 15,972 107,25627055 Houston La Crosse, WI-MN -3,827 15,924 -19.4% 1,339 19,75118157 Tippecanoe Lafayette, IN 60,073 209,414 40.2% 27,383 149,34118023 Clinton Lafayette, IN 31,432 65,402 92.5% 2,416 33,97022055 Lafayette Lafayette, LA 23,485 214,062 12.3% 39,161 190,57722099 St. Martin Lafayette, LA -5,121 43,541 -10.5% 8,179 48,66222097 St. Landry Lafayette, LA -14,794 72,963 -16.9% 3,365 87,75722001 Acadia Lafayette, LA -32,338 26,489 -55.0% 2,196 58,82722019 Calcasieu Lake Charles, LA 4,423 187,943 2.4% 15,466 183,52012105 Polk Lakeland-Winter Haven, FL 173,954 659,358 35.8% 161,366 485,40442071 Lancaster Lancaster, PA 96,896 568,550 20.5% 108,234 471,65426065 Ingham Lansing-East Lansing, MI 33,693 313,243 12.1% 3,943 279,55026045 Eaton Lansing-East Lansing, MI 28,044 131,951 27.0% 15,405 103,90726037 Clinton Lansing-East Lansing, MI 18,733 83,700 28.8% 8,967 64,96748479 Webb Laredo, TX 213,157 407,818 109.5% 94,180 194,66135013 Dona Ana Las Cruces, NM 180,911 355,891 103.4% 77,968 174,98032003 Clark Las Vegas, NV-AZ 1,120,793 2,513,962 80.4% 923,984 1,393,1694015 Mohave Las Vegas, NV-AZ 144,908 301,155 92.7% 99,824 156,247
32023 Nye Las Vegas, NV-AZ 87,647 120,563 266.3% 23,431 32,91620045 Douglas Lawrence, KS 44,253 144,435 44.2% 32,137 100,18240031 Comanche Lawton, OK 18,354 132,918 16.0% 1,643 114,56423001 Androscoggin Lewiston-Auburn, ME 1,882 105,747 1.8% 4,334 103,86521067 Fayette Lexington, KY 89,207 350,168 34.2% 56,363 260,96121209 Scott Lexington, KY 37,209 70,638 111.3% 11,595 33,42921151 Madison Lexington, KY 21,519 92,790 30.2% 17,835 71,27121239 Woodford Lexington, KY 16,901 40,169 72.6% 5,469 23,26821113 Jessamine Lexington, KY 10,906 50,125 27.8% 13,032 39,21921017 Bourbon Lexington, KY 4,440 23,812 22.9% -3 19,37221049 Clark Lexington, KY 2,946 36,188 8.9% 4,860 33,24239011 Auglaize Lima, OH 20,470 67,087 43.9% 3,952 46,61739003 Allen Lima, OH 4,058 112,602 3.7% -3,644 108,54431109 Lancaster Lincoln, NE 97,268 348,458 38.7% 57,591 251,1905125 Saline Little Rock-North Little Rock, AR 61,798 145,733 73.6% 30,580 83,9355045 Faulkner Little Rock-North Little Rock, AR 45,432 131,824 52.6% 40,046 86,3925119 Pulaski Little Rock-North Little Rock, AR 43,467 405,172 12.0% 20,539 361,705
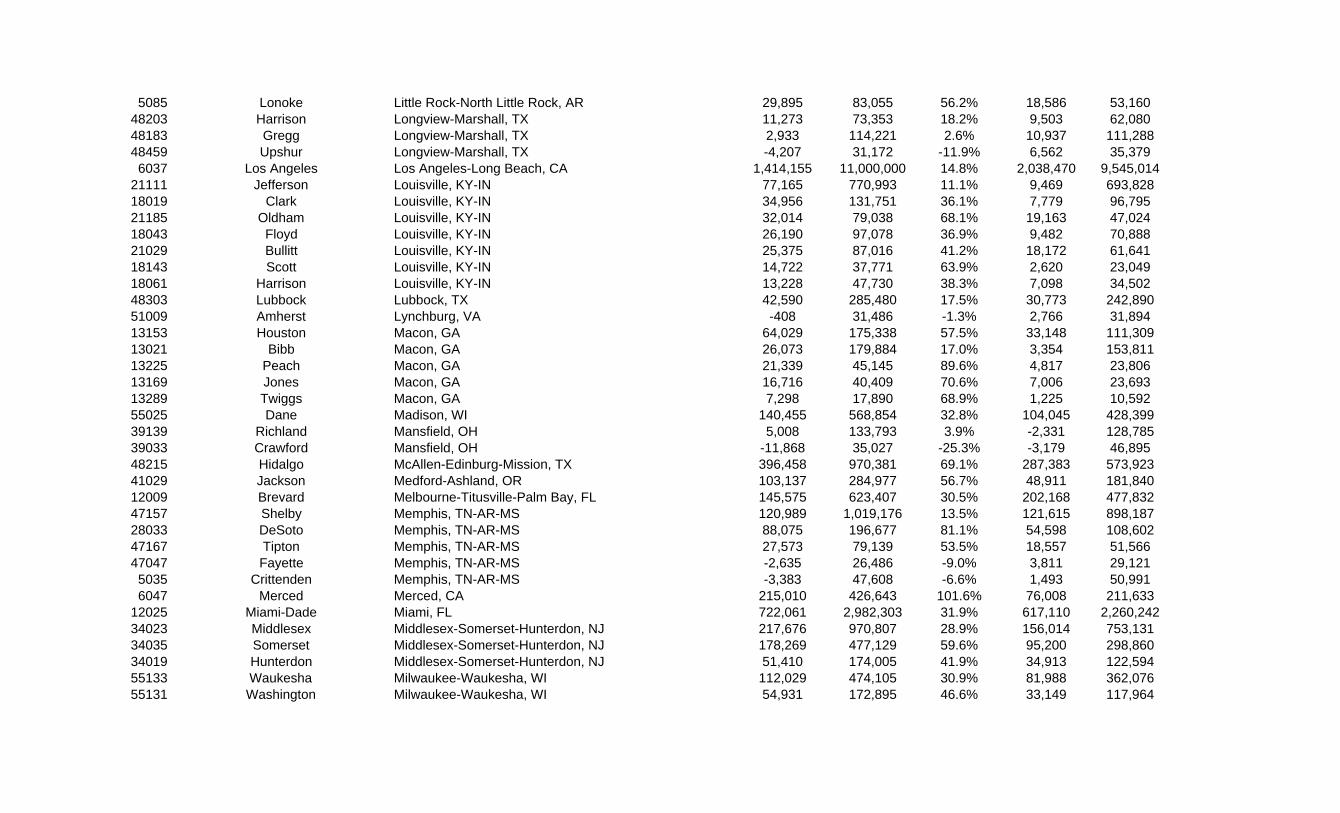
5085 Lonoke Little Rock-North Little Rock, AR 29,895 83,055 56.2% 18,586 53,16048203 Harrison Longview-Marshall, TX 11,273 73,353 18.2% 9,503 62,08048183 Gregg Longview-Marshall, TX 2,933 114,221 2.6% 10,937 111,28848459 Upshur Longview-Marshall, TX -4,207 31,172 -11.9% 6,562 35,3796037 Los Angeles Los Angeles-Long Beach, CA 1,414,155 11,000,000 14.8% 2,038,470 9,545,014
21111 Jefferson Louisville, KY-IN 77,165 770,993 11.1% 9,469 693,82818019 Clark Louisville, KY-IN 34,956 131,751 36.1% 7,779 96,79521185 Oldham Louisville, KY-IN 32,014 79,038 68.1% 19,163 47,02418043 Floyd Louisville, KY-IN 26,190 97,078 36.9% 9,482 70,88821029 Bullitt Louisville, KY-IN 25,375 87,016 41.2% 18,172 61,64118143 Scott Louisville, KY-IN 14,722 37,771 63.9% 2,620 23,04918061 Harrison Louisville, KY-IN 13,228 47,730 38.3% 7,098 34,50248303 Lubbock Lubbock, TX 42,590 285,480 17.5% 30,773 242,89051009 Amherst Lynchburg, VA -408 31,486 -1.3% 2,766 31,89413153 Houston Macon, GA 64,029 175,338 57.5% 33,148 111,30913021 Bibb Macon, GA 26,073 179,884 17.0% 3,354 153,81113225 Peach Macon, GA 21,339 45,145 89.6% 4,817 23,80613169 Jones Macon, GA 16,716 40,409 70.6% 7,006 23,69313289 Twiggs Macon, GA 7,298 17,890 68.9% 1,225 10,59255025 Dane Madison, WI 140,455 568,854 32.8% 104,045 428,39939139 Richland Mansfield, OH 5,008 133,793 3.9% -2,331 128,78539033 Crawford Mansfield, OH -11,868 35,027 -25.3% -3,179 46,89548215 Hidalgo McAllen-Edinburg-Mission, TX 396,458 970,381 69.1% 287,383 573,92341029 Jackson Medford-Ashland, OR 103,137 284,977 56.7% 48,911 181,84012009 Brevard Melbourne-Titusville-Palm Bay, FL 145,575 623,407 30.5% 202,168 477,83247157 Shelby Memphis, TN-AR-MS 120,989 1,019,176 13.5% 121,615 898,18728033 DeSoto Memphis, TN-AR-MS 88,075 196,677 81.1% 54,598 108,60247167 Tipton Memphis, TN-AR-MS 27,573 79,139 53.5% 18,557 51,56647047 Fayette Memphis, TN-AR-MS -2,635 26,486 -9.0% 3,811 29,1215035 Crittenden Memphis, TN-AR-MS -3,383 47,608 -6.6% 1,493 50,9916047 Merced Merced, CA 215,010 426,643 101.6% 76,008 211,633
12025 Miami-Dade Miami, FL 722,061 2,982,303 31.9% 617,110 2,260,24234023 Middlesex Middlesex-Somerset-Hunterdon, NJ 217,676 970,807 28.9% 156,014 753,13134035 Somerset Middlesex-Somerset-Hunterdon, NJ 178,269 477,129 59.6% 95,200 298,86034019 Hunterdon Middlesex-Somerset-Hunterdon, NJ 51,410 174,005 41.9% 34,913 122,59455133 Waukesha Milwaukee-Waukesha, WI 112,029 474,105 30.9% 81,988 362,07655131 Washington Milwaukee-Waukesha, WI 54,931 172,895 46.6% 33,149 117,964
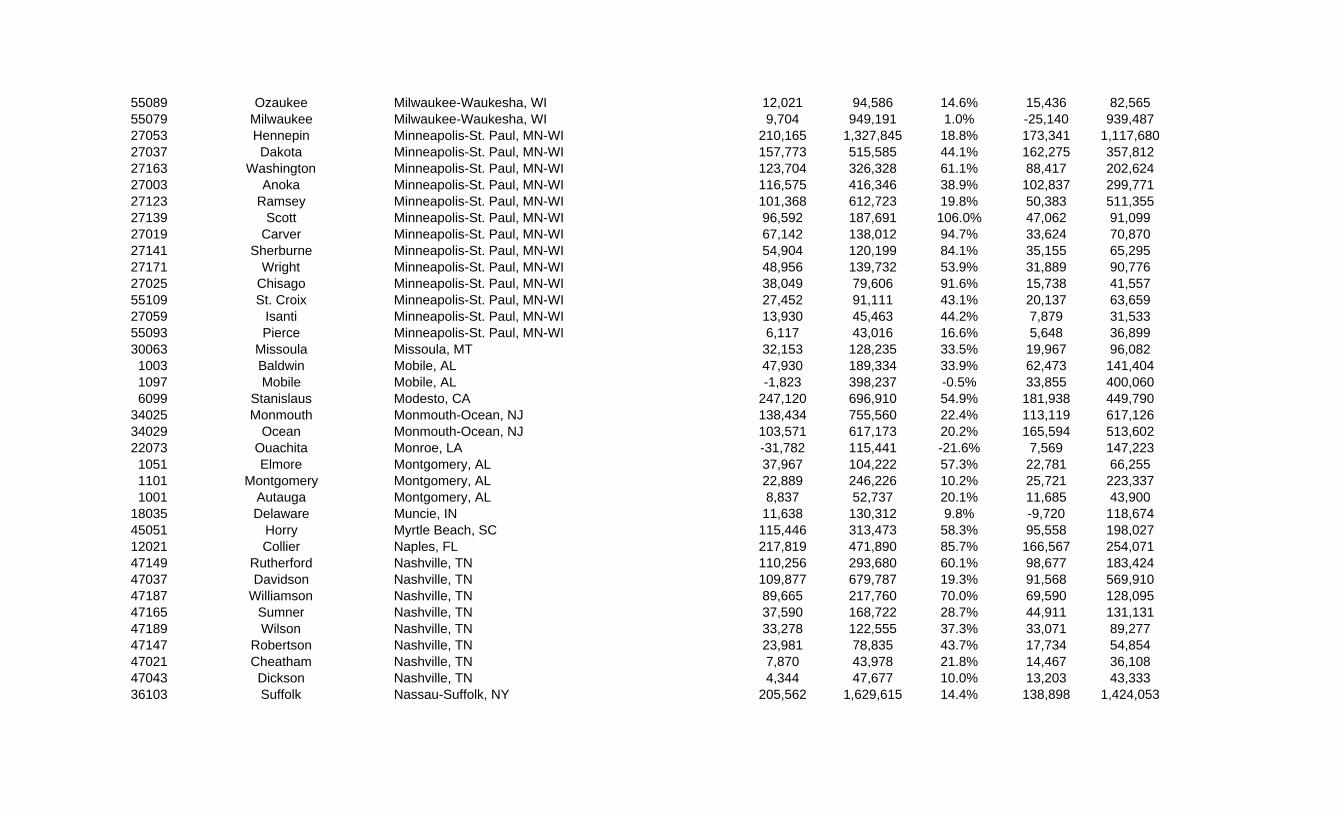
55089 Ozaukee Milwaukee-Waukesha, WI 12,021 94,586 14.6% 15,436 82,56555079 Milwaukee Milwaukee-Waukesha, WI 9,704 949,191 1.0% -25,140 939,48727053 Hennepin Minneapolis-St. Paul, MN-WI 210,165 1,327,845 18.8% 173,341 1,117,68027037 Dakota Minneapolis-St. Paul, MN-WI 157,773 515,585 44.1% 162,275 357,81227163 Washington Minneapolis-St. Paul, MN-WI 123,704 326,328 61.1% 88,417 202,62427003 Anoka Minneapolis-St. Paul, MN-WI 116,575 416,346 38.9% 102,837 299,77127123 Ramsey Minneapolis-St. Paul, MN-WI 101,368 612,723 19.8% 50,383 511,35527139 Scott Minneapolis-St. Paul, MN-WI 96,592 187,691 106.0% 47,062 91,09927019 Carver Minneapolis-St. Paul, MN-WI 67,142 138,012 94.7% 33,624 70,87027141 Sherburne Minneapolis-St. Paul, MN-WI 54,904 120,199 84.1% 35,155 65,29527171 Wright Minneapolis-St. Paul, MN-WI 48,956 139,732 53.9% 31,889 90,77627025 Chisago Minneapolis-St. Paul, MN-WI 38,049 79,606 91.6% 15,738 41,55755109 St. Croix Minneapolis-St. Paul, MN-WI 27,452 91,111 43.1% 20,137 63,65927059 Isanti Minneapolis-St. Paul, MN-WI 13,930 45,463 44.2% 7,879 31,53355093 Pierce Minneapolis-St. Paul, MN-WI 6,117 43,016 16.6% 5,648 36,89930063 Missoula Missoula, MT 32,153 128,235 33.5% 19,967 96,0821003 Baldwin Mobile, AL 47,930 189,334 33.9% 62,473 141,4041097 Mobile Mobile, AL -1,823 398,237 -0.5% 33,855 400,0606099 Stanislaus Modesto, CA 247,120 696,910 54.9% 181,938 449,790
34025 Monmouth Monmouth-Ocean, NJ 138,434 755,560 22.4% 113,119 617,12634029 Ocean Monmouth-Ocean, NJ 103,571 617,173 20.2% 165,594 513,60222073 Ouachita Monroe, LA -31,782 115,441 -21.6% 7,569 147,2231051 Elmore Montgomery, AL 37,967 104,222 57.3% 22,781 66,2551101 Montgomery Montgomery, AL 22,889 246,226 10.2% 25,721 223,3371001 Autauga Montgomery, AL 8,837 52,737 20.1% 11,685 43,900
18035 Delaware Muncie, IN 11,638 130,312 9.8% -9,720 118,67445051 Horry Myrtle Beach, SC 115,446 313,473 58.3% 95,558 198,02712021 Collier Naples, FL 217,819 471,890 85.7% 166,567 254,07147149 Rutherford Nashville, TN 110,256 293,680 60.1% 98,677 183,42447037 Davidson Nashville, TN 109,877 679,787 19.3% 91,568 569,91047187 Williamson Nashville, TN 89,665 217,760 70.0% 69,590 128,09547165 Sumner Nashville, TN 37,590 168,722 28.7% 44,911 131,13147189 Wilson Nashville, TN 33,278 122,555 37.3% 33,071 89,27747147 Robertson Nashville, TN 23,981 78,835 43.7% 17,734 54,85447021 Cheatham Nashville, TN 7,870 43,978 21.8% 14,467 36,10847043 Dickson Nashville, TN 4,344 47,677 10.0% 13,203 43,33336103 Suffolk Nassau-Suffolk, NY 205,562 1,629,615 14.4% 138,898 1,424,053

36059 Nassau Nassau-Suffolk, NY 164,147 1,500,505 12.3% 15,719 1,336,3589001 Fairfield New Haven-Bridgprt-Stamfrd-Danbry-Wtrbry, CT 158,955 1,043,559 18.0% 75,901 884,6049009 New Haven New Haven-Bridgprt-Stamfrd-Danbry-Wtrbry, CT 66,439 891,426 8.1% 62,921 824,9879011 New London New London-Norwich, CT 22,822 282,282 8.8% 20,232 259,460
22103 St. Tammany New Orleans, LA 45,235 237,499 23.5% 80,281 192,26422051 Jefferson New Orleans, LA -6,804 447,893 -1.5% -1,344 454,69722071 Orleans New Orleans, LA -18,296 465,271 -3.8% -74,990 483,56722093 St. James New Orleans, LA -21,194 0 -100.0% -370 21,19422075 Plaquemines New Orleans, LA -26,746 0 -100.0% 645 26,74622095 St. John the Baptist New Orleans, LA -39,592 3,547 -91.8% 10,852 43,13922087 St. Bernard New Orleans, LA -47,531 19,484 -70.9% 2,620 67,01522089 St. Charles New Orleans, LA -48,196 0 -100.0% 10,713 48,19636081 Queens New York, NY 610,051 2,840,947 27.3% 336,600 2,230,89636047 Kings New York, NY 413,431 2,879,690 16.8% 232,473 2,466,25936005 Bronx New York, NY 297,217 1,631,465 22.3% 165,845 1,334,24836061 New York New York, NY 212,669 1,752,938 13.8% 111,898 1,540,26936085 Richmond New York, NY 149,100 594,506 33.5% 92,385 445,40636119 Westchester New York, NY 147,890 1,073,816 16.0% 58,999 925,92636087 Rockland New York, NY 84,555 371,990 29.4% 27,900 287,43536079 Putnam New York, NY 54,367 150,485 56.6% 18,713 96,11834027 Morris Newark, NJ 153,386 624,756 32.5% 63,169 471,37034039 Union Newark, NJ 146,132 669,296 27.9% 18,769 523,16434013 Essex Newark, NJ 113,454 905,882 14.3% -56,948 792,42834041 Warren Newark, NJ 43,049 146,023 41.8% 18,385 102,97434037 Sussex Newark, NJ 35,962 180,636 24.9% 28,087 144,67436071 Orange Newburgh, NY-PA 63,544 406,572 18.5% 82,516 343,02842103 Pike Newburgh, NY-PA 19,325 65,974 41.4% 28,273 46,64951550 Chesapeake (Independent City) Norfolk-Virginia Beach-Newport News, VA-NC 97,883 298,329 48.8% 85,513 200,44651810 Virginia Beach (Independent City) Norfolk-Virginia Beach-Newport News, VA-NC 61,760 488,425 14.5% 161,844 426,66551800 Suffolk (Independent City) Norfolk-Virginia Beach-Newport News, VA-NC 26,207 90,452 40.8% 16,641 64,24537053 Currituck Norfolk-Virginia Beach-Newport News, VA-NC 22,483 40,823 122.6% 7,225 18,34051093 Isle of Wight Norfolk-Virginia Beach-Newport News, VA-NC 15,813 45,696 52.9% 8,264 29,88351115 Mathews Norfolk-Virginia Beach-Newport News, VA-NC 3,994 13,199 43.4% 1,189 9,20551073 Gloucester Norfolk-Virginia Beach-Newport News, VA-NC 1,904 36,785 5.5% 14,617 34,8816001 Alameda Oakland, CA 412,117 1,862,524 28.4% 340,476 1,450,4076013 Contra Costa Oakland, CA 358,894 1,312,457 37.6% 294,780 953,563
12083 Marion Ocala, FL 126,184 386,474 48.5% 136,072 260,290

48135 Ector Odessa-Midland, TX 60,004 180,707 49.7% 3,651 120,70348329 Midland Odessa-Midland, TX 53,642 169,171 46.4% 31,572 115,52940109 Oklahoma Oklahoma City, OK 118,044 779,633 17.8% 89,951 661,58940027 Cleveland Oklahoma City, OK 53,695 262,057 25.8% 73,860 208,36240017 Canadian Oklahoma City, OK 27,256 115,456 30.9% 30,995 88,20040087 McClain Oklahoma City, OK 8,418 36,265 30.2% 7,435 27,84740083 Logan Oklahoma City, OK -9,602 24,350 -28.3% 6,916 33,95240125 Pottawatomie Oklahoma City, OK -21,169 44,531 -32.2% 10,045 65,70053067 Thurston Olympia, WA 42,768 251,132 20.5% 83,039 208,36431055 Douglas Omaha, NE-IA 113,508 578,014 24.4% 66,930 464,50631153 Sarpy Omaha, NE-IA 62,846 186,037 51.0% 36,663 123,19119155 Pottawattamie Omaha, NE-IA 32,452 120,431 36.9% 1,428 87,97931025 Cass Omaha, NE-IA 23,344 47,742 95.7% 4,095 24,39831177 Washington Omaha, NE-IA 12,790 31,587 68.0% 3,254 18,7976059 Orange Orange County, CA 853,954 3,710,400 29.9% 908,379 2,856,446
12095 Orange Orlando, FL 433,910 1,336,228 48.1% 427,576 902,31812097 Osceola Orlando, FL 197,558 371,727 113.4% 123,535 174,16912117 Seminole Orlando, FL 179,452 546,462 48.9% 185,042 367,01012069 Lake Orlando, FL 121,889 334,717 57.3% 106,947 212,82821059 Daviess Owensboro, KY -3,181 88,423 -3.5% 5,512 91,60412005 Bay Panama City, FL 36,533 184,776 24.6% 49,925 148,24354107 Wood Parkersburg-Marietta, WV-OH -2,339 85,552 -2.7% -5,719 87,89139167 Washington Parkersburg-Marietta, WV-OH -13,607 49,574 -21.5% -1,057 63,18112113 Santa Rosa Pensacola, FL 76,584 195,059 64.6% 61,872 118,47412033 Escambia Pensacola, FL 48,497 342,774 16.5% 59,049 294,27717179 Tazewell Peoria-Pekin, IL 22,752 151,227 17.7% -3,566 128,47517143 Peoria Peoria-Pekin, IL 22,635 205,843 12.4% -17,237 183,20817203 Woodford Peoria-Pekin, IL 2,947 38,450 8.3% 2,087 35,50342091 Montgomery Philadelphia, PA-NJ 150,097 901,053 20.0% 106,501 750,95642029 Chester Philadelphia, PA-NJ 115,493 551,241 26.5% 117,728 435,74842017 Bucks Philadelphia, PA-NJ 113,723 713,111 19.0% 118,364 599,38834005 Burlington Philadelphia, PA-NJ 93,862 518,507 22.1% 61,031 424,64534015 Gloucester Philadelphia, PA-NJ 68,544 323,851 26.8% 54,800 255,30734007 Camden Philadelphia, PA-NJ 58,274 566,979 11.5% 35,915 508,70542045 Delaware Philadelphia, PA-NJ 41,766 593,919 7.6% -2,256 552,15334033 Salem Philadelphia, PA-NJ -16,298 47,925 -25.4% -424 64,22342101 Philadelphia Philadelphia, PA-NJ -21,309 1,492,375 -1.4% -171,750 1,513,684

4013 Maricopa Phoenix-Mesa, AZ 1,547,026 4,643,369 50.0% 1,575,503 3,096,3434021 Pinal Phoenix-Mesa, AZ 192,012 373,444 105.8% 90,090 181,4325069 Jefferson Pine Bluff, AR -7,693 76,526 -9.1% -6,503 84,219
42019 Butler Pittsburgh, PA 25,336 199,906 14.5% 26,471 174,57042051 Fayette Pittsburgh, PA -401 148,096 -0.3% -10,588 148,49742129 Westmoreland Pittsburgh, PA -8,249 361,519 -2.2% -22,526 369,76842125 Washington Pittsburgh, PA -9,654 193,357 -4.8% -13,947 203,01142007 Beaver Pittsburgh, PA -19,552 161,589 -10.8% -22,860 181,14142003 Allegheny Pittsburgh, PA -48,588 1,231,395 -3.8% -168,271 1,279,98225003 Berkshire Pittsfield, MA -2,750 132,059 -2.0% -10,272 134,80916005 Bannock Pocatello, ID 20,306 95,888 26.9% 9,932 75,58223005 Cumberland Portland, ME 28,451 294,410 10.7% 49,563 265,95941067 Washington Portland-Vancouver, OR-WA 266,919 715,361 59.5% 200,680 448,44253011 Clark Portland-Vancouver, OR-WA 192,723 540,216 55.5% 154,263 347,49341051 Multnomah Portland-Vancouver, OR-WA 186,382 847,774 28.2% 97,786 661,39241005 Clackamas Portland-Vancouver, OR-WA 134,489 474,065 39.6% 96,719 339,57641071 Yamhill Portland-Vancouver, OR-WA 47,808 133,092 56.1% 29,652 85,28441009 Columbia Portland-Vancouver, OR-WA 6,400 50,070 14.7% 7,947 43,67044007 Providence Providence-Warwick-Pawtucket, RI 83,675 706,414 13.4% 50,259 622,73944001 Bristol Providence-Warwick-Pawtucket, RI 30,248 80,985 59.6% 3,910 50,73744003 Kent Providence-Warwick-Pawtucket, RI 27,163 194,663 16.2% 13,281 167,50044009 Washington Providence-Warwick-Pawtucket, RI 26,788 150,801 21.6% 30,419 124,01349049 Utah Provo-Orem, UT 160,268 531,128 43.2% 150,967 370,8608101 Pueblo Pueblo, CO 81,719 223,557 57.6% 15,826 141,838
12015 Charlotte Punta Gorda, FL 36,808 179,076 25.9% 82,796 142,26855101 Racine Racine, WI 29,126 218,111 15.4% 16,006 188,98537183 Wake Raleigh-Durham-Chapel Hill, NC 392,122 1,025,270 61.9% 329,792 633,14837063 Durham Raleigh-Durham-Chapel Hill, NC 129,104 353,647 57.5% 71,707 224,54337101 Johnston Raleigh-Durham-Chapel Hill, NC 127,335 250,626 103.3% 52,482 123,29137037 Chatham Raleigh-Durham-Chapel Hill, NC 70,353 120,062 141.5% 16,160 49,70937135 Orange Raleigh-Durham-Chapel Hill, NC 69,053 185,066 59.5% 38,747 116,01337069 Franklin Raleigh-Durham-Chapel Hill, NC 49,429 97,031 103.8% 17,462 47,60246103 Pennington Rapid City, SD 788 89,559 0.9% 18,287 88,77142011 Berks Reading, PA 67,888 442,355 18.1% 61,451 374,4676089 Shasta Redding, CA 8,631 172,457 5.3% 47,236 163,826
32031 Washoe Reno, NV 259,487 600,804 76.0% 145,945 341,31753021 Franklin Richland-Kennewick-Pasco, WA 115,505 165,060 233.1% 14,292 49,555
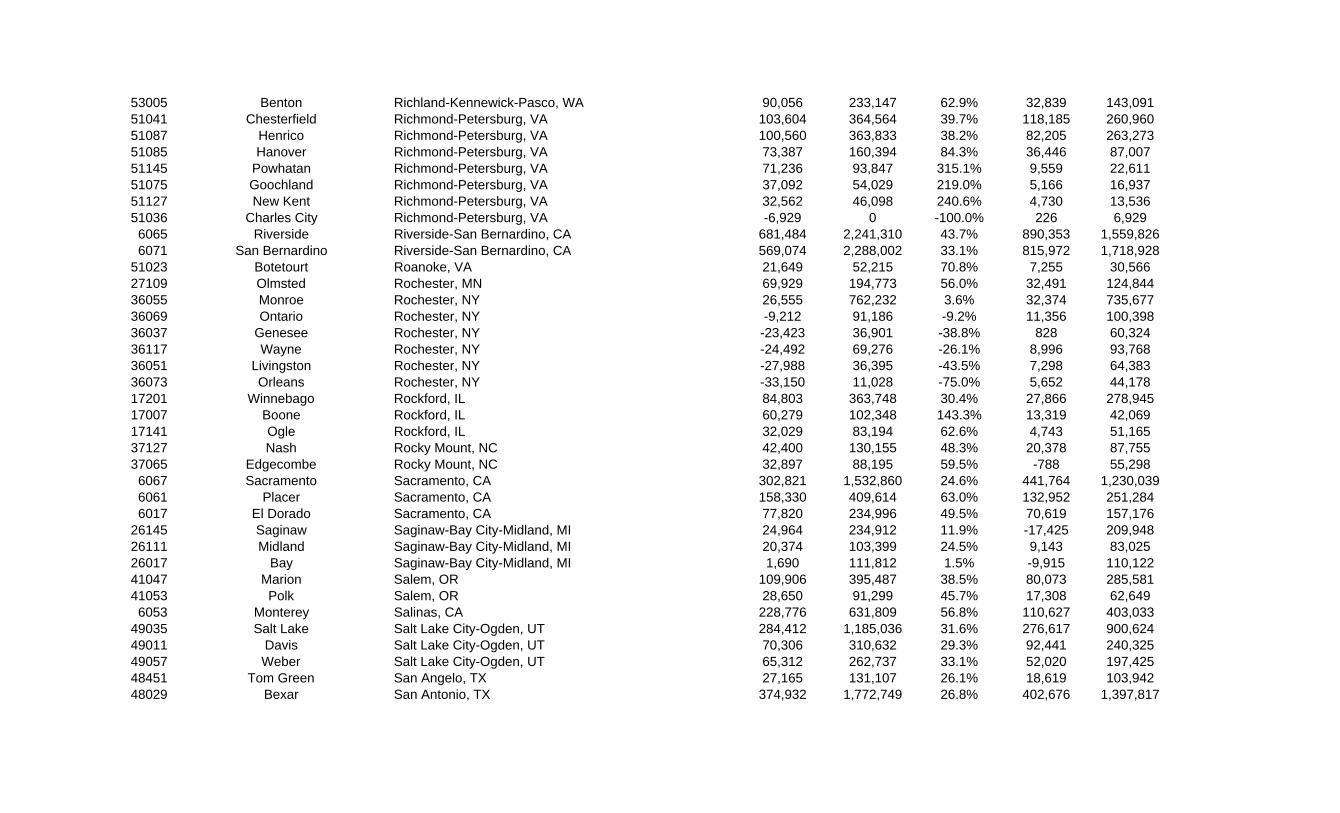
53005 Benton Richland-Kennewick-Pasco, WA 90,056 233,147 62.9% 32,839 143,09151041 Chesterfield Richmond-Petersburg, VA 103,604 364,564 39.7% 118,185 260,96051087 Henrico Richmond-Petersburg, VA 100,560 363,833 38.2% 82,205 263,27351085 Hanover Richmond-Petersburg, VA 73,387 160,394 84.3% 36,446 87,00751145 Powhatan Richmond-Petersburg, VA 71,236 93,847 315.1% 9,559 22,61151075 Goochland Richmond-Petersburg, VA 37,092 54,029 219.0% 5,166 16,93751127 New Kent Richmond-Petersburg, VA 32,562 46,098 240.6% 4,730 13,53651036 Charles City Richmond-Petersburg, VA -6,929 0 -100.0% 226 6,9296065 Riverside Riverside-San Bernardino, CA 681,484 2,241,310 43.7% 890,353 1,559,8266071 San Bernardino Riverside-San Bernardino, CA 569,074 2,288,002 33.1% 815,972 1,718,928
51023 Botetourt Roanoke, VA 21,649 52,215 70.8% 7,255 30,56627109 Olmsted Rochester, MN 69,929 194,773 56.0% 32,491 124,84436055 Monroe Rochester, NY 26,555 762,232 3.6% 32,374 735,67736069 Ontario Rochester, NY -9,212 91,186 -9.2% 11,356 100,39836037 Genesee Rochester, NY -23,423 36,901 -38.8% 828 60,32436117 Wayne Rochester, NY -24,492 69,276 -26.1% 8,996 93,76836051 Livingston Rochester, NY -27,988 36,395 -43.5% 7,298 64,38336073 Orleans Rochester, NY -33,150 11,028 -75.0% 5,652 44,17817201 Winnebago Rockford, IL 84,803 363,748 30.4% 27,866 278,94517007 Boone Rockford, IL 60,279 102,348 143.3% 13,319 42,06917141 Ogle Rockford, IL 32,029 83,194 62.6% 4,743 51,16537127 Nash Rocky Mount, NC 42,400 130,155 48.3% 20,378 87,75537065 Edgecombe Rocky Mount, NC 32,897 88,195 59.5% -788 55,2986067 Sacramento Sacramento, CA 302,821 1,532,860 24.6% 441,764 1,230,0396061 Placer Sacramento, CA 158,330 409,614 63.0% 132,952 251,2846017 El Dorado Sacramento, CA 77,820 234,996 49.5% 70,619 157,176
26145 Saginaw Saginaw-Bay City-Midland, MI 24,964 234,912 11.9% -17,425 209,94826111 Midland Saginaw-Bay City-Midland, MI 20,374 103,399 24.5% 9,143 83,02526017 Bay Saginaw-Bay City-Midland, MI 1,690 111,812 1.5% -9,915 110,12241047 Marion Salem, OR 109,906 395,487 38.5% 80,073 285,58141053 Polk Salem, OR 28,650 91,299 45.7% 17,308 62,6496053 Monterey Salinas, CA 228,776 631,809 56.8% 110,627 403,033
49035 Salt Lake Salt Lake City-Ogden, UT 284,412 1,185,036 31.6% 276,617 900,62449011 Davis Salt Lake City-Ogden, UT 70,306 310,632 29.3% 92,441 240,32549057 Weber Salt Lake City-Ogden, UT 65,312 262,737 33.1% 52,020 197,42548451 Tom Green San Angelo, TX 27,165 131,107 26.1% 18,619 103,94248029 Bexar San Antonio, TX 374,932 1,772,749 26.8% 402,676 1,397,817

48187 Guadalupe San Antonio, TX 73,332 163,217 81.6% 42,793 89,88548091 Comal San Antonio, TX 68,354 147,142 86.8% 42,069 78,78848493 Wilson San Antonio, TX 44,042 76,755 134.6% 15,894 32,7136073 San Diego San Diego, CA 634,780 3,459,858 22.5% 949,458 2,825,0786075 San Francisco San Francisco, CA 315,630 1,092,232 40.6% 95,772 776,6026081 San Mateo San Francisco, CA 292,084 1,000,422 41.2% 119,896 708,3386041 Marin San Francisco, CA 168,590 416,201 68.1% 24,667 247,6116085 Santa Clara San Jose, CA 497,900 2,184,374 29.5% 384,959 1,686,4746079 San Luis Obispo San Luis Obispo-Atascadero-Paso Robles, CA 96,291 343,969 38.9% 90,892 247,6786083 Santa Barbara Santa Barbara-Santa Maria-Lompoc, CA 170,907 570,653 42.8% 99,555 399,7466087 Santa Cruz Santa Cruz-Watsonville, CA 156,829 412,611 61.3% 66,477 255,782
35049 Santa Fe Santa Fe, NM 152,538 282,353 117.5% 53,943 129,81535028 Los Alamos Santa Fe, NM 71,587 89,882 391.3% 703 18,2956097 Sonoma Santa Rosa, CA 200,535 660,873 43.6% 158,752 460,338
12081 Manatee Sarasota-Bradenton, FL 100,606 366,310 37.9% 115,442 265,70412115 Sarasota Sarasota-Bradenton, FL 96,613 423,625 29.5% 122,550 327,01213103 Effingham Savannah, GA 55,893 93,695 147.9% 19,409 37,80213051 Chatham Savannah, GA 33,331 265,305 14.4% 28,933 231,97413029 Bryan Savannah, GA 30,019 53,557 127.5% 13,281 23,53842079 Luzerne Scranton-Wilkes-Barre-Hazleton, PA -13,730 304,849 -4.3% -24,056 318,57942131 Wyoming Scranton-Wilkes-Barre-Hazleton, PA -14,910 13,114 -53.2% 1,571 28,02442069 Lackawanna Scranton-Wilkes-Barre-Hazleton, PA -17,099 195,805 -8.0% -15,029 212,90442037 Columbia Scranton-Wilkes-Barre-Hazleton, PA -26,520 37,585 -41.4% 2,036 64,10553033 King Seattle-Bellevue-Everett, WA 424,664 2,163,580 24.4% 462,391 1,738,91653061 Snohomish Seattle-Bellevue-Everett, WA 238,509 847,677 39.2% 268,623 609,16853029 Island Seattle-Bellevue-Everett, WA 4,726 76,569 6.6% 27,534 71,84342085 Mercer Sharon, PA -32,073 88,113 -26.7% -8,019 120,18655117 Sheboygan Sheboygan, WI 13,685 126,439 12.1% 11,847 112,75448181 Grayson Sherman-Denison, TX 28,292 139,304 25.5% 20,894 111,01222015 Bossier Shreveport-Bossier City, LA 10,320 108,935 10.5% 17,330 98,61522017 Caddo Shreveport-Bossier City, LA -4,373 247,559 -1.7% -1,069 251,93222119 Webster Shreveport-Bossier City, LA -29,886 11,849 -71.6% -1,923 41,73531043 Dakota Sioux City, IA-NE 76,115 96,393 375.4% 3,646 20,27819193 Woodbury Sioux City, IA-NE 50,740 154,589 48.9% 2,856 103,84946099 Minnehaha Sioux Falls, SD 51,965 200,954 34.9% 39,352 148,98946083 Lincoln Sioux Falls, SD 38,845 63,394 158.2% 10,615 24,54918141 St. Joseph South Bend, IN 40,572 306,433 15.3% 24,509 265,861

53063 Spokane Spokane, WA 118,094 536,767 28.2% 75,734 418,67317167 Sangamon Springfield, IL 45,695 234,745 24.2% 12,988 189,05017129 Menard Springfield, IL 9,465 21,979 75.6% 796 12,51425013 Hampden Springfield, MA 14,845 471,332 3.3% 12,877 456,48725015 Hampshire Springfield, MA 2,477 154,939 1.6% 13,380 152,46229043 Christian Springfield, MO 47,996 102,947 87.3% 32,490 54,95129077 Greene Springfield, MO 32,971 273,596 13.7% 54,969 240,62529225 Webster Springfield, MO 3,079 34,328 9.9% 10,783 31,24927145 Stearns St. Cloud, MN 17,641 151,235 13.2% 25,131 133,59427009 Benton St. Cloud, MN 2,742 37,224 8.0% 9,163 34,48229021 Buchanan St. Joseph, MO -16,049 70,002 -18.7% -1,681 86,05129003 Andrew St. Joseph, MO -16,536 0 -100.0% 2,520 16,53629183 St. Charles St. Louis, MO-IL 119,526 405,690 41.8% 140,914 286,16429189 St. Louis St. Louis, MO-IL 63,571 1,079,951 6.3% 41,420 1,016,38029099 Jefferson St. Louis, MO-IL 53,262 252,056 26.8% 52,121 198,79417119 Madison St. Louis, MO-IL 40,149 299,247 15.5% 11,539 259,09817133 Monroe St. Louis, MO-IL 33,375 61,142 120.2% 7,573 27,76717163 St. Clair St. Louis, MO-IL 19,079 275,337 7.4% -11,272 256,25817083 Jersey St. Louis, MO-IL 14,039 35,708 64.8% 1,071 21,66929113 Lincoln St. Louis, MO-IL 13,249 52,506 33.8% 17,028 39,25729071 Franklin St. Louis, MO-IL 11,899 105,962 12.7% 22,709 94,06317027 Clinton St. Louis, MO-IL 10,960 46,516 30.8% 2,718 35,55629219 Warren St. Louis, MO-IL -7,695 17,041 -31.1% 9,712 24,73629510 St. Louis (Independent City) St. Louis, MO-IL -33,793 312,975 -9.7% -104,344 346,76842027 Centre State College, PA -1,221 134,758 -0.9% 22,848 135,97954029 Hancock Steubenville-Weirton, OH-WV -186 32,436 -0.6% -8,339 32,62254009 Brooke Steubenville-Weirton, OH-WV -4,477 20,894 -17.6% -5,711 25,37139081 Jefferson Steubenville-Weirton, OH-WV -16,288 57,390 -22.1% -17,624 73,6786077 San Joaquin Stockton-Lodi, CA 268,931 837,094 47.3% 217,859 568,163
45085 Sumter Sumter, SC 29,953 134,694 28.6% 16,005 104,74136067 Onondaga Syracuse, NY -24,414 434,030 -5.3% -5,288 458,44436053 Madison Syracuse, NY -36,066 33,378 -51.9% 4,187 69,44436011 Cayuga Syracuse, NY -56,550 25,388 -69.0% 1,986 81,93836075 Oswego Syracuse, NY -62,809 59,728 -51.3% 8,762 122,53753053 Pierce Tacoma, WA 151,866 855,827 21.6% 215,207 703,96112073 Leon Tallahassee, FL 114,644 354,669 47.8% 90,233 240,02512039 Gadsden Tallahassee, FL 54,783 99,836 121.6% 3,300 45,053

12057 Hillsborough Tampa-St. Petersburg-Clearwater, FL 321,649 1,324,731 32.1% 351,249 1,003,08212103 Pinellas Tampa-St. Petersburg-Clearwater, FL 143,785 1,065,993 15.6% 189,341 922,20812101 Pasco Tampa-St. Petersburg-Clearwater, FL 97,293 444,648 28.0% 150,795 347,35512053 Hernando Tampa-St. Petersburg-Clearwater, FL 24,965 156,457 19.0% 85,777 131,49218167 Vigo Terre Haute, IN 17,407 123,125 16.5% -6,530 105,71818165 Vermillion Terre Haute, IN 9,649 26,427 57.5% -1,474 16,77818021 Clay Terre Haute, IN 5,801 32,359 21.8% 1,757 26,5585091 Miller Texarkana, TX-Texarkana AR 6,539 46,988 16.2% 2,580 40,449
48037 Bowie Texarkana, TX-Texarkana AR 3,077 92,360 3.4% 13,773 89,28339051 Fulton Toledo, OH 15,265 57,408 36.2% 4,366 42,14339173 Wood Toledo, OH 10,702 131,910 8.8% 13,465 121,20839095 Lucas Toledo, OH 9,800 464,693 2.2% -16,751 454,89320177 Shawnee Topeka, KS 28,967 199,014 17.0% 14,913 170,04734021 Mercer Trenton, NJ 113,600 465,180 32.3% 43,784 351,5804019 Pima Tucson, AZ 380,615 1,229,259 44.8% 312,864 848,644
40143 Tulsa Tulsa, OK 92,864 656,606 16.5% 90,543 563,74240131 Rogers Tulsa, OK 9,126 80,487 12.8% 24,507 71,36140145 Wagoner Tulsa, OK 536 58,269 0.9% 15,587 57,73340113 Osage Tulsa, OK -5,170 39,377 -11.6% 5,149 44,54740037 Creek Tulsa, OK -6,959 60,594 -10.3% 8,149 67,5531125 Tuscaloosa Tuscaloosa, AL 5,708 170,773 3.5% 27,234 165,065
48423 Smith Tyler, TX 51,100 226,508 29.1% 46,092 175,40836065 Oneida Utica-Rome, NY -36,758 198,450 -15.6% -18,352 235,20836043 Herkimer Utica-Rome, NY -59,174 5,217 -91.9% -2,272 64,3916095 Solano Vallejo-Fairfield-Napa, CA 178,982 576,148 45.1% 159,710 397,1666055 Napa Vallejo-Fairfield-Napa, CA 152,272 276,858 122.2% 25,255 124,5866111 Ventura Ventura, CA 269,157 1,025,782 35.6% 223,798 756,625
48469 Victoria Victoria, TX 19,492 103,509 23.2% 14,640 84,01734011 Cumberland Vineland-Millville-Bridgeton, NJ 33,559 179,933 22.9% 13,286 146,3746107 Tulare Visalia-Tulare-Porterville, CA 174,369 543,214 47.3% 121,419 368,845
48309 McLennan Waco, TX 48,814 262,815 22.8% 42,547 214,00124031 Montgomery Washington, DC-MD-VA-WV 326,464 1,204,245 37.2% 295,728 877,78151107 Loudoun Washington, DC-MD-VA-WV 230,667 404,607 132.6% 116,175 173,94024033 Prince George's Washington, DC-MD-VA-WV 209,605 1,013,254 26.1% 137,280 803,64951013 Arlington Washington, DC-MD-VA-WV 176,822 366,145 93.4% 35,960 189,32324021 Frederick Washington, DC-MD-VA-WV 102,482 299,077 52.1% 80,889 196,59551179 Stafford Washington, DC-MD-VA-WV 63,448 157,067 67.8% 52,907 93,619

24009 Calvert Washington, DC-MD-VA-WV 53,916 129,107 71.7% 40,307 75,19111001 District of Columbia Washington, DC-MD-VA-WV 43,635 615,072 7.6% -66,847 571,43724017 Charles Washington, DC-MD-VA-WV 40,613 161,894 33.5% 47,815 121,28151061 Fauquier Washington, DC-MD-VA-WV 38,174 93,743 68.7% 19,499 55,56954003 Berkeley Washington, DC-MD-VA-WV 32,718 109,148 42.8% 29,435 76,43051047 Culpeper Washington, DC-MD-VA-WV 21,578 56,070 62.6% 11,770 34,49254037 Jefferson Washington, DC-MD-VA-WV 18,009 60,453 42.4% 12,010 42,44451187 Warren Washington, DC-MD-VA-WV 16,350 48,069 51.5% 10,463 31,71951043 Clarke Washington, DC-MD-VA-WV 16,174 28,883 127.3% 2,708 12,70951099 King George Washington, DC-MD-VA-WV -1,040 15,847 -6.2% 6,338 16,88719013 Black Hawk Waterloo-Cedar Falls, IA 26,620 154,522 20.8% -10,111 127,90255073 Marathon Wausau, WI 18,751 144,653 14.9% 14,656 125,90212099 Palm Beach West Palm Beach-Boca Raton, FL 466,127 1,601,782 41.0% 549,913 1,135,65554051 Marshall Wheeling, WV-OH -12,423 22,974 -35.1% -6,135 35,39754069 Ohio Wheeling, WV-OH -26,563 20,771 -56.1% -14,010 47,33439013 Belmont Wheeling, WV-OH -34,829 35,290 -49.7% -12,345 70,11948485 Wichita Wichita Falls, TX 31,990 163,348 24.4% 9,792 131,35848009 Archer Wichita Falls, TX -8,974 0 -100.0% 1,650 8,97420173 Sedgwick Wichita, KS 116,876 570,339 25.8% 84,759 453,46320015 Butler Wichita, KS 22,614 82,304 37.9% 14,623 59,69020079 Harvey Wichita, KS 5,166 38,046 15.7% 2,254 32,88042081 Lycoming Williamsport, PA 1,433 121,368 1.2% 1,664 119,93537129 New Hanover Wilmington, NC 77,168 237,831 48.0% 56,751 160,66337019 Brunswick Wilmington, NC 39,776 113,526 53.9% 37,676 73,75010003 New Castle Wilmington-Newark, DE-MD 124,523 626,373 24.8% 103,322 501,85024015 Cecil Wilmington-Newark, DE-MD 31,559 118,027 36.5% 25,878 86,46853077 Yakima Yakima, WA 122,911 345,620 55.2% 49,591 222,7096113 Yolo Yolo, CA 167,084 336,850 98.4% 55,975 169,766
42133 York York, PA 76,931 459,651 20.1% 69,121 382,72039155 Trumbull Youngstown-Warren, OH 6,347 231,288 2.8% -16,765 224,94139029 Columbiana Youngstown-Warren, OH -2,063 110,039 -1.8% -1,326 112,10239099 Mahoning Youngstown-Warren, OH -15,058 241,986 -5.9% -31,645 257,0446101 Sutter Yuba City, CA 108,149 187,317 136.6% 26,588 79,1686115 Yuba Yuba City, CA 53,172 113,512 88.1% 10,532 60,3404027 Yuma Yuma, AZ 236,192 396,899 147.0% 69,314 160,707