forecasting fine grained air quality based on big data
TRANSCRIPT

Forecasting Fine-Grained Air Quality Based on Big Data
Yu ZhengSouthwest Jiaotong University, China
SIGKDD’ 15
2015/8/14(Mon.)Chang Wei-Yuan @ MakeLab Lab Meeting
Keywords: Urban computing; urban air; air quality forecast; big data

Outline• Introduction• Data Description• Methodology• Evaluation• Conclusion
2

Introduction• People are concerned with air pollution
increasingly– human health and sustainable development
• Air quality monitoring data– inform people about urban air quality– predict of future air quality
3

Challenges• Multiple complex factors• Insufficient and inaccurate data• Urban air changes over location and time
significantly• Inflection points and sudden changes
4

Goal• This paper want to forecast Fine-Grained
air quality using a hybrid predictive model– air quality data the station and its nearby
stations– current meteorological data– weather forecasts
5

Goal• This paper want to forecast Fine-Grained
air quality using a hybrid predictive model– Spatial granularity• for each air quality monitoring station
– Temporal granularity• For each hour in the first 6 coming hours• A max-min range for 7-12, 13-24, and 25-48
6

Data Description– Air quality data with hourly• NO2, SO2, O3, CO, PM2.5 and PM10• 2,296 stations in Chinese cities updates
– Meteorological data with hourly• sunny/cloudy/overcast/foggy/snowy/ rainy,
temperature, humidity, and wind speed• 3,514 district-level stations
– Weather forecasts next three days forecast • 2,612 cities/districts
7

Methodology: SA• System Architecture
8

Methodology: Framework• Predictive Model
9
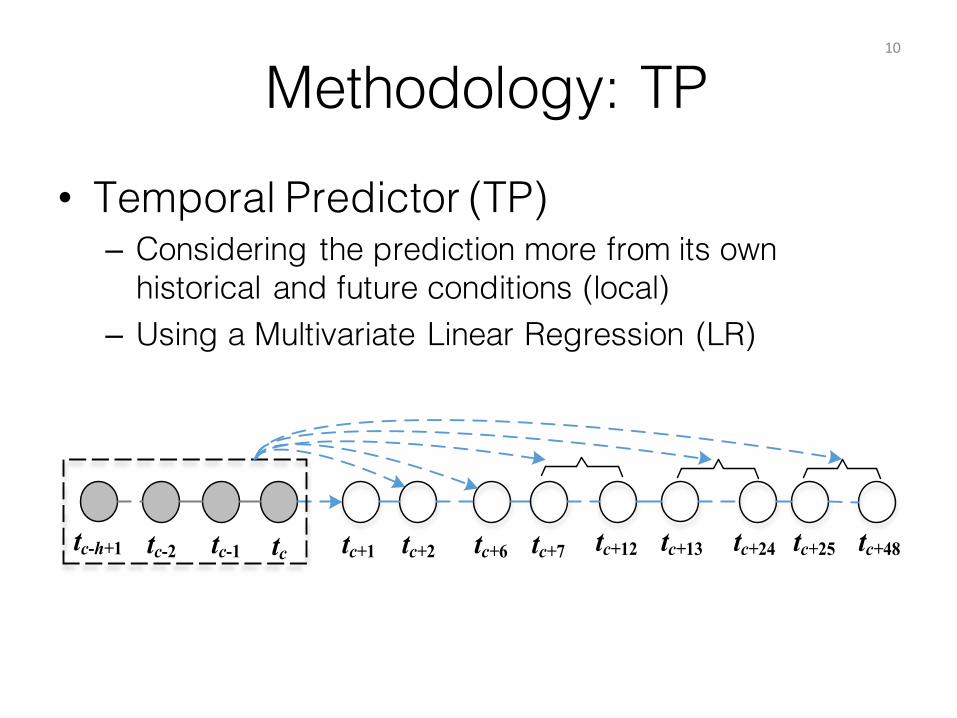
Methodology: TP• Temporal Predictor (TP)– Considering the prediction more from its own
historical and future conditions (local)– Using a Multivariate Linear Regression (LR)
10
tc-1 tctc-2tc-h+1 tc+1 tc+6tc+2 tc+7 tc+12 tc+24 tc+48tc+13 tc+25

Methodology: TP• Temporal Predictor (TP)– Feature• 1) the AQIs in the past at the station• 2) the local meteorology at the current time • 3) time of day and day of the week• 4) the weather forecasts of the time interval we are
going to predict– Note• not conduct an iterative moving prediction
11

Methodology: SP• Spatial Predictor (SP)
– Modeling the spatial correlation of air pollution– Predicting the air quality from other locations’ points of view– External stations are sensors sending signals to the SP
12
M1
AQI1
∆AQI
ANN
w'11
w'qr
w1
wr
wpq
w11b1
bq
b'r
b'1
b''
M2
AQI2
Mn
AQIn
Day
tctc-1 tctc-2 tc+1 tc+wtc+2
tc-1
tc
tc-2
tc-1
tc
tc-2
tc-1
tc
tc-2
A) Spatial partition B) Spatial aggregation
C) Prediction paradigm D) Structure of the model
S

Methodology: SP• Features of SP– For each non-empty region 𝑖 of the current time 𝑡#– the AQI of the past three hours (𝑨𝑸𝑰') – meteorological features (𝑀')
13
M1
AQI1
∆AQI
ANN
w'11
w'qr
w1
wr
wpq
w11b1
bq
b'r
b'1
b''
M2
AQI2
Mn
AQIn
Day
tctc-1 tctc-2 tc+1 tc+wtc+2
tc-1
tc
tc-2
tc-1
tc
tc-2
tc-1
tc
tc-2
A) Spatial partition B) Spatial aggregation
C) Prediction paradigm D) Structure of the model
S

Methodology: PA• Regression Tree
– Spatial and local predictions– Meteorological features: the wind speed, direction, humidity,
and sunny/cloudy/overcast/foggy– Predict ∆𝐴𝑄𝐼
14
Spatial
≤ 0.003 >0.003
Temporal
≤ -0.001
Foggy
Humidity
=1
≤ 54.5≤ 6.62 >6.62
LM2 LM3
>-0.001
LM5
Temporal
LM4
≤ -0.08 >-0.08
Spatial
Wind speed
>-0.14≤ -0.14
LM1 LM8
=0
LM7
>54.5
LM6
LM 3: ∆AQI = 0.666×Spatial + 0.1627×Temporal + 0.001×isSunnyCloudyOvercast + 0.002×Foggy - 0.001×Wind_Dir_SE - 0.022×Wind_Dir_NE - 0.003×WinSpeed - 0.0003×Humidity - 0.0452
LM 2: ∆AQI = 0.186×Spatial+2.52×Temporal+ 0.001×SunnyCloudyOvercast + 0.002×Foggy-0.001×Wind_Dir_SE - 0.09×Wind_Dir_NE - 0.007×WinSpeed - 0.001×Humidity + 0.399

Methodology: IP• Inflection Predictor (IP)– Sudden changes are very important – Too infrequent to be predicted
• Four steps– Step 1. Select the sudden drop instances D. from historical data– Step 2. Find surpassing ranges and categories– Step 3. Select surpassing ranges and categories as thresholds – Step 4. Train an inflection predictor with D/
15

Evaluation• This paper focuses the evaluation on
PM2.5 since it is the most reported air pollutant.– Datasets: Beijing, Tianjin, Guangzhou, Shenzhen– Time span: one year from 2014/5/1 to 2015/4/30
16

Results
2014-11-15 03 2014-11-27 08 2014-12-07 22 2014-12-18 17 2014-12-29 13
0
100
200
300
400
500
PM2.5 AQI
DateTime
Prediction Ground Truth
2014-11-14 01 2014-11-25 22 2014-12-06 23 2014-12-17 23 2014-12-28 200
50
100
150
PM2.5 AQI
DateTime
Prediction Ground Truth
B) 6-hour PM2.5prediction of Dazhigu Station in Tianjin
C) 6-hour PM2.5 prediction of Nanyou station in Shenzhen D) 7-12 hours PM2.5 prediction at HaidianWanliu in Beijing
2014-11-14 18 2014-11-26 16 2014-12-07 08 2014-12-18 09 2014-12-29 20
0
100
200
300
400
500
PM2.5 AQI
DateTime
Prediction Ground Truth
A) 6-hour PM2.5 prediction of HaidianWanliu Station, Beijing

Results
Time 1-‐6h 7-‐12h 13-‐24h 25-‐48h Sudden Changes
Cities 𝒑 𝒆 𝒑 𝒆 𝒑 𝒆 𝒑 𝒆 𝒑 𝒆
Beijing 0.750 30 0.62 64 0.53 78.3 0.496 81.1 0.300 78.3
Tianjin 0.746 31 0.634 62.1 0.595 67.4 0.579 68.6 0.437 70.9
Guangzhou 0.805 13 0.748 23.9 0.714 26.8 0.681 29.5 0.477 54.6
Shenzhen 0.838 8.4 0.764 17.6 0.728 20 0.689 22.8 0.575 45.3
𝑝 = 1 −∑ |𝑦'9 − 𝑦'|'
∑ 𝑦''𝑒 = ∑ |;<=>;<|<
?.

Results19

Conclusion• This paper proposes a real-time air quality
forecasting system that uses data-driven models to predict fine-grained air quality over the following 48 hours.
• It uses a multi-view-based hybrid model which combines the spatial and temporal predictions dynamically according to weather conditions.
20