forecasting stock exchange data using group method of data
TRANSCRIPT

Knowledge Engineering and Data Science (KEDS) pISSN 2597-4602
Vol 4, No 1, July 2021, pp. 1–13 eISSN 2597-4637
https://doi.org/10.17977/um018v4i12021p1-13
©2021 Knowledge Engineering and Data Science | W : http://journal2.um.ac.id/index.php/keds | E : [email protected]
This is an open access article under the CC BY-SA license (https://creativecommons.org/licenses/by-sa/4.0/)
KEDS is Sinta 2 Journal (https://sinta.ristekbrin.go.id/journals/detail?id=6662) accredited by Indonesian Ministry of Research & Technology
Forecasting Stock Exchange Data using Group Method
of Data Handling Neural Network Approach
Marzieh Faridi Masouleh a, 1, *, Ahmad Bagheri b, 2
a Department of Computer Engineering, Ahrar Institute of Technology and Higher Education
Rasht, km 4 Rasht-Lakan road, Seyed Ahmad Khomeini, Guilan, Iran
b Department of Dynamics, Control, and Vibrations, Faculty of Mechanical Engineering, University of Guilan
5th Kilometer of Persian Gulf Highway, Rasht, Guilan, Iran
1 [email protected] *; 2 [email protected]
* corresponding author
I. Introduction
In economics, there are several definitions for the market. Primarily, market refers to a physical place where sellers and buyers come together to exchange goods and services [1], but a second definition expresses that market does not necessarily need to have a physical existence to encompass a specific space; in fact, the market includes all the buyers and sellers that are exchanging some specific goods or services. For example, the international stock exchange market is a market whose transaction operations occur through international communicational networks and are not limited to a certain place. In fact, the market is a mechanism that allows buyers and sellers to exchange their properties. These properties can be physical (e.g., estates) or financial (e.g., valuable stock share papers) [2][3][4].
According to Dominic Salvatore, business is a location or circumstance where buyers and sellers trade products, facilities, and capital. Any item, service, or resource that can be traded has a demand. However, Salvatore believes that the market can be a non-physical location for trading in addition to its physical form [5]. In terms of the type of properties, the market can be divided into the market of physical properties (real) and the market of financial properties. The market of physical properties is a market where buyers and sellers exchange properties that have physical nature (like automobiles, estates, and furniture). The phrase market of financial properties is used for a market. People, including
ARTICLE INFO A B S T R A C T
Article history:
Received 4 March 2021
Revised 29 March 2021
Accepted 4 April 2021
Published online 17 August 2021
The increasing uncertainty of the natural world has motivated computer scientists to seek out the best approach to technological problems. Nature-inspired problem-solving approaches include meta-heuristic methods that are focused on evolutionary computation and swarm intelligence. One of these problems significantly impacting information is forecasting exchange index, which is a serious concern with the growth and decline of stock as there are many reports on loss of financial resources or profitability. When the exchange includes an extensive set of diverse stock, particular concepts and mechanisms for physical security, network security, encryption, and permissions should guarantee and predict its future needs. This study aimed to show it is efficient to use the group method of data handling (GMDH)-type neural networks and their application for the classification of numerical results. Such modeling serves to display the precision of GMDH-type neural networks. Following the US withdrawal from the Joint Comprehensive Plan of Action in April 2018, the behavior of the stock exchange data stream and commend algorithms has not been able to predict correctly and fit in the network satisfactorily. This paper demonstrated that Group Method Data Handling is most likely to improve inductive self-organizing approaches for addressing realistic severe problems such as the Iranian financial market crisis. A new trajectory would be used to verify the consistency of the obtained equations hence the models' validity.
This is an open access article under the CC BY-SA license
(https://creativecommons.org/licenses/by-sa/4.0/).
Keywords:
Exchange
Forecasting
Group Method of Data Handling
Neural Network

2 M.F. Masouleh and A. Bagheri / Knowledge Engineering and Data Science 2021, 4 (1): 1–13
natural and legal people, are busy exchanging financial securities, goods, and other properties that can be paid for by a small commission. The market prices depend on supply and demand. On the other hand, financial securities include shares, bonds, and some other goods (such as expensive metals or agriculture produce) [6].
Communications and information technology have led to the growth of easy online sales that reduce time and cost and prevent physical presence in crowded places. Today, one can easily do desired shopping with a few simple clicks. This technology has brought new challenges, including data management systems, data recommendation, data classification, and data security risk. Some studies [7] and [8] have proposed that forecasting and ensuring should be considered a management issue. The main concern in online business organizations is the management of information security that deals with the issues of data breaches, identification of burglary, and other online frauds. In terms of global security, data breaches are a major concern. Data breaches affect 93 percent of big businesses and 87 percent of small businesses in the United Kingdom [9][10]. In the United Kingdom, the total cost of a data loss is about 4.1 million dollars, and rehabilitation lasts around nine months and three days [11]. Although various technical solutions have been proposed for forecasting exchange in recent years, and some are being upgraded, forecasting exchange is still considered a necessary approach [12]. Many approaches in forecasting stock exchange indices have been used by the neural networks approach and other algorithms. One of the newest methods is proposed in [13]. They all have advantages and disadvantages, including computational complexity, high runtime, ungeneralizable algorithms, and insufficient accuracy.
Statistical technological metrics were used in several previous experiments to forecast exchange rates. Soft computing tools were used in some of the proposed approaches as a forecasting scheme. Hann et al. proposed a new approach for predicting exchange rates based on neural networks vs. linear models using monthly and weekly data in 1996 [14]. Mahnaz et al. introduced a Bayesian statistics algorithm for predicting exchange rates in 1997. Regardless of the economic model used by forecasters, the solution suggested may be used. The International Fisher Effect was used to show how the proposed model could be used in practice and how its results differed from the mean squared method [15].
The neural networks proposed by Zhang et al. were used to predict the British Pound/US Dollar exchange rate. It looked at how the number of input and hidden nodes and the scale of the training sample affected output in-sample and out-of-sample. For this investigation, the British pound/US dollar exchange rate was used. Neural networks outperformed linear models, mainly when the forecast horizon was small, according to the findings. Furthermore, the number of input nodes has a more significant effect on output than the number of hidden nodes, while a more significant number of observations allows prediction errors to be reduced [16]. Rodrı́guez et al. proposed simultaneous nearest-neighbour methods [17], Leung et al. presented general regression neural networks (GRNN) algorithm [18], and Michael et al. introduced SETAR models for exchange rate forecasting [19]. Chen et al. published a Bayesian vector error correction model for exchange rate forecasting in 2003. They developed the Bayesian Vector Error Correction Model (BVECM), which they used to predict shifts in currency exchange rates for three big Asia Pacific economies one month ahead [20]. Chen et al. [21] developed a regression neural network and used an adaptive forecasting method that combined the strengths of neural networks and multivariate econometric models to provide a solution to error correction in foreign exchange forecasting and trading. A time series model was used to estimate the exchange rates, and a General Regression Neural Network was used to correct the estimate errors in this process. Several experiments and statistical methods were used to compare the consistency of the two-stage models (with neural network error correction) and the single-stage models (without neural network error correction).
In 2005, Yu et al. presented a novel nonlinear ensemble forecasting model incorporating GLAR and ANN [22]. In 2007, Preminger et al. presented a robust regression approach [23], and in 2008 Wright et al. introduced Bayesian Model Averaging for foreign exchange [24]. In 2009, Carriero et al. presented a large Bayesian VAR for foreign exchange [25], and in 2012, Ye et al. introduced MB Exchange Rate Forecast Approach Based on BP Neural Network. This paper chose RMB exchange rate data from July 2005 to September 2010 to establish a BP neural network model to forecast RMB exchange rate in the future by using MATLAB software [26]. Korol et al. in 2014 proposed a fuzzy logic model [27], and in 2015, Shen et al. presented deep belief networks and conjugate gradient method [28], and in 2016, Abounoori et al. introduced Markov switching GARCH approach [29] for

M.F. Masouleh and A. Bagheri / Knowledge Engineering and Data Science 2021, 4 (1): 1–13 3
forecasting exchange rates. In 2017, Kolasa et al [30] proposed DSGE models, and in 2018, Sun et al. introduced a new multiscale decomposition ensemble approach. In the latter approach, foreign exchange rates were divided into a limited number of subcomponents by employing the variational mode decomposition (VMD). And in order to model and forecast each subcomponent, it used the support vector neural network (SVNN) technique. Another SVNN technique was utilized to integrate the forecasting results of each subcomponent. The quality of the performance of the proposed approach was tested by comparing and evaluating four key exchange rates. The experimental results showed that the forecasting accuracy and statistical tests of the proposed VMD-SVNN-SVNN multiscale decomposition ensemble approach were higher than some other benchmarks. Therefore, in forecasting foreign exchange rates, the proposed VMD-SVNN-SVNN multiscale decomposition ensemble method proved superior [31]. Variational Mode Decomposition and entropy theory was proposed to forecast exchange rates [32]. Dzalbs et al. proposed Cartesian Genetic Programming and artificial neural network (ANN), and Amat et al. presented simple machine learning methods for forecasting exchange rates [33]. The methods they used were sequential ridge regression and the exponentially weighted average strategy. Neither of them estimated an underlying model with discount factors but combined the fundamentals to directly output forecasts [34]. Finally, in 2019, Wei et al. presented Decomposition Clustering Ensemble Learning Approach [35], and Fu et al. introduced a support vector machine for RMB [36], and Ni et al. proposed Deep Learning [37] and Wang et al. nonlinear Taylor rule-based models for Forecasting Foreign Exchange Rates [38].
One self-organizing approach is named the group method of data handling (GMDH) algorithm among the newly developed methods. This approach evaluates the models' accuracy in a group of multi-input single-output data pairs, eventually yielding more complex models. As a result, GMDH will aid in creating an analytical function in a feed-forward network by solving the problem of initial information about the system's mathematical model and relying on a quadratic node transfer function. The coefficients of the equation are calculated using the regression technique [39][40][41]. Thus, this research makes use of the GMDH neural network algorithm to forecast stock exchange data. Other sections of the article include the introduction of the method with the description of the proposed architecture, results and discussion, and finally, the conclusion.
II. Method
The artificial neural network is an information processing system that has features in common with natural neural networks. Neural networks are generalized mathematical models of human recognition based on biology that have several assumptions, some of which are as follows [6][42]:
• Neurons do information processing operations. • Signals are transferred between neurons in the network via their bonds or connections. • Each bond has its weight that is multiplied by its transferred signals in common neural
networks.
Each neuron applies an activation function on its inputs, the weighted sum of the input signals to produce its output signals.
Figure 1 shows the flowchart is a suggested method for forecasting currency. As shown in Figure 1, the exchange dataset is first introduced into the proposed system. Then all data are preprocessed. After the preprocessing of the exchange dataset, the missing values are removed. Then the data prepared and received from the Stock Exchange are converted into an acceptable format for simulation.
In the next step, the data are normalized, and then the sampling process is performed. Train sample (80%) is used to generate the model by GMDH neural network algorithm and test samples (20%) to evaluate the performance of the proposed method. Train data are applied to the GMDH neural network algorithm, and a model is developed after the training. After model generation, test data is applied to the model for prediction. Finally, it is examined whether all specimens are predicted. If all new samples are completed, evaluation and calculation of the results are performed.
After the data are entered into the proposed system, the desired data are preprocessed, and then the unused and useless samples are deleted. Next, the data converted into cohesive after-pre-processing becomes an acceptable format for simulation tools. At this point, the data are usually converted into an Excel and integrated format.

4 M.F. Masouleh and A. Bagheri / Knowledge Engineering and Data Science 2021, 4 (1): 1–13
For preprocessing the data, various methods have been proposed, which are as follows:
• Clearing the data • Data collection • Data transfer • Reduced
Given the problem in this research, the present study has made use of only the data clearing method. The proposed strategy analyzes the data and identifies if the row or column has empty or unused values. Then the empty or unused values will be examined before and after the sample, and their averages will be computed. Finally, the null value will be replaced with the obtained average. By doing so, the samples will be lost, and more consistent data will be generated.
After the prototype has disappeared, the data have to be prepared and for this purpose. The preprocessed data are converted into an acceptable format for simulation tools. The default format for the data is in Excel, and therefore, for the analysis, we initially need case-tested data.
In the preprocessing stage, the values of each attribute of the data used are normalized from 0 to 1. Then we rotate the rows of the general data matrix randomly so that the order of the data is collected from the initial state, Get out. In addition, all data are mapped in a matrix form and changes in matrix rows, and then normalization operations are performed. Normalization is due to higher precision. Relationship (1) is used to normalize the values of each set of data.
𝑁𝑜𝑟𝑚𝑎𝑙𝑖𝑧𝑒(𝑥) =(𝑥−𝑋𝑚𝑖𝑛)
(𝑋𝑚𝑎𝑥−𝑋𝑚𝑖𝑛) (1)
Xmax and Xmin are the maximum and minimum values in the X-property range. After normalizing the data, the values of all the adjectives are in the range [0,1].
Data sampling
Test
data(20%)
Train
data(80%)
GMDH
neural network
GMDH
Model
Forecasting
Exchange Data
Evaluating the
results
END
Is the process
finished?
Learning
Generate model
No
i=i+1
Input ith data
Evaluating the performance
Of new data(Test)
Yes
Data
preprocessing
Dataset
Data preparation
Data
normalization
Fig. 1. The proposed method flowchart

M.F. Masouleh and A. Bagheri / Knowledge Engineering and Data Science 2021, 4 (1): 1–13 5
It is assumed that the Train Samples will learn the GMDH algorithm, and the resultant model will be used for other data. Training samples are usually 80% of the total sample. Test samples representing 20% of the total samples are used to evaluate and validate the method. These samples are used for testing and measuring the efficiency and validation of the proposed method. After the training samples (80%) and the experimental samples (20%) were normally subdivided, we apply the training samples to GMDH neural network algorithms as inputs.
A. Group Method of Data Handling (GMDH)
Group method of data handling (GMDH) is a family of inductive algorithms for computer-based mathematical modeling of multi-parametric datasets that features fully automatic structural and parametric optimization of models. GMDH is used in data mining, knowledge discovery, prediction, complex systems modeling, optimization, and pattern recognition. In 2017, Li et al. showed that GMDH neural network outperformed the classical forecasting algorithms such as Single Exponential Smooth, Double Exponential Smooth, ARIMA, and back-propagation neural network.
GMDH algorithms (Figure 2) are characterized by an inductive procedure that gradually sorts out complicated polynomial models and selects the best solution through the so-called external criterion [9][42]. A set of neurons can represent the standard GMDH algorithm. They contain different pairs of neurons in each layer, and they are joined utilizing a quadratic polynomial. The result of this connection is new neurons in the next layer.
This representation can be utilized to model the mapping inputs to outputs. The identification
problem is formally defined as a way of finding a function 𝑓 so that it can be approximately used in place of the actual one, 𝑓 for the prediction of the output �̂� for a given input vector 𝑋 =(𝑥1. 𝑥2. 𝑥3. … . 𝑥𝑛) possibly close to its actual output 𝑦. Thus, given M, samples of multi-input single-output data pairs define the equations (2):
𝑦𝑖 = 𝑓(𝑥𝑖1. 𝑥𝑖2. 𝑥𝑖3. … . . 𝑥𝑖𝑛). 𝑖 = 1.2.… .𝑀 (2)
A GMD-type neural network may now be trained for the prediction of the output values 𝑋 =(𝑥𝑖1. 𝑥𝑖2. 𝑥𝑖3. … . 𝑥𝑖𝑛). It means,
�̂�𝑖 = 𝑓(𝑥𝑖1. 𝑥𝑖2. 𝑥𝑖3. … . . 𝑥𝑖𝑛). 𝑖 = 1.2.… .𝑀 (3)
There is now the problem of determining a GMDH-type neural network to minimize the square of the difference between the predicted output and the actual one:
∑ [(𝑓(𝑥𝑖1. 𝑥𝑖2. 𝑥𝑖3. … . 𝑥𝑖𝑛) − 𝑦𝑖)2] → 𝑀𝑖𝑛.𝑀
𝑘=1 (4)
A complicated polynomial of the form can display the general connection between inputs and output variables, known as the Ivakhnenko polynomial [43].
�̂� = 𝑎0 + ∑ 𝑎𝑖𝑥𝑖 + ∑ ∑ 𝑎𝑖𝑗𝑥𝑖𝑥𝑗 + ∑ ∑ ∑ 𝑎𝑖𝑗𝑘𝑥𝑖𝑥𝑗𝑥𝑘 + ⋯𝑚𝑘=1
𝑚𝑗=1
𝑚𝑖=1
𝑚𝑗=1
𝑚𝑖=1
𝑚𝑖=1 (5)
Most applications, however, use the quadratic form of two variables in the following form to predict the output y.
�̂� = 𝐺(𝑥𝑖 . 𝑥𝑗) = 𝑎0 + 𝑎1𝑥𝑖 + 𝑎3𝑥𝑖2 + 𝑎4𝑥𝑗
2 + 𝑎5𝑥𝑖𝑥𝑗 (6)
Fig. 2. Structure of GMDH Network

6 M.F. Masouleh and A. Bagheri / Knowledge Engineering and Data Science 2021, 4 (1): 1–13
Using regression techniques, the coefficients a_i in equation (5) are calculated [43] in order to minimize the difference between actual output, y, and the calculated one, �̂�, for each pair of 𝑥𝑖 . 𝑥𝑗) as
input variables. In fact, it shows that through the quadratic form given in equation (5), whose coefficients are obtained in a least-squares sense, a tree of polynomials is constructed. Therefore, the coefficients of each quadratic function 𝐺𝑖 are derived to fit the output in the whole set input-output pair optimally:
𝑟2 =∑ (𝑦𝑖−𝐺𝑖)
𝑀𝑖=1
∑ 𝑦𝑖2𝑀
𝑖=1
→ 𝑀 𝑖𝑛 (7)
The construct of the regression polynomial in equation (6) can very well fit the dependent samples
(𝑦𝑖 . 𝑖 = 1.2.… .𝑀) in a least-squares sense. As a result, (𝑛2) =
𝑛(𝑛−1)
2 neurons will be constructed in
the second layer of the feed-forward network from the samples {(𝑦𝑖 . 𝑥𝑖𝑝. 𝑥𝑖𝑝). (𝑖 = 1.2.… .𝑀)} for
different 𝑝. 𝑞𝜖{1.2.… .𝑀} (Farlow 1984). It means that there is a possibility for the construction of M
data triples {(𝑦𝑖 . 𝑥𝑖𝑝. 𝑥𝑖𝑞). (𝑖 = 1.2.… .𝑀)} from samples using such 𝑝. 𝑞𝜖{1.2. … .𝑀}
[
𝑥1𝑝 𝑥1𝑝
𝑥2𝑝 𝑥2𝑞⋯
𝑥𝑀𝑝
⋯𝑥𝑀𝑝
⋮ 𝑦1
𝑦2⋯⋮
⋯𝑦𝑀
] (8)
The following matrix equation can be readily obtained if the quadratic sub-expression is used in the form of equation (6) for each row of M data triples:
𝐴𝑎 = 𝑌 (9)
where a is the vector of unknown coefficients of the quadratic polynomial in equation (10):
𝑎 = {𝑎0. 𝑎1. 𝑎2. 𝑎3. 𝑎4. 𝑎5} (10)
𝑌 = {𝑦1. 𝑦2. 𝑦3. … . 𝑦𝑀}𝑇 (11)
is the vector of output values from samples? It shows
𝐴 =
[ 11⋮1
𝑥1𝑝
𝑥2𝑝
⋮𝑥𝑀𝑝
𝑥1𝑞
𝑥2𝑞
⋮𝑥𝑀𝑝
𝑥1𝑝𝑥1𝑞
𝑥2𝑝𝑥2𝑞
⋮𝑥𝑀𝑝𝑥𝑀𝑞
𝑥1𝑝2
𝑥2𝑝2
⋮𝑥𝑀𝑝
2
𝑥1𝑞2
𝑥2𝑞2
⋮𝑥𝑀𝑞
2]
(12)
The least-squares technique from multiple-regression analysis results in the solution of the normal equations as follows:
𝑎 = (𝐴𝑇𝐴)−1𝐴𝑇𝑌 (13)
The vector of the best coefficients of the quadratic (5) for the whole set of M data triples, but this solution directly derived from normal equations is almost capable of rounding off errors and, more importantly, of the singularity of these equations.
B. Structural Identification of GMDH Type Neural Networks
For the structural identification of GMDH-type networks, there are different approaches [39][41]:
1. Increasing Selection Pressure Approach (ISP). In the approach of selection pressure, there is only one parameter that is sequentially increased in different layers so that the number of neurons in each layer and the number of layers in the network can be determined.
2. Pre-specified Structural Design Approach (PSD). This approach prescribes the number of layers in the network and the number of neurons in each layer.
3. Error Driven Structural approach (EDS). In this approach, following a threshold error for equation (6). It is possible to determine the number of layers and al. Moreover, the third approach also differs in that it is possible to include in subsequent layers some of the input variables or generated neurons in different layers. Therefore, the structure of such a network may be more complex than those generated in other approaches.
M.F. Masouleh and A. Bagheri / Knowledge Engineering and Data Science 2021, 4 (1): 1–13 7
III. Results and Discussions
This Section describes the dataset, evaluation metrics and then discusses the results of the proposed method. Firstly, the dataset used to forecast the stock exchange data is described in Section III.A. Secondly, the evaluation metrics of the proposed method are presented in Section III.B. Finally, in Section III.C, the analysis of the results is discussed.
The software and hardware configuration of the experimental environment is shown in Table 1. As can be seen from Table 1, the operating system (OS) Windows 10, the OS type is also 64-bit, 4GB of RAM used that 3.06 gigabytes of usable, CPU is intel (Core™ i7 CPU) - Q720 @ 1.60GHz 1.60 GHz.
A. Dataset
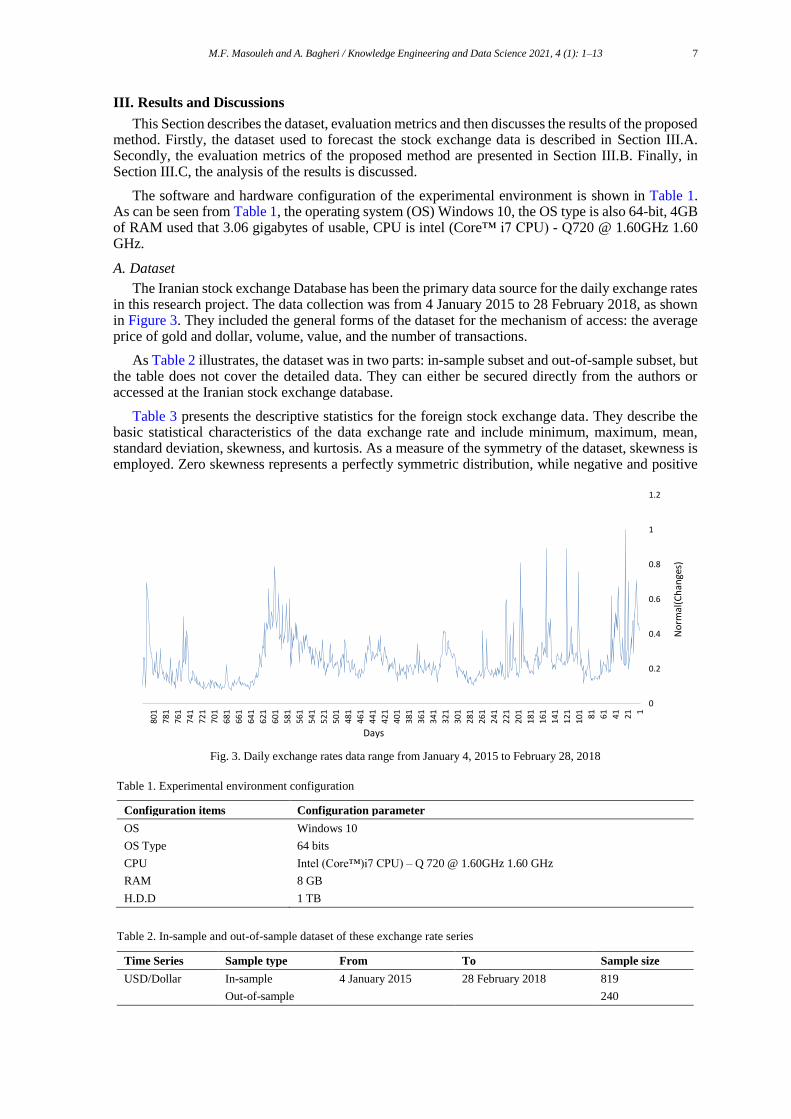
The Iranian stock exchange Database has been the primary data source for the daily exchange rates in this research project. The data collection was from 4 January 2015 to 28 February 2018, as shown in Figure 3. They included the general forms of the dataset for the mechanism of access: the average price of gold and dollar, volume, value, and the number of transactions.
As Table 2 illustrates, the dataset was in two parts: in-sample subset and out-of-sample subset, but the table does not cover the detailed data. They can either be secured directly from the authors or accessed at the Iranian stock exchange database.
Table 3 presents the descriptive statistics for the foreign stock exchange data. They describe the basic statistical characteristics of the data exchange rate and include minimum, maximum, mean, standard deviation, skewness, and kurtosis. As a measure of the symmetry of the dataset, skewness is employed. Zero skewness represents a perfectly symmetric distribution, while negative and positive
Fig. 3. Daily exchange rates data range from January 4, 2015 to February 28, 2018
Table 1. Experimental environment configuration
Configuration items Configuration parameter
OS Windows 10
OS Type 64 bits
CPU Intel (Core™)i7 CPU) – Q 720 @ 1.60GHz 1.60 GHz
RAM 8 GB
H.D.D 1 TB
Table 2. In-sample and out-of-sample dataset of these exchange rate series
Time Series Sample type From To Sample size
USD/Dollar In-sample 4 January 2015 28 February 2018 819
Out-of-sample 240
0
0.2
0.4
0.6
0.8
1
1.2
1
21
41
61
81
101
121
141
161
181
201
221
241
261
281
301
321
341
361
381
401
421
441
461
481
501
521
541
561
581
601
621
641
661
681
701
721
741
761
781
801
Norm
al(Changes)
Days

8 M.F. Masouleh and A. Bagheri / Knowledge Engineering and Data Science 2021, 4 (1): 1–13
skewness show that distribution is skewed to the left and right, respectively. However, if the value of absolute skewness is great, the asymmetry is more specific. However, kurtosis represents a measurement of the extremities (i.e., tails) of the distribution of data, indicating the existence of outliers. The standard measure of kurtosis is on the basis of a scaled version of the fourth moment of the data. This figure shows the tails of the distribution. In this regard, a higher kurtosis results from infrequent extreme deviations (or outliers) than the frequent modestly sized deviations. The kurtosis of any univariate normal distribution (standard Gaussian distribution) is 3, and if it is greater than 3, the observation is more concentrated with a shorter tail than the normal distribution. However, if the kurtosis is less than 3, the observation is not so concentrated, and it has a longer tail than the normal one, as is common in the uniform distribution of the rectangle. The results are normalized with equation (1) in Table 3.
B. Evaluation Metric
In order to assess the level forecasting accuracy of the proposed FED-GMDH, three main evaluation metrics are used to compare the out-of-sample forecasting performance. For level forecasting accuracy evaluation, the mean absolute error (MAE), the root mean square error (RMSE), and the mean absolute percentage error (MAPE) is selected, respectively, as follow:
𝑀𝐴𝐸 =1
𝑇∑ |𝑦𝑡 − 𝑌′
𝑡|.𝑇𝑡=1 (14)
𝑅𝑀𝑆𝐸 = √1
𝑇∑ |𝑦𝑡 − 𝑌′
𝑡|.𝑇𝑡=1 (15)
𝑀𝐴𝑃𝐸 =1
𝑇∑ |
𝑦𝑡−𝑌′𝑡
𝑦𝑡| × 100.𝑇
𝑡=1 (16)
where T is the number of observations in the out-of-sample subset, yt and y't are respectively the actual value and the forecast value at time t.
C. Analyzing Results
This Section analyzes the simulation results of the proposed method for forecasting stock exchange data and discusses the evaluation metric. The primary purpose is to design an intelligent system that can predict the unstructured pattern of dollar prices based on other financial market attributes.
Figure 4 and Figure 5 show the fitting of train and test data sets. Several training runs have been performed using different numbers of the group. Figure 4 shows the error distributions from the neural network, with the sample containing all 400 simulated patterns. The plots are quite encouraging in that there are no very badly reconstructed patterns, and the error distribution is reasonably uniform throughout the space. There is some evidence of a slight systematic misfitting of wide spectra.
In Figure 4(a), 750 train samples are shown. In this Section, the dollar prices and the predicted value in the training process are shown by the GMDH algorithm. As can be seen, the GMDH algorithm performs the training process with high accuracy and low error. In Figure 4(b), the MAE and RMSE are calculated at the training stage, where MAE = 5268.8127, RMSE = 72.5866. In Figure 4(c), the Error StD and Mape are calculated at the training stage: Mape = 10.5582, Error StD = 7314.6658.
Figure 5 shows an example test with the GMDH neural network that fits superimposed. In Figure 5(a), 85 test samples are shown. In this Section, the dollar prices and the predicted value in the testing process are shown by the GMDH algorithm. As can be seen, the GMDH algorithm performs the testing process with high accuracy and low error. In Figure 5(b), the MAE and RMSE are calculated at the testing stage, where MAE = 5837.4721, RMSE = 76.4034. In Figure 5(c), the Error StD and Mape are calculated at the training stage: Mape = 11.4883, Error StD = 9242.0662.
Table 3. The descriptive statistics of these exchange rate series
Time Series Minimum Maximum Mean Std* Skewness Kurtosis
USD/US Dollar 0.075 1 0.244 0.125 1.83 5.11
Note: Std∗ refers to the standard deviation

M.F. Masouleh and A. Bagheri / Knowledge Engineering and Data Science 2021, 4 (1): 1–13 9
In Figure 6(a), 825 all samples are shown. In this Section, the dollar prices and the predicted value in the predicting process are shown by the GMDH algorithm. As can be seen, the GMDH algorithm performs the predicting process with high accuracy and low error. In Figure 6(b), the MAE and RMSE are calculated at the predicting stage, where MAE = 5325.7481, RMSE = 72.9777. In Figure 6(c), the Error StD and Mape are calculated at the predicting stage: Mape = 10.6513, Error StD = 7525.16.
As shown in Figure 7, the linear regression offers information on two extremes. It provides a global appreciation of the accuracy (through the regression value R and through the slope and offset. It compares the position of each generated data point with its target counterpart.
Fig. 4. Fitting of training set
Fig. 5. Fitting of testing set

10 M.F. Masouleh and A. Bagheri / Knowledge Engineering and Data Science 2021, 4 (1): 1–13
IV. Conclusion
The correct prediction of the price of the currency in the stock market and the banking system of any country is significant. With timely and accurate forecasting of the currency, significant improvements can be made in each country's economy and foreign exchange industry. In this paper,
Fig. 6. Fitting of all dataset
Fig. 7. Plot regression

M.F. Masouleh and A. Bagheri / Knowledge Engineering and Data Science 2021, 4 (1): 1–13 11
we have used the GMDH Neural Network algorithm to predict the price of a currency on the Iranian stock exchange. The GMDH algorithm is a deep neural network that can predict high-order time series examples such as currency. The proposed method in this paper has several stages: data preprocessing, data preparation and data normalization, separation of training and testing samples, entering training samples into the GMDH neural network algorithm, and generating a network model. Applying test samples to the generated model, forecasting the price of the currency and finally, evaluating the desired criteria. By simulating the proposed method, the GMDH neural network algorithm predicted the minimum amount of error in training, testing, and evaluation of the price of the currency. Therefore, this algorithm can be trusted and used to predict the currency's price on the Iranian stock exchange.
As a suggestion for developing the results of this research, we can use the combination of machine learning algorithms such as decision tree C5, SVM-Lib, and MLP in the form of a reinforcement learning system to improve the results of the GMDH algorithm. We also can improve the results by combining optimization methods, CATs, Dragon Fly, GA, and ACO.
Declarations
Author contribution
All authors contributed equally as the main contributor of this paper. All authors read and approved the final paper.
Funding statement
This research did not receive any specific grant from funding agencies in the public, commercial, or not-for-profit sectors.
Conflict of interest
The authors declare no known conflict of financial interest or personal relationships that could have appeared to influence the work reported in this paper.
Additional information
Reprints and permission information is available at http://journal2.um.ac.id/index.php/keds.
Publisher’s Note: Department of Electrical Engineering - Unversitas Negeri Malang remains neutral with regard to jurisdictional claims and institutional affiliations.
References
[1] A. N. Singh, A. Picot, J. Kranz, M. P. Gupta, and A. Ojha, “Information Security Management (ISM) Practices: Lessons from Select Cases from India and Germany,” Glob. J. Flex. Syst. Manag., vol. 14, no. 4, pp. 225–239, Dec. 2013, doi: 10.1007/s40171-013-0047-4.
[2] B. Apolloni, S. Bassis, J. Rota, G. L. Galliani, M. Gioia, and L. Ferrari, “A Neurofuzzy Algorithm for Learning from Complex Granules,” Granul. Comput., vol. 1, no. 4, pp. 225–246, Dec. 2016, doi: 10.1007/s41066-016-0018-1.
[3] J. K. Deane, D. M. Goldberg, T. R. Rakes, and L. P. Rees, “The Effect of Information Security Certification Announcements on the Market Value of the Firm,” Inf. Technol. Manag., vol. 20, no. 3, pp. 107–121, Sep. 2019, doi: 10.1007/s10799-018-00297-3.
[4] S. Shan, Z. Hu, Z. Liu, J. Shi, L. Wang, and Z. Bi, “An Adaptive Genetic Algorithm for Demand-Driven and Resource-Constrained Project Scheduling in Aircraft Assembly,” Inf. Technol. Manag., vol. 18, no. 1, pp. 41–53, Mar. 2017, doi: 10.1007/s10799-015-0223-7.
[5] Ernst & Young LLP, Fighting to close the gap, no. November. 2012.
[6] M. Song and Y. Wang, “A study of granular computing in the agenda of growth of artificial neural networks,” Granul. Comput., vol. 1, no. 4, pp. 247–257, Dec. 2016, doi: 10.1007/s41066-016-0020-7.
[7] Z. A. Soomro, M. H. Shah, and J. Ahmed, “Information security management needs more holistic approach: A literature review,” Int. J. Inf. Manage., vol. 36, no. 2, pp. 215–225, Apr. 2016, doi: 10.1016/j.ijinfomgt.2015.11.009.
[8] M. Siponen, M. A. Mahmood, and S. Pahnila, “Technical opinionAre employees putting your company at risk by not following information security policies?,” Commun. ACM, vol. 52, no. 12, pp. 145–147, Dec. 2009, doi: 10.1145/1610252.1610289.
[9] T. Ring, “A breach too far?,” Comput. Fraud Secur., vol. 2013, no. 6, pp. 5–9, Jun. 2013, doi: 10.1016/S1361-3723(13)70052-6.
[10] M. R. Sanaei and F. M. Sobhani, “Information technology and e-business marketing strategy,” Inf. Technol. Manag., vol. 19, no. 3, pp. 185–196, Sep. 2018, doi: 10.1007/s10799-018-0289-0.
[11] W. Ashford, “Many UK firms underestimate cost of data breaches, study finds,” https://www.computerweekly.com/, 2012. https://www.computerweekly.com/news/2240171040/Many-UK-firms-underestimate-cost-of-data-breaches-study-finds.

12 M.F. Masouleh and A. Bagheri / Knowledge Engineering and Data Science 2021, 4 (1): 1–13
[12] S. Chaigusin, C. Chirathamjaree, and J. Clayden, “The Use of Neural Networks in the Prediction of the Stock Exchange of Thailand (SET) Index,” in 2008 International Conference on Computational Intelligence for Modelling Control & Automation, 2008, pp. 670–673, doi: 10.1109/CIMCA.2008.83.
[13] S. Galeshchuk, “Neural networks performance in exchange rate prediction,” Neurocomputing, vol. 172, pp. 446–452, Jan. 2016, doi: 10.1016/j.neucom.2015.03.100.
[14] T. H. Hann and E. Steurer, “Much ado about nothing? Exchange rate forecasting: Neural networks vs. linear models using monthly and weekly data,” Neurocomputing, vol. 10, no. 4, pp. 323–339, Apr. 1996, doi: 10.1016/0925-2312(95)00137-9.
[15] M. Mahdavi, “A Bayesian approach to foreign exchange forecasting,” Glob. Financ. J., vol. 8, no. 1, pp. 15–31, Mar. 1997, doi: 10.1016/S1044-0283(97)90003-X.
[16] G. Zhang and M. Y. Hu, “Neural network forecasting of the British Pound/US Dollar exchange rate,” Omega, vol. 26, no. 4, pp. 495–506, Aug. 1998, doi: 10.1016/S0305-0483(98)00003-6.
[17] F. Fernández-Rodrı́guez, S. Sosvilla-Rivero, and J. Andrada-Félix, “Exchange-rate forecasts with simultaneous nearest-neighbour methods: evidence from the EMS,” Int. J. Forecast., vol. 15, no. 4, pp. 383–392, Oct. 1999, doi: 10.1016/S0169-2070(99)00003-5.
[18] M. T. Leung, A.-S. Chen, and H. Daouk, “Forecasting exchange rates using general regression neural networks,” Comput. Oper. Res., vol. 27, no. 11–12, pp. 1093–1110, Sep. 2000, doi: 10.1016/S0305-0548(99)00144-6.
[19] M. P. Clements and J. Smith, “Evaluating forecasts from SETAR models of exchange rates,” J. Int. Money Financ., vol. 20, no. 1, pp. 133–148, Feb. 2001, doi: 10.1016/S0261-5606(00)00039-5.
[20] A.-S. Chen and M. T. Leung, “A Bayesian vector error correction model for forecasting exchange rates,” Comput. Oper. Res., vol. 30, no. 6, pp. 887–900, May 2003, doi: 10.1016/S0305-0548(02)00041-2.
[21] A.-S. Chen and M. T. Leung, “Regression neural network for error correction in foreign exchange forecasting and trading,” Comput. Oper. Res., vol. 31, no. 7, pp. 1049–1068, Jun. 2004, doi: 10.1016/S0305-0548(03)00064-9.
[22] L. Yu, S. Wang, and K. K. Lai, “A novel nonlinear ensemble forecasting model incorporating GLAR and ANN for foreign exchange rates,” Comput. Oper. Res., vol. 32, no. 10, pp. 2523–2541, Oct. 2005, doi: 10.1016/j.cor.2004.06.024.
[23] A. Preminger and R. Franck, “Forecasting exchange rates: A robust regression approach,” Int. J. Forecast., vol. 23, no. 1, pp. 71–84, Jan. 2007, doi: 10.1016/j.ijforecast.2006.04.009.
[24] J. H. Wright, “Bayesian Model Averaging and exchange rate forecasts,” J. Econom., vol. 146, no. 2, pp. 329–341, Oct. 2008, doi: 10.1016/j.jeconom.2008.08.012.
[25] A. Carriero, G. Kapetanios, and M. Marcellino, “Forecasting exchange rates with a large Bayesian VAR,” Int. J. Forecast., vol. 25, no. 2, pp. 400–417, Apr. 2009, doi: 10.1016/j.ijforecast.2009.01.007.
[26] S. Ye, “RMB Exchange Rate Forecast Approach Based on BP Neural Network,” Phys. Procedia, vol. 33, pp. 287–293, 2012, doi: 10.1016/j.phpro.2012.05.064.
[27] T. Korol, “A fuzzy logic model for forecasting exchange rates,” Knowledge-Based Syst., vol. 67, pp. 49–60, Sep. 2014, doi: 10.1016/j.knosys.2014.06.009.
[28] F. Shen, J. Chao, and J. Zhao, “Forecasting exchange rate using deep belief networks and conjugate gradient method,” Neurocomputing, vol. 167, pp. 243–253, Nov. 2015, doi: 10.1016/j.neucom.2015.04.071.
[29] E. Abounoori, Z. (Mila) Elmi, and Y. Nademi, “Forecasting Tehran stock exchange volatility; Markov switching GARCH approach,” Phys. A Stat. Mech. its Appl., vol. 445, pp. 264–282, Mar. 2016, doi: 10.1016/j.physa.2015.10.024.
[30] M. Ca’ Zorzi, M. Kolasa, and M. Rubaszek, “Exchange rate forecasting with DSGE models,” J. Int. Econ., vol. 107, no. 260, pp. 127–146, 2017, doi: 10.1016/j.jinteco.2017.03.011.
[31] S. Sun, S. Wang, and Y. Wei, “A new multiscale decomposition ensemble approach for forecasting exchange rates,” Econ. Model., vol. 81, pp. 49–58, Sep. 2019, doi: 10.1016/j.econmod.2018.12.013.
[32] K. He, Y. Chen, and G. K. F. Tso, “Forecasting exchange rate using Variational Mode Decomposition and entropy theory,” Phys. A Stat. Mech. its Appl., vol. 510, pp. 15–25, Nov. 2018, doi: 10.1016/j.physa.2018.05.135.
[33] I. Dzalbs and T. Kalganova, “Forecasting Price Movements in Betting Exchanges Using Cartesian Genetic Programming and ANN,” Big Data Res., vol. 14, pp. 112–120, Dec. 2018, doi: 10.1016/j.bdr.2018.10.001.
[34] C. Amat, T. Michalski, and G. Stoltz, “Fundamentals and exchange rate forecastability with simple machine learning methods,” J. Int. Money Financ., vol. 88, pp. 1–24, Nov. 2018, doi: 10.1016/j.jimonfin.2018.06.003.
[35] Y. Wei, S. Sun, J. Ma, S. Wang, and K. K. Lai, “A decomposition clustering ensemble learning approach for forecasting foreign exchange rates,” J. Manag. Sci. Eng., vol. 4, no. 1, pp. 45–54, Mar. 2019, doi: 10.1016/j.jmse.2019.02.001.
[36] S. Fu, Y. Li, S. Sun, and H. Li, “Evolutionary support vector machine for RMB exchange rate forecasting,” Phys. A Stat. Mech. its Appl., vol. 521, pp. 692–704, May 2019, doi: 10.1016/j.physa.2019.01.026.
[37] L. Ni, Y. Li, X. Wang, J. Zhang, J. Yu, and C. Qi, “Forecasting of Forex Time Series Data Based on Deep Learning,” Procedia Comput. Sci., vol. 147, pp. 647–652, 2019, doi: 10.1016/j.procs.2019.01.189.
[38] R. Wang, B. Morley, and M. P. Stamatogiannis, “Forecasting the exchange rate using nonlinear Taylor rule based models,” Int. J. Forecast., vol. 35, no. 2, pp. 429–442, Apr. 2019, doi: 10.1016/j.ijforecast.2018.07.017.
[39] A. Bagheri, N. Nariman-Zadeh, A. S. Siavash, and A. R. Khoobkar, “GMDH type neural networks and their application to the identification of the inverse kinematic equations of robotic manipulators,” Int. J. Eng., vol. 18, no. 2, pp. 135–143, 2005.

M.F. Masouleh and A. Bagheri / Knowledge Engineering and Data Science 2021, 4 (1): 1–13 13
[40] A. Bagheri, H. Mohammadi Peyhani, and M. Akbari, “Financial forecasting using ANFIS networks with Quantum-behaved Particle Swarm Optimization,” Expert Syst. Appl., vol. 41, no. 14, pp. 6235–6250, Oct. 2014, doi: 10.1016/j.eswa.2014.04.003.
[41] S. Dick and A. Kandel, “Granular Computing in Neural Networks,” Studies in Fuzziness and Soft Computing, pp. 275–305, 2001.
[42] B. Apolloni, S. Bassis, J. Rota, G. L. Galliani, M. Gioia, and L. Ferrari, “A neurofuzzy algorithm for learning from complex granules,” Granul. Comput., vol. 1, no. 4, pp. 225–246, Dec. 2016, doi: 10.1007/s41066-016-0018-1.
[43] S. J. Farlow, “The GMDH Algorithm of Ivakhnenko,” Am. Stat., vol. 35, no. 4, pp. 210–215, Nov. 1981, doi: 10.1080/00031305.1981.10479358.