forecasting technological progress potential based on the complexity of product knowledge
TRANSCRIPT

Technological Forecasting & Social Change xxx (2014) xxx–xxx
TFS-17952; No of Pages 12
Contents lists available at ScienceDirect
Technological Forecasting & Social Change
Forecasting technological progress potential based on the complexity ofproduct knowledge
Andy Dong a,⁎, Somwrita Sarkar b,1
a Faculty of Engineering and Information Technologies, Civil Engineering Building (J05), University of Sydney, Sydney, NSW 2006, Australiab Faculty of Architecture, Design and Planning, Wilkinson Building (G04), University of Sydney, Sydney, NSW 2006, Australia
a r t i c l e i n f o
⁎ Corresponding author. Tel.: +61 2 9351 4766.E-mail addresses: [email protected] (A. D
[email protected] (S. Sarkar).1 Tel.: +61 2 9351 8555.
http://dx.doi.org/10.1016/j.techfore.2014.02.0090040-1625/© 2014 Elsevier Inc. All rights reserved.
Please cite this article as: A. Dong, S. Sarkknowledge, Technol. Forecast. Soc. Change
a b s t r a c t
Article history:Received 20 May 2013Received in revised form 7 January 2014Accepted 9 February 2014Available online xxxx
Investing in R&D for a product employing new technologies is a challenging issue for companiesand governments alike, especially at the critical juncture of deciding the degree of resourceallocation, if any. Decision-makers generally rely either on historical data or intuitive prediction togauge the rate of improvement and level of R&D spending to achieve the desired improvement.This paper introduces a systematic way of forecasting the endogenous progress potential of aproduct based on the complexity of its knowledge structure. The knowledge structure representsknowledge associatedwith the product's core technology and the configuration of the componentsand sub-systems supporting the core technology. Topological properties of complex networks areapplied to assess the knowledge complexity of a product relative to its class. Analyses of thecomplexity of knowledge structures for a set of energy harvesting devices confirm that node degreeand clustering coefficient provide distinguishing topological properties whereas community sizeand membership number do not clearly differentiate the knowledge structure complexity. Wediscuss the implications of these findings on forecasting progress potential.
© 2014 Elsevier Inc. All rights reserved.
Keywords:Emerging technologyProduct architectureNetworkModularityManagement of innovationTechnological forecasting
1. Introduction
A central concern in R&D investment in product innova-tions employing new or untested technology is the necessarylevel of resource allocation to grow the stock of knowledge[1,2]. A model of the intrinsic improvability of a productwould allow decision makers to forecast a product's endog-enous rate of improvement, or progress potential, whichwould inform their decisions on the appropriate level ofresearch budget and the time span for the stock of knowledgeto accumulate [3]. Similarly, companies or governmentsaiming to allocate investments across a number of potentialproduct innovations, all of which appear attractive, mayprefer to invest in those that have a higher likelihood of faster
ong),
ar, Forecasting technolo(2014), http://dx.doi.org
progress. We contrast this problem of forecasting theendogenous progress potential of a product based on itsintrinsic improvability with forecasting the diffusion ofproduct innovation [4,5], which generally focuses on exoge-nous, market-driven factors, or forecasting the generalgrowth of knowledge about technologies through environ-mental scanning, for which bibliometrics and Delphi haveplayed a key role [6,7].
The extent to which a product and its core technologyrespond to investment and improve has been quantified byprogress functions [8] and ‘learning curves’ or ‘experiencecurves’. Progress functions measure the result of companiesgaining experience and making improvements to production,which is assessed by data on cumulative volume of productionand unit cost. Despite subtle differences in the definition ofprogress functions and learning curves or experience curves[8], they all rest on the same principle: the cost of productiondecreases as individuals, companies, or industries ‘learn bydoing’. The precise nature of the relation between the inherent
gical progress potential based on the complexity of product/10.1016/j.techfore.2014.02.009
2 A. Dong, S. Sarkar / Technological Forecasting & Social Change xxx (2014) xxx–xxx
difficulty in ‘learning by doing’ posed by a specific technologyand cumulative volume of production is not yet fully under-stood, though. In the energy sector, for example, experiencecurves only weakly explain the change in cumulative volume ofproduction, with the endogenous factor of technical barriersbeingmore significant [9]. Two other causal factors downplayedin progress functions are the intrinsic degree of difficulty in‘learning’ about a technology at a component level and thedegree of architectural complexity in configuring parts andsub-systems around the technology into a commercial product.Understanding how the intrinsic complexities in the design andunderlying technology of a product affect growing the stock ofknowledge, and hence the progress potential of a product,would be a powerful tool for investors and policy-makers toforecast the progress potential of new products at the earlystages of technological development.
To address this question, we bring engineering design tothe problem of forecasting technological improvement byexploring a seldom-cited link, which is the knowledge that isembodied in the design of a product. When we mean design,we refer to both the componentry of the core technologiesand the configuration of the parts and sub-systems of aproduct, that is, the product architecture. Significant knowl-edge is embodied in the components of the product and inthe way that they fit together. One way in which a number ofacademic studies have connected technological improve-ment and design is through the modularity of productarchitecture. A highly modular product architecture hasbeen shown to decrease the time to design the product[10], support end-user innovation [11], and facilitate theestablishment of product platforms and families [12,13]among other benefits that increase the rate of innovation[14]. Architectural modularity turns out to be an importantway to link the design of a product to its progress potential.McNerney et al. [15] developed an intriguing model showingthat the progress potential of a product is driven by a powerlaw with exponent b = 1 / (γd*), where γ is the intrinsicdifficulty of finding a better component and d* is themaximum design complexity of the product. The maximumdesign complexity of the product is determined by thecomponent that has the most influence on other compo-nents, such that it is not possible to alter that componentwithout simultaneously altering the other dependent com-ponents. Through simulation on synthetic data, they showeda correspondence between their model and reported rates ofprogress.
A notable caveat to this perspective is the work byHenderson and Clark [16], who studied the relationshipsbetween architectural knowledge as embodied in the prod-uct architecture and the capability of companies to imple-ment architectural innovation. They showed that simplymodularizing the physical architecture of a product does notthen mean that knowledge underlying the product has alsobeen modularized. Brusoni and Prencipe [17] emphasize thepoint “that product modularization does not derive from, norbring about, knowledge modularization”. When there is acorrespondence between architectural and knowledge mod-ularity, Ethiraj et al. [18] showed that an increase in physicalproduct modularity decreased the cognitive complexity ofthe product, leading to easier and quicker imitation bycompetitors. In essence, they point toward the main thrust of
Please cite this article as: A. Dong, S. Sarkar, Forecasting technoloknowledge, Technol. Forecast. Soc. Change (2014), http://dx.doi.org
this article: the complexity of the knowledge structureunderlying a product influences the dynamics of progress.The questions are, how complex and complex relative towhat?
Modeling progress according to architectural modularityalone downplays the inherent difficulty in producing newknowledge relevant to the product and the knowledgedependencies between interacting components and systems.When it comes to product innovation, knowledge is both arequisite of innovation and a barrier to innovation. It is abarrier to innovation because the process of acquiring andtransforming knowledge input into innovation output iscostly and requires coordination. Previously, scholars haveexamined the problem of the complexity of the coordinationin relation to the complexity of the task structure [19,20] orproduct architecture [21]. Much less is known, though, howthe complexity of the knowledge structure may affect thecost of transforming the knowledge into an innovation, withthe exception of the study by Dollinger [22], who demon-strated that increasing complexity of information requiresmore boundary spanning across knowledge domains byindividuals so as to produce cohesive strategic plans.
We thus make one important correction and contributionto studies aiming to forecast the progress potential ofproducts: the fundamental factor in the progress potentialof a product is not the complexity of the product architecture,but rather the complexity of the underlying knowledgestructure for the product. Our main hypothesis is thatprogress potential is bounded by the degree of complexity(or simplicity) of the underlying knowledge structure of aproduct, which represents both knowledge associated withthe product's core technology and the configuration ofthe parts and sub-systems around the core technology toproduce a commercially viable product. The challenge lays inunderstanding the differentials in underlying knowledgestructures for products. Which characteristics of knowledgestructures distinguish the complexity of products and howcan the complexity of product knowledge structures beassessed to ascertain progress potential?
This paper explores the hypothesis that a relationshipexists between product knowledge structure and the product'sprogress potential. We describe an approach based oncomplex network theory and tensor analysis. The complexityof the knowledge structure for a product is compared toproducts within its class in a form of outside-view referenceclass forecasting [23]. We present three hypotheses to testwhich topological properties distinguish the complexity ofproducts and examine these topological properties for a set ofproducts. Our first hypothesis tests the degree of connectivitybetween knowledge elements associated with a product. Thesecond hypothesis tests the relative sizes of modules ofknowledge elements. The third hypothesis tests the linksbetween knowledge elements to elements outside of itsknowledge module. Each of the hypotheses is based on a setof arguments relating to challenges associated with producingnew stock of knowledge as the knowledge structure complex-ity increases. We illustrate our approach on a set of energyconversion devices employing various core technologiesincluding piezoelectric, wind, wave, and solar to find evidenceto support our principle hypothesis that a relationship existsbetween the complexity of product knowledge structures andthe rate of progress.
gical progress potential based on the complexity of product/10.1016/j.techfore.2014.02.009

3A. Dong, S. Sarkar / Technological Forecasting & Social Change xxx (2014) xxx–xxx
We find that the topological properties of node degreeand clustering coefficient distinguish the knowledge struc-ture complexity of products, whereas there is insufficientdifference in community sizes and community degree. Thatis, there is support for the first hypothesis but insufficientsupport for the second and third hypotheses in our data set.We find that piezoelectric technologies have product knowl-edge structures with the lowest node degree and clusteringcoefficient. The similarity in knowledge structure complexitybased on node degree and clustering coefficient for wind andsolar energy harvester devices follows the observed learningrates for wind power and solar photovoltaic panels [24]. Thiscorrespondence and the statistically significant difference innode degree and clustering coefficient between productsemploying piezoelectric technologies and other productslead us to conjecture that piezoelectric-based energy har-vesting products will likely progress the fastest. Wind andsolar products will progress at approximately the same ratesand slower than piezoelectric. Hybrid technologies combin-ing wind and solar will progress the slowest.
2. Forecasting method
2.1. Knowledge representation
In this section, we develop a means to model theknowledge underlying a product. In the field of engineeringdesign, one of the most accepted methods for modeling aproduct in a component and architecture independentmanner is from the perspective of the product's function, inother words, what it is intended to do. Conceptualizing aproduct in terms of its intended functions is considered aknowledge-oriented view of engineering design. Functionalrepresentations of products include the Function–Behavior–Structure (FBS) ontology [25], the design matrix [26], andfunctional modeling [27,28]. In this paper, we will utilize thefunctional model because of its ontological rigor. A functionalmodel identifies the intended purpose behind a product,typically using a standardized and economical (exhaustivebut mutually exclusive) set of function-related terminologysuch as the functional basis [28]. More formally, function isthe operation on a flow, or the manner in which an input istransformed into an output [29], as depicted in Fig. 1 for apiezoelectric component (adapted from [30]).
The functional modeling approach provides ‘structural’data about the knowledge underlying a product, because thefunctions (e.g., convert, transmit) describe the intended reasonbehind the existence of the product, and the flows (e.g., humanenergy, mechanical energy, electrical energy) connect thefunctions to produce the full set of functional requirementsfor the product [31]. Further, because a functional model canrely on a controlled vocabulary (ontology) of function and flow
Fig. 1. Functional model of a p
Please cite this article as: A. Dong, S. Sarkar, Forecasting technoloknowledge, Technol. Forecast. Soc. Change (2014), http://dx.doi.org
with the functional basis [28], it describes product knowledgein an objective and uniform manner.
The functional model lends itself to mathematical repre-sentation in matrix form since all that is required to producethe knowledge representation is to answer the question:Does a product implement a given function on a given flow?If the answer to this question is ‘Yes’, then it can be said that aproduct contains a flow that is operated on by a number offunctions. Matrix A in Eq. (1) models the structure of theknowledge about the product because it provides a mappingbetween m functions and n flows, where ai,j = 1 if function ioperates on flow j and 0 otherwise.
Aa1;1 a1;2 ⋯ a1;na2;1 a2;2 ⋯ a2;n⋮ ⋮ ⋱ ⋮
am;1 am;2 ⋯ am;n
0BB@
1CCA ð1Þ
Alternatively, we can represent matrix A as a bi-partitenetwork G. Each type-1 node in G is a function and eachtype-2 node is a flow. A homomorphism exists between therepresentation of G and matrix A. Matrix A is an adjacencymatrix of network G:
Aij ¼ 0 if an edge exists between nodes i and j1 otherwise
:
�ð2Þ
A typical functional model will contain a variety offunctions, possibly repeated, operating on a set of flows. Iffunctional models represent a set of products achieving asimilar primary function, such as generating electricity, thenthe set of knowledge structures becomes a reference classagainst which the complexity of a specific knowledge structurecan be compared. In the next section, we turn to the details ofmaking this relative comparison of knowledge complexity.
2.2. Quantifying the complexity of the knowledge structure
To motivate our approach to quantify the complexity ofthe knowledge structure, we consider the issue of indepen-dence and dependence in the knowledge structure, alongwith two associated boundary conditions. At one boundarycondition lies a truly decoupled design. Matrix A is fullydiagonal with network G containing independent pairs of asingle type-1 node connected to exactly one type-2 node.Each function operates on exactly one flow. Modularity existsin a perfect form in this matrix, as modular functions do notaffect other functions and flows. In a perfectly modularknowledge structure, what is known about one aspect of adesign neither affects nor influences knowledge aboutanother aspect of the design. For example, to know how theLCD screen of a cell phone works, I do not also need to know
iezoelectric component.
gical progress potential based on the complexity of product/10.1016/j.techfore.2014.02.009

4 A. Dong, S. Sarkar / Technological Forecasting & Social Change xxx (2014) xxx–xxx
how the Li-ion battery works, except for its power output,and knowledge of these two aspects of the cell phone isessentially independent. At the other boundary condition liesa truly coupled design. That is, matrix A is fully filled, withnetwork G containing all type-1 nodes connected to all othertype-2 nodes. Each function operates on all flows, which inturn affects all other functions. Modularity does not exist atall in this matrix; no function can be altered without affectingany other function or flow.
In general, matrix A is neither perfectly diagonal nor fullyfilled because the knowledge structure for a product involvesa complex set of interactions between the functions andflows. Returning to the example of the cell phone, knowledgeabout a touch screen requires knowledge of both capacitivesensing and liquid crystal display technology. Algebraicproperties of matrix A or equivalently the topologicalproperties of network G can characterize the degree ofcomplex coupling in the knowledge structure.
The field of complex networks has developed a number oftechniques and metrics to characterize the complexity ofnetworks in terms of their topological properties [32]. Thespecific topological property of interest is the modularorganization of the complex network including the numberof modules, the number of levels of hierarchical organization,and node properties at the various levels of modularorganization of the network. In Section 3, we will explainthe relevance of modularity in the knowledge structureto progress potential. We first explain how we identifymodularity in the knowledge structures.
A module is a tightly clustered or interacting subset ofnodes in the network that has much sparser interaction withthe rest of the network. By definition, a module has moreintra-module edges than inter-module edges. If there ismodular organization in the network, many nodes inmodules will have common neighbors. This will result inmany columns in the adjacency matrix of the network havingthe same or similar entries, resulting in redundancy ofinformation. Thus, the number of modules will always bemuch lower than the rank of matrix A. In contrast, if there isno modular organization in the network, e.g., there is perfectindependence in the adjacency matrix, then the number ofmodules will be exactly the rank of matrix A. If there aremodules, what this means is that there is mathematicalredundancy in the adjacency matrix, because there arelinearly dependent rows or columns, and a lower dimen-sional basis for those vectors exists.
In previous work, we have proven that the Eigenvalue orSingular Value Decomposition (EVD/SVD) provides an effi-cient way to detect the modular organization and levels ofhierarchical modular organization of complex networks byanalyzing the eigenvalue/singular value spectra of theiradjacency matrices [33,34]. We summarize the key findingsherein. The eigenvalue (for networks having a single type ofnode) or singular value (for networks having two types ofnodes) spectra provide sufficient information both to identifythe optimal number of modules in the network and toidentify which nodes belong to which modules, includingtheir possible overlap into multiple modules. First, theeigenvalue/singular value spectra correspond to the modu-larity structure of the network. The number of largesteigenvalues/singular values well separated from the tail of
Please cite this article as: A. Dong, S. Sarkar, Forecasting technoloknowledge, Technol. Forecast. Soc. Change (2014), http://dx.doi.org
the trailing ones exactly describes the optimal number ofmodules in the network. If the network has a hierarchicalmodular organization, the largest singular values have astepped pattern of decrease, i.e., clusters of similar singularvalues followed by a large gap followed by another suchcluster, and so on. The number of such gaps describes thenumber of hierarchical levels and the number of singularvalues of similar magnitude at each step describes thenumber of modules within that level. Second, a least squaresapproximation of the network's adjacency matrix generatedby truncating the eigenvalue/singular value matrix and theirassociated eigenvectors at the optimal degree of modularity khas the net effect of translating positions of nodes into acontinuous real-valued space where previously the positionsof nodes were in a binary space. By clustering nodes in spaceusing a simple algorithm such as k-means clustering with adistance-based metric, the modules in the network can bereadily identified. One other important consequence of theleast squares approximation is that nodes that were previ-ously modeled as not having an edge relation, or converselynodes that weremodeled as having an edge relation, may havetheir edge relations strengthened (i.e., Aij = 0 ⇒ Aij N 0) orweakened depending upon the statistical pattern of edgerelations across the entire network. The strengthening orweakening of edge relations reveals additional or decreasedlatent complexity that was previously unaccounted for in theoriginal network model. This is an essential outcome forassessing the actual complexity of networks (knowledgestructures).
To make the relative comparisons of knowledge com-plexity, we must take one more analytical step. Up to thispoint, we have been discussing the knowledge structure forproducts based upon single, independent network represen-tations. Topological signatures of complexity for each knowl-edge structure without reference to a class would not provideus meaningful information, however. In other words, we stillneed an answer to the question of complexity relative towhat. Our approach is to compare the knowledge structure ofa product to a reference class. To perform this comparison,we draw upon the main pillars of reference class forecasting[35] and outside-view similarity-based forecasting [23,36],which are: 1) to generate forecasts from an unbiased class ofsimilar projects; and 2) draw on statistical relations betweenthe target and the reference class. Based upon theseprinciples, we combine the knowledge structure for a set ofsimilar products, where similarity is determined by theprimary function of the product rather than the technologyemployed by the product, into a single knowledge structureconsisting of all of the products. The ‘stacked’ functionalmodels result in a tensor representation of order 3:product × function × flow. A tensor is a matrix with dimen-sionality greater than 2. Consistent with accepted notation,tensors will be represented with boldface Euler capitals, e.g.,A. Tensor A is a knowledge representation for a class ofproducts. By embedding the knowledge structure for aproduct into a tensor representation for the knowledgestructure of the class, we can compute the statistical patternof cross-relations (i.e., similarities) of knowledge shared byall of the products in the class using the Higher-OrderSingular Value Decomposition (HOSVD) tensor decomposi-tion. The HOSVD is a generalization of the singular value
gical progress potential based on the complexity of product/10.1016/j.techfore.2014.02.009

5A. Dong, S. Sarkar / Technological Forecasting & Social Change xxx (2014) xxx–xxx
decomposition [37]. The HOSVD decomposes a tensor A into acore tensor C (equivalent to the matrix of singular values S)and a set of matrices B (equivalent to the left and rightsingular vectors U and V) along each mode of A. Computingthe HOSVD of an order N tensor is equivalent to thecomputation of N different matrix SVDs, one for eachn-mode matrix unfolding of the tensor A [37]. The conse-quence of this homomorphism between SVD and HOSVD isthat concepts about identifying the modularity of complexnetworks apply equivalently to networks described astwo-dimensional matrices and order N tensors. Findings onthe number of modules and levels of organization apply tothe singular value spectra of tensors due to the homomor-phism of SVD and HOSVD. The significance of this general-ization is that we thus have a unified method to characterizeboth the degree of modularity (how many modules) andhierarchical modularity (how many modules at differentlevels of organization of the knowledge structure) inmulti-dimensional knowledge structures.
The HOSVD, like the SVD, changes the values of the cells inthe tensor depending upon their original statistical pattern ofcross-relations when the tensor is re-represented in atruncated lower-dimensional space. If the knowledge struc-ture for a product is similar to the class, then the values in thecells (their node positions in a continuous real-valued 3Dspace) of the ‘slice’ of the tensor representing the productwill become similar in value to the values for the class duringthe tensor decomposition process. Changes to values inthe tensor following the HOSVD decomposition have theeffect of altering the topological properties of the networkrepresenting the knowledge for the product so that it is moresimilar to the topological properties of the class. The sameeffects happen in reverse. As the knowledge structure for theproduct differs from the class, the values in the cells of the‘slice’ of the tensor diverge from the class. The consequence isthat the topological properties of the network representingthe knowledge for the product also diverge from the class. Inshort, by combining the knowledge structures into a singletensor, and then computing the HOSVD of the tensor, we cancompare knowledge structures of products relative to theirclass in a single computation.
The only remaining step is to derive hypotheses linkingtopological properties of a network representing a knowl-edge structure and its complexity to progress potential. Wedevelop these hypotheses in the next section.
3. Hypotheses on complexity and progress potential
If the essence of innovation is the production and integra-tion of knowledge in a new way, these knowledge-orientedactivities will entail a cost influenced by the complexity of theknowledge structure. Topological properties associated withthemodular organization of complex networks are proposed toexplain the influence of the complexity of knowledge structureon progress potential. We propose three hypotheses based onthe complex network topological properties of node degree,clustering coefficient, community size, and node overlap in theknowledge structure of products.
Hypothesis 1. Progress potential increases as the nodedegree decreases and as clustering coefficient decreases.
Please cite this article as: A. Dong, S. Sarkar, Forecasting technoloknowledge, Technol. Forecast. Soc. Change (2014), http://dx.doi.org
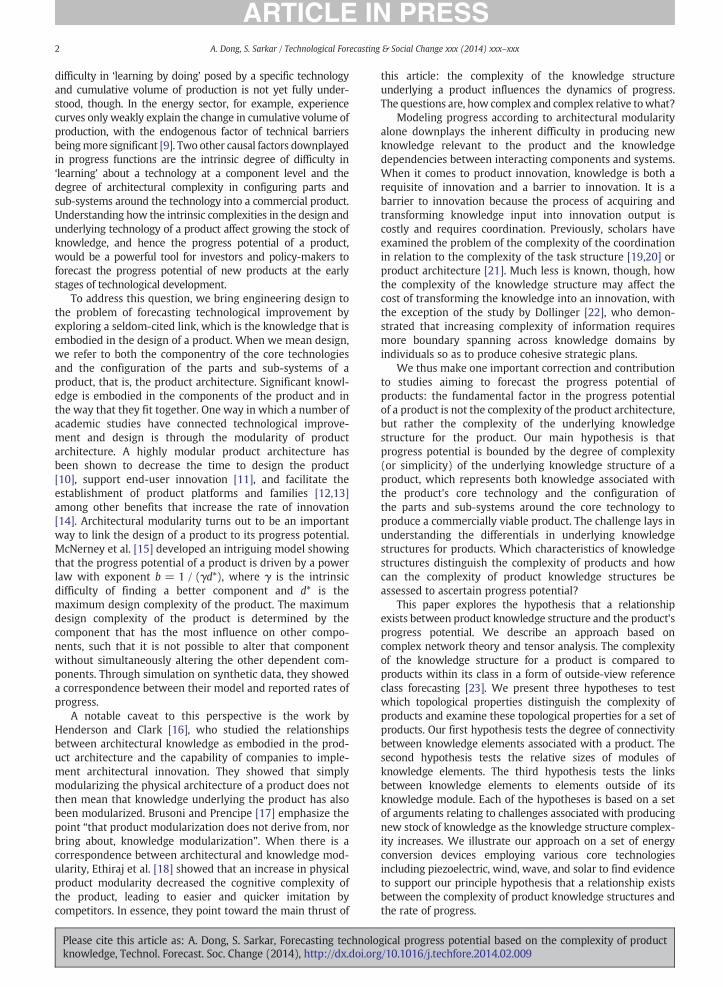
A complex network consists of components that interactand that are interdependent to some degree. The degree ofdecomposability of the network into modules that have weakinteractions between them but strong interactions withinthem [38] is partially determined by the degree of intercon-nectedness of the nodes. At one extreme is a fully connectedcomplex network, in which every node is connected by anedge to every other node; this network is not decomposable,and there is only a single community. At the other extremeare fully independent nodes. Knowledge structures that aredecomposable intomodules can enable the creation ofmodularorganizational units to handle the associated knowledgecreation activities [39]. The complex network features ofNode Degree (ND) and Clustering Coefficient (CC) capturethis degree of interconnectedness of nodes. In a knowledgestructure, each edge represents a dependency betweenknowledge (nodes). The ND is the number of edges (links)per node and is one of the most fundamental features of acomplex network, as illustrated in Fig. 2. The CC measures theprobability that two nodes connected to some other node arethemselves connected; that is, the CC measures the density ofknowledge clusters in terms of the number of actual “triangles”compared to the number that is theoretically possible. Highvalues of CC indicate that there are dense knowledgedependencies in the knowledge structure.
Hypothesis 2. Progress potential increases as the modulesizes approach equilibrium.
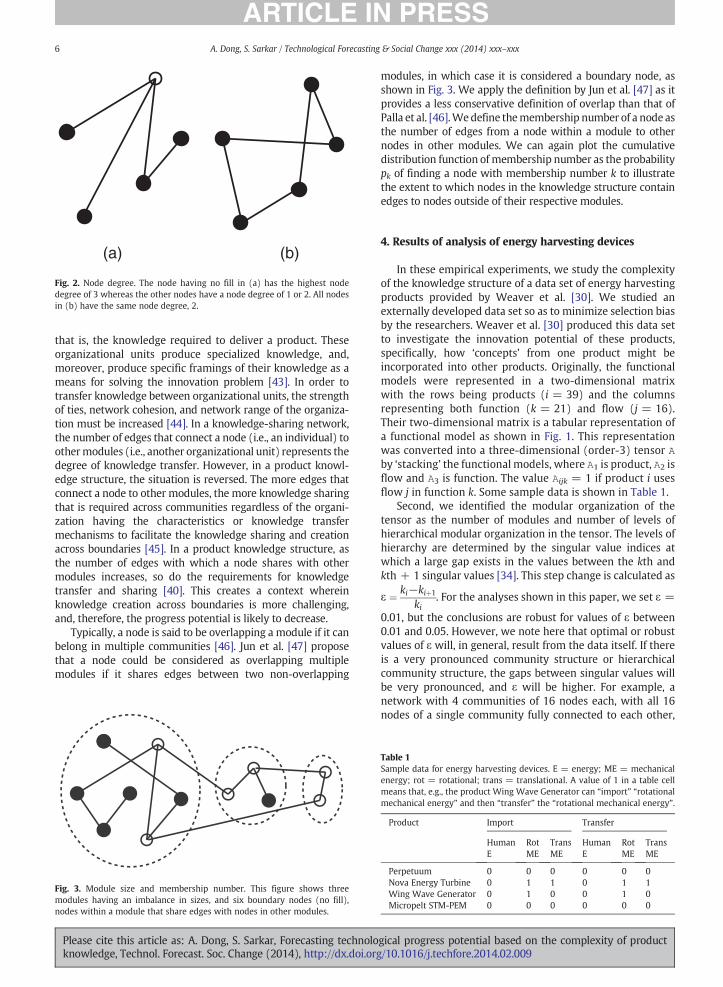
The module size is the number of nodes in a module, asillustrated in Fig. 3. If a given knowledge structure partitionsinto a few large modules and then many small ones asopposed to modules of approximately the same size(equilibrium), this means that there is an imbalance in thetype and amount of knowledge located within thesemodules. This imbalance introduces a coordination problemfor companies in knowledge sharing and transfer. Thedifference in type and amount of domain-specific knowl-edge within each module increases the effort to share theknowledge [40]. Knowledge sharing activities require moreeffort from the smaller knowledge community because ittakes more time for the smaller community to absorbknowledge transmitted by the larger community [41]. Thisview leads us to hypothesize that products having knowl-edge structures containing disproportionately sized mod-ules will progress more slowly than products havingknowledge structures containing similarly sized modules.We measure this imbalance through the complex networkfeature of community degree. The community degree is theprobability pk of finding a module with size k in the knowledgestructure. A cumulative distribution plot of the communitydegree would identify the extent to which modules have asimilar size. A convex shapemeans that there are a fewmodulesof large size whereas a concave shape means that there aremany modules of similar size.
Hypothesis 3. Progress potential increases as the number ofmodules with which a node shares an edge decreases.
Organizational boundaries of companies are often basedupon around distinct units of knowledge and expertise [42],
gical progress potential based on the complexity of product/10.1016/j.techfore.2014.02.009
(a) (b)
Fig. 2. Node degree. The node having no fill in (a) has the highest nodedegree of 3 whereas the other nodes have a node degree of 1 or 2. All nodesin (b) have the same node degree, 2.
6 A. Dong, S. Sarkar / Technological Forecasting & Social Change xxx (2014) xxx–xxx
that is, the knowledge required to deliver a product. Theseorganizational units produce specialized knowledge, and,moreover, produce specific framings of their knowledge as ameans for solving the innovation problem [43]. In order totransfer knowledge between organizational units, the strengthof ties, network cohesion, and network range of the organiza-tion must be increased [44]. In a knowledge-sharing network,the number of edges that connect a node (i.e., an individual) toothermodules (i.e., another organizational unit) represents thedegree of knowledge transfer. However, in a product knowl-edge structure, the situation is reversed. The more edges thatconnect a node to other modules, the more knowledge sharingthat is required across communities regardless of the organi-zation having the characteristics or knowledge transfermechanisms to facilitate the knowledge sharing and creationacross boundaries [45]. In a product knowledge structure, asthe number of edges with which a node shares with othermodules increases, so do the requirements for knowledgetransfer and sharing [40]. This creates a context whereinknowledge creation across boundaries is more challenging,and, therefore, the progress potential is likely to decrease.
Typically, a node is said to be overlapping a module if it canbelong in multiple communities [46]. Jun et al. [47] proposethat a node could be considered as overlapping multiplemodules if it shares edges between two non-overlapping
Fig. 3. Module size and membership number. This figure shows threemodules having an imbalance in sizes, and six boundary nodes (no fill)nodes within a module that share edges with nodes in other modules.
Table 1Sample data for energy harvesting devices. E = energy; ME = mechanicalenergy; rot = rotational; trans = translational. A value of 1 in a table cellmeans that, e.g., the product Wing Wave Generator can “import” “rotationalmechanical energy” and then “transfer” the “rotational mechanical energy”.
Product Import Transfer
HumanE
RotME
TransME
HumanE
RotME
TransME
Perpetuum 0 0 0 0 0 0Nova Energy Turbine 0 1 1 0 1 1Wing Wave Generator 0 1 0 0 1 0Micropelt STM-PEM 0 0 0 0 0 0
Please cite this article as: A. Dong, S. Sarkar, Forecasting teknowledge, Technol. Forecast. Soc. Change (2014), http://dx
,
chnolo.doi.org
modules, in which case it is considered a boundary node, asshown in Fig. 3. We apply the definition by Jun et al. [47] as itprovides a less conservative definition of overlap than that ofPalla et al. [46].Wedefine themembership number of a node asthe number of edges from a node within a module to othernodes in other modules. We can again plot the cumulativedistribution function of membership number as the probabilitypk of finding a node with membership number k to illustratethe extent to which nodes in the knowledge structure containedges to nodes outside of their respective modules.
4. Results of analysis of energy harvesting devices
In these empirical experiments, we study the complexityof the knowledge structure of a data set of energy harvestingproducts provided by Weaver et al. [30]. We studied anexternally developed data set so as to minimize selection biasby the researchers. Weaver et al. [30] produced this data setto investigate the innovation potential of these products,specifically, how ‘concepts’ from one product might beincorporated into other products. Originally, the functionalmodels were represented in a two-dimensional matrixwith the rows being products (i = 39) and the columnsrepresenting both function (k = 21) and flow (j = 16).Their two-dimensional matrix is a tabular representation ofa functional model as shown in Fig. 1. This representationwas converted into a three-dimensional (order-3) tensor Aby ‘stacking’ the functional models, where A1 is product, A2 isflow and A3 is function. The value Aijk = 1 if product i usesflow j in function k. Some sample data is shown in Table 1.
Second, we identified the modular organization of thetensor as the number of modules and number of levels ofhierarchical modular organization in the tensor. The levels ofhierarchy are determined by the singular value indices atwhich a large gap exists in the values between the kth andkth + 1 singular values [34]. This step change is calculated as
ε ¼ ki−kiþ1
ki. For the analyses shown in this paper, we set ε =
0.01, but the conclusions are robust for values of ε between0.01 and 0.05. However, we note here that optimal or robustvalues of ε will, in general, result from the data itself. If thereis a very pronounced community structure or hierarchicalcommunity structure, the gaps between singular values willbe very pronounced, and ε will be higher. For example, anetwork with 4 communities of 16 nodes each, with all 16nodes of a single community fully connected to each other,
gical progress potential based on the complexity of product/10.1016/j.techfore.2014.02.009

7A. Dong, S. Sarkar / Technological Forecasting & Social Change xxx (2014) xxx–xxx
but to no other community, will show the highest ε = 1. Ifthere is a weak community structure or hierarchical com-munity structure, the gaps between the singular values willbe smaller and the whole spectrum will be smoother,resulting in lower ε values. In our data set, we identified 5levels of hierarchy and corresponding sets of singular valueindices, or k-indices, representing the number of modulesat each level of hierarchy along each of the 3 tensor modes:(7, 3, 4); (11, 8, 8); (13, 11, 11); (13, 13, 14); and, (13, 13,16). Using these k-indices as levels of modular organizationof the tensor, we compare the complexity of the knowledgestructure of individual products to the class.
We begin by performing a test of internal validity. Given thedata set, we expect that similar types of products would appearin the samemodule alongmode-1 (the productmode). That is,all the products grouped by Weaver et al. [30] as thermalproducts should appear in the same module. Indeed, acomparison of the modules in mode-1 with the classificationby Weaver et al. [30] shows a high-degree of correspondence.Table 2 shows the accuracy (the fraction of products thatshould appear in the module) and precision (the fraction ofproducts in a cluster that are relevant) of the clustering ofproducts into modules along mode-1. In the results shown inTable 2, the original categories of inductive and piezoelectricvibration were combined and the categories of wind, solar andhybrid were combined before making the accuracy andprecision calculations. The rationale behind combining someof the categories is that piezoelectric products are found in boththe inductive and piezoelectric vibration categories, and theproducts in the hybrid category combine both wind and solartechnologies, so they are equally similar to products in thewind or solar categories alone. Accuracy and precision levelsabove 80%, generally regarded as thresholds for automatedclustering, show that themethod is able to cluster the productsinto appropriate communities of products sharing similarmodes of input for energy harvesting and technologies forconverting the energy.
We now turn our attention to the comparison of thetopological properties of each individual product to the class.For each product, which is represented by a ‘horizontal’ sliceof the tensor, we calculated the metrics associated with eachof the hypotheses at each level of hierarchical organization ofthe tensor, that is, for each set of k-indices stated previously.Each horizontal slice of the tensor represents the knowledgerelation between the flow and the function for each productcalculated at each level of hierarchical organization of theknowledge structure for the class. In order to convert thematrix for each slice into a network according to Eq. (2), weset an edge threshold value. An edge is wired between nodesin a ‘slice’ if the value in a cell is greater than or equal to thethreshold.
Table 2Product cluster accuracy and precision.
Cluster name Accuracy Precision
Inductive and piezoelectric vibration 100% 100%Wind, solar and hybrid 100% 93.75%Ocean 100% 100%Thermal 100% 80%
Please cite this article as: A. Dong, S. Sarkar, Forecasting technoloknowledge, Technol. Forecast. Soc. Change (2014), http://dx.doi.org
To test Hypothesis 1, we calculated the topologicalproperties of node degree and clustering coefficient acrossall k-indices. For threshold values greater than 0.6, for someproducts (Innowattech piezoelectric vibration harvester andtransparent film on window solar panels) at the lowest levelof hierarchical organization, k-index (7, 3, 4), no edges couldbe established between nodes. This is a numerical artifact ofthe weak knowledge relation between function and flow forsome products. To enable a comparison of node degree andclustering coefficient across all products, we set the thresholdceiling at 0.6.We test Hypothesis 1 in twoways: by technologyand by individual product. Table 3 shows the descriptivestatistics for ND and CC calculated at the various levels ofhierarchical organization of the knowledge structure for theproducts and grouped by underlying technology as categorizedby Weaver et al. [30].
There is a statistically significant difference in averagenode degree and clustering coefficient between the tech-nologies. The one-way, between-technologies analysis ofvariance revealed an effect of technology on node degree,F (6, 188) = 22.351, p b .001, M Serror = 1.896, α = .05,and on clustering coefficient, F (6, 188) = 29.458, p b .001,M Serror = .007, α = .05. The choice of technology has astatistically significant difference in node degree andclustering coefficient for product knowledge structures. AWelch test of means confirmed that there is a statisticallysignificant difference in the means at the α = 0.05 level.Post-hoc comparisons using the Tukey HSD test indicatedthat the mean value of the node degree and clusteringcoefficient for the hybrid technologies was statisticallyhigher than all of the other technologies. With respect tohybrid products, combining technologies makes the knowl-edge about the products more complex, as would be expected.The technology with the lowest node degree, piezoelectricvibration, is statistically significantly lower than all the othertechnologies except ocean at the α = 0.05 level. The technol-ogy with the lowest clustering coefficient, piezoelectricvibration, is statistically significantly lower than all of theother technologies at the α = 0.05 level. In summary, we findsupport for Hypothesis 1. The statistically significant differencein average node degree and clustering coefficient distinguishesproducts having a higher knowledge structure complexity.
To compare the knowledge complexity of individual prod-ucts, we calculated the node degree and clustering coefficientfor all products at the various k-indices and edge thresholds tocheck the robustness of the results. Figs. 4 and 5 show thevariation of average node degree and clustering coefficient,respectively, by edge threshold for all of the products at k-index(7, 3, 4) due to space limitations. The purpose of these graphs isto identify the product(s) having a knowledge structure withthe lowest node degree and clustering coefficient. This deter-mination entails identifying the products corresponding to thelines having the lowest, non-zero node degree or clusteringcoefficient at the highest edge threshold. Identifying the producthaving the lowest non-zero node degree or clustering coeffi-cient at increasing edge thresholds sets a conservative rule, as itrequires a stronger connection between knowledge elements.Consistent with the previous results at the technology level, theproduct having the lowest node degree and clusteringcoefficient is the Innowattech piezoelectric energy harvester.The three products with consistently lower node degree
gical progress potential based on the complexity of product/10.1016/j.techfore.2014.02.009
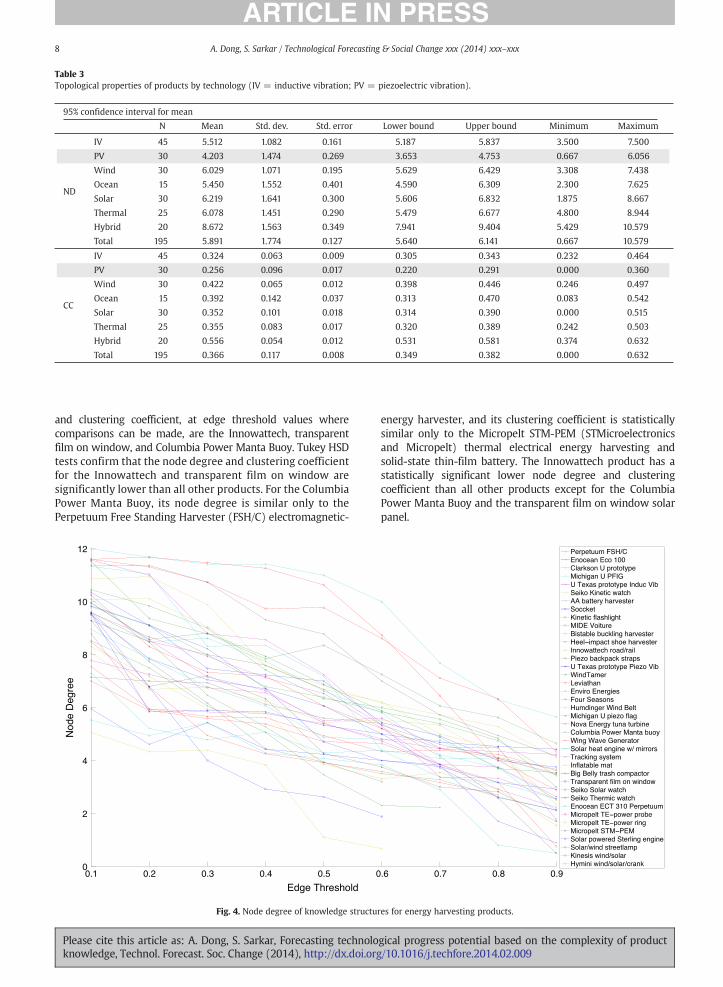
Table 3Topological properties of products by technology (IV = inductive vibration; PV = piezoelectric vibration).
95% confidence interval for mean
N Mean Std. dev. Std. error Lower bound Upper bound Minimum Maximum
ND
6.056
7.438
CC
0.360
0.497
IV 45 5.512 1.082 0.161 5.187 5.837 3.500 7.500
PV 30 4.203 1.474 0.269 3.653 4.753 0.667
Wind 30 6.029 1.071 0.195 5.629 6.429 3.308
Ocean 15 5.450 1.552 0.401 4.590 6.309 2.300 7.625
Solar 30 6.219 1.641 0.300 5.606 6.832 1.875 8.667
Thermal 25 6.078 1.451 0.290 5.479 6.677 4.800 8.944
Hybrid 20 8.672 1.563 0.349 7.941 9.404 5.429 10.579
Total 195 5.891 1.774 0.127 5.640 6.141 0.667 10.579
IV 45 0.324 0.063 0.009 0.305 0.343 0.232 0.464
PV 30 0.256 0.096 0.017 0.220 0.291 0.000
Wind 30 0.422 0.065 0.012 0.398 0.446 0.246
Ocean 15 0.392 0.142 0.037 0.313 0.470 0.083 0.542
Solar 30 0.352 0.101 0.018 0.314 0.390 0.000 0.515
Thermal 25 0.355 0.083 0.017 0.320 0.389 0.242 0.503
Hybrid 20 0.556 0.054 0.012 0.531 0.581 0.374 0.632
Total 195 0.366 0.117 0.008 0.349 0.382 0.000 0.632
8 A. Dong, S. Sarkar / Technological Forecasting & Social Change xxx (2014) xxx–xxx
and clustering coefficient, at edge threshold values wherecomparisons can be made, are the Innowattech, transparentfilm on window, and Columbia Power Manta Buoy. Tukey HSDtests confirm that the node degree and clustering coefficientfor the Innowattech and transparent film on window aresignificantly lower than all other products. For the ColumbiaPower Manta Buoy, its node degree is similar only to thePerpetuum Free Standing Harvester (FSH/C) electromagnetic-
12
10
8
6
4
2
00.1 0.2 0.3 0.4 0.5 0
Fig. 4. Node degree of knowledge structu
Please cite this article as: A. Dong, S. Sarkar, Forecasting technoloknowledge, Technol. Forecast. Soc. Change (2014), http://dx.doi.org
energy harvester, and its clustering coefficient is statisticallysimilar only to the Micropelt STM-PEM (STMicroelectronicsand Micropelt) thermal electrical energy harvesting andsolid-state thin-film battery. The Innowattech product has astatistically significant lower node degree and clusteringcoefficient than all other products except for the ColumbiaPower Manta Buoy and the transparent film on window solarpanel.
.6 0.7 0.8 0.9
res for energy harvesting products.
gical progress potential based on the complexity of product/10.1016/j.techfore.2014.02.009

0.7
0.6
0.5
0.4
0.3
0.2
0.1
00.1 0.2 0.3 0.4 0.5 0.6 0.7 0.8 0.9
Fig. 5. Clustering coefficient of knowledge structures for energy harvesting devices.
9A. Dong, S. Sarkar / Technological Forecasting & Social Change xxx (2014) xxx–xxx
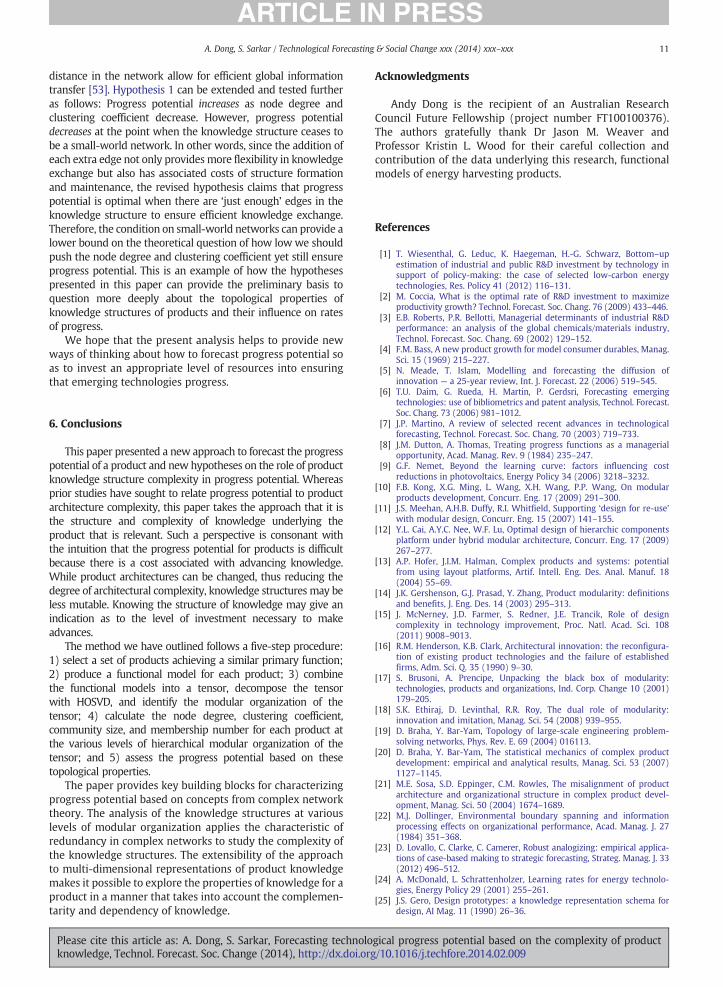
To test Hypothesis 2 and Hypothesis 3, we calculated themodule sizes and membership number of nodes. Fig. 6shows the cumulative distribution for community degreeand membership number for all of the products bytechnology. As before, these graphs were produced bycalculating the module size and membership number forall of the products at the edge threshold level of 0.6 for allk-indices. In this way we find as many modules as possiblein each knowledge structure so that we produce moreobservations of module size and membership number. Thegraphs do not provide a differential prediction of progress
0 5 10 15 200
0.2
0.4
0.6
0.8
1Community Degree
k,Degree
P(k
)
Inductive VibrationPiezoelectric VibrationWindOceanSolarThermalHybrid
((a)
Fig. 6. Community degree and membership number
Please cite this article as: A. Dong, S. Sarkar, Forecasting technoloknowledge, Technol. Forecast. Soc. Change (2014), http://dx.doi.org
potential because the distributions follow a similar shape.As the results are similar when we plot communitydegree and membership number by product, we do notshow these graphs. These results imply that communitydegree and membership number for product knowledgestructures may in general follow similar cumulativedistributions. In summary, we do not find sufficientdifferential in community degree and membership num-ber between these products to support using Hypothesis 2and Hypothesis 3 to gauge knowledge structure complex-ity and progress potential.
0 2 4 6 8 10 120
0.2
0.4
0.6
0.8
1Membership Number
k,Degree
P(k
)
Inductive VibrationPiezoelectric VibrationWindOceanSolarThermalHybrid
b)
for energy harvesting devices by technology.
gical progress potential based on the complexity of product/10.1016/j.techfore.2014.02.009

10 A. Dong, S. Sarkar / Technological Forecasting & Social Change xxx (2014) xxx–xxx
5. Discussion
Studies estimating the rate of progress of energy gener-ation technologies using experience curves have, of course,contributed much to thinking about policy decisions relatedto energy technology [24]. However, as some researchers arestarting to identify, the theoretical mechanism underlyingexperience curves, which is learning by experience, weaklyaccounts for actual progress [9,48]. What remains largelymissing is the study of the influence of knowledge underlyinga product and its core technology on the learning rate. Theknowledge structure of a product has important implicationson how companies organize themselves to create the requiredknowledge. Put simply, the structure of knowledge hasaffordances, which lend themselves to certain organizationalforms to enable learning-by-experience activities includingknowledge production, transfer, integration, and absorption.Our methodology complements existing forecasting methodsto estimate progress when companies (or industries) havescant historical data, and, thus, the use of experience curvesis not practical, or when a technology is simply not matureenough to have any certainty in the factors appearing incalculations such as the Levelized Cost of Energy (LCOE).
From a management of technological innovation perspec-tive, our methodology aims to answer the following ques-tion: the likelihood of progress under the assumption thatinvesting resources into a technology would yield progress.This question could be asked in at least two circumstances.Companies may be given a choice of alternatives in whichthey can invest resources. They may wish to know into whichproduct (and its associated technology) should investmentbe made because it is likely to progress faster and thusbecome commercially viable faster. In another circumstance,a company or a government may have already decided that itwill invest in a range of products andmust allocate a finite setof resources across them. This model provides guidance ondifferential potentials for progress, which suggests that someproducts, given their underlying technologies, may requiremore resources in order to make progress than another set ofproducts employing alternative technologies. We do not makethe recommendation that products that have less progresspotential should receive no resourcing. Some productsmay have important social benefits, such as job creation orenvironmental protection, which our model ignores. The maincontribution of our research is in explaining the differentialprogress potential inherent in real products so that differentialinvestment can be made.
Our model is limited by several important assumptions.First, the model considers endogenous characteristics only. Thatis, we do not take into account any exogenous factors such asmarket size, industry structure, or a company's capability todeliver the technological improvements. Second, this modeldoes not take into account whether the knowledge dependencyexists within the company or outside of the company (orindustry). In related research on innovation networks, whichmodel relationships between companies, those companies andinnovation networks that have strong and dense connectionstend to perform better in terms of achieved innovationoutcomes [49,50]. Our research could contribute to the researchin innovation networks by revealing the necessary degree ofinterdependence due to the node degree, clustering, and degree
Please cite this article as: A. Dong, S. Sarkar, Forecasting technoloknowledge, Technol. Forecast. Soc. Change (2014), http://dx.doi.org
of modularization of knowledge for the product they aredesigning. From the standpoint of managerial practice ininnovation networks, our prescription for increasing or decreas-ing the modularity of the innovation network would be basedon the degree of modularity of the knowledge, rather than thedegree of modularity of the product architecture.
Finally, our model does not consider the underlyingphysics of the specific energy harvesting devices and thecurrently known physical ceilings. Piezoelectric energyharvesters are currently limited in application to small-scaledevices that have modest power requirements rather thanlarge-scale power generation, which is where wind, solar,and wave technologies are currently being deployed. In otherwords, they occupy different market niches for energyharvesting. However, the piezoelectric energy harvestersmay prove to be the disruptive technology [51] since theyare currently being used to address “non-consumption” innew consumer products for which battery technology is notpractical, and, as the Innowattech product demonstrates,appear to have an upward pathway to utility-scale energygeneration by harvesting vibrations from large-scale infra-structure such as roads and railways.
While this work has taken initial steps toward establish-ing the link between knowledge complexity and forecastingproduct progress potential, there is much more potentialalong this line of reasoning. First, the knowledge structureutilized in this paper is based upon a fairly limited standardontology applicable to the description of electromechanicaldevices. We used a standard vocabulary to enable thedescription of a class of products in a uniform way. Otherontologies having a larger vocabulary may be applied withoutloss of generality of the approach. Additionally, other ontol-ogies would be more appropriate for other technologies anddomains such as microelectronics or biological systems. Inorder to obtain more technological forecast insight from thisapproach, it would be valuable to obtain historical data onsuccessive generations of products to calculate the editdistance, that is, the amount of graph transformation betweenthe knowledge structures of successive generations [52] as away to relate the rate of progress to knowledge complexity.
Further, the three hypotheses we present can be lookedupon as initial points of departure for reasoning more deeplyabout progress potential and innovation capacity using topo-logical properties of networks. Our hypotheses are currentlymonotonic; for example, the first hypothesis says that progresspotential increases as node degree and clustering coefficientdecrease, and we have empirically verified this finding for thecurrent sets of data. However, a deeper theoretical question forfuture enquiry is, “How low can you push the node degree orclustering coefficient so that you get the “fastest” or “mostoptimal” progress potential?” The boundary conditions are a(lowest) node degree and clustering coefficient of 0. However,this is physically meaningless in terms of products as well asknowledge structures. There can be no knowledge structure ifthere are no edges in the network. There has to be a physicallymeaningful answer to the question, “How low can we push thenode degree or clustering coefficient?” Therefore, one interest-ing line of reasoning in future researchwould be to combine thehypotheses presented here with research on small-worldnetworks. It is known, for example, that even in very sparsenetworks, the small-world properties of low average path
gical progress potential based on the complexity of product/10.1016/j.techfore.2014.02.009
11A. Dong, S. Sarkar / Technological Forecasting & Social Change xxx (2014) xxx–xxx
distance in the network allow for efficient global informationtransfer [53]. Hypothesis 1 can be extended and tested furtheras follows: Progress potential increases as node degree andclustering coefficient decrease. However, progress potentialdecreases at the point when the knowledge structure ceases tobe a small-world network. In other words, since the addition ofeach extra edge not only providesmore flexibility in knowledgeexchange but also has associated costs of structure formationand maintenance, the revised hypothesis claims that progresspotential is optimal when there are ‘just enough’ edges in theknowledge structure to ensure efficient knowledge exchange.Therefore, the condition on small-world networks can provide alower bound on the theoretical question of how low we shouldpush the node degree and clustering coefficient yet still ensureprogress potential. This is an example of how the hypothesespresented in this paper can provide the preliminary basis toquestion more deeply about the topological properties ofknowledge structures of products and their influence on ratesof progress.
We hope that the present analysis helps to provide newways of thinking about how to forecast progress potential soas to invest an appropriate level of resources into ensuringthat emerging technologies progress.
6. Conclusions
This paper presented a new approach to forecast the progresspotential of a product and new hypotheses on the role of productknowledge structure complexity in progress potential. Whereasprior studies have sought to relate progress potential to productarchitecture complexity, this paper takes the approach that it isthe structure and complexity of knowledge underlying theproduct that is relevant. Such a perspective is consonant withthe intuition that the progress potential for products is difficultbecause there is a cost associated with advancing knowledge.While product architectures can be changed, thus reducing thedegree of architectural complexity, knowledge structures may beless mutable. Knowing the structure of knowledge may give anindication as to the level of investment necessary to makeadvances.
The method we have outlined follows a five-step procedure:1) select a set of products achieving a similar primary function;2) produce a functional model for each product; 3) combinethe functional models into a tensor, decompose the tensorwith HOSVD, and identify the modular organization of thetensor; 4) calculate the node degree, clustering coefficient,community size, and membership number for each product atthe various levels of hierarchical modular organization of thetensor; and 5) assess the progress potential based on thesetopological properties.
The paper provides key building blocks for characterizingprogress potential based on concepts from complex networktheory. The analysis of the knowledge structures at variouslevels of modular organization applies the characteristic ofredundancy in complex networks to study the complexity ofthe knowledge structures. The extensibility of the approachto multi-dimensional representations of product knowledgemakes it possible to explore the properties of knowledge for aproduct in a manner that takes into account the complemen-tarity and dependency of knowledge.
Please cite this article as: A. Dong, S. Sarkar, Forecasting technoloknowledge, Technol. Forecast. Soc. Change (2014), http://dx.doi.org
Acknowledgments
Andy Dong is the recipient of an Australian ResearchCouncil Future Fellowship (project number FT100100376).The authors gratefully thank Dr Jason M. Weaver andProfessor Kristin L. Wood for their careful collection andcontribution of the data underlying this research, functionalmodels of energy harvesting products.
References
[1] T. Wiesenthal, G. Leduc, K. Haegeman, H.-G. Schwarz, Bottom–upestimation of industrial and public R&D investment by technology insupport of policy-making: the case of selected low-carbon energytechnologies, Res. Policy 41 (2012) 116–131.
[2] M. Coccia, What is the optimal rate of R&D investment to maximizeproductivity growth? Technol. Forecast. Soc. Chang. 76 (2009) 433–446.
[3] E.B. Roberts, P.R. Bellotti, Managerial determinants of industrial R&Dperformance: an analysis of the global chemicals/materials industry,Technol. Forecast. Soc. Chang. 69 (2002) 129–152.
[4] F.M. Bass, A new product growth for model consumer durables, Manag.Sci. 15 (1969) 215–227.
[5] N. Meade, T. Islam, Modelling and forecasting the diffusion ofinnovation — a 25-year review, Int. J. Forecast. 22 (2006) 519–545.
[6] T.U. Daim, G. Rueda, H. Martin, P. Gerdsri, Forecasting emergingtechnologies: use of bibliometrics and patent analysis, Technol. Forecast.Soc. Chang. 73 (2006) 981–1012.
[7] J.P. Martino, A review of selected recent advances in technologicalforecasting, Technol. Forecast. Soc. Chang. 70 (2003) 719–733.
[8] J.M. Dutton, A. Thomas, Treating progress functions as a managerialopportunity, Acad. Manag. Rev. 9 (1984) 235–247.
[9] G.F. Nemet, Beyond the learning curve: factors influencing costreductions in photovoltaics, Energy Policy 34 (2006) 3218–3232.
[10] F.B. Kong, X.G. Ming, L. Wang, X.H. Wang, P.P. Wang, On modularproducts development, Concurr. Eng. 17 (2009) 291–300.
[11] J.S. Meehan, A.H.B. Duffy, R.I. Whitfield, Supporting ‘design for re-use’with modular design, Concurr. Eng. 15 (2007) 141–155.
[12] Y.L. Cai, A.Y.C. Nee, W.F. Lu, Optimal design of hierarchic componentsplatform under hybrid modular architecture, Concurr. Eng. 17 (2009)267–277.
[13] A.P. Hofer, J.I.M. Halman, Complex products and systems: potentialfrom using layout platforms, Artif. Intell. Eng. Des. Anal. Manuf. 18(2004) 55–69.
[14] J.K. Gershenson, G.J. Prasad, Y. Zhang, Product modularity: definitionsand benefits, J. Eng. Des. 14 (2003) 295–313.
[15] J. McNerney, J.D. Farmer, S. Redner, J.E. Trancik, Role of designcomplexity in technology improvement, Proc. Natl. Acad. Sci. 108(2011) 9008–9013.
[16] R.M. Henderson, K.B. Clark, Architectural innovation: the reconfigura-tion of existing product technologies and the failure of establishedfirms, Adm. Sci. Q. 35 (1990) 9–30.
[17] S. Brusoni, A. Prencipe, Unpacking the black box of modularity:technologies, products and organizations, Ind. Corp. Change 10 (2001)179–205.
[18] S.K. Ethiraj, D. Levinthal, R.R. Roy, The dual role of modularity:innovation and imitation, Manag. Sci. 54 (2008) 939–955.
[19] D. Braha, Y. Bar-Yam, Topology of large-scale engineering problem-solving networks, Phys. Rev. E. 69 (2004) 016113.
[20] D. Braha, Y. Bar-Yam, The statistical mechanics of complex productdevelopment: empirical and analytical results, Manag. Sci. 53 (2007)1127–1145.
[21] M.E. Sosa, S.D. Eppinger, C.M. Rowles, The misalignment of productarchitecture and organizational structure in complex product devel-opment, Manag. Sci. 50 (2004) 1674–1689.
[22] M.J. Dollinger, Environmental boundary spanning and informationprocessing effects on organizational performance, Acad. Manag. J. 27(1984) 351–368.
[23] D. Lovallo, C. Clarke, C. Camerer, Robust analogizing: empirical applica-tions of case-based making to strategic forecasting, Strateg. Manag. J. 33(2012) 496–512.
[24] A. McDonald, L. Schrattenholzer, Learning rates for energy technolo-gies, Energy Policy 29 (2001) 255–261.
[25] J.S. Gero, Design prototypes: a knowledge representation schema fordesign, AI Mag. 11 (1990) 26–36.
gical progress potential based on the complexity of product/10.1016/j.techfore.2014.02.009

12 A. Dong, S. Sarkar / Technological Forecasting & Social Change xxx (2014) xxx–xxx
[26] N.P. Suh, Axiomatic Design: Advances and Applications, OxfordUniversity Press, New York, 2001.
[27] J. Hirtz, R. Stone, D. McAdams, S. Szykman, K. Wood, A functional basisfor engineering design: reconciling and evolving previous efforts, Res.Eng. Des. 13 (2002) 65–82.
[28] R.B. Stone, K.L. Wood, Development of a functional basis for design, J.Mech. Des. 122 (2000) 359–370.
[29] S. Borgo, M. Carrara, P. Garbacz, P.E. Vermaas, A formalization offunctions as operations on flows, J. Comput. Inf. Sci. Eng. 11 (2011)031007–031014.
[30] J.M. Weaver, K.L. Wood, R.H. Crawford, D. Jensen, Exploring innovationpotential opportunities in energy harvesting using functional modelingapproaches, ASME 2011 International Design Engineering TechnicalConferences and Computers and Information in Engineering Confer-ence (IDETC/CIE2011), ASME, Washington, DC, 2011, pp. 479–489.
[31] M. Van Wie, C.R. Bryant, M.R. Bohm, D. McAdams, R.B. Stone, A modelof function-based representations, AI EDAM 19 (2005) 89–111.
[32] M.E.J. Newman, M. Girvan, Finding and evaluating community structurein networks, Phys. Rev. E. 69 (2004) 026113.
[33] S. Sarkar, A. Dong, Community detection in graphs using singular valuedecomposition, Phys. Rev. E. 83 (2011).
[34] S. Sarkar, J.A. Henderson, P.A. Robinson, Spectral characterization ofhierarchical network modularity and limits of modularity detection,PLoS ONE 8 (2013) e54383.
[35] D. Kahneman, A. Tversky, Intuitive prediction: biases and correctiveprocedures, in: S. Makridakis, S.C. Wheelwright (Eds.), TIMS Studies inManagement Sciences: Forecasting, North Holland, Amsterdam, 1979,pp. 313–327.
[36] D. Kahneman, D. Lovallo, Timid choices and bold forecasts: a cognitiveperspective on risk taking, Manag. Sci. 39 (1993) 17–31.
[37] L. de Lathauwer, B. de Moor, J. Vandewalle, A multilinear singular valuedecomposition, SIAM J. Matrix Anal. Appl. 21 (2000) 1253–1278.
[38] H.A. Simon, The architecture of complexity, Proc. Am. Philos. Soc. 106(1962) 467–482.
[39] R. Sanchez, J.T. Mahoney, Modularity, flexibility, and knowledgemanagement in product and organization design, Strateg. Manag. J.17 (1996) 63–76.
[40] P.R. Carlile, A pragmatic view of knowledge and boundaries: boundaryobjects in new product development, Organ. Sci. 13 (2002) 442–455.
[41] P. Bolton, M. Dewatripont, The firm as a communication network, Q. J.Econ. 109 (1994) 809–839.
[42] L. Argote, Organizational Learning: Creating, Retaining, and Transfer-ring Knowledge, Springer, New York, 2005.
[43] P.M. Leonardi, Innovation blindness: culture, frames, and cross-boundaryproblem construction in the development of new technology concepts,Organ. Sci. 22 (2011) 347–369.
[44] M. Tortoriello, R. Reagans, B. McEvily, Bridging the knowledge gap: theinfluence of strong ties, network cohesion, and network range on thetransfer of knowledge between organizational units, Organ. Sci. 23(2012) 1024–1039.
Please cite this article as: A. Dong, S. Sarkar, Forecasting technoloknowledge, Technol. Forecast. Soc. Change (2014), http://dx.doi.org
[45] L. Argote, E. Miron-Spektor, Organizational learning: from experienceto knowledge, Organ. Sci. 22 (2011) 1123–1137.
[46] G. Palla, I. Derenyi, I. Farkas, T. Vicsek, Uncovering the overlappingcommunity structure of complex networks in nature and society,Nature 435 (2005) 814–818.
[47] W. Jun, M. Barahona, T. Yue-jin, D. Hong-Zhong, Spectral measure ofstructural robustness in complex networks, IEEE Trans. Syst. ManCybern. Part A Syst. Humans 41 (2011) 1244–1252.
[48] L. Neij, Cost development of future technologies for power generation—a study based on experience curves and complementary bottom–upassessments, Energy Policy 36 (2008) 2200–2211.
[49] W.W. Powell, K.W. Koput, L. Smith-Doerr, Interorganizational collabora-tion and the locus of innovation: networks of learning in biotechnology,Adm. Sci. Q. 41 (1996) 116–145.
[50] R.W. Rycroft, Does cooperation absorb complexity? Innovation net-works and the speed and spread of complex technological innovation,Technol. Forecast. Soc. Chang. 74 (2007) 565–578.
[51] C.M. Christensen, The Innovator's Dilemma: When New TechnologiesCause Great Firms to Fail, Harvard Business School Press, Boston, 1997.
[52] G. Rugg, Special issue: innovation and the evolution of human behavior.Quantifying technological innovation, PaleoAnthropology 2011 (2011)154–165.
[53] D.J. Watts, Small Worlds: The Dynamics of Networks between Orderand Randomness, Princeton University Press, Princeton, 1999.
Andy Dong is the Warren Centre Chair for Engineering Innovation. Heresearches what constitutes design knowledge and the causal importance ofthe structures and processes of design knowledge production to design-ledinnovation. He received an Australian Research Council Future Fellowship(FT100100376) in 2010 to research inventiveness and its relation to productinnovation. He serves on the editorial boards of Design Studies, ArtificialIntelligence for Engineering Design, Analysis and Manufacturing, Research inEngineering Design, and Journal of Engineering Design. He received his BS, MSand PhD in Mechanical Engineering from the University of California,Berkeley.
Somwrita Sarkar researches complex systems and networks in variousdesign, technological, and biological domains. She is currently working onspectral methods for graph classification, especially for modularity andhierarchy detection in complex networks. The methods developed are beingapplied to complex engineering design, social networks, brain/neural net-works, and urban spatial and socio-economic networks. She has a backgroundin architecture, urban planning, and engineering design, and completed herpostdoctoral training in physics.
gical progress potential based on the complexity of product/10.1016/j.techfore.2014.02.009