forecasting the eu sugar balance sheet - constant...
TRANSCRIPT
ForecastingtheEUSugarBalanceSheet2016/17,2017/18,andfutureyears
2016Brochure www.lm
c.co.uk
© 2016 LMC International. All rights reserved. Forecasting the EU Sugar Balance Sheet
Objectives
Abolition of quotas in October 2017 will transform the EU sweetener market and there is great uncertainty over what lies ahead.
Anyone who is affected by developments in the EU will find huge value in having visibility on the market balance (‘bilan’) and outlook.
To meet this need, LMC’s new monthly service, Forecasting the EU Balance Sheet, 2016/17, 2017/18 and future years, closely monitors developments in the EU sweetener market.
2
The core of the new service is the ‘bilan’.
Subscribers receive detailed updates on:Sugar production
ImportsConsumption
Exports

© 2016 LMC International. All rights reserved. Forecasting the EU Sugar Balance Sheet
LMC offers a two‐tier service
Core ServiceThe core service provides a monthly report with all the key elements of the current ‘bilan’ –sugar production, imports, consumption and exports – plus prospects for the next crop year. It also gives a view on the outlook for sugar prices in the EU.
Premium Service The premium service provides all the core elements and will dig deeper, into the cost structure of EU beet production. This analysis provides insights into the profitability of sugar production across the EU’s growing regions and its implications for future levels of production and exports.
3
The premium service provides analysis in the monthly report plus a detailed dataset in Excel:
Gross margins from alternative crops Beet prices needed to match other crop revenues
Consumption Exports
The outlook for sugar prices in the EU
4
Core Service

© 2016 LMC International. All rights reserved. Forecasting the EU Sugar Balance Sheet
EU supply/demand forecasts
EU Sugar & Isoglucose ‘Bilan’ ('000 tonnes, white sugar equivalent)
5
2017/18quota out-of-quota
Beginning stocks 1,116 986 2,614
Production Sugar 13,330 4,411 20,000Isoglucose 720 40 2,000
Imports As such 3,400 15 2,000Processed products 550 550
TOTAL AVAILABILITY 19,116 5,452 27,164
Consumption/disappearance Sugar 16,090 2,230 17,040 Food 16,090 14,810 Industrial 800 800 Bioethanol 1,430 1,430Isoglucose 720 40 2,000
Exports As such 100 1,374 4,750Processed products 1,400 1,400
Ending stocks 806 1,808 1,974
TOTAL DEMAND 19,116 5,452 27,164
2016/17

© 2016 LMC International. All rights reserved. Forecasting the EU Sugar Balance Sheet
The building blocks of the 'bilan'
The service drills down into each element of the ‘bilan’, providing step-by-step analysis of:
Production Production forecasts (with an indication of yields in light of climate)
Imports Availability of preferential sugars Import parity (world raw sugar price + freight + refining)
Consumption Demand for food, chemical and ethanol use
Exports
Volume and destination of EU exports
Stocks
6

© 2016 LMC International. All rights reserved. Forecasting the EU Sugar Balance Sheet
Coverage
Austria Italy
Belgium Lithuania
Croatia Netherlands
Czech Rep. Poland
Denmark Romania
Finland Slovakia
France Spain
Germany Sweden
Greece United Kingdom
Hungary
Beet sugar production: country & regional coverage
Location of beet factories in the EU
7

© 2016 LMC International. All rights reserved. Forecasting the EU Sugar Balance Sheet
Production volumes: beet sugar & isoglucose
8
IsoglucoseArea Yield Fresh Production Carry-in Supply
Hectares Tonnes/hectare Tonnes Tonnes Tonnes Tonnes wseAustria 50 10.0 500 20 520 0Belgium 0 0Croatia 0 0Czech Republic 0 0Denmark 0 0Finland 0 0France 0 0Germany 0 0Greece 0 0Hungary 0 0Italy 0 0Lithuania 0 0Netherlands 0 0Poland 0 0Romania 0 0Slovakia 0 0Spain 0 0Sweden 0 0United Kingdom 100 13.0 1,300 50 1,350 0EU-28 150 12.0 1,800 70 1,870 0
Beet Sugar

© 2016 LMC International. All rights reserved. Forecasting the EU Sugar Balance Sheet
Coverage
ACP / LDC
FTAs
Balkans, Ukraine, Moldova
CXL
Sugar qualities
Raws (for refining)
Raws (for direct consumption)
Whites
Imports & refineries: availability and import parity
Imports from third country suppliers will be an important and potentially volatile part of the EU balance.
Location of refineries in the EU
9
Full-time refiners Beet factories with raw refining capacity

© 2016 LMC International. All rights reserved. Forecasting the EU Sugar Balance Sheet
The removal of quotas is likely to result in higher sugar exports with implications for origin exporters and re-export refiners.
The service monitors the:
• Volume of exports
• Destination of shipments EU exports
Exports
10
0
1
2
3
4
5
6
7
2000 2003 2006 2009 2012
Mill
ion
tonn
es, w
hite
val
ue
Post WTO rulingPre WTO ruling

© 2016 LMC International. All rights reserved. Forecasting the EU Sugar Balance Sheet
When quotas are lifted, several companies in numerous locations will expand their output of isoglucose.The service monitors developments in production and intra-EU trade flows.
Location of starch plants & isoglucose production capacity
Current isoglucose quotas
Isoglucose: production & trade
11
Maize-based starch plants Wheat-based starch plants
Wheat and Maize-based starch plants Plants with isoglucose quota
IsoglucoseQuotaProduction 2013/14 2014/15 2015/16Belgium 114,580 114,580 114,580Bulgaria 89,198 89,198 89,198Germany 56,638 56,638 56,638Hungary 250,266 250,266 250,266Italy 32,493 29,041 32,493Poland 42,861 42,861 42,861Portugal 10,562 9,343 12,500Slovakia 67,336 68,095 68,095Spain 53,810 53,810 53,810EU‐28 717,744 713,832 720,441
© 2016 LMC International. All rights reserved. Forecasting the EU Sugar Balance Sheet
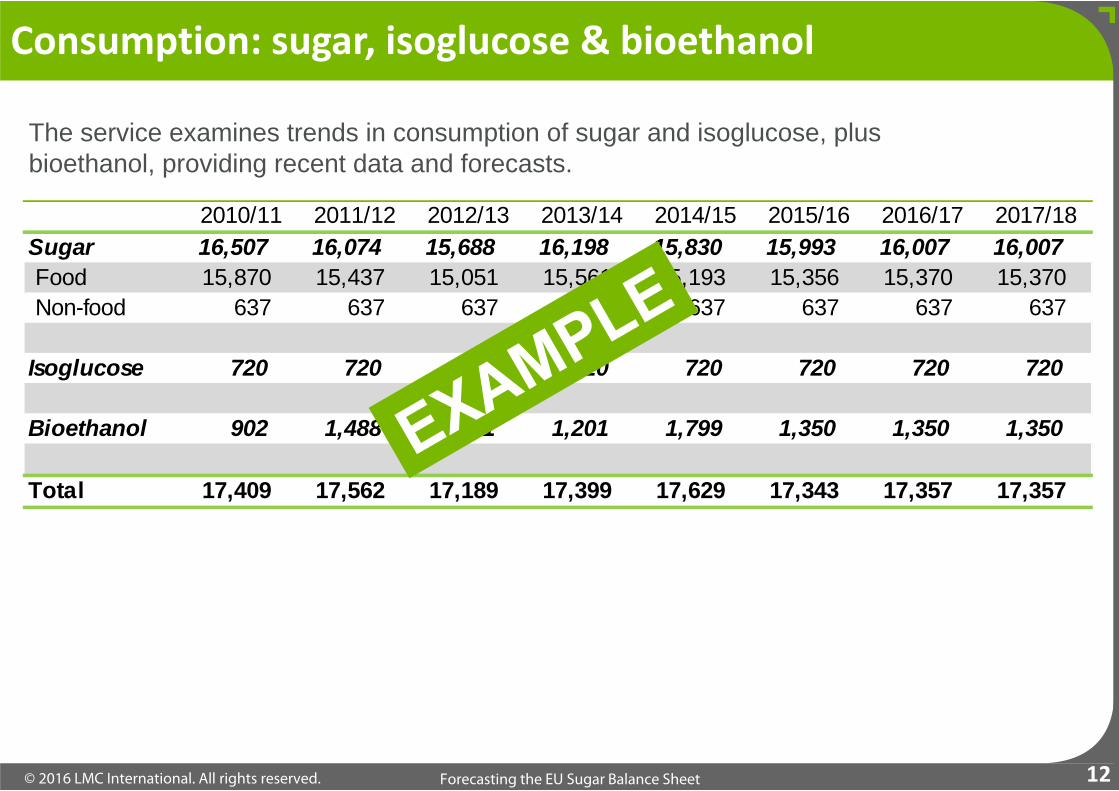
Consumption: sugar, isoglucose & bioethanol
The service examines trends in consumption of sugar and isoglucose, plus bioethanol, providing recent data and forecasts.
12
2010/11 2011/12 2012/13 2013/14 2014/15 2015/16 2016/17 2017/18Sugar 16,507 16,074 15,688 16,198 15,830 15,993 16,007 16,007 Food 15,870 15,437 15,051 15,561 15,193 15,356 15,370 15,370 Non-food 637 637 637 637 637 637 637 637
Isoglucose 720 720 720 720 720 720 720 720
Bioethanol 902 1,488 1,501 1,201 1,799 1,350 1,350 1,350
Total 17,409 17,562 17,189 17,399 17,629 17,343 17,357 17,357

© 2016 LMC International. All rights reserved. Forecasting the EU Sugar Balance Sheet
Outlook for sugar prices in the EU
EU prices will be set in relation to two key benchmarks:
• Import parity (duty free) raws/whites
• Export parity
This, in turn, will be determined by the outlook for world sugar prices.
13
Import parity
• We monitor the cost of importing sugar (and refining it where appropriate) in four locations:o NW Europeo Iberiao Italyo SE Europe
Export parity
• We derive export parity values f.o.b. and ex-works in NW Europe

14
Premium Service

© 2016 LMC International. All rights reserved. Forecasting the EU Sugar Balance Sheet
Monitoring beet supply prices
Beet production
Domestic beet sugar production is the single largest component of the EU market balance. Tracking crop profitability prior to planting will be critical.
15
The model tracks and presents:
Beet farmers’ crop margins and supply prices
Costs of production for beet and competing crops Beet prices derived from future EU sugar prices Future values of alternative crops (wheat, maize and rapeseed)
This data and analysis is used to inform us about:
Farmers’ planting intentions and the implications for beet area EU sugar production

© 2016 LMC International. All rights reserved. Forecasting the EU Sugar Balance Sheet
Cost of EU beet sugar production
Beet cost + haulage + processing ex-works cost
The cost of growing beets and the price farmers receive for beets are not the same.
This service presents the minimum prices farmers require to grow beets, which is:
Gross margin from alternative crops + additional cost of growing beetsBeet yield
The service drills down into each Member State to provide these prices at a regional level along with factory-level estimates of processing costs.
This allows subscribers to view costs at the farm and factory gate and to compare and contrast these:
• With prevailing beet and sugar prices (within the EU and on the world market)
• Within countries and companies
• Between countries and companies16

© 2016 LMC International. All rights reserved. Forecasting the EU Sugar Balance Sheet
Supply prices by factory in the EU
Supply prices by factory in the EU
17

© 2016 LMC International. All rights reserved. Forecasting the EU Sugar Balance Sheet
Sugar imports and isoglucose
In addition to beet sugar production, the two other critical supply-side factors are:
Sugar imports
The availability of imported sugar from a growing number of origins with zero or reduced duty will be a vital element of the EU balance. Imported sugar will also set a ceiling on sugar prices in the EU.
Isoglucose
How the grain processing sector will respond to the abolition of quotas will be important to watch.
18
The service: Monitors the availability of sugar from these origins Estimates the cost of importing sugar from these origins
We follow developments and capture its impact on the EU sugar market balance.

© 2016 LMC International. All rights reserved. Forecasting the EU Sugar Balance Sheet
Import parity calculations for importing and refining raws
US No.16 vs. ICE No.11 FOB returns from EU & US vs. ICE No.11
The cost and viability of imports
The ability of EU refiners to attract imports will depend on:
• The level of EU prices in relation to world prices plus (a) the cost of importing white sugar or (b) the cost of importing and refining raw sugar.
• The returns origins can earn from sales to the US under the tariff-rate quota.
The service tracks these costs as a guide to the likely volume of imports.
19
Guyana MozambiqueExports to the EUWorld raw sugar US$/mt 463 463Pol premium US$/mt 16 16FOB premium US$/mt -5 20Freight to the EU US$/mt 55 36Insurance US$/mt 5 5Raw sugar discharge/handling US$/mt 16 16Raw sugar supply price (US$/mt) US$/mt 550 556Exchange rate US$/€ 1.09 1.09Raw sugar supply price (€/mt) €/mt 504 509Refining cost €/mt 73 73Pol loss €/mt 18 18Transport to market €/mt 20 20EU supply price €/mt 615 620
0
5
10
15
20
25
30
Jan 14 Ju l 14 Jan 15 Ju l 15 Jan 16
Cent
s/lb
No.11 No.16
0
100
200
300
400
500
600
700
800
Jan-13 Ju l-13 Jan-14 Ju l-14 Jan-15 Ju l-15 Jan-16
|US$
/ton
ne
EU Raw Sugar US Raw Sugar

© 2016 LMC International. All rights reserved. Forecasting the EU Sugar Balance Sheet
Cumulative imports of white & DC raw sugar
Cumulative imports of raw sugar White & raw sugar imports by EU Member State 2014/15
Monitoring trade flows into the EU
The service tracks monthly inflows of:
• White sugar and DC raws (special sugars).
• Raws for refining.
• Imports by member state.
20
0.0
0.2
0.4
0.6
0.8
1.0
1.2
1.4
Oc t Nov Dec Jan Feb Mar Apr May Ju n Ju l Aug Sep
Mill
ion
tonn
es rv
2012/13 2013/14 2014/15 2015/16
0.0
0.5
1.0
1.5
2.0
2.5
3.0
3.5
Oc t Nov Dec Jan Feb Mar Apr May Ju n Ju l Aug Sep
Mill
ion
tonn
es rv
2012/13 2013/14 2014/15 2015/16
0 200 400 600 800
AustriaBelgiumBulg aria
Cro atiaFinlandFrance
GermanyGreec e
ItalyNetherlands
PolandPortugalRoman iaSlovenia
SpainSweden
UK
Million tonnes wvRaw White

© 2016 LMC International. All rights reserved. Forecasting the EU Sugar Balance Sheet
The availability of preferential sugar supplies with depend on
• Near-term crop prospects.
• Longer-term structural changes taking place in these industries and trade arrangements (FTAs with the EU) and other countries (e.g. regional integration in Africa, Caribbean, etc.).
The service provides updates of national balances and trade flows.
Mozambique supply/demand Mozambique trade flows
Developments at origin
21
0
50
100
150
200
250
300
0
100
200
300
400
500
600
2006/07 2008/09 2010/11 2012/13 2014/15
Surplus/deficit (mn m
t rv)
Prod
ucti
on/c
onsu
mpt
ion
(mn
mt r
v)
Surplus/deficit Production Consumption
0
50
100
150
200
250
300
350
400
450
2010/11 2011/12 2012/13 2013/14 2014/15
Tonn
es o
f sug
ar so
ld (t
hous
ands
)
Domestic EU US Regional

© 2016 LMC International. All rights reserved. Forecasting the EU Sugar Balance Sheet
Export availability by origin
22
ExportProduction Imports Consumption Availability Regional/World EU White DC Raw Raw for Refining
ACP / LDC 0 0 0 0 0 0BangladeshBarbadosBelize 147 0 17 130 12 118 0 0 118CambodiaDominican RepublicEthiopiaFijiGuyanaJamaicaKenyaLaosMadagascarMalawiMauritiusMozambiqueSudanSwazilandTanzaniaZambiaZimbabweBalkans & East Europe 0 0 0 0 0 0MoldovaSerbiaUkraineFTAs 0 0 0 0 0 0CentralsColombiaPanamaPeruSouth AfricaCXL 0 0 0 0 0 0AustraliaBrazilCubaIndiaTotal 130 12 118 0 0 118
Distribition of Exportsof which:
© 2016 LMC International. All rights reserved. Forecasting the EU Sugar Balance Sheet
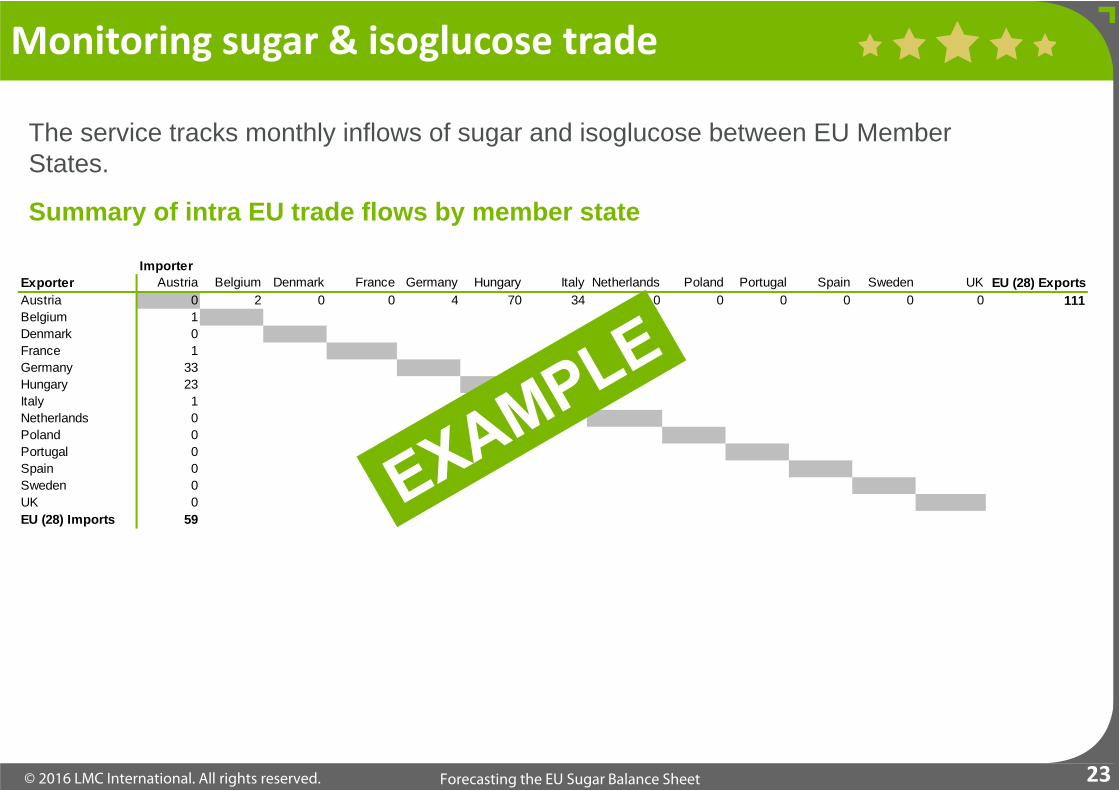
Monitoring sugar & isoglucose trade
The service tracks monthly inflows of sugar and isoglucose between EU Member States.
Summary of intra EU trade flows by member state
23
ImporterExporter Austria Belgium Denmark France Germany Hungary Italy Netherlands Poland Portugal Spain Sweden UK EU (28) ExportsAustria 0 2 0 0 4 70 34 0 0 0 0 0 0 111Belgium 1Denmark 0France 1Germany 33Hungary 23Italy 1Netherlands 0Poland 0Portugal 0Spain 0Sweden 0UK 0EU (28) Imports 59
© 2016 LMC International. All rights reserved. Forecasting the EU Sugar Balance Sheet
Sugar demand
DemandThe Model also monitors developments on the demand side of the EU balance. The three key uses comprise:
The ethanol sector has the potential to be the most variable because the use of beets for ethanol will be influenced by the arbitrage between sugar and ethanol, where producers have the capacity to produce both products. The service monitors the returns from each product to determine how arbitrage might affect the allocation of beets. These supply and demand-side elements are brought together to capture the impact on the EU sugar market balance.
24
Food Chemicals Ethanol

© 2016 LMC International. All rights reserved. Forecasting the EU Sugar Balance Sheet
Market balance by Member State
25
Austria Belgium Denmark France Germany Hungary Italy Netherlands Poland Portugal Spain Sweden United Kingdom TotalRegion CS NW N NW NW CS M NW CN I I N NW EU (28)SUGARProduction"Fresh Production" 1 - Ethanol 0Production net Ethanol 1- Quota 1- Fresh Out-of-Quota 0Imports- Extra EU 445 a) raw 443 b) white 3 c) DOMs 0- Intra EU 33- Processed Products 2Total supply 481
Exports- Extra EU 23- Intra EU 162- Processed Products 12Consumption 275Total demand 472
ISOGLUCOSEProduction 11Imports- Extra EU 0- Intra EU 6Total supply 18Exports- Extra EU 0- Intra EU 1Consumption 4Total demand 5
© 2016 LMC International. All rights reserved. Forecasting the EU Sugar Balance Sheet
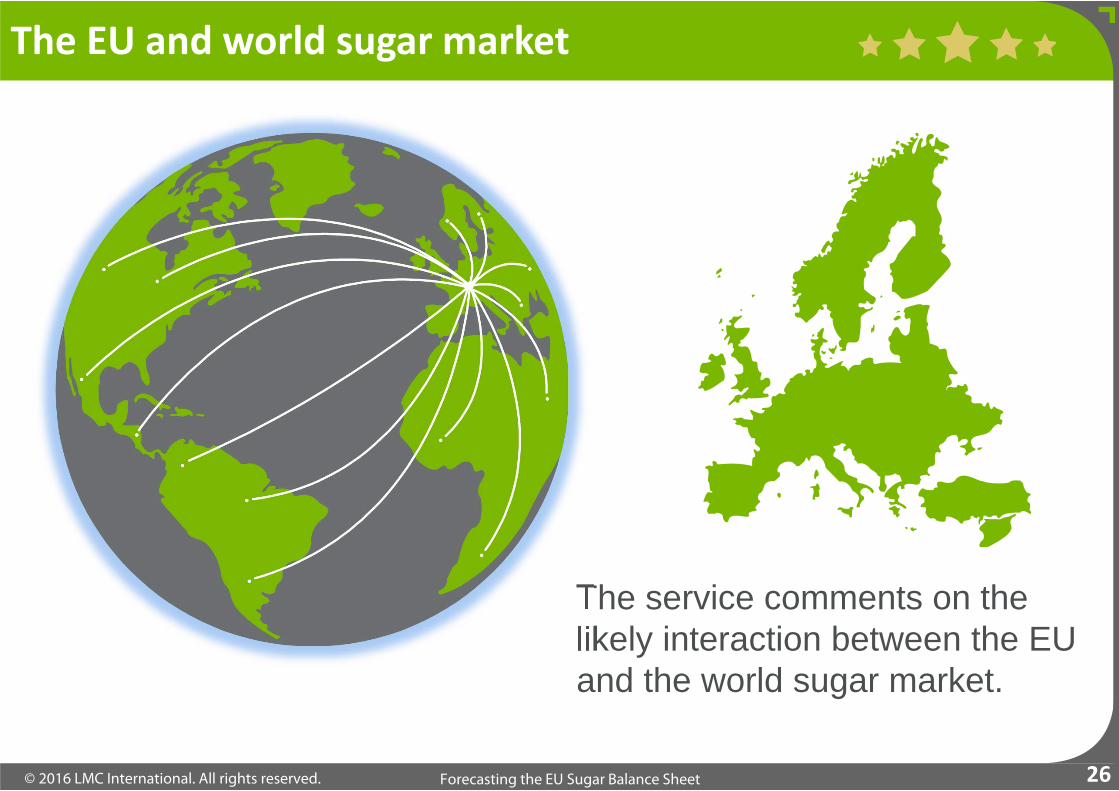
The EU and world sugar market
26
The service comments on the likely interaction between the EU and the world sugar market.

© 2016 LMC International. All rights reserved. Forecasting the EU Sugar Balance Sheet
Deliverables, availability & fees
Forecasting the EU sugar balance sheet
For further information, please contact:Philip Digges [email protected] +44 1865 791737
Robin Shaw [email protected] +44 7768 103952 (if unavailable please email)
27
Core service subscribers: Monthly report
Deliverables
Premium service subscribers: Monthly report Comprehensive dataset in Excel
Both services: Access to senior LMC staff to discuss and interpret findings & forecasts
Availability: The report is now available
Fee: € 9,500 12-month subscription Core service
€ 17,500 12-month subscription Premium service

© 2016 LMC International. All rights reserved. Forecasting the EU Sugar Balance Sheet
LMC has a global client base for its sugar analysis, reports and services. Companies that have used LMC’s services include:
LMC client list
And many more.28
ABSugarAçúcar GuaraniAgriculture&LivestockIndustriesAjinomotoAlKhaleej SugarAmericanCrystalSugarAmericanSugarRefiningArcherDanielsMidlandAsazguaAsocañaBPBiofuelsBungeCargillCoca‐ColaCopersucarCosanDowDuPontGeneralMills
GordianIndofoodAgri ResourcesIngredionItochuKhonburi SugarLedesmaManuelitaMexicanSugarChamberMitr Phol SugarMitsuiMondelezMonsantoMSM/FeldaNordzuckerOdebrecht AgroindustrialOlam InternationalPantaleonPepsi‐ColaQueenslandSugar
RaizenRusagroSamyangSavolaSüdzuckerSuiker UnieSumitomoSyngentaTereosTate&LyleThaiRoong Ruang GroupTongaat‐HulettTotalUSDept ofAgricultureUsina SãoMartinhoUSSugarWangKanaiWilmar SugarWorldBank
© 2016 LMC International. All rights reserved. Forecasting the EU Sugar Balance Sheet
Singapore16 Collyer Quay #21-00
Singapore 049318Singapore
T +65 6818 9231
This presentation and its contents are to be held confidential by the client, and are not to be disclosed, in whole or in part, in any manner, to a third party without the prior written consent of LMC International.
While LMC has endeavoured to ensure the accuracy of the data, estimates and forecasts contained in this presentation, any decisions based on them (including those involving investment and planning) are at the client’s own risk.
LMC International can accept no liability regarding information analysis and forecasts contained in this presentation.
© LMC International, 2016All rights reserved
New York1841 Broadway
New York, NY 10023USA
T +1 (212) 586-2427F +1 (212) 397-4756
Oxford 4th Floor, Clarendon House
52 Cornmarket StreetOxford OX1 3HJ
UK
T +44 1865 791737F +44 1865 791739
Kuala LumpurB-03-19, Empire Soho
Empire SubangJalan SS16/1, SS1647500 Subang Jaya
Selangor Darul EhsanMalaysia
T +603 5611 9337
www.lmc.co.uk

© 2016 LMC International. All rights reserved.
Oxford4th Floor Clarendon House52 Cornmarket Street
Oxford OX! 3HJUK
T: +44 1865 791737F: +44 1865 [email protected]
New York1841 Broadway
New York, NY 10023USA
T +1 (212) 586‐2427F +1 (212) 397‐4756info@lmc‐ny.com
Kuala LumpurB‐03‐19, Empire Soho
Empire SubangJalan SS16/1, SS1647500 Subang JayaSelangor Darul Ehsan
MalaysiaT +603 5611 9337info@lmc‐kl.com
Singapore16 Collyer Quay #21‐00
Singapore 049318Singapore
T +65 6818 9231
info@lmc‐sg.com
