forecasting - university of north carolina at...
TRANSCRIPT

FORECASTINGModule 4

Forecasting
• Predict the next number in the pattern:
a) 3.7, 3.7, 3.7, 3.7, 3.7, ?
b) 2.5, 4.5, 6.5, 8.5, 10.5, ?
c) 5.0, 7.5, 6.0, 4.5, 7.0, 9.5, 8.0, 6.5, ?

Forecasting
• Predict the next number in the pattern:
a) 3.7, 3.7, 3.7, 3.7, 3.7,
b) 2.5, 4.5, 6.5, 8.5, 10.5,
c) 5.0, 7.5, 6.0, 4.5, 7.0, 9.5, 8.0, 6.5,
3.7
12.5
9.0
Outline
• What is forecasting?
• Types of forecasts
• Time-Series forecasting
• Good forecasts
• Monitoring forecasts

Forecasting
• What is Forecasting?
• Determining Future Events Based on Historical Facts and Data
• Some Thoughts on Forecasts
• Forecasts Tend to Be Wrong!
• Forecasts Can Be Biased! (Marketing, Sales, etc.)
• Forecasts Tend to Be Better for Near Future
• So, Why Forecast?
• Better to Have “Educated Guess” About Future Than to Not
Forecast At All!

What is Forecasting?
• Process of predicting a future event based on historical data
• Educated guessing
• Underlying basis of
all business decisions
• Production
• Inventory
• Personnel
• Facilities
Sales will be $200 Million!

Realities of Forecasting
• Forecasts are seldom perfect
• Most forecasting methods assume that there is some
underlying stability in the system
• Both product family and aggregated product forecasts are
more accurate than individual product forecasts
In general, forecasts are almost always wrong. So,
Why do we need to forecast?
Throughout the day we forecast very different things such
as weather, traffic, stock market, state of our company
from different perspectives.
Virtually every business attempt is based on forecasting.
Not all of them are derived from sophisticated methods.
However, “Best" educated guesses about future are more
valuable for purpose of Planning than no forecasts and
hence no planning.
Hochschule Bremen forecasts?

Departments throughout the organization depend on
forecasts to formulate and execute their plans.
• Finance needs forecasts to project cash flows and capital
requirements.
• Human resources need forecasts to anticipate hiring
needs.
• Production needs forecasts to plan production levels,
workforce, material requirements, inventories, etc.
• What departments in your university needs to forecast?
Importance of Forecasting in OM

Demand is not the only variable of interest to
forecasters.
• Manufacturers also forecast worker
absenteeism, machine availability, material
costs, transportation and production lead
times, etc.
• Besides demand, service providers are also
interested in forecasts of population, of
other demographic variables, of weather,
etc.
Importance of Forecasting in OM

• Short-range forecast
• Usually < 3 months
• Job scheduling, worker assignments
• Medium-range forecast
• 3 months to 2 years
• Sales/production planning
• Long-range forecast
• > 2 years
• New product planning
Types of Forecasts by Time Horizon
Design
of system
Detailed
use of
system
Quantitative
methods
Qualitative
Methods

Short vs. Long Term
• Medium/long range forecasts
• More comprehensive issues
• Support management decisions
• Short-term forecasting usually employs different methodologies
than longer-term forecasting
• Short-term forecasts tend to be more accurate than longer-
term forecasts

How to Forecast?
• Qualitative Methods
• Based On Educated Opinion & Judgment (Subjective)
• Particularly Useful When Lacking Numerical Data
(Example: Design and Introduction Phases of a Product’s Life
Cycle)
• Quantitative Methods
• Based On Data (Objective)
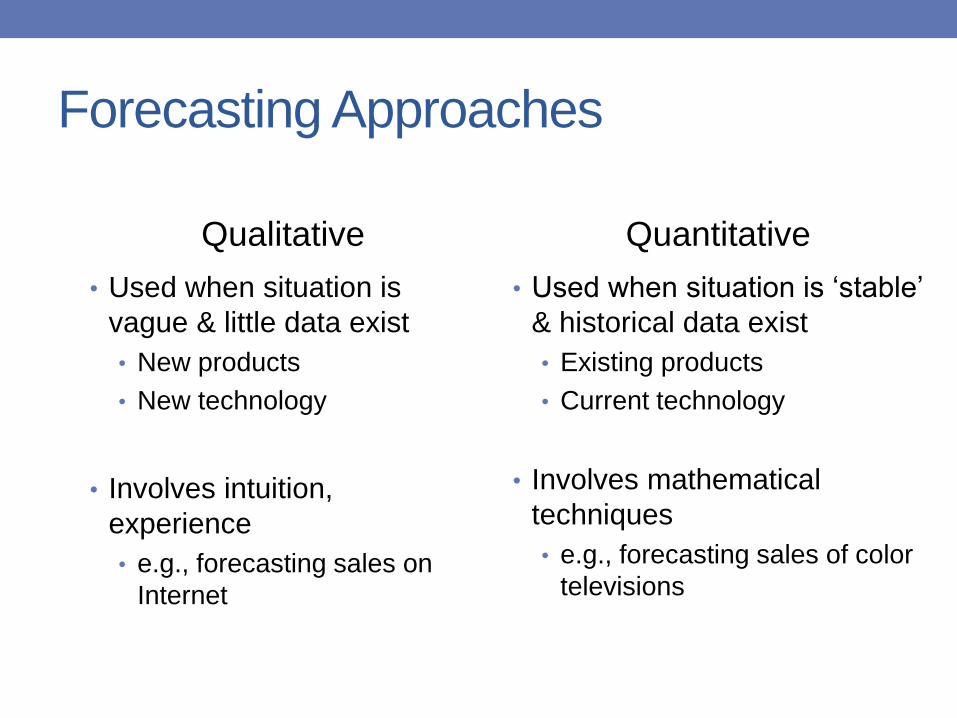
Forecasting Approaches
Qualitative
• Used when situation is
vague & little data exist
• New products
• New technology
• Involves intuition,
experience
• e.g., forecasting sales on
Internet
Quantitative
• Used when situation is ‘stable’
& historical data exist
• Existing products
• Current technology
• Involves mathematical
techniques
• e.g., forecasting sales of color
televisions

Qualitative Methods
• Executive Judgment
• Sales Force Composite
• Market Research/Survey
• Delphi Method
Jury of Executive Opinion
• Involves small group of high-level managers
• Group estimates demand by working together
• Combines managerial experience with statistical models
• Relatively quick
• ‘Group-think’ disadvantage

Sales Force Composite
• Each salesperson projects his or
her sales
• Combined at district & national
levels
• Sales reps know customers’
wants
• Tends to be overly optimistic
Sales
© 1995 Corel Corp.

Consumer Market Survey
• Ask customers about purchasing
plans
• What consumers say, and what
they actually do are often
different
• Sometimes difficult to answer
18
How many hours will you use the Internet
next week?
© 1995 Corel
Corp.

Delphi Method
• Iterative group process
• 3 types of people
• Decision makers
• Staff
• Respondents
• Reduces ‘group-think
(Sales?)
(What will
sales be?
survey)
(Sales will be 45, 50, 55)Respondents
Staff
(Sales will be 50!)
Decision Makers
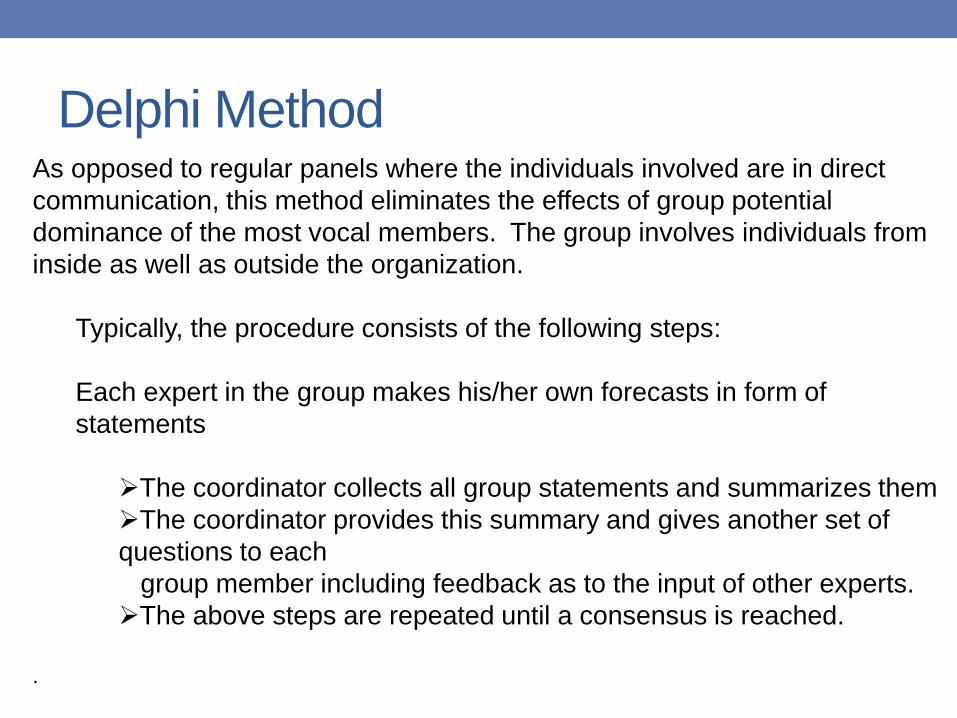
As opposed to regular panels where the individuals involved are in direct
communication, this method eliminates the effects of group potential
dominance of the most vocal members. The group involves individuals from
inside as well as outside the organization.
Typically, the procedure consists of the following steps:
Each expert in the group makes his/her own forecasts in form of
statements
The coordinator collects all group statements and summarizes them
The coordinator provides this summary and gives another set of
questions to each
group member including feedback as to the input of other experts.
The above steps are repeated until a consensus is reached.
.
Delphi Method
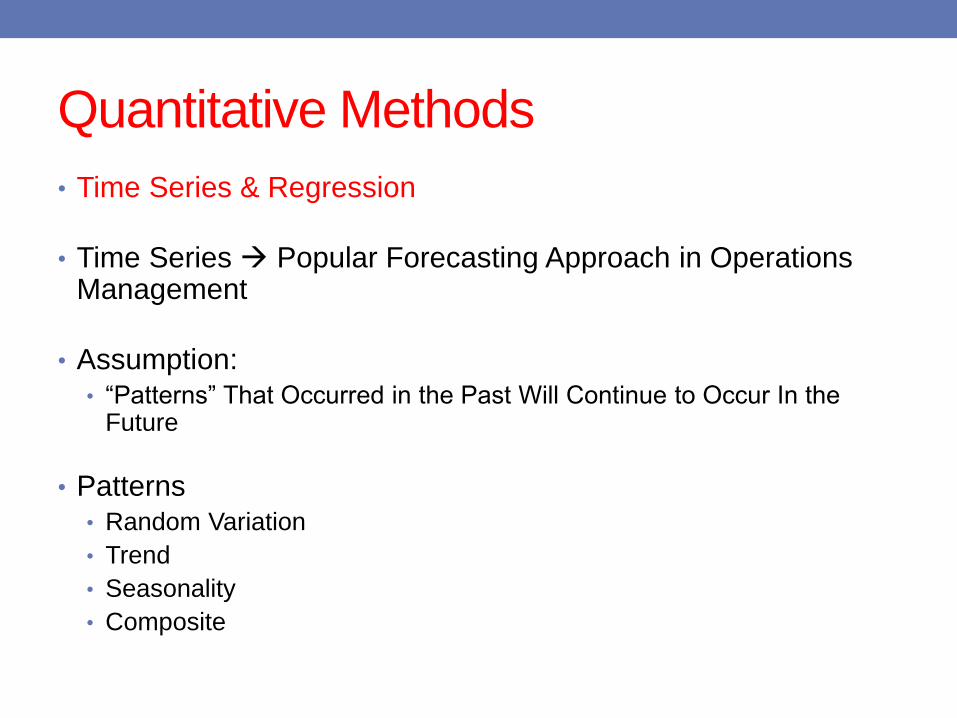
Quantitative Methods
• Time Series & Regression
• Time Series Popular Forecasting Approach in Operations Management
• Assumption:
• “Patterns” That Occurred in the Past Will Continue to Occur In the Future
• Patterns
• Random Variation
• Trend
• Seasonality
• Composite

What is a Time Series?
• Obtained by observing response variable at regular time
periods
• Set of evenly spaced numerical data
• Forecast based only on past values• Assumes that factors influencing past and present will continue
influence in future
• Assumes that factors influencing the past will continue to
influence the future

Monthly Champagne Sales
0
200
400
600
800
1000
1200
1400
1600
0 12 24 36 48 60 72 84
Time (t)

Trend Component
• Persistent, overall upward or downward pattern
• Due to population, technology etc.
• Several years duration
Mo., Qtr., Yr.
Response
© 1984-1994 T/Maker Co.

Seasonal Component
• Regular pattern of up & down fluctuations
• Due to weather, customs etc.
• Occurs within 1 year
Mo., Qtr.
Response
Summer
© 1984-1994 T/Maker Co.

U.K. Airline Miles
0
2000
4000
6000
8000
10000
12000
14000
16000
180001 4 7
10
13
16
19
22
25
28
31
34
37
40
43
46
49
52
55
58
61
64
67
70
73
76
79
82
85
88
91
94
Month
Th
ou
san
ds o
f M
ile
s
U.K. Airline MilesUK Airline Miles
Th
ousan
ds
of
Mil
es
Observe:Increasing trend,
Seasonal component.
Random variation.

Common Seasonal Patterns
Period of Pattern “Season” Length Number of
“Seasons” in
Pattern
Week Day 7
Month Week 4 – 4 ½
Month Day 28 – 31
Year Quarter 4
Year Month 12
Year Week 52
27

Cyclical Component
• Repeating up & down movements
• Due to interactions of factors influencing economy
• Usually 2-10 years duration
Mo., Qtr., Yr.
Response
Cycle

Random Component
• Erratic, unsystematic, ‘residual’ fluctuations
• Due to random variation or unforeseen events
• Union strike
• Hurricane/Cyclone
• Short duration & non-repeating

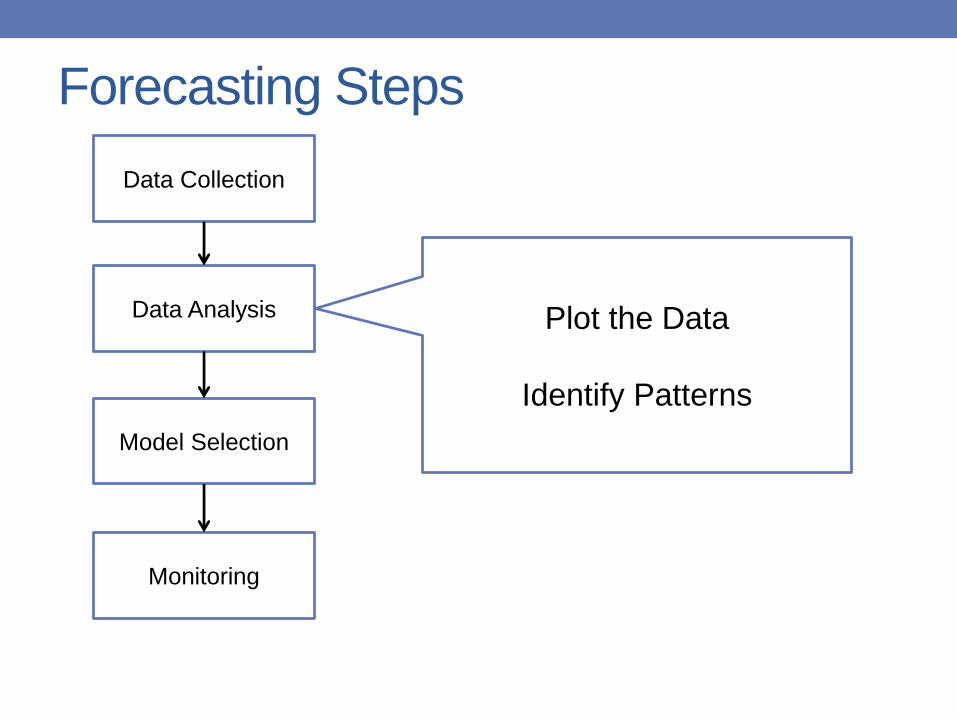
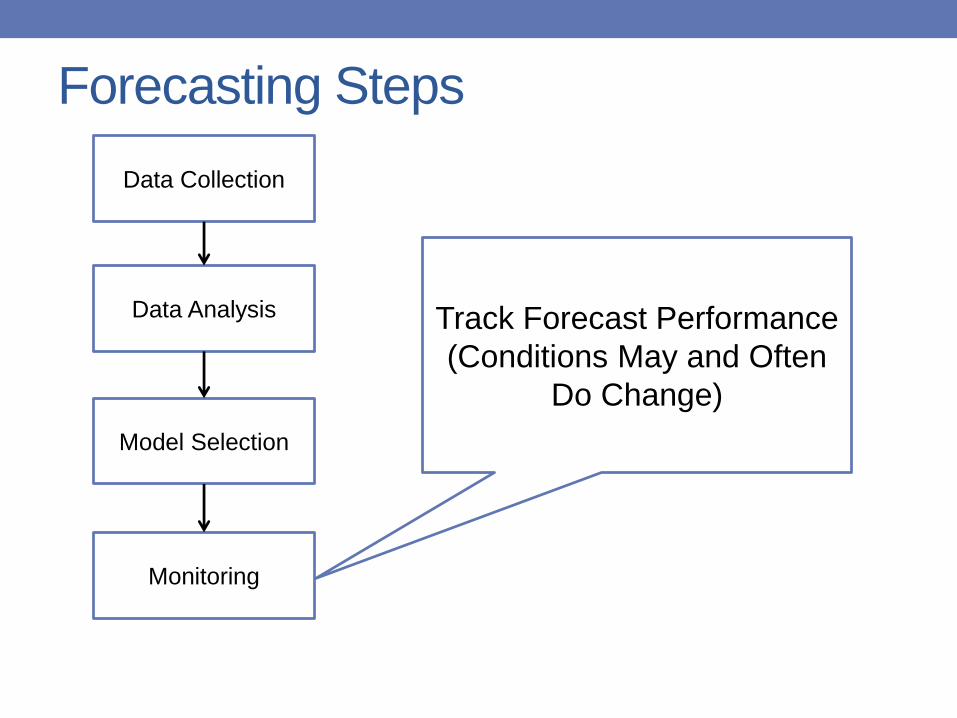
Forecasting Steps
Data Collection
Data Analysis
Model Selection
Monitoring
Collect Relevant/Reliable
Data
Be Aware of “Garbage-In,
Garbage Out”
Forecasting Steps
Data Collection
Data Analysis
Model Selection
Monitoring
Plot the Data
Identify Patterns
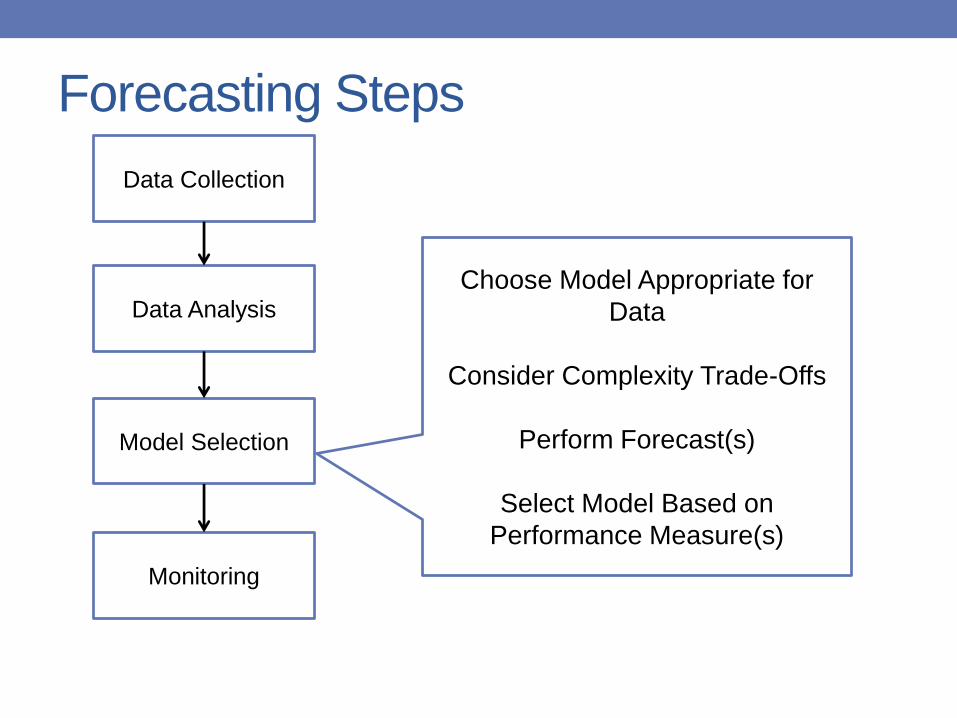
Forecasting Steps
Data Collection
Data Analysis
Model Selection
Monitoring
Choose Model Appropriate for
Data
Consider Complexity Trade-Offs
Perform Forecast(s)
Select Model Based on
Performance Measure(s)
Forecasting Steps
Data Collection
Data Analysis
Model Selection
Monitoring
Track Forecast Performance
(Conditions May and Often
Do Change)
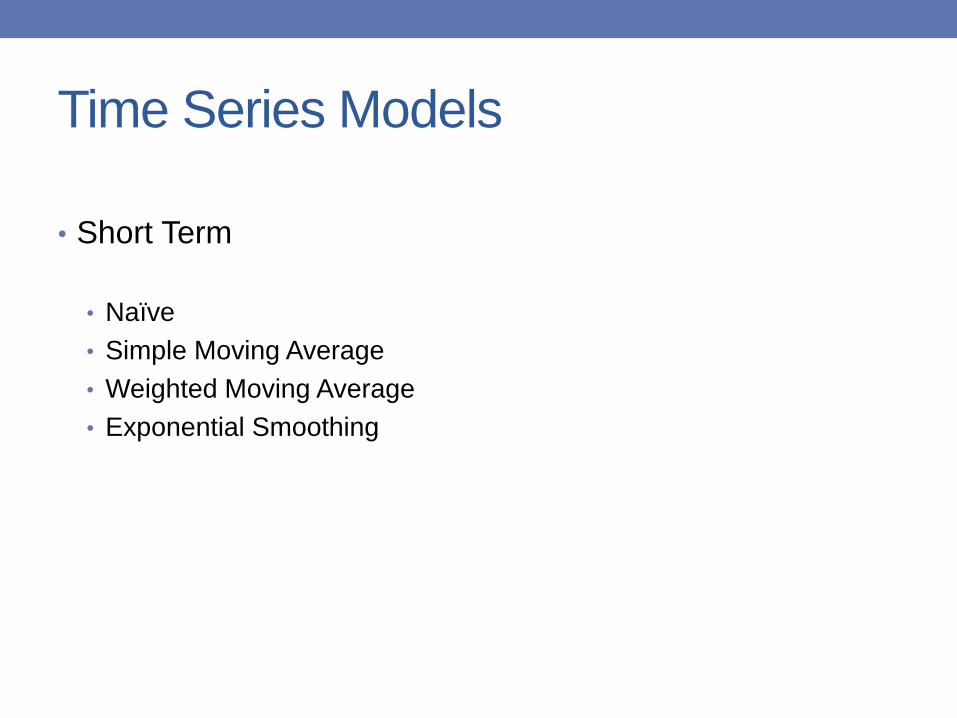
Time Series Models
• Short Term
• Naïve
• Simple Moving Average
• Weighted Moving Average
• Exponential Smoothing
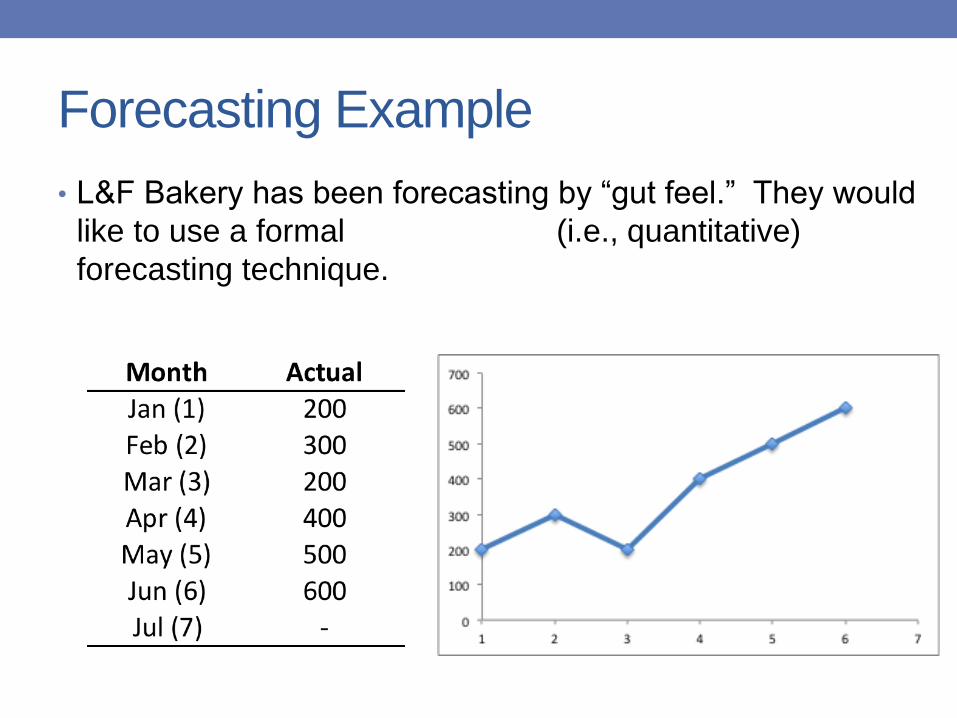
Forecasting Example
• L&F Bakery has been forecasting by “gut feel.” They would
like to use a formal (i.e., quantitative)
forecasting technique.

Forecasting Methods - Naïve
• Forecast for July = Actual
for June
• Ft+1 = At
• FJul = AJun = 600
• Forecast Very Sensitive to
Demand Changes; Good
for stable demand
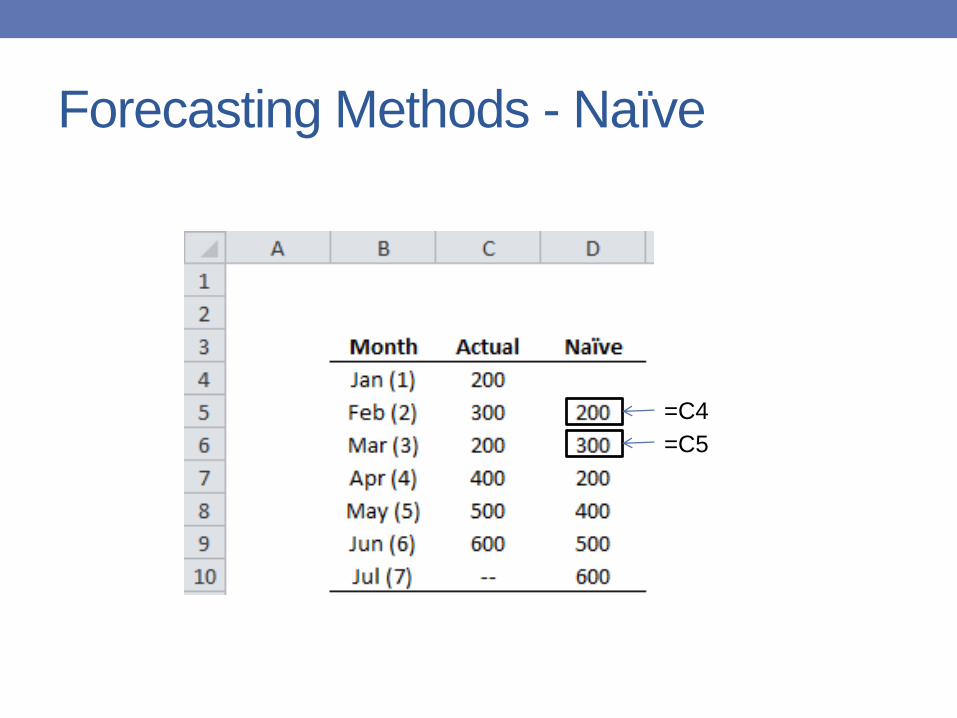
Forecasting Methods - Naïve
=C4
=C5

Forecasting Methods – Moving Avg
• Forecast for July = Average of June, May, and April
• Ft+1 = (At+At-1+…)/n
• FJul = (600+500+400)/3 = 500
• Values Equally Weighted;
Good for stable demand;
Sensitive to fluctuation;
Lags

Forecasting Methods – Moving Avg
=AVERAGE(C4:C6)
= AVERAGE(C5:C7)
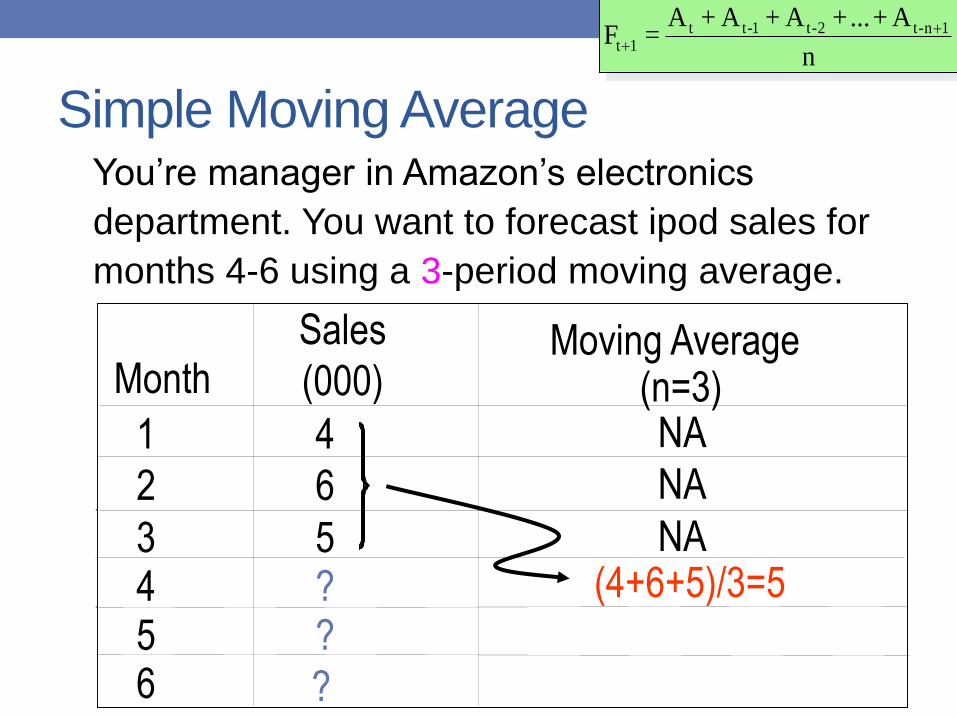
Simple Moving Average
MonthSales
(000)Moving Average
(n=3)1 4 NA
2 6 NA
3 5 NA4 ?5 ?
(4+6+5)/3=5
6 ?
n
A+...+A +A +A =F 1n-t2-t1-tt
1t
You’re manager in Amazon’s electronics
department. You want to forecast ipod sales for
months 4-6 using a 3-period moving average.

What if ipod sales were actually 3 in
month 4
MonthSales
(000)Moving Average
(n=3)1 4 NA
2 6 NA
3 5 NA4 35 ?
5
6 ?
?

Forecast for Month 5?
MonthSales
(000)Moving Average
(n=3)1 4 NA
2 6 NA
3 5 NA4 35 ?
5
6 ?
(6+5+3)/3=4.667
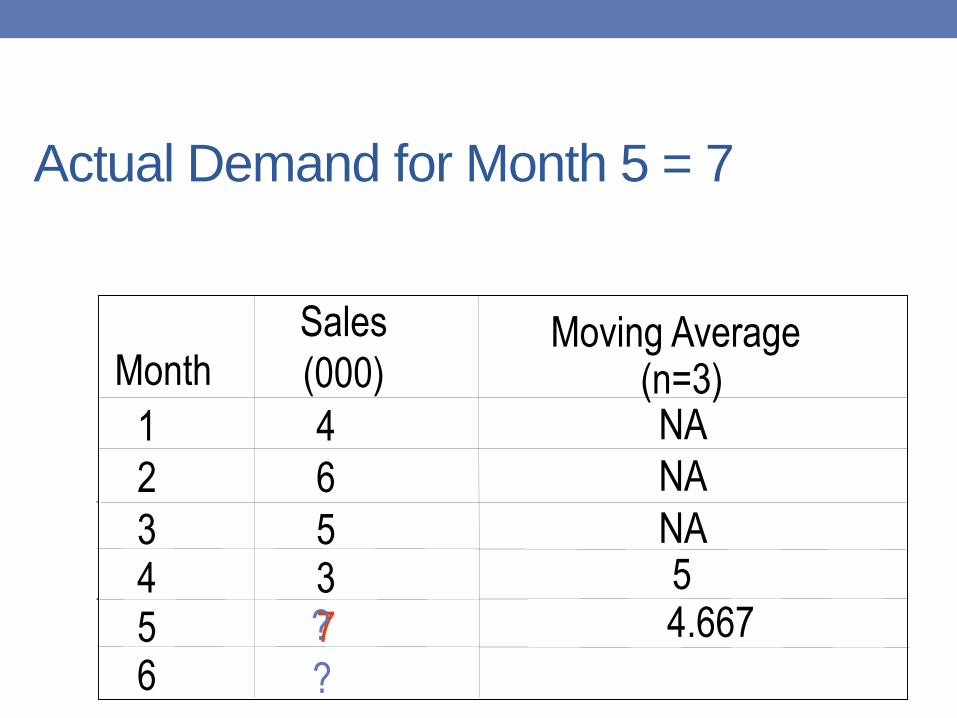
Actual Demand for Month 5 = 7
MonthSales
(000)Moving Average
(n=3)1 4 NA
2 6 NA
3 5 NA4 35 7
5
6 ?
4.667?
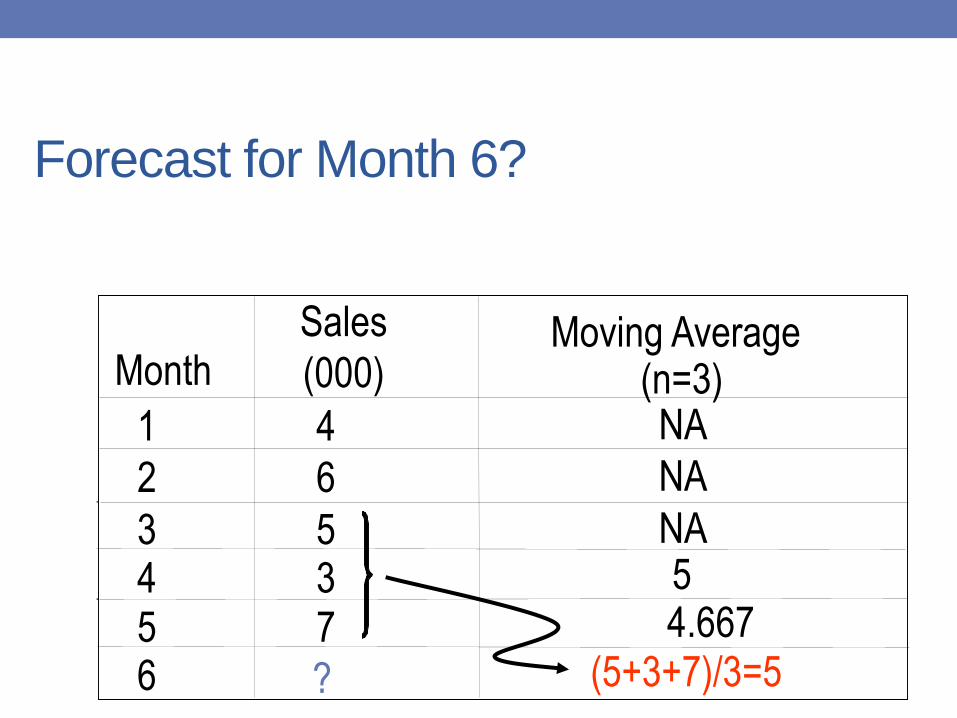
Forecast for Month 6?
MonthSales
(000)Moving Average
(n=3)1 4 NA
2 6 NA
3 5 NA4 35 7
5
6 ?
4.667(5+3+7)/3=5

Weighted Moving Average Method
• Used when trend is present
• Older data usually less important
• Weights based on intuition
• Often lay between 0 & 1, & sum to 1.0
• Equation
WMA =Σ(Weight for period n) (Demand in period n)
ΣWeights

Weighted Moving Average: 3/6, 2/6, 1/6
Month Weighted
Moving
Average1 4 NA
2 6 NA
3 5 NA4 31/6 = 5.167
56 ?
??
1n-tn2-t31-t2t11t Aw+...+Aw+A w+A w=F
Sales(000)
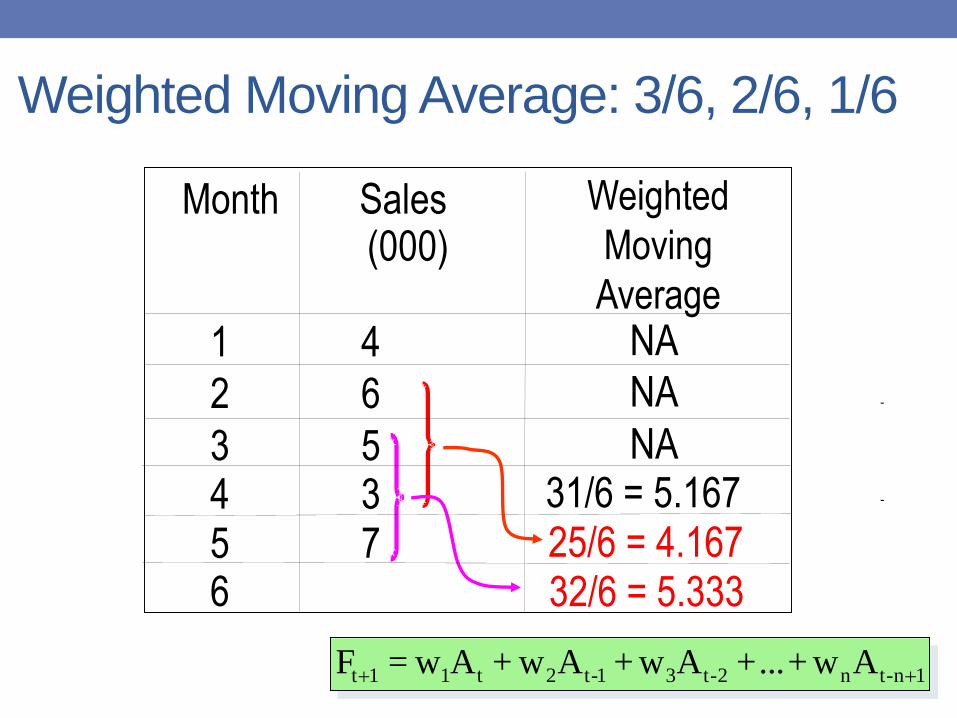
Weighted Moving Average: 3/6, 2/6, 1/6
Month Sales(000)
Weighted
Moving
Average1 4 NA
2 6 NA
3 5 NA4 3 31/6 = 5.167
5 76
25/6 = 4.16732/6 = 5.333
1n-tn2-t31-t2t11t Aw+...+Aw+A w+A w=F
Exponential Smoothing
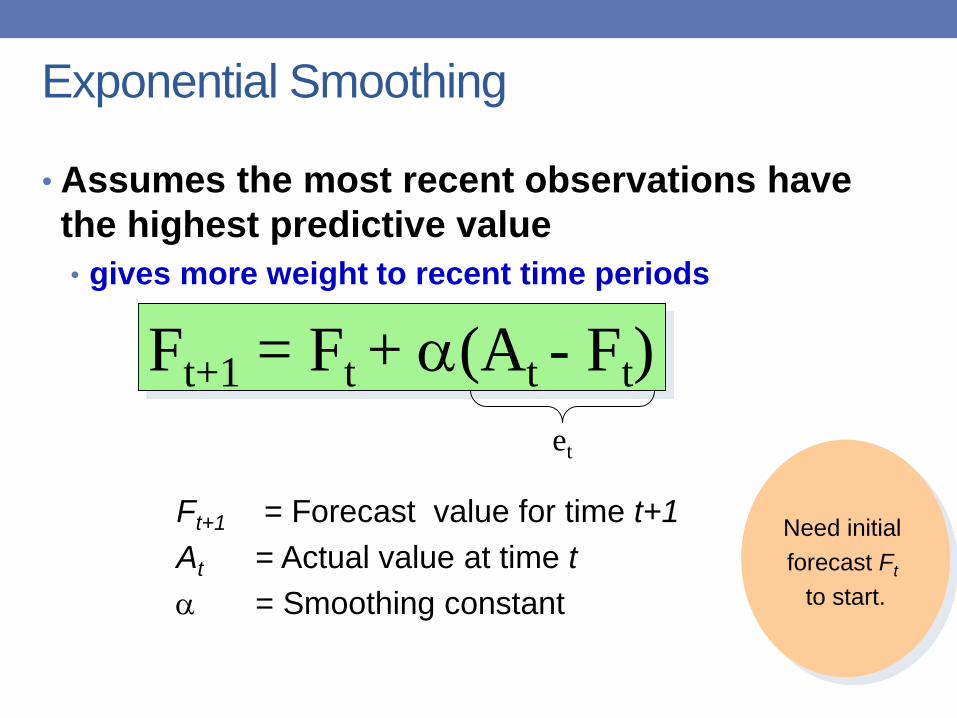
• Assumes the most recent observations have
the highest predictive value
• gives more weight to recent time periods
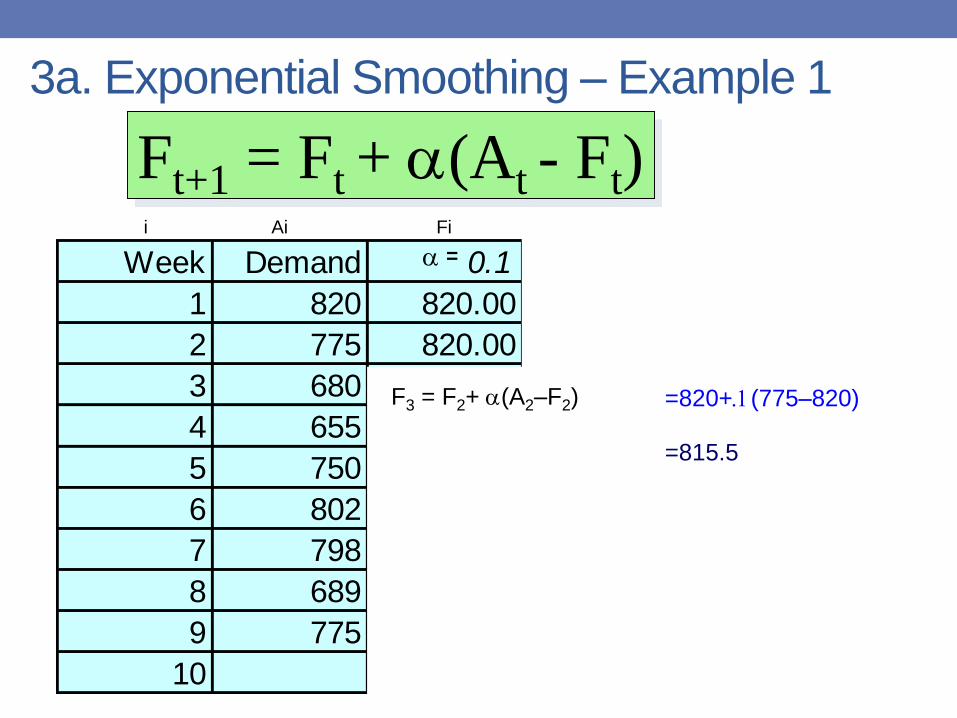
Ft+1 = Ft + a(At - Ft)
et
Ft+1 = Forecast value for time t+1
At = Actual value at time t
a = Smoothing constant
Need initial
forecast Ft
to start.
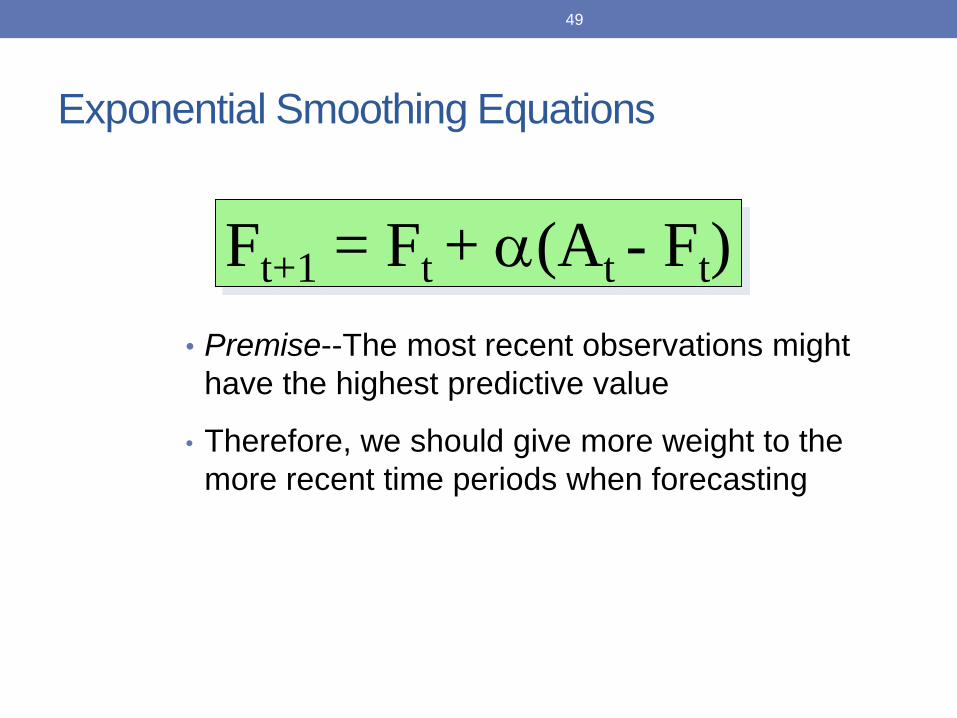
Exponential Smoothing Equations
• Premise--The most recent observations might
have the highest predictive value
• Therefore, we should give more weight to the
more recent time periods when forecasting
49
Ft+1 = Ft + a(At - Ft)
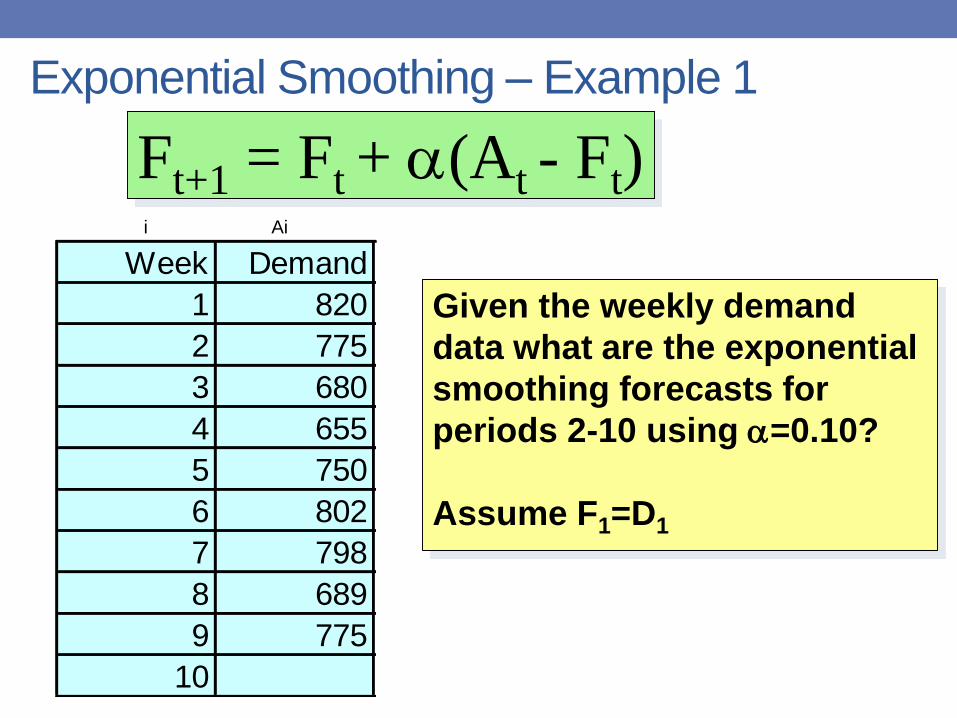
Exponential Smoothing – Example 1
Week Demand
1 820
2 775
3 680
4 655
5 750
6 802
7 798
8 689
9 775
10
Given the weekly demand
data what are the exponential
smoothing forecasts for
periods 2-10 using a=0.10?
Assume F1=D1
Ft+1 = Ft + a(At - Ft)i Ai
Week Demand 0.1 0.6
1 820 820.00 820.00
2 775 820.00 820.00
3 680 815.50 793.00
4 655 801.95 725.20
5 750 787.26 683.08
6 802 783.53 723.23
7 798 785.38 770.49
8 689 786.64 787.00
9 775 776.88 728.20
10 776.69 756.28
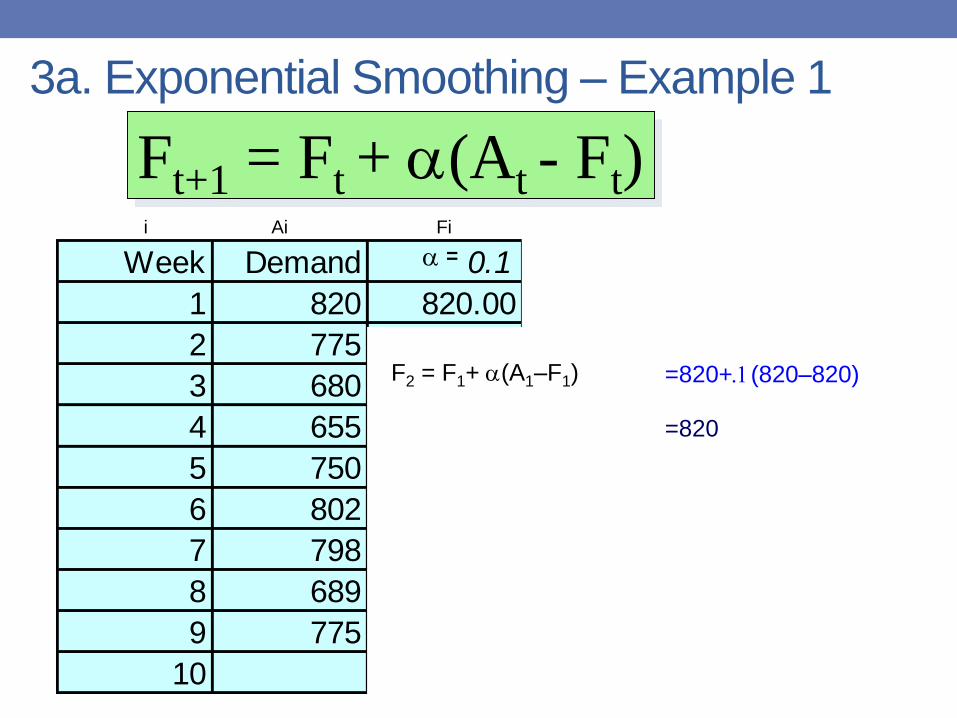
Ft+1 = Ft + a(At - Ft)
3a. Exponential Smoothing – Example 1
a =
F2 = F1+ a(A1–F1) =820+.1(820–820)
=820
i Ai Fi
Week Demand 0.1 0.6
1 820 820.00 820.00
2 775 820.00 820.00
3 680 815.50 793.00
4 655 801.95 725.20
5 750 787.26 683.08
6 802 783.53 723.23
7 798 785.38 770.49
8 689 786.64 787.00
9 775 776.88 728.20
10 776.69 756.28
Ft+1 = Ft + a(At - Ft)
3a. Exponential Smoothing – Example 1
a =
F3 = F2+ a(A2–F2) =820+.1(775–820)
=815.5
i Ai Fi

Week Demand 0.1 0.6
1 820 820.00 820.00
2 775 820.00 820.00
3 680 815.50 793.00
4 655 801.95 725.20
5 750 787.26 683.08
6 802 783.53 723.23
7 798 785.38 770.49
8 689 786.64 787.00
9 775 776.88 728.20
10 776.69 756.28
Ft+1 = Ft + a(At - Ft)
This process
continues
through week 10
3a. Exponential Smoothing – Example 1
a =
i Ai Fi

Week Demand 0.1 0.6
1 820 820.00 820.00
2 775 820.00 820.00
3 680 815.50 793.00
4 655 801.95 725.20
5 750 787.26 683.08
6 802 783.53 723.23
7 798 785.38 770.49
8 689 786.64 787.00
9 775 776.88 728.20
10 776.69 756.28
Ft+1 = Ft + a(At - Ft)
What if the
a constant
equals 0.6
3a. Exponential Smoothing – Example 1
a = a =
i Ai Fi
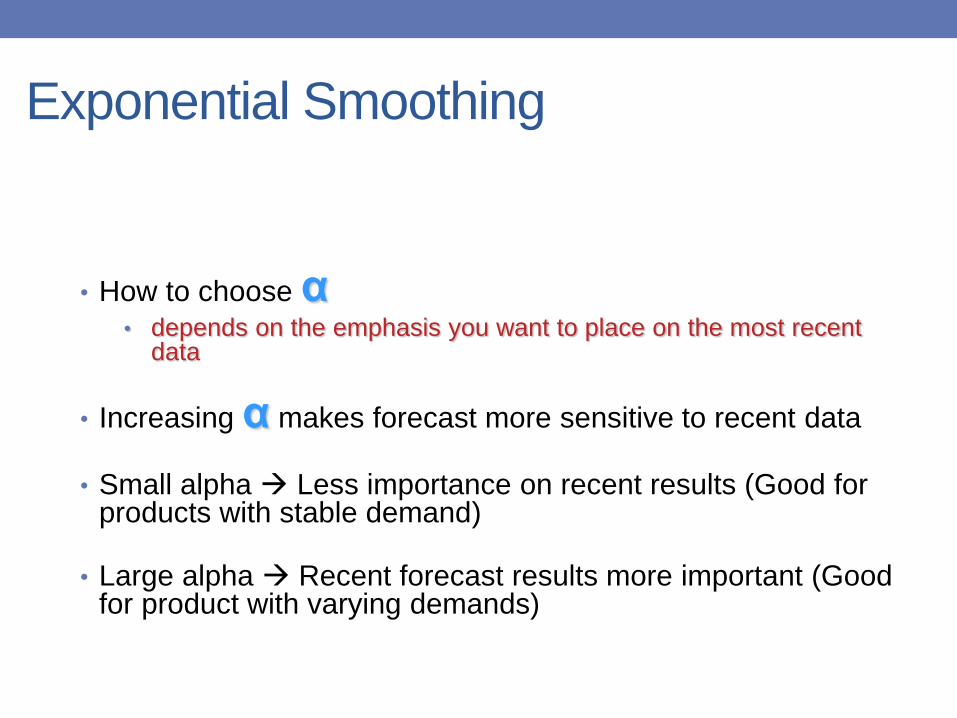
• How to choose α• depends on the emphasis you want to place on the most recent
data
• Increasing α makes forecast more sensitive to recent data
• Small alpha Less importance on recent results (Good for products with stable demand)
• Large alpha Recent forecast results more important (Good for product with varying demands)
Exponential Smoothing
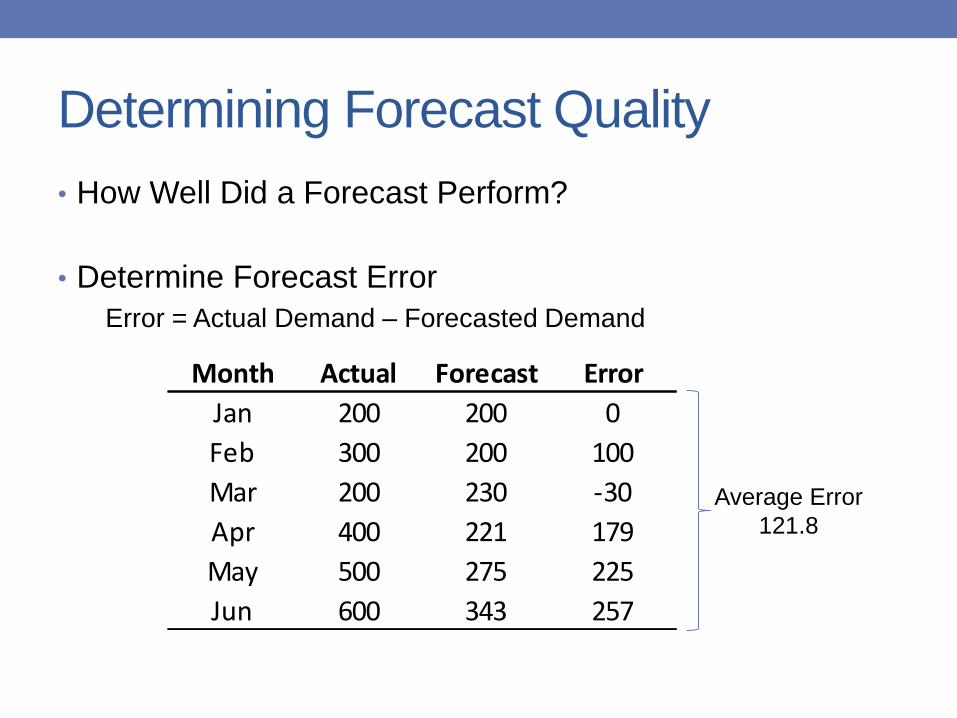
Determining Forecast Quality
• How Well Did a Forecast Perform?
• Determine Forecast Error
Error = Actual Demand – Forecasted Demand
Month Actual Forecast Error
Jan 200 200 0
Feb 300 200 100
Mar 200 230 -30
Apr 400 221 179
May 500 275 225
Jun 600 343 257
Average Error
121.8
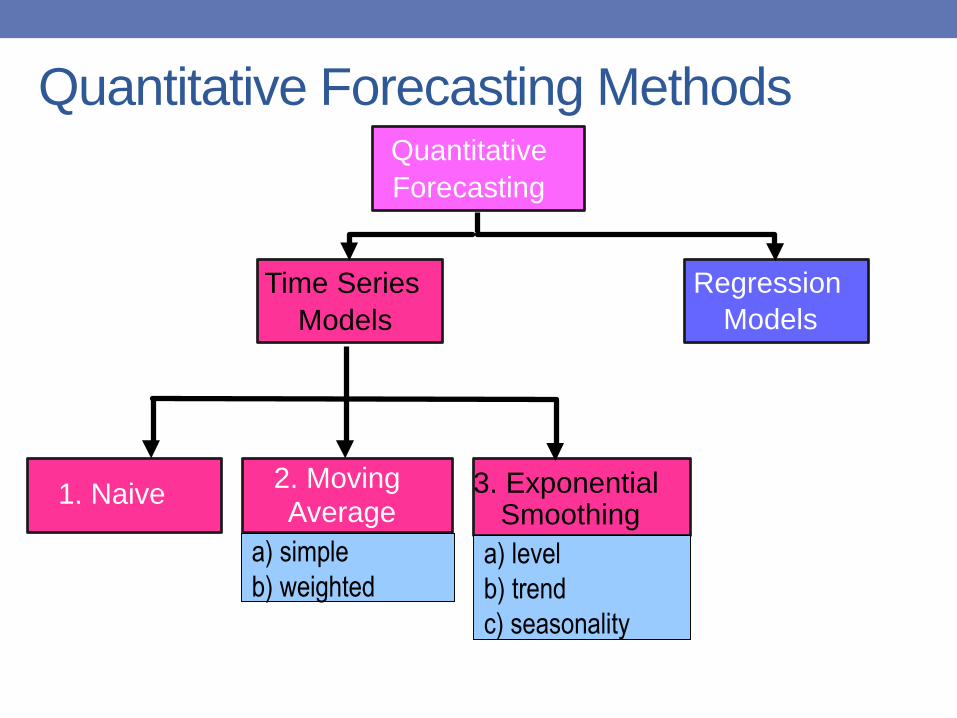
Quantitative Forecasting MethodsQuantitative
Forecasting
Regression
Models
2. MovingAverage
1. Naive
Time Series
Models
3. ExponentialSmoothing
a) simple
b) weighteda) level
b) trend
c) seasonality

General Guiding Principles for Forecasting
1. Forecasts are more accurate for larger groups of items.
2. Forecasts are more accurate for shorter periods of time.
3. Every forecast should include an estimate of error.
4. Before applying any forecasting method, the total system should be understood.
5. Before applying any forecasting method, the method should be tested and evaluated.
6. Be aware of people; they can prove you wrong very easily in forecasting

Summary
• What is forecasting
• How does it help a firm?
• What is the difference between potential tools one may
use if the time frame is short term versus long term?
• Describe the four qualitative forecasting approaches
• Describe the quantitative forecasting approaches
• Calculate a simple moving average
• What approach will let you weight more recent data
versus older data?