forecasts of the registered nurse workforce in california · 24/07/2013 · forecasts of the...
TRANSCRIPT
Forecasts of the Registered Nurse Workforce in California
July 24, 2013
Prepared for the California Board of Registered Nursing
Joanne Spetz, PhD
Philip R. Lee Institute for Health Policy Studies
& School of Nursing
University of California, San Francisco
2
Table of Contents
Table of Contents ............................................................................................................................ 2
Table of Exhibits ............................................................................................................................. 4
Executive Summary ........................................................................................................................ 5
Introduction ..................................................................................................................................... 7
The Supply of RNs.......................................................................................................................... 9
Method of Calculating RN Supply ........................................................................................... 10
Estimates of Supply Model Factors .......................................................................................... 11
Stock of RNs in 2013 ............................................................................................................ 11
Graduates from California nursing programs ....................................................................... 11
Graduates from nursing programs in other states who obtain their first license in California
............................................................................................................................................... 14
Immigration of internationally-educated nurses ................................................................... 14
Age distributions of new graduates ....................................................................................... 15
Interstate migration of RNs to California ............................................................................. 15
Movements from inactive to active license status ................................................................ 17
Movements from lapsed to active license status ................................................................... 18
Migration out of California (to another state or country) ..................................................... 19
Movements from active to inactive or lapsed license status ................................................. 19
Supply Forecasts of California’s RN workforce ....................................................................... 21
The Demand for RNs .................................................................................................................... 25
Forecasts based on RNs per capita ........................................................................................... 26
Forecasts based on hospital staffing of RNs per patient day .................................................... 26
Employment Development Department forecasts .................................................................... 27
Adjusting for low demand due to economic recession ............................................................. 27
Accounting for ACA ................................................................................................................. 28
Comparing the demand forecasts .............................................................................................. 28
Comparing Supply and Demand for RNs ..................................................................................... 30
Comparison of the 2013 Forecasts with Previous Forecasts ........................................................ 32
Policy Implications ....................................................................................................................... 32
References ..................................................................................................................................... 33
Acronyms ...................................................................................................................................... 36

3
4
Table of Exhibits
Executive Summary Exhibit: Projected full-time equivalent supply of and demand for RNs,
2013-2030. .......................................................................................................................... 6
Exhibit 1: A model of the supply of RNs. .................................................................................... 10
Exhibit 2: Counts of actively-licensed RNs living in California, by age group, February 28, 2013,
and March 30, 2011 .......................................................................................................... 13
Exhibit 3: Enrollments and graduations from RN education programs, 2001-2002 through 2011-
2012................................................................................................................................... 13
Exhibit 4: Predicted growth in graduations based on known growth in new enrollments .......... 14
Exhibit 5. Estimated age distribution of new graduates from California RN programs ............... 15
Exhibit 6. Requests for license endorsement into California, 2011-2012 (Low estimate) .......... 16
Exhibit 7. Estimated movements from other states to California, 2007-2008 (High estimate) ... 16
Exhibit 8. Rates of migration of RNs to California from other states as a function of the
California RN population. ................................................................................................. 18
Exhibit 9. Number and age distribution of RNs changing status from inactive to active license
status, 2001-2012 .............................................................................................................. 18
Exhibit 10. Number and rate of RNs reactivating lapsed licenses, 2011-2012 ............................ 19
Exhibit 11. Estimated annual rates of RNs migrating out of California. ...................................... 20
Exhibit 12. Estimated annual rates of RNs changing from active to inactive or lapsed license
status, by age category. ..................................................................................................... 21
Exhibit 13. Forecasted number of RNs with active licenses residing in California, 2013-2030. 22
Exhibit 14. Employment rates and average hours worked per week by RNs residing in California,
2012................................................................................................................................... 23
Exhibit 15. Forecasted full-time equivalent supply of RNs, based on “best estimate” forecasted
count of RNs, 2013-2030. ................................................................................................. 24
Exhibit 16. Forecasted full-time equivalent supply of RNs per 100,000 population, 2013-2030 25
Exhibit 17. Forecasted full-time equivalent demand for RNs, 2013-2030. ................................. 29
Exhibit 18. Forecasted full-time equivalent supply of and demand for RNs, 2013-2030. .......... 31
5
Executive Summary
This report presents supply and demand forecasts for the Registered Nurse (RN)
workforce in California from 2013 through 2030. These new forecasts are based on data from
the 2012 California Board of Registered Nursing (BRN) Survey of Registered Nurses, the U.S.
Bureau of Health Professions (BHPr) 2008 National Sample Survey of RNs, and data extracted
from the BRN license records. The 2013 forecasts indicate that supply of and demand for RNs
are fairly well-balanced, and the market will continue to be balanced in the future if current
enrollment and state-to-state migration patterns are stable. The forecasts of RN supply take
into account the aging of the RN workforce, new graduates (including those from out-of-state
and international nursing programs), interstate flows of RNs, and changes in license status. The
2013 forecasts of supply incorporate new data for these factors. One important change relative to
the 2011 forecasts is that expectations for future migration of nurses into California from other
states were computed using a new method.
The demand forecasts are based on national numbers of RNs per 100,000 population. The
demand for RNs can be measured and forecasted in many ways, reflecting disparate notions of
what demand is or should be. Demand can be measured through benchmarks, such as the
number of nurses per capita. Other demand forecasts may examine rates of population growth
and population aging. Direct survey of employers can illuminate current demand for nursing
positions. We developed several alternate forecasts of demand, using national RN-to-population
data and estimating future hospital utilization in California. We also examined forecasts from
EDD. The demand estimates produced from these different strategies provide a range of
possible scenarios for the future.
A comparison of the supply and demand forecasts, presented in the Executive Summary
Exhibit, indicates that the magnitude of California’s shortage depends on the measure of demand
and the assumptions made about future supply. The forecasting model produces a range of
supply forecasts; the “Best Supply Forecast” is based on the midpoints of most of the parameters
of the model and is between the highest and lowest forecasts. In the figure, the supply forecast is
compared with three different estimates of demand: (1) the 2008 national 25th percentile of full-
time equivalent RNs per population; (2) the 2008 national average of full-time equivalent RNs
per population; and (3) a forecasting of supply based on current hospital utilization of RNs and
project future hospital patient days. In 2013, the statewide RN labor market appears to be
slightly lower than demand, which is consistent with employer surveys that indicate some
hospitals are having difficulty recruiting experienced nurses. Overall, California’s RN supply is
forecasted to match demand reasonably well over the next two decades if RN graduations remain
stable and state-to-state migration patterns do not change significantly.
Policymakers should be cautioned that the 2013 BRN forecasts represent long-term
forecasts and are not intended to reflect rapidly changing economic and labor market conditions.
They also do not measure variations across regions of California; it is possible that some regions
of the state will experience shortages even while others have a surplus of RNs. The forecasts are
based on the most currently available data; the factors that affect RN supply and demand are
unlikely to remain static. The most important possible changes include: (1) the number of
graduations from RN education programs; (2) inter-state migration; and (3) employment rates of
older RNs. California leaders should observe closely the employment paths of recent nursing
graduates who are entering a difficult job market and may choose to leave the nursing profession
or leave California. Moreover, they should watch new enrollments in nursing programs, which

6
could drop as state colleges and universities face tight budgets and as potential students hear
there might not be enough nursing jobs. California will likely need to maintain the present
number of nursing graduates in order to meet long-term health care needs.
Executive Summary Exhibit: Projected full-time equivalent supply of and demand for
RNs, 2013-2030.
7
Introduction
The labor market for registered nurses (RNs) has been characterized by cycles of
shortage and surplus since World War Two. The most recent period of shortage began in the late
1990s (Buerhaus 1998; Buerhaus & Staiger 1999), and persisted through the late 2000s. Periods
of nursing shortage generate significant challenges because they drive higher health care costs as
wages rise (Spetz and Given, 2003), and because patient outcomes are impacted by the level of
nurse staffing in hospitals and other care facilities (Needleman et al., 2002; Aiken et al., 2002).
Since 2010, however, data have indicated that California’s long-standing RN shortage
ended, at least temporarily. Surveys of California hospital Chief Nursing Officers have reported
that they perceive that there is slightly greater RN supply than demand. This change in the labor
market has been attributed to several trends. First, nursing school enrollments expanded
substantially in California, more than doubling between 2001 and 2010 (Bates, Keane, & Spetz,
2011). This expansion of RN supply would have alleviated the shortage in many regions on its
own. In addition, the national economic recession further mitigated the shortage by leading to an
increase in the workforce participation of RNs who would otherwise retire or reduce their hours
for work. It has been estimated that nearly all the hospital employment increase in the past
decade can be attributed to growth in RN supply during economic recessions (Buerhaus and
Auerbach, 2011). The economic recession also has reportedly dampened demand for newly-
graduated nurses. In late 2010, a survey of Chief Nursing Officers found that there were fewer
than 6,500 full-time equivalent vacant positions for RNs statewide (Bates, Keane, & Spetz
2011), while the 2010 BRN Survey of Registered Nurses indicates that nearly 7,700 RNs are
seeking employment (Spetz, Keane, & Herrera, 2011).
More recent data suggest the labor market may be shifting again. The Fall 2012 Survey of
Nurse Employers found that a greater share of Chief Nursing Officers are experiencing some
difficulty recruiting RNs for specialized positions, and that on average they believe the labor
market is in balance. Hospital vacancy rates in fall 2012 were slightly higher than in fall 2010,
rising to 3.8 percent from 3.4 percent. These data are consistent with the widespread expectation
that the economic recovery would lead nurses who delayed retirement, re-entered the labor force,
or increased their hours of work due to the economic recession to retire or reduce their
employment as the economy recovers (Buerhaus, Auerbach, & Staiger 2009; Buerhaus &
Auerbach 2011). In fact, the 2012 BRN Survey of RNs found that there were increases in the
shares of RNs who plan to retire and plan to reduce their hours of nursing work within the next
five years, relative to 2010.
At the same time, the impending implementation of the most significant components of
the Affordable Care Act (ACA) – an expansion of Medi-Cal and the implementation of a Health
Insurance Exchange to facilitate insurance enrollment – is expected to lead to an increase of
more than 30 million additional Americans with health care insurance coverage in the near
future, which will likely increase demand for RNs and other health professionals (Coffman &
Ojeda 2010; Staiger, Auerbach, & Buerhaus 2011). These and other changes have introduced
uncertainty regarding the future supply and demand for RNs.
This report updates forecasts of RN supply and demand in California, which were first
developed for the California Board of Registered Nursing (BRN) in 2005 and subsequently
updated in 2007, 2009, and 2011(Spetz and Dyer, 2005; Spetz, 2007; Spetz 2009; Spetz 2011).
These new forecasts take into account changes in supply that developed as a result of the

8
economic recession and updated estimates of inter-state migration. New data from the 2012 BRN
Survey of Registered Nurses (Spetz, Keane, Chu, and Blash, 2013), the 2008 National Sample
Survey of RNs (U.S. Department of Health and Human Services, 2010), the 2011-2012 BRN
Annual Schools Report (Waneka, Bates, and Spetz, 2012), and BRN license records are used to
update the model of RN supply. The demand estimates are informed by surveys of employers
conducted in fall 2010, 2011, and 2012 with support from the Gordon and Betty Moore
Foundation (Bates, Chu, Keane, & Spetz 2013). Recent changes in demand for health care
services, as well as the published literature on the likely impact of PPACA on demand for health
care services, inform the revised demand forecasts.

9
The Supply of RNs
California’s RN workforce consists of nurses with active California licenses, who are
allowed to work as RNs within the state. There were 384,707 RNs with current and active
licenses on February 28, 2013, of whom 328,282 resided in California. For the purposes of these
forecasts, we consider the California-resident population as the supply of available nurses; the
role of nurses who travel to work in California from other states is discussed later in the report.
The RN workforce constantly changes with the entrance of newly graduated nurses,
migration of nurses from other states and countries, retirements, temporary departures from
nursing work, and fluctuations in the number of hours nurses choose to work. These factors can
be grouped into three categories:
Inflows of nurses: Additions to the number of RNs in California.
o Graduates from California nursing programs;
o Graduates of nursing programs in other states who obtain their first RN
license in California;
o Internationally-educated nurses who immigrate to California and obtain their
RN license;
o Interstate migration of RNs to California;
o Changes from inactive to active license status; and
o Changes from delinquent to active license status.
Outflows of nurses: The departure of RNs from the California population.
o Migration out of California (to another state or country); and
o Movements from active to inactive or lapsed license status, which includes
nurses who do not move out of California but who retire or otherwise
permanently leave nursing.
Labor force participation factors: Decisions to work, and how much to work.
o Share of RNs with active licenses and California residence that works in
nursing; and
o Average number of hours worked per week by RNs working in nursing.
The inflows are added to the number of RNs with active licenses and California
residences, which is called the “stock” of nurses available to work, and the outflows are
subtracted from the stock. Estimates of the labor supply of RNs are derived from the stock of
RNs potentially available to work and how much they choose to work in nursing. This number is
expressed as full-time equivalent employment (FTEE) in order to account for differences in the
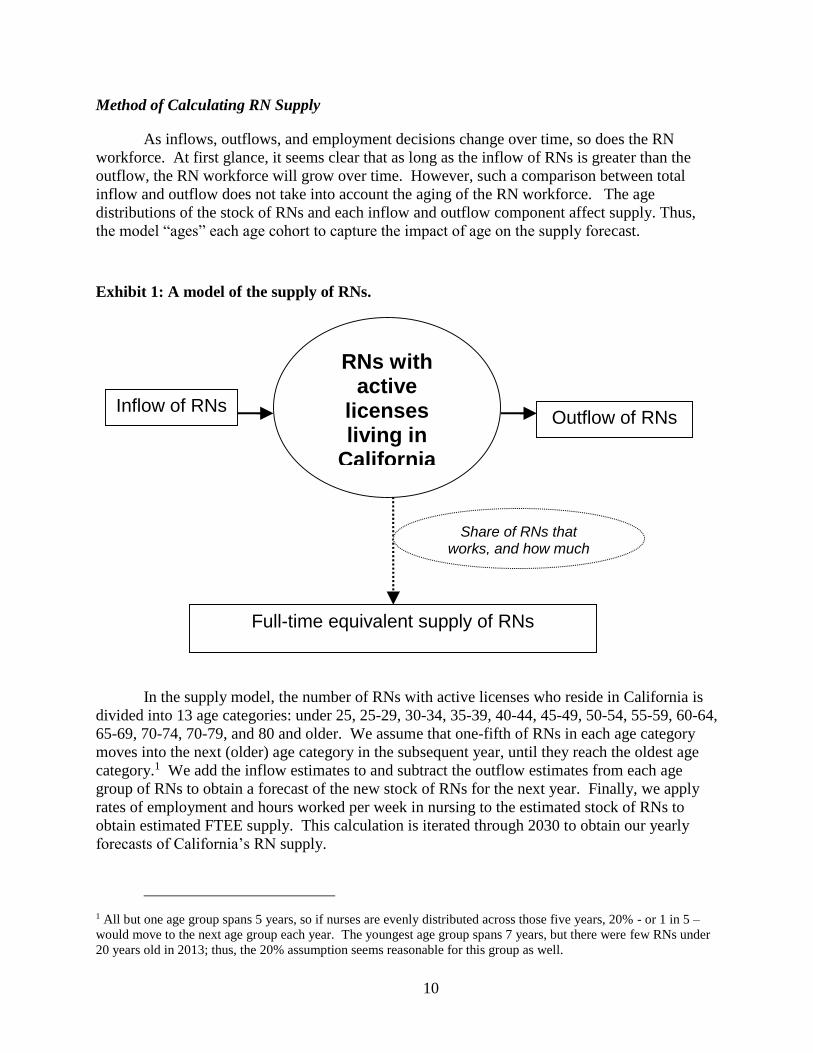
work commitments of those employed full-time and part-time. Figure 1 illustrates this model of
the supply of RNs in California, commonly called a “stock-and-flow model.”
10
Method of Calculating RN Supply
As inflows, outflows, and employment decisions change over time, so does the RN
workforce. At first glance, it seems clear that as long as the inflow of RNs is greater than the
outflow, the RN workforce will grow over time. However, such a comparison between total
inflow and outflow does not take into account the aging of the RN workforce. The age
distributions of the stock of RNs and each inflow and outflow component affect supply. Thus,
the model “ages” each age cohort to capture the impact of age on the supply forecast.
Exhibit 1: A model of the supply of RNs.
In the supply model, the number of RNs with active licenses who reside in California is
divided into 13 age categories: under 25, 25-29, 30-34, 35-39, 40-44, 45-49, 50-54, 55-59, 60-64,
65-69, 70-74, 70-79, and 80 and older. We assume that one-fifth of RNs in each age category
moves into the next (older) age category in the subsequent year, until they reach the oldest age
category.1 We add the inflow estimates to and subtract the outflow estimates from each age
group of RNs to obtain a forecast of the new stock of RNs for the next year. Finally, we apply
rates of employment and hours worked per week in nursing to the estimated stock of RNs to
obtain estimated FTEE supply. This calculation is iterated through 2030 to obtain our yearly
forecasts of California’s RN supply.
1 All but one age group spans 5 years, so if nurses are evenly distributed across those five years, 20% - or 1 in 5 –
would move to the next age group each year. The youngest age group spans 7 years, but there were few RNs under
20 years old in 2013; thus, the 20% assumption seems reasonable for this group as well.
RNs with active
licenses living in
California
Inflow of RNs Outflow of RNs
Full-time equivalent supply of RNs
Share of RNs that works, and how much
they work

11
For some factors in the supply model, differing estimates are available, with no indication
of which estimate is most reliable. For other factors, there is uncertainty as to whether current
data are applicable to what might happen in the future. For example, in 2010 and 2012 a greater
share of nurses over age 60 was employed as compared with prior years. This increase is likely
because older nurses are delaying their retirement due to declines in the value of their retirement
savings. If interest rates and the stock market rise, these nurses may decide to stop working and
employment rates might return to pre-recession levels. However, it also is possible that “baby
boomer” nurses have different intentions regarding retirement than did previous generations, and
the higher rate of employment in this age group will persist regardless of economic
circumstances. For variables with such uncertainty, a range of estimates is offered representing
the highest and lowest values. In the final models, the “best estimate” for each parameter is the
average of the low and high estimates, unless otherwise noted.
Estimates of Supply Model Factors
Stock of RNs in 2013
Data on the number of RNs with active licenses were obtained from the BRN for
February 28, 2013. At that time, 328,282 RNs had active licenses and a California address. The
56,425 RNs with addresses outside California were not included in the stock of RNs because
California’s border regions are generally rural and thus few nurses commute regularly from out
of state. Some nurses might intermittently come to California as traveling nurses, thus
supplanting the state’s supply, but these are not part of the regular stock of RNs. Traveling
nurses are discussed in more detail below.
The number of RNs with active licenses and California addresses was divided into 13 age
groups, as seen in Exhibit 2. Three RNs did not have age data recorded in the licensing file
provided by the BRN and are excluded from the table and subsequent analyses. The same age
groups are used throughout the model. Exhibit 2 compares the 2013 data to that from 2011. The
total number of licensed RNs living in California grew by 17,540 (5.6%), representing a slightly
lower growth rate than between 2009 and 2011 (6.2%). The number of licensed California-
resident RNs increased in all age groups except 20 to 24 years (-8.4%), and 50-54 years (-6.2%).
The largest growth rates between 2011 and 2013 were seen among the older age group, with
greater than 17 percent growth among nurses 65 to 69 years (17.7%), 70 to 74 years (18.8%), 75
to 79 years (19.2%), and 80 years and older (19.1%). This contrasts notably to the growth
between 2009 and 2011, when the fastest growth was among nurses 25 to 29 years (21.9%), 40
to 44 years (18.2%), and 65 to 69 years (15.5%).
Graduates from California nursing programs
Data on new graduates from California nursing programs who receive their first RN
license in California were obtained from the BRN. According to the 2011-2012 BRN Annual
Schools Report, there were 10,814 new graduates from California nursing programs in the 2011-
2012 school year (Waneka, Bates, & Spetz 2013). This is a slight decrease from two years prior;
in the 2009-2010 academic year, there were 11,512 graduates. However, over the past decade,
there was substantial growth in new enrollments in RN education programs. Exhibit 3 presents
the numbers of enrollments and graduates from the past nine Annual Schools Reports.
Growth in RN program enrollments will lead to growth in graduations in future years.
Associate Degree Nursing (ADN) programs are designed so students can complete the nursing
12
component of the degree in two years. In most Baccalaureate of Science Nursing Degree (BSN)
programs, students are formally enrolled in nursing major courses during the last 2.5 to 3 years
of the pre-licensure BSN degree program, unless the program is an accelerated BSN degree
program. Thus, enrollment changes will translate to graduation changes two to three years into
the future.
To predict future graduations, actual enrollments for each year of the Annual Schools
Report were compared with graduations two years later. From 2006-2007 through 2011-2012,
graduations averaged 83.8 percent of the number of enrollments two years prior, which
represents a notable decrease from the 89.3 percent “productivity rate” used in the 2011
forecasts. This rate was used to estimate future graduations. The forecasted number of
graduations in 2013-2014 is thus 83.8 percent of the known enrollments from 2011-2012.

13
Exhibit 2: Counts of actively-licensed RNs living in California, by age group, February 28,
2013, and March 30, 2011
February 28, 2013 March 30, 2011
Age Group Count % of Total Count % of Total
Under 25 2,531 0.77% 2,763 0.89%
25-29 23,335 7.11% 21,681 6.98%
30-34 33,206 10.12% 28,910 9.30%
35-39 34,878 10.62% 35,189 11.32%
40-44 41,097 12.52% 37,045 11.92%
45-49 33,718 10.27% 33,136 10.66%
50-54 37.099 11.30% 39,547 12.73%
55-59 45,083 13.73% 45,956 14.79%
60-64 38.876 11.84% 33,980 10.94%
65-69 22,521 6.86% 19,135 6.16%
70-74 10,181 3.10% 8,568 2.76%
75-79 4,056 1.24% 3,403 1.10%
80+ 1,698 0.52% 1,426 0.46%
Total 328,279 100.00% 310,739 100.00%
Source: California Board of Registered Nursing license records. Notes that 3 RNs with unknown ages are excluded
from this table.
Exhibit 3: Enrollments and graduations from RN education programs, 2001-2002 through
2011-2012
Survey year Number of new
enrollments
Growth in
enrollments
Number of
graduations
Growth in
graduations
2001-2002 6,422 4.8% 5,346 3.2%
2002-2003 7,457 16.1% 5,623 5.2%
2003-2004 7,825 4.9% 6,158 9.5%
2004-2005 8,926 14.1% 6,677 8.4%
2005-2006 11,131 24.7% 7,528 12.8%
2006-2007 12,709 14.2% 8,317 10.5%
2007-2008 12,961 2.0% 9,580 15.2%
2008-2009 13,988 7.9% 10,570 10.3%
2009-2010 14,228 1.7% 11,512 8.9%
2010-2011 13,939 -2.0% 10,666 -7.4%
2011-2012 13,677 -1.9% 10,814 1.4% Source: Waneka, Bates, & Spetz, 2013. 2011-2012 Annual School Report Data Summary and Historical Trend
Analysis.
14
Graduations after the 2013-2014 academic year are more difficult to estimate, because
enrollments for 2012-2013 are not yet known. To estimate graduations beyond the 2013-2014
academic year, we used estimates reported by schools of their new enrollments for future years.
They estimated their 2012-2013 new enrollments to be 12,948, which is a 5.3 percent decline
relative to the previous year. Their forecasted new enrollment for 2013-2014 is 12,601, which is
a 7.9 percent decline relative to 2011-2012. These estimates were multiplied by 83.8 percent to
obtain forecasted graduations for 2014-2015 and 2015-2016. Based on current funding for
higher education, the forecasts assume that nursing program enrollments will be relatively stable
after the 2013-2014 academic year. In the forecasting model, the “low” estimate of growth in
RN education after 2015-2016 is 0%, the high estimate is 2%, and the “best” estimate is 1%.
Predicted graduations from 2008-2009 through 2015-2016 are presented in Exhibit 4.
Exhibit 4: Predicted growth in graduations based on known growth in new enrollments
Academic year Actual/forecasted
new enrollments
Forecasted
graduations
2008-2009 13,988* 10,526*
2009-2010 14,228* 11,512*
2010-2011 13,939* 10.666*
2011-2012 13,677* 10,814*
2012-2013 12,948 11,678
2013-2014 12,601 11,458
2014-2015 10,847
2015-2016 10,557 * Actual number of enrollments and graduations based on Annual Schools Report.
Note: Forecasts of enrollments are provided by RN programs in the Annual Schools Survey. Forecasted graduations
are 83.8 percent of enrollments two years prior. Source: Waneka, Bates, and Spetz, 2013. 2011-2012 Annual School
Report Data Summary and Historical Trend Analysis.
Graduates from nursing programs in other states who obtain their first license in California
Each year, some graduates of nursing programs in other states obtain their first RN
license in California. According to the BRN, in the 2011-2012 fiscal year, 693 out-of-state
graduates obtained their first license from California; this is the high estimate of out-of-state
graduates who move to California. BRN records also indicate that 564 of these nurses are living
in California; this is the low estimate. The “best estimate” for the inflow of new licensees from
other states is the average of the high and low estimates: 629 nurses. This estimate is lower than
that from the 2011 forecasts, which was 840.
Immigration of internationally-educated nurses
In the 2011-2012 fiscal year, the BRN reports that 2,021 internationally-educated nurses
passed the National Council Licensure Examination for RNs (NCLEX-RN) and received initial
licensure as an RN in California; in the 2009-2010 fiscal year, the figure was slightly higher,
with 3,900 internationally-educated RNs receiving initial licensure in California. In 2013, 1,200
of these nurses lived in California; the remainder lived in other states or countries. Since the
1997-1998 fiscal year, the number of first licenses issued to internationally-educated nurses has
ranged between 1,145 and 4,107 annually. In the supply model, we use total number of 2011-
15
2012 international graduates as the high estimate of the number of immigrants. We use the
number that lives in California as the low estimate. The best estimate is the average of the high
and low estimates: 1,611 internationally-educated RNs immigrate to California each year.
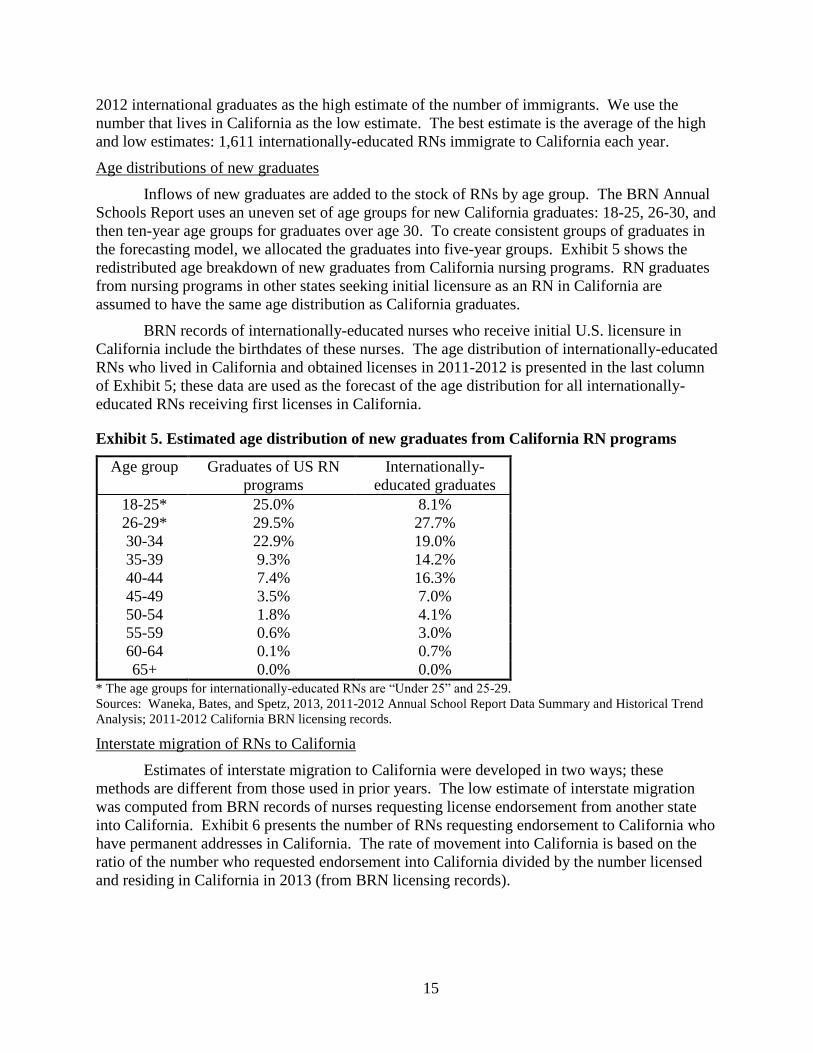
Age distributions of new graduates
Inflows of new graduates are added to the stock of RNs by age group. The BRN Annual
Schools Report uses an uneven set of age groups for new California graduates: 18-25, 26-30, and
then ten-year age groups for graduates over age 30. To create consistent groups of graduates in
the forecasting model, we allocated the graduates into five-year groups. Exhibit 5 shows the
redistributed age breakdown of new graduates from California nursing programs. RN graduates
from nursing programs in other states seeking initial licensure as an RN in California are
assumed to have the same age distribution as California graduates.
BRN records of internationally-educated nurses who receive initial U.S. licensure in
California include the birthdates of these nurses. The age distribution of internationally-educated
RNs who lived in California and obtained licenses in 2011-2012 is presented in the last column
of Exhibit 5; these data are used as the forecast of the age distribution for all internationally-
educated RNs receiving first licenses in California.
Exhibit 5. Estimated age distribution of new graduates from California RN programs
Age group Graduates of US RN
programs
Internationally-
educated graduates
18-25* 25.0% 8.1%
26-29* 29.5% 27.7%
30-34 22.9% 19.0%
35-39 9.3% 14.2%
40-44 7.4% 16.3%
45-49 3.5% 7.0%
50-54 1.8% 4.1%
55-59 0.6% 3.0%
60-64 0.1% 0.7%
65+ 0.0% 0.0% * The age groups for internationally-educated RNs are “Under 25” and 25-29.
Sources: Waneka, Bates, and Spetz, 2013, 2011-2012 Annual School Report Data Summary and Historical Trend
Analysis; 2011-2012 California BRN licensing records.
Interstate migration of RNs to California
Estimates of interstate migration to California were developed in two ways; these
methods are different from those used in prior years. The low estimate of interstate migration
was computed from BRN records of nurses requesting license endorsement from another state
into California. Exhibit 6 presents the number of RNs requesting endorsement to California who
have permanent addresses in California. The rate of movement into California is based on the
ratio of the number who requested endorsement into California divided by the number licensed
and residing in California in 2013 (from BRN licensing records).

16
Exhibit 6. Requests for license endorsement into California, 2011-2012 (Low estimate)
Age Category Number requesting
endorsement & living in CA
Percent of RNs living in other
states requesting endorsement
Under 25 73 2.88%
25-29 590 2.53%
30-34 589 1.77%
35-39 377 1.08%
40-44 284 0.69%
45-49 174 0.52%
50-54 160 0.43%
55-59 165 0.37%
60-64 90 0.23%
Over 64 33 0.86% Sources: California Board of Registered Nursing license records, 2011-2012; BRN license records, 2013.
The high estimate of interstate migration is based on data from the 2008 BHPr NSSRN.
The NSSRN asked respondents about their current and former state of residence with the
following questions:
(1) Where do you currently reside?
(2) Did you reside in the same city/town a year ago?
(3) If the person does not live in the same place as one year previously: Where did
you reside a year ago?
Using the variables corresponding to these questions in the 2008 NSSRN and applying
sample weights, we were able to estimate the number and age distribution of RNs who did not
reside in California in 2007, but did so in 2008. The share moving to California between 2007
and 2008 is divided by the estimated number of RNs residing in California in 2007 to obtain a
rate of migration into California. Exhibit 7 presents these estimates.
Exhibit 7. Estimated movements from other states to California, 2007-2008 (High estimate)
Age Category Number moving to
California, 2007-2008
Number of RNs in
California, 2007
Percent of RNs moving
to California
Under 25 1,569 3,326 1.98%
25-29 4,146 18,125 2.00%
30-34 5,311 24,793 1.90%
35-39 4,811 31,111 1.45%
40-44 2,556 30,128 0.73%
45-49 3,246 38,383 0.73%
50-54 1,869 43,684 0.38%
55-59 2,161 37,339 0.55%
60-64 760 22,893 0.30%
65-69 183 13,500 0.13%
70-74 196 6,213 0.37% Source: Bureau of Health Professions, 2010.

17
Note that during 2007 and early 2008, California’s economy was growing rapidly and
both the U.S. and California economy were strong. In-migration rates was likely to have been
higher at that time than we might expect in the future. Thus, we estimate future migration with
more weight to recent patterns of endorsement requests, and de-emphasizing the 2007-2008
estimates from the NSSRN. We calculate the “best estimate” as:
Best estimate = 0.2*high estimate + 0.8*low estimate
Because future interstate movements of nurses are highly uncertain, this variable is
largely responsible for the overall difference between the high supply forecast and the low
forecast. It also is responsible for the lower estimates of in-migration in 2013 as compared with
2011.
Movements from inactive to active license status
We obtained data from the BRN, by age category, on the number of RNs with California
addresses changing from inactive to active license status for the most recent fiscal year. The
total has ranged from 189 nurses in 2002-2003 to 796 nurses in 2011-2012. The 2011-2012 data
are used to estimate the number and age distribution of RNs changing from inactive to active
license status (Exhibit 9).

18
Exhibit 8. Rates of migration of RNs to California from other states as a function of the
California RN population.
High estimate
(NSSRN)
Low estimate
(BRN)
Best estimate
2013
Best estimate
2011
Under 25 47.2% 2.9% 11.7% 8.1%
25-29 22.9% 2.5% 6.6% 9.3%
30-34 21.4% 1.8% 5.7% 8.2%
35-39 15.5% 1.1% 4.0% 6.1%
40-44 8.5% 0.7% 2.2% 3.2%
45-49 8.5% 0.5% 2.1% 3.0%
50-54 4.3% 0.4% 1.2% 1.7%
55-59 5.8% 0.4% 1.5% 2.3%
60-64 3.3% 0.2% 0.8% 1.3%
65-69 1.4% 0.1% 0.3% 0.7%
70-74 3.2% 0.0% 0.6% 1.4%
75-79 0.0% 0.0% 0.0% 0.0%
80+ 9.8% 0.0% 2.0% 3.3% Sources: California Board of Registered Nursing license records, FY 2011-2012; Bureau of Health Professions,
2010.
Exhibit 9. Number and age distribution of RNs changing status from inactive to active
license status, 2011-2012
Age Category Number Percent Age Category Number Percent
<30 2 0.3% 55-59 95 11.9%
30-34 15 1.9% 60-64 96 12.1%
35-39 27 3.4% 65-69 111 13.9%
40-44 45 5.7% 70-74 125 15.7%
45-49 39 4.9% 75+ 156 19.6%
50-54 85 10.7% Total 796 100.0% Source: California Board of Registered Nursing license records, FY 2011-2012.
Movements from lapsed to active license status
The BRN provided data on the number and age distribution of RNs whose licenses were
lapsed and later were reactivated. In the 2011-2012 fiscal year, 868 RNs living in California
reactivated their licenses. The rate of reactivation was computed by dividing the number of RNs
reactivating their licenses in each age group by the total number of actively licensed RNs in the
age group. These data are presented in Exhibit 10.

19
Exhibit 10. Number and rate of RNs reactivating lapsed licenses, 2011-2012
Age Category
Number of
reactivated
licenses
Rate of
reactivation
<30 26 0.10%
30-34 72 0.22%
35-39 86 0.25%
40-44 113 0.27%
45-49 103 0.31%
50-54 123 0.33%
55-59 117 0.26%
60-64 101 0.26%
65-69 64 0.28%
70-74 40 0.39%
75+ 23 0.40% Source: California Board of Registered Nursing license records, FY 2011-2012.
Migration out of California (to another state or country)
Estimates of migration out of California were created with data from the 2008 NSSRN
and California BRN records of nurses requesting outgoing endorsement. The first estimate is
based on analysis of the 2008 NSSRN data. The same variables used to calculate migration of
RNs into California were used to calculate the high estimate of migration out of California.
First, estimates of the number and age distribution of RNs who moved out of California between
2007 and 2008 were computed. Then, the number and age distribution of RNs who resided in
California in 2007 were tabulated. Finally, for each age category, the estimated share of RNs
who moved out of California between 2007 and 2008 was calculated by dividing the number
who moved out of California by the total number in California in 2007.
Two additional estimates were obtained from BRN records on applications for outgoing
endorsements in 2011-2012, by age group. Some of these people requesting outgoing
endorsement had in-state addresses at the time of the request, and others had out-of-state
addresses. Both of these numbers were divided by the numbers of RNs in each age group in
2013 to obtain estimates of the rate of out-migration. Exhibit 11 presents the rates used in the
model. The “best estimate” is the average of the three estimated out-migration rates.
Movements from active to inactive or lapsed license status
Estimates of the rate at which actively-licensed RNs allow their licenses to lapse were
computed from California BRN license records and the NSSRN. These estimates are very
important to the model because they measure the loss of nurses due to relocation, change in
employment plans, retirement, and death. The model does not distinguish among these reasons
for allowing a license to lapse.

20
Exhibit 11. Estimated annual rates of RNs migrating out of California.
Age Category NSSRN
estimate
BRN estimate –
CA addresses
BRN estimate
– all addresses
Best estimate
2013
Best estimate
2011
Under 25 0.0% 2.9% 5.3% 4.1% 25.2%
25-29 13.9% 2.9% 6.4% 4.7% 10.1%
30-34 1.9% 2.1% 5.0% 3.6% 4.0%
35-39 5.6% 1.3% 3.6% 2.4% 4.1%
40-44 2.4% 1.0% 2.6% 1.8% 2.2%
45-49 2.2% 0.8% 2.5% 1.7% 2.4%
50-54 1.2% 0.8% 2.2% 1.5% 1.5%
55-59 2.1% 0.8% 1.8% 1.3% 1.6%
60-64 2.0% 0.5% 1.4% 0.9% 1.3%
65-69 1.9% 0.4% 1.1% 0.7% 1.1%
70-74 1.5% 0.1% 0.6% 0.4% 0.8%
75-79 0.0% 0.3% 0.2% 0.1% 0.1%
80+ 0.0% 0.0% 0.0% 0.0% 0.0% Source: California Board of Registered Nursing license records, FY 2011-2012; Bureau of Health Professions,
2010.
The BRN provided data on the number of RNs with California addresses who changed
their license status to inactive or allowed their license to lapse in the 2011-2012 fiscal year.
These data were provided in age groups up through “75 and older”. The number of RNs with a
non-active license divided by the number of current active RNs to produce initial estimates of the
rate at which nurses leave the pool of actively licensed RNs.
The 2004 and 2008 NSSRN were used to obtain an alternative estimate of movements
from active to inactive license status, and to obtain estimates for age groups through 65 and
older. First, the number of RNs who were U.S. residents in 2004 was calculated, by age
category. The number of RNs (U.S. residents only), by age category, who responded in the 2008
survey that they received their first U.S. license between 2004 and 2008 was added to this
figure. Then the number of RNs who were U.S. residents in 2008, by age category, was
calculated for age categories four years older than those tabulated in 2004. The formula for
estimating the number going “inactive” is:
Number of inactive RNs (US residents only) = Number of RNs in 2008 – Number of
RNs in 2004 – Number newly licensed between 2004 and 2008.
The rate of inactivation is:
Inactive Rate=Number of inactive RNs (US residents only) / Number of RNs in 2008
This calculation was translated into a yearly rate with the following formula:
Yearly Rate = 1-(1-Inactive rate)0.25
If the estimated rate from the NSSRN was negative, it was assumed to be zero. For
nurses under 65 years old, the average of the BRN-based estimate and the NSSRN-based
estimate was used to compute the rate at which nurses’ licenses go inactive or lapse. For nurses
21
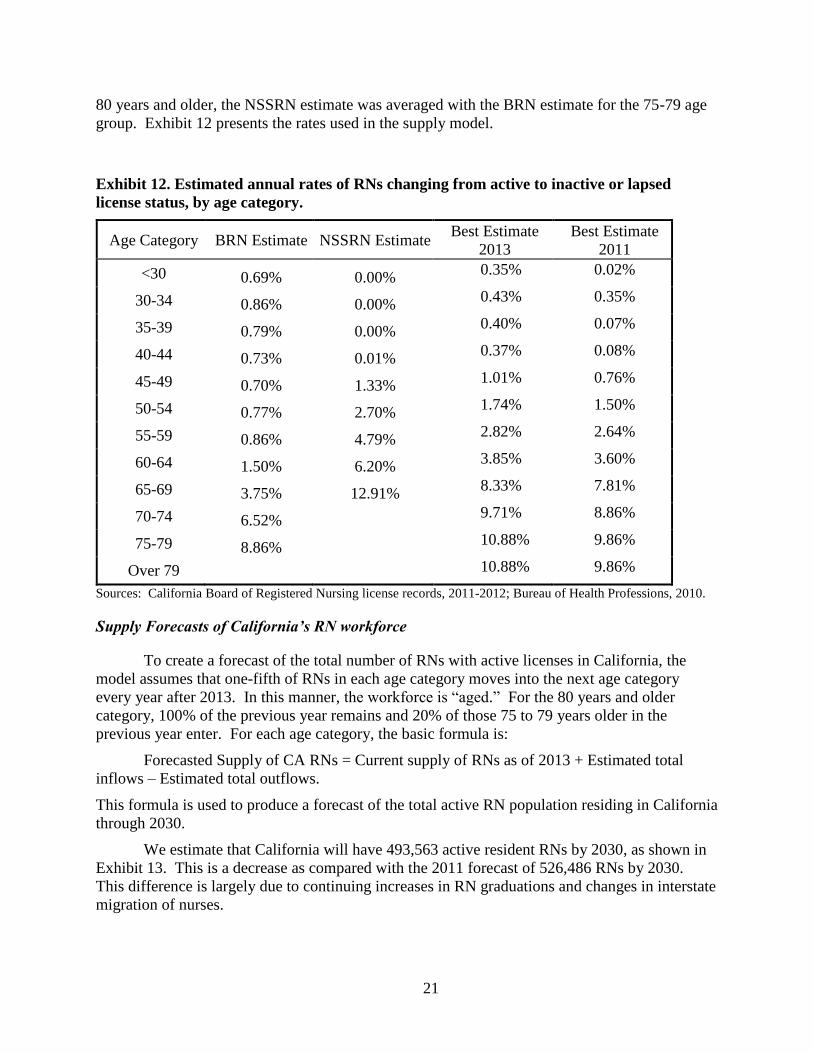
80 years and older, the NSSRN estimate was averaged with the BRN estimate for the 75-79 age
group. Exhibit 12 presents the rates used in the supply model.
Exhibit 12. Estimated annual rates of RNs changing from active to inactive or lapsed
license status, by age category.
Age Category BRN Estimate NSSRN Estimate Best Estimate
2013
Best Estimate
2011
<30 0.69% 0.00% 0.35% 0.02%
30-34 0.86% 0.00% 0.43% 0.35%
35-39 0.79% 0.00% 0.40% 0.07%
40-44 0.73% 0.01% 0.37% 0.08%
45-49 0.70% 1.33% 1.01% 0.76%
50-54 0.77% 2.70% 1.74% 1.50%
55-59 0.86% 4.79% 2.82% 2.64%
60-64 1.50% 6.20% 3.85% 3.60%
65-69 3.75% 12.91% 8.33% 7.81%
70-74 6.52% 9.71% 8.86%
75-79 8.86% 10.88% 9.86%
Over 79 10.88% 9.86%
Sources: California Board of Registered Nursing license records, 2011-2012; Bureau of Health Professions, 2010.
Supply Forecasts of California’s RN workforce
To create a forecast of the total number of RNs with active licenses in California, the
model assumes that one-fifth of RNs in each age category moves into the next age category
every year after 2013. In this manner, the workforce is “aged.” For the 80 years and older
category, 100% of the previous year remains and 20% of those 75 to 79 years older in the
previous year enter. For each age category, the basic formula is:
Forecasted Supply of CA RNs = Current supply of RNs as of 2013 + Estimated total
inflows – Estimated total outflows.
This formula is used to produce a forecast of the total active RN population residing in California
through 2030.
We estimate that California will have 493,563 active resident RNs by 2030, as shown in
Exhibit 13. This is a decrease as compared with the 2011 forecast of 526,486 RNs by 2030.
This difference is largely due to continuing increases in RN graduations and changes in interstate
migration of nurses.
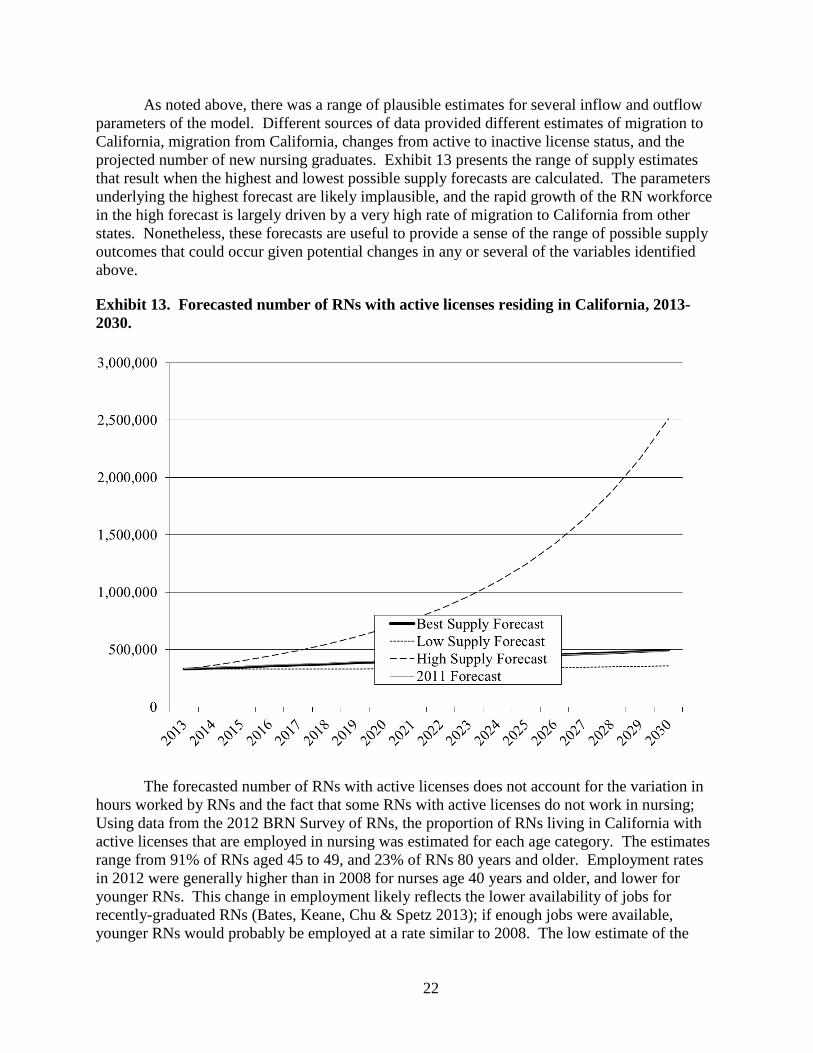
22
As noted above, there was a range of plausible estimates for several inflow and outflow
parameters of the model. Different sources of data provided different estimates of migration to
California, migration from California, changes from active to inactive license status, and the
projected number of new nursing graduates. Exhibit 13 presents the range of supply estimates
that result when the highest and lowest possible supply forecasts are calculated. The parameters
underlying the highest forecast are likely implausible, and the rapid growth of the RN workforce
in the high forecast is largely driven by a very high rate of migration to California from other
states. Nonetheless, these forecasts are useful to provide a sense of the range of possible supply
outcomes that could occur given potential changes in any or several of the variables identified
above.
Exhibit 13. Forecasted number of RNs with active licenses residing in California, 2013-
2030.
The forecasted number of RNs with active licenses does not account for the variation in
hours worked by RNs and the fact that some RNs with active licenses do not work in nursing;
Using data from the 2012 BRN Survey of RNs, the proportion of RNs living in California with
active licenses that are employed in nursing was estimated for each age category. The estimates
range from 91% of RNs aged 45 to 49, and 23% of RNs 80 years and older. Employment rates
in 2012 were generally higher than in 2008 for nurses age 40 years and older, and lower for
younger RNs. This change in employment likely reflects the lower availability of jobs for
recently-graduated RNs (Bates, Keane, Chu & Spetz 2013); if enough jobs were available,
younger RNs would probably be employed at a rate similar to 2008. The low estimate of the
23
employment rate is the lower of the 2008, 2010, and 2012 employment rates for each age group,
and the high estimate is the higher of these rates. The best estimate is the average of the low and
high rates.
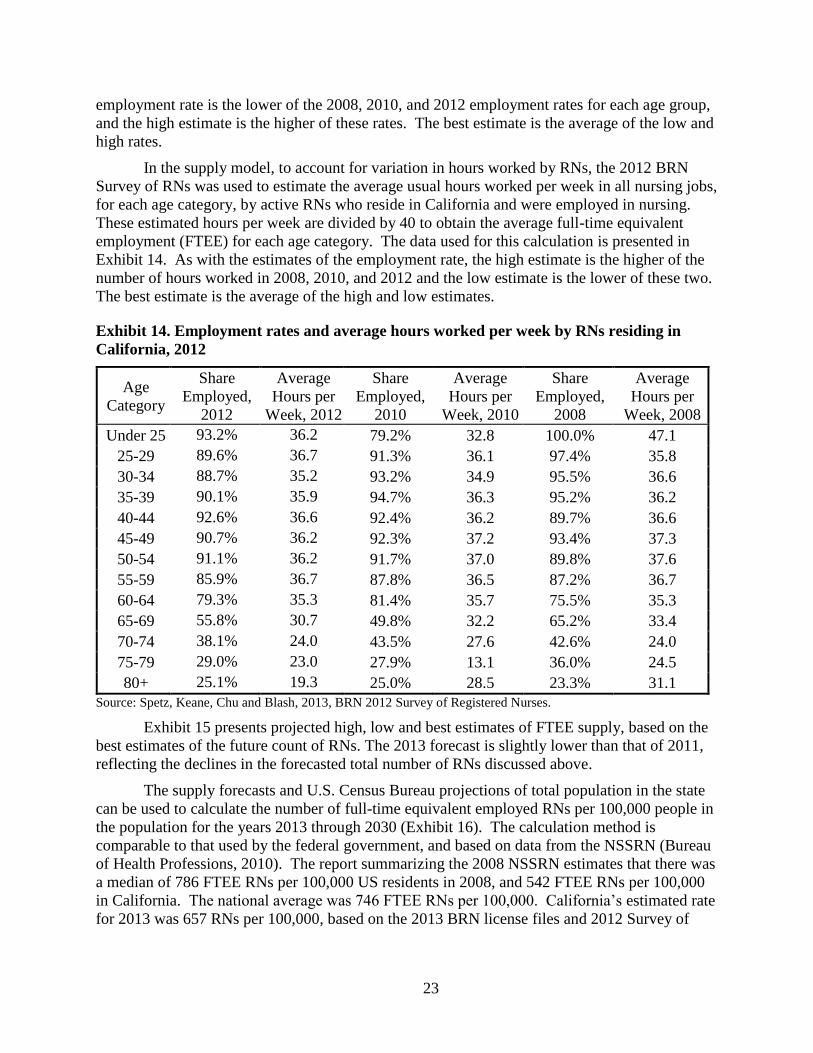
In the supply model, to account for variation in hours worked by RNs, the 2012 BRN
Survey of RNs was used to estimate the average usual hours worked per week in all nursing jobs,
for each age category, by active RNs who reside in California and were employed in nursing.
These estimated hours per week are divided by 40 to obtain the average full-time equivalent
employment (FTEE) for each age category. The data used for this calculation is presented in
Exhibit 14. As with the estimates of the employment rate, the high estimate is the higher of the
number of hours worked in 2008, 2010, and 2012 and the low estimate is the lower of these two.
The best estimate is the average of the high and low estimates.
Exhibit 14. Employment rates and average hours worked per week by RNs residing in
California, 2012
Age
Category
Share
Employed,
2012
Average
Hours per
Week, 2012
Share
Employed,
2010
Average
Hours per
Week, 2010
Share
Employed,
2008
Average
Hours per
Week, 2008
Under 25 93.2% 36.2 79.2% 32.8 100.0% 47.1
25-29 89.6% 36.7 91.3% 36.1 97.4% 35.8
30-34 88.7% 35.2 93.2% 34.9 95.5% 36.6
35-39 90.1% 35.9 94.7% 36.3 95.2% 36.2
40-44 92.6% 36.6 92.4% 36.2 89.7% 36.6
45-49 90.7% 36.2 92.3% 37.2 93.4% 37.3
50-54 91.1% 36.2 91.7% 37.0 89.8% 37.6
55-59 85.9% 36.7 87.8% 36.5 87.2% 36.7
60-64 79.3% 35.3 81.4% 35.7 75.5% 35.3
65-69 55.8% 30.7 49.8% 32.2 65.2% 33.4
70-74 38.1% 24.0 43.5% 27.6 42.6% 24.0
75-79 29.0% 23.0 27.9% 13.1 36.0% 24.5
80+ 25.1% 19.3 25.0% 28.5 23.3% 31.1
Source: Spetz, Keane, Chu and Blash, 2013, BRN 2012 Survey of Registered Nurses.
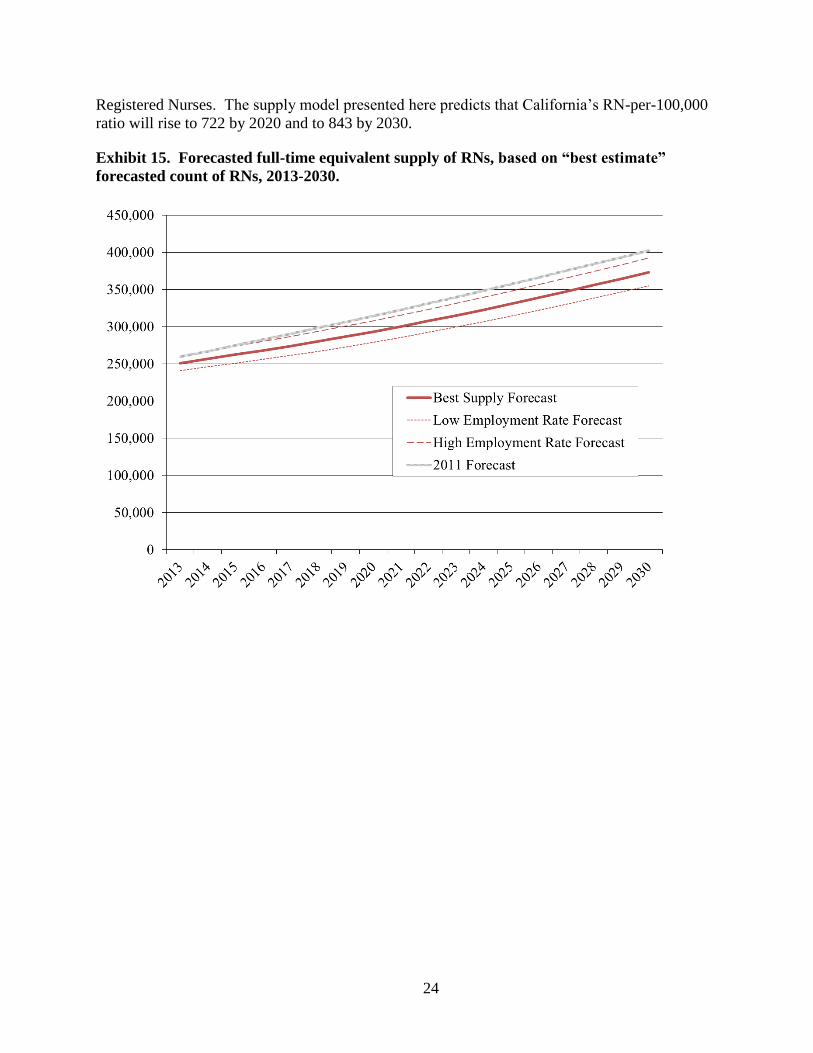
Exhibit 15 presents projected high, low and best estimates of FTEE supply, based on the
best estimates of the future count of RNs. The 2013 forecast is slightly lower than that of 2011,
reflecting the declines in the forecasted total number of RNs discussed above.
The supply forecasts and U.S. Census Bureau projections of total population in the state
can be used to calculate the number of full-time equivalent employed RNs per 100,000 people in
the population for the years 2013 through 2030 (Exhibit 16). The calculation method is
comparable to that used by the federal government, and based on data from the NSSRN (Bureau
of Health Professions, 2010). The report summarizing the 2008 NSSRN estimates that there was
a median of 786 FTEE RNs per 100,000 US residents in 2008, and 542 FTEE RNs per 100,000
in California. The national average was 746 FTEE RNs per 100,000. California’s estimated rate
for 2013 was 657 RNs per 100,000, based on the 2013 BRN license files and 2012 Survey of
24
Registered Nurses. The supply model presented here predicts that California’s RN-per-100,000
ratio will rise to 722 by 2020 and to 843 by 2030.
Exhibit 15. Forecasted full-time equivalent supply of RNs, based on “best estimate”
forecasted count of RNs, 2013-2030.

25
Exhibit 16. Forecasted full-time equivalent supply of RNs per 100,000 population, 2013-
2030
The Demand for RNs
The demand for RNs can be measured and forecasted in many ways, reflecting disparate
notions of what demand is or should be. Many policymakers and health planners consider
population needs as the primary factor that should dictate the need for health care workers. For
example, the World Health Organization has established a goal of countries needing a minimum
of 2.28 health care professionals per 1,000 population, in order to achieve the goal of 80 percent
of deliveries being attended by a skilled birth attendant (WHO 2006). Similarly, policymakers
could target a stable number of nurses per capita, based on the current number of nurses per
capita, a target developed by an expert panel based on review of health needs and the role of
nurses in meeting those needs, or a goal based on comparisons with other U.S. states.
It is important to recognize, however, that population need is not the same thing as
economic demand. Nurses and other health professionals are not free, and the cost of employing
them must be weighed against other uses of resources. A nurse employer might want to hire
more nurses but may not have sufficient income from its patient care services to afford more
nurses. An employer might have resources that could be used to hire more nurses, but might
think that investment in an electronic medical record will produce more value to patients. The
demand for nurses is essentially derived from economic forces, which may not be aligned with
population needs.
26
For this report, several different measures of demand (or need) are considered, in order to
develop a range of plausible estimates of future demand for RNs. The approaches used are:
Fixed benchmarks based on current RN-to-population ratios in California
Fixed benchmarks based on U.S. RN-to-population ratios
An employment forecast published by the California Employment Development
Department for 2020
Demand forecasts based on 2011 employment in hospitals and future population
growth and aging
These approaches are informed by a survey of RN employers conducted in fall 2012, and by
Massachusetts’s experience after implementation of its statewide health insurance reform. The
Massachusetts health insurance reform is similar in many ways to the Patient Protection and
Affordable Care Act (PPACA), and thus may help predict how PPACA will affect RN demand.
Forecasts based on RNs per capita
One frequently-used benchmark of the need for RNs is the number of employed RNs per
100,000 population (California Institute for Nursing and Health Care, 2006). This metric is
reported by the BHPr in the NSSRN report (Bureau of Health Professions, 2010). For over ten
years, California has had one of the lowest ratios of employed RNs-per-100,000 population in
the United States and ranked 48th in 2008. Many policy advocates have supported efforts to
move California’s full-time equivalent employment of RNs toward the 25th percentile nationwide
(706 RNs per 100,000) or even the national average (746 RNs per 100,000). These benchmarks
were compared with the current and forecasted population of California (California Department
of Finance, 2013) to project need for RNs to remain at current FTEE RN-to-population ratios, to
reach the 25th national ratio, and to attain the national average ratio.
Forecasts based on hospital staffing of RNs per patient day
The main shortcoming of targeting a fixed number of RNs per population is that the
target is arbitrarily defined. The current number of nurses per capita may not be a large enough
number to deliver health care needs, and if there is a shortage of nurses, the number may not be
as large as economic demand. Likewise, a target number based on a national average or other
source might not reflect the unique population and health care system of California. An
additional shortcoming is that fixed nurse-to-population ratios do not account for increases in the
demand for health services associated with population aging. However, this approach has the
benefit of being easy to understand and adjust, and provides a clear indication of how
California’s supply compares to national levels of supply.
A second approach to forecasting demand for RNs uses current hospital utilization and
staffing patterns to estimate future demand. First, the number of hospital patient days per ten-
year age group was obtained from the OSHPD Inpatient Hospital Discharge Data for 2011, for
short-term acute-care hospitals (Office of Statewide Health Planning and Development, 2012).2
Then, age-specific population forecasts were gathered from the California Department of
2 The age groups are under 1, 1-9, 10-19, 20-29, 30-39, 40-49, 50-59, 60-69, 70-79, and 80 and older.

27
Finance (2013). Dividing patient days by 2013 population provides the number of patient days
per population, per age group. These rates of patient days can be applied to future population
projections to get forecasts of patient days by age category. To produce forecasts of hospital
demand for RNs, RN hours per patient day were obtained from OSHPD’s Hospital Annual
Financial Data for 2010-2011 (Office of Statewide Health Planning and Development, 2012).
Average RN hours per patient day in 2011 were 12.93. Multiplying the RN hours per patient day
figure of 12.93 by the patient day forecasts produces a forecast of RN hours needed in the future.
To equate these hours to FTEEs, RN hours are divided by 1768 (average annual productive hours
per FTE).
The calculations described above provide demand forecasts for only one type of
employer (hospitals). In order to extrapolate these forecasts across all employment settings, they
were compared with other known estimates of RN employment. First, EDD’s estimate of the
number of RN jobs in 2010 was used as a calibration, estimating that 49.4 percent of jobs were in
the short-term acute-care hospitals that reported to OSHPD. Second, the BRN 2012 survey was
used to calibrate against the OSHPD data, indicating that 44.5 percent of jobs were in these
hospitals. The EDD-based estimates forecast there will be 315,615 FTEE positions for nurses in
2030, while the BRN-based estimates indicate there will be 350,166 positions.
Employment Development Department forecasts
The most recent projections by the EDD indicate that there will be 306,100 registered
nurse jobs in California by 2020 (California Employment Development Department, 2010). The
EDD forecast does not distinguish between full-time and part-time jobs. To estimate the FTEE
employment implied by the EDD forecasts, we use the adjustment of 0.9, which is the average
number of hours worked per week by California RNs (36) divided by 40. The FTEE forecast for
2020 is thus 275,782.
Adjusting for low demand due to economic recession
The above-described forecasting methods can be useful in considering long-term trends
in demand, but do not account for the impact of the economic recession on demand, and the
potential impact of economic recovery. Since January 2008, the United States has been mired in
a deep recession. In fall 2010, a survey of nurse employers was conducted, and found that nearly
half of the responding hospitals found that demand was less than supply, and another 11.3
percent thought demand and supply were in balance (Bates, Keane, & Spetz 2011). Respondents
expected employment of RNs to increase 4.4 percent between 2010 and 2011, and 1.1 percent
between 2011 and 2012. These growth rates are higher than those calculated from the forecasts
based on expected patient days (3.6% total from 2010 to 2012), and suggest that in 2012 there
may have been 2,000 more hospital-based positions than forecasted. This represents less than 1
percent variation in the forecasts. A more recent survey of employers found that there has been
some slight improvement in the labor market, but the vacancy rate has not changed notably
(Bates, Chu, and Spetz 2013). Thus, adjustments were not made to the demand forecasts based
on the employer surveys.

28
Accounting for ACA
The implementation of the Affordable Care Act (ACA) is expected to increase access to
health insurance, and likely will increase demand for health care services (Coffman and Ojeda,
2010). In particular, growth in demand for primary care services is expected to be more rapid, as
well as for other professionals whose work supports primary care, such as laboratory technicians
who provide diagnostic tests and pharmacists. A recent analysis of health care employment in
Massachusetts found that employment grew about 8 percent over a five-year period prior to
implementation of that state’s health insurance reform, and 9.5 percent over nearly a five-year
period afterward (Staiger, Auerbach, & Buerhaus 2011). However, most of this growth was in
administrative positions; employment of health care professionals grew 2.8 percent in
Massachusetts between 2005-2006 and 2008-2009, while it grew 5.9 percent in the rest of the
United States.
It is unclear how the ACA might affect the demand forecasts for RNs in California. Most
registered nurses do not provide primary care services, and thus the main area of anticipated
growth in demand may not impact them as much as other health professionals. Nurse
practitioner demand may rise, but only 3.5 percent of RNs have the job title of NP (Spetz, Keane,
Chu, and Blash 2013), and thus growth in their demand will have little effect on overall RN
demand. RN positions could rise more rapidly than in Massachusetts because Massachusetts had
a relatively good supply of health professionals in advance of their implementation of health
insurance reform, and thus their system may have been able to absorb increased demand for
services easily. In California, more health professionals may be needed to meet the higher
demand for health services.
The evidence suggests that the ACA is likely to impact primary care professionals more
substantially than other health professionals, and may have no impact on employment growth for
any health professionals. Thus, it seems likely that the ACA will have little to no impact on
demand for RNs, and the demand forecasts presented here are not adjusted to account for any
potential impact of the ACA.
Comparing the demand forecasts
Exhibit 17 compares all aforementioned demand forecasts of full-time equivalent RNs.
The forecasts estimate that the FTEE demand for RNs in 2013 ranged from 234,516 to 286,985.
Demand in 2030 is forecasted to be between 291,679 and 350,166. These lower figures are not
likely to accurately represent total future demand, because they do not account for additional
demand caused by future population growth and aging. The EDD forecast for 2020 is lower than
that produced by targeting the national 25th percentile of RN-to-population ratios, and slightly
higher than that calculated from estimated future patient days when calibrated using employment
data from the BRN.

29
Exhibit 17. Forecasted full-time equivalent demand for RNs, 2013-2030.
30
Comparing Supply and Demand for RNs
Through most of the 2000s, there was a widespread perception that California faced a
significant long-term shortage of RNs, and forecasts published by the BRN were consistent with
this perception. Since the 2005 forecasts were published, yearly RN graduations have more than
doubled. The forecasts published in 2011 reflected part of this improvement in RN graduations,
and indicated that California had closed the gap between RN supply and demand. The rapid
onset of the economic recession that began in December 2007 has led to concerns that RN supply
is now greater than demand, although in the long term another RN shortage could emerge.
Exhibit 18 presents two supply forecasts and two demand forecasts. The supply forecasts
are the “best” forecast, and the “low” forecast, which assumes that interstate migration of RNs is
biased towards nurses leaving California. The demand forecasts are based on future patient days,
and also the benchmark of California reaching the 25th percentile of nationwide FTE RNs per
100,000.
The best estimate is that in 2013 there were 250,472 FTE RNs available to work, and the
patient days-based estimate is that there are 260,189 positions to be filled. This suggests a small
shortage of RNs in 2013. This is consistent with employer survey data that indicate that in some
parts of California, employers are having difficulty filling specialized nursing positions (Bates,
Chu, Keane, and Spetz, 2013).
In the long-term, the best supply forecast predicts that nurse supply will rise more rapidly
than California’s population as a whole, and RN supply will surpass the national 25th percentile
of FTE RNs per 100,000 by 2018. Supply is forecasted to grow substantially more rapidly than
the demand estimate based on hospital utilization. However, the low estimate of supply indicates
that it is possible that California enters another period of RN shortage soon, and such a shortage
could persist for decades. Which scenario prevails will depend on a number of factors:
Whether RN graduations are sustained at the current level or increase
Whether inter-state migration leads to more nurses entering California than leaving
Whether older RNs continue to work at higher rates than in the past
Whether younger RNs are able to work at rates similar to 2008, rather than the lower
rates of 2010 and 2012
It is likely in the short run that more nurses will leave California than will enter, and if a surplus
persists, then out-migration will prevail in the long term. Whether older RNs will continue to
work at a higher rate than in the past and younger RNs will find jobs in California depend on the
rate of economic recovery.

31
Exhibit 18. Forecasted full-time equivalent supply of and demand for RNs, 2013-2030.

32
Comparison of the 2013 Forecasts with Previous Forecasts
The forecasts presented here use a similar methodology to that used previously by
Coffman, Spetz, Seago, Rosenoff, and O’Neil (2001), Spetz and Dyer (2005), Spetz (2007),
Spetz (2009), and Spetz (2011). The magnitude of the projected shortage changed dramatically
between the 2005 and 2007 forecasts. In 2005, the estimated shortage ranged between 6,872 and
21,161 RN FTEs; in 2007, the shortage was estimated to be at least 10,294 RN FTEs. However,
while the 2005 forecasts predicted that the shortage would worsen continuously, reaching up to
122,223 FTEs by 2030, the 2007 forecasts predicted that the shortage will improve, and
California would surpass the national average of RN FTEs per 100,000 population (825) by
2022. The 2009 forecasts were similar to those of 2007, although California was not anticipated
to reach the national average of RN FTEs per 100,000 population until 2025. The 2011 forecasts
indicate that supply will rise more rapidly than estimated in 2009, and that California will
surpass the national average of RN FTEs per 100,000 population by 2020. The 2013 forecasts
are similar to those from 2011, although the potential shortage is not as large as previously
forecasted.
Policy Implications
The 2005 forecast report advised that “The only plausible solution to the RN shortage,
based on our preliminary analyses, appears to be continued efforts to increase the numbers of
graduates from California nursing programs.” This recommendation was acted upon by state
leaders. Significant increases in state funding for expanded educational capacity of nursing
programs, increased funding for equipment, use of updated instructional technologies, and other
needed educational resources have had a favorable impact on addressing the RN shortage in
California. Between 2004-2005 and 2009-2010, nursing graduations increased 72 percent,
reaching over 11,500 new RN graduates per year. Graduations have declined slightly since then,
to fewer than 11,000 per year, but the new forecasts indicate that this number of graduations per
year appears sufficient to meet future RN demand.
Policymakers should be cautioned that the 2013 BRN forecasts represent long-term
forecasts and are not intended to reflect rapidly changing economic and labor market conditions.
They also are based on the most currently available data; the factors that affect RN supply and
demand are unlikely to remain static. The most important possible changes include: (1) the
number of graduations from RN education programs; (2) inter-state migration; and (3)
employment rates of older RNs. These factors and any other potential influences on California’s
nursing shortage, such as the limited pool of faculty, limited availability of clinical education
placements, and faculty salaries that are not competitive with clinical practice positions, should
be monitored continuously.
California leaders should observe closely the employment paths of recent nursing
graduates who are entering a difficult job market and may choose to leave the nursing profession
or leave California. Moreover, they should watch new enrollments in nursing programs, which
could drop as state colleges and universities face tight budgets and as potential students hear
there might not be enough nursing jobs. California will likely need to maintain the present
number of nursing graduates in order to meet long-term health care needs.

33
References
Aiken, LH, et al. 2002. Hospital Nurse Staffing and Patient Mortality, Nurse Burnout, and Job
Dissatisfaction,” Journal of the American Medical Association 288 (16): 1987–1993.
American Association of Colleges of Nursing. 2006. Student Enrollment Rises in U.S. Nursing
Colleges and Universities for the 6th Consecutive Year. Washington, DC: American
Association of Colleges of Nursing, December 5, 2006. Available from
http://www.aacn.nche.edu/06Survey.htm
Bates, T, Keane, D, Spetz, J. 2011. 2009-2010 Annual School Report: Data Summary and
Historical Trend Analysis. Sacramento, CA: California Board of Registered Nursing,
February 2011.
Bates, T, Keane, D, Spetz, J. 2011. Survey of Nurse Employers in California, Fall 2010. San
Francisco, CA: University of California, San Francisco.
Bates, T, Keane, D, Chu, L, Spetz, J. 2013. Survey of Nurse Employers in California, Fall 2012.
San Francisco, CA: University of California, San Francisco.
Bates, T, Keane, D, Spetz, J. 2011. Survey of Nurse Employers in California, Second Quarter
2011. San Francisco, CA: University of California, San Francisco.
Buerhaus, Peter I. 1998. “Is Another RN Shortage Looming?” Nursing Outlook 46 (3): 103-108.
Buerhaus, PI, and Auerbach, DI. 2011. The Recession’s Effect on Hospital Registered Nurse
Employment Growth.” Nursing Economics 29 (4): 163-167.
Buerhaus, PI, and Staiger, DO. 1999. “Trouble in the Nurse Labor Market? Recent Trends and
Future Outlook,” Health Affairs (Jan/Feb 1999): 214–222.
Buerhaus, PI, Auerbach, DI, Staiger, DO. 2009. The recent surge in nurse employment: Causes
and implications. Health Affairs, 28 (4): w657-w668.
Bureau of Health Professions. 2007. The Registered Nurse Population: Findings from the
March 2004 National Sample Survey of Registered Nurses. Washington, DC: Bureau of
Health Professions, Health Resources and Services Administration, U.S. Department of
Health and Human Services.
Bureau of Labor Statistics. 2009. Monthly Labor Reports. Washington, DC: U.S. Department of
Labor.
California Department of Finance. 2013. Race/Ethnic Population with Age and Sex Detail,
2010–2060. Sacramento, CA: California Department of Finance. Available from:
http://www.dof.ca.gov/research/demographic/reports/projections/P-2/
California Employment Development Department. 2013. California Industry-Occupational
Matrix 2010 - 2020. Sacramento, CA: Labor Market Information Division, California
Employment Development Department. Data available from
http://www.labmarketinfo.edd.ca.gov.
California Institute for Nursing and Health Care. 2006. California Registered Nurse Regional
Workforce Report Card. Berkeley, CA: California Institute for Nursing and Health Care.

34
California Institute for Nursing and Health Care. 2009. New RN Graduate Workforce Regional
Planning Meetings (Presentation). Berkeley, CA: California Institute for Nursing and
Health Care.
Coffman, J, Ojeda, G. 2010. Impact of National Health Care Reform on California’s Health
Care Workforce. Berkeley, CA: California Program on Access to Care.
Coffman, J., Spetz, J., Seago, JA., Rosenoff. E., & O'Neil, E. 2001. Nursing in California: A
Workforce Crisis. San Francisco, CA: UCSF Center for the Health Professions.
National Center for Health Workforce Analysis. July 2002. Projected Supply, Demand, and
Shortages of Registered Nurses: 2000-2020. Rockville, MD: Bureau of Health
Professions, Health Resources and Services Administration, U.S. Department of Health
and Human Services.
Needleman, J, et al. 2002. Nurse-Staffing Levels and the Quality of Care in Hospitals. New
England Journal of Medicine 346 (22): 1715–1722.
Office of Statewide Health Planning and Development. 2012. Hospital Annual Financial Data,
2010-2011. Sacramento, CA: California Office of Statewide Health Planning and
Development.
Office of Statewide Health Planning and Development. 2012. Inpatient Hospital Discharge
Data, 2011. Sacramento, CA: California Office of Statewide Health Planning and
Development.
Spetz, J. 2007. Forecasts of the Registered Nurse Workforce in California. Sacramento, CA:
California Board of Registered Nursing.
Spetz, J. 2009. Forecasts of the Registered Nurse Workforce in California. Sacramento, CA:
California Board of Registered Nursing.
Spetz, J. 2011. Forecasts of the Registered Nurse Workforce in California. Sacramento, CA:
California Board of Registered Nursing.
Spetz, J, Dyer, WT. 2005. Forecasts of the Registered Nurse Workforce in California.
Sacramento, CA: California Board of Registered Nursing.
Spetz, J, Given, R. 2003. The Future of the Nurse Shortage: Will Wage Increases Close the Gap?
Health Affairs 22 (6): 199-206.
Spetz, J, Keane, D, Hailer, L. 2007. 2006 Survey of Registered Nurses. Sacramento, CA:
California Board of Registered Nursing.
Spetz, J, Keane, D, Herrera, C. 2009. 2008 Survey of Registered Nurses. Sacramento, CA:
California Board of Registered Nursing.
Spetz, J, Keane, D, Herrera, C. 2011. 2010 Survey of Registered Nurses. Sacramento, CA:
California Board of Registered Nursing.
Spetz, J, Keane, D, Chu, L, Blash, L. 2013. 2012 Survey of Registered Nurses. Sacramento, CA:
California Board of Registered Nursing.
Staiger, DO, Auerbach, DI, and Buerhaus, PI. 2011. Health Care Reform and the Health Care
Workforce – The Massachusetts Experience. New England Journal of Medicine, e-
publication ahead of print, September 7, 2011.

35
Waneka, R, Spetz, J, Chan, M. 2008. The Movement of Registered Nurses into and out of
California. Sacramento, CA: California Board of Registered Nursing.
Waneka, R, Bates, T, Spetz, J. 2013. 2011-2012 Annual School Report: Data Summary and
Historical Trend Analysis. Sacramento, CA: California Board of Registered Nursing,
February 2013.
World Health Organization. 2006. Working Together for Health: The World Health Report 2006.
Geneva: World Health Organization.
U.S. Department of Health and Human Services, Health Resources and Services Administration.
2010. The Registered Nurse Population: Findings from the 2008 National Sample Survey
of Registered Nurses. Washington, DC: U.S. Department of Health and Human Services.
September 2010.
36
Acronyms
BHPr – Bureau of Health Professions, part of the Health Resources and Services Administration
in the U.S. Department of Health and Human Services
BRN – California Board of Registered Nursing
BLS – U.S. Bureau of Labor Statistics
CA – California
DOF – California Department of Finance
EDD – California Employment Development Department
FTE – Full-time Equivalent
FTEE – Full-time Equivalent Employment
NCLEX-RN – National Council Licensure Examination – Registered Nurses (NCLEX is a
registered trademark and/or servicemark of the National Council of State Boards of
Nursing, Inc.)
NSSRN – National Sample Survey of Registered Nurses
OSHPD – California Office of Statewide Health Planning and Development
RN – Registered Nurse
UCSF – University of California San Francisco