foreign exchange market intervention in emes: implications ... · foreign exchange markets, thus...
TRANSCRIPT

BIS Papers No 57 65
Foreign exchange market intervention in EMEs: implications for central banks
Ramon Moreno1
1. Introduction
The recovery of the global economy that followed the Lehman bankruptcy in September 2008 has been associated with renewed foreign currency inflows to emerging market economies (EMEs), reflecting a combination of capital inflows and current account surpluses.2 The resulting exchange rate appreciation and the question of what do about it have raised concerns that were last heard prior to the bankruptcy of Lehman Brothers. Many emerging market central banks have responded to appreciation pressures by intervening in foreign exchange markets, thus expanding central bank foreign assets and balance sheets. An important concern is that large changes in central bank balance sheets induced by foreign asset growth will hinder the conduct of monetary policy.
To shed light on some of these issues, this paper will discuss recent trends in the balance sheets of central banks and the motives for accumulating foreign assets (Section 2). Section 3 discusses issues raised by the use of alternative approaches to the sterilisation of foreign exchange market interventions. Some implications for commercial banks are briefly discussed in Section 4. Section 5 concludes.
2. The balance sheets of central banks in emerging markets
2.1 Recent developments in central bank balance sheets Table 1 shows a simplified central bank balance sheet to illustrate the implications of foreign asset accumulation. Assets comprise net foreign assets and domestic assets (including government securities).3 Liabilities include currency in circulation and reserves of commercial banks (ie monetary liabilities); and government deposits, central bank securities and other liabilities (ie non-monetary liabilities). Appendix Tables A1 and A2 show selected balance sheet assets and liabilities for a set of emerging market central banks.
According to Table 1, if we take equity capital as given, the accumulation of foreign asset must be financed by either the sale of domestic assets or the issuance of domestic liabilities.
1 This paper draws on work by Andrew Filardo and joint work with Carlos Montoro. The author thanks Stephen
Cecchetti, Dubravko Mihaljek, Philip Turner and participants in the meeting for comments. Emese Kuruc, Jimmy Shek, Agne Subelyte and Alan Villegas provided research assistance.
2 Recent commentary suggests that capital flows in 2010 may have been higher. At this writing, the Institute for International Finance (2011) estimates that net private capital flows to a set of EMEs rose by 50% (which was more than anticipated) to more than $900 billion in 2010.
3 We use foreign assets and foreign reserves interchangeably in our discussion, although the latter are the more liquid component of the former.

66 BIS Papers No 57
As noted in CGFS (2009), one simple measure of this type of financing is the excess of foreign currency reserves over currency in circulation.4
Table 1
Stylised central bank balance sheet
Assets Liabilities and capital
Net foreign assets Monetary liabilities
Domestic assets Currency in circulation
Reserves of commercial banks
Non-monetary liabilities
Government deposits
Central bank securities
Others
Equity capital
Until the late 1990s, this “financing gap” was either small or negative in many EMEs. In other words, foreign reserve assets and currency in circulation were of a similar order of magnitude. With economic growth and the central bank purchase of foreign reserves, the rising demand for cash has meant that liabilities issued by the central bank had to increase by less than the increase in foreign reserves.
Graph 1
Central bank assets1 As a percentage of GDP
0
20
40
60
80
100
120
HK SA SG DZ CN MY TH BR KR IL HU RU PH PE AR PL ID CZ IN TR CL ZA VE MX CO
End–2002End–2007Latest 20102
AR = Argentina; BR = Brazil; CL = Chile; CN = China; CO = Colombia; CZ = Czech Republic; DZ = Algeria;HK = Hong Kong SAR; HU = Hungary; ID = Indonesia; IL = Israel; IN = India; KR = Korea; MX = Mexico;MY = Malaysia; PE = Peru; PH = Philippines; PL = Poland; RU = Russia; SA = Saudi Arabia; TH = Thailand;TR = Turkey; VE = Venezuela; ZA = South Africa. 1 Net of currency in circulation. Countries are listed, in descending order, according to the latest information available for 2010. 2 For the Philippines and Venezuela, November 2009.
Sources: IMF, International Financial Statistics, World Economic Outlook.
4 If currency in circulation is issued only when there is demand for it, foreign asset acquisition would have no
inflationary consequence and could be netted out from assessments of the impact of reserve accumulation on the central bank balance sheet.

BIS Papers No 57 67
Since 2002, however, total central bank assets have grown significantly, in the case of Algeria, Hong Kong SAR and Saudi Arabia by 40–80% of GDP (Graph 1). As a result, central bank balance sheets in EMEs have expanded considerably: the median ratio of total central bank assets to GDP was around 24% in 2010.5 Central banks with asset-to-GDP ratios that are well above the median include financial centres (Hong Kong SAR and Singapore); oil exporters (Algeria and Saudi Arabia); and some Asian economies (China, Malaysia and Thailand). Central banks with balance sheets well below the median are mostly inflation targeting regimes (Chile, Colombia, the Czech Republic, Mexico, Poland, Turkey and South Africa) but also Venezuela.
Graph 2
Foreign exchange reserves minus currency held by the public As a percentage of
(a) Public sector domestic debt securities (b) M14
0
250
500
750
1,000
0
25
50
75
100
2005 2006 2007 2008 2009 2010
ChinaOther Asia1
Latin America2
Russia (lhs)Other EMEs3
0
75
150
225
300
2005 2006 2007 2008 2009 2010
(c) M25 (d) Bank credit to the private sector
0
20
40
60
80
2005 2006 2007 2008 2009 20100
20
40
60
80
2005 2006 2007 2008 2009 2010
1 Chinese Taipei, Hong Kong SAR, India, Indonesia, Korea, Malaysia, the Philippines, Singapore and Thailand. 2 Argentina, Brazil, Chile, Colombia, Mexico and Peru. 3 The Czech Republic, Hungary, Poland, Turkey and South Africa. 4 M1, also called narrow money, comprises transferable deposits and currency outside depositmoney banks. 5 M2 is a broad measure of money which comprises, in addition to M1, time, savings, and foreign currency deposits of resident sectors other than central government.
Sources: IMF; Datastream; national data; BIS.
5 There are many difficulties in using and interpreting central bank balance sheet data. To keep problems of
comparability to a minimum, we follow Ulrich and Stella (2008) and rely on IMF IFS data. Nevertheless there appear to be visible differences between IMF and central bank-reported data in some countries.
68 BIS Papers No 57
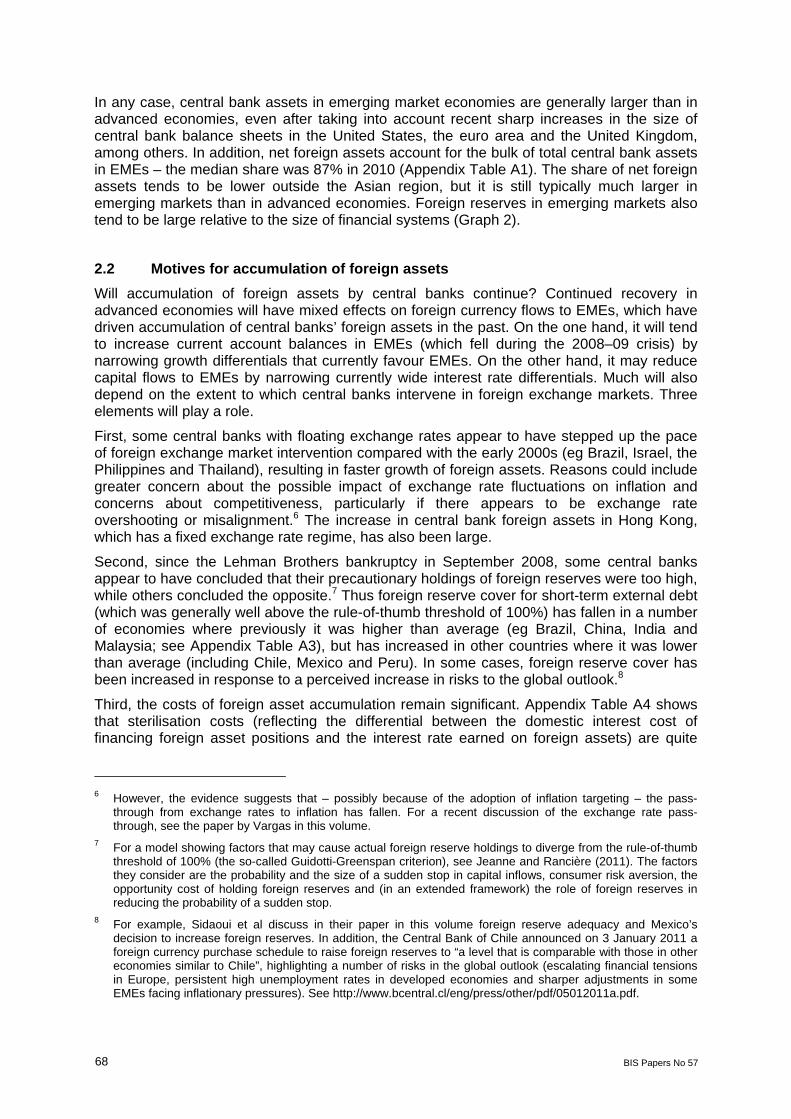
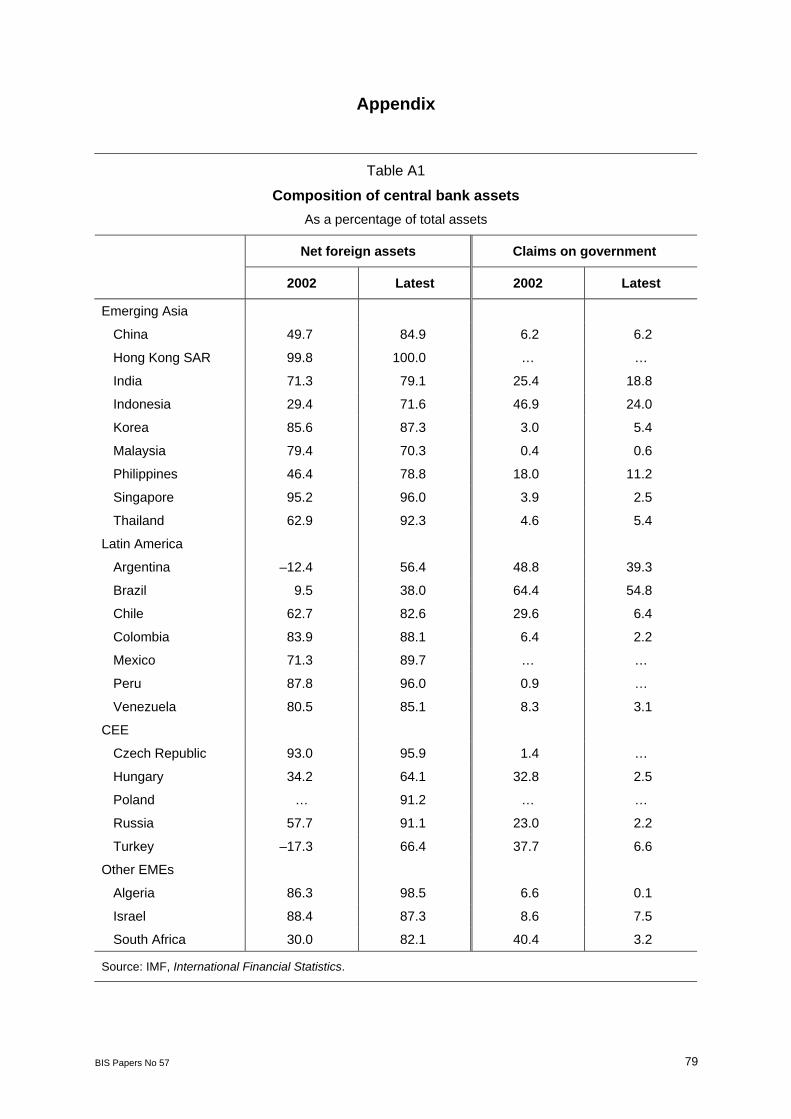
In any case, central bank assets in emerging market economies are generally larger than in advanced economies, even after taking into account recent sharp increases in the size of central bank balance sheets in the United States, the euro area and the United Kingdom, among others. In addition, net foreign assets account for the bulk of total central bank assets in EMEs – the median share was 87% in 2010 (Appendix Table A1). The share of net foreign assets tends to be lower outside the Asian region, but it is still typically much larger in emerging markets than in advanced economies. Foreign reserves in emerging markets also tend to be large relative to the size of financial systems (Graph 2).
2.2 Motives for accumulation of foreign assets Will accumulation of foreign assets by central banks continue? Continued recovery in advanced economies will have mixed effects on foreign currency flows to EMEs, which have driven accumulation of central banks’ foreign assets in the past. On the one hand, it will tend to increase current account balances in EMEs (which fell during the 2008–09 crisis) by narrowing growth differentials that currently favour EMEs. On the other hand, it may reduce capital flows to EMEs by narrowing currently wide interest rate differentials. Much will also depend on the extent to which central banks intervene in foreign exchange markets. Three elements will play a role.
First, some central banks with floating exchange rates appear to have stepped up the pace of foreign exchange market intervention compared with the early 2000s (eg Brazil, Israel, the Philippines and Thailand), resulting in faster growth of foreign assets. Reasons could include greater concern about the possible impact of exchange rate fluctuations on inflation and concerns about competitiveness, particularly if there appears to be exchange rate overshooting or misalignment.6 The increase in central bank foreign assets in Hong Kong, which has a fixed exchange rate regime, has also been large.
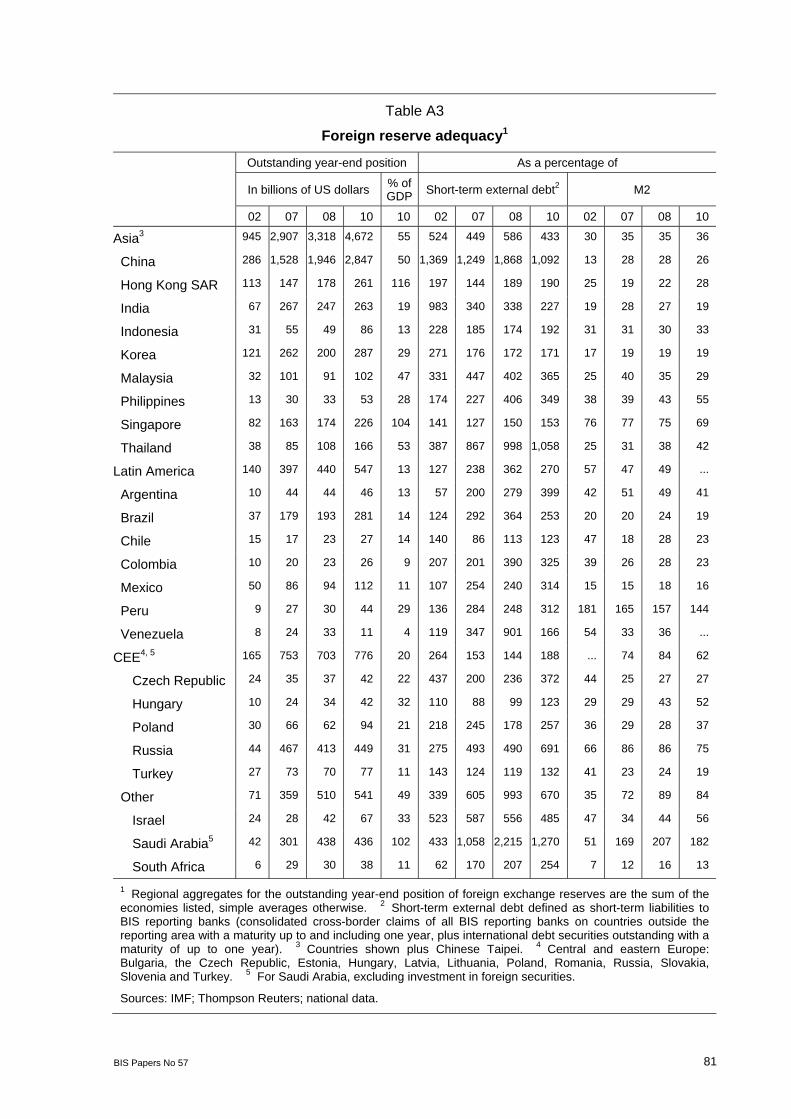
Second, since the Lehman Brothers bankruptcy in September 2008, some central banks appear to have concluded that their precautionary holdings of foreign reserves were too high, while others concluded the opposite.7 Thus foreign reserve cover for short-term external debt (which was generally well above the rule-of-thumb threshold of 100%) has fallen in a number of economies where previously it was higher than average (eg Brazil, China, India and Malaysia; see Appendix Table A3), but has increased in other countries where it was lower than average (including Chile, Mexico and Peru). In some cases, foreign reserve cover has been increased in response to a perceived increase in risks to the global outlook.8
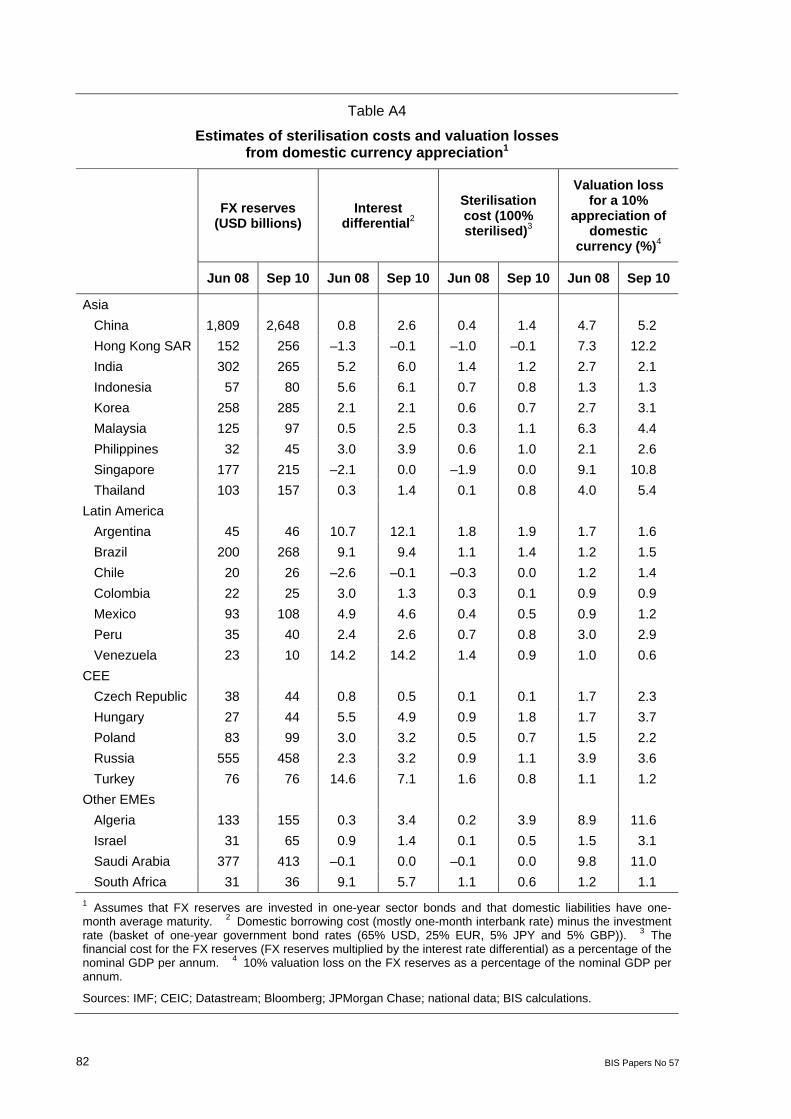
Third, the costs of foreign asset accumulation remain significant. Appendix Table A4 shows that sterilisation costs (reflecting the differential between the domestic interest cost of financing foreign asset positions and the interest rate earned on foreign assets) are quite
6 However, the evidence suggests that – possibly because of the adoption of inflation targeting – the pass-
through from exchange rates to inflation has fallen. For a recent discussion of the exchange rate pass-through, see the paper by Vargas in this volume.
7 For a model showing factors that may cause actual foreign reserve holdings to diverge from the rule-of-thumb threshold of 100% (the so-called Guidotti-Greenspan criterion), see Jeanne and Rancière (2011). The factors they consider are the probability and the size of a sudden stop in capital inflows, consumer risk aversion, the opportunity cost of holding foreign reserves and (in an extended framework) the role of foreign reserves in reducing the probability of a sudden stop.
8 For example, Sidaoui et al discuss in their paper in this volume foreign reserve adequacy and Mexico’s decision to increase foreign reserves. In addition, the Central Bank of Chile announced on 3 January 2011 a foreign currency purchase schedule to raise foreign reserves to “a level that is comparable with those in other economies similar to Chile”, highlighting a number of risks in the global outlook (escalating financial tensions in Europe, persistent high unemployment rates in developed economies and sharper adjustments in some EMEs facing inflationary pressures). See http://www.bcentral.cl/eng/press/other/pdf/05012011a.pdf.

BIS Papers No 57 69
high in a number of countries, ie close to or exceeding 1% of GDP assuming full sterilisation. For countries with large foreign asset holdings, valuation losses that could be associated with a 10% appreciation could be even larger. High sterilisation costs may partly explain the tendency for foreign reserve cover to decline in some EMEs.9
These findings suggest that large foreign reserve holdings could significantly weaken central bank financial strength due to costs of financing (or sterilisation) and if exchange rate risks are realised. One measure of financial strength, the return on average assets (ROAA), was on a declining trend between 1998 and 2007, a period which included episodes of significant central bank foreign asset accumulation (Graph 3). While the return on average assets rose during the period of sharp exchange rate depreciation in EMEs in 2008, it has since once again turned downwards.
Graph 3
Return on average assets in emerging market central banks, 1995–20091 In per cent
–0.5
0.0
0.5
1.0
1.5
2.0
2.5
1995 1996 1997 1998 1999 2000 2001 2002 2003 2004 2005 2006 2007 2008 2009
AverageMedian
1 Simple average and median of the return on average assets for the central banks of Argentina, Brazil, Chile, Colombia, the Czech Republic, Hong Kong SAR, Hungary, India, Indonesia, Israel, Korea, Malaysia, Mexico, Peru, the Philippines, Poland, Russia, Saudi Arabia, Singapore, South Africa, Thailand and Turkey.
Sources: Bankscope; BIS calculations.
Graph 4 reveals visible differences in performance of the return on average assets across emerging market regions. The return on average assets in Asia tends to be higher and less volatile than in other regions. This could partly reflect the impact of lower exchange rate volatility on central bank balance sheets. Episodes of exchange rate appreciation would tend to be associated with lower return on average assets, although this outcome will depend in part on accounting procedures.
There are two views on what lower returns on assets – or outright losses – imply for central bank credibility. On the one hand, losses mean that central banks are taking steps to drain liquidity created by foreign reserve accumulation, ie that central banks are serious about maintaining monetary control. On the other hand, losses raise questions about the sustainability of monetary policies and the central bank’s ability to resist political pressures to
9 In principle, carrying costs could be reduced by diversifying reserve assets, including buying more EM debt. In
practice, the scope for such diversification is limited because of the small supply of higher-yielding investment grade assets: only $5 trillion in sovereign debt (of which $2 trillion in smaller advanced economies and $3 trillion in investment grade EMEs) is available, compared with $38 trillion in the major advanced economies. The supply of EME domestic debt securities is also relevant for sterilisation, as discussed below.

70 BIS Papers No 57
inflate. In line with this second view, an empirical study by Klüh and Stella (2008) finds that lower central bank financial strength is associated with higher inflation.
Graph 4
ROAA for central banks by region, 1999–2009 In per cent
Latin America1 Asia2 Other emerging3
80
200
–8
–4
0
4
8
99 00 01 02 03 04 05 06 07 08 09
Exchange rate 4,5 (lhs)ROAA5
80
120
–4
–2
0
2
4
99 00 01 02 03 04 05 06 07 08 0980
160
–4
–2
0
2
4
99 00 01 02 03 04 05 06 07 08 09
The vertical line marks the date of the Lehman Brothers bankruptcy on 15 September 2008. 1 Argentina, Brazil, Chile, Colombia, Mexico and Peru. 2 Hong Kong SAR, India, Indonesia, Korea, Malaysia, the Philippines, Singapore and Thailand. 3 The Czech Republic, Hungary, Israel, Poland, Russia, South Africaand Turkey. 4 National currency per US dollar indexes, 1999 = 100. 5 Simple average across region countries.
Sources: IMF; Bankscope; BIS calculations.
3. Sterilisation and implications for central bank balance sheets10
How a central bank’s intervention in the foreign exchange market to purchase foreign currency will affect its financial performance depends on how the intervention is financed. If reserve money is issued, the policy rate will tend to decline unless money demand increases. But money demand is unlikely to increase at a pace that matches a surge in foreign currency inflows. In order to maintain monetary control (ie to keep the policy rate close to its target level), a central bank can avoid or sterilise the expansionary effects of its foreign exchange market intervention via foreign currency operations that reduce the central bank’s net foreign assets (issuance of foreign liabilities, implementing offsetting transactions in the foreign exchange market) or by implementing domestic operations (selling treasury securities on its portfolio, issuing central bank debt or accepting government deposits). These are market-based instruments for sterilisation. In a number of cases, central banks have also used non-market instruments, such as adjusting reserve requirements for commercial banks. The choice of sterilisation instruments – or how a central bank finances its acquisition of foreign assets – will have different implications for a central bank’s balance sheet, the risks it assumes and the costs.
10 For related discussions on central bank balance sheets, see CGFS (2009) and the contributions in this volume
by Vargas; Rossini et al; and Sidaoui et al.
BIS Papers No 57 71
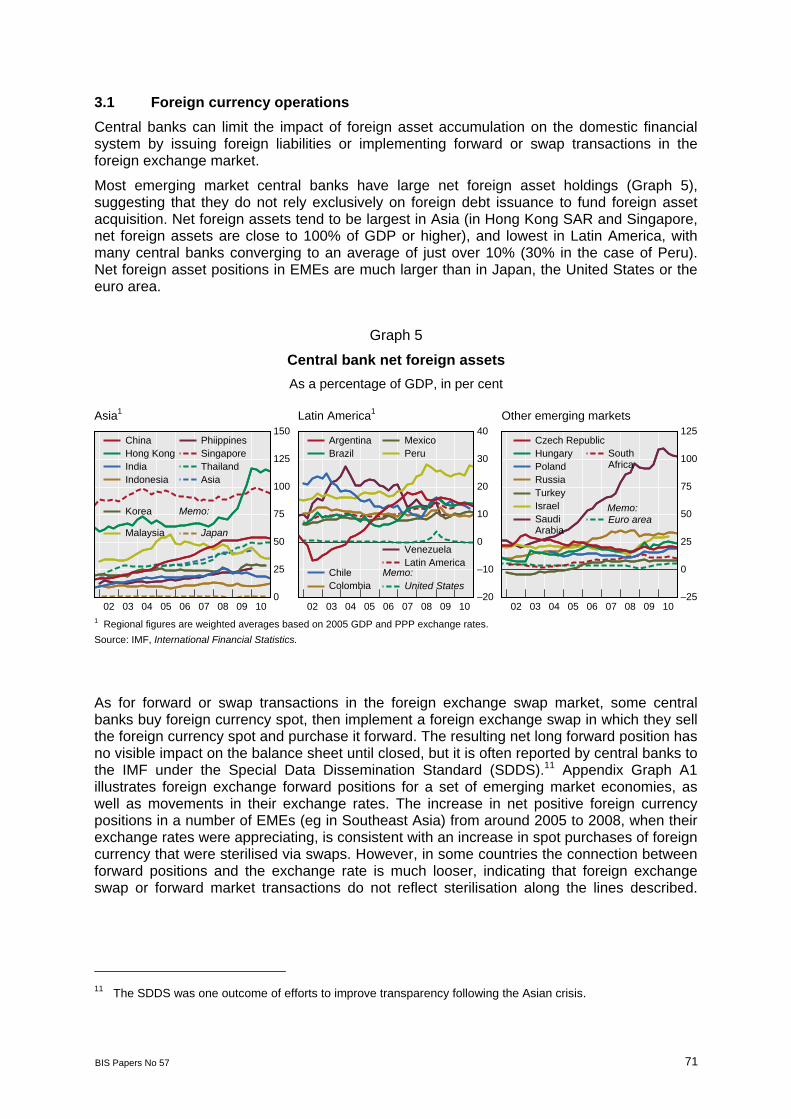
3.1 Foreign currency operations Central banks can limit the impact of foreign asset accumulation on the domestic financial system by issuing foreign liabilities or implementing forward or swap transactions in the foreign exchange market.
Most emerging market central banks have large net foreign asset holdings (Graph 5), suggesting that they do not rely exclusively on foreign debt issuance to fund foreign asset acquisition. Net foreign assets tend to be largest in Asia (in Hong Kong SAR and Singapore, net foreign assets are close to 100% of GDP or higher), and lowest in Latin America, with many central banks converging to an average of just over 10% (30% in the case of Peru). Net foreign asset positions in EMEs are much larger than in Japan, the United States or the euro area.
Graph 5
Central bank net foreign assets As a percentage of GDP, in per cent
Asia1 Latin America1 Other emerging markets
0
25
50
75
100
125
150
02 03 04 05 06 07 08 09 10
Memo:
ChinaHong KongIndiaIndonesia
Korea
Malaysia
PhiippinesSingaporeThailandAsia
Japan
–20
–10
0
10
20
30
40
02 03 04 05 06 07 08 09 10
Memo:
ArgentinaBrazil
ChileColombia
MexicoPeru
VenezuelaLatin America
United States–25
0
25
50
75
100
125
02 03 04 05 06 07 08 09 10
Memo:
Czech RepublicHungaryPolandRussiaTurkeyIsraelSaudiArabia
SouthAfrica
Euro area
1 Regional figures are weighted averages based on 2005 GDP and PPP exchange rates.
Source: IMF, International Financial Statistics.
As for forward or swap transactions in the foreign exchange swap market, some central banks buy foreign currency spot, then implement a foreign exchange swap in which they sell the foreign currency spot and purchase it forward. The resulting net long forward position has no visible impact on the balance sheet until closed, but it is often reported by central banks to the IMF under the Special Data Dissemination Standard (SDDS).11 Appendix Graph A1 illustrates foreign exchange forward positions for a set of emerging market economies, as well as movements in their exchange rates. The increase in net positive foreign currency positions in a number of EMEs (eg in Southeast Asia) from around 2005 to 2008, when their exchange rates were appreciating, is consistent with an increase in spot purchases of foreign currency that were sterilised via swaps. However, in some countries the connection between forward positions and the exchange rate is much looser, indicating that foreign exchange swap or forward market transactions do not reflect sterilisation along the lines described.
11 The SDDS was one outcome of efforts to improve transparency following the Asian crisis.

72 BIS Papers No 57
Instead, such positions may be maintained to hedge foreign currency exposures or influence liquidity in foreign exchange markets.12
Net foreign asset or net long forward positions can be used to make foreign currency resources available during periods of financial stress. However, these positions mean that a large proportion of foreign asset acquisition will typically require sterilisation via domestic operations, leading to the sterilisation costs cited earlier.
3.2 Domestic operations Sterilisation via repo operations has been facilitated by the availability of government debt securities that can be presented as collateral.13 While there are prohibitions (constitutional or legislative) on central bank financing of the government in many countries, notably in central and eastern Europe and Latin America, central bank purchases of government bonds in the secondary market have been allowed in many EMEs for some years now (Hawkins (2003, Table 6)). Furthermore, issuance of government debt securities in EMEs has risen; by June 2010, it had reached around $5 trillion for a set of larger EMEs, compared with slightly under $1 trillion in December 1999.
Remaining maturities of debt instruments have also lengthened (Appendix Table A5). In larger EMEs in Asia, remaining maturities rose from 5.3 years in 2000 to 7½ years in 2009. Maturities tend to be shorter in Latin America (although they nearly doubled to 4½ years over the same period), but have nevertheless lengthened in the past decade, notably in Mexico (from 1.4 to 6.4 years). The longest maturities of emerging market debt securities in 2010 were observed in India (10½ years), Peru (16 years) and South Africa (10.6 years).
Some central banks issue their own debt instruments. Maturities of central bank debt securities have also lengthened, eg Bank Indonesia introduced maturities of up to a year in 2010 and discouraged holdings of securities with shorter maturities. The People’s Bank of China began to issue three-year securities in 2005. Longer maturities imply that sterilisation operations could have a more lasting impact on the excess liquidity of the banking system.
The use of debt securities for sterilisation purposes raises a number of issues.
First, while markets have deepened, the availability of sterilisation instruments is sometimes limited. In particular, Appendix Table A1 shows that, with the exception of Argentina, Brazil, India and Indonesia, central bank claims on government represent a small fraction of total assets. While central bank securities sometimes provide an alternative, many countries (eg Brazil, India and the Philippines) prohibit the central bank from issuing its own debt
12 Some central banks also acquire foreign assets by making transactions outside the foreign exchange market
(Moreno (2005), CGFS (2009)); this is sometimes known as “direct intervention”. This approach insulates the domestic financial system in some cases but not in others. For example, in Chile foreign assets accumulated by the state-owned copper company appear to be held in accounts abroad that are managed by the central bank and that do not enter the domestic banking system. If government deposits arising from copper exports are matched by central bank foreign assets, accumulation of the latter would have no impact on domestic financial intermediation. By contrast, in Mexico the central bank directly purchases foreign exchange from the state-owned oil company and the federal government in exchange for pesos (see Sidaoui et al in this volume). Since these entities acquire pesos in exchange for the foreign assets deposited in the central bank, the result is an increase in the commercial banks’ balance sheets that needs to be sterilised.
13 Government deposits are also an important source of liquidity drain from the financial system. They appear to be economically meaningful in most EMEs (Appendix Table A2) but have been particularly large – ranging from 13 to 45% of GDP – in Algeria, Hong Kong SAR, Israel, Russia, Saudi Arabia and Singapore. Government deposits rose during the 2000s in most EMEs. A particularly interesting case is that of India, which set up an arrangement (the Market Stabilisation Scheme) under which the Reserve Bank of India was empowered to “to issue government Treasury bills and medium-duration dated securities for the purpose of liquidity absorption” (Mohan (2008, p 248)).
BIS Papers No 57 73
securities.14 One reason is that such securities could erode liquidity in the government debt market, by offering a competing “safe” instrument. Another consideration is that such an instrument, like other domestic operations, can mask the fiscal impact of sterilised intervention. This could result in significant losses to the central bank and, by extension, to the government.
Second, sterilisation can reduce the central bank’s net creditor position vis-à-vis the market, which can in turn weaken the effectiveness of monetary control.15 For example, when the central bank in Colombia becomes a net debtor to the market, excess liquidity is absorbed through a central bank facility with an interest rate 1 percentage point lower than the policy rate, implying a de facto change in monetary policy. There is also evidence that the pass-through from the policy rate to certain bank deposit and lending rates declines when the central bank is in a net debtor position (Vargas et al (2010), Vargas in this volume).16
Third, foreign holdings of domestic debt securities can affect the cost of financing and its volatility. Recent estimates by Peires (2010) indicate varying degrees of foreign participation in bond markets in EMEs: they are comparatively high in central Europe (25–35% in 2008), and lower in other EMEs (15% in Indonesia, 10% or lower in Brazil, Korea, Malaysia, Mexico, Thailand and Turkey). Using panel data analysis, Peires finds that foreign participation in the domestic government bond market significantly lowers long-term government yields and does not necessarily imply increased volatility (and might lower it in some cases).17 While lower financing costs are a considerable benefit of more open financial markets, the flip side is that monetary authorities might not want to accept lower interest rates if the economy is close to capacity during periods of surging capital inflows.
Furthermore, during periods of exchange rate appreciation, foreign investors may take one-sided bets that generate exchange rate volatility. This effect is amplified if foreign investors hold a large share of domestic securities, and that share increases during episodes of appreciation. This occurred in Peru, where the central bank adopted a number of measures to dampen capital inflows in response to sterilised intervention by making it more difficult or costly for foreign investors to acquire central bank securities.18 In addition, during periods of financial stress foreign residents might seek to wind down their positions in domestic bond markets very quickly. For example, this was the experience of Mexico in the aftermath of the Lehman Brothers bankruptcy (Sidaoui et al (2010), Jara et al (2009)).
14 Vargas notes in his contribution to this volume that Colombia passed a law authorising the central bank to
issue its own debt securities but none had been issued yet. 15 Kamil (2008) argues that the risk that the central bank in Colombia might become a net debtor undermined the
credibility of foreign exchange market intervention to dampen exchange rate appreciation, prompting investors to take positions that rendered such intervention ineffective.
16 The paper by Vargas in this volume notes that remunerated, non-reserve deposits in Colombia are used when the central bank becomes a net debtor of the financial system, as the effects of sterilisation on the monetary policy stance are neutral. However, these deposits pose complications, including: the possibly of attracting capital inflows (if maturities are short); reduced incentives for banks to lend on the interbank market; and weaker control over liquidity (if maturities are longer).
17 Peires (2010, Table 4) finds that foreign investor participation increases government bond yield volatility in Korea; lowers it in Malaysia, Mexico and Turkey; and is not significant in other countries (Brazil, the Czech Republic, Hungary, Indonesia, Poland and Thailand).
18 The paper by Rossini et al in this volume indicates that the central bank: (i) imposed a 4% fee on purchases or sales of central bank paper involving non-residents, in order to limit resale to them; (ii) increased to 120% the reserve requirement on local currency deposits for non-residents; and (iii) used certificates of term deposits as sterilisation instruments so that non-residents could not access central bank paper indirectly, through the resale of other local currency instruments to non-residents.
74 BIS Papers No 57
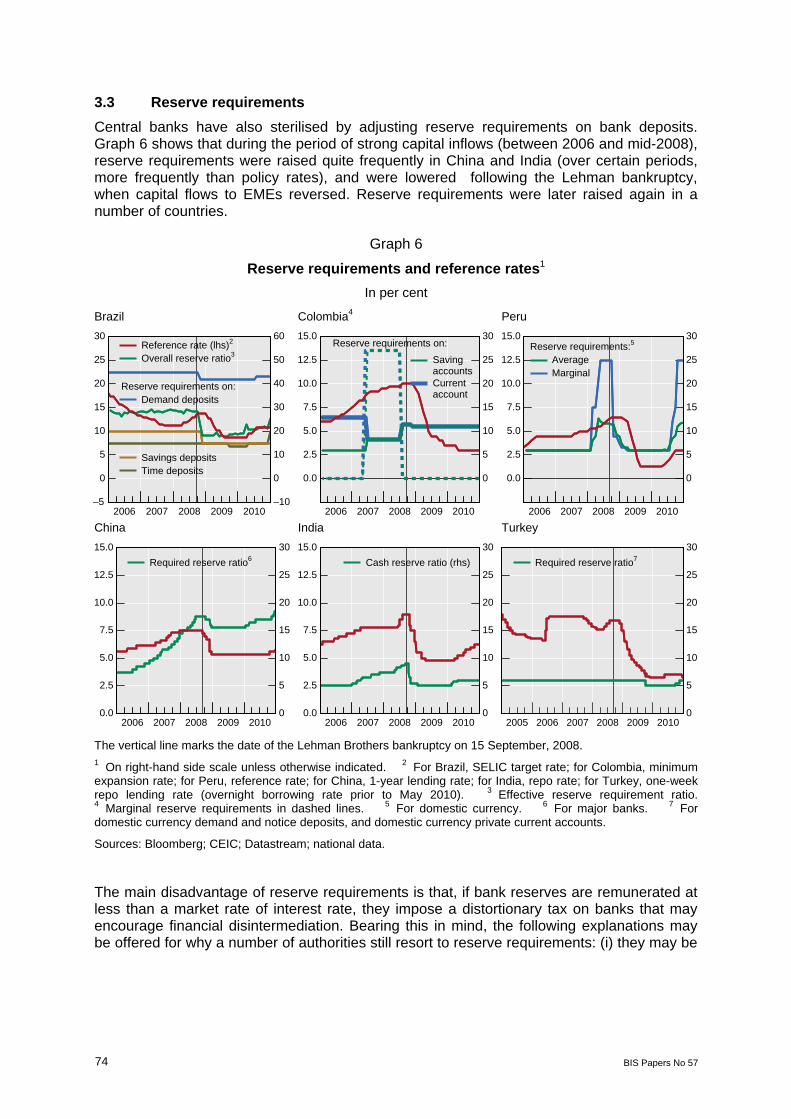
3.3 Reserve requirements Central banks have also sterilised by adjusting reserve requirements on bank deposits. Graph 6 shows that during the period of strong capital inflows (between 2006 and mid-2008), reserve requirements were raised quite frequently in China and India (over certain periods, more frequently than policy rates), and were lowered following the Lehman bankruptcy, when capital flows to EMEs reversed. Reserve requirements were later raised again in a number of countries.
Graph 6
Reserve requirements and reference rates1 In per cent
Brazil Colombia4 Peru
–5
0
5
10
15
20
25
30
–10
0
10
20
30
40
50
60
2006 2007 2008 2009 2010
Reserve requirements on:
Reference rate (lhs)2
Overall reserve ratio3
Demand deposits
Savings depositsTime deposits
0.0
2.5
5.0
7.5
10.0
12.5
15.0
0
5
10
15
20
25
30
2006 2007 2008 2009 2010
Reserve requirements on:
Savingaccounts Currentaccount
0.0
2.5
5.0
7.5
10.0
12.5
15.0
0
5
10
15
20
25
30
2006 2007 2008 2009 2010
Reserve requirements:5
AverageMarginal
China India Turkey
0.0
2.5
5.0
7.5
10.0
12.5
15.0
0
5
10
15
20
25
30
2006 2007 2008 2009 2010
Required reserve ratio6
0.0
2.5
5.0
7.5
10.0
12.5
15.0
0
5
10
15
20
25
30
2006 2007 2008 2009 2010
Cash reserve ratio (rhs)
0
5
10
15
20
25
30
2005 2006 2007 2008 2009 2010
Required reserve ratio7
The vertical line marks the date of the Lehman Brothers bankruptcy on 15 September, 2008. 1 On right-hand side scale unless otherwise indicated. 2 For Brazil, SELIC target rate; for Colombia, minimumexpansion rate; for Peru, reference rate; for China, 1-year lending rate; for India, repo rate; for Turkey, one-week repo lending rate (overnight borrowing rate prior to May 2010). 3 Effective reserve requirement ratio. 4 Marginal reserve requirements in dashed lines. 5 For domestic currency. 6 For major banks. 7 For domestic currency demand and notice deposits, and domestic currency private current accounts.
Sources: Bloomberg; CEIC; Datastream; national data.
The main disadvantage of reserve requirements is that, if bank reserves are remunerated at less than a market rate of interest rate, they impose a distortionary tax on banks that may encourage financial disintermediation. Bearing this in mind, the following explanations may be offered for why a number of authorities still resort to reserve requirements: (i) they may be
BIS Papers No 57 75
easier to implement; (ii) they do not tend to attract capital inflows as much as higher interest rates; (iii) they can serve as an alternative policy instrument; and (iv) they could provide some financial stability benefits.19
Ease of implementation. Reserve requirements potentially avoid many of the problems of sterilisation via domestic operations cited earlier (sterilisation costs to the central bank if not fully remunerated, lack of sterilisation instruments, concerns about the central bank’s net creditor position). Furthermore, reserve requirements are an instrument available to most central banks; indeed, they may be the only instrument that can supplement the policy rate when banking supervision and regulation is in a different institution. At the same time, adjustments to liquidity involve the banking system’s own balance sheet; so the central bank does not directly incur any costs or risks.
Smaller effect on capital inflows. A dilemma confronting policymakers during periods of large capital inflows is that raising interest rates can attract more capital inflows. To avoid this dilemma, some central banks have increased domestic reserve requirements instead. The reason is that banks can be expected to compensate for the impact of higher reserve requirements by adjusting deposit or lending rates in a way that increases their net interest margins. An increase in reserve requirements can tighten domestic financing conditions without attracting more capital inflows if banks do not raise the deposit rate but rather lending rates. Recent experience and some central bank research suggest that banks may indeed pass on the costs of an increase in reserve requirements to depositors (by lowering deposit rates; see Montoro and Moreno (2011) and Vargas et al (2010)), in order to increase the margin between lending and deposit rates.
Alternative policy instrument. Changes in reserve requirements may be preferred for sterilisation purposes when transmission via the policy rate is weak, eg when financial markets are underdeveloped; during episodes of financial stress (Quizpe and Rossini (2010)); or when policy rates are close to zero. They may also make it easier to resolve conflicting objectives. For instance, in the case of a sudden negative external shock that leads to a reversal in capital inflows and the sale of foreign reserves, monetary authorities may prefer to sterilise by lowering reserve requirements in order to ease monetary conditions. In Latin America and central and eastern Europe, reserve requirements fell shortly after the Lehman Brothers bankruptcy, which was consistent with sterilising the contractionary effects of foreign currency liquidity provision in foreign exchange markets experiencing severe stress. Policy rates were lowered in Latin America starting in December 2008, after much of the turmoil had passed (Graph 6). This may be useful if changes in the policy rate are seen as signalling policymakers’ commitment to inflation stability, while changes in reserve requirements are seen as addressing financial stability concerns. An important question is whether it is best to use interest rates and reserve requirements so that they reinforce each other (eg to raise reserve requirements when the policy rate is also being raised) or whether these two instruments could be used in opposing directions, assigned to different targets. This last type of policy assignment has been implemented in Turkey:20 In
19 For a related discussion on the use of reserve requirements, see Montoro and Moreno (2011). 20 On 11 November 2010, the Monetary Policy Committee (MPC) of the Central Bank of the Republic of Turkey
(CBRT) announced a large reduction in the overnight borrowing rate (from 5.75% to 1.75%) as well as in the late liquidity borrowing rate (from 1.75% to 0%), citing low inflation. The interest rate corridor was also widened, to encourage longer-term investments. See Press Release on Summary of the Monetary Policy Committee Meeting, no 2010-39, 29 November 2010. This was done in a setting in which reserve requirements had been rising. On 12 November, the CBRT announced a 0.5 percentage point increase in the Turkish lira required reserve ratio to 6% with immediate effect. This followed an earlier increase of 0.5 percentage points on 1 October 2010. (The FX required reserve was also increased.) See Press Release on Required Reserves, no. 2010-38, 12 November 2010. In 2011, authorities relied more heavily on reserve requirements, raising them to a peak of 16% for demand deposits in April while keeping interest rates stable (2011 is not shown in graph).

76 BIS Papers No 57
late 2010, interest rates were lowered sharply, which could dampen exchange rate appreciation in the face of a current account deficit and in a setting of low inflation. At the same time, reserve requirements were increased, which could restrain credit growth (see the paper by Binici and Yörükoğlu in this volume).
Financial stability benefits. Reserve requirements can act countercyclically, containing credit growth (and, by extension, asset price increases) and building a cushion of reserves in the upswing of the business cycle; and enabling bank credit to grow during periods of stress.21 Similar countercyclical effects can be achieved by sterilising via open market operations. Both types of sterilisation instruments also reduce banking sector currency mismatches that could arise from central bank sales of foreign reserves.
However, these instruments may have different implications for other types of risks. For example, reserve requirements may imply lower market risk but greater exposure to rollover risks. In particular, reserve requirements lead commercial banks to deposit a certain amount of their assets at the central bank (with no flexibility on how much is allocated), while domestic monetary operations prompt them to acquire government securities. In the latter case, banks are exposed to market risks that they may not be well equipped to handle (in EMEs, most bank risk exposure is traditionally in the form of credit risk). Furthermore, risk weights on government debt can be significant under Basel II (BCBS (2006, paragraph 53), ranging from zero (for ratings AAA to AA–) to 150% (ratings below B–). As recent experience shows, sudden changes in the market value of debt and rating downgrades can have a large impact on bank balance sheets.
As for rollover risks, the costs that reserve requirements impose on domestic banks may encourage banks to resort to short-term wholesale (domestic or foreign) financing, rather than rely on more stable deposits (typically their most important source of funds). The extent to which this creates problems will depend on the availability of such financing.
4. Implications for domestic money and credit
How has foreign asset accumulation affected domestic money and credit in EMEs? More systematic analysis is needed to answer this question, but an impression can be gained by examining the relationship between growth in net foreign assets of the central bank and, respectively, reserve money, M2 and credit to the private sector. A positive association could imply that sterilisation is incomplete, and the resulting increase in money and credit could pose macroeconomic and financial stability concerns.
Graph 7 illustrates this relationship during two recent periods of capital inflows, the first in the 2000s prior to the Lehman Brothers bankruptcy, and the second during the most recent period of recovery of capital inflows. As can be seen, in spite of the complete absence of control variables (and bearing in mind the presence of outliers), a positive relationship between net foreign asset growth and indicators of money and credit growth is apparent in a cross-section of countries prior to the Lehman bankruptcy. However, this relationship has broken down in the most recent period. This could reflect more effective sterilisation. Alternatively, it could mean that, although foreign assets have grown rapidly in some countries, weak growth in demand for money and credit has dampened the extent to which this is reflected in faster money growth.
21 At least one central bank – Brazil – has also used reserve requirements in order to target certain vulnerable
sectors during episodes of financial stress (Mesquita and Toros (2010)).

BIS Papers No 57 77
Graph 7
Growth in net foreign assets minus currency in circulation, versus growth in various monetary and credit aggregates1
Reserve money minus currency in circulation2
M2 minus currency in circulation2 Credit to the private sector minus currency in circulation2
–20
0
20
40
60
0 20 40 60 80
y = 4.86 + 0.384xAdjusted R2 = 0.4229
–20
0
20
40
60
0 20 40 60 80
y = 10.36 + 0.214xAdjusted R2 = 0.2356
–20
0
20
40
60
0 20 40 60 80
y = 14.77 + 0.206xAdjusted R2 = 0.0779
Reserve money minus currency in circulation3
M2 minus currency in circulation3 Credit to the private sector minus currency in circulation3
–40
0
40
80
120
–20 0 20 40 60
y = 19.25 + 0.064xAdjusted R2 = -0.0446
–10
0
10
20
30
–20 0 20 40 60
y = 9.35 + 0.005xAdjusted R2 = -0.0433
–10
0
10
20
30
–20 0 20 40 60
y = 8.57 + 0.059xAdjusted R2 = -0.0309
1 Horizontal axis: monetary authorities’ net foreign assets minus currency in circulation. Vertical axis: reservemoney minus currency in circulation, M2 minus currency in circulation, and credit to the private sector minuscurrency in circulation, respectively. The dots represent Algeria, Argentina, Brazil, Chile, China, Colombia, the Czech Republic, Hong Kong SAR, Hungary, India, Indonesia, Israel, Korea, Malaysia, Mexico, Peru, thePhilippines, Poland, Russia, Saudi Arabia, Singapore, South Africa, Thailand, Turkey andVenezuela. 2 Annualised changes between December 2002 and June 2008, in per cent. 3 Annualised changes between March 2009 and the latest available data, in per cent.
Sources: IMF, International Financial Statistics; Datastream.
5. Conclusions
In the past decade, foreign asset growth has led to significant growth in central bank assets in EMEs. As a result, emerging market central bank assets are large – much larger than in advanced economy central banks, even after quantitative easing or large-scale asset purchases by the latter. Large foreign asset holdings of emerging market central banks appear to have been associated with significant costs for central banks, reflecting sterilisation costs and possible losses from domestic currency appreciation. In line with this, the return on average assets in a sample of emerging market economies has broadly declined during the period of strong capital inflows. There also appear to be macroeconomic effects: until September 2008, growth in net foreign assets was positively associated with growth in reserve money, M2, and credit (all net of currency in circulation). However, this relationship has broken down more recently.

78 BIS Papers No 57
Emerging market authorities have tried to sterilise or limit the impact of foreign asset accumulation on the domestic financial system through foreign currency operations (eg by issuing foreign liabilities). However, this has not fully offset gross foreign asset growth – certainly not in comparison with advanced economies – so that net foreign assets tend to be large. Much of the sterilisation by central banks is thus done via domestic operations – specifically, sales of treasury or central bank securities. Apart from costs, domestic operations raise a number of concerns. First, central bank claims on government are often small relative to the size of net foreign assets to be sterilised. While issuing central bank securities is a possible alternative, this is not always allowed because it may interfere with the smooth functioning of the market for government debt. Second, as a result of sterilisation, the central bank could become a net debtor in the domestic market, impairing its ability to regulate liquidity and conduct monetary policy. And third, while debt markets in EMEs have deepened and maturities of local currency debt securities have lengthened, greater participation by foreign investors can complicate sterilisation efforts.
Some authorities have used reserve requirements on commercial banks as an alternative sterilisation tool. Although reserve requirements impose significant costs on banks and could encourage financial disintermediation, they have some advantages over interest rates in terms of ease of implementation, impact on capital inflows, effectiveness and possible financial stability benefits.
BIS Papers No 57 79
Appendix
Table A1
Composition of central bank assets
As a percentage of total assets
Net foreign assets Claims on government
2002 Latest 2002 Latest
Emerging Asia
China 49.7 84.9 6.2 6.2
Hong Kong SAR 99.8 100.0 … …
India 71.3 79.1 25.4 18.8
Indonesia 29.4 71.6 46.9 24.0
Korea 85.6 87.3 3.0 5.4
Malaysia 79.4 70.3 0.4 0.6
Philippines 46.4 78.8 18.0 11.2
Singapore 95.2 96.0 3.9 2.5
Thailand 62.9 92.3 4.6 5.4
Latin America
Argentina –12.4 56.4 48.8 39.3
Brazil 9.5 38.0 64.4 54.8
Chile 62.7 82.6 29.6 6.4
Colombia 83.9 88.1 6.4 2.2
Mexico 71.3 89.7 … …
Peru 87.8 96.0 0.9 …
Venezuela 80.5 85.1 8.3 3.1
CEE
Czech Republic 93.0 95.9 1.4 …
Hungary 34.2 64.1 32.8 2.5
Poland … 91.2 … …
Russia 57.7 91.1 23.0 2.2
Turkey –17.3 66.4 37.7 6.6
Other EMEs
Algeria 86.3 98.5 6.6 0.1
Israel 88.4 87.3 8.6 7.5
South Africa 30.0 82.1 40.4 3.2
Source: IMF, International Financial Statistics.

80
BIS
Papers 57
Table A2
Share of central bank liabilities in total assets, in per cent Reserve money
other than currency Claims by non-residents Bonds and securities Government deposits Capital account and other items (net)
2002 Latest 2002 Latest 2002 Latest 2002 Latest 2002 Latest Asia
China 60.8 52.0 1.0 0.6 3.2 16.8 6.7 13.3 –9.4 –0.0 Hong Kong SAR 16.0 40.4 0.2 0.0 … … 36.2 27.3 34.0 21.8 India 17.7 22.3 1.0 1.7 … … 0.0 2.3 25.5 19.6 Indonesia 12.5 41.4 15.5 2.8 … 5.4 17.6 7.9 27.6 6.5 Korea 10.7 9.8 5.9 5.5 61.8 44.7 6.6 1.3 3.3 29.5 Malaysia 9.5 1.2 1.6 13.9 … … 4.6 6.1 20.1 5.8 Philippines 8.4 18.8 28.0 3.6 … … 6.7 6.0 20.5 17.5 Singapore 5.1 6.0 0.9 1.5 … … 63.6 43.1 22.1 42.1 Thailand 2.5 1.6 10.0 2.1 4.8 22.3 2.9 7.3 47.3 5.7
Latin America Argentina 11.7 26.2 42.4 3.7 2.7 25.1 0.1 3.5 29.1 13.5 Brazil 33.0 23.7 20.7 2.4 … … 20.2 29.2 –4.4 2.1 Chile 36.5 64.3 1.7 4.6 45.9 18.5 2.9 1.9 2.4 –19.3 Colombia 4.7 13.5 2.7 5.3 … … 0.8 5.7 58.0 13.2 Mexico … … 0.8 3.5 17.6 0.1 13.9 41.1 –2.7 –4.6 Peru 55.9 29.3 10.8 4.0 5.4 23.1 6.5 22.2 5.9 3.4 Venezuela 40.8 113.6 4.1 11.8 2.0 11.1 3.9 10.4 49.0 –49.2
CEE Czech Republic 4.7 6.5 0.6 3.4 … … 10.7 11.6 –4.3 –14.7 Hungary 9.9 3.2 32.4 33.0 3.8 8.4 5.3 11.7 –3.7 –13.6 Poland … 6.7 … 8.5 … … … 9.5 … 13.1 Russia 17.5 11.1 9.7 1.7 … … 14.9 37.0 22.8 18.1 Turkey 17.1 35.6 76.1 19.1 … … 7.3 9.8 –21.2 4.0
Other EMEs Algeria 8.8 3.1 7.0 1.5 … … 22.2 41.0 10.9 15.5 Israel 41.2 40.0 0.6 5.2 … … 40.5 49.1 5.5 –7.7 Saudi Arabia 12.2 5.0 … … … … 32.8 60.8 21.7 28.3 South Africa 11.8 16.4 18.8 6.8 … … 2.4 37.0 –2.6 2.2
Source: IMF, International Financial Statistics.
BIS Papers No 57 81
Table A3
Foreign reserve adequacy1
Outstanding year-end position As a percentage of
In billions of US dollars % of GDP Short-term external debt2 M2
02 07 08 10 10 02 07 08 10 02 07 08 10
Asia3 945 2,907 3,318 4,672 55 524 449 586 433 30 35 35 36
China 286 1,528 1,946 2,847 50 1,369 1,249 1,868 1,092 13 28 28 26
Hong Kong SAR 113 147 178 261 116 197 144 189 190 25 19 22 28
India 67 267 247 263 19 983 340 338 227 19 28 27 19
Indonesia 31 55 49 86 13 228 185 174 192 31 31 30 33
Korea 121 262 200 287 29 271 176 172 171 17 19 19 19
Malaysia 32 101 91 102 47 331 447 402 365 25 40 35 29
Philippines 13 30 33 53 28 174 227 406 349 38 39 43 55
Singapore 82 163 174 226 104 141 127 150 153 76 77 75 69
Thailand 38 85 108 166 53 387 867 998 1,058 25 31 38 42
Latin America 140 397 440 547 13 127 238 362 270 57 47 49 ...
Argentina 10 44 44 46 13 57 200 279 399 42 51 49 41
Brazil 37 179 193 281 14 124 292 364 253 20 20 24 19
Chile 15 17 23 27 14 140 86 113 123 47 18 28 23
Colombia 10 20 23 26 9 207 201 390 325 39 26 28 23
Mexico 50 86 94 112 11 107 254 240 314 15 15 18 16
Peru 9 27 30 44 29 136 284 248 312 181 165 157 144
Venezuela 8 24 33 11 4 119 347 901 166 54 33 36 ...
CEE4, 5 165 753 703 776 20 264 153 144 188 ... 74 84 62
Czech Republic 24 35 37 42 22 437 200 236 372 44 25 27 27
Hungary 10 24 34 42 32 110 88 99 123 29 29 43 52
Poland 30 66 62 94 21 218 245 178 257 36 29 28 37
Russia 44 467 413 449 31 275 493 490 691 66 86 86 75
Turkey 27 73 70 77 11 143 124 119 132 41 23 24 19
Other 71 359 510 541 49 339 605 993 670 35 72 89 84
Israel 24 28 42 67 33 523 587 556 485 47 34 44 56
Saudi Arabia5 42 301 438 436 102 433 1,058 2,215 1,270 51 169 207 182
South Africa 6 29 30 38 11 62 170 207 254 7 12 16 13
1 Regional aggregates for the outstanding year-end position of foreign exchange reserves are the sum of the economies listed, simple averages otherwise. 2 Short-term external debt defined as short-term liabilities to BIS reporting banks (consolidated cross-border claims of all BIS reporting banks on countries outside the reporting area with a maturity up to and including one year, plus international debt securities outstanding with a maturity of up to one year). 3 Countries shown plus Chinese Taipei. 4 Central and eastern Europe: Bulgaria, the Czech Republic, Estonia, Hungary, Latvia, Lithuania, Poland, Romania, Russia, Slovakia, Slovenia and Turkey. 5 For Saudi Arabia, excluding investment in foreign securities.
Sources: IMF; Thompson Reuters; national data.
82 BIS Papers No 57
Table A4
Estimates of sterilisation costs and valuation losses from domestic currency appreciation1
FX reserves (USD billions)
Interest differential2
Sterilisation cost (100% sterilised)3
Valuation loss for a 10%
appreciation of domestic
currency (%)4
Jun 08 Sep 10 Jun 08 Sep 10 Jun 08 Sep 10 Jun 08 Sep 10
Asia
China 1,809 2,648 0.8 2.6 0.4 1.4 4.7 5.2
Hong Kong SAR 152 256 –1.3 –0.1 –1.0 –0.1 7.3 12.2
India 302 265 5.2 6.0 1.4 1.2 2.7 2.1
Indonesia 57 80 5.6 6.1 0.7 0.8 1.3 1.3
Korea 258 285 2.1 2.1 0.6 0.7 2.7 3.1
Malaysia 125 97 0.5 2.5 0.3 1.1 6.3 4.4
Philippines 32 45 3.0 3.9 0.6 1.0 2.1 2.6
Singapore 177 215 –2.1 0.0 –1.9 0.0 9.1 10.8
Thailand 103 157 0.3 1.4 0.1 0.8 4.0 5.4
Latin America
Argentina 45 46 10.7 12.1 1.8 1.9 1.7 1.6
Brazil 200 268 9.1 9.4 1.1 1.4 1.2 1.5
Chile 20 26 –2.6 –0.1 –0.3 0.0 1.2 1.4
Colombia 22 25 3.0 1.3 0.3 0.1 0.9 0.9
Mexico 93 108 4.9 4.6 0.4 0.5 0.9 1.2
Peru 35 40 2.4 2.6 0.7 0.8 3.0 2.9
Venezuela 23 10 14.2 14.2 1.4 0.9 1.0 0.6
CEE
Czech Republic 38 44 0.8 0.5 0.1 0.1 1.7 2.3
Hungary 27 44 5.5 4.9 0.9 1.8 1.7 3.7
Poland 83 99 3.0 3.2 0.5 0.7 1.5 2.2
Russia 555 458 2.3 3.2 0.9 1.1 3.9 3.6
Turkey 76 76 14.6 7.1 1.6 0.8 1.1 1.2
Other EMEs
Algeria 133 155 0.3 3.4 0.2 3.9 8.9 11.6
Israel 31 65 0.9 1.4 0.1 0.5 1.5 3.1
Saudi Arabia 377 413 –0.1 0.0 –0.1 0.0 9.8 11.0
South Africa 31 36 9.1 5.7 1.1 0.6 1.2 1.1
1 Assumes that FX reserves are invested in one-year sector bonds and that domestic liabilities have one-month average maturity. 2 Domestic borrowing cost (mostly one-month interbank rate) minus the investment rate (basket of one-year government bond rates (65% USD, 25% EUR, 5% JPY and 5% GBP)). 3 The financial cost for the FX reserves (FX reserves multiplied by the interest rate differential) as a percentage of the nominal GDP per annum. 4 10% valuation loss on the FX reserves as a percentage of the nominal GDP per annum.
Sources: IMF; CEIC; Datastream; Bloomberg; JPMorgan Chase; national data; BIS calculations.

BIS Papers No 57 83
Table A5
Maturity of domestic central government debt outstanding1 Average original and remaining maturity in years²
2000 2007 2009
Original Remaining maturity Original Remaining
maturity Original Remaining maturity
Asia
China ... ... ... ... ... ...
Hong Kong SAR 5.6 3.2 6.6 3.6 6.6 3.4
India 13.0 [7.1] 14.7 10.0 13.8 10.5
Korea 4.0 2.4 7.0 4.4 7.6 4.6
Indonesia 5.6 6.0 13.3 12.7 6.7 6.1
Malaysia ... 5.0 10.0 5.4 9.2 5.3
Philippines 8.6 5.8 7.8 5.0 ... ...
Singapore 4.3 2.7 6.8 3.6 6.2 3.2
Thailand ... ... 9.7 5.8 10.2 5.8
Latin America
Argentina ... ... 17.2 10.4 16.2 10.0
Brazil ... 2.7 ... 3.0 ... 3.4
Chile ... ... 7.8 6.8 ... ...
Colombia 5.1 3.6 7.7 4.1 8.8 5.1
Mexico ... 1.4 ... 5.7 ... 6.4
Peru ... [6.4] 18.5 16.5 19.6 16.0
Venezuela ... 2.5 ... 14.9 ... 3.9
CEE
Czech Rep 5.2 3.4 8.5 5.6 9.6 5.9
Hungary ... 3.9 6.8 4.0 5.3 2.7
Poland 4.2 2.6 8.0 4.3 7.9 4.1
Russia 8.7 4.4 13.1 8.9 11.3 7.4
Turkey 1.7 1.0 3.8 1.1 4.0 1.9
Other EMEs
Israel 8.5 6.2 11.0 6.2 11.1 6.3
Saudi Arabia ... 6.0 ... 4.2 ... 3.3
South Africa 17.6 9.2 17.3 8.3 18.0 10.6
1 Includes bonds, notes and money market instruments. Average original and remaining maturities of central government amounts outstanding reported in Table 2e of the Working Group survey. Numbers in brackets represent the results of the 2001 survey published in BIS (2002, Table 6). ² These estimates should be regarded as indicative and may not be strictly comparable across countries.
Sources: CGFS Working Group survey; BIS, http://www.bis.org/statistics/secstats.htm item D4.

84 BIS Papers No 57
Graph A1
Exchange rate and aggregate positions in FX forwards and futures against domestic currency
Hong Kong SAR India Indonesia
99.5
100.0
100.5
101.0
101.5
–0.5
0.0
0.5
1.0
1.5
2.0
2.5
03 04 05 06 07 08 09 10
(rhs)2
Exchange rate (lhs)1
Net position
90
100
110
120
130
–10
–5
0
5
10
15
20
03 04 05 06 07 08 09 10
(rhs)2
Long positions (rhs)2
Short positions
70
80
90
100
110
120
130
–1.25
–1.00
–0.75
–0.50
–0.25
0.00
0.25
03 04 05 06 07 08 09 10
Korea Malaysia Philippines
70
80
90
100
110
120
130
140
–40
–20
0
20
40
60
03 04 05 06 07 08 09 10
100
105
110
115
120
125
–5
0
5
10
15
20
25
03 04 05 06 07 08 09 1090
100
110
120
130
–5
0
5
10
15
20
25
03 04 05 06 07 08 09 10
Singapore Thailand
100
110
120
130
140
–20
0
20
40
60
80
100
03 04 05 06 07 08 09 10
90
100
110
120
130
140
150
–5
0
5
10
15
20
25
03 04 05 06 07 08 09 10
1 2002 = 100; an increase indicates appreciation of the local currency. 2 Aggregate net, short (–) and long (+) positions in forwards and futures in foreign currencies vis-à-vis the domestic currency (including the forward leg of currency swaps); in billions of US dollars.
Source: IMF, Data Template on International Reserves and Foreign Currency Liquidity.

BIS Papers No 57 85
Graph A1 (cont) Exchange rate and aggregate positions in FX forwards and futures
against domestic currency Argentina Brazil Chile
70
77
84
91
98
105
112
–1.5
–1.0
–0.5
0.0
0.5
1.0
1.5
03 04 05 06 07 08 09 10
Exchange rate (lhs)1
Net position (rhs)2
Long position2
Short position2
66
88
110
132
154
176
198
66
88
110
132
154
176
198
03 04 05 06 07 08 09 1080
100
120
140
160
–2.0
–1.5
–1.0
–0.5
0.0
0.5
1.0
03 04 05 06 07 08 09 10
Colombia Peru
80
100
120
140
160
–0.50
–0.25
0.00
0.25
0.50
0.75
1.00
1.25
03 04 05 06 07 08 09 10
96
102
108
114
120
126
132
–1.5
–1.0
–0.5
0.0
0.5
1.0
1.5
03 04 05 06 07 08 09 10
Czech Republic Hungary Russia
100
125
150
175
200
225
250
–1.5
–1.0
–0.5
0.0
0.5
1.0
1.5
03 04 05 06 07 08 09 10
90
105
120
135
150
165
180
–7.5
–5.0
–2.5
0.0
2.5
5.0
7.5
03 04 05 06 07 08 09 1080
90
100
110
120
130
140
–8
–6
–4
–2
0
2
4
03 04 05 06 07 08 09 10
Turkey South Africa
80
90
100
110
120
130
140
–1.5
–1.0
–0.5
0.0
0.5
1.0
1.5
03 04 05 06 07 08 09 10
80
100
120
140
160
180
200
–8
–6
–4
–2
0
2
4
03 04 05 06 07 08 09 10
1 2002 = 100; an increase indicates appreciation of the local currency. 2 Aggregate net, short (–) and long (+) positions in forwards and futures in foreign currencies vis-à-vis the domestic currency (including the forward leg of currency swaps); in billions of US dollars.
Source: IMF, Data Template on International Reserves and Foreign Currency Liquidity.
86 BIS Papers No 57
References
Basel Committee on Banking Supervision (2006): International convergence of capital measurement and capital standards: a revised framework, Basel, June.
Committee on the Global Financial System (2007): “Financial stability and local currency bond markets”, CGFS Publications, no 28, June.
——— (2009): “Capital flows and emerging market economies”, CGFS Publications, no 33, January.
Kamil, H (2008): “Is central bank intervention effective under inflation targeting regimes? The case of Colombia”, IMF Working Papers, no WP/08/88.
Jara, A, R Moreno and C Tovar (2009): “The global crisis and Latin America: financial impact and policy responses”, BIS Quarterly Review, June.
Jeanne, O and R Rancière (2011): “The optimal level of international reserves for emerging market countries: a new formula and some applications”, Economic Journal, June.
Klüh, U and P Stella (2008): “Central bank financial strength and policy performance: an econometric evaluation”, IMF Working Papers, no WP/08/176.
Mesquita, M and M Toros (2010): “Brazil and the 2008 panic”, in The global crisis and financial intermediation in emerging market economies, BIS Papers, no 54, December.
Mohan, R (2008): “Capital flows to India”, in Financial globalisation and emerging market capital flows, BIS Papers, no 44, December.
Mohanty, M and P Turner (2006): “Foreign exchange reserve accumulation in emerging markets: what are the domestic implications?”, BIS Quarterly Review, September.
Montoro, C and R Moreno (2011): “The use of reserve requirements as a policy instrument in Latin America”, BIS Quarterly Review, March.
Moreno, R (2005): “Motives for intervention”, in Foreign exchange market intervention in emerging markets: motives, techniques and implications, BIS Papers, no 24, May.
Peires, S (2010): “Foreign participation in emerging markets’ local currency bond markets”, IMF Working Papers, no WP 10/88.
Quizpe, Z and R Rossini (2010): “Monetary policy during the global financial crisis of 2007–09: the case of Peru”, in The global crisis and financial intermediation in emerging market economies, BIS Papers, no 54, December.
Reinhart, C and V Reinhart (1999): “On the use of reserve requirements in dealing with capital flow problems”, International Journal of Finance and Economics, vol 4, no 1, January, pp 27–54.
Sidaoui, J, M Ramos-Francia and G Cuadra (2010): “The global financial crisis and policy response in Mexico”, in The global crisis and financial intermediation in emerging market economies, BIS Papers, no 54, December.
Vargas, H, Y Bettancourt, C Varela and N Rodríguez (2010): “Effects of reserve requirements in an inflation targeting regime: the case of Colombia”, in The global crisis and financial intermediation in emerging market economies, BIS Papers no 54, December.