foreign multinational corporations in hawaii: the
TRANSCRIPT
Foreign Multinational Corporations in Hawaii: The Decreasing Role of Japanese Investors?
Eric D. Ramstetter Acting Chief, Research Division, ICSEAD
and Visiting Professor, Graduate School of Economics,
Kyushu University
Working Paper Series Vol. 2001-30 November 2001
The views expressed in this publication are those of the author(s) and
do not necessarily reflect those of the Institute.
No part of this book may be used reproduced in any manner whatsoever
without written permission except in the case of brief quotations
embodied in articles and reviews. For information, please write to the
Centre.
The International Centre for the Study of East Asian Development, Kitakyushu

1
Foreign Multinational Corporations in Hawaii: The Decreasing Role of Japanese Investors?
Eric D. Ramstetter1
Acting Chief, Research Division, International Centre for the Study of East Asian Development
and
Visiting Professor, Graduate School of Economics, Kyushu University
Draft, 10 October 2001
Abstract
The primary goal of this paper is to examine how the roles of foreign MNCs in Hawaii, and
Japanese MNCs in particular, have changed over the last 2 decades. The major findings are (1)
foreign MNCs are relatively large in Hawaii by U.S. standards, but not that large by international
standards, (2) large increases in fixed investment by foreign MNCs were an important element of
large increases in aggregate demand in the late 1980s and early 1990s and were both a cause and
result of increased economic growth in this period, (3) the scale of foreign MNC activities in Hawaii
has trended downwards in recent years and the decline has been much larger if measured in terms of
fixed asset stocks than in terms of employment, and (4) tourism-related investments by Japanese
MNCs, in particular commercial property investments, continue to dominate the activities of foreign
MNCs in Hawaii, even though Japanese MNCs have apparently been selling off numerous
properties in recent years.
1 This paper was originally prepared for the Department of Business, Economic Development, and Tourism, of the State of Hawaii. I would like to thank Pearl Imada-Iboshi, Robert Shore, and Mary Blewitt for comments on earlier drafts but I am solely responsible for all remaining errors and for all opinions expressed. Please send any comments or criticisms to the author at [email protected].

2
1. Introduction
Inward foreign direct investment (FDI) by foreign multinational corporations (MNCs) increased
markedly in the late 1980s both in Hawaii and in the United States as a whole. The increase of
inward FDI in the United States was very large and a major element of a worldwide increase in FDI
during this period. Although there are no data on FDI in Hawaii, trends in the stock of fixed
investment (the stock of gross property, plant, and equipment) and the employment of foreign MNCs
in Hawaii indicate that the increase of foreign MNC activity was even larger in Hawaii than in the
rest of the United States. In Hawaii, Japanese MNCs accounted for a relatively large portion of the
fixed assets and employment of foreign MNCs and the increases in these measures of foreign MNC
activities observed in the late 1980s and 1990s. On the other hand, after Hawaii’s real estate bubble
burst in the early 1990s, Hawaii experienced large decreases in fixed assets of foreign MNCs and
further declines followed in the late 1990s. Japanese MNCs have been among the most prominent
sellers of foreign-controlled fixed assets in the late 1990s. Preliminary data and press reports
indicate that Japanese MNCs in particular continued to sell fixed assets in 2000-2001. Declines in
affiliate employment of foreign MNCs, including Japanese MNCs, have been more modest than
declines in fixed asset holdings, however.
The primary purpose of this paper is to examine these and related trends with a focus on
ascertaining the extent to which Japanese MNCs have reduced presence in Hawaii in recent years.
3
The paper is organized into four sections. The first two sections analyze overall trends in foreign
MNC activities (Section 2) and trends in the country and industry distributions of foreign MNC
activities (Section 3), using data from the comprehensive surveys of foreign MNCs in the United
States conducted by the Bureau of Economic Analysis’s (BEA). The BEA data are the most
comprehensive and thus provide the most reliable information available, but these data are relatively
slow to appear and provide limited detail in many cases, making it useful to supplement them with
data from other sources. Thus, Section 4 then examines patterns that emerge from more recent but
less comprehensive data on trends in the sales and employment of a sample of large foreign MNCs.
Some conclusions are then offered (Section 5).
2. An Overview of Trends in Activities of Foreign MNCs in Hawaii
As indicated above, there are no data on FDI levels or stocks in Hawaii. On a corporate
balance sheet FDI comprises the annual flow of equity and loans from foreign parents or related
firms that own more than 10 percent of a local affiliate. FDI is thus measure of corporate financial
resources, not how those resources are used. A foreign affiliate typically gets a large portion of
financial resources, both equity and loans, from local and other foreign sources. These sources are
used to finance investment in fixed assets (e.g., property, plant, and equipment) and other assets (e.g.,
holdings in other companies, cash balances, inventories) by the foreign affiliates involved. The

4
only measure of investment activity by foreign MNCs in the United States that is available at the
state level is a measure of fixed assets, namely the stock of gross property, plant, and equipment
controlled by foreign affiliates at yearend. Taking the first difference of this measure yields an
estimate of annual fixed investment by foreign MNCs that is roughly comparable estimates of total
fixed investment compiled by the state in its expenditure-side accounting of gross state product.2
Trends in fixed investment, by both local firms and foreign MNCs, are important for two
reasons. First, fixed investment is an important element of aggregate demand that is often highly
correlated with the business cycle. Fixed investment tends to display strong cyclical behavior with
large increases often being followed by large decreases, and the fluctuations in fixed investment have
long been thought to be an important cause of fluctuations in aggregate demand and the business
cycle. Second, fixed investment is the avenue through which an important factor of production,
fixed capital, is accumulated. The accumulation of fixed capital adds to productive capacity and
increases the productivity of other factors of production (e.g., labor), and can thus contribute to
economic growth in the medium- to long-term. The accumulation of physical factors such as labor
and capital is not generally thought to be the key supply-side determinant of economic growth,
however. Rather, the accumulation of technical knowledge and human capital is generally thought
to be more important in modern economic analysis and foreign MNCs are thought to contribute to
2 There are important differences in these measures, however. The largest differences result from the fact that measuring fixed investments as the first differences of fixed asset stocks in MNCs include (1) changes in asset prices or asset revaluations and (2) depreciation expenditures that are not included in estimates of total gross fixed investment which are compiled on an expenditure basis.
5
the accumulation of these intangible factors, both directly and indirectly through spillovers to local
firms (see Box: Foreign MNCs and Economic Growth).
Figure 1 shows trends in the growth rate of gross state product (GSP) in constant prices or the
real economic growth rate, the ratio of total fixed investment in the state to GSP in current prices,
and the ratio of fixed investment by foreign MNCs (=the change gross property, plant, and
equipment stocks for foreign MNCs) to GSP, again in current prices. Although it should be
emphasized the measure of fixed investment in MNCs is very different than the measure of total
fixed investment (see footnote 2 above), it is important that the trends in the two ratios are
remarkably similar for much of the period.3
The ratio of annual fixed investment by foreign MNCs to GSP rose rapidly in the late 1980s,
increasing more than tenfold in between 1985-1986 (0.4-1.1 percent) to 1989-1990 (11.2 percent in
each year) and falling more or less continually afterwards. These ratios became negative in
1995-1999 and fell to as low as –5.9 percent in 1998 before recovering some in 1999. Total fixed
investment to GSP ratios also rose in the late 1980s, albeit more slowly, from 13 percent in 1985 to
as high as 19-21 percent in 1988-1992, before trending downwards to 11 percent in 1997-1999.
Meanwhile, the economic growth rate followed a similar trend, rising from 2.6 percent in 1985 and
3.1 percent in 1986 to 5.0 percent in 1987 and very high rates of 6.8-8.0 percent in 1988-1990,
before falling to 1.0-1.6 percent in 1991-1992 and below zero in 1993-1996. In recent years, there
3 These estimates use the BEA’s estimates of GSP in the denominator. State estimates tend to be somewhat smaller, suggesting somewhat higher ratios to GSP than are shown in Figure 1.

6
has been some recovery to 0.5 percent in 1997-1998 and 1.0 percent in 1999. Thus, while the rise
and fall of fixed investment by MNCs appears to have been highly correlated with fixed
investment-GSP ratios and economic growth in 1985-1995, these correlations appear to have
weakened in recent years. It must also be stressed that correlation does not necessarily imply
causation. Economic theory suggests mutual causation because investment decisions by foreign
MNCs are likely to be affected by Hawaii’s economic performance and those investment decisions
in turn affect the state’s economic performance (see Box: Foreign MNCs and Economic Growth).
Figures 2-3 provide some additional perspectives on the relative size of fixed investment by
foreign MNCs in Hawaii and in the United States, showing the ratio of fixed investment (again
measured as gross property, plant and equipment) flows and stocks to two measures of GSP, total
GSP and GSP originating in the private sector for Hawaii and for the whole country. The figures
highlight five important patterns. First, there were increases in fixed investment by foreign MNCs
in the late 1980s and the early 1990s but the increases were much larger in Hawaii than in the
country as a whole. Second, in the late 1990s, fixed investment by foreign MNCs increased
markedly in the country as a whole, especially in 1998, but the reverse was true in Hawaii. Third,
the stock of fixed investment by foreign MNCs is much larger in Hawaii relative to the size of the
local economy than in the country as a whole. Fourth, in Hawaii, there is a relatively large gap
between the size of foreign MNCs measured relative to private GSP and the size of foreign MNCs
measured relative to total GSP because the public sector is relatively large in Hawaii. Fifth, the size

7
of fixed investment stocks relative to GSP has fallen markedly in Hawaii since 1995 but remained
rather constant in the country in 1991-1997, before increasing some in 1998-1999.
The ratios in Figures 2 and 3 are not precise measures of the size of foreign MNCs relative to the
local economy because they measure different things in the numerators (measures of annual flows or
yearend stocks of fixed investment) and the denominators (measures of the annual flows of goods
and services produced). A more precise measure of relative size is the ratio of employment in
foreign MNCs to total employment or to private employment (Figure 4). This figure first
reconfirms the five patterns described above with respect to Figure 1: (1) the increase in relative size
of foreign MNCs in the late 1980s was relatively large in Hawaii, (2) the contrast between increase
of relative size of foreign MNCs in the country but the decline of relative size in Hawaii in
1998-1999, (3) foreign MNCs are relatively large compared to the local economy in Hawaii, (4)
foreign MNCs are especially large relative to the private sector in Hawaii, and (5) the relative size of
foreign MNCs tended to decline in the 1990s in Hawaii while remaining largely unchanged until
1997 and then increasing some in the country as a whole.
However, there are also two important differences that emerge from comparison of Figures 2-3
and Figure 4. First, the decline in of foreign MNC activity in Hawaii in the 1990s is much smaller
if measured in terms of employment. Second, the gap between the relative size of MNCs in Hawaii
and the relative size of foreign MNCs in the country as a whole appears relatively small if measured
8
in terms of employment than if measured in terms of fixed investment stock-GSP ratios.4 These
two differences also reflect the facts that (1) foreign MNC shares tend to be smaller and more stable
when measured in terms of employment than in terms of production or capital stocks and (2)
investment flows (and stocks) of foreign MNCs are often highly volatile.
There is one technicality of importance here and below. From 1997 fewer U.S. affiliates of
foreign MNCs were required to respond to the BEA surveys, which are the primary source of U.S.
data on foreign MNCs in the United States. Specifically, U.S. affiliates with total assets, sales, or
net income greater than $3 million were required to respond to the surveys from 1997 forward. In
previous years, this threshold was much lower, only $1 million. Thus, part of the decline in MNC
fixed asset stocks and employment between 1996 and 1997 results from smaller sample sizes; for
example the number of reporting affiliates in Hawaii with gross property, plant and equipment fell
from 685 in 1996 to 497 in 1997 and the number of affiliates with employment fell from 469 to 407,
respectively (see Appendix Table 6a). On the other hand, affiliate employment actually rose from
47,500 in 1996 to 50,200 in 1997 (Appendix Table 5a) and declines in gross property, plant and
equipment was larger in 1998 and 1999 than in 1997 (see Appendix Table 1a). Thus, the effects of
the change in sample appear on these trends have been rather minor in the aggregate. However,
when foreign MNC activities are disaggregated by country or industry as in the following section,
the effects of the change in sample may have been somewhat larger for some observations.
4 For example, foreign MNCS accounted for about 10-13 percent of Hawaii’s private employment versus about 5-6 percent of U.S. private employment in the 1990s but ratios of fixed investment stocks to GSP were 35-56 percent in Hawaii and 12-13 percent in the country as a whole.

9
3. Where Do Foreign MNCs in Hawaii Come From and What Do They Do?
Foreign MNC activity in Hawaii is dominated by investment from Japan, investment in
commercial property, and investment in activities related to tourism and real estate. Figure 5 shows
trends in fixed investment stocks (again measured as stocks of gross property, plant, and equipment)
in Japanese MNCs and how they closely mirrored trends in all foreign MNCs, accounting for 82-88
percent of the total after 1987.5 European MNCs (3-9 percent of the total after 1987) and other
Asia-Pacific investors (3-11 percent of the total after 1987) were the next largest sources but the
shares of these two groups are much smaller than Japanese shares.
Commercial property holdings were the largest component of fixed investment stocks for
Japanese MNCs, accounting 68-86 percent of total after 1987 (Figure 6). In contrast, commercial
property comprised only 31-56 percent for non-Japanese MNCs. 6 In other words, commercial
property of Japanese MNCs accounted for the vast majority of all fixed assets held by foreign MNCs
in Hawaii. After falling from 74 percent in 1987 to 56-58 percent in 1988-1989, the ratio of
commercial property in Japanese MNCs to total fixed assets of all MNCs remained rather constant at
63-67 percent in 1990-1999.
Although Japanese MNCs also account for the majority of employment by foreign MNCs,
5 Japanese shares are much larger in Hawaii than they were for the United States as a whole (e.g., 18-21 percent since 1991; see Appendix Tables A1 and A2). 6 Shares of commercial property were much lower for both Japanese and non-Japanese MNCs in the United States as whole, though Japanese MNCs held a much larger portion of their assets in the form of commercial property than did non-Japanese MNCs (e.g., 30-56 percent since 1987 versus 18-20 percent; see Appendix Tables A1 and A2).

10
Japanese shares of foreign MNC employment (e.g., 68-75 percent after 1987) were somewhat
smaller that corresponding shares of fixed assets in foreign MNCs (Figure 7). Employment of
Japanese affiliates peaked at 38,300 in 1991 and 37,500 in 1993, before trending downwards to a
low of 30,600 in 1998. Employment in European MNCs was also relatively high in the early 1990s
(6,100-6,500 in 1990-1992) and in recent years (6,800-7,300 in 1996-1999) but was somewhat lower
in the interim. Employment in other Asian and Pacific MNCs also peaked in the early 1990s
(6,300-6,500 in 1990-1991) but declined markedly to 3,400-3,500 in 1994-1997 and 1,400-1,600 in
1998-1999. Australian MNCs accounted for the largest share of this group in 1987-1996 (41-64
percent of the group total) but employment in Australian MNCs declined to zero in 1998-1999 (see
Appendix Table A5a). Employment MNCs from other regions first rose in the early 1990s (from
2,800 in 1987 to 4,200-4,700 in 1991-1993), then declined some (to as low as 3,800 in 1996), before
rebounding to historical high levels in 1998 (5,200). MNCs from Latin America accounted for the
vast majority of employment in this group (76-95 percent of the group total, see Appendix Table
A5a).
Unfortunately the industrial classifications from the annual BEA data do not allow a very clear
identification the major industries of operation for foreign MNCs in Hawaii. Moreover, the
industrial classification used from 1997 forward is quite different from the classification used in
previous years, which mandates caution when interpreting differences between patterns observed in
recent years (1997 forward) and those of previous years.
11
Measures in terms of fixed assets in foreign MNCs, the real estate industry is the largest specific
industry that can be identified, accounting for a little more one-fourth of the total in recent years (e.g.,
27 percent in 1995-1999 and 29-31 percent in 1991, 1993-1994), down from more than one-third of
total in previous years (e.g., 35 percent in 1988 and 33 percent in 1990; Figure 8). However, the
non-specific category of other industries has been by far the largest since 1987, accounting for 53-58
percent of the total in 1987-1988 and 1990, and 62-66 percent of the total in 1989 and 1991-1998
before falling back to 60 percent in 1999. As will be detailed below the largest component of this
category is probably hotels and motels, and the decline of this share results in large part from sales of
hotels, mainly by Japanese owners. Retail trade is the largest of the goods-related industries
(including manufacturing and wholesale trade) but all three of the goods-related categories are very
small in terms of fixed assets.
The other industry and real estate categories are dominated by investments in commercial
property (Figure 9). Commercial property usually accounted for over two thirds of all fixed assets
in other industries and in real estate, this threshold being exceeded in all years except 1988-1989 for
other industries and 1996 for real estate. This again reflects the importance of developing largely
tourism-related properties in Hawaii. The share of commercial property was also roughly
two-thirds of fixed assets or more in earlier years in retail trade (1987-1996) and wholesale trade
(1987-1991), but this share fell markedly in more recent years to as low as 29 percent in wholesale
trade (1997) and 52 percent in retail trade (1997). These shares increased somewhat in 1998-1999

12
to 42-45 percent in wholesale trade and 57-59 percent in retail trade. Ratios were much lower in
manufacturing in all years, never exceeding the high of 33 percent in 1998 and ranging between 3
and 19 percent in other years.
The distribution of employment in foreign MNC across industries differs in two major respects
from the distribution of fixed assets. First, the real estate category is much smaller, accounting for
no more than 7 percent (in 1990) of the total after 1987 (Figure 10). Second, the retail trade
category is much larger with shares of 12-19 percent after 1987, and larger shares in earlier years.
The share of the other industries category also tends to be somewhat larger if measured in terms of
employment, this sector’s share varying between 65 and 73 percent after 1987. Manufacturing and
wholesale trade are also larger if measured in terms of employment, but still rather small compared
to other industries and retail trade.
As indicated above, the industry distributions in Figures 8-10 are not very informative in the
case of Hawaii because the category of unidentified other industries is quite large.7 Every five
years the BEA compiles data on foreign MNCs at the establishment or factory level, which is
published in much greater industry detail. These compilations show that hotels and motels were by
far the largest component of this category in 1987 and 1992 (Table 1).8 For example, hotels and
motels accounted for 40 percent of employment, 29 percent of payroll, and 16 percent of sales in all
7 The annual data do show that a number of industries (e.g., petroleum, finance and insurance, and information and professional services) are small components of this item. 8 It is important to recognize that the existence of multi-plant firms can lead to large differences in industrial distributions in plant-level compilations such as those in Tables 1-3 and firm-level compilations such as those in Figures 1-10. For example if a real estate company owns a hotel, real estate will be larger in the firm-level compilation than in the plant-level compilation.

13
foreign establishments in 1992, as well as 52 percent of the employment in Japanese establishments.
Construction was also relatively large, accounting for 10 percent of all foreign employment, 16
percent of payroll, and 12 percent of sales in 1992, if subdividers and developers are excluded to
avoid double counting.9 Finance and insurance was relatively large in terms of sales (17 percent of
the foreign total), but much smaller in terms of employment and payroll.
The foreign establishment data in Table 1 are also useful because they can be matched with
corresponding data from the economic censuses to calculate the share of foreign plants in Hawaii’s
employment in various industries with greater precision than is possible with the annual firm-level
data.10 Not surprisingly these calculations show relatively large shares in the large hotel industry
(Table 2). The large share in the smaller general merchandise retailing industry is also conspicuous.
Shares were also high in small manufacturing sector in 1992, largely because there was one large oil
manufacturing plant, which was foreign-owned at the time but was subsequently sold to U.S. buyers.
The data in Table 2 also underscore the fact that foreign shares often differ depending on the
activity being measured. For example, Table 2 shows a tendency for foreign shares to be relatively
high in terms of sales and payroll compared to employment. In other words, payroll per employee
and sales per employee (a very poor measure of labor productivity) both tended to be higher in
foreign plants. This is consistent with the notion that foreign MNCs often have relatively high
9 Subdividers and developers are also included in real estate. 10 Here again, it is important to recognize that the existence of multi-plant firms means these shares might be very different if firm-level data were used. However, the plant-level data allow more much more precise calculations because definitions and compilation-methods are much more consistent for foreign MNCs and all establishments when using these data.
14
labor productivity and/or pay relatively high wages compared to U.S. firms. One reason that
foreign MNCs may have higher labor productivity is if MNCs tend to be more efficient than
non-MNCs and U.S. plants tend to be predominantly non-MNCs. Differences in efficiency as well
as the possible need for foreign MNCs to pay a premium to attract good workers, may also
contribute to wage differentials between foreign and U.S. plants. These differentials are shown
explicitly in Table 3, but they are usually not very large, perhaps reflecting that many U.S. firms are
also MNCs (see Box on Foreign MNCs and Economic Growth). However, the data in Table 3 this
provide only a very rough comparison and more rigorous analysis would be necessary to determine
whether these differentials are in some sense statistically significant.11
4. More Recent Trends in Foreign MNC Activities
The BEA data presented in the previous two sections are the most comprehensive information
available on foreign MNCs in Hawaii. However, these data have two drawbacks. First, they are
rather slow to be published (e.g., preliminary estimates for 1999 and revised estimates for 1998 were
posted on the BEA web site in early October 2001). Second, because of confidentiality
requirements, it is often impossible to get detailed breakdowns of the data by industry of affiliate and
country of investor.
11 There are also some industries in which differentials appear to be unrealistically large (e.g., the 1124 percent differential in amusement and recreation payroll per employee in 1992. This suggests that there may be some problem with the calculations or the underlying data.

15
BOX: Foreign MNCs and Economic Growth in Hawaii
Foreign MNCs can affect aggregate economic activity in host economy and thus economic
growth both directly through their own activities and indirectly through the effects imparted on
local firms. Economic growth is often thought to be determined on the supply side of the
economy in the medium- to long-run and the most important effects of foreign MNCs are thought
to work through the supply side. However, foreign MNCs may also impart large demand-side
effects in relatively small economies like Hawaii. For example, in Hawaii the large increase in
fixed investment expenditures amounted to between 4.3 percent and 11.2 percent of GSP for 6
years between 1987 and 1992 (Figure 1). This is a very large demand-side stimulus that did not
exist in previous or subsequent years and one of the reasons that economic growth increased to
high levels in 1987-1990. However, causation likely runs both ways, with the increase in
growth also being one reason that foreign investors decided to invest more during these years.
On the supply side, the increase in fixed asset stocks and employment in foreign MNCs both
led to increased production capacity in foreign MNCs and probably contributed to increased
aggregate capacity as well. It is also possible that increased production by foreign MNCs
increased efficiency in Hawaii, further contributing to growth in the medium- to long-term.
Compared to non-MNCs, MNCs are generally thought to possess relatively large amounts of
firm-specific assets, many of which are intangible, such as technological know-how and related
assets (e.g., patents, knowledge generated through R&D), marketing networks, and management
know-how. If this is true, other factors of production (e.g., labor, capital) will tend to be more
efficient in MNCs than in non-MNCs, and increased MNC presence can improve the efficiency
of an economy if local firms are predominantly non-MNCs. The economic literature also
stresses that the relative efficiency of foreign MNCs may spillover to local firms through many
means, including direct contractual arrangements (e.g., technology transfer or requirements

16
BOX: Foreign MNCs and Economic Growth in Hawaii (continued)
included in sourcing agreements), movements of workers between MNCs and local firms, and
increased competitive pressure that the entry of the foreign MNC may bring. On the other hand,
there is also the danger that foreign MNCs can use their firm-specific assets to create and exercise
market power, thereby creating inefficiencies in market structures. However, the ability to
exercise market power is usually limited if the host market is open to trade and investment from
outside as is the case in Hawaii.
In the case of Hawaii, it is impossible to unambiguously evaluate the contributions of
foreign MNCs to growth in the state because of data constraints, but the data do give us a few
hints. First, the data suggest that foreign MNCs are of moderate size in Hawaii and that any
contribution to growth is likely to be correspondingly modest in the medium- to long-run. For
example, the foreign MNC share of employment, about 8-10 percent in recent years (Figure 4), is
not that large by international standards, though it is large by U.S. standards. However, as
indicated above, the demand side effects of fixed investment by foreign MNCs may have been
relatively large in the late 1980s and early 1990s, though it appears that local fixed investment
was a larger factor. Second, at the industry level, BEA’s establishment data suggest that payroll
and sales per employee may be slightly higher in foreign plants than in local plants (Table 3).
These observations are consistent with the view that foreign MNCs are more efficient than local
plants, but far more research is necessary before one can conclude that foreign MNCs had higher
sales and payroll per employee than local plants with any degree of statistical confidence.
Moreover, even if one concludes that this was probably true, neither of these indicators is a very
good measure of economic efficiency, and it is possible that foreign MNCs were not appear more
efficient if better measures of economic efficiency (e.g., value added per worker) were used.

17
Fortunately, there is one alternative source, an annual survey of the largest 250 firms by Hawaii
by a private magazine, Hawaii Business, which is both more up-to-date and provides more details on
the country of investor, the industry of activity, and the actual firms involved. The major drawback
of this source is that it covers only the largest firms in Hawaii ranked by sales; in recent years, the
lowest ranked firms had sales somewhat over $20 million. Thus, this it is important to recognize
that many of the smaller foreign MNCs are not included in these data. A second source that is of
some use, especially for checking the data on Japanese MNCs in the Hawaii Business data, is data on
Japanese affiliates abroad from the Japanese publisher Toyo Keizai (various years). However, this
source appears to omit several of the largest Japanese MNCs in Hawaii and BEA estimates of
Japanese affiliate employment (e.g., Figure 7) were 2-3 times larger than estimates compiled from
the Toyo Keizai data.12
Because the data on large foreign MNCs from Hawaii Business yield estimates of the number of
affiliates and affiliate employment, they can be directly compared with corresponding BEA
estimates. By definition the sample of large foreign MNCs, between 41 and 54 firms in 1988-1999,
is much smaller than the BEA sample of firms reporting employment, between 261 and 473 firms in
12 I had originally planned to analyze the Toyo Keizai data in this section as well, but I have chosen to omit that analysis here because of the apparently poor coverage in the Toyo Keizai data. See Appendix Tables C1 and C2 for data on equity and employment in Japanese affiliates compiled from the Toyo Keizai data.
A third data set that might be useful in this context describes real estate holdings on Oahu by country of owner (State of Hawaii, Department of Business, Economic Development & Tourism, various years). However, these data indicate very different trends than the BEA data on commercial property of foreign MNCs, probably because of difference in valuation methodology and differences in coverage (e.g., the real estate holdings data cover only Oahu and include non-commercial property). Thus analysis of these data is also omitted here.

18
the same period (Appendix Tables A6a, B3). However, this small sample accounted for more than
half of all affiliate employment as estimated by the BEA in 1983-1991 and 1996, and a little less
than half of the BEA total in 1992-1995 and 1997-1999 (Figure 13). Trends in the employment of
these large MNCs also very closely mirrored trends in overall affiliate employment in 1983-1990, a
period during which affiliate employment grew very rapidly. Data on large MNCs indicate a large
fall in 1992 and stagnation in 1993-1995, followed by fluctuations in 1996-1998 and decreases in
1999-2000. The BEA data contrast somewhat, indicating a generally steadier decline after 1991,
with isolated increases in 1997 and 1999 being the exceptions.
The data on large foreign MNCs also suggest that Japanese affiliates dominate, accounting for no
less than 60-64 percent of employment in large foreign MNCs in 1989-1991 and as much as 82-86
percent of this total in recent years (1997-2000, Figure 11). Thus, these data suggest large
non-Japanese MNCs experienced an extremely rapid increase in employment from between 2,850
and 4,267 in 1983-1984 to between 10,136 and 11,536 in 1989-1991 and then an equally rapid
decline to between 2,775 and 3,501 in 1997-2000. On the other hand, employment in large
Japanese affiliates grew more slowly and fluctuated more, going from between 8,664 to 10,178 in
1983-1985 to between 16,717 and 18,091 in 1987-1995, peaking at 20,485 in 1996, and then falling
back to between 16,950 and 18,534 in 1997-1999, and then to 13,847 in 2000.
Hotels accounted for the largest share of employment in these large MNCs by industry, 45-54
percent in 1983-1989, 37-40 percent in 1990-1991, 49 percent in 1992, and 54-62 percent in

19
1993-2000 (Figure 12). Retail trade was the second largest in most years accounting for 25-31
percent of the total in 1983-1986, 13-18 percent of the total in 1987-1998, and 20-21 percent of the
total in 1999-2000. Wholesale trade was also relatively large in the mid-1980s with shares of 10-17
percent in 1983-1987 and construction and other industries was relatively large in 1988-1992 with
shares of 10-23 percent, the vast majority of this being in construction itself (9-22 percent). The
share of eating and drinking establishments also reached double digits in one year (10 percent in
1987) but none of the other industries listed had shares exceeding this threshold in the 1983-2000
period. Here it should be pointed out that some of the differences between the industry-wise
distribution of employment in large MNCs in Figure 12 and all MNCs in Figure 10 may result from
differences in classification of individual firms, but many of the differences also result from the fact
that the sample in Figure 10 is more comprehensive.13
The share of hotels was relatively large for large Japanese MNCs, 62-68 percent in 1983-1989,
58-62 percent in 1990-1992, and 68-74 percent in 1993-2000 (Figure 13). Shares were in the 10-15
percent range for some years in wholesale trade (1983-1985), retail trade (1983-1985, 1996), and
eating and drinking (1986-1989), but shares never exceeded 10 percent for any of the other industries
categories listed in Figure 13.
As might be expected in a sales-based ranking, the coverage of the sample of large MNCs
13 It is a not a simple matter to classify a large firm with interests in hotels, retail trade, and real estate, for example. In the large-firm sample, for example, most of the firms with interests in both hotels and real estate are classified under hotels and this is probably one reason for the small share of real estate in this sample (1 percent between 1986 and 1992, 0 percent in other years).

20
appears to be higher in terms of sales than in terms of employment. In 1992, the only year for
which an overall comparison is possible, the sample of large foreign MNCs reported employment of
23,387, which was 43 percent of the 53,799 employees reported in the BEA establishment data or
the 53,800 employees reported in the BEA’s annual survey data.14 On the other hand, the sample of
large foreign MNCs reported sales of $4.8 billion or 66 percent of the total reported in the BEA
establishment data for the year.
It is also of some interest that, while employment of large foreign MNCs tended to fall rather
slowly after peaking in 1990 and then more rapidly in recent years, the reverse was true for sales of
these large MNCs, which rose very rapidly from $1.9 billion or less in 1987 and previous years to
over $7.1 billion in 1990 and then declined quickly $4.1-$5.1 billion in 1991-1996 and then more
slowly to $3.7-$3.9 billion in 1997-2000 (Figure 14). As with employment, the spike in 1990 and
surrounding years resulted largely from an increase in the sales of non-Japanese firms, which rose
from $0.8 billion or less in 1988 and previous years to $5.1 billion in 1990 and then fell back to
$1.7-$2.0 billion in 1993-1996 and $0.7 billion or less in subsequent years. One large Australian
oil manufacturer, which was eventually sold to U.S. interests, accounted for a very large portion of
this trend. In contrast, sales of large Japanese MNCs tended to rise through the mid-1990s, though
at a pace that slowed over time, from $1.2 billion or less in 1983-1987 to $1.6-$2.0 billion in
1988-1990, $2.1-$2.2 billion in 1991-1993, and $2.4-$2.7 billion 1994-1995, before stagnating at
14 Note that these totals often differ at the state level, primarily because of differences in the timing of data reporting and compilation.

21
$3.1-$3.3 billion in 1996-2000.
The important role of the Australian oil manufacturer is further reflected in Figure 15, which
shows a large increase in manufacturing sales from under $0.2 billion in 1988 and previous years to
$4.0 billion in 1990 and then a rapid decline to $1.2 billion in 1993-1994 and $0.1 billion or less in
1997 and subsequent years. A similar pattern is observed in construction and other category, which
is dominated by construction firms from New Zealand, Japan, and Australia, where sales rose from
$0.1 billion or less in 1987 and earlier years to a peak of $0.9-$1.1 billion in 1990-1991 and then fell
back to $0.1 billion or less in 1999-2000. Among non-manufacturing industries, hotels was again
the largest since 1987, with sales rising from $0.5 billion or less in 1986 and earlier years to
$0.7-$1.0 billion in 1987-1993, $1.1 billion in 1994-1995, and $1.3-$1.4 billion in 1996-1999, before
declining to $1.2 billion in 2000. Transportation and travel services was a very small industry for
large foreign MNCs through 1991, with sales of $0.1 billion or less, but sales grew very rapidly to
reach $1.1 billion in 1997, before declining somewhat to $0.9 billion in subsequent years. Sales
have also been relatively large in retail trade, which was the largest non-manufacturing industry
before 1987, fluctuating in the $0.4-$0.5 billion range in 1983-1989 and 1991-1994, and then the
$0.6-$0.7 range billion in 1990 and 1995-2000. Sales were also relatively large (more than 10
percent of the total) in wholesale trade in 1983-1988 and finance and insurance in 1999-2000. Thus,
the distribution of sales has been much more diverse and balanced than the distribution of
employment among large foreign MNCs. This finding is consistent with the pattern observed for
22
all MNCs in the BEA establishment data (Table 1).
The same general pattern is observed among large Japanese MNCs as well. Hotels are still the
largest industry in all years but they account for much smaller shares of sales (36-55 percent, Figure
16) than of employment (58-74 percent, Figure 13) . On the other hand, shares of sales were
relatively large in a number of industries such as retail trade (25-35 percent in 1983-1986 and 12-19
percent in 1987-2000), transportation and travel services in recent years (18-33 percent from
1994-2000), wholesale trade in earlier years (9-17 percent in 1983-1993), finance and insurance in
early 1990s (10-12 percent in 1990-1994, and construction and other industries (mainly construction,
11-15 percent in 1990-1993).
5. Conclusion
This paper has examined the existing data on foreign MNCs in Hawaii and yields several
important conclusions, four of which are most conspicuous. First, foreign MNCs play a moderate
role in the Hawaiian economy, which is relatively large compared to the role of foreign MNCs in the
United States as a whole, but not that large by international standards. Second, large fixed
investment by foreign MNCs in the late 1980s and early 1990s provided a large demand-side
stimulus in the state that was both a cause and a result of increased economic growth in this period.
Third, the scale of foreign MNC activities in Hawaii has trended downwards in recent years but the

23
decline has been much larger if measured in terms of fixed asset stocks than if measured in terms of
employment. Fourth, tourism-related investments in commercial property by Japanese MNCs
continue to dominate activities by foreign MNCs in Hawaii but the relative importance of Japanese
MNCs and commercial property investment has shrunk somewhat in recent years as Japanese
parents have sold off numerous properties in Hawaii.
These findings then raise two important questions about the future of foreign MNCs in Hawaii.
First, will the withdrawal of Japanese MNCs from the Hawaiian tourism and property markets that
has accelerated in recent years continue in the coming years? Second, if Japanese MNCs continue
to withdraw will there be alternative sources of foreign or mainland investment to replace them?
Unfortunately, the answer to these questions will not be known until Hawaii’s policy makers have to
deal with problems that changes in investment patterns may present the state with. However, even
if the answers were known in advance, they would be of limited use to Hawaiian policy makers,
because even the most rudimentary economic analysis strongly suggests that there is very little if
anything that policy makers in a small open economy like Hawaii can do to influence the decisions
of individual investors from abroad or the mainland without imposing large costs on the Hawaiian
economy. Thus, policy should remain indifferent to the sources of investment and focus on
maintaining a business environment that encourages productive investment, while providing
adequate public goods such as physical and educational infrastructure, and the maintenance of the
natural environment which is the basis for so much economic activity in the state.
24
References
Hawaii Business, various years. " The 250 Largest Companies in Hawaii, " Hawaii Business,
August issues 1984-2001.
Ramstetter, Eric D., 1998. "Quantitative Information on Foreign Multinationals in Hawaii ",
Working Paper 98-4, Kitakyushu: International Centre for the Study of East Asian Development.
State of Hawaii, Department of Business, Economic Development & Tourism, 1995. A Listing of
Foreign Invesmtents in Hawaii - 1994. Honolulu: Department of Business, Economic
Development & Tourism.
State of Hawaii, Department of Business, Economic Development & Tourism, 2001. Unpublished
data on fixed investment in Hawaii. Honolulu: Department of Business, Economic Development
& Tourism.
State of Hawaii, Department of Business, Economic Development & Tourism, various years. The
State of Hawaii Data Book, 1997-2000 issues. Honolulu: Department of Business, Economic
Development & Tourism (downloaded from http://www.hawaii.gov/dbedt/stats.html).
Toyo Keizai, various years. Kaigai Shinshutsu Kigyo Soran (A Comprehensive Survey of Firms
Overseas), CD-ROMs with data from 1990, 1992, 1994, 1996, 1998, and 2000 issues (data for 1988,
1990, 1992, 1994, 1996, 1998). Tokyo: Toyo Keizai (in Japanese).
U.S. Bureau of Labor Statistics, 2001. Nonfarm Payroll Statistics from the Current Employment
Statistics (State and Area), files with data for Hawaii for 1977-1999. Washington, D.C.: Bureau of
Labor Statistics (downloaded from http://146.142.4.24/cgi-bin/surveymost?sa+15).
U.S. Department of Commerce, Bureau of Economic Analysis, various years a. Foreign Direct
Investment in the United States: 19__ Benchmark Survey, Final Results, files with data from 1987,
1992, 1997 publications. Washington, D.C.: Bureau of Economic Analysis. (downloaded from
http://www.bea.doc.gov/bea/uguide.htm#_1_23).
U.S. Department of Commerce, Bureau of Economic Analysis, various years b. Foreign Direct
Investment in the United States: Operations of U.S. Affiliates 19__, files with data for 1977-1986,
1988-1991, 1993-1995, 1998-1999. Washington, D.C.: Bureau of Economic Analysis.
(downloaded from http://www.bea.doc.gov/bea/uguide.htm#_1_23).

25
U.S. Department of Commerce, Bureau of Economic Analysis, 2001. Regional Accounts Data,
Gross State Product Data, files with data for 1977-1999. Washington, D.C.: Bureau of Economic
Analysis. (downloaded from http://www.bea.doc.gov/bea/regional/gsp/).

Notes: The BEA definition of gross state product ist used in the denominators of the ratios; economic growth is the percentage change in the BEA's chain-type quantity index for gross state product; 1999 figure for GPPE is preliminary.Sources: State of Hawaii, Department of Business, Economic Development, and Tourism (2001); U.S. Department of Commerce, Bureau of Economic Analysis (various years a, various years b, 2001).
Figure 1: Ratios of Fixed Investment and Changes in Gross Property, Plant and Equipment ofForeign MNCs to Gross Product and Economic Growth Rates in Hawaii (percent)
-8-7-6-5-4-3-2-10123456789
1011121314151617181920212223
1985 1986 1987 1988 1989 1990 1991 1992 1993 1994 1995 1996 1997 1998 1999p
Fixed Investment to GSP Economic Growth Changes in GPPE of Foreign MNCs to GSP
26

Note: 1999 figure is preliminary.Sources: U.S. Department of Commerce, Bureau of Economic Analysis (various years a, various years b, 2001).
Figure 2: Ratios of Changes in Gross Property, Plant, and Equipment in Foreign MNCs to GrossProduct in Hawaii and the United States (percent)
-9-8-7-6-5-4-3-2-10123456789
10111213141516
1978 1979 1980 1981 1982 1983 1984 1985 1986 1987 1988 1989 1990 1991 1992 1993 1994 1995 1996 1997 1998 1999p
Hawaii, % of total Hawaii, % of private U.S., % of total U.S., % of private
27

Note: 1999 figure is preliminary.Sources: U.S. Department of Commerce, Bureau of Economic Analysis (various years a, various years b, 2001).
Figure 3: Ratios of Stocks of Gross Property, Plant, and Equipmentin Foreign MNCs to Gross Product in Hawaii and the United States (percent)
0
5
10
15
20
25
30
35
40
45
50
55
60
1977 1978 1979 1980 1981 1982 1983 1984 1985 1986 1987 1988 1989 1990 1991 1992 1993 1994 1995 1996 1997 1998 1999p
Hawaii, % of total Hawaii, % of private U.S., % of total U.S., % of private
28

Note: 1999 figure is preliminary.Sources: U.S. Department of Commerce, Bureau of Economic Analysis (various years a, various years b, 2001).
Figure 4: Ratios of Employment in Foreign MNCs to Non-agricultural Employment in Hawaii andthe United States (percent)
0
1
2
3
4
5
6
7
8
9
10
11
12
13
14
15
16
1977 1978 1979 1980 1981 1982 1983 1984 1985 1986 1987 1988 1989 1990 1991 1992 1993 1994 1995 1996 1997 1998 1999p
Hawaii, % of total Hawaii, % of private U.S., % of total U.S., % of private
29

Notes: 1999 figure is preliminary; for 1977-1986 it is impossible to distinguish other Asia & Pacific; for 1981-1983 data are not disclosed for some of the.regions and/or countries identified above. Sources: U.S. Department of Commerce, Bureau of Economic Analysis (various years a, various years b).
Figure 5: Yearend Stocks of Gross Property, Plant, & Equipment of Foreign MNCs in Hawaiiby Country of Ultimate Beneficial Owner (US$ billions)
0
1
2
3
4
5
6
7
8
9
10
11
12
13
14
15
16
17
1977 1978 1979 1980 1984 1985 1986 1987 1988 1989 1990 1991 1992 1993 1994 1995 1996 1997 1998 1999p
Japan Europe Canada Other, incl. Other Asia & Pac. Other Asia & Pacific Other, excl. Other Asia & Pac.
30

Note: 1999 figure is preliminary.Sources: U.S. Department of Commerce, Bureau of Economic Analysis (various years a, various years b).
Figure 6: Yearend Stocks of Gross Property, Plant, & Equipment of Japanese and Other MNCs inHawaii by Type of Asset (US$ billions)
0
1
2
3
4
5
6
7
8
9
10
11
12
13
14
15
16
17
1987 1988 1989 1990 1991 1992 1993 1994 1995 1996 1997 1998 1999p
Japanese MNCs, commercial property Japanese MNCs, other assets Other MNCs, commercial property Other MNCs, other assets
31

Notes: 1999 figure is preliminary; for 1977-1986 it is impossible to distinguish Other Asia & Pacific.Sources: U.S. Department of Commerce, Bureau of Economic Analysis (various years a, various years b).
Figure 7: Employment of Foreign MNCs in Hawaii by Country of Ultimate Beneficial Owner(thousands)
0
4
8
12
16
20
24
28
32
36
40
44
48
52
56
60
1977 1978 1979 1980 1981 1982 1983 1984 1985 1986 1987 1988 1989 1990 1991 1992 1993 1994 1995 1996 1997 1998 1999p
Japan Europe Canada Other, incl. Other Asia & Pac. Other Asia & Pacific Other, excl. Other Asia & Pac.
32

Notes: 1999 figure is preliminary; for 1980-1983 and 1992, data are not disclosed for some of the industries identified above; for 1977-1996, publishing is classified under manufacturing, petroleum and coal product manufacturing and rental and leasing (other than real estate) are classified under other industries, and eating and drinking is classified under retail trade; for 1997-1999, petroleum and coal product manufacturing is classified under manufacturing, rental and leasing (other than real estate) is classified under real estate, and eating and drinking and publishing are classified under other industries.Sources: U.S. Department of Commerce, Bureau of Economic Analysis (various years a, various years b).
Figure 8: Yearend Stocks of Gross Property, Plant, & Equipment of Foreign MNCs in Hawaiiby Industry of Affiliate (US$ billions)
0
1
2
3
4
5
6
7
8
9
10
11
12
13
14
15
16
17
1977 1978 1979 1984 1985 1986 1987 1988 1989 1990 1991 1993 1994 1995 1996 1997 1998 1999p
Other industries Real Estate Retail Trade Manufacturing Wholesale Trade
33

Notes: 1999 figure is preliminary; for 1992 and 1995 data are not disclosed for some of the industries identified above; for 1977-1996, publishing is classifiedunder manufacturing, petroleum and coal product manufacturing and rental and leasing (other than real estate) are classified under other industries, and eating and drinking is classified under retail trade; for 1997-1999, petroleum and coal product manufacturing is classified under manufacturing, rental and leasing (other than real estate) is classified under real estate, and eating and drinking and publishing are classified under other industries.Sources: U.S. Department of Commerce, Bureau of Economic Analysis (various years a, various years b).
Figure 9: Yearend Stocks of Gross Property, Plant, & Equipment of Foreign Other MNCs inHawaii by Major Industry Group and Type of Asset (US$ billions)
0123456789
1011121314151617
1987 1988 1989 1990 1991 1993 1994 1996 1997 1998 1999p
Other industries, commercial property Other industries, other assets Real estate, commercial property
Real estate, other assets Manufacturing & trade, commercial property Manufacturing & trade, other assets
34

Notes: 1999 figure is preliminary; for 1991 and 1996 data are not disclosed for some of the industries identified above; for 1977-1996, publishing is classifiedunder manufacturing, petroleum and coal product manufacturing and rental and leasing (other than real estate) are classified under other industries, and eating and drinking is classified under retail trade; for 1997-1999, petroleum and coal product manufacturing is classified under manufacturing, rental and leasing (other than real estate) is classified under real estate, and eating and drinking and publishing are classified under other industries.Sources: U.S. Department of Commerce, Bureau of Economic Analysis (various years a, various years b).
Figure 10: Employment of Foreign MNCs in Hawaii by Industry of Affiliate (thousands)
0
4
8
12
16
20
24
28
32
36
40
44
48
52
56
60
1977 1978 1979 1980 1981 1982 1983 1984 1985 1986 1987 1988 1989 1990 1992 1993 1994 1995 1997 1998 1999p
Other industries Real Estate Retail Trade Manufacturing Wholesale Trade
35

Table 1: Employment of Foreign Establishments, the Share of Foreign Establishments in Employment ofAll Establishments, and Employment of Japanese Establishments in Hawaii, by Industry in 1987 and 1992
Employment (number)Payroll (US$thousands)
Sales (US$thousands)
All foreign establishmentsJapanese
establishmentsAll foreign
establishmentsAll foreign
establishmentsIndustry 1987 1992 1987 1992 1987 1992 1987 1992
All industries 26,220 53,799 18,281 36,829 484,714 1,308,452 n.a. 7,256,724 Manufacturing 1,000-2,499 1,644 388 505 D 55,626 D 887,971 Wholesale trade 1,107 1,702 250-499 556 29,055 52,981 331,355 795,627 Durable goods 631 1,000 100-249 364 18,708 30,392 178,909 429,268 Nondurable goods 250-499 631 100-249 100-249 D 19,737 D 366,359 Administrative, auxil. 100-249 NA NA NA D NA NA NA Retail trade 7,069 12,042 3,861 5,669 85,915 200,578 872,589 1,515,684 Building materials, garden supplies 100-249 100-249 NA NA D D D D General merchandise 1,778 1,965 1,000-2,499 500-999 25,091 36,116 633,558 D Food 192 1,112 100-249 1,087 2,210 16,089 17,918 118,937 Automotive dealers 166 253 NA 190 2,772 7,216 28,716 54,322 Gasoline stations NA 293 NA NA NA 4,457 n.a. 70,209 Apparel, accessories 133 853 NA 244 1,267 11,862 21,492 109,525 Eating & drinking 3,018 4,933 1,000-2,499 2,247 26,615 51,394 90,894 166,737 Miscellaneous retail 821 1,256 250-499 640 8,840 22,531 51,076 160,841 Administrative, auxil. 500-999 1,169 250-499 193 D 46,334 n.a. n.a. Real estate, incl. sub- dividers & developers 698 2,716 250-499 2,688 12,535 70,857 NA 355,399 Other industries 14,847-16,346 35,695 D 27,411 D 928,410 D 3,702,043 Finance & insurance 1,100 1,854 NA 1,164 28,866 59,673 NA 1,199,379 Hotels, motels 9,454 21,362 5,000-8,966 19,097 144,699 384,315 541,252 1,146,814 Amusement, recreation 344 1,799 250-499 1,798 5,118 93,758 14,528 81,181 Other personal & business services 731 2,324 D 712 11,907 59,163 51,457 152,339 Transportation & public utilities 1,000-2,499 3,244 778 1,379 D 120,209 NA 235,723 Construction, excl. subdividers & developers 2,893-3,042 5,112 NA 3,253 D 211,292 D 886,607
ADDENDUM:Construction, incl.subdividers & developers 3,142 6,724 NA 5,082 102,827 217,219 677,533 1,091,450
Notes: D=not disclosed; NA=not available.Sources: Bureau of the Census and Department of Commerce as cited in Ramstetter (1998, Table 9).
36
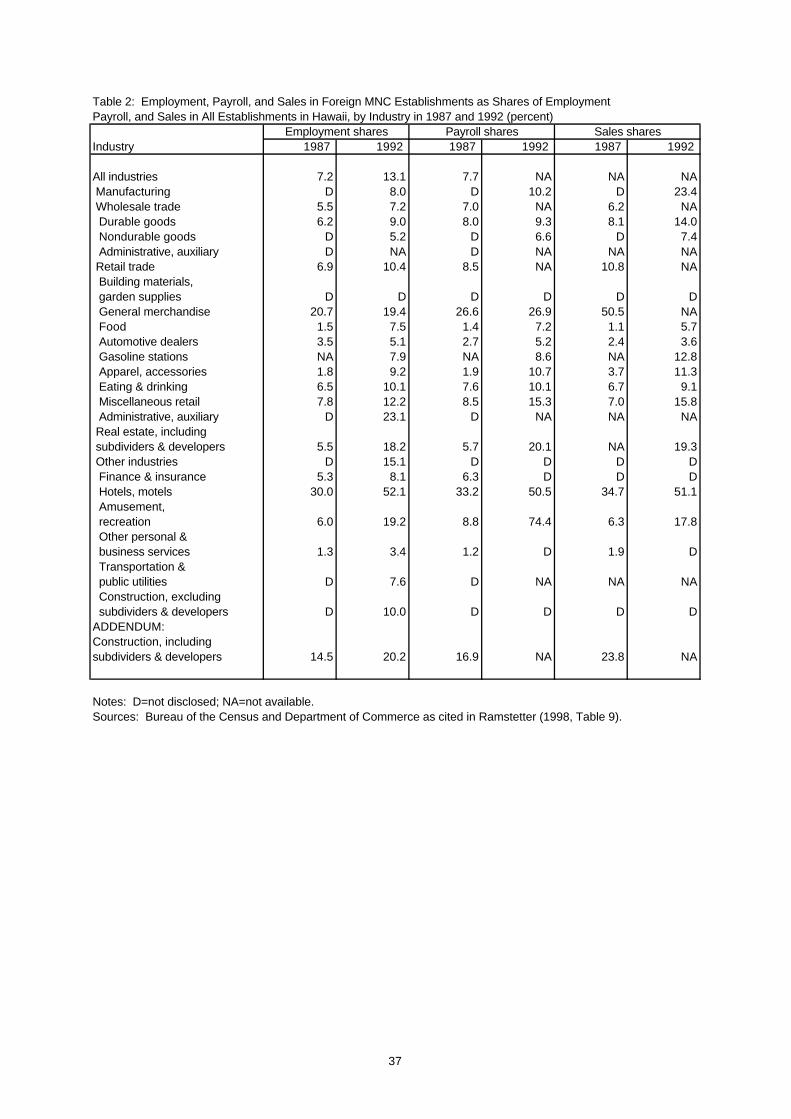
Table 2: Employment, Payroll, and Sales in Foreign MNC Establishments as Shares of EmploymentPayroll, and Sales in All Establishments in Hawaii, by Industry in 1987 and 1992 (percent)
Employment shares Payroll shares Sales sharesIndustry 1987 1992 1987 1992 1987 1992
All industries 7.2 13.1 7.7 NA NA NA Manufacturing D 8.0 D 10.2 D 23.4 Wholesale trade 5.5 7.2 7.0 NA 6.2 NA Durable goods 6.2 9.0 8.0 9.3 8.1 14.0 Nondurable goods D 5.2 D 6.6 D 7.4 Administrative, auxiliary D NA D NA NA NA Retail trade 6.9 10.4 8.5 NA 10.8 NA Building materials, garden supplies D D D D D D General merchandise 20.7 19.4 26.6 26.9 50.5 NA Food 1.5 7.5 1.4 7.2 1.1 5.7 Automotive dealers 3.5 5.1 2.7 5.2 2.4 3.6 Gasoline stations NA 7.9 NA 8.6 NA 12.8 Apparel, accessories 1.8 9.2 1.9 10.7 3.7 11.3 Eating & drinking 6.5 10.1 7.6 10.1 6.7 9.1 Miscellaneous retail 7.8 12.2 8.5 15.3 7.0 15.8 Administrative, auxiliary D 23.1 D NA NA NA Real estate, including subdividers & developers 5.5 18.2 5.7 20.1 NA 19.3 Other industries D 15.1 D D D D Finance & insurance 5.3 8.1 6.3 D D D Hotels, motels 30.0 52.1 33.2 50.5 34.7 51.1 Amusement, recreation 6.0 19.2 8.8 74.4 6.3 17.8 Other personal & business services 1.3 3.4 1.2 D 1.9 D Transportation & public utilities D 7.6 D NA NA NA Construction, excluding subdividers & developers D 10.0 D D D DADDENDUM:Construction, includingsubdividers & developers 14.5 20.2 16.9 NA 23.8 NA
Notes: D=not disclosed; NA=not available.Sources: Bureau of the Census and Department of Commerce as cited in Ramstetter (1998, Table 9).
37

Table 3: Payroll per employee and Sales per Employee in Foreign MNC Establishments and Local Establishments in Hawaii, by Industry in 1987 and 1992 (US$)
Payroll per Employee Sales per Employee1987 1992 1987 1992
Industry Foreign Local Foreign Local Foreign Local Foreign Local
All industries 18,486 17,193 24,321 NA D NA 134,886 NA Manufacturing D D 33,836 25,943 D D 540,128 153,183 Wholesale trade 26,247 20,295 31,129 NA 299,327 263,565 467,466 NA Durable goods 29,648 22,536 30,392 29,222 283,532 212,629 429,268 259,745 Nondurable goods D D 31,279 24,100 D D 580,601 397,782 Administrative, auxiliary NA NA NA NA NA NA NA NA Retail trade 12,154 9,696 16,657 NA 123,439 75,560 125,866 NA Building materials, garden supplies D D D D D D D D General merchandise 14,112 10,165 18,380 12,069 356,332 91,173 D D Food 11,510 12,345 14,469 15,314 93,323 127,775 106,958 144,395 Automotive dealers 16,699 21,826 28,522 27,914 172,988 255,150 214,711 310,419 Gasoline stations D D 15,212 13,914 D D 239,621 140,099 Apparel, accessories 9,526 9,016 13,906 11,714 161,594 77,092 128,400 101,694 Eating & drinking 8,819 7,454 10,418 10,487 30,117 29,156 33,800 38,122 Miscellaneous retail 10,767 9,806 17,939 13,831 62,212 69,923 128,058 94,774 Administrative, auxiliary NA NA 39,636 NA NA NA NA NA Real estate, including subdividers & developers 17,958 17,292 26,089 23,053 D D 130,854 121,857 Other industries D NA 26,010 NA D NA 103,713 NA Finance & insurance 26,242 22,041 32,186 D D D 646,914 D Hotels, motels 15,306 13,198 17,991 19,177 57,251 46,173 53,685 55,884 Amusement, recreation 14,878 9,842 52,117 4,259 42,233 40,093 45,126 49,432 Other personal & business services 16,289 18,506 25,457 D 70,393 48,958 65,550 D Transportation & public utilities D D 37,056 D D D 72,664 D Construction, excluding subdividers & developers D NA 41,333 NA D NA 173,436 NAADDENDUM:Construction, includingsubdividers & developers 32,727 27,291 32,305 NA 215,637 117,086 162,322 NA
Notes: D=not disclosed; NA=not available.Sources: Bureau of the Census and Department of Commerce as cited in Ramstetter (1998, Table 9).
38

Notes: 1999 figure for all MNCs is preliminary.Sources: Hawaii Business (various years); U.S. Department of Commerce, Bureau of Economic Analysis (various years a, various years b).
Figure 11: Employment of Sample of Large Foreign MNCs in Hawaii by Country of Owner andEmployment of All Foreign MNCs in Hawaii (thousands)
0
2
4
6
8
10
12
14
16
18
20
22
24
26
28
30
1983 1984 1985 1986 1987 1988 1989 1990 1991 1992 1993 1994 1995 1996 1997 1998 1999 2000
0
4
8
12
16
20
24
28
32
36
40
44
48
52
56
60
Japan Europe Canada Australia New Zealand Hong Kong Korea All foreign MNCs (right)
39

Sources: Hawaii Business (various years).
Figure 12: Employment of a Sample of Large Foreign MNCs in Hawaii by Industry of Affiliate(thousands)
0
2
4
6
8
10
12
14
16
18
20
22
24
26
28
30
1983 1984 1985 1986 1987 1988 1989 1990 1991 1992 1993 1994 1995 1996 1997 1998 1999 2000
Manufacturing Wholesale trade Retail trade Eating, drinking Hotels Travel services Finance, insurance Construction, other
40

Sources: Hawaii Business (various years).
Figure 13: Employment of a Sample of Large Japanese MNCs in Hawaii by Industry of Affiliate(thousands)
0
2
4
6
8
10
12
14
16
18
20
22
1983 1984 1985 1986 1987 1988 1989 1990 1991 1992 1993 1994 1995 1996 1997 1998 1999 2000
Manufacturing Wholesale trade Retail trade Eating, drinking Hotels Travel services Finance, insurance Construction, other
41
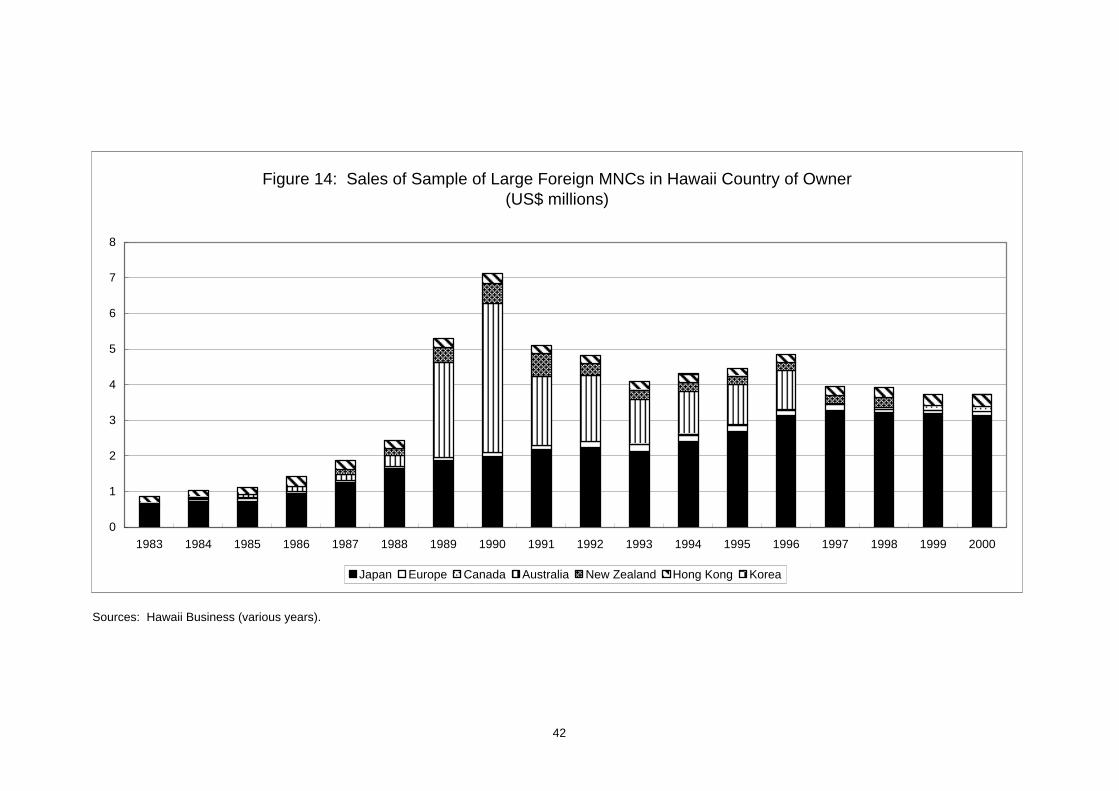
Sources: Hawaii Business (various years).
Figure 14: Sales of Sample of Large Foreign MNCs in Hawaii Country of Owner(US$ millions)
0
1
2
3
4
5
6
7
8
1983 1984 1985 1986 1987 1988 1989 1990 1991 1992 1993 1994 1995 1996 1997 1998 1999 2000
Japan Europe Canada Australia New Zealand Hong Kong Korea
42

Sources: Hawaii Business (various years).
Figure 15: Sales of a Sample of Large Foreign MNCs in Hawaii by Industry of Affiliate (US$millions)
0
1
2
3
4
5
6
7
8
1983 1984 1985 1986 1987 1988 1989 1990 1991 1992 1993 1994 1995 1996 1997 1998 1999 2000
Manufacturing Wholesale trade Retail trade Eating, drinking Hotels Travel services Finance, insurance Construction, other
43

Sources: Hawaii Business (various years).
Figure 16: Sales of a Sample of Large Japanese MNCs in Hawaii by Industry of Affiliate (US$millions)
0
0.5
1
1.5
2
2.5
3
3.5
1983 1984 1985 1986 1987 1988 1989 1990 1991 1992 1993 1994 1995 1996 1997 1998 1999 2000
Manufacturing Wholesale trade Retail trade Eating, drinking Hotels Travel services Finance, insurance Construction, other
44

Statistical Appendix Tables
A. U.S. Data on Nonbank Affiliates of Foreign Companies in Hawaii and the United StatesAppendix Table A1a: Yearend Stocks of Gross Property, Plant, and Equipment of Nonbank Affiliatesin Hawaii by Country of Ultimate Beneficial Owner (US$ millions)Appendix Table A1b: Yearend Stocks of Gross Property, Plant, and Equipment of Nonbank Affiliatesin the United States by Country of Ultimate Beneficial Owner (US$ millions)Appendix Table A1c: Yearend Stocks of Gross Property, Plant, and Equipment of Nonbank Affiliates in Hawaii by Industry of Affiliate (US$ millions)Appendix Table A1d: Yearend Stocks of Gross Property, Plant, and Equipment of Nonbank Affiliatesin the United States by Country of Ultimate Beneficial Owner (first differences of stocks, US$ millions)Appendix Table A2a: Annual Flows of Investment in Gross Property, Plant, and Equipment of Nonbank Affiliatesin Hawaii by Country of Ultimate Beneficial Owner (first differences of stocks, US$ millions)Appendix Table A2b: Annual Flows of Investment in Gross Property, Plant, and Equipment of Nonbank Affiliatesin the United States by Country of Ultimate Beneficial Owner (first differences of stocks, US$ millions)Appendix Table A2c: Annual Flows of Investment in Gross Property, Plant, and Equipment of NonbankAffiliates in Hawaii by Industry of Affiliate (first differences of yearend stocks, US$ millions)Appendix Table A2d: Annual Flows of Investment in Gross Property, Plant, and Equipment of NonbankAffiliates in the United States by Industry of Affiliate (first differences of yearend stocks, US$ millions)Appendix Table A3a: Yearend Stocks of Commercial Property of Nonbank Affiliates in Hawaii andthe United States by Country of Ultimate Beneficial Owner (US$ millions)Appendix Table A3b: Yearend Stocks of Commercial Property of Nonbank Affiliates in Hawaii andthe United States by Industry of Affiliate (US$ millions)Appendix Table A4a: Annual Flows of Investment in Commercial Property of Nonbank Affiliates in Hawaii andthe United States by Country of Ultimate Beneficial Owner (first differences of yearend stocks, US$ millions)Appendix Table A4b: Annual Investment Flows in Commercial Property of Nonbank Affiliates in Hawaii andthe United States by Industry of Affiliate (first differences of yearend stocks, US$ millions)Appendix Table A5a: Employment of Nonbank Affiliates in Hawaii by Country of Ultimate BeneficialOwner (thousands)Appendix Table A5b: Employment of Nonbank Affiliates in the United States by Country of Ultimate BeneficialOwner (number)Appendix Table A5c: Employment of Nonbank Affiliates in Hawaii by Industry of Affiliate(thousands)Appendix Table A5d: Employment of Nonbank Affiliates in the United States by Industry of Affiliate(thousands)Table A6a: The Number of Nonbank Affiliates in Hawaii by Size ClassTable A6b: The Number of Nonbank Affiliates in the United States by Size Class
Appendix B: Data on Large Multinationals in Hawaii based on Hawaii Business' Top 250Table B1: Number of Employees in a Sample of Large Foreign Multinationals in Hawaii by Country of Owner and Industry of OperationTable B2: Sales of a Sample of Large Foreign Multinationals in Hawaii by Country of Owner and Industry of Operation (US$ millions)Table B3: The Number of Firms in a Sample of Large Foreign Multinationals in Hawaii by Country of Owner and Industry of Operation
Appendix C: Data on Japanese Multinationals in Hawaii from Toyo KeizaiAppendix Table C1: Equity Stocks in Toyo Keizai's Sample of Japanese Affiliates at YearendAppendix Table C2: Employment in Toyo Keizai's Sample of Japanese Affiliates at Yearend
45
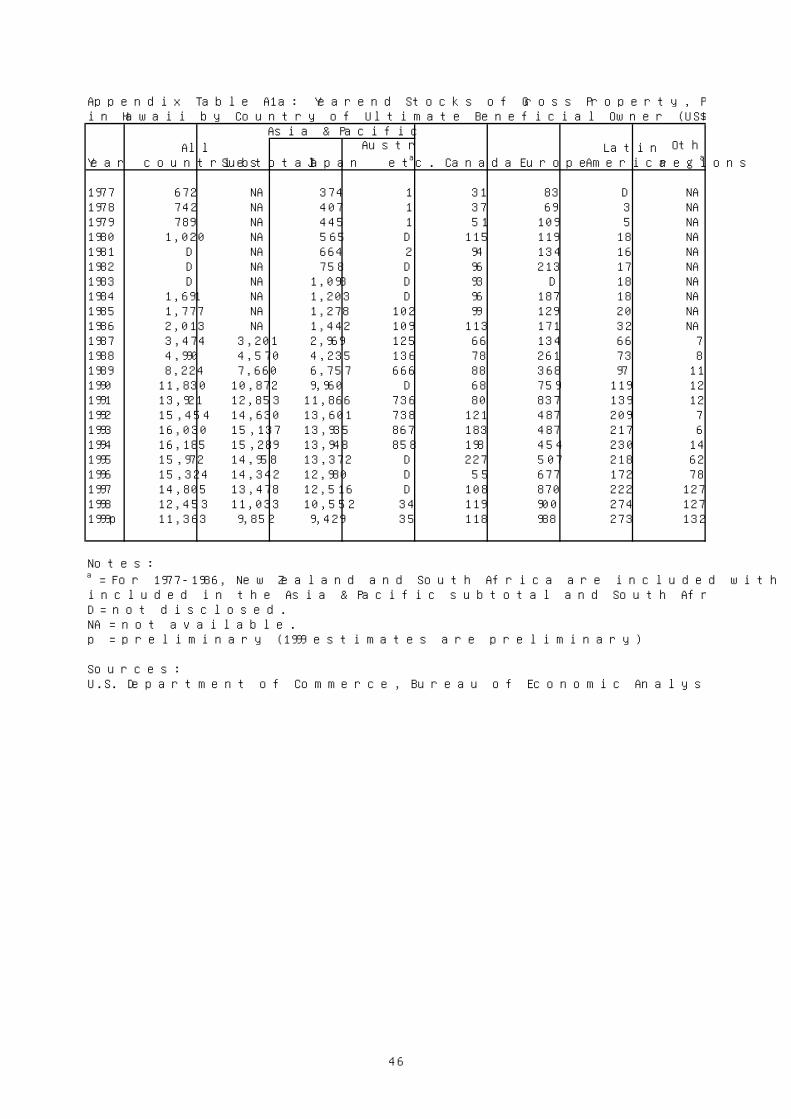
Appendix Table A1a: Yearend Stocks of Gross Property, Plant, and Equipment of Nonbank Affiliatesin Hawaii by Country of Ultimate Beneficial Owner (US$ millions)
Asia & Pacific
YearAll
countries Subtotal Japan
Australia,
etc.a Canada EuropeLatin
America
Other
regionsa
1977 672 NA 374 1 31 83 D NA1978 742 NA 407 1 37 69 3 NA1979 789 NA 445 1 51 109 5 NA1980 1,020 NA 565 D 115 119 18 NA1981 D NA 664 2 94 134 16 NA1982 D NA 758 D 96 213 17 NA1983 D NA 1,098 D 93 D 18 NA1984 1,691 NA 1,203 D 96 187 18 NA1985 1,777 NA 1,278 102 99 129 20 NA1986 2,013 NA 1,442 109 113 171 32 NA1987 3,474 3,201 2,969 125 66 134 66 71988 4,990 4,570 4,235 136 78 261 73 81989 8,224 7,660 6,757 666 88 368 97 111990 11,830 10,872 9,960 D 68 759 119 121991 13,921 12,853 11,866 736 80 837 139 121992 15,454 14,630 13,601 738 121 487 209 71993 16,030 15,137 13,935 867 183 487 217 61994 16,185 15,289 13,948 858 198 454 230 141995 15,972 14,958 13,372 D 227 507 218 621996 15,324 14,342 12,980 D 55 677 172 781997 14,805 13,478 12,516 D 108 870 222 1271998 12,453 11,033 10,552 34 119 900 274 1271999p 11,363 9,852 9,429 35 118 988 273 132
Notes:a = For 1977-1986, New Zealand and South Africa are included with Australia; for 1987-1999, New Zealand isincluded in the Asia & Pacific subtotal and South Africa is included in Other regions.D = not disclosed.NA = not available.p = preliminary (1999 estimates are preliminary)
Sources:U.S. Department of Commerce, Bureau of Economic Analysis (various years a, various years b).
46

Appendix Table A1b: Yearend Stocks of Gross Property, Plant, and Equipment of Nonbank Affiliatesin the United States by Country of Ultimate Beneficial Owner (US$ millions)
Asia & Pacific
YearAll
countries Subtotal Japan
Australia,
etc.a Canada EuropeLatin
America
Other
regionsa
1977 66,785 NA 2,691 552 11,582 48,225 2,429 NA1978 80,633 NA 3,484 833 14,072 57,947 2,397 NA1979 101,209 NA 4,401 1,032 16,830 73,556 2,896 NA1980 127,838 NA 5,287 1,268 23,141 90,283 4,094 NA1981 187,956 NA 6,803 3,073 47,968 117,783 5,571 NA1982 225,235 NA 8,666 3,850 57,360 137,625 6,983 NA1983 244,012 NA 10,892 4,407 61,928 144,516 8,710 NA1984 269,462 NA 15,508 5,667 64,824 156,865 9,669 NA1985 295,181 NA 18,438 7,169 67,984 173,263 10,132 NA1986 320,215 NA 22,964 10,174 72,757 178,453 11,233 NA1987 353,278 49,735 32,950 9,750 74,118 196,200 10,440 22,7851988 418,069 66,271 48,603 10,994 89,976 224,229 10,916 26,6771989 489,461 98,785 70,931 17,514 99,616 252,431 14,488 24,1411990 578,355 133,535 98,891 21,612 105,890 294,386 16,687 27,8571991 640,140 154,138 119,231 21,055 108,255 328,001 17,884 31,8621992 660,826 164,204 134,784 13,803 95,955 345,805 19,544 35,3181993 705,665 174,106 143,770 13,648 103,492 368,499 21,428 38,1401994 754,383 186,976 156,203 11,920 105,913 393,848 24,629 43,0171995 769,491 198,582 164,716 12,210 83,683 416,193 25,341 45,6921996 825,695 214,540 171,936 17,292 76,344 455,939 27,323 51,5491997 877,568 238,107 187,539 18,269 83,410 476,228 26,470 53,3531998 990,332 245,173 195,770 17,159 94,817 567,748 33,148 49,4461999p 1,069,209 243,584 193,203 18,219 102,411 634,501 44,437 44,276
Notes:a = For 1977-1986, New Zealand and South Africa are included with Australia; for 1987-1999, New Zealand isincluded in the Asia & Pacific subtotal and South Africa is included in Other regions.D = not disclosed.NA = not available.p = preliminary (1999 estimates are preliminary)
Sources:U.S. Department of Commerce, Bureau of Economic Analysis (various years a, various years b).
47

Appendix Table A1c: Yearend Stocks of Gross Property, Plant, and Equipment of Nonbank Affiliates in Hawaii by Industry of Affiliate (US$ millions)
Other industriesa,b,c
YearAll
industries
Manufac-
turingaWholesale
trade
Retail
tradeb
Real
estatec SubtotalFinance &insurance
Informa-tion &
profes-sional
services
1977 672 8 5 54 233 372 1 NA1978 742 12 8 57 246 419 2 NA1979 789 14 7 65 256 447 2 NA1980 1,020 D 17 52 431 D D NA1981 D 24 D D 494 D 3 NA1982 D 38 24 80 584 D D NA1983 D 40 28 253 558 D 11 NA1984 1,691 73 56 274 605 683 6 NA1985 1,777 103 60 281 584 749 5 NA1986 2,013 157 61 280 713 802 5 NA1987 3,474 129 44 297 991 2,013 D NA1988 4,990 201 91 322 1,739 2,637 11 NA1989 8,224 247 179 340 2,380 5,078 25 NA1990 11,830 368 189 490 3,868 6,915 32 NA1991 13,921 386 212 535 4,069 8,719 95 NA1992 15,454 290 D 564 5,075 D 239 NA1993 16,030 296 258 570 4,907 9,999 D NA1994 16,185 308 257 597 4,615 10,408 324 NA1995 15,972 319 168 626 4,374 10,485 D NA1996 15,324 279 181 739 4,167 9,958 D NA1997 14,805 228 203 705 4,049 9,620 199 1481998 12,453 336 184 810 3,312 7,811 76 1791999p 11,363 299 177 939 3,113 6,835 58 240
Notes:a = For 1977-1996, publishing is classified under manufacturing and petroleum and coal product manufacturingis classified under other industries; for 1997-1999, publishing is classified under other industries andpetroleum and coal product manufacturing is classified under manufacturing. b = For 1977-1996, eating and drinking is included in retail trade; for 1997-1999, this industry is includedin other industries.c = For 1977-1996, rental and leasing (other than real estate) is included in other industries; for 1997-1999,this industry is included in real estate.D = not disclosed.NA = not available.p = preliminary (1999 estimates are preliminary)
Sources:U.S. Department of Commerce, Bureau of Economic Analysis (various years a, various years b).
48
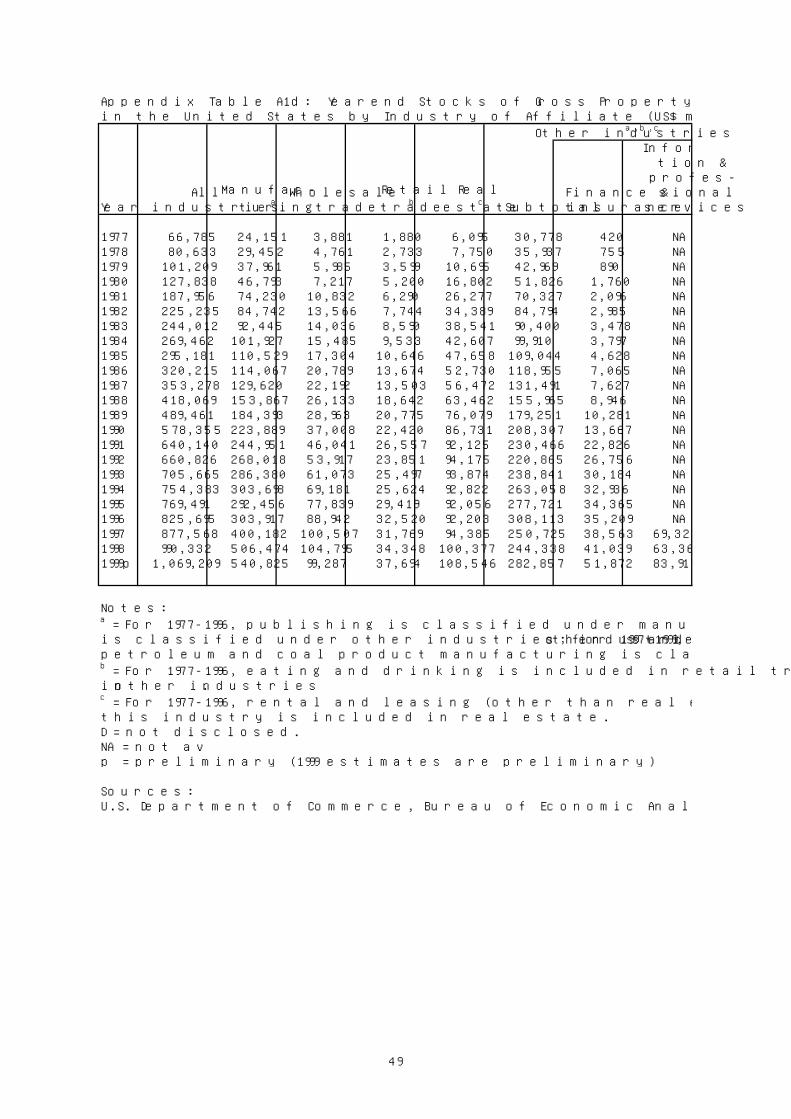
Appendix Table A1d: Yearend Stocks of Gross Property, Plant, and Equipment of Nonbank Affiliates in the United States by Industry of Affiliate (US$ millions)
Other industriesa,b,c
YearAll
industries
Manufac-
turingaWholesale
trade
Retail
tradeb
Real
estatec SubtotalFinance &insurance
Informa-tion &
profes-sional
services
1977 66,785 24,151 3,881 1,880 6,095 30,778 420 NA1978 80,633 29,452 4,761 2,733 7,750 35,937 755 NA1979 101,209 37,961 5,985 3,599 10,695 42,969 890 NA1980 127,838 46,793 7,217 5,200 16,802 51,826 1,760 NA1981 187,956 74,230 10,832 6,290 26,277 70,327 2,096 NA1982 225,235 84,742 13,566 7,744 34,389 84,794 2,985 NA1983 244,012 92,445 14,036 8,590 38,541 90,400 3,478 NA1984 269,462 101,927 15,485 9,533 42,607 99,910 3,797 NA1985 295,181 110,529 17,304 10,646 47,658 109,044 4,628 NA1986 320,215 114,067 20,789 13,674 52,730 118,955 7,065 NA1987 353,278 129,620 22,192 13,503 56,472 131,491 7,627 NA1988 418,069 153,867 26,133 18,642 63,462 155,965 8,946 NA1989 489,461 184,393 28,963 20,775 76,079 179,251 10,281 NA1990 578,355 223,889 37,008 22,420 86,731 208,307 13,667 NA1991 640,140 244,951 46,041 26,557 92,125 230,466 22,826 NA1992 660,826 268,018 53,917 23,851 94,175 220,865 26,756 NA1993 705,665 286,380 61,073 25,497 93,874 238,841 30,184 NA1994 754,383 303,698 69,181 25,624 92,822 263,058 32,936 NA1995 769,491 292,456 77,839 29,419 92,056 277,721 34,365 NA1996 825,695 303,917 88,942 32,520 92,203 308,113 35,209 NA1997 877,568 400,182 100,507 31,769 94,385 250,725 38,563 69,3221998 990,332 506,474 104,795 34,348 100,377 244,338 41,039 63,3611999p 1,069,209 540,825 99,287 37,694 108,546 282,857 51,872 83,917
Notes:a = For 1977-1996, publishing is classified under manufacturing and petroleum and coal product manufacturingis classified under other industries; for 1997-1999, publishing is classified under other industries andpetroleum and coal product manufacturing is classified under manufacturing. b = For 1977-1996, eating and drinking is included in retail trade; for 1997-1999, this industry is includedin other industries.c = For 1977-1996, rental and leasing (other than real estate) is included in other industries; for 1997-1999,this industry is included in real estate.D = not disclosed.NA = not available.p = preliminary (1999 estimates are preliminary)
Sources:U.S. Department of Commerce, Bureau of Economic Analysis (various years a, various years b).
49

Appendix Table A2a: Annual Flows of Investment in Gross Property, Plant, and Equipment of Nonbank Affiliatesin Hawaii by Country of Ultimate Beneficial Owner (first differences of stocks, US$ millions)
Asia & Pacific
YearAll
countries Subtotal Japan Australiaa Canada EuropeLatin
America
Other
regionsa
1978 70 NA 33 0 6 -14 D NA1979 47 NA 38 0 14 40 2 NA1980 231 NA 120 D 64 10 13 NA1981 D NA 99 D -21 15 -2 NA1982 D NA 94 D 2 79 1 NA1983 D NA 340 D -3 D 1 NA1984 D NA 105 D 3 D 0 NA1985 86 NA 75 D 3 -58 2 NA1986 236 NA 164 7 14 42 12 NA1987 1,461 NA 1,527 16 -47 -37 34 NA1988 1,516 1,369 1,266 11 12 127 7 11989 3,234 3,090 2,522 530 10 107 24 31990 3,606 3,212 3,203 D -20 391 22 11991 2,091 1,981 1,906 D 12 78 20 01992 1,533 1,777 1,735 2 41 -350 70 -51993 576 507 334 129 62 0 8 -11994 155 152 13 -9 15 -33 13 81995 -213 -331 -576 D 29 53 -12 481996 -648 -616 -392 D -172 170 -46 161997 -519 -864 -464 D 53 193 50 491998 -2,352 -2,445 -1,964 D 11 30 52 01999p -1,090 -1,181 -1,123 1 -1 88 -1 5
Notes:a = For 1977-1986, New Zealand and South Africa are included with Australia; for 1987-1999, New Zealand isincluded in the Asia & Pacific subtotal and South Africa is included in Other regions.D = not disclosed.NA = not available.p = preliminary (1999 estimates are preliminary)
Sources:U.S. Department of Commerce, Bureau of Economic Analysis (various years a, various years b).
50
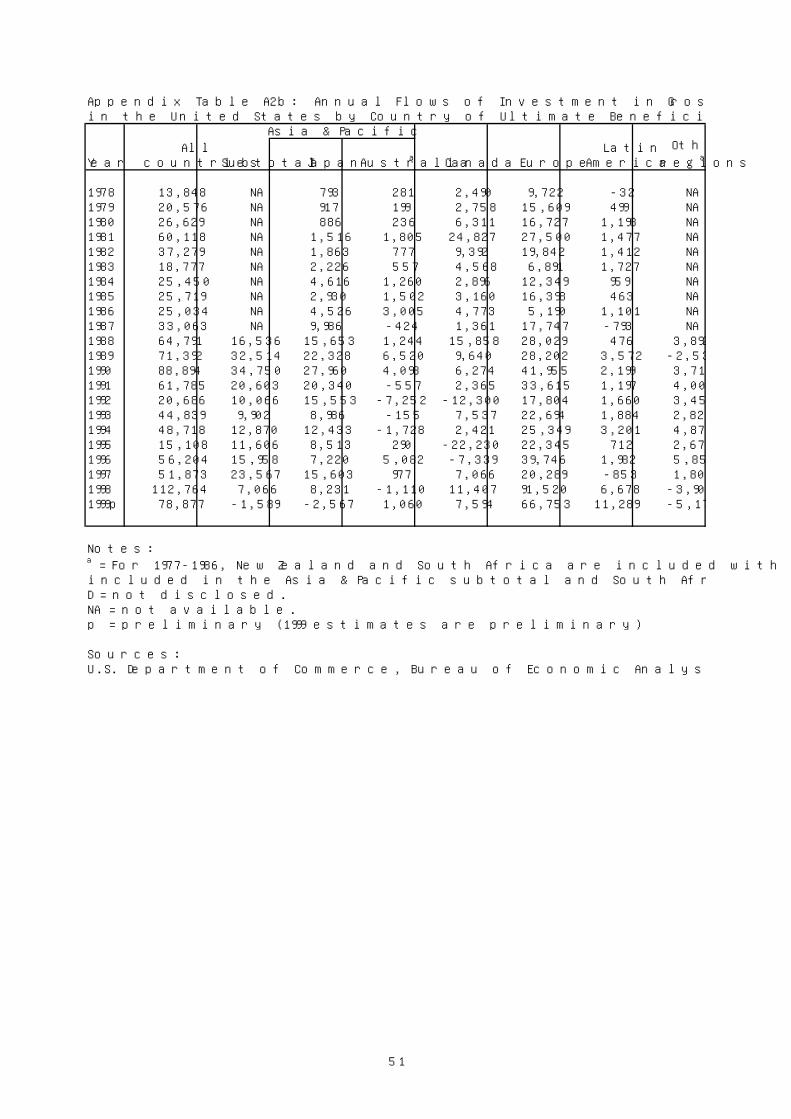
Appendix Table A2b: Annual Flows of Investment in Gross Property, Plant, and Equipment of Nonbank Affiliatesin the United States by Country of Ultimate Beneficial Owner (first differences of stocks, US$ millions)
Asia & Pacific
YearAll
countries Subtotal Japan Australiaa Canada EuropeLatin
America
Other
regionsa
1978 13,848 NA 793 281 2,490 9,722 -32 NA1979 20,576 NA 917 199 2,758 15,609 499 NA1980 26,629 NA 886 236 6,311 16,727 1,198 NA1981 60,118 NA 1,516 1,805 24,827 27,500 1,477 NA1982 37,279 NA 1,863 777 9,392 19,842 1,412 NA1983 18,777 NA 2,226 557 4,568 6,891 1,727 NA1984 25,450 NA 4,616 1,260 2,896 12,349 959 NA1985 25,719 NA 2,930 1,502 3,160 16,398 463 NA1986 25,034 NA 4,526 3,005 4,773 5,190 1,101 NA1987 33,063 NA 9,986 -424 1,361 17,747 -793 NA1988 64,791 16,536 15,653 1,244 15,858 28,029 476 3,8921989 71,392 32,514 22,328 6,520 9,640 28,202 3,572 -2,5361990 88,894 34,750 27,960 4,098 6,274 41,955 2,199 3,7161991 61,785 20,603 20,340 -557 2,365 33,615 1,197 4,0051992 20,686 10,066 15,553 -7,252 -12,300 17,804 1,660 3,4561993 44,839 9,902 8,986 -155 7,537 22,694 1,884 2,8221994 48,718 12,870 12,433 -1,728 2,421 25,349 3,201 4,8771995 15,108 11,606 8,513 290 -22,230 22,345 712 2,6751996 56,204 15,958 7,220 5,082 -7,339 39,746 1,982 5,8571997 51,873 23,567 15,603 977 7,066 20,289 -853 1,8041998 112,764 7,066 8,231 -1,110 11,407 91,520 6,678 -3,9071999p 78,877 -1,589 -2,567 1,060 7,594 66,753 11,289 -5,170
Notes:a = For 1977-1986, New Zealand and South Africa are included with Australia; for 1987-1999, New Zealand isincluded in the Asia & Pacific subtotal and South Africa is included in Other regions.D = not disclosed.NA = not available.p = preliminary (1999 estimates are preliminary)
Sources:U.S. Department of Commerce, Bureau of Economic Analysis (various years a, various years b).
51

Appendix Table A2c: Annual Flows of Investment in Gross Property, Plant, and Equipment of NonbankAffiliates in Hawaii by Industry of Affiliate (first differences of yearend stocks, US$ millions)
Other industriesa,b,c
YearAll
industries
Manufac-
turingaWholesale
trade
Retail
tradeb
Real
estatec SubtotalFinance &insurance
Informa-tion &
profes-sional
services
1978 70 4 3 3 13 47 1 NA1979 47 2 -1 8 10 28 0 NA1980 231 D 10 -13 175 D D NA1981 D D D D 63 D D NA1982 D 14 D D 90 D D NA1983 D 2 4 173 -26 D D NA1984 D 33 28 21 47 D -5 NA1985 86 30 4 7 -21 66 -1 NA1986 236 54 1 -1 129 53 0 NA1987 1,461 -28 -17 17 278 1,211 D NA1988 1,516 72 47 25 748 624 D NA1989 3,234 46 88 18 641 2,441 14 NA1990 3,606 121 10 150 1,488 1,837 7 NA1991 2,091 18 23 45 201 1,804 63 NA1992 1,533 -96 D 29 1,006 D 144 NA1993 576 6 D 6 -168 D D NA1994 155 12 -1 27 -292 409 D NA1995 -213 11 -89 29 -241 77 D NA1996 -648 -40 13 113 -207 -527 D NA1997 -519 -51 22 -34 -118 -338 D NA1998 -2,352 108 -19 105 -737 -1,809 -123 761999p -1,090 -37 -7 129 -199 -976 -18 58
Notes:a = For 1977-1996, publishing is classified under manufacturing and petroleum and coal product manufacturingis classified under other industries; for 1997-1999, publishing is classified under other industries andpetroleum and coal product manufacturing is classified under manufacturing. b = For 1977-1996, eating and drinking is included in retail trade; for 1997-1999, this industry is includedin other industries.c = For 1977-1996, rental and leasing (other than real estate) is included in other industries; for 1997-1999,this industry is included in real estate.D = not disclosed.NA = not available.p = preliminary (1999 estimates are preliminary)
Sources:U.S. Department of Commerce, Bureau of Economic Analysis (various years a, various years b).
52

Appendix Table A2d: Annual Flows of Investment in Gross Property, Plant, and Equipment of NonbankAffiliates in the United States by Industry of Affiliate (first differences of yearend stocks, US$ millions)
Other industriesa,b,c
YearAll
industries
Manufac-
turingaWholesale
trade
Retail
tradeb
Real
estatec SubtotalFinance &insurance
Informa-tion &
profes-sional
services
1978 13,848 5,301 880 853 1,655 5,159 335 NA1979 20,576 8,509 1,224 866 2,945 7,032 135 NA1980 26,629 8,832 1,232 1,601 6,107 8,857 870 NA1981 60,118 27,437 3,615 1,090 9,475 18,501 336 NA1982 37,279 10,512 2,734 1,454 8,112 14,467 889 NA1983 18,777 7,703 470 846 4,152 5,606 493 NA1984 25,450 9,482 1,449 943 4,066 9,510 319 NA1985 25,719 8,602 1,819 1,113 5,051 9,134 831 NA1986 25,034 3,538 3,485 3,028 5,072 9,911 2,437 NA1987 33,063 15,553 1,403 -171 3,742 12,536 562 NA1988 64,791 24,247 3,941 5,139 6,990 24,474 1,319 NA1989 71,392 30,526 2,830 2,133 12,617 23,286 1,335 NA1990 88,894 39,496 8,045 1,645 10,652 29,056 3,386 NA1991 61,785 21,062 9,033 4,137 5,394 22,159 9,159 NA1992 20,686 23,067 7,876 -2,706 2,050 -9,601 3,930 NA1993 44,839 18,362 7,156 1,646 -301 17,976 3,428 NA1994 48,718 17,318 8,108 127 -1,052 24,217 2,752 NA1995 15,108 -11,242 8,658 3,795 -766 14,663 1,429 NA1996 56,204 11,461 11,103 3,101 147 30,392 844 NA1997 51,873 96,265 11,565 -751 2,182 -57,388 3,354 NA1998 112,764 106,292 4,288 2,579 5,992 -6,387 2,476 -5,9611999p 78,877 34,351 -5,508 3,346 8,169 38,519 10,833 20,556
Notes:a = For 1977-1996, publishing is classified under manufacturing and petroleum and coal product manufacturingis classified under other industries; for 1997-1999, publishing is classified under other industries andpetroleum and coal product manufacturing is classified under manufacturing. b = For 1977-1996, eating and drinking is included in retail trade; for 1997-1999, this industry is includedin other industries.c = For 1977-1996, rental and leasing (other than real estate) is included in other industries; for 1997-1999,this industry is included in real estate.D = not disclosed.NA = not available.p = preliminary (1999 estimates are preliminary)
Sources:U.S. Department of Commerce, Bureau of Economic Analysis (various years a, various years b).
53

Appendix Table A3a: Yearend Stocks of Commercial Property of Nonbank Affiliates in Hawaii andthe United States by Country of Ultimate Beneficial Owner (US$ millions)
Asia & Pacific
YearAll
countries Subtotal Japan Australia Canada EuropeLatin
AmericaOther
regions
HAWAII1987 2,848 2,703 2,564 57 32 75 36 21988 3,316 3,111 2,900 55 34 96 71 41989 5,169 4,885 4,642 55 49 142 88 51990 8,599 8,131 7,924 22 31 367 D D1991 9,923 9,427 9,221 23 32 388 D D1992 10,939 10,451 10,206 23 D 275 D D1993 10,828 10,447 10,182 23 D 251 109 D1994 11,210 10,805 10,421 19 D 283 D D1995 10,861 10,422 10,057 20 D 311 88 D1996 10,546 10,110 9,744 27 D 314 82 D1997 10,750 10,133 9,659 D 36 463 110 81998 9,213 8,536 8,186 26 5 497 168 71999p 8,343 7,738 7,435 26 5 428 158 14
UNITED STATES1987 89,919 19,596 14,096 2,101 22,509 35,339 3,385 9,0901988 104,048 25,084 18,695 2,818 23,472 40,745 3,504 11,2431989 124,839 36,790 30,033 2,795 27,239 44,538 4,650 11,6221990 146,520 49,323 40,995 2,386 29,936 51,212 4,480 11,5691991 165,759 56,355 47,828 1,966 29,657 61,442 4,672 13,6331992 172,613 61,624 52,140 1,980 23,597 67,790 5,025 14,5771993 173,867 61,438 52,062 1,815 22,304 70,065 5,150 14,9101994 173,118 62,712 52,230 2,232 21,220 67,875 6,078 15,2331995 168,393 62,025 51,421 2,423 20,181 65,402 5,828 14,9571996 167,577 59,030 45,853 3,620 18,582 67,148 5,744 17,0731997 170,271 60,485 47,194 4,244 21,452 68,519 5,075 14,7401998 180,351 58,046 44,393 5,020 21,465 86,154 5,860 8,8261999p 181,198 55,922 41,468 5,277 24,515 85,729 6,656 8,376
Notes:D = not disclosed.p = preliminary (1999 estimates are preliminary)
Sources:U.S. Department of Commerce, Bureau of Economic Analysis (various years a, various years b).
54

Appendix Table A3b: Yearend Stocks of Commercial Property of Nonbank Affiliates in Hawaii andthe United States by Industry of Affiliate (US$ millions)
Other industriesa,b,c
YearAll
industries
Manufac-
turingaWholesale
trade
Retail
tradeb
Real
estatec SubtotalFinance &insurance
Informa-tion &
profes-sional
services
HAWAII1987 2,848 24 33 274 676 1,841 D NA1988 3,316 17 70 301 1,271 1,657 0 NA1989 5,169 17 115 318 1,777 2,942 D NA1990 8,599 16 125 377 3,117 4,964 D NA1991 9,923 11 139 393 3,247 6,133 D NA1992 10,939 57 101 419 3,425 6,937 209 NA1993 10,828 22 102 415 3,482 6,807 235 NA1994 11,210 23 81 434 3,331 7,341 198 NA1995 10,861 D 45 436 3,065 D 148 NA1996 10,546 28 51 483 2,668 7,316 115 NA1997 10,750 37 59 367 3,095 7,192 131 51998 9,213 110 82 478 2,521 6,022 0 51999p 8,343 33 75 536 2,436 5,263 0 9
UNITED STATES1987 89,919 7,683 5,850 7,578 49,760 19,048 3,342 NA1988 104,048 9,560 5,854 10,307 56,563 21,764 3,638 NA1989 124,839 11,256 5,902 11,424 69,080 27,177 4,371 NA1990 146,520 8,860 7,211 13,562 80,285 36,602 4,246 NA1991 165,759 8,963 8,234 16,171 84,862 47,529 11,046 NA1992 172,613 9,795 9,719 14,314 86,357 52,428 12,470 NA1993 173,867 11,386 9,381 15,202 86,005 51,893 13,483 NA1994 173,118 11,125 8,010 15,789 84,885 53,309 13,160 NA1995 168,393 9,528 7,637 15,508 83,751 51,969 12,177 NA1996 167,577 8,677 8,857 16,900 80,207 52,936 10,324 NA1997 170,271 16,464 8,196 16,879 80,108 48,624 10,288 3,5821998 180,351 29,496 8,720 17,746 85,101 39,288 9,288 3,4101999p 181,198 24,230 9,124 16,716 89,970 41,158 9,009 5,364
Notes:a = For 1987-1996, publishing is classified under manufacturing and petroleum and coal product manufacturingis classified under other industries; for 1997-1999, publishing is classified under other industries andpetroleum and coal product manufacturing is classified under manufacturing. b = For 1987-1996, eating and drinking is included in retail trade; for 1997-1999, this industry is includedin other industries.c = For 1987-1996, rental and leasing (other than real estate) is included in other industries; for 1997-1999,this industry is included in real estate.D = not disclosed. NA = not available. p = preliminary (1999 estimates are preliminary)
Sources:U.S. Department of Commerce, Bureau of Economic Analysis (various years a, various years b).
55

Appendix Table A4a: Annual Flows of Investment in Commercial Property of Nonbank Affiliates in Hawaii andthe United States by Country of Ultimate Beneficial Owner (first differences of yearend stocks, US$ millions)
Asia & Pacific
YearAll
countries Subtotal Japan Australia Canada EuropeLatin
AmericaOther
regions
HAWAII1988 468 408 336 -2 2 21 35 21989 1,853 1,774 1,742 0 15 46 17 11990 3,430 3,246 3,282 -33 -18 225 D D1991 1,324 1,296 1,297 1 1 21 D D1992 1,016 1,024 985 0 D -113 D D1993 -111 -4 -24 0 D -24 D D1994 382 358 239 -4 D 32 D D1995 -349 -383 -364 1 D 28 D D1996 -315 -312 -313 7 D 3 -6 D1997 204 23 -85 D D 149 28 D1998 -1,537 -1,597 -1,473 D -31 34 58 -11999p -870 -798 -751 0 0 -69 -10 7
UNITED STATES1988 14,129 5,488 4,599 717 963 5,406 119 2,1531989 20,791 11,706 11,338 -23 3,767 3,793 1,146 3791990 21,681 12,533 10,962 -409 2,697 6,674 -170 -531991 19,239 7,032 6,833 -420 -279 10,230 192 2,0641992 6,854 5,269 4,312 14 -6,060 6,348 353 9441993 1,254 -186 -78 -165 -1,293 2,275 125 3331994 -749 1,274 168 417 -1,084 -2,190 928 3231995 -4,725 -687 -809 191 -1,039 -2,473 -250 -2761996 -816 -2,995 -5,568 1,197 -1,599 1,746 -84 2,1161997 2,694 1,455 1,341 624 2,870 1,371 -669 -2,3331998 10,080 -2,439 -2,801 776 13 17,635 785 -5,9141999p 847 -2,124 -2,925 257 3,050 -425 796 -450
Notes:D = not disclosed.NA = not available.p = preliminary (1999 estimates are preliminary)
Sources:U.S. Department of Commerce, Bureau of Economic Analysis (various years a, various years b).
56
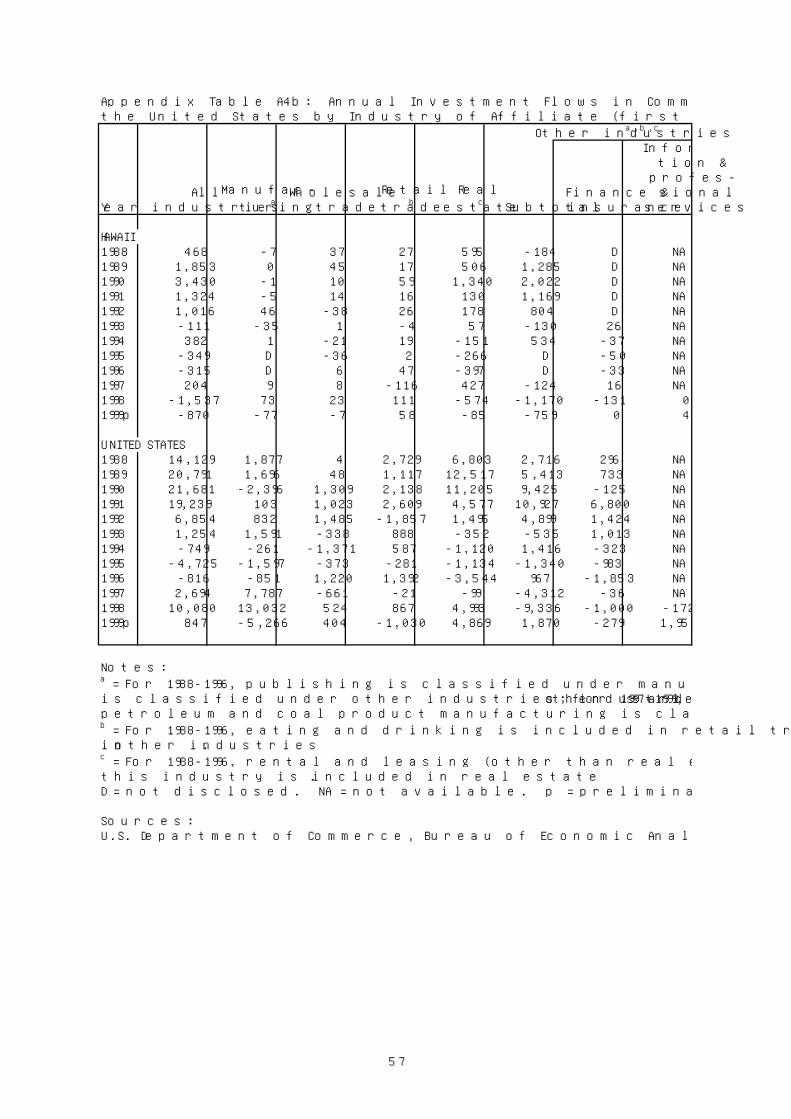
Appendix Table A4b: Annual Investment Flows in Commercial Property of Nonbank Affiliates in Hawaii andthe United States by Industry of Affiliate (first differences of yearend stocks, US$ millions)
Other industriesa,b,c
YearAll
industries
Manufac-
turingaWholesale
trade
Retail
tradeb
Real
estatec SubtotalFinance &insurance
Informa-tion &
profes-sional
services
HAWAII1988 468 -7 37 27 595 -184 D NA1989 1,853 0 45 17 506 1,285 D NA1990 3,430 -1 10 59 1,340 2,022 D NA1991 1,324 -5 14 16 130 1,169 D NA1992 1,016 46 -38 26 178 804 D NA1993 -111 -35 1 -4 57 -130 26 NA1994 382 1 -21 19 -151 534 -37 NA1995 -349 D -36 2 -266 D -50 NA1996 -315 D 6 47 -397 D -33 NA1997 204 9 8 -116 427 -124 16 NA1998 -1,537 73 23 111 -574 -1,170 -131 01999p -870 -77 -7 58 -85 -759 0 4
UNITED STATES1988 14,129 1,877 4 2,729 6,803 2,716 296 NA1989 20,791 1,696 48 1,117 12,517 5,413 733 NA1990 21,681 -2,396 1,309 2,138 11,205 9,425 -125 NA1991 19,239 103 1,023 2,609 4,577 10,927 6,800 NA1992 6,854 832 1,485 -1,857 1,495 4,899 1,424 NA1993 1,254 1,591 -338 888 -352 -535 1,013 NA1994 -749 -261 -1,371 587 -1,120 1,416 -323 NA1995 -4,725 -1,597 -373 -281 -1,134 -1,340 -983 NA1996 -816 -851 1,220 1,392 -3,544 967 -1,853 NA1997 2,694 7,787 -661 -21 -99 -4,312 -36 NA1998 10,080 13,032 524 867 4,993 -9,336 -1,000 -1721999p 847 -5,266 404 -1,030 4,869 1,870 -279 1,954
Notes:a = For 1988-1996, publishing is classified under manufacturing and petroleum and coal product manufacturingis classified under other industries; for 1997-1999, publishing is classified under other industries andpetroleum and coal product manufacturing is classified under manufacturing. b = For 1988-1996, eating and drinking is included in retail trade; for 1997-1999, this industry is includedin other industries.c = For 1988-1996, rental and leasing (other than real estate) is included in other industries; for 1997-1999,this industry is included in real estate.D = not disclosed. NA = not available. p = preliminary (1999 estimates are preliminary).
Sources:U.S. Department of Commerce, Bureau of Economic Analysis (various years a, various years b).
57

Appendix Table A5a: Employment of Nonbank Affiliates in Hawaii by Country of Ultimate BeneficialOwner (thousands)
Asia & Pacific
YearAll
countries Subtotal Japan Australiaa Canada EuropeLatin
America
Other
regionsa
1977 11.4 NA 7.3 0.1 0.3 0.5 D NA1978 11.9 NA 7.2 D 0.4 0.8 D NA1979 14.7 NA 8.6 D 0.6 1.3 D NA1980 15.5 NA 9.0 D 0.7 1.5 D NA1981 17.0 NA 9.1 D 0.7 1.6 1.1 NA1982 16.4 NA 9.3 0.4 0.6 2.2 D NA1983 16.3 NA 9.7 D 0.6 1.7 0.7 NA1984 16.5 NA 9.8 D 0.5 2.2 0.8 NA1985 18.7 NA 11.7 D 0.5 1.6 0.8 NA1986 18.4 NA 10.9 1.1 0.7 1.8 2.1 NA1987 27.3 22.8 20.6 1.4 0.7 1.0 D D1988 34.8 27.2 24.3 1.5 0.8 3.2 3.5 0.11989 45.0 36.1 30.3 2.6 0.8 4.0 3.7 0.41990 53.0 42.3 36.0 2.7 0.7 6.2 3.6 0.21991 56.0 44.8 38.3 3.2 0.7 6.1 4.0 0.41992 53.8 42.1 36.5 3.3 0.5 6.5 4.0 0.71993 52.4 43.1 37.5 3.5 1.5 3.6 4.0 0.21994 50.8 40.4 37.0 1.4 1.4 4.0 4.7 0.31995 48.9 37.7 34.3 1.7 1.6 4.3 4.6 0.71996 47.5 36.0 32.6 1.5 0.9 6.8 2.9 0.91997 50.2 37.5 34.0 1.0-2.499 1.5 7.0 2.9 1.31998 43.4 31.4 30.0 0.0 1.1 6.2 3.7 1.01999p 44.4 31.4 29.8 0.0 0.9 7.3 3.7 1.1
Notes:a = For 1977-1986, New Zealand and South Africa are included with Australia; for 1987-1999, New Zealand isincluded in the Asia & Pacific subtotal and South Africa is included in Other regions.D = not disclosed.NA = not available.p = preliminary (1999 estimates are preliminary)
Sources:U.S. Department of Commerce, Bureau of Economic Analysis (various years a, various years b).
58

Appendix Table A5b: Employment of Nonbank Affiliates in the United States by Country of Ultimate BeneficialOwner (thousands)
Asia & Pacific
YearAll
countries Subtotal Japan Australiaa Canada EuropeLatin
America
Other
regionsa
1977 1,218.7 NA 76.2 19.6 189.3 855.6 54.5 NA1978 1,429.9 NA 89.9 21.8 221.2 1,013.4 54.7 NA1979 1,753.2 NA 105.9 28.1 255.5 1,266.0 60.1 NA1980 2,033.9 NA 115.3 29.2 290.0 1,477.1 74.5 NA1981 2,416.6 NA 138.1 49.4 437.4 1,628.4 74.7 NA1982 2,448.1 NA 139.9 53.9 455.4 1,640.4 73.7 NA1983 2,546.5 NA 164.1 53.7 473.5 1,658.0 96.0 NA1984 2,714.3 NA 190.0 63.0 507.1 1,735.6 114.7 NA1985 2,862.2 NA 212.8 73.3 527.5 1,806.0 122.1 NA1986 2,937.9 NA 220.8 91.5 609.2 1,783.2 128.0 NA1987 3,224.3 456.0 303.2 91.7 592.9 1,940.4 148.5 86.51988 3,844.2 584.4 427.1 97.6 737.9 2,301.3 119.3 101.31989 4,511.5 761.5 528.0 155.1 721.4 2,711.1 227.7 89.81990 4,734.5 890.6 629.2 166.2 739.1 2,894.6 134.5 75.71991 4,871.9 959.6 719.4 155.0 724.1 2,979.5 133.2 75.51992 4,715.4 958.4 727.6 138.3 587.5 2,894.9 129.7 144.91993 4,765.6 966.4 731.1 140.1 669.9 2,889.7 141.3 98.31994 4,840.5 923.4 744.8 70.5 661.9 2,974.0 159.1 122.11995 4,941.8 958.4 761.9 73.0 708.8 2,992.6 168.6 113.41996 5,105.0 994.7 788.8 79.6 608.9 3,196.6 146.6 158.21997 5,201.9 1,013.9 812.3 81.2 616.4 3,233.8 168.7 169.11998 5,646.1 1,032.2 837.5 83.8 665.9 3,566.6 223.2 158.21999p 6,003.3 1,018.3 834.2 84.8 665.2 3,901.1 290.7 128.0
Notes:a = For 1977-1986, New Zealand and South Africa are included with Australia; for 1987-1999, New Zealand isincluded in the Asia & Pacific subtotal and South Africa is included in Other regions.D = not disclosed.NA = not available.p = preliminary (1999 estimates are preliminary)
Sources:U.S. Department of Commerce, Bureau of Economic Analysis (various years a, various years b).
59

Appendix Table A5c: Employment of Nonbank Affiliates in Hawaii by Industry of Affiliate(thousands)
Other industriesa,b,c
YearAll
industries
Manufac-
turingaWholesale
trade
Retail
tradeb
Real
estatec SubtotalFinance &insurance
Informa-tion &
profes-sional
services
1977 11.4 0.6 0.4 2.9 0.2 7.3 0.2 NA1978 11.9 0.8 0.6 3.2 0.2 7.1 0.2 NA1979 14.7 1.3 0.7 4.0 0.3 8.4 0.2 NA1980 15.5 1.3 0.8 4.0 0.5 8.9 D NA1981 17.0 1.3 0.8 5.4 0.8 8.7 0.4 NA1982 16.4 1.9 0.7 4.2 0.7 8.9 D NA1983 16.3 1.4 0.8 4.5 0.7 8.9 0.5 NA1984 16.5 2.0 2.0 4.4 0.5 7.6 0.5 NA1985 18.7 2.0 1.8 5.0 1.0 8.9 0.5 NA1986 18.4 2.4 2.0 4.5 1.3 8.2 0.4 NA1987 27.3 1.3 1.3 5.1 0.6 19.0 1.6 NA1988 34.8 2.1 2.9 5.3 1.8 22.7 0.6 NA1989 45.0 2.3 4.0 5.3 2.0 31.4 1.2 NA1990 53.0 2.8 4.2 7.1 3.5 35.4 1.2 NA1991 56.0 2.7 4.7 D D D 1.3 NA1992 53.8 3.5 4.1 7.8 3.1 35.3 D NA1993 52.4 2.3 4.2 7.8 3.4 34.7 1.1 NA1994 50.8 2.4 3.5 7.8 2.6 34.5 1.1 NA1995 48.9 2.4 1.9 9.1 2.6 32.9 0.6-1.099 NA1996 47.5 2.2 1.5 5.0-9.999 2.2 31.601-36.6 1.0 NA1997 50.2 2.0 2.0 6.6 3.2 36.4 1.0 0.61998 43.4 2.4 1.8 6.4 1.8 31.0 1.0 0.81999p 44.4 2.6 1.7 6.6 1.7 31.8 1.0 1.0
Notes:a = For 1977-1996, publishing is classified under manufacturing and petroleum and coal product manufacturingis classified under other industries; for 1997-1999, publishing is classified under other industries andpetroleum and coal product manufacturing is classified under manufacturing. b = For 1977-1996, eating and drinking is included in retail trade; for 1997-1999, this industry is includedin other industries.c = For 1977-1996, rental and leasing (other than real estate) is included in other industries; for 1997-1999,this industry is included in real estate.D = not disclosed.NA = not available.p = preliminary (1999 estimates are preliminary)
Sources:U.S. Department of Commerce, Bureau of Economic Analysis (various years a, various years b).
60
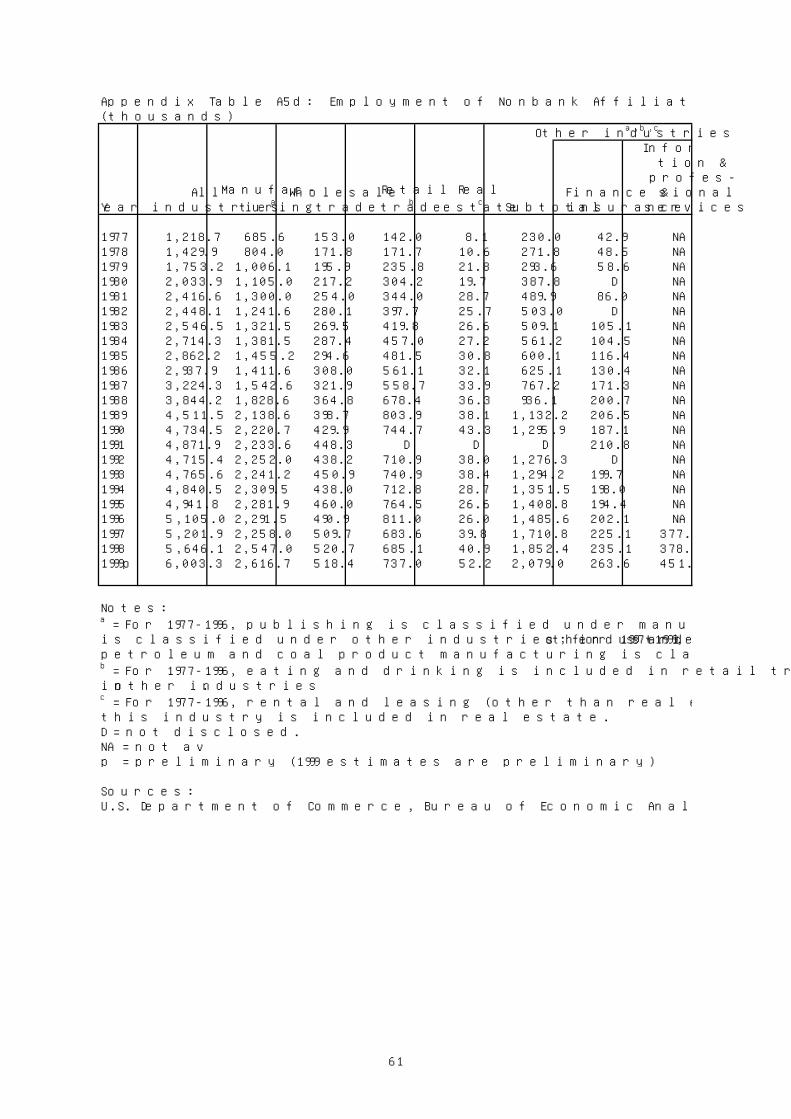
Appendix Table A5d: Employment of Nonbank Affiliates in United States by Industry of Affiliate(thousands)
Other industriesa,b,c
YearAll
industries
Manufac-
turingaWholesale
trade
Retail
tradeb
Real
estatec SubtotalFinance &insurance
Informa-tion &
profes-sional
services
1977 1,218.7 685.6 153.0 142.0 8.1 230.0 42.9 NA1978 1,429.9 804.0 171.8 171.7 10.6 271.8 48.5 NA1979 1,753.2 1,006.1 195.9 235.8 21.8 293.6 58.6 NA1980 2,033.9 1,105.0 217.2 304.2 19.7 387.8 D NA1981 2,416.6 1,300.0 254.0 344.0 28.7 489.9 86.0 NA1982 2,448.1 1,241.6 280.1 397.7 25.7 503.0 D NA1983 2,546.5 1,321.5 269.5 419.8 26.6 509.1 105.1 NA1984 2,714.3 1,381.5 287.4 457.0 27.2 561.2 104.5 NA1985 2,862.2 1,455.2 294.6 481.5 30.8 600.1 116.4 NA1986 2,937.9 1,411.6 308.0 561.1 32.1 625.1 130.4 NA1987 3,224.3 1,542.6 321.9 558.7 33.9 767.2 171.3 NA1988 3,844.2 1,828.6 364.8 678.4 36.3 936.1 200.7 NA1989 4,511.5 2,138.6 398.7 803.9 38.1 1,132.2 206.5 NA1990 4,734.5 2,220.7 429.9 744.7 43.3 1,295.9 187.1 NA1991 4,871.9 2,233.6 448.3 D D D 210.8 NA1992 4,715.4 2,252.0 438.2 710.9 38.0 1,276.3 D NA1993 4,765.6 2,241.2 450.9 740.9 38.4 1,294.2 199.7 NA1994 4,840.5 2,309.5 438.0 712.8 28.7 1,351.5 198.0 NA1995 4,941.8 2,281.9 460.0 764.5 26.6 1,408.8 194.4 NA1996 5,105.0 2,291.5 490.9 811.0 26.0 1,485.6 202.1 NA1997 5,201.9 2,258.0 509.7 683.6 39.8 1,710.8 225.1 377.21998 5,646.1 2,547.0 520.7 685.1 40.9 1,852.4 235.1 378.91999p 6,003.3 2,616.7 518.4 737.0 52.2 2,079.0 263.6 451.5
Notes:a = For 1977-1996, publishing is classified under manufacturing and petroleum and coal product manufacturingis classified under other industries; for 1997-1999, publishing is classified under other industries andpetroleum and coal product manufacturing is classified under manufacturing. b = For 1977-1996, eating and drinking is included in retail trade; for 1997-1999, this industry is includedin other industries.c = For 1977-1996, rental and leasing (other than real estate) is included in other industries; for 1997-1999,this industry is included in real estate.D = not disclosed.NA = not available.p = preliminary (1999 estimates are preliminary)
Sources:U.S. Department of Commerce, Bureau of Economic Analysis (various years a, various years b).
61
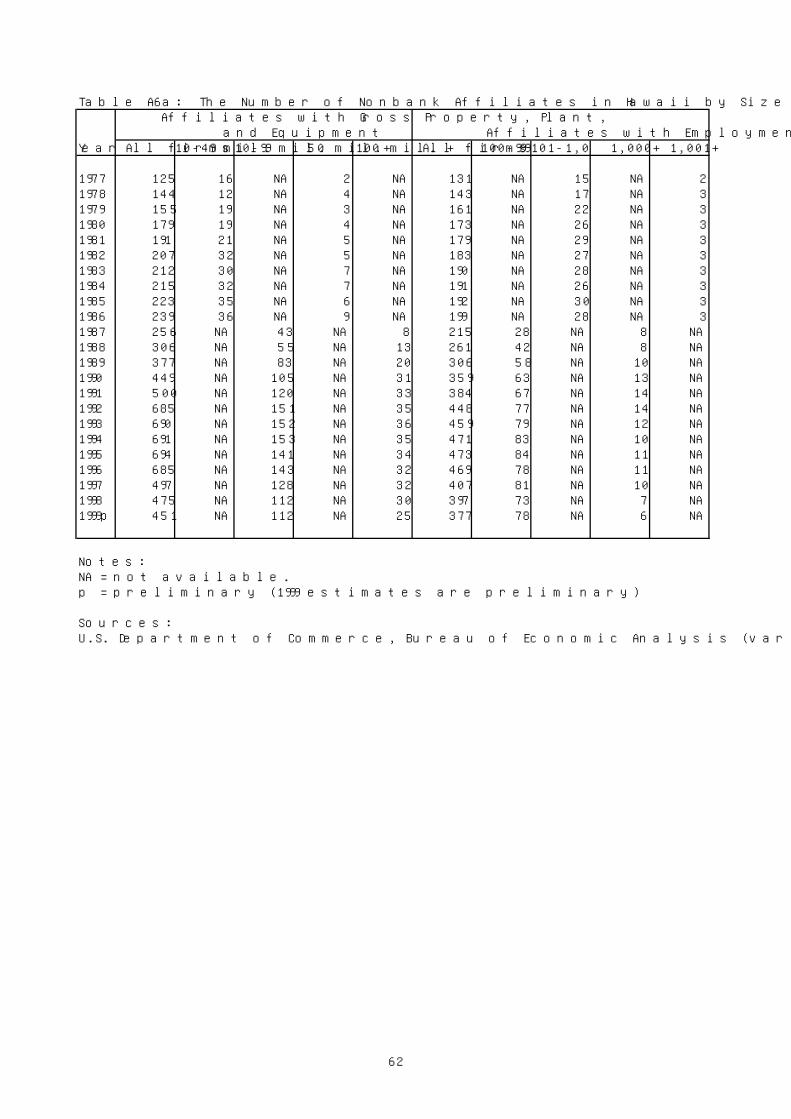
Table A6a: The Number of Nonbank Affiliates in Hawaii by Size ClassAffiliates with Gross Property, Plant,
and Equipment Affiliates with EmploymentYear All firms 10-49 mil. 10-99 mil. 50 mil.+ 100 mil. + All firms 100-999 101-1,000 1,000+ 1,001+
1977 125 16 NA 2 NA 131 NA 15 NA 21978 144 12 NA 4 NA 143 NA 17 NA 31979 155 19 NA 3 NA 161 NA 22 NA 31980 179 19 NA 4 NA 173 NA 26 NA 31981 191 21 NA 5 NA 179 NA 29 NA 31982 207 32 NA 5 NA 183 NA 27 NA 31983 212 30 NA 7 NA 190 NA 28 NA 31984 215 32 NA 7 NA 191 NA 26 NA 31985 223 35 NA 6 NA 192 NA 30 NA 31986 239 36 NA 9 NA 199 NA 28 NA 31987 256 NA 43 NA 8 215 28 NA 8 NA1988 306 NA 55 NA 13 261 42 NA 8 NA1989 377 NA 83 NA 20 306 58 NA 10 NA1990 449 NA 105 NA 31 359 63 NA 13 NA1991 500 NA 120 NA 33 384 67 NA 14 NA1992 685 NA 151 NA 35 448 77 NA 14 NA1993 690 NA 152 NA 36 459 79 NA 12 NA1994 691 NA 153 NA 35 471 83 NA 10 NA1995 694 NA 141 NA 34 473 84 NA 11 NA1996 685 NA 143 NA 32 469 78 NA 11 NA1997 497 NA 128 NA 32 407 81 NA 10 NA1998 475 NA 112 NA 30 397 73 NA 7 NA1999p 451 NA 112 NA 25 377 78 NA 6 NA
Notes:NA = not available.p = preliminary (1999 estimates are preliminary)
Sources:U.S. Department of Commerce, Bureau of Economic Analysis (various years a, various years b).
62

Table A6b: The Number of Nonbank Affiliates in the United States by Size ClassAffiliates with Gross Property, Plant,
and Equipment Affiliates with EmploymentYear All firms 10-49 mil. 10-99 mil. 50 mil.+ 100 mil. + All firms 100-999 101-1,000 1,000+ 1,001+
1977 3,827 399 NA 166 NA 2,999 NA 837 NA 2041978 4,580 488 NA 196 NA 3,410 NA 960 NA 2221979 5,168 575 NA 247 NA 3,694 NA 1,040 NA 2681980 6,822 738 NA 317 NA 4,419 NA 1,136 NA 3171981 7,756 917 NA 419 NA 4,790 NA 1,251 NA 3711982 8,499 1,055 NA 510 NA 5,121 NA 1,295 NA 3731983 8,860 1,185 NA 572 NA 5,288 NA 1,368 NA 3891984 9,171 1,282 NA 623 NA 5,407 NA 1,463 NA 4111985 9,392 1,368 NA 679 NA 5,528 NA 1,523 NA 4341986 9,656 1,436 NA 751 NA 5,716 NA 1,625 NA 4521987 7,451 NA 1,669 NA 507 5,525 1,567 NA 526 NA1988 7,928 NA 1,916 NA 585 5,867 1,740 NA 602 NA1989 8,718 NA 2,287 NA 691 6,407 1,936 NA 683 NA1990 9,517 NA 2,632 NA 816 6,959 2,120 NA 745 NA1991 9,971 NA 2,806 NA 885 7,303 2,269 NA 750 NA1992 10,882 NA 2,925 NA 935 8,489 2,397 NA 758 NA1993 11,125 NA 2,965 NA 986 8,631 2,423 NA 768 NA1994 11,333 NA 3,061 NA 1,002 8,773 2,514 NA 770 NA1995 11,529 NA 3,103 NA 1,027 8,902 2,516 NA 781 NA1996 11,675 NA 3,092 NA 1,080 9,030 2,509 NA 801 NA1997 8,602 NA 2,662 NA 1,117 7,445 2,412 NA 806 NA1998 8,436 NA 2,587 NA 1,131 7,300 2,377 NA 843 NA1999p 8,368 NA 2,545 NA 1,167 7,211 2,307 NA 836 NA
Notes:NA = not available.p = preliminary (1999 estimates are preliminary)
Sources:U.S. Department of Commerce, Bureau of Economic Analysis (various years a, various years b).
63

Table B1: Number of Employees in a Sample of Large Foreign Multinationals in Hawaii by Country of Owner and Industry of OperationCountry, industry 1983 1984 1985 1986 1987 1988 1989 1990 1991 1992 1993 1994 1995 1996 1997 1998 1999 2000
ALL COUNTRIES-all 11,514 14,435 15,208 19,821 22,199 25,267 28,146 28,888 28,124 23,387 24,383 23,674 23,627 25,806 21,334 22,218 19,162 18,251 Manufacturing, food 300 300 300 365 540 570 538 615 660 640 635 597 630 640 410 410 410 407 Manufacturing, oil 0 0 0 0 0 0 1,129 1,215 1,250 1,250 1,120 1,128 1,000 1,000 0 0 0 0 Manufacturing, other 0 0 200 237 292 300 335 0 0 0 0 0 0 0 0 0 0 0 Wholesale trade 1,942 1,952 2,003 1,893 2,320 2,212 1,596 1,608 1,710 1,602 881 536 464 512 501 530 537 557 Retail trade, general 1,260 1,110 1,020 1,068 1,068 1,045 1,080 1,200 1,200 1,220 1,270 1,260 1,415 2,220 1,229 1,333 1,391 1,447 Retail trade, specialized 2,279 2,856 3,282 3,982 2,533 2,855 3,386 4,016 3,759 1,840 2,660 2,586 2,421 2,667 2,151 2,503 2,494 2,415 Eating, drinking 0 0 0 1,400 2,239 1,800 1,850 1,480 1,375 890 760 680 0 0 0 0 0 0 Real estate 0 0 0 266 297 300 350 300 350 330 33 48 13 10 10 10 10 11 Finance & insurance 103 72 73 76 90 143 678 1,155 1,213 1,100 1,116 1,026 1,046 1,056 1,019 940 982 877 Hotels 5,350 7,865 7,980 10,174 11,838 13,573 12,579 10,711 11,148 11,494 13,199 13,128 13,507 14,555 12,881 13,808 11,611 10,813 Travel services 0 0 0 0 0 0 0 0 65 261 255 489 926 1,130 1,313 1,080 1,042 1,011 Transport services 280 280 350 360 360 179 185 330 342 340 332 531 336 341 340 340 330 293 Construction 0 0 0 0 622 2,290 4,440 6,258 5,052 2,420 1,970 1,665 1,869 1,675 1,480 1,264 355 420 Other services 0 0 0 0 0 0 0 0 0 0 152 0 0 0 0 0 0 0
JAPAN-all 8,664 10,168 10,178 13,575 16,717 18,091 17,849 17,302 17,988 17,125 17,720 17,861 18,635 20,485 17,833 18,594 16,387 15,241 Manufacturing, food 300 300 300 295 470 420 468 465 460 440 435 397 410 410 410 410 410 407 Manufacturing, oil 0 0 0 0 0 0 0 0 0 0 0 0 0 0 0 0 0 0 Manufacturing, other 0 0 0 0 0 0 0 0 0 0 0 0 0 0 0 0 0 0 Wholesale trade 1,342 1,382 1,433 1,253 1,455 1,392 878 840 855 747 266 266 263 298 295 354 359 362 Retail trade, general 1,260 1,110 1,020 1,068 1,068 1,045 1,080 1,200 1,200 1,220 1,270 1,260 1,415 2,220 1,229 1,333 1,391 1,447 Retail trade, specialized 29 29 32 32 33 35 120 270 207 140 60 55 57 117 94 39 37 37 Eating, drinking 0 0 0 1,400 2,239 1,800 1,850 1,480 1,375 890 760 680 0 0 0 0 0 0 Real estate 0 0 0 266 297 300 350 300 350 330 33 48 13 10 10 10 10 10 Finance & insurance 103 72 73 76 90 143 678 1,012 1,070 969 996 918 908 921 911 865 842 733 Hotels 5,350 6,995 6,970 8,825 10,705 12,277 11,500 10,097 10,687 10,568 12,398 12,712 13,507 14,555 12,881 13,808 11,611 10,521 Travel services 0 0 0 0 0 0 0 0 65 261 255 489 926 1,130 1,313 1,080 1,042 1,011 Transport services 280 280 350 360 360 179 185 330 342 340 332 331 336 341 340 340 330 293 Construction 0 0 0 0 0 500 740 1,308 1,377 1,220 915 705 800 483 350 355 355 420 Other services 0 0 0 0 0 0 0 0 0 0 0 0 0 0 0 0 0 0
64

Table B1: (continued)Country, industry 1983 1984 1985 1986 1987 1988 1989 1990 1991 1992 1993 1994 1995 1996 1997 1998 1999 2000
OTHER COUNTRIES-all 2,850 4,267 5,030 6,246 5,482 7,176 10,297 11,586 10,136 6,262 6,663 5,813 4,992 5,321 3,501 3,624 2,775 3,010 Manufacturing, food 0 0 0 70 70 150 70 150 200 200 200 200 220 230 0 0 0 0 Manufacturing, oil 0 0 0 0 0 0 1,129 1,215 1,250 1,250 1,120 1,128 1,000 1,000 0 0 0 0 Manufacturing, other 0 0 200 237 292 300 335 0 0 0 0 0 0 0 0 0 0 0 Wholesale trade 600 570 570 640 865 820 718 768 855 855 615 270 201 214 206 176 178 195 Retail trade, general 0 0 0 0 0 0 0 0 0 0 0 0 0 0 0 0 0 0 Retail trade, specialized 2,250 2,827 3,250 3,950 2,500 2,820 3,266 3,746 3,552 1,700 2,600 2,531 2,364 2,550 2,057 2,464 2,457 2,378 Eating, drinking 0 0 0 0 0 0 0 0 0 0 0 0 0 0 0 0 0 0 Real estate 0 0 0 0 0 0 0 0 0 0 0 0 0 0 0 0 0 1 Finance & insurance 0 0 0 0 0 0 0 143 143 131 120 108 138 135 108 75 140 144 Hotels 0 870 1,010 1,349 1,133 1,296 1,079 614 461 926 801 416 0 0 0 0 0 292 Travel services 0 0 0 0 0 0 0 0 0 0 0 0 0 0 0 0 0 0 Transport services 0 0 0 0 0 0 0 0 0 0 0 200 0 0 0 0 0 0 Construction 0 0 0 0 622 1,790 3,700 4,950 3,675 1,200 1,055 960 1,069 1,192 1,130 909 0 0 Other services 0 0 0 0 0 0 0 0 0 0 152 0 0 0 0 0 0 0
EUROPE-all 130 990 1,130 1,255 1,114 1,220 1,247 925 764 762 838 676 326 339 307 248 238 246CANADA-all 150 250 250 0 0 0 0 0 0 0 0 13 13 10 7 3 80 93OTHER ASIA & PAC.-all 2,570 3,027 3,650 4,991 4,368 5,956 9,050 10,661 9,372 5,500 5,825 5,124 4,653 4,972 3,187 3,373 2,457 2,671 AUSTRALIA-all 470 450 650 1,041 1,246 2,346 3,420 4,185 3,645 2,135 1,770 1,433 1,220 1,230 0 0 0 0 NEW ZEALAND-all 0 0 0 0 622 790 2,364 2,730 2,175 1,200 1,055 960 1,069 1,192 1,130 909 0 0 HONG KONG-all 2,100 2,577 3,000 3,950 2,500 2,820 3,266 3,746 3,552 2,165 3,000 2,531 2,364 2,550 2,057 2,464 2,457 2,670 KOREA-all 0 0 0 0 0 0 0 0 0 0 0 200 0 0 0 0 0 1
Sources: Hawaii Business (various years); State of Hawaii, Department of Business, Economic Development & Tourism (1995); Toyo Keizai (various years); author's estimates based on these sources.
65

Table B2: Sales of a Sample of Large Foreign Multinationals in Hawaii by Country of Owner and Industry of Operation (US$ millions)Country, industry 1983 1984 1985 1986 1987 1988 1989 1990 1991 1992 1993 1994 1995 1996 1997 1998 1999 2000
ALL COUNTRIES-all 876 1,016 1,120 1,414 1,873 2,431 5,300 7,130 5,095 4,823 4,083 4,306 4,453 4,844 3,954 3,926 3,669 3,879 Manufacturing, food 20 20 22 39 71 78 88 86 83 84 91 87 90 83 62 66 66 66 Manufacturing, oil 0 0 0 0 0 0 2,300 3,900 1,600 1,700 1,141 1,114 1,104 1,072 0 0 0 0 Manufacturing, other 0 0 31 50 51 65 85 0 0 0 0 0 0 0 0 0 0 0 Wholesale trade 149 181 198 206 239 263 382 330 361 398 246 233 183 236 240 179 228 298 Retail trade, general 143 161 138 132 136 148 157 173 180 190 186 184 248 273 289 275 276 287 Retail trade, specialized 300 286 333 381 359 328 359 432 343 331 320 330 323 340 367 368 425 461 Eating, drinking 0 0 0 31 70 67 53 46 45 29 28 29 0 0 0 0 0 0 Real estate 0 0 0 32 51 33 43 68 52 47 44 53 37 16 19 31 36 63 Finance & insurance 21 25 27 20 18 36 150 273 323 336 334 349 324 317 319 344 440 460 Hotels 225 316 345 494 714 974 952 810 868 991 1,012 1,070 1,089 1,297 1,285 1,380 1,215 1,246 Travel services 0 0 0 0 0 0 0 0 40 69 64 377 612 763 1,015 832 827 842 Transport services 19 27 27 30 25 26 27 66 56 53 56 88 71 70 68 87 91 83 Construction 0 0 0 0 140 412 704 947 1,145 595 546 394 374 377 291 366 64 75 Other services 0 0 0 0 0 0 0 0 0 0 17 0 0 0 0 0 0 0
JAPAN-all 581 712 727 931 1,240 1,638 1,875 1,984 2,178 2,232 2,130 2,413 2,683 3,122 3,281 3,221 3,141 3,283 Manufacturing, food 20 20 22 23 55 55 58 65 65 64 65 63 64 61 62 66 66 66 Manufacturing, oil 0 0 0 0 0 0 0 0 0 0 0 0 0 0 0 0 0 0 Manufacturing, other 0 0 0 0 0 0 0 0 0 0 0 0 0 0 0 0 0 0 Wholesale trade 91 117 124 132 134 140 245 192 199 197 79 81 84 135 140 136 185 250 Retail trade, general 143 161 138 132 136 148 157 173 180 190 186 184 248 273 289 275 276 287 Retail trade, specialized 63 85 90 102 100 112 108 134 119 122 103 117 115 116 111 103 132 149 Eating, drinking 0 0 0 31 70 67 53 46 45 29 28 29 0 0 0 0 0 0 Real estate 0 0 0 32 51 33 43 68 52 47 44 53 37 16 19 31 36 44 Finance & insurance 21 25 27 20 18 36 150 210 258 258 264 252 229 227 226 244 248 268 Hotels 225 277 299 430 653 908 901 785 843 951 969 1,047 1,089 1,297 1,285 1,380 1,215 1,221 Travel services 0 0 0 0 0 0 0 0 40 69 64 377 612 763 1,015 832 827 842 Transport services 19 27 27 30 25 26 27 66 56 53 56 69 71 70 68 87 91 83 Construction 0 0 0 0 0 112 133 246 321 252 272 142 135 165 68 68 64 75 Other services 0 0 0 0 0 0 0 0 0 0 0 0 0 0 0 0 0 0
66

Table B2: (continued)Country, industry 1983 1984 1985 1986 1987 1988 1989 1990 1991 1992 1993 1994 1995 1996 1997 1998 1999 2000
OTHER COUNTRIES-all 295 304 393 483 632 793 3,425 5,145 2,918 2,591 1,953 1,893 1,770 1,722 672 706 529 596 Manufacturing, food 0 0 0 16 17 23 30 21 18 20 26 24 26 22 0 0 0 0 Manufacturing, oil 0 0 0 0 0 0 2,300 3,900 1,600 1,700 1,141 1,114 1,104 1,072 0 0 0 0 Manufacturing, other 0 0 31 50 51 65 85 0 0 0 0 0 0 0 0 0 0 0 Wholesale trade 58 64 74 74 105 123 137 138 162 201 166 152 98 101 100 43 44 48 Retail trade, general 0 0 0 0 0 0 0 0 0 0 0 0 0 0 0 0 0 0 Retail trade, specialized 237 201 243 279 259 216 251 298 224 209 217 213 208 225 256 265 293 312 Eating, drinking 0 0 0 0 0 0 0 0 0 0 0 0 0 0 0 0 0 0 Real estate 0 0 0 0 0 0 0 0 0 0 0 0 0 0 0 0 0 19 Finance & insurance 0 0 0 0 0 0 0 64 65 78 70 97 94 91 93 100 192 191 Hotels 0 38 46 64 61 66 51 25 25 40 43 22 0 0 0 0 0 26 Travel services 0 0 0 0 0 0 0 0 0 0 0 0 0 0 0 0 0 0 Transport services 0 0 0 0 0 0 0 0 0 0 0 19 0 0 0 0 0 0 Construction 0 0 0 0 140 300 571 701 824 343 274 252 239 212 223 298 0 0 Other services 0 0 0 0 0 0 0 0 0 0 17 0 0 0 0 0 0 0
EUROPE-all 18 57 66 69 68 75 78 116 118 181 193 171 161 160 159 106 101 101CANADA-all 30 31 31 0 0 0 0 0 0 0 0 32 32 32 34 37 135 138OTHER ASIA & PAC.-all 247 216 297 414 564 719 3,347 5,030 2,800 2,410 1,761 1,691 1,577 1,531 479 563 293 357 AUSTRALIA-all 40 46 85 135 166 303 2,665 4,185 1,926 1,838 1,249 1,207 1,130 1,094 0 0 0 0 NEW ZEALAND-all 0 0 0 0 140 199 431 547 651 343 274 252 239 212 223 298 0 0 HONG KONG-all 207 170 212 279 259 216 251 298 224 229 237 213 208 225 256 265 293 338 KOREA-all 0 0 0 0 0 0 0 0 0 0 0 19 0 0 0 0 0 19
Sources: Hawaii Business (various years); State of Hawaii, Department of Business, Economic Development & Tourism (1995); Toyo Keizai (various years); author's estimates based on these sources.
67

Table B3: The Number of Firms in a Sample of Large Foreign Multinationals in Hawaii by Country of Owner and Industry of OperationCountry, industry 1983 1984 1985 1986 1987 1988 1989 1990 1991 1992 1993 1994 1995 1996 1997 1998 1999 2000
ALL COUNTRIES-all 17 21 22 29 35 41 42 42 44 45 43 46 47 54 51 48 43 43 Manufacturing, food 1 1 1 2 3 3 3 3 3 3 3 3 3 3 2 2 2 2 Manufacturing, oil 0 0 0 0 0 0 1 1 1 1 1 1 1 1 0 0 0 0 Manufacturing, other 0 0 1 1 1 1 1 0 0 0 0 0 0 0 0 0 0 0 Wholesale trade 5 6 6 6 6 6 8 7 8 9 6 6 6 7 7 6 6 6 Retail trade, general 3 3 2 2 2 2 2 2 2 2 2 2 2 3 3 3 3 3 Retail trade, specialized 4 4 4 4 3 3 3 4 3 3 2 2 2 3 4 3 3 3 Eating, drinking 0 0 0 1 2 2 2 2 2 1 1 1 0 0 0 0 0 0 Real estate 0 0 0 2 2 1 1 1 1 1 1 1 1 1 1 1 1 2 Finance & insurance 1 1 1 1 1 2 3 4 4 4 4 5 5 5 5 5 6 6 Hotels 2 5 6 9 12 14 10 9 10 12 13 13 13 15 14 15 11 11 Travel services 0 0 0 0 0 0 0 0 1 2 2 4 7 9 9 7 7 6 Transport services 1 1 1 1 1 1 1 2 2 2 2 3 2 2 2 2 2 2 Construction 0 0 0 0 2 6 7 7 7 5 5 5 5 5 4 4 2 2 Other services 0 0 0 0 0 0 0 0 0 0 1 0 0 0 0 0 0 0
JAPAN-all 12 15 14 19 24 28 29 30 33 33 31 34 37 44 42 40 36 34 Manufacturing, food 1 1 1 1 2 2 2 2 2 2 2 2 2 2 2 2 2 2 Manufacturing, oil 0 0 0 0 0 0 0 0 0 0 0 0 0 0 0 0 0 0 Manufacturing, other 0 0 0 0 0 0 0 0 0 0 0 0 0 0 0 0 0 0 Wholesale trade 3 4 4 4 4 4 6 5 5 5 3 3 3 4 4 4 4 4 Retail trade, general 3 3 2 2 2 2 2 2 2 2 2 2 2 3 3 3 3 3 Retail trade, specialized 1 1 1 1 1 1 1 2 2 2 1 1 1 2 2 1 1 1 Eating, drinking 0 0 0 1 2 2 2 2 2 1 1 1 0 0 0 0 0 0 Real estate 0 0 0 2 2 1 1 1 1 1 1 1 1 1 1 1 1 1 Finance & insurance 1 1 1 1 1 2 3 3 3 3 3 3 3 3 3 3 3 3 Hotels 2 4 4 6 9 11 8 8 9 10 11 12 13 15 14 15 11 10 Travel services 0 0 0 0 0 0 0 0 1 2 2 4 7 9 9 7 7 6 Transport services 1 1 1 1 1 1 1 2 2 2 2 2 2 2 2 2 2 2 Construction 0 0 0 0 0 2 3 3 4 3 3 3 3 3 2 2 2 2 Other services 0 0 0 0 0 0 0 0 0 0 0 0 0 0 0 0 0 0
68
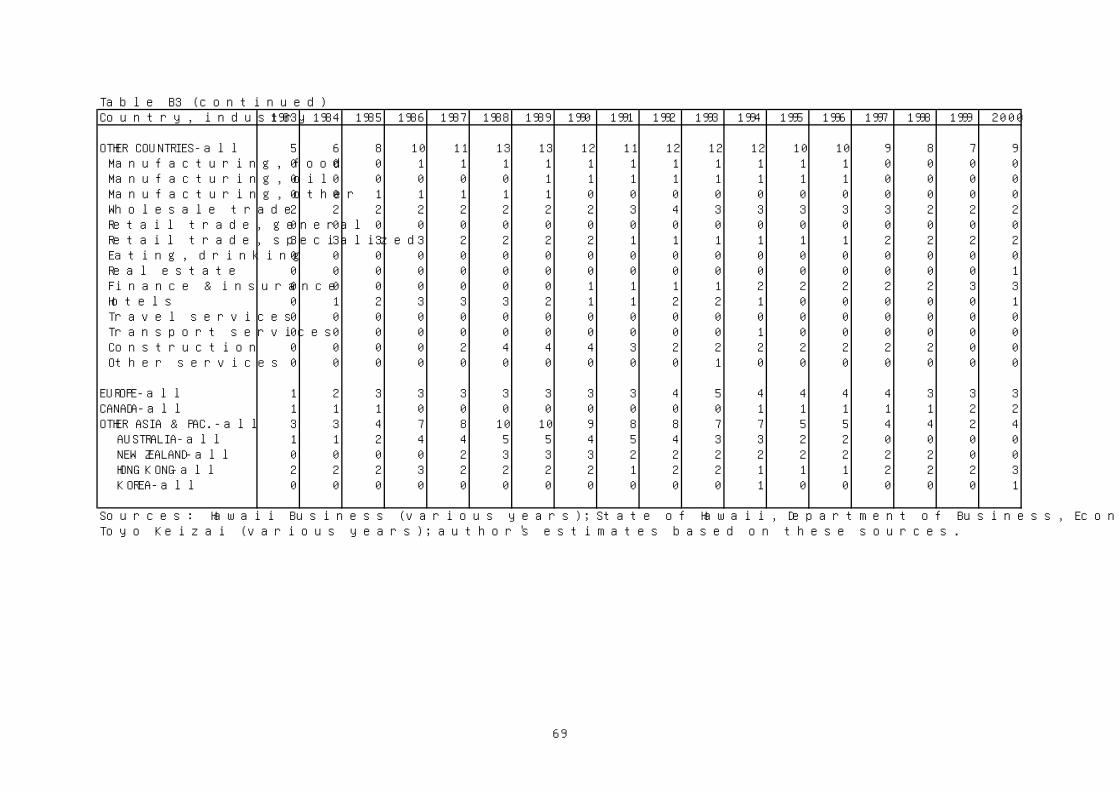
Table B3 (continued)Country, industry 1983 1984 1985 1986 1987 1988 1989 1990 1991 1992 1993 1994 1995 1996 1997 1998 1999 2000
OTHER COUNTRIES-all 5 6 8 10 11 13 13 12 11 12 12 12 10 10 9 8 7 9 Manufacturing, food 0 0 0 1 1 1 1 1 1 1 1 1 1 1 0 0 0 0 Manufacturing, oil 0 0 0 0 0 0 1 1 1 1 1 1 1 1 0 0 0 0 Manufacturing, other 0 0 1 1 1 1 1 0 0 0 0 0 0 0 0 0 0 0 Wholesale trade 2 2 2 2 2 2 2 2 3 4 3 3 3 3 3 2 2 2 Retail trade, general 0 0 0 0 0 0 0 0 0 0 0 0 0 0 0 0 0 0 Retail trade, specialized 3 3 3 3 2 2 2 2 1 1 1 1 1 1 2 2 2 2 Eating, drinking 0 0 0 0 0 0 0 0 0 0 0 0 0 0 0 0 0 0 Real estate 0 0 0 0 0 0 0 0 0 0 0 0 0 0 0 0 0 1 Finance & insurance 0 0 0 0 0 0 0 1 1 1 1 2 2 2 2 2 3 3 Hotels 0 1 2 3 3 3 2 1 1 2 2 1 0 0 0 0 0 1 Travel services 0 0 0 0 0 0 0 0 0 0 0 0 0 0 0 0 0 0 Transport services 0 0 0 0 0 0 0 0 0 0 0 1 0 0 0 0 0 0 Construction 0 0 0 0 2 4 4 4 3 2 2 2 2 2 2 2 0 0 Other services 0 0 0 0 0 0 0 0 0 0 1 0 0 0 0 0 0 0
EUROPE-all 1 2 3 3 3 3 3 3 3 4 5 4 4 4 4 3 3 3CANADA-all 1 1 1 0 0 0 0 0 0 0 0 1 1 1 1 1 2 2OTHER ASIA & PAC.-all 3 3 4 7 8 10 10 9 8 8 7 7 5 5 4 4 2 4 AUSTRALIA-all 1 1 2 4 4 5 5 4 5 4 3 3 2 2 0 0 0 0 NEW ZEALAND-all 0 0 0 0 2 3 3 3 2 2 2 2 2 2 2 2 0 0 HONG KONG-all 2 2 2 3 2 2 2 2 1 2 2 1 1 1 2 2 2 3 KOREA-all 0 0 0 0 0 0 0 0 0 0 0 1 0 0 0 0 0 1
Sources: Hawaii Business (various years); State of Hawaii, Department of Business, Economic Development & Tourism (1995); Toyo Keizai (various years); author's estimates based on these sources.
69

Appendix Table C1: Equity Stocks in Toyo Keizai's Sample of Japanese Affiliates at YearendIndustry 1988 1990 1992 1994 1996 1998
EQUITY STOCKS AT YEAREND (US$ millions)All industries 1,091 825 1,356 1,787 2,817 2,872 Manufacturing, food 11 19 46 47 48 47 Manufacturing, other 0 0 0 1 1 1 Wholesale trade 28 11 12 22 21 11 Retail trade, general 205 227 227 227 216 216 Retail trade, specialized 2 5 10 9 9 1 Eating, drinking 23 66 20 21 21 57 Real estate 200 304 450 707 700 664 Finance & insurance 33 80 92 67 156 155 Hotels 70 65 443 612 1,542 1,620 Leisure, sports 9 9 9 12 21 21 Other services 0 1 1 12 16 39 Travel services 2 5 13 14 32 9 Transport services 0 0 0 1 0 0 Construction 506 33 33 33 35 30 Primary industries 0 0 0 1 0 0
NUMBER OF AFFILIATES REPORTING POSITIVE EQUITY STOCKSAll industries 114 138 142 138 132 117 Manufacturing, food 8 10 11 11 9 8 Manufacturing, other 1 1 1 2 2 2 Wholesale trade 17 16 17 17 14 12 Retail trade, general 3 4 4 4 3 3 Retail trade, specialized 4 6 6 5 4 2 Eating, drinking 12 10 9 8 7 5 Real estate 24 35 30 27 28 23 Finance & insurance 8 17 18 18 15 14 Hotels 12 10 14 17 18 17 Leisure, sports 1 3 3 4 2 2 Other services 3 5 4 4 7 9 Travel services 8 8 12 9 12 12 Transport services 1 2 2 3 3 3 Construction 12 11 10 8 8 5 Primary industries 0 0 1 1 0 0
Source: Toyo Keizai (various years).
70

Appendix Table C2: Employment in Toyo Keizai's Sample of Japanese Affiliates at YearendIndustry 1988 1990 1992 1994 1996 1998
EMPLOYMENT (number)All industries 11,672 13,822 13,209 12,343 12,240 11,581 Manufacturing, food 1,045 1,090 742 803 726 753 Manufacturing, other 40 40 40 82 82 83 Wholesale trade 496 316 316 258 247 226 Retail trade, general 1,212 2,178 1,273 1,071 822 363 Retail trade, specialized 26 137 312 307 233 19 Eating, drinking 1,387 1,395 1,174 470 492 472 Real estate 325 360 378 901 869 795 Finance & insurance 681 1,629 1,426 1,375 1,528 1,193 Hotels 5,539 5,547 5,745 5,640 5,685 5,823 Leisure, sports 54 54 54 69 69 69 Other services 64 225 233 192 178 512 Travel services 231 205 865 720 908 936 Transport services 75 145 144 148 173 137 Construction 497 501 507 307 228 200 Primary industries 0 0 0 0 0 0
NUMBER OF AFFILIATES REPORTING POSITIVE EMPLOYMENTAll industries 80 101 106 100 102 86 Manufacturing, food 9 9 9 9 8 7 Manufacturing, other 1 1 1 2 2 2 Wholesale trade 14 15 16 15 13 11 Retail trade, general 3 4 3 3 2 2 Retail trade, specialized 2 5 5 5 4 2 Eating, drinking 7 8 7 4 6 4 Real estate 13 18 19 18 19 14 Finance & insurance 5 13 11 11 10 9 Hotels 7 8 8 9 9 7 Leisure, sports 1 1 1 2 2 2 Other services 2 4 5 4 5 7 Travel services 6 5 10 8 12 12 Transport services 1 2 2 3 3 3 Construction 9 8 9 7 7 4 Primary industries 0 0 0 0 0 0
Source: Toyo Keizai (various years).
71