forensic geochemistry – the key to accurate site characterization
TRANSCRIPT
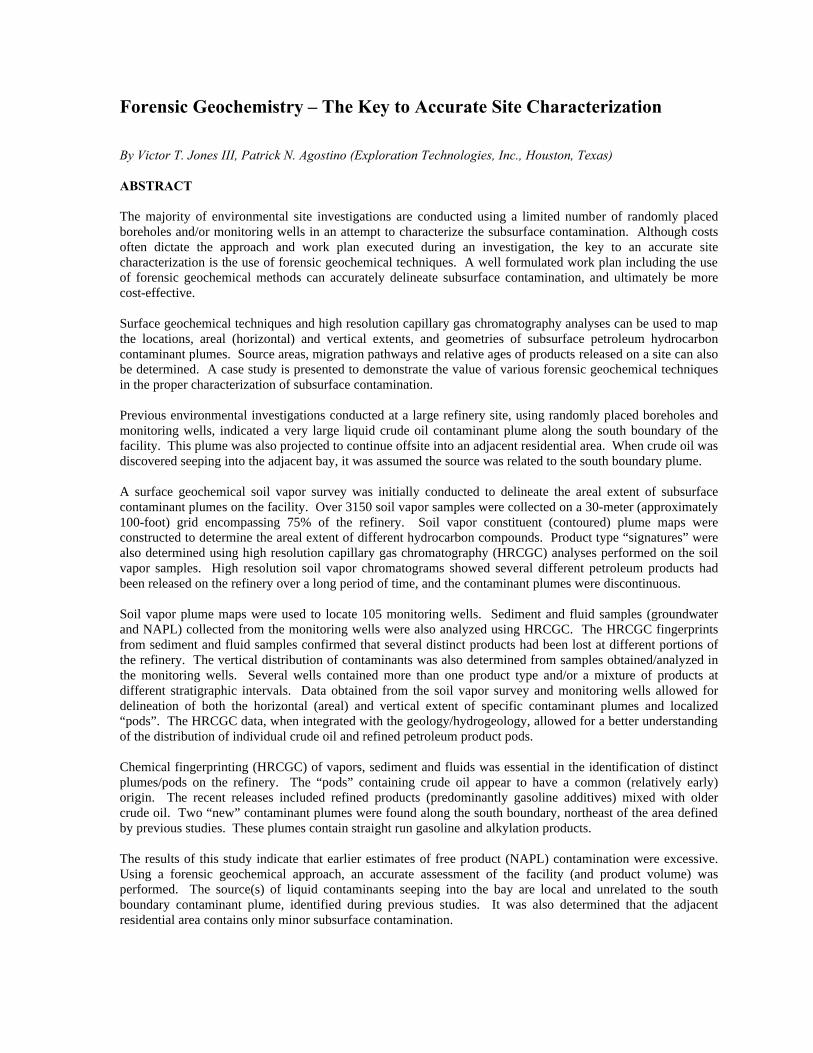
Forensic Geochemistry – The Key to Accurate Site Characterization By Victor T. Jones III, Patrick N. Agostino (Exploration Technologies, Inc., Houston, Texas) ABSTRACT The majority of environmental site investigations are conducted using a limited number of randomly placed boreholes and/or monitoring wells in an attempt to characterize the subsurface contamination. Although costs often dictate the approach and work plan executed during an investigation, the key to an accurate site characterization is the use of forensic geochemical techniques. A well formulated work plan including the use of forensic geochemical methods can accurately delineate subsurface contamination, and ultimately be more cost-effective. Surface geochemical techniques and high resolution capillary gas chromatography analyses can be used to map the locations, areal (horizontal) and vertical extents, and geometries of subsurface petroleum hydrocarbon contaminant plumes. Source areas, migration pathways and relative ages of products released on a site can also be determined. A case study is presented to demonstrate the value of various forensic geochemical techniques in the proper characterization of subsurface contamination. Previous environmental investigations conducted at a large refinery site, using randomly placed boreholes and monitoring wells, indicated a very large liquid crude oil contaminant plume along the south boundary of the facility. This plume was also projected to continue offsite into an adjacent residential area. When crude oil was discovered seeping into the adjacent bay, it was assumed the source was related to the south boundary plume. A surface geochemical soil vapor survey was initially conducted to delineate the areal extent of subsurface contaminant plumes on the facility. Over 3150 soil vapor samples were collected on a 30-meter (approximately 100-foot) grid encompassing 75% of the refinery. Soil vapor constituent (contoured) plume maps were constructed to determine the areal extent of different hydrocarbon compounds. Product type “signatures” were also determined using high resolution capillary gas chromatography (HRCGC) analyses performed on the soil vapor samples. High resolution soil vapor chromatograms showed several different petroleum products had been released on the refinery over a long period of time, and the contaminant plumes were discontinuous. Soil vapor plume maps were used to locate 105 monitoring wells. Sediment and fluid samples (groundwater and NAPL) collected from the monitoring wells were also analyzed using HRCGC. The HRCGC fingerprints from sediment and fluid samples confirmed that several distinct products had been lost at different portions of the refinery. The vertical distribution of contaminants was also determined from samples obtained/analyzed in the monitoring wells. Several wells contained more than one product type and/or a mixture of products at different stratigraphic intervals. Data obtained from the soil vapor survey and monitoring wells allowed for delineation of both the horizontal (areal) and vertical extent of specific contaminant plumes and localized “pods”. The HRCGC data, when integrated with the geology/hydrogeology, allowed for a better understanding of the distribution of individual crude oil and refined petroleum product pods. Chemical fingerprinting (HRCGC) of vapors, sediment and fluids was essential in the identification of distinct plumes/pods on the refinery. The “pods” containing crude oil appear to have a common (relatively early) origin. The recent releases included refined products (predominantly gasoline additives) mixed with older crude oil. Two “new” contaminant plumes were found along the south boundary, northeast of the area defined by previous studies. These plumes contain straight run gasoline and alkylation products. The results of this study indicate that earlier estimates of free product (NAPL) contamination were excessive. Using a forensic geochemical approach, an accurate assessment of the facility (and product volume) was performed. The source(s) of liquid contaminants seeping into the bay are local and unrelated to the south boundary contaminant plume, identified during previous studies. It was also determined that the adjacent residential area contains only minor subsurface contamination.

1.0 Introduction In 1959, a residential area located adjacent to the south boundary of the subject refinery was found to be impacted by petroleum hydrocarbons. Following the extension of the refinery boundary into the residential area in 1971, more than 225,000 barrels of liquid product were recovered from this impacted area within four years. Subsurface contamination on the facility was characterized to some extent in 1990 using a limited number of randomly placed boreholes and monitor wells. Data obtained from this study found liquid product, ranging up to 2 meters in thickness, over a large portion of the south boundary. Calculations of lost product volumes, based on a contour map constructed from data obtained from these monitor wells suggested that upwards of 900,000 barrels of product might be present within the impacted area. The depth to ground water ranges from one to over 14 meters below ground surface, and decreases towards the west and south. Potentiometric surface maps indicate groundwater flow is mainly towards the south boundary, although there is some component of flow towards the western boundary. In 1998, liquid phase hydrocarbons began to migrate into the bay near the southwest corner of the refinery. A series of closely-spaced monitor/recovery wells were installed along the southwest boundary in an attempt to prevent this plume from contaminating the bay. Because of the potential for westward flow, it was assumed that the south boundary contamination had somehow migrated to the bay. The current (subsequent) geological evaluation of the available borehole and monitor well data indicated a complex sequence of interbedded coquina, shale, and sand strata existed in the near subsurface environment. This sequence of sedimentary rocks, in general, strikes (trends) east-west and dips to the south. The sand strata appear to be poorly cemented, and the coquina strata contain vugular, cavernous, and solution channel porosity/permeability. The solution channel porosity, fractures, and caverns in the coquina appear to allow for high mobility of groundwater and liquid phase hydrocarbons, both horizontally and vertically. Porosity and permeability in the various strata (especially coquina) are usually discontinuous. Liquid product and dissolved phase contaminants migrate along zones of relatively high porosity and permeability controlled by the environments of deposition of the sand and carbonate strata. Within the coquina environment discontinuous lateral and vertical migration pathways exist. In order to design an effective remediation solution, a thorough assessment of the horizontal and vertical extents of the contamination was conducted utilizing a multi-phase work program. The program included: 1) the collection and analysis (“fingerprinting”) of fluid samples from existing monitor and recovery wells, 2) the delineation of the horizontal (using soil vapor surveys) and vertical (using boreholes and monitor wells) extent of the contamination, 3) a determination of the subsurface geology (using borehole data), 4) the mapping of migration pathways along which contaminants move through subsurface strata, and 5) a determination of the products released at the facility (historical information). 2.0 Fingerprinting of Fluid Samples from Existing Monitor Wells Liquid product and water samples were collected from 30 preexisting monitor wells. Selected chromatograms of the free product from sixteen (16) of these preexisting monitor wells on Plate 1 have been grouped into four subgroups and shown as Figures 1 to 4 for evaluation and comparison with one another and with the pre-existing product thickness contour map generated from these wells. Results of this high resolution capillary gas chromatography analyses of liquid product samples from these monitor wells indicate the presence of several completely different products. The liquid products show varying levels of weathering, with some minimally (near the bay boundary) and some severely biodegraded (on the south boundary). Several samples also show subordinate amounts of other products, including gasoline range compounds, gasoline, diesel fuel oil, etc. Some of the wells appear to contain a straight run gasoline (a distillate cut with no blending of additional process streams). The crude oils are distinguished mainly by their relative isoprenoid concentrations. Essentially five crude oil types and four different gasoline types were identified from the high resolution capillary GC data. Although a discussion of this complexity is beyond the scope of this paper, a limited discussion regarding some of the major differences follows. For example, Monitor well SB-3 on the South Boundary is located in the heart of the existing product recovery system (see Plate 1, Figure 1), where approximately 300 BBLS/day are recovered from pits dug just to the west

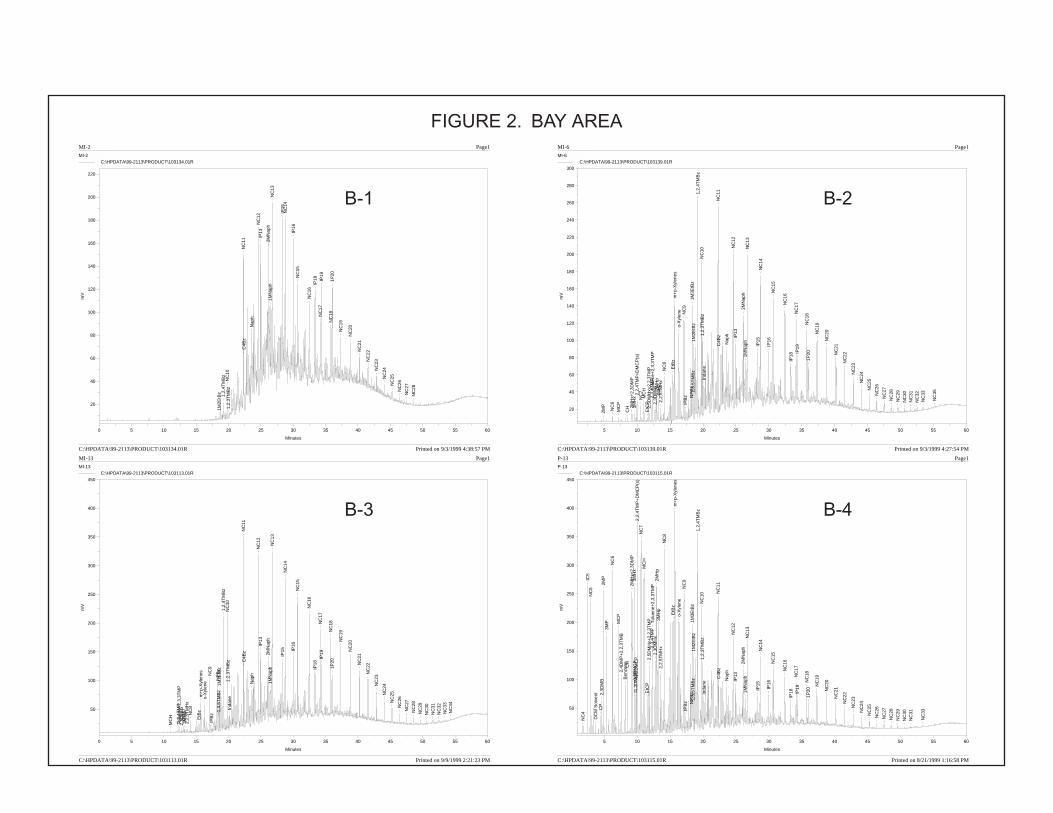
of this well. This sample is a very biodegraded crude oil showing a large unresolved hump and a nearly complete lack of normal paraffins. This sample also contains a very subordinate quantity of cycloparaffins. SB-4 just to the east of SB-3 is dominated by alkylates such as 2,2,4-TMP (Trimethylpentane), which is not a natural component of unprocessed crude oils. This sample does contain a small quantity of the very weathered crude oil found in SB-3. Sample SB-2 to the west of SB-3 is dominated by cycloparaffins rather than alkylates, but does also contain a subordinate quantity of the very weathered crude oil which dominates SB-3. Sample SB-1, which lies completely outside of the product thickness contours on Plate 1 is dominated by a minimally degraded and different crude oil that obviously has nothing in common with the crude recovered from the SB-3 area. This sample also contains a small amount of gasoline. As shown by Figure 2, the product, which began to seep into the bay is a minimally degraded crude oil mixed with gasoline, similar to SB-1. Clearly, these Bay area samples cannot be derived from the South Boundary products, which have no gasoline and a much more weathered crude of a different origin. Samples B-2 and B-4 have the largest percentage of gasoline, with B-4 being about a 50/50 mix. Interestingly enough, B-1 is a different crude oil than either of the other two and contains no gasoline. Samples B-2 and B-4 suggest the possibility of two separate gasoline-type plumes. This suggestion is confirmed by the soil gas survey data. It is also very interesting to look at the samples on the South East Boundary, which were used to define the eastern portion of the contour thickness map. Samples SE-1 and SE-3, shown in Figure 3, are dominated by straight-run gasoline with a small amount of weathered crude, while SE-2 and SE-4 are dominated by cycloparaffins. SE-4 also contains some alkylates. All four of these samples contain a subordinate quantity of the weathered crude oil, but are certainly not a main source for the oil being recovered near SE-3. These product samples indicate that the product in the eastern portion of the refinery is not related to the product found on the South Boundary. Thus indicating that the product thickness contour map needs to redrawn with a separation between these areas. As shown by Figure 4, none of the samples analyzed from the Central areas inside of the refinery can provide sources for either the Bay or South Boundary areas. Sample C-1 and C-2 are both from alkylate streams, while C-3 is dominated by a gasoline and a small quantity of degraded crude oil which could be related to the South Boundary contamination, and C-4 is dominated by a moderately degraded crude oil (different from any of the other crudes) with a subordinate quantity of a different gasoline containing alkylates. The most important conclusion to be drawn from these high resolution capillary gas chromatograms is that the contour map of the product thickness which suggests one large plume is actually a combination of many different products. These products must be contained in separate localized pods that are not connected chemically. Most important, it shows that the oil contamination currently being recovered at the bay is not related to the oil being recovered along the south boundary or from any of the known areas of contamination located inside the refinery. The bay product is a mixture of a fairly fresh crude oil with some light finished gasoline, whereas the south boundary product is a very old and weathered crude oil. Product samples collected on the bay boundary appear to have common parent product sources, which contain minimally biodegraded topped crude oil (after distillation-gasoline range compounds have been removed) and varying amounts of gasoline. The gasoline product portion of these samples ranges from approximately equal (50/50) to the crude, to somewhat more than 50 percent of the sample. Although these samples contain a common gasoline type, varying levels of weathering are apparent. Sample B-4 contains the least weathered, common gasoline product, with the gasoline contribution dominant over the crude in this sample. This analysis of the pre-existing products indicates that new boundaries for these product contamination pods must be redefined by additional monitor wells. As discussed below, the best method for determining the location for these additional monitor wells is to conduct a soil vapor survey in order to determine the horizontal extent of the individual contaminated areas.
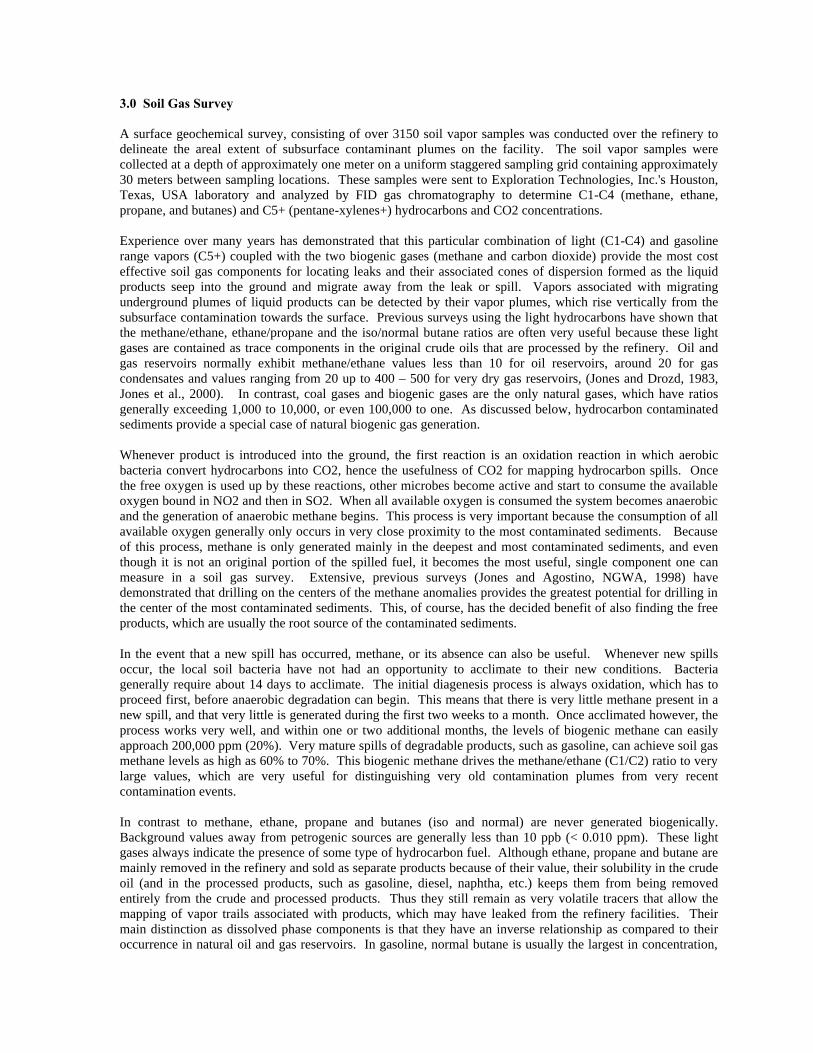
3.0 Soil Gas Survey A surface geochemical survey, consisting of over 3150 soil vapor samples was conducted over the refinery to delineate the areal extent of subsurface contaminant plumes on the facility. The soil vapor samples were collected at a depth of approximately one meter on a uniform staggered sampling grid containing approximately 30 meters between sampling locations. These samples were sent to Exploration Technologies, Inc.'s Houston, Texas, USA laboratory and analyzed by FID gas chromatography to determine C1-C4 (methane, ethane, propane, and butanes) and C5+ (pentane-xylenes+) hydrocarbons and CO2 concentrations. Experience over many years has demonstrated that this particular combination of light (C1-C4) and gasoline range vapors (C5+) coupled with the two biogenic gases (methane and carbon dioxide) provide the most cost effective soil gas components for locating leaks and their associated cones of dispersion formed as the liquid products seep into the ground and migrate away from the leak or spill. Vapors associated with migrating underground plumes of liquid products can be detected by their vapor plumes, which rise vertically from the subsurface contamination towards the surface. Previous surveys using the light hydrocarbons have shown that the methane/ethane, ethane/propane and the iso/normal butane ratios are often very useful because these light gases are contained as trace components in the original crude oils that are processed by the refinery. Oil and gas reservoirs normally exhibit methane/ethane values less than 10 for oil reservoirs, around 20 for gas condensates and values ranging from 20 up to 400 – 500 for very dry gas reservoirs, (Jones and Drozd, 1983, Jones et al., 2000). In contrast, coal gases and biogenic gases are the only natural gases, which have ratios generally exceeding 1,000 to 10,000, or even 100,000 to one. As discussed below, hydrocarbon contaminated sediments provide a special case of natural biogenic gas generation. Whenever product is introduced into the ground, the first reaction is an oxidation reaction in which aerobic bacteria convert hydrocarbons into CO2, hence the usefulness of CO2 for mapping hydrocarbon spills. Once the free oxygen is used up by these reactions, other microbes become active and start to consume the available oxygen bound in NO2 and then in SO2. When all available oxygen is consumed the system becomes anaerobic and the generation of anaerobic methane begins. This process is very important because the consumption of all available oxygen generally only occurs in very close proximity to the most contaminated sediments. Because of this process, methane is only generated mainly in the deepest and most contaminated sediments, and even though it is not an original portion of the spilled fuel, it becomes the most useful, single component one can measure in a soil gas survey. Extensive, previous surveys (Jones and Agostino, NGWA, 1998) have demonstrated that drilling on the centers of the methane anomalies provides the greatest potential for drilling in the center of the most contaminated sediments. This, of course, has the decided benefit of also finding the free products, which are usually the root source of the contaminated sediments. In the event that a new spill has occurred, methane, or its absence can also be useful. Whenever new spills occur, the local soil bacteria have not had an opportunity to acclimate to their new conditions. Bacteria generally require about 14 days to acclimate. The initial diagenesis process is always oxidation, which has to proceed first, before anaerobic degradation can begin. This means that there is very little methane present in a new spill, and that very little is generated during the first two weeks to a month. Once acclimated however, the process works very well, and within one or two additional months, the levels of biogenic methane can easily approach 200,000 ppm (20%). Very mature spills of degradable products, such as gasoline, can achieve soil gas methane levels as high as 60% to 70%. This biogenic methane drives the methane/ethane (C1/C2) ratio to very large values, which are very useful for distinguishing very old contamination plumes from very recent contamination events. In contrast to methane, ethane, propane and butanes (iso and normal) are never generated biogenically. Background values away from petrogenic sources are generally less than 10 ppb (< 0.010 ppm). These light gases always indicate the presence of some type of hydrocarbon fuel. Although ethane, propane and butane are mainly removed in the refinery and sold as separate products because of their value, their solubility in the crude oil (and in the processed products, such as gasoline, diesel, naphtha, etc.) keeps them from being removed entirely from the crude and processed products. Thus they still remain as very volatile tracers that allow the mapping of vapor trails associated with products, which may have leaked from the refinery facilities. Their main distinction as dissolved phase components is that they have an inverse relationship as compared to their occurrence in natural oil and gas reservoirs. In gasoline, normal butane is usually the largest in concentration,

followed by iso-butane, propane and then ethane. However, once exsolved from the liquid product, these light gases are always vapors at normal temperatures and pressures, and thus can be detected at some distance from the free product (because of their volatility). The C5+ (pentane-xylenes+) hydrocarbon analyses yield a quantitative measure of the concentration, by volume, of gasoline range petroleum product vapors present in near surface soils. These C5+ hydrocarbons dissipate more slowly than lighter fraction (C1-C4) compounds. Due to the large number of individual compounds present in gasolines, diesels, jet fuels, etc., this method uses a capillary column that requires a temperature programmed operation. This group of compounds provides very diagnostic product identifications. Laboratory results for all C1-C4 and C5+ hydrocarbons are measured in parts per million by volume (ppmv). Soil vapor constituent (contoured) plume maps were constructed to determine the areal extent of different hydrocarbon compounds. Color dot maps were also constructed for methane, ethane, propane, iso-butane, normal-butane, C5+ hydrocarbons and carbon dioxide to demonstrate the magnitude and compositional variations of the vapors detected at each sample site. The size of each dot represents the magnitude of each soil gas sample and the color of each dot shows the hydrocarbon compositions as defined by selected ratios. The methane/ethane ratio was used for the methane map, the ethane/propane compositional ratio was used for the ethane and propane maps, and the iso/normal butane ratio was used for the butane maps. The ethane/propane compositional ratio was also used for the C5+ and for the CO2 maps. The cuts for the compositions (colors) and magnitudes (dot size) are shown on the respective maps. The light gas ratios used on the color dot maps are controlled mainly by their parent products, although, they can change slightly (volatilize) during weathering and water washing in the environment along their migration pathway. Changes due to weathering and water washing are more pronounced for product exposed very near to the surface, but are usually second-order changes when compared to differences related to product compositional differences. Lower numerical ratios (for all three ratios) generally tend to indicate fresher products (that are closer to the release point), while the larger numerical ratios tend to increase as the products weather. This is generally true of all three of these independent ratios. Within these constraints, one can map these ratios in the soil gas data in order to determine if they form coherent spatial clusters of similar composition, thereby indicating control primarily by the subsurface contamination. Unlike soil gas surveys conducted only with field screening instruments, there are no false anomalies when these components are properly collected and analyzed using laboratory gas chromatography methods. These specific gases do not occur naturally and can only be sourced by a petroleum product. The presence of elevated levels of these components in the shallow soil gas indicates the presence of a shallow source at one meter in depth where they were measured. They will either represent a cone of dispersion from a local source (leak or spill) or they must represent a vapor trail from the migration pathway followed by subsurface contamination that underlies the soil gas site. When combined with continuous vertical measurements of the contamination within specific boreholes and monitor wells, it is possible to provide a three-dimensional picture of the contaminated sediments providing the migration pathways. The vertical distribution of the subsurface contamination can only be determined by analyzing the vertical distribution of the petroleum products from soil cores collected during drilling. It cannot be determined from only soil gas data alone. 4.0 Monitor Wells Locations for one hundred and five (105) monitor wells were selected based upon the soil vapor plume maps. Soil core samples were collected continuously from the ground surface to groundwater in all boreholes. Seventy-two of the 105 monitor wells (69%) encountered measurable levels of product ranging in thickness from 0.005 meters to as much as 1.87 meters. A revised product thickness map is shown on Plate 2 and a normal butane contour map is shown on Plate 3, which also contains an interpretative summary of the products found in the monitor wells. These monitor wells were used for sampling the dissolved phase and liquid phase (free product) hydrocarbons from the groundwater and rock strata and for fingerprinting the specific products found in the wells. The data obtained from these monitor wells also includes subsurface stratigraphy, depth to liquid product and/or groundwater and information on hydrocarbon contaminant concentrations of rock cuttings and cores collected

from various depths. The boreholes have been utilized to establish the vertical extent of petroleum contaminants in the subsurface strata at depth. The soil vapor surveys identified the horizontal limits, and monitor wells defined the vertical extent of the petroleum product contaminant plumes, and served as the basis for locating potential product recovery wells. These wells can be used to monitor and measure product, dissolved and vapor phase hydrocarbons during future remediation activities. There is no relationship between the values exhibited by the soil gases and the thickness, or abundance of free product at depth below the soil gas anomalies. The saturated vapor pressure associated with liquid free product is the same for a film (“sheen”) as for several meters of free product. The saturated vapor pressure is controlled by solubility of the specific gas in the liquid product. It will vary with temperature (similar to water vapor pressure with its associated liquid phase) but will not change in association with changes in the thickness of the liquid product. As noted above, these vertical changes in thickness or volume can only be ascertained by measurements made in monitor wells. The value of the soil gas data is to provide horizontal localization of the anomalous areas so that random drilling can be avoided. 5.0 Discussion and Results Surface geochemical methods were used to map the location of subsurface petroleum hydrocarbon plumes, their boundaries and areas where new releases have occurred. A total of over 3150 four-foot soil vapor samples were collected on a 30 meter grid spacing covering approximately 75% of the refinery area. Soil gas component contour maps were used to place/drill 105 monitor wells. Data from the soil gas surveys and wells allowed for delineation of both the horizontal and vertical extent of specific plumes and localized pods of subsurface contamination. High resolution capillary gas chromatography conducted on the vapor, residual, dissolved and free phase hydrocarbon contamination allowed for specific products to be identified. With this approach the hydrogeology could be better characterized; both crude oil and refined petroleum products were recognized and individual product pods were better defined. The Bay area where the finished gasoline/crude oil contamination occurs is clearly defined by the soil gas data. The origin of the two soil gas plumes is no longer a current source area. A steam-power generation plant is currently located where this plume originated, removing the potential for an active source. The contamination from this former source area has moved down gradient toward the bay, where seepage occurs at the outcrop. Monitor wells drilled on the soil gas anomalies confirmed the migration pathways and defined a current source area where this contamination has pooled. As shown in Plate 3, new boundaries defining the locations of known contamination pods have been defined along the south boundary using specific chemical fingerprints, which can distinguish the different pods of crude oil and/or refined products. The differences in the areal extents of the different contaminant plumes appear to be controlled by their location within different terraces, supplemented by variable stratigraphy, porosity, permeability and possibility fractures in the carbonate bedrock. These factors also account for the discontinuous lateral and vertical migration pathways. Most of the crude oil in these pods is very weathered and appears to have a common origin, suggesting a relationship with the earliest releases reported, which date back to the 1970’s. The newer refined products, mixed with the older crude, are mainly gasoline additives and intermediate products (not finished gasolines). Most of these newer pods are found on the second to youngest terrace, which appears to be partially controlling downdip migration. Two new contaminant plumes have been defined along the southeast boundary. One of these newly defined plumes contains straight run gasoline, and the second contains nearly pure alkylation products. Numerous cones of dispersion associated with areas containing leakages and/or spills of refined products are clearly defined by the soil gas plume maps. One of the most serious leak areas occurs in the main process area, where percent levels of various light gases were found in close proximity to an active leak defined by this survey. The thickness of the vadose zone in these areas has thus far reduced the impact to the ground water under these cones of dispersion. Mitigation of this active leak will reduce product loses and prevent future environmental problems. Left undiscovered and untreated, such leakage areas would become serious problems in the future.

The monitor wells installed in the adjacent town contained very little product contamination. Slightly elevated ground water elevations were defined in these offsite well which will serve to retard migration of free phase product from the south boundary of the refinery. No further action was required within the town. Using a non-random soil gas/monitor well grid approach, it was possible to determine specific fingerprints for the products found in the monitor wells and to ascertain that the large plume mapped by random drilling was actually made up of many separate product pods. Even more important, this technology has demonstrated that these earlier estimates for product contamination were excessive. New estimates based on the more accurate mapping of the facility suggest the actual volume of product in the subsurface probably ranges from 96,000 to 192,000 barrels for the entire refinery. Results of the reassessment defined the location of the contamination seeping into the bay. In addition, the data allowed for the determination that none of the contaminated areas found on the northern, upper terraces, or along the south boundary of the refinery are moving toward the bay. This study also showed that the adjacent town contains only minor contamination, and that further offsite contamination could be prevented with appropriate remedial action. 6.0 References Jones, V.T., and R.J. Drozd, 1983. Predictions of Oil or Gas Potential by Near-Surface Geochemistry, AAPG
Bull., V. 67, pp 932-952. Jones, V.T., and P.N. Agostino, 1998. Case Studies of Anaerobic Methane Generation at a Variety of
Hydrocarbon Fuel Contaminated Sites. NGWA Petroleum Hydrocarbons and Organic Chemicals in Ground Water: Prevention, Detection, and Remediation.
Jones, V.T., Matthews, M.D., and D. Richers, 2000. Light Hydrocarbons in Petroleum and Natural Gas
Exploration. Handbook of Exploration Geochemistry: Geochemical Remote Sensing of the Sub-Surface. Vol. 7, Chapter 5, Elsevier Science Publishers, Editor Martin Hale.
Authors Dr. Victor T. Jones, III, President, Exploration Technologies, Inc. has been actively involved in the research and development of surface geochemical techniques to both exploration and environmental applications for more than 27 years, initially at the Superior and Gulf Oil Companies, Woodward Clyde Oceaneering and at ETI. Dr. Jones has a Ph.D. in physics from Texas A&M University. Dr. Patrick N. Agostino, Vice President, Exploration Technologies, Inc. has more than 26 years of experience in the petroleum exploration and environmental industries. He has directed various baseline environmental studies on oil and gas producing properties, refinery and chemical facilities for the purpose of remediating and/or bringing such sites into compliance with regulatory agencies. Dr. Agostino has a Ph.D. in Geology from Renssealer Polytechnic Institute.
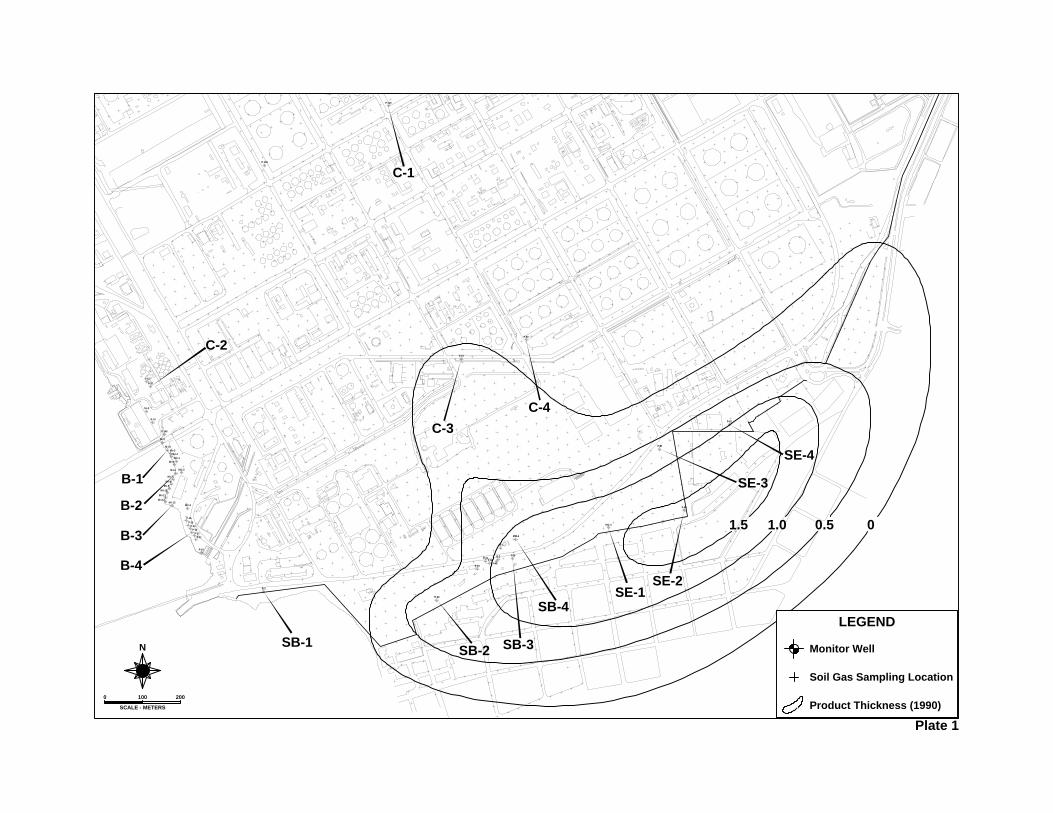
Plate 1
1.5 1.0 0.5 0
B-3
P-110
P-100
S-I-1
S-I-2
S-I-3
P-20
P-17
P-140
P-10
P-11P-12
P-13P-14
P-15
P-16
INC-3M-I-13
M-I-12
M-I-11
M-I-10
M-I-9
M-I-8
M-I-7
INC-2M-I-6
M-I-5INC-1
M-I-4M-I-3
M-I-2
M-I-1
P-80
P-70
P-62
P-61
P-60
P-31
P-40
INC-4
B-1
MW-6
T-50B-2P-32
P-30
C-2
B-3
B-4
SB-3
SB-4
SB-2SB-1
B-2
SE-4
B-1
C-1
C-3
C-4
SE-3
SE-2SE-1
N Monitor Well
Soil Gas Sampling Location
1.5 Product Thickness (1990)
LEGEND
SCALE - METERS
0 100 200
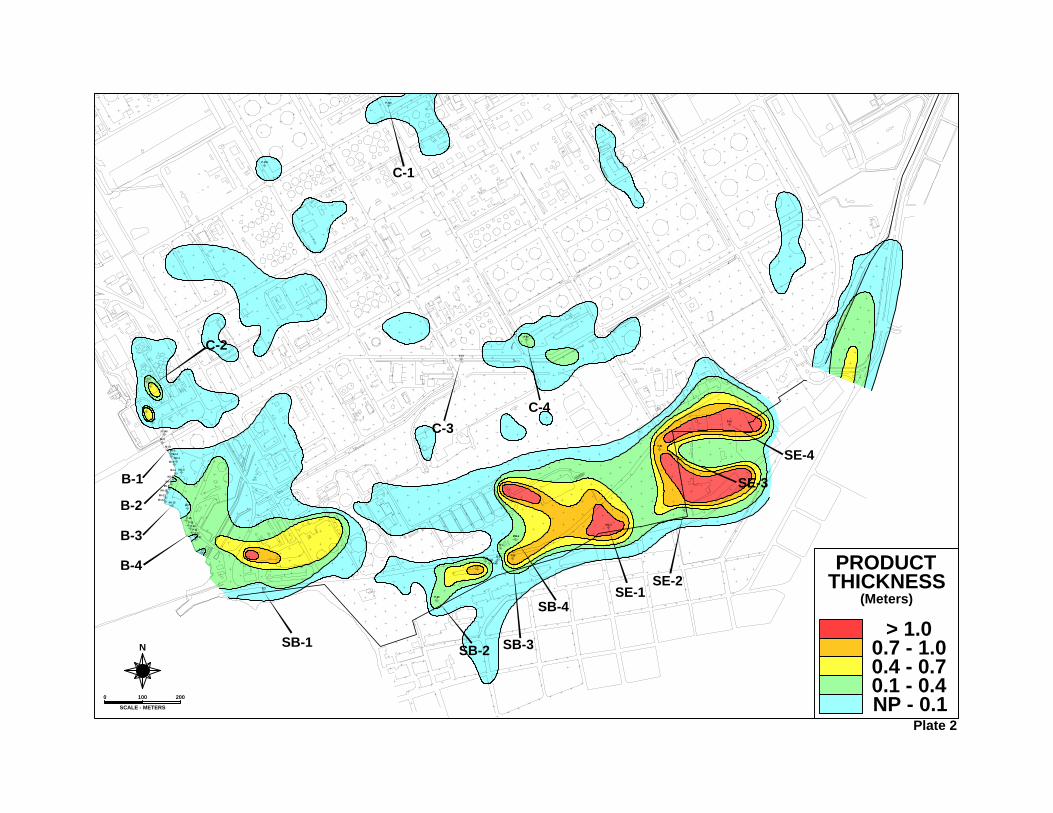
Plate 2
B-3
P-110
P-100
S-I-1
S-I-2
S-I-3
P-20
P-17
P-140
P-10
P-11P-12
P-13P-14
P-15
P-16
INC-3M-I-13
M-I-12
M-I-11
M-I-10
M-I-9
M-I-8
M-I-7
INC-2M-I-6
M-I-5INC-1
M-I-4M-I-3
M-I-2
M-I-1
P-80
P-70
P-62
P-61
P-60
P-31
P-40
INC-4
B-1
MW-6
T-50B-2P-32
P-30
C-2
B-3
B-4
SB-3
SB-4
SB-2SB-1
B-2
SE-4
B-1
C-1
C-3
C-4
SE-3
SE-2SE-1
SCALE - METERS
0 100 200
(Meters)THICKNESSPRODUCT
> 1.00.7 - 1.00.4 - 0.70.1 - 0.4NP - 0.1
N
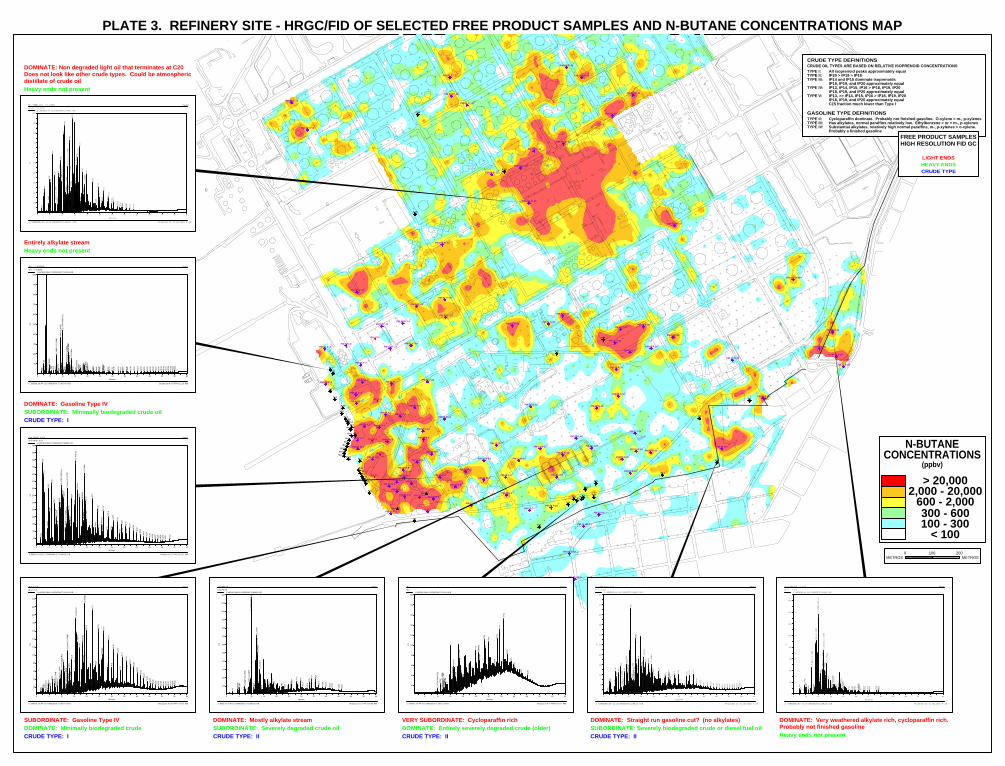
PLATE 3. REFINERY SITE - HRGC/FID OF SELECTED FREE PRODUCT SAMPLES AND N-BUTANE CONCENTRATIONS MAP
B-3
P-110
P-100
P-120
S-I-1
S-I-2
S-I-3
P-20
P-17
P-140
P-10
P-11P-12
P-13P-14
P-15
P-16
INC-3M-I-13
M-I-12
M-I-11
M-I-10
M-I-9
M-I-8
M-I-7
INC-2M-I-6
M-I-5INC-1
M-I-4M-I-3
M-I-2
M-I-1
P-80
P-70
P-62
P-61
P-60
P-31 P-40
INC-4
B-1
MW-6
T-50B-2
P-32
P-30
PM-01 G-22 PM-02 F-24
PM-03 G-20
PM-04 E-20
PM-05 Q-4
PM-06 O-4
PM-07 Q-5
PM-08 Ñ-1
PM-09 P-3
PM-10 K-39
PM-11 I-13
PM-12 M-1
PM-13 M-14
PM-14 L-19
PM-15 K-2
PM-16 R-6
PM-17 O-17PM-18 J-18PM-19 M-17
PM-20 P-5
PM-21 N-31
PM-22 Ñ-12
PM-23 R-8
PM-24 Ñ-14
PM-25 M-9
PM-26 Q-23
PM-27 I-24
PM-28 F-10PM-29 G-7
PM-30 J-6
PM-31 O-9
PM-32 N-8
PM-33 Ñ-5PM-34 N-5
PM-35 K-15
PM-36 L-9
PM-37 N-28
PM-38 Q-3
PM-39 P-34
PM-40 Q-37
PM-41 U-3
PM-42 R-4
PM-43 F’-2
PM-44 X-4
PM-45 H’-14
PM-46 Y-2
PM-47 Y-5
PM-48 V-5PM-49 X-1
PM-50 I’-11
PM-51 W-2
PM-52 X-7
PM-53 F’-11
PM-54 B’-2
PM-55 E’-14
PM-56 B’-7
PM-57 P-42
PM-58 P-39PM-59 I’-6
PM-60 F’-7
PM-61 J’-4
PM-62 X-9
PM-63 U-10
PM-64 I’-16
PM-65 T-37
PM-66 Z-11
PM-67 A’-24
PM-68 U-13
PM-69 T-9
PM-70 S-35
PM-71 Y-28
PM-72 E-48
PM-73 E-86
PM-74 HH-7
PM-75 II-6
PM-76 S-39
PM-77 R’-31
PM-78 C’-5
PM-79 B-7
PM-80 EE-9
PM-81 R’-45
PM-82 N’-11
PM-83 R’-25
PM-84 Y-30
PM-85 BB-8
PM-86 H-51
PM-87 H’-20
PM-88 A’’-27
PM-89 E-39
PM-90 G-48
PM-91 Y’-40
PM-92 D’-6
PM-93 F’-19
PM-105 N’-23
PM-96 Q’-29
PM-94 Q’-35
PM-102 Q’-42
PM-103 W’-41
PM-97 H’’-8
PM-95 L’’-8
PM-98 C’’-26
PM-99 E’’-27
PM-100 O-59
PM-104 B’-47
PM-101 N’-35
BH-H’10
BH-S-1
BH-A’-5
BH-W-4
BH-U-4
CAL-1
CAL-2
N'-35 PM-101 11.215m Page1
J:\HPDATA\99-2113\PRODUCT\109837.01R Printed on 3/15/2000 6:20
100
200
300
400
500
600
700
800
900
1000
mV
0 5 10 15 20 25 30 35 40 45 50 55 60
Minutes
N'-35 11.215m
J:\HPDATA\99-2113\PRODUCT\109837.01R
NC4
IC5
NC5
CP2,3DMB
2MP
3MP
NC6
MCP
2,4DMP+2,2,3TMB
Benzene
CH
2MHx+2,3DMP
3MHx
c1,3DMCP
t1,3DMCP
t1,2DMCP
2,2,4TMP+DMCP(s)
NC7
MCH
EtCP
2,5DMHx+2,2,3TMP
2,3,4TMP
Toluene+2,3,3TMP
2,3DMHx
2MHp
3MHp
2,2,5TMHx
NC8
EtBz
m+p-Xylenes
o-Xylene
NC9
IPBz
NPBz
1M3EtBz
1,3,5TMBz
1,2,4TMBzNC10
1,2,3TMBz
Indane
NC11
C4Bz Naph
NC12
IP13
2MNaph
1MNaph
NC13
IP15 NC14
IP16
NC15
NC16
IP18
NC17
IP19
NC18
1P20
NC19
NC20
H-51 PM-86; 0.1ul Page1
J:\HPDATA\99-2113\PRODUCT\109826.01R Printed on 3/10/2000 4:14
0
200
400
600
800
1000
1200
1400
1600
mV
0 5 10 15 20 25 30 35 40 45 50 55 60
Minutes
H-51; 0.1ul
J:\HPDATA\99-2113\PRODUCT\109826.01R
IC5
NC5
CP
2,3DMB
2MP
3MP
NC6
MCP
2,4DMP+2,2,3TMB
Benzene
CH
2MHx+2,3DMP
3MHx
c1,3DMCP
t1,3DMCP
t1,2DMCP
2,2,4TMP+DMCP(s)
NC7
MCH
EtCP
2,5DMHx+2,2,3TMP
2,3,4TMP
Toluene+2,3,3TMP
2,3DMHx
2MHp
3MHp
2,2,5TMHx
NC8
EtBz
m+p-Xylenes
o-Xylene
NC9
IPBz NPBz
1M3EtBz
1,2,4TMBz
NC10
1,2,3TMBz
Indane
NC11
Naph
NC12
IP13
2MNaph
1MNaph
NC13
IP15
NC14
IP16
NC15
IP18
NC17
IP19
B-7 PM-79 0.1ul Page1
J:\HPDATA\99-2113\PRODUCT\109823.01R Printed on 3/10/2000 3:17
50
100
150
200
250
300
350
400
450
500mV
0 5 10 15 20 25 30 35 40 45 50 55 60
Minutes
B-7 0.1ul
J:\HPDATA\99-2113\PRODUCT\109823.01R
IC4
NC4
IC5
NC5
CP2,3DMB
2MP
3MPNC6
MCP
2,4DMP+2,2,3TMB
Benzene
CH2MHx+2,3DMP
3MHx
c1,3DMCP
t1,3DMCP t1,2DMCP
2,2,4TMP+DMCP(s)
NC7
MCH
EtCP
2,5DMHx+2,2,3TMP
2,3,4TMP
Toluene+2,3,3TMP
2,3DMHx
2MHp
3MHp
2,2,5TMHx
NC8
EtBz
m+p-Xylenes
o-Xylene
NC9
IPBz
NPBz
1M3EtBz
1,3,5TMBz
1M2EtBz
1,2,4TMBz
NC10
1,2,3TMBz
Indane
NC11
C4Bz
Naph
NC12IP13
2MNaph
1MNaph
NC13
IP15
NC14 IP16
NC15
NC16
IP18
NC17
IP19
NC18
1P20
NC19
NC20
NC21
NC22
NC23
NC24
NC25
NC26
NC27
NC28
NC29
NC30
NC31
NC32
NC33
NC34
NC35
J-18,PM-18 Page1
J:\HPDATA\99-2113\PRODUCT\108032.03R Printed on 12/1/99 3:28:08 PM
100
200
300
400
500
600
700
800
900
1000
1100
1200
mV
0 5 10 15 20 25 30 35 40 45 50 55 60
Minutes
J-18,PM-18J:\HPDATA\99-2113\PRODUCT\108032.03R
IC5 2,
3DM
B2M
P3M
P
MC
P2,
4DM
P+2,
2,3T
MB
CH
2MH
x+2,
3DM
Pc1
,3D
MC
Pt1
,3D
MC
P2,
2,4T
MP+
DM
CP(
s)M
CH
EtC
P 2,5D
MH
x+2,
2,3T
MP
2,3,
4TM
PTo
luen
e+2,
3,3T
MP
2,3D
MH
x2M
Hp
3MH
p2,
2,5T
MH
xN
C8
EtBz
m+p
-Xyl
enes
NC
9IP
Bz 1M3E
tBz
1,2,
4TM
BzIn
dane
C4B
zN
aph
IP13 2M
Nap
h1M
Nap
h IP15
NC
14IP
16N
C15
NC
16IP
18N
C17
IP19
NC
181P
20
NC
19
NC
20
NC
21
NC
22N
C23
NC
25N
C26
B-2 Page1
C:\HPDATA\99-2113\PRODUCT\103123.01R Printed on 9/3/1999 4:33:17 PM
20
40
60
80
100
120
140
160
180
200
mV
5 10 15 20 25 30 35 40 45 50 55 60
Minutes
B-2C:\HPDATA\99-2113\PRODUCT\103123.01R
2,2,
4TM
P+D
MC
P(s)
MC
H2,
5DM
Hx+
2,2,
3TM
P2,
3,4T
MP
Tolu
ene+
2,3,
3TM
P2,
3DM
Hx
2MH
p3M
Hp
EtBz
m+p
-Xyl
enes
o-Xy
lene
NC
9IP
Bz1,
3,5T
MBz
1,2,
4TM
Bz1,
2,3T
MBz
Inda
ne
NC
11C
4Bz
Nap
hN
C12
IP13
2MN
aph
1MN
aph
NC
13
IP15
NC
14
IP16
NC
15
NC
16IP
18N
C17
IP19
NC
181P
20
NC
19
NC
20
NC
21
NC
23
NC
25
B-3, 0.1 ul Page1
C:\HPDATA\99-2113\PRODUCT\103119.01R Printed on 8/16/1999 5:10:32 PM
20
40
60
80
100
120
140
160
180
200
220
240
mV
0 5 10 15 20 25 30 35 40 45 50 55 60
Minutes
B-3, 0.1 ulC:\HPDATA\99-2113\PRODUCT\103119.01R
IC4
NC
4 IC5
NC
5D
CM
Sol
vent
CP 2,
3DM
B 2M
P3M
PN
C6
MC
P2,
4DM
P+2,
2,3T
MB
Benz
ene
CH
2MH
x+2,
3DM
P3M
Hx
c1,3
DM
CP
t1,3
DM
CP
t1,2
DM
CP
2,2,
4TM
P+D
MC
P(s)
NC
7M
CH
EtC
P 2,5
DM
Hx+
2,2,
3TM
P2,
3,4T
MP
Tolu
ene+
2,3,
3TM
P2,
3DM
Hx
2MH
p3M
Hp
2,2,
5TM
Hx
NC
8
EtBz
m+p
-Xyl
enes
o-Xy
lene
NC
9IP
BzN
PBz
1M3E
tBz
1,3,
5TM
Bz1M
2EtB
z1,
2,4T
MBz
NC
101,
2,3T
MBz
Inda
ne
NC
11C
4Bz
Nap
hN
C12
IP13
2MN
aph
1MN
aph
NC
13
IP15
NC
14
IP16
NC
15
NC
16IP
18N
C17
IP19
NC
181P
20
NC
19
NC
20
NC
21
NC
22
NC
23
NC
24N
C25
NC
26N
C27
NC
28N
C29
NC
30N
C31
NC
32N
C33
NC
34N
C35
O-9, PM-31, 0.1ul Page1
J:\HPDATA\99-2113\PRODUCT\108054.01R Printed on 12/1/99 4:14:57 PM
50
100
150
200
250
300
350
400
450
500
550
600
650
700
mV
0 5 10 15 20 25 30 35 40 45 50 55 60
Minutes
O-9, PM-31, 0.1ulJ:\HPDATA\99-2113\PRODUCT\108054.01R
NC
4IC
5N
C5
CP
2,3D
MB
2MP
3MP
NC
6M
CP
2,4D
MP+
2,2,
3TM
BBe
nzen
eC
H2M
Hx+
2,3D
MP
3MH
xc1
,3D
MC
Pt1
,3D
MC
Pt1
,2D
MC
P2,
2,4T
MP+
DM
CP(
s)N
C7
MC
HEt
CP
2,5D
MH
x+2,
2,3T
MP
2,3,
4TM
PTo
luen
e+2,
3,3T
MP
2,3D
MH
x2M
Hp
3MH
p2,
2,5T
MH
xN
C8
EtBz
m+p
-Xyl
enes
o-Xy
lene
NC
9IP
Bz NPB
z1M
3EtB
z1,
3,5T
MBz
1M2E
tBz
1,2,
4TM
BzN
C10
1,2,
3TM
BzIn
dane
NC
11C
4Bz
Nap
hN
C12
IP13
2MN
aph
1MN
aph
NC
13
IP15
NC
14
IP16
NC
15
NC
16IP
18N
C17
IP19
NC
181P
20
NC
19
NC
20
NC
21
NC
22
NC
23
NC
24N
C25
NC
26N
C27
NC
28N
C29
NC
30N
C31
NC
33
SI-1, ~1:10 DCM Page1
C:\HPDATA\99-2113\PRODUCT\103105.03R Printed on 9/3/1999 4:52:26 PM
100
200
300
400
500
600
700
800
900
1000
mV
0 5 10 15 20 25 30 35 40 45 50 55 60
Minutes
SI-1, ~1:10 DCMC:\HPDATA\99-2113\PRODUCT\103105.03R
IC4
NC
4IC
5N
C5
DC
M S
olve
ntC
P2,
3DM
B2M
P3M
PN
C6
MC
P2,
4DM
P+2,
2,3T
MB
Benz
ene
CH
2MH
x+2,
3DM
P3M
Hx
c1,3
DM
CP
t1,3
DM
CP
t1,2
DM
CP
2,2,
4TM
P+D
MC
P(s)
NC
7M
CH
EtC
P2,
5DM
Hx+
2,2,
3TM
P2,
3,4T
MP
Tolu
ene+
2,3,
3TM
P2,
3DM
Hx
2MH
p3M
Hp
2,2,
5TM
Hx
NC
8
EtBz m+p
-Xyl
enes
o-Xy
lene
NC
9IP
BzN
PBz
1M3E
tBz
1,3,
5TM
Bz1M
2EtB
z1,
2,4T
MBz
NC
101,
2,3T
MBz
Inda
ne
NC
11C
4Bz
Nap
hN
C12
IP13
2MN
aph
1MN
aph
NC
13
IP15
NC
14
IP16
NC
15
NC
16IP
18N
C17
IP19
NC
181P
20
NC
19
NC
20
NC
21
NC
22
NC
23
NC
24N
C25
NC
26N
C27
NC
28N
C29
NC
30N
C31
NC
32N
C33
NC
34N
C35
DOMINATE: Non degraded light oil that terminates at C20Does not look like other crude types. Could be atmosphericdistillate of crude oilHeavy ends not present
Heavy ends not presentEntirely alkylate stream
DOMINATE: Gasoline Type IVSUBORDINATE: Minimally biodegraded crude oilCRUDE TYPE: I
SUBORDINATE: Gasoline Type IVDOMINATE: Minimally biodegraded crudeCRUDE TYPE: I
SUBORDINATE: Severely degraded crude oilDOMINATE: Mostly alkylate stream
CRUDE TYPE: II CRUDE TYPE: IIDOMINATE: Entirely severely degraded crude (older)VERY SUBORDINATE: Cycloparaffin rich
SUBORDINATE: Severely biodegraded crude or diesel fuel oilDOMINATE: Straight run gasoline cut? (no alkylates)
CRUDE TYPE: II Heavy ends not present
DOMINATE: Very weathered alkylate rich, cycloparaffin rich.Probably not finished gasoline
(ppbv)CONCENTRATIONS
N-BUTANE
< 100
> 20,0002,000 - 20,000
600 - 2,000300 - 600100 - 300
CRUDE TYPE DEFINITIONS
Has alkylates, normal paraffins relatively low. Ethylbenzene > or = m-, p-xylenesTYPE IV:TYPE III: TYPE II:
Probably a finished gasolineSubstantial alkylates, relatively high normal paraffins, m-, p-xylenes > o-xylene.
Cycloparaffin dominate. Probably not finished gasoline. O-xylene > m-, p-xylenesGASOLINE TYPE DEFINITIONS
IP13, >> IP14, IP15, IP16 > IP18, IP19, IP20
IP13, IP14, IP15, IP16 > IP18, IP19, IP20
IP14 and IP15 dominate isoprenoidsIP20 > IP19 > IP18All isoprenoid peaks approximately equal
C15 fraction much lower than Type IIP18, IP19, and IP20 approximately equal
TYPE V:IP18, IP19, and IP20 approximately equal
TYPE IV:IP18, IP19, and IP20 approximately equal
TYPE III:TYPE II:TYPE I:CRUDE OIL TYPES ARE BASED ON RELATIVE ISOPRENOID CONCENTRATIONS
METROS2001000
METROS
HIGH RESOLUTION FID GCFREE PRODUCT SAMPLES
CRUDE TYPEHEAVY ENDSLIGHT ENDS

MW-6, 0.1 ul Page1
C:\HPDATA\99-2113\PRODUCT\103126.01R Printed on 8/16/1999 5:28:13 PM
50
100
150
200
250
300
350
400
450
500
550
600
650
700
750
mV
0 5 10 15 20 25 30 35 40 45 50 55 60
Minutes
MW-6, 0.1 ul
C:\HPDATA\99-2113\PRODUCT\103126.01R
2,3
DM
B2M
P3M
P
MC
P 2,4
DM
P+
2,2
,3T
MB
CH
2MH
x+2,
3DM
P3M
Hx
c1,3
DM
CP
t1,3
DM
CP
t1,2
DM
CP
2,2
,4T
MP
+D
MC
P(s
)
MC
HE
tCP
2,5D
MH
x+2,
2,3T
MP 2
,3,4
TM
PT
olu
ene+
2,3
,3T
MP
2,3D
MH
x2M
Hp
3MH
p2,
2,5T
MH
x
EtB
zm
+p-X
ylenes
o-X
ylen
eN
C9
IPB
z NP
Bz 1,3
,5T
MB
z1,2
,4T
MB
z1,2
,3T
MB
zIn
dane
NC
11C
4B
z
Nap
h
IP13
2MN
aph
1MN
aph
NC
13
IP15
NC
14 IP16
NC
15
NC
16IP
18
IP19
NC
181P
20
NC
19
NC
20
NC
21
NC
25
T-50 Page1
Not present Entirely topped and severely biodegraded crude oil
10
20
30
40
50
60
70
80
90
100
110
mV
0 5 10 15 20 25 30 35 40 45 50 55 60
Minutes
T-50
C:\HPDATA\99-2113\PRODUCT\103125.01R
m+
p-X
ylenes
o-X
ylen
eN
C9
IPB
zN
PB
z1,3
,5T
MB
z1,2
,4T
MB
z1,2
,3T
MB
zIn
dane
NC
11C
4B
z
Nap
h
IP13
2MN
aph
1MN
aph
NC
13
IP15
NC
14
IP16
NC
15
NC
16
IP18
IP19
NC
181P
20
NC
19
NC
20
NC
21
NC
25
II
P-20, 0.1 ul Page1
C:\HPDATA\99-2113\PRODUCT\103121.01R Printed on 9/3/1999 4:43:02 PM
20
40
60
80
100
120
140
160
180
200
220
mV
0 5 10 15 20 25 30 35 40 45 50 55 60
Minutes
P-20, 0.1 ul
C:\HPDATA\99-2113\PRODUCT\103121.01R
CH 2M
Hx+
2,3D
MP
3MH
xc1
,3D
MC
Pt1
,3D
MC
Pt1
,2D
MC
P2,2
,4T
MP
+D
MC
P(s
)
MC
HE
tCP 2,5D
MH
x+2,
2,3T
MP
2,3
,4T
MP
Tolu
ene+
2,3
,3T
MP
2,3D
MH
x2M
Hp
3MH
p 2,2,
5TM
Hx
EtB
zm
+p-X
ylenes
o-X
ylen
eN
C9
IPB
zN
PB
z1,3
,5T
MB
z1,2
,4T
MB
z1,2
,3T
MB
zIn
dane
NC
11 C4B
z
Nap
h
IP13
2MN
aph
1MN
aph
NC
13
IP15
NC
14
IP16
NC
15
NC
16IP
18 IP
19
NC
181P
20
NC
19
NC
20
NC
21
NC
25
B-3, 0.1 ul Page1
C:\HPDATA\99-2113\PRODUCT\103119.01R Printed on 8/16/1999 5:10:32 PM
20
40
60
80
100
120
140
160
180
200
220
240
mV
0 5 10 15 20 25 30 35 40 45 50 55 60
Minutes
B-3, 0.1 ul
C:\HPDATA\99-2113\PRODUCT\103119.01R
IC4
NC
4 IC5
NC
5D
CM
Solv
ent
CP 2,3
DM
B 2M
P3M
PN
C6
MC
P2,4
DM
P+
2,2
,3T
MB
Ben
zene
CH
2MH
x+2,
3DM
P3M
Hx
c1,3
DM
CP
t1,3
DM
CP
t1,2
DM
CP
2,2
,4T
MP
+D
MC
P(s
)N
C7
MC
HE
tCP 2
,5D
MH
x+2,
2,3T
MP
2,3
,4T
MP
Tolu
ene+
2,3
,3T
MP
2,3D
MH
x2M
Hp
3MH
p2,
2,5T
MH
xN
C8
EtB
zm
+p-X
ylenes
o-X
ylen
eN
C9
IPB
z NP
Bz
1M
3E
tBz
1,3
,5T
MB
z1M
2E
tBz
1,2
,4T
MB
zN
C10
1,2
,3T
MB
zIn
dane
NC
11C
4B
z
Nap
h
NC
12IP
13
2MN
aph
1MN
aph
NC
13
IP15
NC
14
IP16
NC
15
NC
16IP
18
NC
17IP
19
NC
181P
20
NC
19
NC
20
NC
21
NC
22
NC
23
NC
24
NC
25
NC
26
NC
27
NC
28
NC
29
NC
30N
C31
NC
32N
C33
NC
34N
C35
FIGURE 1. SOUTH BOUNDARY AREA
SB-3 SB-4
SB-1 SB-2
P-13 Page1
C:\HPDATA\99-2113\PRODUCT\103115.01R Printed on 8/21/1999 1:16:58 PM
50
100
150
200
250
300
350
400
450
mV
5 10 15 20 25 30 35 40 45 50 55 60
Minutes
P-13
C:\HPDATA\99-2113\PRODUCT\103115.01R
NC
4IC
5N
C5
DC
M S
olv
ent
CP
2,3
DM
B2M
P3M
PN
C6
MC
P2,4
DM
P+
2,2
,3T
MB
Ben
zene CH
2MH
x+2,
3DM
P3M
Hx
c1,3
DM
CP
t1,3
DM
CP
t1,2
DM
CP
2,2
,4T
MP
+D
MC
P(s
)N
C7
MC
HE
tCP
2,5D
MH
x+2,
2,3T
MP
2,3
,4T
MP
Tolu
ene+
2,3
,3T
MP
2,3D
MH
x2M
Hp
3MH
p2,
2,5T
MH
xN
C8
EtB
zm
+p-X
ylenes
o-X
ylen
eN
C9
IPB
z NP
Bz
1M
3E
tBz
1,3
,5T
MB
z1M
2E
tBz
1,2
,4T
MB
zN
C10
1,2
,3T
MB
zIn
dane
NC
11C
4B
z
Nap
h
NC
12IP
13
2MN
aph
1MN
aph
NC
13
IP15
NC
14
IP16
NC
15
NC
16IP
18
NC
17IP
19
NC
181P
20
NC
19
NC
20
NC
21
NC
22
NC
23
NC
24
NC
25
NC
26
NC
27
NC
28
NC
29
NC
30N
C31
NC
33
MI-13 Page1
C:\HPDATA\99-2113\PRODUCT\103113.01R Printed on 9/9/1999 2:21:23 PM
50
100
150
200
250
300
350
400
450
mV
0 5 10 15 20 25 30 35 40 45 50 55 60
Minutes
MI-13
C:\HPDATA\99-2113\PRODUCT\103113.01R
MC
H
2,3
,4T
MP
Tolu
ene+
2,3
,3T
MP
2,3D
MH
x2M
Hp
3MH
p2,
2,5T
MH
xN
C8
EtB
zm
+p-X
ylenes
o-X
ylen
eN
C9
IPB
z
NP
Bz
1,3
,5T
MB
z1M
2E
tBz
1,2
,4T
MB
zN
C10
1,2
,3T
MB
zIn
dane
NC
11C
4B
z
Nap
h
NC
12IP
13
2MN
aph
1MN
aph
NC
13
IP15
NC
14
IP16
NC
15
NC
16IP
18
NC
17IP
19
NC
181P
20
NC
19
NC
20
NC
21
NC
22
NC
23
NC
24
NC
25
NC
26
NC
27
NC
28
NC
29
NC
30N
C31
NC
32N
C33
NC
34
MI-6 Page1
C:\HPDATA\99-2113\PRODUCT\103139.01R Printed on 9/3/1999 4:27:54 PM
20
40
60
80
100
120
140
160
180
200
220
240
260
280
300
mV
5 10 15 20 25 30 35 40 45 50 55 60
Minutes
MI-6
C:\HPDATA\99-2113\PRODUCT\103139.01R
2M
P
NC
6M
CP
CH 2M
Hx+
2,3D
MP
3MH
x2,2
,4T
MP
+D
MC
P(s
)N
C7
MC
HE
tCP
2,5D
MH
x+2,
2,3T
MP
2,3
,4T
MP
Tolu
ene+
2,3
,3T
MP
2,3D
MH
x 2MH
p3M
Hp
2,2,
5TM
Hx
NC
8
EtB
zm
+p-X
ylenes
o-X
ylen
e NC
9IP
Bz N
PB
z1M
3E
tBz
1,3
,5T
MB
z1M
2E
tBz
1,2
,4T
MB
zN
C10
1,2
,3T
MB
zIn
dane
NC
11C
4B
z
Nap
h
NC
12IP
13
2MN
aph
1MN
aph
NC
13
IP15
NC
14
IP16
NC
15
NC
16IP
18
NC
17IP
19
NC
181P
20
NC
19
NC
20
NC
21
NC
22
NC
23
NC
24
NC
25
NC
26
NC
27
NC
28
NC
29
NC
30N
C31
NC
32N
C33
NC
35
MI-2 Page1
C:\HPDATA\99-2113\PRODUCT\103134.01R Printed on 9/3/1999 4:38:57 PM
20
40
60
80
100
120
140
160
180
200
220
mV
0 5 10 15 20 25 30 35 40 45 50 55 60
Minutes
MI-2
C:\HPDATA\99-2113\PRODUCT\103134.01R
1M
2E
tBz
1,2
,4T
MB
zN
C10
1,2
,3T
MB
z
NC
11C
4B
z
Nap
h
NC
12IP
13
2MN
aph
1MN
aph
NC
13
IP15
NC
14
IP16
NC
15
NC
16IP
18
NC
17IP
19
NC
181P
20
NC
19
NC
20
NC
21
NC
22
NC
23
NC
24
NC
25
NC
26
NC
27
NC
28
FIGURE 2. BAY AREA
B-4B-3
B-2B-1

P-61, 0.1 ul Page1
C:\HPDATA\99-2113\PRODUCT\103129.01R Printed on 9/3/1999 4:48:22 PM
50
100
150
200
250
300
350
mV
0 5 10 15 20 25 30 35 40 45 50 55 60
Minutes
P-61, 0.1 ul
C:\HPDATA\99-2113\PRODUCT\103129.01R
IC5
NC
5
CP
2,3
DM
B2M
P3M
PN
C6
MC
P2,4
DM
P+
2,2
,3T
MB
Ben
zene
CH
2MH
x+2,
3DM
P3M
Hx
c1,3
DM
CP
t1,3
DM
CP t
1,2
DM
CP
2,2
,4T
MP
+D
MC
P(s
)N
C7
MC
HE
tCP 2,
5DM
Hx+
2,2,
3TM
P2,3
,4T
MP
2,3D
MH
x2M
Hp
3MH
p2,
2,5T
MH
xN
C8
EtB
zm
+p-X
ylenes
o-X
ylen
eN
C9
IPB
zN
PB
z 1M
3E
tBz
1,3
,5T
MB
z1M
2E
tBz
1,2
,4T
MB
zN
C10
1,2
,3T
MB
zIn
dane
NC
11C
4B
z
Nap
h
NC
12IP
13
2MN
aph
1MN
aph
NC
13
IP15
NC
14 IP16
NC
15
NC
16IP
18
NC
17IP
19
NC
181P
20
NC
19
NC
20
P-62 Page1
C:\HPDATA\99-2113\PRODUCT\103130.01R Printed on 9/3/1999 4:49:02 PM
20
40
60
80
100
120
140
160
180
200
220
mV
0 5 10 15 20 25 30 35 40 45 50 55 60
Minutes
P-62
C:\HPDATA\99-2113\PRODUCT\103130.01R
IC5
NC
5
CP 2
,3D
MB
2M
P3M
PN
C6
MC
P2,4
DM
P+
2,2
,3T
MB
Ben
zene
CH
2MH
x+2,
3DM
P3M
Hx
c1,3
DM
CP
t1,3
DM
CP
t1,2
DM
CP
2,2
,4T
MP
+D
MC
P(s
)N
C7
MC
HE
tCP
2,5D
MH
x+2,
2,3T
MP
2,3
,4T
MP
2,3D
MH
x2M
Hp
3MH
p2,
2,5T
MH
xN
C8
EtB
zm
+p-X
ylenes
o-X
ylen
eN
C9
IPB
zN
PB
z1M
3E
tBz
1,3
,5T
MB
z1M
2E
tBz
1,2
,4T
MB
zN
C10
1,2
,3T
MB
zIn
dane
NC
11C
4B
z
Nap
h NC
12IP
13
2MN
aph
1MN
aph
NC
13
IP15
NC
14 IP16
NC
15
NC
16
IP18
IP19
NC
181P
20
NC
19
NC
20
NC
21
NC
25
P-60 3,34M, 0.1 ul Page1
C:\HPDATA\99-2113\PRODUCT\103128.01R Printed on 9/3/1999 4:47:11 PM
5
10
15
20
25
30
35
40
45
50
55
60
65
70
mV
0 5 10 15 20 25 30 35 40 45 50 55 60
Minutes
P-60 3,34M, 0.1 ul
C:\HPDATA\99-2113\PRODUCT\103128.01R
2MH
x+2,
3DM
P3M
Hx
t1,2
DM
CP
NC
7M
CH
EtC
P2,
5DM
Hx+
2,2,
3TM
P2,3
,4T
MP
2,3D
MH
x2M
Hp
3MH
p2,
2,5T
MH
x
EtB
zm
+p-X
ylenes
o-X
ylen
eN
C9
IPB
zN
PB
z1,3
,5T
MB
z1,2
,4T
MB
z1,2
,3T
MB
zIn
dane
NC
11C
4B
z
Nap
h
IP13
2MN
aph
1MN
aph
NC
13
IP15
NC
14
IP16
NC
15
NC
16IP
18
IP19
NC
181P
20
NC
21
INC-4 Page1
C:\HPDATA\99-2113\PRODUCT\103127.01R Printed on 8/16/1999 5:46:42 PM
20
40
60
80
100
120
140
160
180
200
220
240
mV
0 5 10 15 20 25 30 35 40 45 50 55 60
Minutes
INC-4
C:\HPDATA\99-2113\PRODUCT\103127.01R
NC
5
CP 2,3
DM
B2M
P3M
PN
C6
MC
P2,4
DM
P+
2,2
,3T
MB
Ben
zene
CH
2MH
x+2,
3DM
P 3MH
xc1
,3D
MC
Pt1
,3D
MC
Pt1
,2D
MC
P2,2
,4T
MP
+D
MC
P(s
)N
C7
MC
HE
tCP
2,5D
MH
x+2,
2,3T
MP
2,3
,4T
MP
Tolu
ene+
2,3
,3T
MP
2,3D
MH
x2M
Hp
3MH
p2,
2,5T
MH
x NC
8
EtB
zm
+p-X
ylenes
o-X
ylen
eN
C9
IPB
zN
PB
z1M
3E
tBz
1,3
,5T
MB
z1M
2E
tBz
1,2
,4T
MB
zN
C10
1,2
,3T
MB
zIn
dane
NC
11C
4B
z
Nap
hN
C12
IP13
2MN
aph
1MN
aph
NC
13
IP15
NC
14 IP16
NC
15
NC
16IP
18
IP19
NC
181P
20
NC
19
NC
20
NC
25
FIGURE 3. SOUTH-EAST AREA
SE-3 SE-4
SE-2SE-1

P-110 Page1
C:\HPDATA\99-2113\PRODUCT\103131.01R Printed on 9/3/1999 4:23:56 PM
10
20
30
40
50
60
70
80
90
100
mV
0 5 10 15 20 25 30 35 40 45 50 55 60
Minutes
P-110
C:\HPDATA\99-2113\PRODUCT\103131.01R
IC5
NC
5
2M
P3M
P
2,4
DM
P+
2,2
,3T
MB
2MH
x+2,
3DM
P2,2
,4T
MP
+D
MC
P(s
)
MC
H 2,5D
MH
x+2,
2,3T
MP
2,3
,4T
MP
Tolu
ene+
2,3
,3T
MP
2,3D
MH
x2,
2,5T
MH
x
NC
9
1,2
,4T
MB
z
2MN
aph
NC
14
NC
18 NC
20
P-17, ~1:10 DCM Page1
C:\HPDATA\99-2113\PRODUCT\103106.01R Printed on 8/18/1999 9:38:34 AM
50
100
150
200
250
300
350
mV
0 5 10 15 20 25 30 35 40 45 50 55 60
Minutes
P-17, ~1:10 DCM
C:\HPDATA\99-2113\PRODUCT\103106.01R
IC5
NC
5D
CM
Solv
ent
2,3
DM
B2M
P3M
PN
C6
MC
P2,4
DM
P+
2,2
,3T
MB
CH
2MH
x+2,
3DM
P3M
Hx
2,2
,4T
MP
+D
MC
P(s
)N
C7
MC
H2,
5DM
Hx+
2,2,
3TM
P2,3
,4T
MP
Tolu
ene+
2,3
,3T
MP
2,3D
MH
x2M
Hp
3MH
p2,
2,5T
MH
xN
C8
EtB
zm
+p-X
ylenes
NC
9
1,2
,4T
MB
z
NC
11
P-70 Page1
C:\HPDATA\99-2113\PRODUCT\103132.01R Printed on 9/3/1999 4:58:54 PM
50
100
150
200
250
300
350
400
450
500
550
600
mV
0 5 10 15 20 25 30 35 40 45 50 55 60
Minutes
P-70
C:\HPDATA\99-2113\PRODUCT\103132.01R
NC
4IC
5N
C5
CP
2,3
DM
B2M
P3M
P NC
6M
CP
2,4
DM
P+
2,2
,3T
MB
Ben
zene
CH
2MH
x+2,
3DM
P3M
Hx
c1,3
DM
CP
t1,3
DM
CP
t1,2
DM
CP
2,2
,4T
MP
+D
MC
P(s
)N
C7
MC
HE
tCP 2
,5D
MH
x+2,
2,3T
MP
2,3
,4T
MP
Tolu
ene+
2,3
,3T
MP
2,3D
MH
x2M
Hp
3MH
p2,
2,5T
MH
xN
C8
EtB
zm
+p-X
ylenes
o-X
ylen
eN
C9
IPB
zN
PB
z1M
3E
tBz
1M
2E
tBz
1,2
,4T
MB
zN
C10
1,2
,3T
MB
zIn
dane
NC
11 C4B
z
Nap
hN
C12
IP13
2MN
aph
1MN
aph
NC
13 IP15
NC
14
IP16
NC
15
NC
16 IP18
NC
17IP
19
NC
181P
20
NC
20
P-80 Page1
C:\HPDATA\99-2113\PRODUCT\103133.01R Printed on 9/3/1999 4:50:37 PM
50
100
150
200
250
300
350
mV
0 5 10 15 20 25 30 35 40 45 50 55 60
Minutes
P-80
C:\HPDATA\99-2113\PRODUCT\103133.01R
IC4
NC
4IC
5N
C5
DC
M S
olv
ent
CP
2,3
DM
B2M
P3M
PN
C6
MC
P2,4
DM
P+
2,2
,3T
MB
Ben
zene
CH
2MH
x+2,
3DM
P3M
Hx
c1,3
DM
CP
t1,3
DM
CP
t1,2
DM
CP
2,2
,4T
MP
+D
MC
P(s
)N
C7
MC
HE
tCP
2,5D
MH
x+2,
2,3T
MP
2,3
,4T
MP
Tolu
ene+
2,3
,3T
MP
2,3D
MH
x2M
Hp
3MH
p2,
2,5T
MH
xN
C8
EtB
zm
+p-X
ylenes
o-X
ylen
eN
C9
IPB
zN
PB
z1M
3E
tBz
1,3
,5T
MB
z1M
2E
tBz
1,2
,4T
MB
zN
C10
1,2
,3T
MB
zIn
dane
NC
11C
4B
z
Nap
h
NC
12IP
13
2MN
aph
1MN
aph
NC
13
IP15
NC
14
IP16 NC
15
NC
16IP
18
NC
17IP
19
NC
181P
20
NC
19
NC
20
NC
21
NC
22
NC
23
NC
24
NC
25
NC
26
NC
27
NC
28
NC
29
NC
30N
C31
NC
32N
C33
NC
34N
C35
FIGURE 4. CENTRAL AREA
C-1
C-3
C-2
C-4

C5+ Magnitude Contour Map (ppmv) CO2 Magnitude Contour Map (%)
Propane Magnitude Contour Map (ppbv) Normal Butane Magnitude Contour Map (ppbv)
Methane Magnitude Contour Map (ppmv) Ethane Magnitude Contour Map (ppbv)
FORENSIC GEOCHEMISTRY - THE KEY TO ACCURATE SITE CHARACTERIZATIONVictor T. Jones, III, Patrick N. Agostino - Exploration Technologies, Inc.
SCALE - METERS
0 100 200
N
C-2
B-3
B-4
SB-3
SB-4
SB-2SB-1
B-2
SE-4
B-1
C-1
C-3
C-4
SE-3
SE-2SE-1
500 - 800800 - 1,000
1,000 - 2,0002,000 - 5,000
> 5,000
< 500
ETHANECONCENTRATIONS
(ppbv)
SCALE - METERS
0 100 200
N
C-2
B-3
B-4
SB-3
SB-4
SB-2SB-1
B-2
SE-4
B-1
C-1
C-3
C-4
SE-3
SE-2SE-1 (ppmv)
CONCENTRATIONSMETHANE
< 15
> 20,0005,000 - 20,000
100 - 5,00030 - 10015 - 30
SCALE - METERS
0 100 200
N
C-2
B-3
B-4
SB-3
SB-4
SB-2SB-1
B-2
SE-4
B-1
C-1
C-3
C-4
SE-3
SE-2SE-1 (ppbv)
CONCENTRATIONSN-BUTANE
< 100
> 20,0002,000 - 20,000
600 - 2,000300 - 600100 - 300
SCALE - METERS
0 100 200
N
C-2
B-3
B-4
SB-3
SB-4
SB-2SB-1
B-2
SE-4
B-1
C-1
C-3
C-4
SE-3
SE-2SE-1
300 - 500500 - 1,000
1,000 - 4,0004,000 - 8,000
> 8,000
< 300
PROPANECONCENTRATIONS
(ppbv)
SCALE - METERS
0 100 200
N
C-2
B-3
B-4
SB-3
SB-4
SB-2SB-1
B-2
SE-4
B-1
C-1
C-3
C-4
SE-3
SE-2SE-1 (%)
CONCENTRATIONSCO2
< 1.0
> 5.04.0 - 5.03.0 - 4.02.0 - 3.01.0 - 2.0
SCALE - METERS
0 100 200
N
C-2
B-3
B-4
SB-3
SB-4
SB-2SB-1
B-2
SE-4
B-1
C-1
C-3
C-4
SE-3
SE-2SE-1
2 - 55 - 100
100 - 1,0001,000 - 5,000
> 5,000
< 2
C5+CONCENTRATIONS
(ppmv)

C5+ Interpretive Dot Map (ppmv) CO2 Interpretive Dot Map (%)
Propane Interpretive Dot Map (ppbv) Normal Butane Interpretive Dot Map (ppbv)
Methane Interpretive Dot Map (ppmv) Ethane Interpretive Dot Map (ppbv)
FORENSIC GEOCHEMISTRY - THE KEY TO ACCURATE SITE CHARACTERIZATIONVictor T. Jones, III, Patrick N. Agostino - Exploration Technologies, Inc.
SCALE - METERS
0 100 200
N
C-2
B-3
B-4
SB-3
SB-4
SB-2SB-1
B-2
SE-4
B-1
C-1
C-3
C-4
SE-3
SE-2SE-1
Truncated at 5000000 ppb
< 1
0 100005000Ethane (ppb)
1 - 22 - 33 - 5> 5
Ethane/Propane
SCALE - METERS
0 100 200
N
C-2
B-3
B-4
SB-3
SB-4
SB-2SB-1
B-2
SE-4
B-1
C-1
C-3
C-4
SE-3
SE-2SE-1
< 2,500
0 100005000Methane (ppm)
2,500 - 5,0005,000 - 7,5007,500 - 10,000
> 10,000
Methane/Ethane
SCALE - METERS
0 100 200
N
C-2
B-3
B-4
SB-3
SB-4
SB-2SB-1
B-2
SE-4
B-1
C-1
C-3
C-4
SE-3
SE-2SE-1
< 0.2
0 10000050000N-Butane (ppb)
0.2 - 0.30.3 - 0.40.4 - 0.5
> 0.5
I-Butane/N-Butane
SCALE - METERS
0 100 200
N
C-2
B-3
B-4
SB-3
SB-4
SB-2SB-1
B-2
SE-4
B-1
C-1
C-3
C-4
SE-3
SE-2SE-1
Truncated at 5000000 ppb
< 1
0 60003000Propane (ppb)
1 - 22 - 33 - 5> 5
Ethane/Propane
SCALE - METERS
0 100 200
N
C-2
B-3
B-4
SB-3
SB-4
SB-2SB-1
B-2
SE-4
B-1
C-1
C-3
C-4
SE-3
SE-2SE-1
< 1
0 63CO2 (%)
1 - 22 - 33 - 5> 5
Ethane/Propane
SCALE - METERS
0 100 200
N
C-2
B-3
B-4
SB-3
SB-4
SB-2SB-1
B-2
SE-4
B-1
C-1
C-3
C-4
SE-3
SE-2SE-1
Ethane/Propane
> 53 - 52 - 31 - 2
C5+ (ppm)2000 40000
< 1