forensic pharmaceutical analysis of counterfeit …
TRANSCRIPT
Faculty of Health and Life Sciences
FORENSIC PHARMACEUTICAL
ANALYSIS OF COUNTERFEIT
MEDICINES
A thesis submitted in partial fulfilment of the requirements for the degree of
Doctor of Philosophy (Ph.D) in Forensic Pharmaceutical Analysis
JOHN EPOH OGWU
Supervisors
Prof. Sangeeta Tanna
Dr Graham Lawson September, 2018

ii | P a g e
DEDICATION
This thesis is dedicated to God Almighty for the strength and grace to go through the
process.
iii | P a g e
ABSTRACT
The World Health Organisation suggests that falsified and substandard medicines
(FSMs) constitute approximately 10% of medicines globally with higher figures
expected in low and middle income countries (LMICs). To combat the proliferation of
FSMs this study is aimed at developing simple and rapid instrumental methods for the
identification and quantification of these medicines. Attenuated Total Reflection-Fourier
Transform Infrared (ATR-FTIR) spectroscopy, Raman spectroscopy and two probe
Mass Spectrometry (MS) methods were assessed for the rapid screening of tablet
dosage forms. These systems were chosen because NO solvent extraction of the
sample was required. Comparison with analyses of the tablets by accepted but more
time consuming methods (UV-Vis and LC-MS) assessed the quality of the data
obtained. Analgesic/antipyretic and antimalarial medicines tablet dosage forms are
commonly falsified and for this study tablets were obtained opportunistically from
different countries around the world. Reference spectra of appropriate active
pharmaceutical ingredients (APIs) and excipients were created, for each method, as
part of the identification process. Currently only Raman and ATR-FTIR delivered
quantitative results which were based on automated multivariate analysis.
For tablets with a single API, Raman and ATR-FTIR provided the simplest route to API
confirmation and for tablets with multiple APIs or APIs present at <10%w/w, in the
tablet, probe MS methods were superior. Quantitative screening using ATR-FTIR
required the samples to be weighed and crushed to produce reproducible data.
Comparison of API confirmation tests between trial methods and LC-MS showed
complete agreement and the quantitative results were within ±15% of the UV-Vis data.
Each of the new tests can be completed in under five minutes and a survey of 69
paracetamol tablets, from around the world, showed that 10% were suspect.
Subsequent probe MS showed the presence of a second undeclared API in different
samples. More complex tablet formulations, for example the antimalarials were difficult
to quantify rapidly. Raman and PCA methods provide a rapid approach to tablet
identification within a limited range of possibilities. Factors that may affect Raman
spectra of tablets include the expected API, the API levels, different excipients, colours
or surface coatings for the tablets.
The simplicity, speed and cost effectiveness of the proposed analytical methods make
them suitable for use in LMICs. The potential use of these simple analytical methods in
addition to already established pharmacopoeia approved (solvent extraction)
techniques could help provide more comprehensive data about FSMs globally.
iv | P a g e
ACKNOWLEDGEMENTS
My sincere appreciation goes to my supervisors, Professor Sangeeta Tanna and Dr
Graham Lawson, who went above and beyond to ensure this program was completed.
I am grateful for the patience, support, encouragement and the opportunity to learn a
whole lot. Thank you for that extra push that got me to the finish line!
I remain forever indebted to my parents, Mr and Mrs P. I. Ogwu, who practically put
their lives on the line to enable me complete this course. Thank you for your love,
prayers and sacrifice both financially and otherwise. You’re the best! To Uncle Ejoga
Inalegwu, my cousin, Pius Odaba and the rest of my family; I’ll never forget all the
labour of love.
I will like to express my heartfelt gratitude to Pastor Ebenezer Babalola, Mrs Olubajo
and all other members of The Redeemed Christian Church of God, Covenant of Grace
Parish, Leicester. Thanks for being there from start to finish. Many thanks also go to
Bishop Mark Anderson, members of Emmanuel Apostolic Gospel Academy and the De
Montfort University Gospel Choir. The fellowship and music was always refreshing and
uplifting.
Special thanks go to Unmesh Desai, Nazmin Juma and Dr Jinit Masania for the
technical support in the laboratory and cheering me on through it all. To Dr Dennis
Bernieh, Dr Rachel Armitage, Ahmed Alalaqi and all my colleagues who made this
program a worthwhile experience, I say thank you.
I’m earnestly grateful to my friends, Vitah and Vina Zamba. Words fail me at the
moment but thanks for everything. To Bhishak Pankhania, Dr Lok Lee, Hajara Alfa, Dr
Emmanuel Quansah, Dr Thomas Karikari, Dr Christina Weis, Pastor Dimeji Adewale
and others too numerous to mention, we did this together and you’re treasured!
Finally, I owe all that I am to God who has kept me by His steadfast love and mercy.
v | P a g e
PUBLICATIONS
A list of publications from this PhD
Lawson, G., Ogwu, J. and Tanna, S. (2018) Quantitative screening of the
pharmaceutical ingredient for the rapid identification of substandard and falsified
medicines using reflectance infrared spectroscopy. PLoS ONE, 13 (8): e0202059.
Lawson, G., Ogwu, J. and Tanna, S. (2014) Counterfeit Tablet Investigations: Can
ATR FT/IR Provide Rapid Targeted Quantitative Analyses? Journal of Analytical &
Bioanalytical Techniques, 5: 214.
vi | P a g e
TABLE OF CONTENTS
COVER PAGE ........................................................................................................................... i
DEDICATION ............................................................................................................................ ii
ABSTRACT............................................................................................................................... iii
ACKNOWLEDGEMENTS .................................................................................................... iv
PUBLICATIONS ....................................................................................................................... v
TABLE OF CONTENTS ........................................................................................................ vi
List of Figures ........................................................................................................................... xi
List of Tables .......................................................................................................................... xvii
ABBREVIATIONS ................................................................................................................ xix
CHAPTER ONE Introduction and Aim of study ...................................................... 1
1.1 Introduction..................................................................................................................... 2
1.2 Aim of Study ................................................................................................................. 12
1.3 Thesis Outline .............................................................................................................. 13
1.4 References .................................................................................................................... 15
CHAPTER TWO Falsified and Substandard Medicines Overview ................. 18
2.1 What are falsified and substandard medicines? ................................................. 19
2.1.2 Types of falsified and substandard medicines ............................................ 21
2.1.3 Extent of the falsified/substandard medicines problem worldwide ....... 26
2.1.4 Overview of the falsified and substandard medicines market ................. 31
2.1.5 Falsified and substandard medicines: the causes ..................................... 35
2.1.6 Falsified and substandard medicines: the consequences ....................... 40
2.1.7 Tackling the challenges posed by falsified and substandard medicines
............................................................................................................................................ 43
2.2 Analytical methods for screening falsified and substandard medicines ..... 48
vii | P a g e
2.2.1 Preliminary Screening for falsified and substandard medicines ............ 48
2.2.2 Authentication Techniques for Falsified and Substandard Medicines .. 54
2.2.3 Confirmatory Techniques for Falsified and Substandard Medicines .... 55
2.3 Conclusion .................................................................................................................... 58
2.4 References .................................................................................................................... 60
CHAPTER THREE Rapid identification of falsified and substandard
medicines: Reflectance infrared spectroscopy for quantitative screening of the
pharmaceutical ingredient ................................................................................................... 70
3.1 Introduction................................................................................................................... 71
3.2. Materials and Methods .............................................................................................. 74
3.2.1 Reference Chemicals .......................................................................................... 74
3.2.2 Test tablet samples.............................................................................................. 74
3.2.3 Instrumentation .................................................................................................... 76
3.2.4 Methods .................................................................................................................. 77
3.3. Results and Discussion ............................................................................................ 81
3.3.1 Reference Spectra................................................................................................ 81
3.3.2 Qualitative assessment of whole tablet samples ........................................ 86
3.3.3 Spectral reproducibility ...................................................................................... 86
3.3.4 Identification of active pharmaceutical ingredient (API) ........................... 88
3.3.5 Quantification of Active Pharmaceutical Ingredients ................................. 93
3. 4 Conclusion ................................................................................................................. 125
3.5 References .................................................................................................................. 126
CHAPTER FOUR Raman Spectroscopy for rapid discrimination of tablet
medicines ............................................................................................................................... 130
4.1 Introduction................................................................................................................. 131
4.2 Materials and Method ............................................................................................... 135
4.2.1 Materials ............................................................................................................... 135
viii | P a g e
4.2.2 Instrumentation .................................................................................................. 136
4.3 Method .......................................................................................................................... 136
4.4 Results and Discussion ........................................................................................... 138
4.4.1 Raman Analysis of Paracetamol Tablet Samples ...................................... 138
4.4.2 Raman Analysis of Antimalarial (Chloroquine) Tablets ........................... 157
4.5 Conclusion .................................................................................................................. 164
4.6 References .................................................................................................................. 166
CHAPTER FIVE Falsified and Substandard Medicines: Probe Mass
Spectrometry for rapid characterisation of tablet content ....................................... 168
5.1 Introduction................................................................................................................. 169
5.1.1 Introduction to Mass Spectrometry............................................................... 170
5.2 Principle and Potential Applications of Probe-MS ........................................... 175
5.2.1 DIP-MS ................................................................................................................... 175
5.2.2 ASAP-MS .............................................................................................................. 178
5.3 Materials and Methods ............................................................................................. 179
5.3.1 Materials ............................................................................................................... 179
5.3.2 Instrumentation .................................................................................................. 181
5.3.3 Methods- Sample analysis ............................................................................... 182
5.4 Results and Discussion ........................................................................................... 183
5.4.1 Application of DIP-MS to Analgesics/Antipyretics .................................... 183
5.4.2 Antimalarial medicines study ......................................................................... 194
5.4.3 Effects of Probe Tip Temperature Ramp Rate on Signal Intensity ....... 202
5.4.4 Effects of electron voltage on the mass spectrum produced ................ 204
5.4.5 Limit of Detection (LOD) and Quantification Study .................................. 207
5.5 Conclusion .................................................................................................................. 213
5.6 References .................................................................................................................. 215
ix | P a g e
CHAPTER SIX Ultraviolet-Visible (UV-Vis) Spectrophotometry for validation
of quantitative ATR-FTIR data .......................................................................................... 218
6.1 Introduction................................................................................................................. 219
6.1.1 Ultraviolet-Visible Spectrophotometry Principle ....................................... 221
6.2 Materials and Methods ............................................................................................. 223
6.2.1 Materials and Reagents .................................................................................... 223
6.2.2 Test Tablet Samples .......................................................................................... 223
6.2.3 Instrumentation .................................................................................................. 224
6.2.4 Methods ................................................................................................................ 224
6.3 Results and Discussion ........................................................................................... 227
6.3.1 UV Spectra ........................................................................................................... 227
6.3.2 Quantification data: Linearity, Limit of Detection (LOD) and Limit of
Quantification (LOQ) ................................................................................................... 228
6.3.3 Accuracy/ Incurred sample analysis ............................................................. 229
6.3.4 Precision of UV-Vis Data .................................................................................. 229
6.3.5 UV-Vis Quantitative Data for Paracetamol Tablet Samples .................... 229
6.4 Conclusion .................................................................................................................. 234
6.5 References .................................................................................................................. 235
CHAPTER SEVEN Confirmatory testing for pharmaceutical ingredient in
tablet dosage forms by liquid chromatography- mass spectrometry ................... 237
7.1 Introduction................................................................................................................. 238
7.2 Materials and Methods ............................................................................................. 240
7.2.1 Materials and Reagents .................................................................................... 240
7.2.2 Test Tablet Samples .......................................................................................... 240
7.2.3 Instrumentation .................................................................................................. 240
7.2.4 Methods ................................................................................................................ 241
7.3 Results and Discussion ........................................................................................... 244
x | P a g e
7.3.1 Qualitative analysis - Chromatograms ......................................................... 244
7.3.2 Qualitative analysis - Mass spectra .............................................................. 246
7.3.3 Quantification data: Linearity, Limit of Detection (LOD) and Limit of
Quantification (LOQ) ................................................................................................... 248
7.3.4 Accuracy/ Incurred sample analysis ............................................................. 250
7.3.5 Precision of Data ................................................................................................ 250
7.3.6 Quantitative Data for Test Tablet Samples .................................................. 250
7.4 Conclusion .................................................................................................................. 251
7.5 References .................................................................................................................. 253
CHAPTER EIGHT Analytical Strategy for Identification of Falsified and
Substandard Medicines ...................................................................................................... 255
8.1 Introduction................................................................................................................. 256
8.2 Cost of Technique/Analysis.................................................................................... 256
8.3 Sampling time and sample throughput ............................................................... 258
8.4 Ease of use .................................................................................................................. 258
8.5 Complexity of Data Output...................................................................................... 259
8.6 Detection Capability ................................................................................................. 259
8.7 Site where analyses takes place ........................................................................... 263
8.8 Conclusion .................................................................................................................. 267
8.9 References .................................................................................................................. 269
CHAPTER NINE Conclusion and Future Perspectives .............................. 271
9.1 Conclusion .................................................................................................................. 272
9.2 Recommendations and Future work .................................................................... 275
APPENDIX 3 ........................................................................................................................... 277
xi | P a g e
List of Figures
Figure 2. 1 Reports of falsified medicines by therapeutic class received by the WHO GSMS
(2013–2017) (Adapted from WHO, 2017). .................................................................................. 24
Figure 2. 2 Incidents of falsification of medicines in different regions of the world in 2016. (PSI,
2016). .......................................................................................................................................... 27
Figure 2. 3 Countries where reports of substandard and falsified medical products were
received by the WHO GSMS (2013–2017) (Adapted from WHO, 2017). ................................... 28
Figure 2. 4 Diagram showing how the falsified and substandard medicines (FSMs) market
operates within the legal medicines distribution chain. ............................................................... 31
Figure 2. 5 Global distribution of medicine falsification- from production to point of sale
(Adapted from Dégardin et al, 2014). .......................................................................................... 33
Figure 2. 6 The Authentication pyramid. More overt security features towards the base of the
pyramid allows more individuals to be involved in the validation of medicines (Adapted from
Davison, 2011). ........................................................................................................................... 45
Figure 3. 1 Attenuated Total Reflection Fourier Transform Infrared (ATR-FTIR) Schematic
(Adapted from Lawson et al, 2014) …………………………………………………………….73
Figure 3. 2 ATR-FTIR reference spectra for (a) paracetamol (b) chloroquine ........................... 82
Figure 3. 3 ATR-FTIR reference spectra for (a) caffeine (b) aspirin .......................................... 83
Figure 3. 4 ATR-FTIR reference spectra for (a) artemether (b) artesunate ............................... 84
Figure 3. 5 Comparing members of the same excipient group (a) Stearates: magnesium
stearate (Blue), calcium stearate (Red), zinc stearate (Black) (b) Celluloses: microcrystalline
celluose (Blue), carboxymethyl cellulose (Red), methylcellulose (Black) (c) Starches: maize
starch (Blue), potato starch (Red), sodium starch glycolate (Black) ........................................... 85
Figure 3. 6 Paracetamol crushed (Black), Tablet top (Blue), Tablet bottom (Red) .................... 86
Figure 3. 7 Multiple spectra overlay of paracetamol reference showing reproducibility ............ 87
Figure 3. 8 Multiple spectra overlay of paracetamol reference showing variation in spectra due
to improper homogenisation of samples ..................................................................................... 87
Figure 3. 9 Overlay of ATR-FTIR spectra for identification: Paracetamol reference (red) and
magnesium stearate (blue). ........................................................................................................ 89
Figure 3. 10 Comparison of three spectra: (A) pure paracetamol, (B) a paracetamol tablet, (C) a
mixture of three excipients (maize starch, magnesium stearate and microcrystalline cellulose).
.................................................................................................................................................... 90
Figure 3. 11 Molecular Structure of Paracetamol (Acetaminophen) .......................................... 90
Figure 3. 12 Overlay of ATR-FTIR spectra for identification: Paracetamol reference (red) and
paracetamol tablet (blue). ........................................................................................................... 91
Figure 3. 13 Overlay of ATR-FTIR spectra for paracetamol reference (red) and 3-API tablet
(black). ......................................................................................................................................... 92
xii | P a g e
Figure 3. 14 Overlay of ATR-FTIR spectra for chloroquine reference (blue), magnesium
stearate (green), MCC (black) and maize starch (red). .............................................................. 92
Figure 3. 15 Calibration curve for paracetamol in magnesium stearate at 1225cm‾¹ using mode
A (Data represents the mean±SD of 3 replicate samples). ........................................................ 95
Figure 3. 16 Ratio of measured to expected amounts of paracetamol for 5 replicates each of 6
different paracetamol tablets after grinding/mixing (a) for 60 seconds (b) for 120 seconds ....... 96
Figure 3. 17 Overlay of ATR-FTIR spectra of paracetamol reference (red) and Ind P8 tablet
(blue). .......................................................................................................................................... 99
Figure 3. 18 Ratio of measured to expected paracetamol amounts in the tablets using
integration Mode A for paracetamol in magnesium stearate calibration (a) 10 tablets from
Europe and Africa (b) 18 tablet samples from Asia .................................................................. 101
Figure 3. 19 Ratio of measured to expected paracetamol amounts in the tablets using
integration Mode B for paracetamol in magnesium stearate calibration (a) 10 tablets from
Europe and Africa (b) 18 tablet samples from Asia .................................................................. 102
Figure 3. 20 Ratio of measured to expected paracetamol amounts in the tablets using
integration Mode J for paracetamol in magnesium stearate calibration (a) 10 tablets from
Europe and Africa (b) 18 tablet samples from Asia .................................................................. 103
Figure 3. 21 Ratio of measured to expected paracetamol amounts in the tablets using
integration Mode K for paracetamol in magnesium stearate calibration (a) 10 tablets from
Europe and Africa (b) 18 tablet samples from Asia .................................................................. 104
Figure 3. 22 ATR FTIR spectra of Paracetamol in maize starch standards between 1800-
800cm-1 ..................................................................................................................................... 107
Figure 3. 23 Chart showing measured amounts of paracetamol in tablets based on
quantification methods using different absorbance bands and excipients. .............................. 109
Figure 3. 24 PLS calibration plot over the range 1524-1493cm-1 (with peak centred at 1505cm-1)
.................................................................................................................................................. 110
Figure 3. 25 Comparison of measured versus expected amounts of paracetamol in calibration
mixtures based on the range 1524-1493cm-1. .......................................................................... 111
Figure 3. 26 Ratio of measured to expected amounts of Paracetamol in 69 samples of tablets
from around the world based on calibration for peak at 1505cm-1 (a) 14 tablet samples from
around Europe (b) 37 tablet samples from Asia and the Middle East (c) 18 tablet samples from
around Africa and the Caribbean Islands. ................................................................................. 116
Figure 3. 27 Comparison of ATR-FTIR spectra for 3 API tablet (blue) with paracetamol
reference (red) showing absorbance from other material in spectra range assessed. ............ 118
Figure 3. 28 Comparison of ATR-FTIR spectra for 3 API tablet (blue), paracetamol reference
(red) and aspirin reference (black) identifying peak interfering with measurement range to be
aspirin ........................................................................................................................................ 118
xiii | P a g e
Figure 3. 29 PLS calibration plot for chloroquine over the range 1256-1173cm-1 (for peak at
1212cm-1) using the Bruker OPUS 7.5 Quant 2 software. Data represents three replicate
samples with maize starch as excipient. ................................................................................... 119
Figure 3. 30 Comparison of measured (Fit) versus expected (True) amounts of chloroquine in
calibration mixtures over the range 1256-1173cm-1. ................................................................. 120
Figure 3. 31 Ratio of measured to expected amounts of chloroquine in tablet samples from
around the world based on peak over the range 1256-1173cm-1.(for the peak centred at
1212cm-1). (a) with Ken C1T1 tablet sample (b) zoomed in excluding Ken C1T1 sample ....... 122
Figure 3. 32 Comparison of ATR-FTIR spectra for Kenyan chloroquine tablet- Ken C1T1 (blue),
UK chloroquine tablet- UK C1T1 (red) and chloroquine reference (black) identifying peak
showing differences in Ken C1T1 spectra. ............................................................................... 123
Figure 4. 1 Raman spectra for all paracetamol tablets assessed- Non Baseline Corrected …138
Figure 4. 2 PCA for all paracetamol tablets assessed- Non Baseline Corrected .................... 139
Figure 4. 3 PCA for all paracetamol tablet samples except coloured (Chn P2 and Ind P13)
tablets- Non Baseline Corrected. .............................................................................................. 140
Figure 4. 4 PCA for all paracetamol tablets in Fig. 4.3 not containing other APIs like caffeine
(Ken P1) - Non Baseline Corrected .......................................................................................... 141
Figure 4. 5 (a) PCA for all paracetamol tablets in Fig 4.4 without outlier Chinese samples (Chn
P3T1 and Chn P3T2) - Non Baseline Corrected (b) PCA for all paracetamol tablets in Fig. 4.5a
without outlier Chinese sample (Chn P4T1) - Non Baseline Corrected .................................... 142
Figure 4. 6 PCA for all paracetamol tablets without all outliers in Fig 4.2- Non Baseline
Corrected................................................................................................................................... 143
Figure 4. 7 Raman spectra for selected paracetamol tablets including Nig P2 (Red) - Baseline
Corrected................................................................................................................................... 145
Figure 4. 8 PCA for selected paracetamol tablets listed in Table 4.3 - Baseline Corrected ... 146
Figure 4. 9 PCA for selected paracetamol tablets - Baseline Corrected vs Non Baseline
Corrected................................................................................................................................... 147
Figure 4. 10 Spectra for powder samples of selected paracetamol tablets- Non Baseline
Corrected................................................................................................................................... 148
Figure 4. 11 PCA for powder samples of selected paracetamol tablets in Table 4.4- Non
Baseline Corrected .................................................................................................................... 149
Figure 4. 12 PCA for whole paracetamol tablets selected in Table 4.4- Non Baseline Corrected
.................................................................................................................................................. 150
Figure 4. 13 PCA for Powder (Red) vs Whole tablet (Black) Raman data for selected
paracetamol tablets in Table 4.4 - Non Baseline Corrected ..................................................... 151
Figure 4. 14 Non-transparent side of a blister pack for paracetamol ....................................... 152
Figure 4. 15 Spectra for selected paracetamol tablets through the non-transparent side (Fig
4.14) of the blister pack – Non Baseline Corrected .................................................................. 153
xiv | P a g e
Figure 4. 16 Transparent side of a blister pack for paracetamol.............................................. 153
Figure 4. 17 Spectra for selected paracetamol tablets through the transparent side (Fig 4.16) of
the blister pack - Non Baseline Corrected ................................................................................ 154
Figure 4. 18 Raman spectra for Paracetamol tablet sample from Nepal (Nep P1T3)(Blue-
directly from tablet; Yellow- crushed /powder sample; Green- through transparent side of blister
pack; Red- non transparent side of blister pack) ...................................................................... 155
Figure 4. 19 Raman spectra for Paracetamol tablet sample from Nigeria (P2T3) (Blue-directly
from tablet; Yellow- crushed /powder sample; Green- through transparent side of blister pack;
Red- non transparent side of blister pack) ................................................................................ 155
Figure 4. 20 Raman spectra for Paracetamol tablet sample from Spain (P1T3) (Blue-directly
from tablet; Yellow- crushed /powder sample; Green- through transparent side of blister pack;
Red- non transparent side of blister pack) ................................................................................ 156
Figure 4. 21 Spectra for Paracetamol tablet sample from UAE (UAE P1T3) (Blue-directly from
whole tablet; Yellow- crushed /powder sample; Green- through transparent side of blister pack;
Red- non transparent side of blister pack) ................................................................................ 156
Figure 4. 22 Raman spectra for chloroquine tablet samples- Non Baseline Corrected ........... 158
Figure 4. 23 Raman spectra for chloroquine tablet samples- Baseline Corrected .................. 159
Figure 4. 24 PCA for all chloroquine tablet samples - Non Baseline Corrected ...................... 160
Figure 4. 25 PCA for all chloroquine tablet samples - Baseline Corrected .............................. 161
Figure 4. 26 PCA for all chloroquine tablet samples – (Baseline Corrected vs Non Baseline
Corrected) ................................................................................................................................. 162
Figure 5. 1 Direct Insertion Probe Mass Spectrometry (with high energy electron ionisation- EI)
Schematic. ………………………………………………………………………………………..175
Figure 5. 2 TIC for UK tablet with multiple APIs/components. ................................................. 177
Figure 5. 3 Direct Insertion Probe Mass Spectrometry (ASAP-MS with low energy ionisation
under atmospheric pressure) Schematic .................................................................................. 179
Figure 5. 4 DIP-MS data for (a) Paracetamol reference (Molecular weight- 151 g/mol) (b)
Caffeine reference (Molecular weight- 194 g/mol) (c) Aspirin reference (Molecular weight- 180
g/mol) ........................................................................................................................................ 185
Figure 5. 5 ASAP data for a mixture of reference samples of Paracetamol, Caffeine and Aspirin
(a) Positive ion spectrum (b) Negative ion spectrum. ............................................................... 186
Figure 5. 6 Mass spectrum for Paracetamol tablet from UK (Molecular weight- 151 g/mol) (a)
using high energy (EI) ionisation (b) using low energy ambient ionisation ASAP-MS.............. 187
Figure 5. 7 Mass spectrum for suspect paracetamol tablet from India .................................... 189
Figure 5. 8 ASAP-MS mass spectrum for suspect paracetamol tablet from Hong Kong. ....... 191
Figure 5. 9 Total ion chromatogram (TIC) and extracted ion chromatograms (EICs) for UK tablet
containing 3 APIs (m/z- Paracetamol- 151, Aspirin- 180, Caffeine- 194). ................................ 192
xv | P a g e
Figure 5. 10 Mass spectrum for UK tablet containing 3 APIs (m/z- Paracetamol- 151, Aspirin-
138, Caffeine- 194). .................................................................................................................. 193
Figure 5. 11 Mass spectrum for UK tablet containing Paracetamol and Caffeine (m/z:
Paracetamol- 151, Caffeine- 194). ............................................................................................ 193
Figure 5. 12 Mass spectra for (a) sulfadoxine reference (Molecular ion: m/z 310) (b) chloroquine
reference (Molecular ions: m/z 319 and 321). .......................................................................... 195
Figure 5. 13 Mass spectrum for Sulfadoxine and Pyrimethamine tablet 70eV- AM Ghana A (a)
Delay time – 3.948min (b) Delay time – 6.561min. ................................................................... 196
Figure 5. 14 ASAP-MS mass spectrum for Sulfadoxine and Pyrimethamine tablet ................ 197
Figure 5. 15 Mass spectrum for Artesunate and Amodiaquine tablet – 70eV ......................... 198
Figure 5. 16 Mass spectrum for antimalarial tablet containing artemether and lumefantrine -
70eV (a) in positive ion mode (b) in negative ion mode showing molecular ion for lumefantrine at
m/z 528.9 (c) ) in negative ion mode showing molecular ion for artemether at m/z 298 .......... 200
Figure 5. 17 ASAP mass spectrum for antimalarial tablet containing artemether and
lumefantrine (a) showing molecular ion for lumefantrine at m/z 528 and 530 (b) showing
fragment ion for artemether at m/z 267. .................................................................................... 201
Figure 5. 18 Paracetamol reference- where temperature at TIC max is 165ºC (a) TIC with initial
probe temperature of 30ºC (b) Mass spectrum with initial probe temperature of 30ºC ............ 202
Figure 5. 19 Paracetamol reference - where temperature at TIC max is 152ºC (a) TIC with
initial probe temperature of 40ºC (b) Mass spectrum with initial probe temperature of 40ºC. .. 203
Figure 5. 20 Mass spectrum for Chloroquine tablet UK (a) Electron energy- 70eV (b) Electron
energy– 20eV. ........................................................................................................................... 206
Figure 5. 21 TIC of a paracetamol test sample showing 3 approximate points (start, apex and
end) on the paracetamol peak where mass spectral data was collected for each calibration
standard sample considered for potential quantitative analysis of test tablet samples. ........... 208
Figure 5. 22 Calibration curve for paracetamol in maize starch standard mixtures (1-90% w/w)
using ion signal intensity for molecular ion at m/z 151. ............................................................ 209
Figure 5. 23 Calibration curve for paracetamol in maize starch standard mixtures (1-10% w/w)
using ion signal intensity for molecular ion at m/z 151. ............................................................ 210
Figure 5. 24 0.1% w/w paracetamol in maize starch (a) Total ion chromatogram (b) Mass
spectrum.................................................................................................................................... 212
Figure 6. 1 UV-Vis spectra of paracetamol standard showing λmax at 244nm…………….. 223
Figure 6. 2 UV-Vis calibration curve for paracetamol standards over the range 2-10ppm (Data
points represent the mean±SD of 3 replicates. ......................................................................... 228
Figure 6. 3 Ratio of measured to expected amounts of Paracetamol in tablet samples from
around the world using UV-analysis (a) 14 tablet samples from Europe (b) 37 tablet samples
from Asia and the Middle East (c) 18 tablet samples from Africa and the Caribbean Islands .. 232
xvi | P a g e
Figure 7. 1 LC-MS traces for reference paracetamol (a) TIC scan mode (b) SIM mode at m/z
152 …………………............……………………………………………………………………..244
Figure 7. 2 LC-MS traces for paracetamol tablet (a) TIC scan mode (b) SIM mode at m/z 152
.................................................................................................................................................. 245
Figure 7. 3 LC-MS traces for paracetamol tablet (Ind P8) (a) TIC scan mode (b) SIM mode at
m/z 152 ...................................................................................................................................... 245
Figure 7. 4 Mass spectrum for paracetamol standard (a) scan mode (b) SIM mode at m/z 152
.................................................................................................................................................. 246
Figure 7. 5 Mass spectrum for paracetamol tablet (a) scan mode (b) SIM mode at m/z 152 .. 247
Figure 7. 6 Mass spectrum for suspect paracetamol tablet using scan mode at (a) 3.875minutes
retention time (b) 2.586 minutes retention time ........................................................................ 248
Figure 7. 7 LC-MS Calibration curve for paracetamol standards over the range 5-80µM ....... 249
Figure 8. 1 Comparing the ratio of measured to expected amounts of paracetamol in tablet
samples based on ATR-FTIR and UV-Vis showing agreement data from both techniques and
the ability of the ATR-FTIR to spot suspect samples…………………………….....…………. 261
Figure 8. 2 Comparing the performance of ATR-FTIR, UV-Vis and LC-MS in the quantitative
analysis of selected paracetamol tablets (showing increasing selectivity of the techniques). .. 263
Figure 8. 3 Analytical Strategy for the detection of Falsified and Substandard Medicines (FSMs)
.................................................................................................................................................. 266
xvii | P a g e
List of Tables
Table 2. 1 Types of falsified medicines and their relative levels based on reported cases ....... 23
Table 2. 2 Comparison of devices for detecting falsified and substandard medicines............... 52
Table 3. 1 Active Pharmaceutical Ingredients and Excipients for ATR-FTIR analysis….…. 74
Table 3. 2 Single API paracetamol tablets analysed, their countries of origin and expected
amount ........................................................................................................................................ 75
Table 3. 3 Multiple API tablets from the UK containing paracetamol analysed using ATR-FTIR76
Table 3. 4 Chloroquine tablets analysed, their countries of origin and expected amount .......... 76
Table 3. 5 Integration modes for ATR-FTIR quantitative analysis and functions ....................... 80
Table 3. 6 Calibration curve equations and R2 values using different integration modes for
paracetamol in magnesium stearate calibration mixtures ........................................................... 94
Table 3. 7 Absorbance readings for paracetamol in magnesium stearate using mode A (Peak
1225cm-1) .................................................................................................................................... 94
Table 3. 8 Measured concentration of paracetamol (% w/w) using mode A calibration curve for
Paracetamol in Magnesium stearate. ......................................................................................... 97
Table 3. 9 Measured amount (in mg) of Paracetamol using Mode A calibration curve for
paracetamol in magnesium stearate. .......................................................................................... 98
Table 3. 10 Summary of the results of quantitative analysis of the Paracetamol tablets using
manual integration method.......................................................................................................... 99
Table 3. 11 PLS calibration data for paracetamol in selected excipients and across different
ranges ....................................................................................................................................... 108
Table 3. 12 Assessing the performance of Quant 2 calibration methods for paracetamol in
excipients across different spectral ranges ............................................................................... 109
Table 3. 13 Summary of quantitative results using the Quant 2 method for paracetamol tablet
analysis from around the world (results are the mean of 5 replicate samples) ........................ 113
Table 3. 14 Measured amounts of paracetamol in multiple API tablets from the UK based on
Quant 2 ATR-FTIR analysis ...................................................................................................... 117
Table 3. 15 Summary of quantitative results for chloroquine tablet analysis form around the
world (results are the mean of 3 replicate samples) ................................................................. 120
Table 4. 1 Paracetamol tablets analysed and their origin ……………………………………….135
Table 4. 2 Chloroquine Tablet Samples analysed and their origin ........................................... 136
Table 4. 3 Selected paracetamol tablet samples used for comparing non baseline corrected vs
baseline corrected tablet samples ............................................................................................ 144
Table 4. 4 Selected Paracetamol tablet samples used for comparing tablet vs powder data .. 148
Table 4. 5 Selected Paracetamol tablet samples used for comparing whole tablet data vs data
through blister packs ................................................................................................................. 152
xviii | P a g e
Table 4. 6 Chloroquine Tablet Samples analysed and their origin ........................................... 157
Table 4. 7 Paracetamol tablets analysed and their weights and expected amounts (%w/w) .. 163
Table 5. 1 Advantages and Disadvantages of Electron ionisation (EI) method in mass
spectrometry ………………………………………………………………………………………..176
Table 5. 2 List of analgesic/antipyretic tablets containing paracetamol analysed using EI DIP-
MS and their countries of origin ................................................................................................ 180
Table 5. 3 List of multiple API analgesic/antipyretic tablets from the UK containing paracetamol
analysed using EI DIP-MS ........................................................................................................ 181
Table 5. 4 List of antimalarial tablets analysed using EI DIP-MS and their countries .............. 181
Table 5. 5 EI DIP-MS authentication of tablets containing paracetamol based on the presence
of the API................................................................................................................................... 188
Table 5. 6 List of test tablets analysed using DIP-MS with low energy ambient ionisation (ASAP-
MS) and their countries of origin ............................................................................................... 190
Table 5. 7 List of multiple API analgesic/antipyretic tablets containing paracetamol analysed
using EI DIP-MS ........................................................................................................................ 194
Table 5. 8 DIP-MS data for antimalarial tablets with 70eV and 20eV ...................................... 207
Table 5. 9 Ion signal intensities for calibration standard mixtures of paracetamol in maize starch
(m/z 151) at different points on the TIC .................................................................................... 209
Table 6. 1 List of analgesic/antipyretic tablets containing paracetamol analysed using UV-Vis
and their countries of origin and expected amounts………………………………………… 224
Table 6. 2 Paracetamol standard concentrations and absorbance values for UV-Vis calibration
curve .......................................................................................................................................... 228
Table 6. 3 Comparison of measured versus expected concentrations of paracetamol in
standard calibration solutions.................................................................................................... 229
Table 6. 4 Summary of UV-Vis quantitative data for paracetamol tablets from around the world
(Results are the mean±SD of 3 replicates) ............................................................................... 230
Table 7. 1 Paracetamol Tablet Samples analysed and their origin …………………….240
Table 7. 2 Paracetamol standard concentrations and peaks areas for LC-MS calibration curve
.................................................................................................................................................. 249
Table 7. 3 Comparison of measured versus expected concentrations of paracetamol in
standard calibration solutions.................................................................................................... 250
Table 7. 4 Quantitative results for paracetamol tablet samples analysed and their origin ....... 251
Table 8. 1 Equipment costs – new purchase…………………………………………………… 257
Table 8. 2 Comparing quantitative results for a selected range of paracetamol tablets based on
ATR-FTIR, UV-Vis and LC-MS ................................................................................................. 262
Table 8. 3 Key features and findings from rapid analytical techniques employed in the screening
of tablet medicines .................................................................................................................... 268
xix | P a g e
ABBREVIATIONS
ACMD Advisory Council on the Misuse of Drugs
API Active Pharmaceutical Ingredient
ASAP-MS Atmospheric Pressure Solids Analysis Probe-Mass Spectrometry
ATR-FTIR Attenuated Total Reflectance- Fourier Transform Infrared
DART Direct Analysis in Real Time
DESI Desorption Electrospray Ionisation
DIP-MS Direct Insertion Probe-Mass Spectrometry
EMVS European Medicines Verification System
EU European Union
FDA Food and Drug Administration
FSM Falsified and Substandard Medicine
GPHF Global Pharma Health Fund
GPS Global Positioning System
GSMS Global Surveillance and Monitoring System
HPLC High Performance Liquid Chromatography
IP Intellectual Property
IR Infrared
KBr Potassium Bromide
LC-MS Liquid Chromatography-Mass Spectrometry
LMICs Low and Middle Income Countries
MIR Mid Infrared
MCC Microcrystalline Cellulose
NIR Near Infrared
NHS National Health Service
xx | P a g e
NMR Nuclear Magnetic Resonance
NMRA National Medicines Regulatory Authority
OOS Out of Specification
OTC Over the Counter
PCA Principal Component Analysis
PLS Partial Least Squares
PDA Photodiode Array
PSI Pharmaceutical Security Institute
RFID Radio Frequency Identification
TLC Thin Layer Chromatography
SSFFC Substandard/ Spurious/ Falsely-labelled/ Falsified/ Counterfeit
UV-Vis Ultraviolet Visible
WHO World Health Organisation
WTO World Trade Organisation

CHAPTER ONE
Introduction and Aim of study
2 | P a g e
1.1 Introduction
Medicines, particularly tablet formulations, may not correspond to the description on
the packaging. In the literature, such tablets are variously described as: counterfeit,
falsified or substandard. The currently appropriate choice of descriptions are discussed
in Chapter 2.
Falsification of medicines is a growing global problem and a serious crime considering
the threat they pose to human health. The United Nations Sustainable Development
Goals for 2030 also includes access to “safe, effective, quality and affordable essential
medicines” acknowledging the severity of the falsified medicines situation (Petersen et
al, 2017). The difficulty in controlling the falsified medicines market can be attributed in
no small measure to the complex medicines distribution network with numerous actors
involved at different stages of the medicine distribution chain (Martino et al, 2010;
Dégardin et al, 2014). The huge profits that can be made by the falsifiers of medicines
could be a driving force for this phenomenon (Martino et al, 2010; Rebiere et al, 2017).
Counterfeiting of medicines is an age old practice which dates back to the 4th century
BC with Pedanius Dioscorides being the first to mention counterfeit medicines (Newton
et al, 2006). However, regulations on the trade of the medicines did not include the
control of counterfeits until 1988 when resolutions against counterfeit medicines were
adopted (Newton et al, 2006).
Over time, falsification of medicines has been on the rise with current estimates
indicating that about 10% of the medicines sold worldwide are falsified or substandard
(Dégardin et al, 2014). Industrialisation, globalisation and the increasing access to
medicines via the internet makes the situation even more alarming. Reports suggest
that over 50% of the medicines sold via the internet may be counterfeit even in
developed countries like the United States of America (USA) and United Kingdom
3 | P a g e
(Martino et al, 2010; Jackson et al, 2012). This is alarming and calls for urgent action
even more so because children may have access to and abuse prescription medicines
exposing them to these falsified medicines. Falsification of medicines has also been
identified as a branch of organised crime (Dégardin et al, 2015).
Medicines presented to a patient are usually a combination of the active ingredient with
several non-active materials called excipients. The excipients generally have no
bioactivity but are present to protect, bulk out or make the active pharmaceutical
ingredient (API) more readily available for bio assimilation.
Whilst medication formulations may be liquids or solids, there is an industry move
towards tablet formulations so that the patient can take responsibility for adherence to
the prescribed regimen. API doses can range from 1-1000mg whilst typical tablet
overall masses range from 100-1100mg. The API level ranges from < 1%, for some
tablets, to approximately 90% for paracetamol tablets. The aim of the counterfeiter
therefore is to produce medicines that would pass as or are similar to the genuine
formulation even though it is falsified.
In this thesis, the expression falsified/substandard medicines (FSMs) will be the term
used for all suspect/ questionable medicines. “Falsified” and “counterfeit” will be used
interchangeably when referring to medicines that are fraudulently mislabelled or
misrepresented with respect to their identity or source. This is because they refer to the
same group of medicines as mentioned earlier. Falsified and substandard medicines
range from those with incorrect amounts of the Active Pharmaceutical Ingredient (API)
to those with no API(s) present (Davison, 2011). Unlike the counterfeiting of other
goods, counterfeit medicines could be potentially life threatening and as such, require
urgent attention (Mackey and Liang, 2011). More sophisticated techniques are now
4 | P a g e
employed in the manufacture and packaging of falsified and substandard medicines
making it increasingly difficult to detect them (Kovacs et al, 2014).
Trade in falsified and substandard medicines depends on profit margins like any other
commerce and so will thrive where demand is high and there is shortage of supply. It is
important to note that even cheap medicines are attractive to falsifiers of medicines
provided the potential volume of sales is high enough. In addition, trade in falsified and
substandard medicines is facilitated by the ignorant, the careless, the unscrupulous
and the criminal and so thrives in regions where the risk of detection is low and the
technical capacity is weak (WHO, 2017). Limited access to quality medicines that are
both safe and affordable is another huge challenge especially in low and middle-
income countries. The cost pressures and inadequate supply of medicines at any point
in the medicines supply chain allows counterfeiters to fill in or take care of the deficit
with falsified/substandard medicines. There is also the lack of legislation prohibiting the
manufacture or sale of FSMs in many countries and corruption among officials, which
allows counterfeiters of medicines to thrive. Penalties for manufacturing FSMs in many
other cases are weak and therefore encourage the counterfeiters to continue with this
crime of medicine falsification with unfavourable implications on the legal manufacturer
and the consumers of the falsified medicines (Dégardin et al, 2015).
Falsified medicines (whether with incorrect amounts of API(s) or no API(s) present) can
lead to therapeutic failure. Therapeutic failure due to falsified or substandard medicines
implies that the patient does not get better, the patient’s condition worsens or ultimately
the patient/consumer dies. For instance, incorrect amount of API(s) could lead to drug
resistance reducing the bioactivity of the medicine as well as providing no relief for the
patient even after administration of the required dose. Drug resistance is a serious
global challenge especially with antimalarial medicine and antibiotics costing the
pharmaceutical industry millions of pounds every year. Generally, drug resistance is
5 | P a g e
linked to abuse of medication but falsified and substandard medicines might be
responsible for even more cases of drug resistance than have been reported. This is
because drug resistance is identified, only in retrospect, when the patient shows no
positive response to the prescribed dosage of the medication administered. It is
therefore difficult to say conclusively whether one or a combination of factors is
responsible for drug resistance in each case reported. This implies that several cases
of drug resistance caused by falsified and substandard medicines may be going
unnoticed and attributed to other factors unless measures are put in place to assess
medicines from manufacturing level to the point of sale to the final consumer. Besides
the health risk associated with therapeutic failure from falsified or substandard
medicines, there is the additional costs to healthcare suppliers who have to spend
more funds to provide treatment for the patients in cases where medication did not
work.
Irrespective of whether people live in low and middle income or developed countries,
they can be affected by the sale/distribution of falsified and substandard medicines
(Dégardin et al, 2015). A typical example would be patients suffering from tuberculosis,
who have been administered falsified anti-tuberculosis medicines. The patients taking
falsified anti-tuberculosis medicines could pose a huge health risk to all those they
come in contact with including tourists from different countries. Falsification of
medicines also leads to economic losses for both the legal manufacturer of the
medicine and the consumer/patient purchasing the medication. Due to low cost of
production, falsified medicines are generally cheaper and more accessible to
consumers. It is more likely that the demand for the cheaper and more affordable
falsified medicines will be higher than for the more expensive genuine product.
Declining demand for genuine medicines would invariably lead to losses for the legal
manufacturers of the medicine. For the patient/consumer on the other hand, money
6 | P a g e
spent on the falsified medicine would be lost since the falsified/substandard medicine
does not provide any relief from the debilitating ailment (Deisingh, 2005; Dégardin et al,
2014). It is therefore important that there are quality checks and assessments for
medicines at different points throughout the medicines distribution chain.
Current techniques used in the detection of falsified and substandard medicines involve
lengthy procedures for analysis and the techniques are very expensive making these
analyses less feasible in low and middle-income countries where resources are limited
(Kovacs et al, 2014). Therefore, a simple, rapid and cost effective detection system for
falsified and substandard medicines would help in addressing this challenge of
medicine falsification. Different approaches have been employed in the detection of
counterfeit medicines, the first being visual inspection or physical examination of the
packaging and then the medicines (Davison, 2011).
Visual inspection/physical examination of medicines starts with the packaging; are
there any unique features, which could be covert or overt such as logos, watermarks or
radio-frequency identification tags? For example, absence of leaflets and/or
inconsistencies in labelling on packaging compared to authentic tablets could help
identify falsified medication. Newton et al. (2011) identified falsified antimalarial
medicines based on observed differences in their packaging. Tablet inspection could
include noting the length, width, thickness, mass, shape, colour and
markings/inscriptions on the tablet (Kovacs et al, 2014). Custers et al (2016), in their
study showed measurements of tablets length and mass helped discriminate genuine
Viagra® tablets from falsified ones.
Nowadays, simple visual inspection of the medicines no longer suffices for the
screening of medicines since the falsifiers of medicines now use more sophisticated
approaches (Martino et al, 2010; Dégardin et al, 2014). Consequently, more advanced
analytical techniques are required to detect suspect medicines as fast as possible, to
7 | P a g e
get them out of the market to help curb the threat falsified and substandard medicines
pose to public health.
Some simple and easy analytical methods used for screening of medicines include,
colorimetry, thin-layer chromatography (TLC) and melting point determination
(Dégardin et al, 2014). These simple analytical methods easily identify the presence or
absence of the API and/or excipient in the medication, hence, provide quick screening
of samples. The absence of API(s)/excipients declared on the packaging or the
presence of API(s)/excipients not declared suggests the medicine might be counterfeit
and needs further analysis. The drawback with the simpler colorimetric and TLC based
methods for quick screening of medicines mentioned earlier is that they are qualitative
based techniques and so will not be able to detect counterfeits where incorrect
amounts of APIs are present but rather identify the presence or absence of the API
concerned. Furthermore, some of these simple qualitative methods are specific for
particular medicines such as the paper test cards for assessing antimalarial tablets
(Weaver and Lieberman, 2015) implying that different methods will be developed for
different medicines making the process laborious (Martino et al, 2010). Nevertheless,
the simple qualitative methods are useful as fast preliminary checks for medicines.
Other more advanced separation techniques that could be used for further
quantification of APIs or excipients in medicines are gas chromatography (GC), high
performance liquid chromatography (HPLC), Ultraviolet Visible (UV-vis) spectroscopy,
nuclear magnetic resonance (NMR) and mass spectrometry (MS) (Görög, 2015).
Hyphenated mass spectrometry techniques such as GC-MS and LC-MS have also
been investigated in the quantification of APIs. Despite the fact that these techniques
are more robust, much longer sample preparation times are required since APIs and/or
excipients have to be solvent extracted before analysis. These more advanced
8 | P a g e
techniques are also expensive and require skilled personnel for both analysis and
interpretation of results (Kovacs et al, 2014).
Simple techniques requiring little or no sample preparation prior to analysis help to
speed up analysis time and thus would be apt for the first-line analysis of falsified
medicines (Kovacs et al, 2014). Cost-effectiveness and portability are also important
features to consider when choosing methods for screening falsified and substandard
medicines. Cheaper (cost of production and maintenance) methods will make the
techniques more accessible to wide range of users globally and therefore facilitate
quicker analysis at different points in the medicines distribution chain. Portability of the
equipment is also important in screening for falsified medicines in order to ensure ease
of use on the field or at the point of sale of the medicines. The speed of analysis,
cheaper costs, portability and simplicity of the technique employed in the screening of
medicines will go a long way in facilitating in-field analysis of medicines especially in
low and middle-income countries (Höllein et al, 2016).
Taking into account the important features for techniques employed in screening
falsified medicines (highlighted in the previous paragraph), vibrational spectroscopic
techniques would be well suited for screening medicines since minimal sample
preparation is required prior to analysis. With spectroscopic-based methods, the
excitation of fundamental molecular rotations or vibrations gives rise to unique spectra
for the individual samples (Been, 2011). Generally, spectroscopic techniques can
assess both solid and liquid samples and require minimal amount of sample (just
enough to cover the sampling window) because they are surface based techniques.
Although the IR system was initially a transmission system, current modifications of the
system allows the excitation of fundamental vibrations only few micrometres beyond
the sample surface. Very small amounts of sample needed will in turn reduce exposure
of the analyst to harmful chemicals or substances in the medicines investigated.
9 | P a g e
Raman and Near Infrared (NIR) spectroscopy have been extensively used for the
analysis of pharmaceutical tablet (solid dosage) formulations though most
investigations were qualitative, focusing on identifying the sources of the medicines (de
Veij et al, 2007; Moffat et al, 2010; Mbinze et al, 2015; Dégardin et al, 2016). Raman
spectroscopy involves heating the test tablet sample via intense laser radiation that
could in turn destroy the sample or cover the Raman spectrum. Although no sample
preparation is needed with Raman spectroscopy and samples can be analysed through
packaging, there might be challenges obtaining good data/ Raman spectra from solid
formulations which are poorly homogenised or medicines that fluoresce. Poor Raman
spectra obtained could be because of the weak Raman effect (scattering the inelastic
part of light by a sample irradiated by a laser). As such, Raman instrumentation has to
be highly optimised in order to obtain valuable spectra (Deisingh, 2005). The analyst
may also be exposed to strong laser radiation which is a health risk. NIR on the other
hand produces spectra with broad peaks which are less specific and are rather
indicative of vibrational combination and overtones of oxygen-hydrogen (-OH),
nitrogen-hydrogen (-NH) and carbon-hydrogen (-CH), not particular functional group
vibrations or rotations (Moffat et al, 2010; Dégardin et al, 2016). Fourier transform
infrared (FTIR) has been investigated in the analysis of falsified medicines as it
eliminates the need for solvent extraction of the APIs/excipients. However, skilled
personnel are needed for sample preparation using transmission FTIR as this involves
dispersing about 0.1- 2% w/w of the sample in a KBr matrix and pressing it into a disc
before analysis. The strength of the IR spectra is dependent on the amount and
homogeneity of the powder sample dispersed in the matrix. Therefore, ensuring the
right amount of sample in the matrix is crucial in order to obtain good and well-defined
FTIR spectra. Sample preparation involving dispersion in a matrix in turn lengthens
time for analysis (Mallah et al, 2015).
10 | P a g e
The use of Attenuated Total Reflection- Fourier Transform Infrared (ATR-FTIR)
spectroscopy can address the problems identified with Raman and NIR spectroscopy
(Custers et al, 2011). The spectral peaks with ATR-FTIR spectroscopy are also more
specific addressing the challenges of poor specificity with NIR spectroscopy. In
addition, minimal sample preparation is needed, solid pharmaceutical formulations are
only crushed before analysis. For a tablet, just enough powder to cover the tip of a
micro spatula is needed for analysis. The ATR-FTIR spectrum is obtained within a few
seconds. So far, this technique has been used primarily for qualitative analysis of
medicines (Ortiz et al, 2013; Custers et al, 2015).
Apart from the spectroscopic techniques, mass spectrometry (MS) was investigated as
a technique for the rapid authentication of medicines based on its high accuracy,
selectivity and quantitative abilities. While the spectroscopic techniques are relatively
low cost, rapid and are able to detect the presence of the expected API(s), they do not
provide detailed compositional information pertaining to contaminants or wrong APIs.
MS is able to detect molecules based on the ionisation of the analyte and sorts the ions
according to their mass-to-charge ratios (m/z) thereby providing a valuable tool for the
characterisation of individual components in medicines. The ability of MS to
characterise individual components in medicines will facilitate the detection of falsified
medicines that might contain other APIs not declared on the packaging or
contaminants. Detailed MS data could also aid forensic investigations in linking/tracing
falsified medicines to their source or countries of origin. On the other hand, MS is only
capable of detecting analytes that are converted to gas phase ions. Liquid and gas
chromatography coupled to mass spectrometry (LC-MS and GC-MS respectively) are
the most commonly used MS techniques by regulatory agencies and laboratories in
pharmaceutical companies in developed countries (Culzoni et al, 2014). However, LC-
MS and GC-MS are expensive techniques and have limited sample throughput
11 | P a g e
resulting from extensive sample preparation requirements before analysis and actual
duration of the chromatographic runs. The high cost and limited sample throughput
using LC-MS and GC-MS implies that these techniques (LC-MS and GC-MS) will not
be easily accessible in LMICs. More cost-effective complementary techniques with
increased sample throughput that can provide reliable answers rapidly are highly
desirable especially in LMICs.
Improving sensitivity has been the focus of recent efforts towards miniaturization of
mass spectrometers to make them more portable (Kumano et al, 2015; Snyder et al,
2015). Optimisation of these portable mass spectrometry (MS) based techniques could
be important in the efforts towards detecting falsified and substandard medicines.
Kumano et al, (2015) recently developed a probe heating method for a portable mass
spectrometer, for the analysis of solid samples. This method was used in the detection
of illicit drugs but there was no mention of the use of the probe heating MS method as
a technique for detection of falsified medicines. Probe heating MS method otherwise
known as Direct Insertion Probe- Mass Spectrometry (DIP-MS) could occur by electron
ionisation (conventional hard ionisation) or by ambient (soft) ionisation. Minute amount
of sample is also required for DIP-MS (just a flick of TLC spotter dipped in sample).
The conditions influencing fragmentation pattern of samples being analysed include the
ionisation environment (atmospheric or vacuum) within which ionisation takes place as
well as the energy (soft or hard) employed during ionisation of the samples.
MS methods such as Direct Analysis in Real Time (DART) and Desorption
Electrospray Ionisation (DESI) have been identified as suitable for assessing medicines
since minimal sample preparation is needed before analysis (Culzoni et al, 2014;
Rebiere et al, 2017; Zou et al, 2017). DART and DESI-MS are ambient ionisation MS
methods meaning ionisation occurs in open air and outside of the vacuum environment
of the mass spectrometer and they generate ions softly (Monge et al, 2013). The high
12 | P a g e
throughput capabilities of DART and DESI-MS make them valuable methods for quick
and reliable screening of large numbers of both solid and liquid pharmaceutical
formulations (Culzoni et al, 2014; Bernier et al, 2016). Culzoni et al, (2014) identifies
DART and DESI as solid-liquid extraction based MS techniques suggesting solid
samples are dissolved in a solvent prior to analysis. Another, ambient ionisation
technique used for analysis in recent times is the direct analysis probe also known as
Atmospheric Solid Analysis Probe (ASAP) but as mentioned earlier (with DIP-MS) its
potential in the screening of medicines has scarcely been explored. ASAP-MS require
soft ionisation, allows fast analysis of both solid and liquid samples with quality data
available within seconds and minimal sample preparation is needed prior to analysis as
with DART and DESI. In addition to the advantages ASAP-MS shares with other
ambient MS techniques like DART and DESI, it is also a low cost alternative to the
other direct analysis MS techniques. Furthermore, ASAP-MS provides a replacement
for the conventional electron ionisation (EI) vacuum solids probe which involves longer
sampling time and requires hard ionisation. Therefore, ASAP-MS could potentially be a
valuable option for the investigation of medicines.
1.2 Aim of Study
The purpose of this study was to research into the development of rapid instrumental
methods addressing both the qualitative and the quantitative analysis of medicines
since many counterfeit medicines in the international market also contain incorrect
amounts of the API(s). It is therefore important to go beyond confirming the presence
or absence of the APIs/ excipients to determine if the medicine contains the APIs in the
right amounts. The following techniques were investigated: Attenuated Total Reflection
Fourier Transform Infrared (ATR/FTIR) Spectroscopy, Raman Spectroscopy,
Atmospheric Solid Analysis Probe-Mass Spectrometry (ASAP-MS), Direct Insertion
Probe Mass Spectrometry (DIP MS) by electron ionisation (EI), UV Vis spectroscopy
13 | P a g e
and Liquid Chromatography- Mass Spectrometry (LC-MS). Direct Insertion Probe Mass
Spectrometry by EI and ambient ionisation (ASAP-MS), UV Vis spectroscopy and LC-
MS were used to validate the results based on the ATR/FTIR and Raman
spectroscopy. In summary, this research proposes:
Simple, rapid and robust instrumental methods for the authentication of solid
pharmaceutical formulations/ medicines
The use of data obtained based on developed methods to facilitate forensic
investigations in tracing falsified medicines to their origin or source.
Optimised methods were employed in the analysis of analgesic/antipyretic and
antimalarial tablets available to patients in the UK and worldwide. The results show the
potential of the spectroscopic and DIP-MS techniques and it is hoped that this will help
facilitate both qualitative and quantitative detection of falsified medicines (especially in
the field) and in turn forensic investigations of falsified and substandard medicines
even in LMICs.
1.3 Thesis Outline
This thesis focuses on the investigation of simple and rapid instrumental methods for
qualitative and quantitative analysis of falsified medicines as mentioned in 1.2. The first
chapter of this thesis gives an overview and general background of the research
project including the aim of the study. Chapter 2 provides a theoretical background with
current literature in the subject highlighting the extent of the problem and analytical
techniques commonly used for investigating counterfeit medicines.
Methods based on different analytical techniques were assessed for their potential for
the rapid detection of counterfeit pharmaceutical tablet formulations. The next three
chapters focus on rapid qualitative and quantitative analysis of counterfeit medicines.
Chapter 3 covers the development of novel screening methods for counterfeit
14 | P a g e
medicines based on ATR-FTIR. Chapters 4 and 5 describe methods for the analysis of
tablet medication using Raman spectroscopy and DIP-MS respectively. DIP-MS by EI
and ambient ionisation (ASAP-MS) were considered for their potential in the detection
of counterfeit medicines with very low API concentrations which were difficult to detect
or not well-resolved with the spectroscopic techniques (ATR/FTIR and Raman).
Since the optimised rapid methods based on the techniques in Chapters 3-5 were able
to detect the presence or absence of the APIs, Chapters 6 and 7 outline
conventional/pharmacopoeia approved solvent extraction methods for quantitative
determination of tablet medications using UV-Vis spectroscopy and LC-MS
respectively. These conventional methods were applied in the analysis of the tablet
medication in order to assess the YES and NO of the data based on the rapid methods
and to ascertain the potential of the rapid methods in the screening of falsified
medicines. Chapter 8 compares the different techniques for assessing medicines
investigated based on data obtained. Finally, the main conclusions and results of this
research project including future directions of the project are presented in the last
chapter (Chapter 9).
15 | P a g e
1.4 References
Been, F., Roggo, Y., Degardin, K., Esseiva, P. and Margot, P. (2011) Profiling of
counterfeit medicines by vibrational spectroscopy. Forensic Science International,
211(1): 83-100.
Bernier, M.C., Li, F., Musselman, B., Newton, P.N. and Fernández, F.M. (2016)
Fingerprinting of falsified artemisinin combination therapies via direct analysis in real
time coupled to a compact single quadrupole mass spectrometer. Analytical Methods,
8(36): 6616-6624.
Culzoni, M.J., Dwivedi, P., Green, M.D., Newton, P.N. and Fernández, F.M. (2014)
Ambient mass spectrometry technologies for the detection of falsified drugs. Medicinal
Chemistry Communications, 5(1): 9-19.
Custers, D., Cauwenbergh, T., Bothy, J.L., Courselle, P., De Beer, J.O., Apers, S. and
Deconinck, E. (2015) ATR-FTIR spectroscopy and chemometrics: an interesting tool to
discriminate and characterize counterfeit medicines. Journal of Pharmaceutical and
Biomedical Analysis, 112: 181-189.
Custers, D., Vandemoortele, S., Bothy, J.L., De Beer, J.O., Courselle, P., Apers, S. and
Deconinck, E. (2016) Physical profiling and IR spectroscopy: simple and effective
methods to discriminate between genuine and counterfeit samples of Viagra® and
Cialis®. Drug Testing and Analysis, 8(3-4): 378-387.
Davison, M. (2011) Pharmaceutical anti-counterfeiting: combating the real danger from
fake drugs. New Jersey: John Wiley & Sons.
Dégardin, K., Guillemain, A., Guerreiro, N.V. and Roggo, Y. (2016) Near infrared
spectroscopy for counterfeit detection using a large database of pharmaceutical
tablets. Journal of Pharmaceutical and Biomedical Analysis, 128: 89-97.
Dégardin, K., Roggo, Y. and Margot, P. (2015) Forensic intelligence for medicine anti-
counterfeiting. Forensic Science International, 248: 15-32.
Dégardin, K., Roggo, Y. and Margot, P. (2014) Understanding and fighting the
medicine counterfeit market. Journal of Pharmaceutical and Biomedical Analysis, 87:
167-175.
Deisingh, A.K. (2005) Pharmaceutical counterfeiting. Analyst, 130(3): 271-279.
de Veij, M., Vandenabeele, P., Hall, K.A., Fernandez, F.M., Green, M.D., White, N.J.,
Dondorp, A.M., Newton, P.N. and Moens, L. (2007) Fast detection and identification of
counterfeit antimalarial tablets by Raman spectroscopy. Journal of Raman
Spectroscopy, 38(2): 181-187.
Görög, S. (2015) Identification in drug quality control and drug research. TrAC Trends
in Analytical Chemistry, 69: 114-122.
16 | P a g e
Höllein, L., Kaale, E., Mwalwisi, Y.H., Schulze, M.H. and Holzgrabe, U., (2016) Routine
quality control of medicines in developing countries: Analytical challenges, regulatory
infrastructures and the prevalence of counterfeit medicines in Tanzania. TrAC Trends
in Analytical Chemistry, 76: 60-70.
Jackson, G., Patel, S. and Khan, S. (2012) Assessing the problem of counterfeit
medications in the United Kingdom. International Journal of Clinical Practice, 66(3):
241-250.
Kovacs, S., Hawes, S.E., Maley, S.N., Mosites, E., Wong, L. and Stergachis, A. (2014)
Technologies for detecting falsified and substandard drugs in low and middle-income
countries. PLoS One, 9(3): e90601.
Kumano, S., Sugiyama, M., Yamada, M., Nishimura, K., Hasegawa, H., Morokuma, H.,
Inoue, H. and Hashimoto, Y. (2015) Probe Heating Method for the Analysis of Solid
Samples Using a Portable Mass Spectrometer. Mass Spectrometry, 4(1): A0038.
Mackey, T.K. and Liang, B.A. (2011) The global counterfeit drug trade: patient safety
and public health risks. Journal of Pharmaceutical Sciences, 100(11): 4571-4579.
Mallah, M.A., Sherazi, S.T.H., Bhanger, M.I., Mahesar, S.A. and Bajeer, M.A. (2015) A
rapid Fourier-transform infrared (FTIR) spectroscopic method for direct quantification of
paracetamol content in solid pharmaceutical formulations. Spectrochimica Acta Part A:
Molecular and Biomolecular Spectroscopy, 141: 64-70.
Martino, R., Malet-Martino, M., Gilard, V. and Balayssac, S. (2010) Counterfeit drugs:
analytical techniques for their identification. Analytical and Bioanalytical Chemistry,
398(1): 77-92.
Mbinze, J.K., Sacré, P.Y., Yemoa, A., Mbay, J.M.T., Habyalimana, V., Kalenda, N.,
Hubert, P., Marini, R.D. and Ziemons, E. (2015) Development, validation and
comparison of NIR and Raman methods for the identification and assay of poor-quality
oral quinine drops. Journal of Pharmaceutical and Biomedical Analysis, 111: 21-27.
Moffat, A.C., Assi, S. and Watt, R.A. (2010) Identifying counterfeit medicines using
near infrared spectroscopy. Journal of Near Infrared Spectroscopy, 18(1): 1-15.
Monge, M.E., Harris, G.A., Dwivedi, P. and Fernandez, F.M. (2013) Mass
spectrometry: recent advances in direct open air surface sampling/ionization. Chemical
Reviews, 113(4): 2269-2308.
Newton, P.N., Green, M.D., Fernández, F.M., Day, N.P. and White, N.J. (2006)
Counterfeit anti-infective drugs. The Lancet Infectious Diseases, 6(9): 602-613.
Newton, P.N., Green, M.D., Mildenhall, D.C., Plançon, A., Nettey, H., Nyadong, L.,
Hostetler, D.M., Swamidoss, I., Harris, G.A., Powell, K. and Timmermans, A.E. (2011)
Poor quality vital anti-malarials in Africa-an urgent neglected public health
priority. Malaria Journal, 10(1): 352.
Ortiz, R.S., de Cássia Mariotti, K., Fank, B., Limberger, R.P., Anzanello, M.J. and
Mayorga, P. (2013) Counterfeit Cialis and Viagra fingerprinting by ATR-FTIR
17 | P a g e
spectroscopy with chemometry: Can the same pharmaceutical powder mixture be used
to falsify two medicines? Forensic Science International, 226(1): 282-289.
Petersen, A., Held, N. and Heide, L. (2017) Surveillance for falsified and substandard
medicines in Africa and Asia by local organizations using the low-cost GPHF Minilab.
PloS One, 12(9): e0184165.
Rebiere, H., Guinot, P., Chauvey, D. and Brenier, C. (2017) Fighting falsified
medicines: The analytical approach. Journal of Pharmaceutical and Biomedical
Analysis, 142: 286-306.
Snyder, D.T., Pulliam, C.J., Ouyang, Z. and Cooks, R.G. (2015) Miniature and fieldable
mass spectrometers: recent advances. Analytical Chemistry, 88(1): 2-29.
Weaver, A.A. and Lieberman, M. (2015) Paper test cards for presumptive testing of
very low quality antimalarial medications. The American Journal of Tropical Medicine
and Hygiene, 92(6_Suppl): 17-23.
Zou, W.B., Yin, L.H. and Jin, S.H. (2017) Advances in rapid drug detection
technology. Journal of Pharmaceutical and Biomedical Analysis, 147: 81-88.
World Health Organisation- WHO (2017) WHO Global Surveillance and Monitoring
System for Substandard and Falsified Medical Products. Geneva: World Health
Organization. Licence: CC BY-NC-SA 3.0 IGO. Available at:
http://www.who.int/medicines/regulation/ssffc/publications/GSMS_executive_Summary.
pdf (accessed 04.05.2018)
18 | P a g e
CHAPTER TWO
Falsified and Substandard
Medicines Overview
19 | P a g e
2.1 What are falsified and substandard medicines?
The difficulty in reaching an agreement on a clear-cut, globally accepted definition for
falsified medicines (or counterfeit medicines as they were called) led to several
consultations by the World Health Organisation (WHO) (Attaran et al, 2011; Newton et
al, 2011; Dégardin et al, 2015). Initial amendments by the World Health Organisation
(WHO) led to the use of the ambiguous term “substandard/ spurious/ falsely-labelled/
falsified/ counterfeit (SSFFC) medicines” (WHO, 2016). In defining SSFFC medicines,
the WHO held on to the public health meaning and the life-threatening potential of
counterfeit medicines. These amendments of the definition for counterfeit medicines
helped clarify the difference between counterfeit and substandard medicines. Prior to
the WHO (2016) definition of counterfeit medicines, Reggi (2007) suggested that all
counterfeit medicines are substandard medicines but substandard medicines may not
be termed counterfeits if there is no fraudulent intention. The WHO (2016) defines
counterfeit and substandard medicines thus:
“A counterfeit medicine is one which is deliberately and fraudulently mislabelled with
respect to identity and/or source. Counterfeiting can apply to both branded and generic
products and counterfeit products may include products with the correct ingredients or
with the wrong ingredients, without active ingredients, with insufficient (inadequate
quantities of ingredient(s) or with fake packaging.”
“Substandard medicines (also called out of specification (OOS) products) are genuine
medicines produced by manufacturers authorized by the National Medicines
Regulatory Authority (NMRA) which do not meet quality specifications set for them by
National standards” (WHO, 2016).
There was also the argument that it is difficult to distinguish a counterfeit medicine from
a substandard one since the only major difference between the counterfeit and
20 | P a g e
substandard medicine is the intent to deceive by the manufacturer (Chika et al, 2011).
Either way, both counterfeit and substandard medicines are not what they say on the
packet so would pose a threat to public health.
On the other hand, counterfeiting of medicines can legally be described as a violation
of intellectual property (IP). The Agreement On Trade-Related Aspects Of Intellectual
Property Rights (TRIPS), defines “counterfeit trademark goods” as;
“any goods, including packaging, bearing without authorization a trademark which is
identical to the trademark validly registered in respect of such goods, or which cannot
be distinguished in its essential aspects from such a trademark, and which thereby
infringes the rights of the owner of the trademark in question under the law of the
country of importation” (WTO, 2016).
Intellectual property (IP) violation is punishable by law. This definition of counterfeit or
falsified medicines based on IP violation enables the manufacturers of branded
medicines to have a certain level of protection over their products. However,
punishments may not be commensurate to the crime, since the public health threat
posed by counterfeit and substandard medicines is neglected. Moreover, the
intellectual property approach to defining counterfeit medicines does not take account
of generic medicines (Shepherd, 2010; Attaran et al, 2011).
In a bid to highlight more clearly the public health threat posed by these SSFFC
medicines, the WHO have recently adopted the term “substandard and falsified
medical products” highlighting the public health threat posed by these medicines at the
seventieth World Health Assembly (WHO, 2017). The adopted definitions are outlined
as follows:
21 | P a g e
Substandard medical products or out of specification medical products “are authorised
medical products that fail to meet either their quality standards or their specifications, or
both”.
Falsified medical products refer to “medical products that deliberately/fraudulently
misrepresent their identity, composition or source”
Unregistered or unlicensed medical products are those “that have not undergone
evaluation and/or approval by the national or regulatory authority for the market in
which they are marketed/distributed or used, subject to permitted conditions under
national or regional regulation and legislation” (WHO, 2017).
Although the latest definitions by the WHO help to clarify what a falsified medicine
really is, there is still no consensus among countries on what constitutes a falsified or
substandard medicine. Consequently, there is a disparity in the legislation addressing
falsified and substandard between countries, making a general overview difficult. The
absence of an international legal framework is indeed a major challenge in curbing the
proliferation of falsified medicines (Attaran et al, 2011, WHO, 2017).
2.1.2 Types of falsified and substandard medicines
Falsified medicines differ in type and quality and this depends mostly on their
destination or point of purchase. Copies of a pharmaceutical formulation often have the
same API(s) as the genuine product, and in some cases API(s) are present in the
same proportion making it more difficult to distinguish between the genuine and
falsified copies of the pharmaceutical formulation (Seiter, 2009; Dégardin et al, 2014).
Other falsified medicines contain wrong amounts of APIs, no APIs or even other APIs
in some cases. Wrong APIs with chemical structures similar to the genuine ones could
be used (Newton et al., 2008; Rebiere et al, 2017). Other falsified medicines contain a
wrong API that gives the patient a false sense of relief by dealing with or addressing a
22 | P a g e
symptom rather than the ailment itself. A typical example is falsified antimalarial
medicines that reduce the fever in patients with malaria but fail to cure the disease
itself (Davison, 2011). In some other cases, genuine medicines that are expired or
degraded are repacked and resold, making them difficult to identify (Mukhopadhyay,
2007; Davison, 2011). There are also those commonly referred to as “placebo
counterfeits” made up of just excipients (inactive additives) which may not be harmful
but do not deliver the desired therapeutic effect. Beyond the medicines themselves,
falsifiers of medicines also often target the packaging and documentation
(Vanderdonck, 2007; Dégardin et al, 2014). It can be argued that it is the medicine that
the patient ingests that puts the individual at risk and not the packaging. In other words,
fake packaging never killed anyone but taking the wrong medication might. However,
fake packaging can provide a good opportunity for falsifiers of medicine to “dilute” a
consignment of genuine medicines obtained illegally or stolen in order to double unit
volume. For instance, blister-packed medicines can be taken out of their secondary
packaging and the blisters (which have not been tampered with) are repacked into fake
boxes while the genuine boxes are repacked with blisters of the falsified medicine.
Considering this approach of repacking medicine boxes, the falsifier of medicines
ensure that unit volume is increased and all consignments also contain both genuine
and falsified medicines. Authentication of medicines where both genuine and falsified
medicines are present in the same consignment is then a complex situation where
there is a possibility of the falsified medicines being overlooked or not even noticed due
to the presence of genuine medicines in the same lot. Medicines can be falsified in
different ways depending on the individual(s) and the manufacturing steps involved.
These manufacturing steps for falsified medicines could be carried out manually or in a
pharmaceutical plant on an industrial scale. Therefore, falsification of medicines is not
a uniform activity and results in products that are very variable and can take different
forms. In 2012, the WHO considered reported cases of falsified and substandard
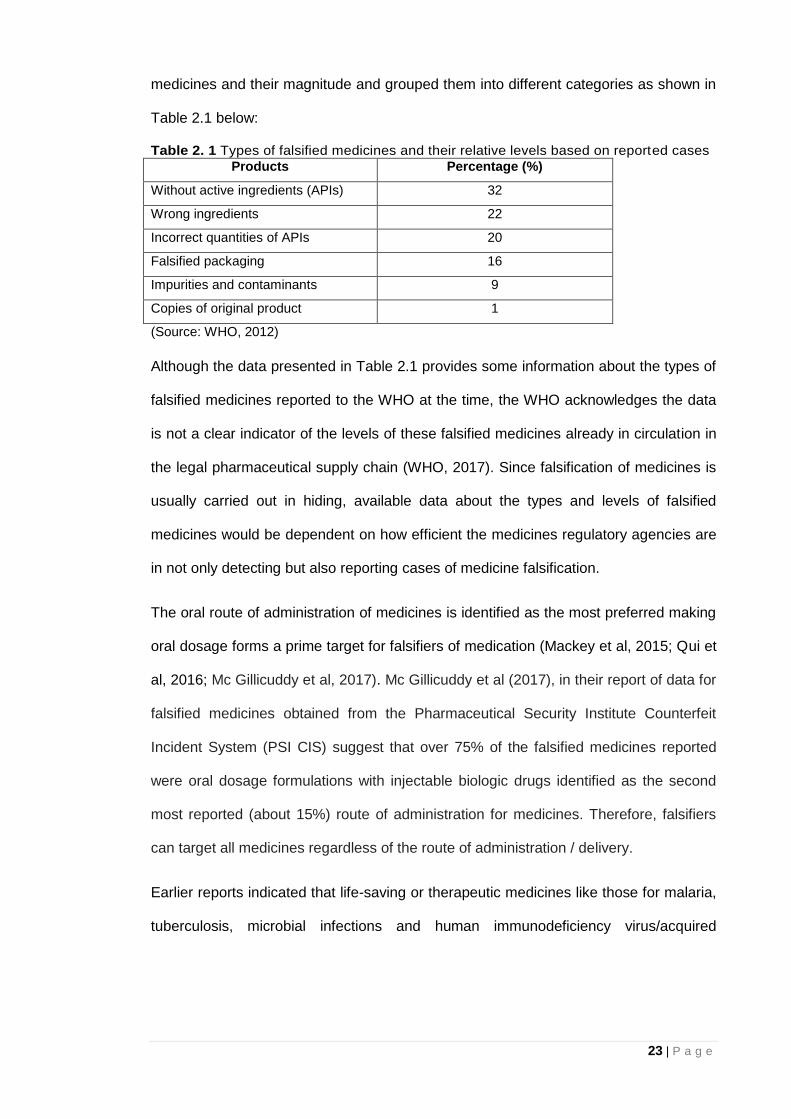
23 | P a g e
medicines and their magnitude and grouped them into different categories as shown in
Table 2.1 below:
Table 2. 1 Types of falsified medicines and their relative levels based on reported cases
Products Percentage (%)
Without active ingredients (APIs) 32
Wrong ingredients 22
Incorrect quantities of APIs 20
Falsified packaging 16
Impurities and contaminants 9
Copies of original product 1
(Source: WHO, 2012)
Although the data presented in Table 2.1 provides some information about the types of
falsified medicines reported to the WHO at the time, the WHO acknowledges the data
is not a clear indicator of the levels of these falsified medicines already in circulation in
the legal pharmaceutical supply chain (WHO, 2017). Since falsification of medicines is
usually carried out in hiding, available data about the types and levels of falsified
medicines would be dependent on how efficient the medicines regulatory agencies are
in not only detecting but also reporting cases of medicine falsification.
The oral route of administration of medicines is identified as the most preferred making
oral dosage forms a prime target for falsifiers of medication (Mackey et al, 2015; Qui et
al, 2016; Mc Gillicuddy et al, 2017). Mc Gillicuddy et al (2017), in their report of data for
falsified medicines obtained from the Pharmaceutical Security Institute Counterfeit
Incident System (PSI CIS) suggest that over 75% of the falsified medicines reported
were oral dosage formulations with injectable biologic drugs identified as the second
most reported (about 15%) route of administration for medicines. Therefore, falsifiers
can target all medicines regardless of the route of administration / delivery.
Earlier reports indicated that life-saving or therapeutic medicines like those for malaria,
tuberculosis, microbial infections and human immunodeficiency virus/acquired
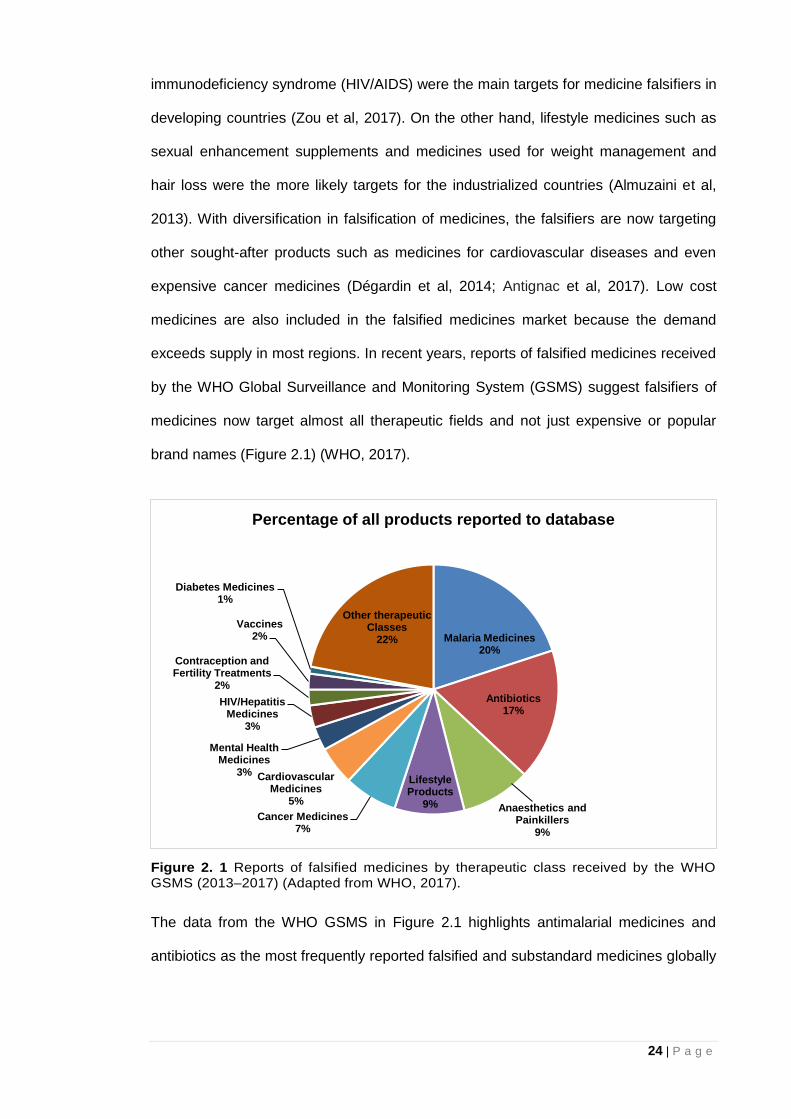
24 | P a g e
immunodeficiency syndrome (HIV/AIDS) were the main targets for medicine falsifiers in
developing countries (Zou et al, 2017). On the other hand, lifestyle medicines such as
sexual enhancement supplements and medicines used for weight management and
hair loss were the more likely targets for the industrialized countries (Almuzaini et al,
2013). With diversification in falsification of medicines, the falsifiers are now targeting
other sought-after products such as medicines for cardiovascular diseases and even
expensive cancer medicines (Dégardin et al, 2014; Antignac et al, 2017). Low cost
medicines are also included in the falsified medicines market because the demand
exceeds supply in most regions. In recent years, reports of falsified medicines received
by the WHO Global Surveillance and Monitoring System (GSMS) suggest falsifiers of
medicines now target almost all therapeutic fields and not just expensive or popular
brand names (Figure 2.1) (WHO, 2017).
Figure 2. 1 Reports of falsified medicines by therapeutic class received by the WHO GSMS (2013–2017) (Adapted from WHO, 2017).
The data from the WHO GSMS in Figure 2.1 highlights antimalarial medicines and
antibiotics as the most frequently reported falsified and substandard medicines globally
Malaria Medicines20%
Antibiotics17%
Anaesthetics and Painkillers
9%
Lifestyle Products
9%Cancer Medicines
7%
Cardiovascular Medicines
5%
Mental Health Medicines
3%
HIV/Hepatitis Medicines
3%
Contraception and Fertility Treatments
2%
Vaccines2%
Diabetes Medicines1%
Other therapeutic Classes
22%
Percentage of all products reported to database
25 | P a g e
(Bassat et al, 2016; Krakowska et al, 2016; WHO, 2017). In addition, Figure 2.1
suggests high demand over-the-counter (OTC) medicines for pain relief have also been
the target of counterfeiters (Newton et al, 2010; Davison, 2011; WHO, 2017). The 2016
Advisory Council on the Misuse of Drugs (ACMD) report on diversion and illicit supply
of medicines identifies painkillers as one of the main group of medicines being supplied
through illicit means in the UK (ACMD, 2016). One API commonly used as a painkiller
and for reducing fever is paracetamol. Paracetamol, also known as acetaminophen (4-
acetamidophenol, N-acetyl-p-phenacetin), (Bosch et al, 2006) has been identified as
the second most widely used API after acetylsalicylic acid and the most commonly
used medicine in children (Star and Choonara, 2014). Falsifiers have therefore
targeted paracetamol containing OTC medicines (Davison, 2011, WHO, 2017). An
example is a case of suspect paracetamol tablets in the Democratic Republic of Congo
in 2014, reported to the WHO (WHO, 2017). Patients taking the paracetamol tablets
were complaining of lethargy and were also found to have low blood pressure. Low
blood pressure due to the paracetamol tablets resulted in slower heartbeat in the foetus
of pregnant women, potentially hampering its growth. Preliminary testing performed
locally by the national pharmacovigilance programme confirmed the presence of
paracetamol in the tablets. However, further tests by WHO in a European laboratory
showed that although the tablets contained the API paracetamol, it was present in
wildly different doses ranging from the expected amount of 500mg to as low as 100mg.
In addition, the tablets contained other ingredients not declared on the packaging such
as the barbiturate phenobarbital a common treatment for epilepsy, which helps to slow
down heart rate and breathing. Even more intriguing was the fact that the very
inconsistent paracetamol tablet formulations all bore the same batch number – a clear
indication that good manufacturing practices were not followed.
26 | P a g e
Recently, the Philippine President Rodrigo Duterte took a stand against falsified OTC
medicines in a bid to curb the spread of falsified paracetamol by ordering the arrest of
those responsible by the police (Reuters News, 2018).
Furthermore, paracetamol was detected in falsified medicines where the anticipated
API was missing (de Veij et al, 2007; Khuluza et al, 2016). Paracetamol can be a very
dangerous chemical if taken incorrectly and unexpected overdoses can occur as a
result of miss-labelled or substandard (too much API) medicines, leading to toxic
effects including renal failure and possible death (Star and Choonara, 2014; Buckley et
al, 2016). A report of a situation in the USA, where 500mg paracetamol tablets were
actually labelled as 325mg, suggest that people in both industrialised and Low and
Middle Income Countries (LMICs) are exposed to miss-labelled (falsified) medication
(Barry, 2015).
2.1.3 Extent of the falsified/substandard medicines problem worldwide
In a bid to tackle falsified and substandard medicines, some important questions need
to be addressed such as: “how many are there and where can they be found?” These
questions are disappointingly difficult to answer due to the clandestine nature of the
falsified and substandard medicines market. Reiterating earlier comments made in
2.1.2, available information regarding FSMs, based on those discovered and reported,
implies that a lot more might not be accounted for or documented. Data from the
Pharmaceutical Security Institute (PSI) show that reported incidents of medicine
falsification from 127 countries around the world increased from 2018 incidents in 2012
to 3147 in 2016 (PSI, 2018). These PSI data for reported incidents of medicine
falsification highlighted in Fig 2.2 were obtained from seven regions of the world
indicating that falsification of medicines is not just peculiar to certain regions of the
world but is a global problem. Consequently, anyone anywhere in the world can be
exposed to falsified medicines. The data from PSI in 2016 also indicates a 5% increase
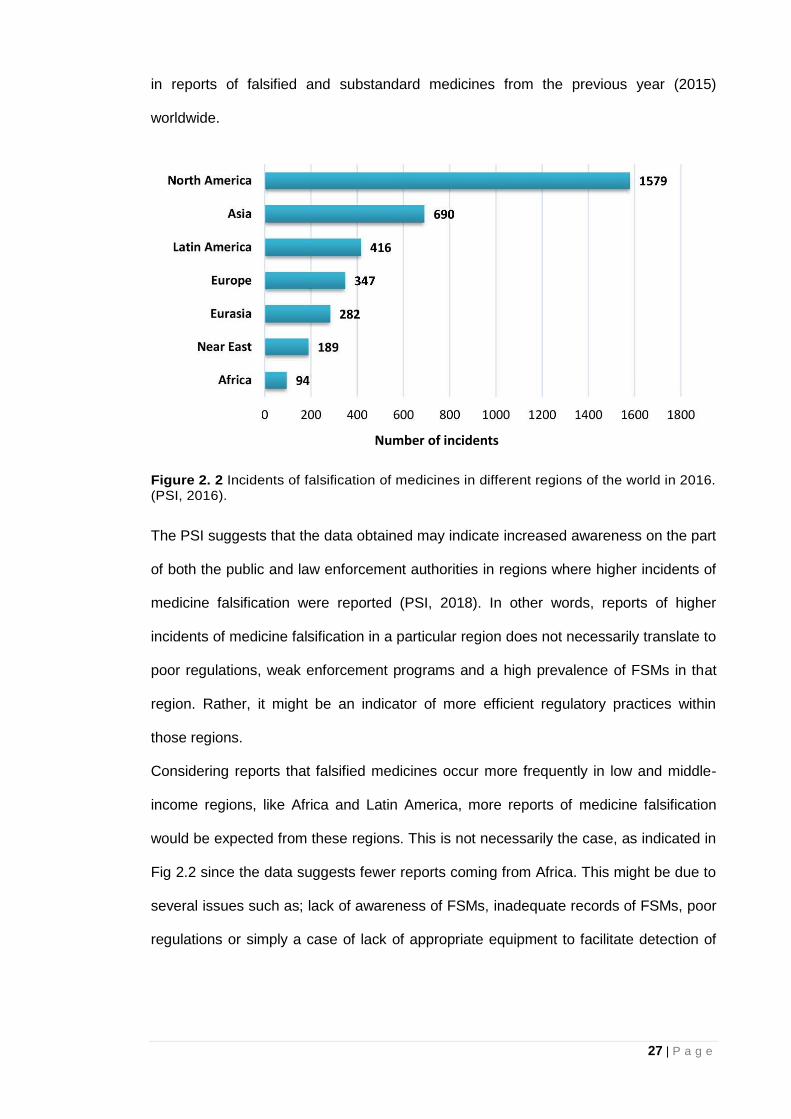
27 | P a g e
in reports of falsified and substandard medicines from the previous year (2015)
worldwide.
Figure 2. 2 Incidents of falsification of medicines in different regions of the world in 2016. (PSI, 2016).
The PSI suggests that the data obtained may indicate increased awareness on the part
of both the public and law enforcement authorities in regions where higher incidents of
medicine falsification were reported (PSI, 2018). In other words, reports of higher
incidents of medicine falsification in a particular region does not necessarily translate to
poor regulations, weak enforcement programs and a high prevalence of FSMs in that
region. Rather, it might be an indicator of more efficient regulatory practices within
those regions.
Considering reports that falsified medicines occur more frequently in low and middle-
income regions, like Africa and Latin America, more reports of medicine falsification
would be expected from these regions. This is not necessarily the case, as indicated in
Fig 2.2 since the data suggests fewer reports coming from Africa. This might be due to
several issues such as; lack of awareness of FSMs, inadequate records of FSMs, poor
regulations or simply a case of lack of appropriate equipment to facilitate detection of
Number of incidents
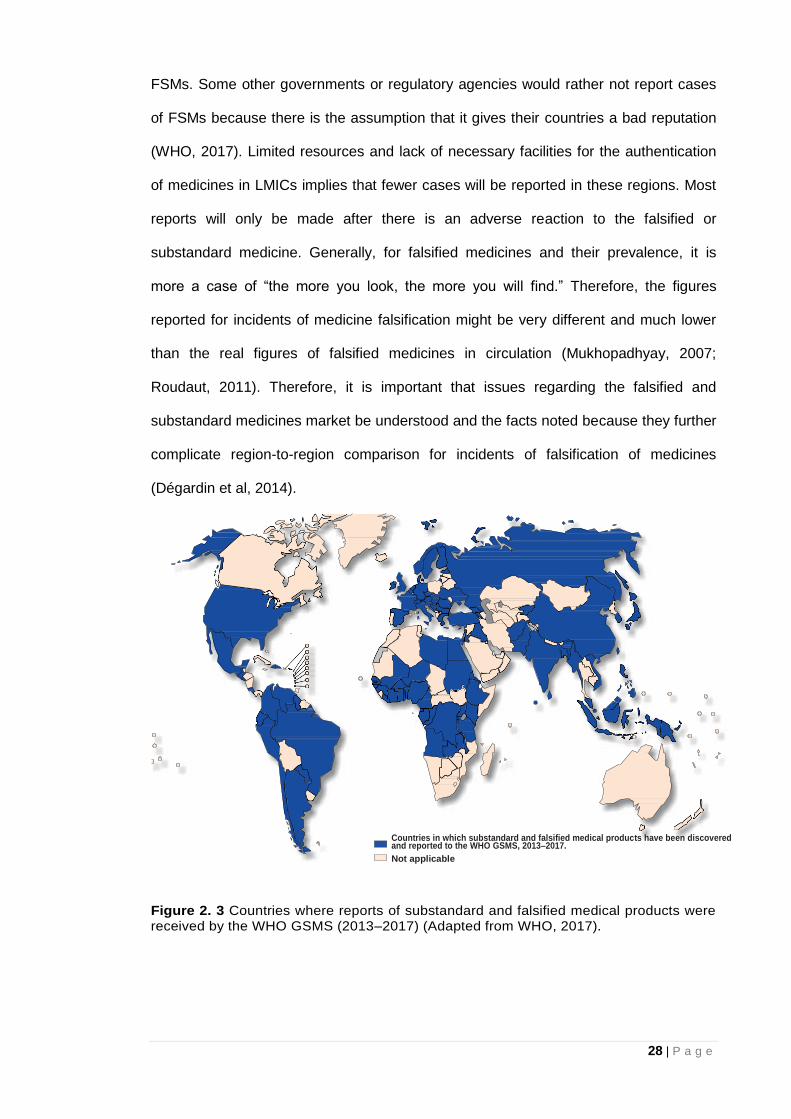
28 | P a g e
FSMs. Some other governments or regulatory agencies would rather not report cases
of FSMs because there is the assumption that it gives their countries a bad reputation
(WHO, 2017). Limited resources and lack of necessary facilities for the authentication
of medicines in LMICs implies that fewer cases will be reported in these regions. Most
reports will only be made after there is an adverse reaction to the falsified or
substandard medicine. Generally, for falsified medicines and their prevalence, it is
more a case of “the more you look, the more you will find.” Therefore, the figures
reported for incidents of medicine falsification might be very different and much lower
than the real figures of falsified medicines in circulation (Mukhopadhyay, 2007;
Roudaut, 2011). Therefore, it is important that issues regarding the falsified and
substandard medicines market be understood and the facts noted because they further
complicate region-to-region comparison for incidents of falsification of medicines
(Dégardin et al, 2014).
Figure 2. 3 Countries where reports of substandard and falsified medical products were received by the WHO GSMS (2013–2017) (Adapted from WHO, 2017).
Countries in which substandard and falsified medical products have been discovered and reported to the WHO GSMS, 2013–2017.
Not applicable
29 | P a g e
Current estimations of the falsified medicines problem are nevertheless disturbing and
it is clearly a worldwide problem (Sammons and Choonara, 2017; WHO, 2017).
Incidents of medicine falsification reported to the WHO from around the world (Fig 2.3)
further accentuates the global nature of this public heath challenge. It is also important
to note that, as with the PSI data, unshaded countries in Fig 2.3 do not necessarily
imply that no FSMs exist in those countries but rather that no reports of FSMs were
made within the duration for which the WHO compiled the data. As mentioned earlier,
the number of reports of FSMs is dependent on who is looking out for the products,
whether they have the appropriate facilities to spot the FSMs, whether they understand
how to report incidents of FSMs, and whether those reports are documented and
forwarded to the appropriate regulatory body (WHO, 2017). Some reported cases of
falsified and substandard medicines are outlined below:
United States of America- In 2018 (Los Angeles), thousands of misbranded and
falsified medicines including Viagra and Diprospan (an injectable anti-
inflammatory medicine) were found to have been sold to the public via
unlicensed vendors. Among these vendors, selling falsified medicines was a
storefront supposedly selling candy and piñatas (Macias Jr, 2018).
United Kingdom- In 2017, antimalarial medicines (Artemether-Lumefantrine)
used to treat four patients who had visited Africa did not work suggesting
resistance of the parasite to the medication or falsification of the medicines
administered (Gallagher, 2017).
Niger- In 2017, a batch of falsified meningitis vaccine was discovered before it
reached the market. Packaging was different from original and the Brazilian
manufacturer indicated on the pack does not manufacture the vaccine in
question (Anderson, 2017).
30 | P a g e
Malawi - In 2016, tablets containing a mixture of paracetamol and co-
trimoxazole were repackaged and labelled as a brand of the antimalarial
medicine sufadoxine/pyrimethamine for resale (Khuluza et al, 2016).
Democratic Republic of Congo- In 2014, over 1000 people were admitted to
clinics with symptoms of meningitis neck stiffness. Investigations revealed
patients had taken tablets thought to be diazepam but actually contained
haloperidol (an antipsychotic medicine) which can cause involuntary action in
the arms, neck and face (Baggaley, 2017).
Republic of Tanzania- In 2013, Halfan tablets expected to contain halofantrine
hydrochloride was confirmed to contain no API (Höllein et al, 2016).
United States of America- In 2012, falsified Avastin for cancer lacking active
ingredient affected 19 medical practices in the USA (WHO, 2012).
Pakistan- In 2012, over 200 patients died and about 1000 hospitalised after
taking medicine used to prevent angina attacks (Isotab- containing isosorbide
mononitrate 20mg) which also contained toxic amounts of the antimalarial API
pyrimethamine (Arie, 2012; WHO, 2017).
The reported cases of FSMs above are a pointer to the global dimension of FSMs
challenge and that medicine falsifiers can target any medicine. A proper understanding
of the marketing and distribution of medicines worldwide will provide more information
about the loop holes within the system that allows medicine falsifiers carry out their
activities unnoticed. Section 2.1.4 provides more detail about the falsified and
substandard medicines market globally.
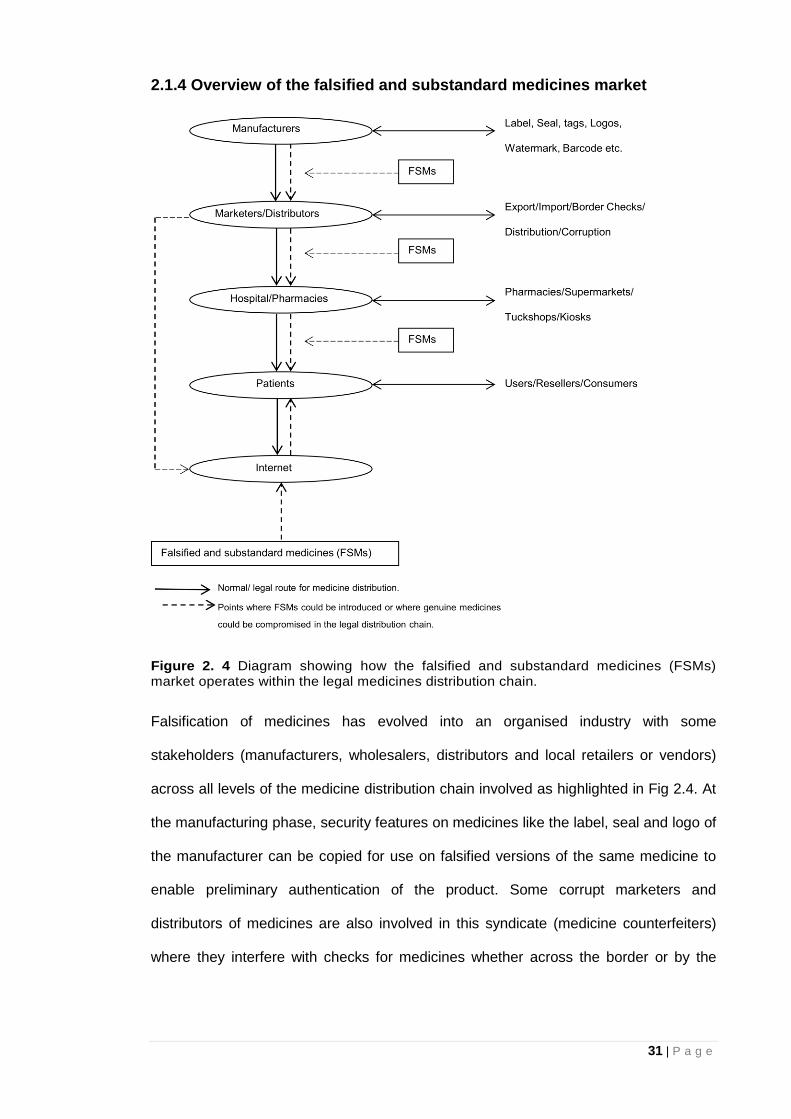
31 | P a g e
2.1.4 Overview of the falsified and substandard medicines market
Figure 2. 4 Diagram showing how the falsified and substandard medicines (FSMs) market operates within the legal medicines distribution chain.
Falsification of medicines has evolved into an organised industry with some
stakeholders (manufacturers, wholesalers, distributors and local retailers or vendors)
across all levels of the medicine distribution chain involved as highlighted in Fig 2.4. At
the manufacturing phase, security features on medicines like the label, seal and logo of
the manufacturer can be copied for use on falsified versions of the same medicine to
enable preliminary authentication of the product. Some corrupt marketers and
distributors of medicines are also involved in this syndicate (medicine counterfeiters)
where they interfere with checks for medicines whether across the border or by the
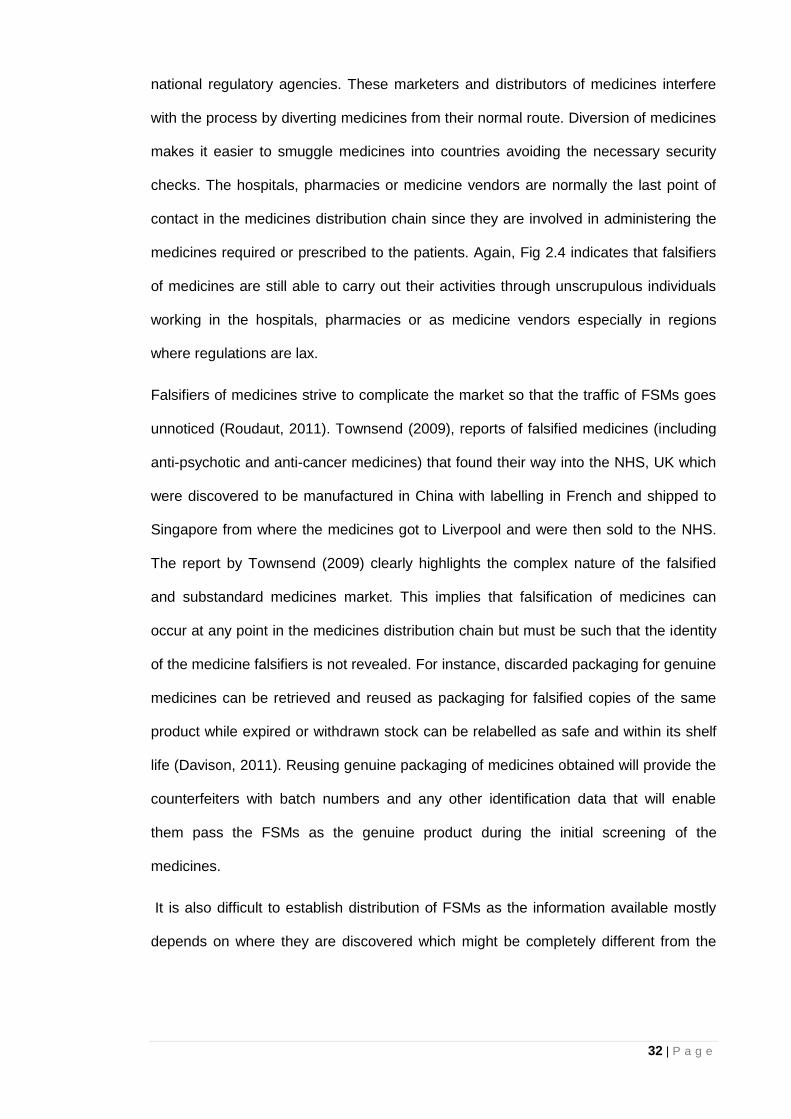
32 | P a g e
national regulatory agencies. These marketers and distributors of medicines interfere
with the process by diverting medicines from their normal route. Diversion of medicines
makes it easier to smuggle medicines into countries avoiding the necessary security
checks. The hospitals, pharmacies or medicine vendors are normally the last point of
contact in the medicines distribution chain since they are involved in administering the
medicines required or prescribed to the patients. Again, Fig 2.4 indicates that falsifiers
of medicines are still able to carry out their activities through unscrupulous individuals
working in the hospitals, pharmacies or as medicine vendors especially in regions
where regulations are lax.
Falsifiers of medicines strive to complicate the market so that the traffic of FSMs goes
unnoticed (Roudaut, 2011). Townsend (2009), reports of falsified medicines (including
anti-psychotic and anti-cancer medicines) that found their way into the NHS, UK which
were discovered to be manufactured in China with labelling in French and shipped to
Singapore from where the medicines got to Liverpool and were then sold to the NHS.
The report by Townsend (2009) clearly highlights the complex nature of the falsified
and substandard medicines market. This implies that falsification of medicines can
occur at any point in the medicines distribution chain but must be such that the identity
of the medicine falsifiers is not revealed. For instance, discarded packaging for genuine
medicines can be retrieved and reused as packaging for falsified copies of the same
product while expired or withdrawn stock can be relabelled as safe and within its shelf
life (Davison, 2011). Reusing genuine packaging of medicines obtained will provide the
counterfeiters with batch numbers and any other identification data that will enable
them pass the FSMs as the genuine product during the initial screening of the
medicines.
It is also difficult to establish distribution of FSMs as the information available mostly
depends on where they are discovered which might be completely different from the
33 | P a g e
original point of manufacture. There is also the issue of underreporting by WHO
member states (as mentioned earlier) and the lack of supplementary data for incidents
of falsified and substandard medicines from other organisations.
With increasing awareness about the threat to public health posed by FSMs, it is
expected that there will be more reports and more WHO member states will be
involved in the fight against FSMs but currently, it is not certain if this is the case.
Figure 2.5 gives a picture of the global distribution of FSMs across the medicine
distribution chain based on reports available at the time.
Figure 2. 5 Global distribution of medicine falsification- from production to point of sale (Adapted from Dégardin et al, 2014).
Manufacturing of FSMs seems to be concentrated in Asia and particularly in India and
China as illustrated in Fig 2.5 (Chika et al, 2011; Dégardin et al, 2014). This can be
attributed to the abundant and cheap workforce in the region. Some parts of Latin
America are also involved in the manufacture of FSMs (Roudaut, 2011). The Middle
East (United Arab Emirates) has been identified as a major transit point for the
distribution of medicines and therefore FSMs as indicated in Fig 2.5. This allows for the
manufacturers of falsified medicines to conceal their identity and the true origin of the
product. It is not clear why the United Arab Emirates is highlighted as a major transit
34 | P a g e
point for FSMs but the free trade zones and trade regulations in the region that allow
movement of such falsified medicines among other products might be the reason for
using that route as a transit point by falsifiers of medicines. On the other hand, sale of
falsified medicines is huge in Africa and South-East Asia and also high in Latin America
(Almuzaini et al, 2013) (Figure 2.5). Most medicines in LMICs in regions like Africa and
Latin America are imported thereby exposing these regions to the falsifiers of
medicines. Developed countries like the UK where medicines are imported are also at
risk.
With reference to Fig 4.2, specific issues regarding surveillance of medicines in the
LMICs include lack of security across the medicines distribution chain and poor storage
conditions. There are not enough facilities to carry out routine checks at borders and
specialists with proper understanding of security features on medicines are also
lacking. Furthermore, most medicines are to be stored below 25°C but the average
temperature in most LMICs (in the tropics) is well above 25°C which could lead to
degradation of the medicines. As a result, medicine storage will be a challenge these
countries especially where facilities are not readily available.
In many LMICs, medicine falsifiers take advantage of the fact that medicines can be
sold in street markets. In some cases, medicines sold in these street markets are not
stored under appropriate conditions and medicines are taken out of the original
packaging before selling to the patients. For instance, tablet medicines in blister packs
can be taken out of the secondary packaging and sold in plastic zip lock bags so
patients who are not able to buy the full pack of the medicine can have access to the
smaller amounts of the medicine they can afford. Removal of medicines from
packaging leaves the patient with little or no documentation and no information leaflet
accompanying the medicine which in turn provides a conducive environment for the
proliferation of FSMs. Falsifiers of medicines are able to take advantage of situations
35 | P a g e
like this to introduce falsified medicines into the system (Wall, 2016). Medicine falsifiers
also target the mainstream distribution chain of medicines even in industrialised
countries though the approach might be different, more subtle and sophisticated since
the market is highly regulated in these countries.
Manufacturers of FSMs medicines might opt for sale of these medicines on the internet
using websites that do not clearly provide the contact details of the seller (Orizio et al,
2009). The patient therefore stands a huge risk of buying falsified medicines on the
internet. The anonymity of these websites make it more difficult to identify the
perpetuators of the crime since it is difficult to track their exact location. A study
considering the hidden parts of the internet suggests that about 12% of the illegal
products sold online are pharmaceutical products (Megget, 2016). These websites
provide unregulated access to prescription medications as well as supplements.
Reports suggest around 50% of the pharmaceutical products available online could be
falsified (Dégardin et al, 2014; Lavorgna, 2015; Lee et al, 2017). In the United States of
America, the number of individuals buying medicines off the internet has grown by
400% in the last decade bringing with it an increased exposure to FSMs. The survey
also suggests that in the USA alone, between 19 and 26 million people buy medicines
online and this figure is on the rise (WHO, 2017). Buying medicines over the internet is
becoming increasingly popular in LMICs too. An in-depth understanding of the different
factors that allow falsifiers of medicines to perpetuate the crime is crucial in order to
address the problem.
2.1.5 Falsified and substandard medicines: the causes
Falsification of medicines is a lucrative business and largely risk-free for the falsifiers of
medicines since they operate within the legal medicine distribution network unlike with
those involved in the distribution of drugs of abuse/ controlled substances. It is
therefore more difficult to identify falsifiers of medicine than traffickers of illicit
36 | P a g e
medicines (Dégardin et al, 2014). Reports from the international police organisation
(INTERPOL) suggests that organised criminal networks formerly involved in the illicit
drugs market now target legal medicines because of the high profits, low risks of
detection and prosecution and the fact that the penalties when prosecuted for falsifying
medicines are much less severe than those incurred for trafficking illicit drugs
(Dégardin et al, 2014).
There are a number of reasons for the boom of the falsified medicine market; foremost
among which is the deficiencies in legislation and enforcement. Deficiencies in
legislation and enforcement would range from poor ethical practices to greed and
corruption at all levels of the medicine distribution chain. Countries where regulation
and enforcement is limited and weak are therefore possible breeding grounds for
medicine falsifiers (Dégardin et al, 2014). Furthermore, the absence of an international
legal framework has not helped in addressing the FSMs problem (Martino et al, 2010;
Rebiere et al, 2017). Corruption is widespread in many LMICs with medicines being
frequently diverted and pilfered at different levels of the medicines distribution chain.
The approval of questionable medicines is secured with bribes at profitable prices
(Berman and Swani, 2010; Mori et al, 2018). Although corruption is rampant in LMICs,
it is important to note that it also exists in developed countries. There have been calls
for doctors in the UK to declare their earnings with reports of a significant increase in
the cash and hospitality given to doctors by pharmaceutical companies and the refusal
by a third of the doctors to declare their earnings making it suspicious (Bodkin, 2017).
Other reports in the USA suggest opioid manufacturing pharmaceutical companies
offered more money to doctors who wrote the most opioid prescriptions; almost
implying that the doctors were being bribed to help the sale of their medicines (Kessler
et al, 2018). The aforementioned cases in the UK and USA might not necessarily
37 | P a g e
confirm clear cases of corruption in the countries but are pointers to the fact that these
developed nations are not immune to corruption.
Limited access to affordable, safe and effective medicines and poor technical
capacity/tools for ensuring good manufacturing practices, quality control and
distribution of medicines are some other factors that would allow FSM manufacturers to
thrive in a region. Some medicines are prime targets for falsifiers because of the value
attached to the products and their corresponding high prices. The selected targets are
either high added-value medicines such as cancer and antiretroviral medicines aimed
at narrow markets (smaller/specific population) or cheaper medicines such as pain
killers and antimalarial medicines aimed at broader markets (wider population) (Reggi,
2007; Degardin et al, 2014). In other words, high cost or high demand medicines are
the most targeted by falsifiers of medicines. This makes them even more profitable for
the falsifiers of those medicines whose production costs is nothing compared to that of
the legal manufacturers, with nothing spent on research and development or licensing
(Reggi, 2007; WHO, 2017). Even if the falsifiers of medicine use the right ingredients,
their quality standards will be much lower. For most medicines, the APIs account for
bulk of the production costs. For generic medicines, APIs generally make up four-fifth
of the production cost. Use of lower amounts of the API(s) by medicine falsifiers will
therefore help to maximise their profit while using just enough API for the medicines to
pass initial screening tests for the presence of the expected API (Reynolds and Mckee,
2010; WHO, 2017).
The high costs of some prescription medicines means they might not be affordable for
LMICs unless they are able to access donated medicines. Patients (with no insurance
or in countries where cost of medication is borne by the people) are forced to seek out
cheaper alternatives because of the high costs of genuine medicines, which are often
burdened by import duty. This in turn encourages street-market (in LMICs) or internet
38 | P a g e
distribution and the spread of non-regulated outlet production of falsified medicines
(Wertheimer and Norris, 2009). Cost pressures also have an implication on the
production and supply chain for medicines. In a bid to cut costs and maximise profit,
some manufacturers of medicines go for cheaper alternatives to the actual APIs and
excipients used in the genuine medicine. As a result, the quality of medicines reaching
the patient might be compromised.
Availability or access to medicines is becoming more of a problem in the developed
countries and patients can be affected by the high cost of medicines especially if they
have to pay for them. Moon (2017), reports that the outrage over the high cost of
medicines was identified as one of the very few issues bringing voters together during
the 2016 elections in the United States of America (USA). The trade-off of affordability
versus quality of medicines by the patient is largely based on necessity and not on
choice because people would generally purchase the best medicines they can afford.
Some FSMs are also sold for the same price as the genuine medicine from the legal
manufacturer to avoid suspicions as to their origin (Shepherd, 2010). Consequently,
the cost of medicines does not guarantee authenticity because both cheap and
expensive copies of genuine medicines abound in the market.
When the demand for medicines exceeds the supply, it creates an opportunity for
medicine falsifiers to provide products to address the deficit. There are several
situations where demand could exceed supply such as when there is outbreak of
disease, war/conflict, economic crisis and natural disasters. Access to medicines is
limited as demand increases in these situations providing a conducive environment for
falsifiers of medicines to thrive. An example that readily comes to mind is recent plans
by the UK government to stockpile medicines just in case the UK leaves the EU with no
deal (Buchan, 2018). Stockpiling of medicines would mean increase in demand for
39 | P a g e
such medicines, which the falsifiers of medicine could readily take advantage of to
infiltrate the market.
Rapid communication systems and technological advancement have also boosted links
between medicine falsifiers at different points in the medicine distribution chain,
especially across international borders (Reynolds and Mckee, 2010). For instance,
medicine falsifiers in one country can now provide real time updates to others in
different countries about the movement of the falsified pharmaceutical products and
falsified medicines are also accessible to people in parts of the world where the
facilities are not available to produce them (LMICs). Globalisation of the financial
markets has aided illegal trade where international transactions can be made in real
time between counterfeiters of medicines and is now widespread in some countries
(Reynolds and Mckee, 2010). Industrialised countries have more control measures for
goods produced within their country than for goods to be exported to other countries.
Falsified medicines are often exported via free trade zones, with their origin concealed
or changed with fresh labels (Degardin et al, 2014). The issue is more political in some
countries where it is perceived there is lack of willingness to tackle the problems
(Roudaut, 2011). In some parts of Europe, medicines can also be sold at low prices
and then resold elsewhere at a higher price. This phenomenon, identified as
“pharmaceutical parallel trade,” leaves intermediaries/middlemen with great profit
(Orizio et al, 2009). The United Kingdom is the largest import market in Europe with
70% of the parallel trade. Falsifiers of medicine across Europe and around the world,
seeking to make more profit can also take advantage of this market by again repacking
medicines to be resold to countries like the UK where cost of medicine obtained via the
NHS are higher (Degardin et al, 2014).
Just as parallel trade is considered Europe’s problem, America’s main problem is
reimportation. This means that medicines that were previously exported to other
40 | P a g e
countries are brought back to America. This practice allows for the importation of
medicines that the regulatory authorities can hardly control (Palumbo et al, 2007).
Producers normally sell the medicines to wholesalers who in turn send them directly to
hospitals or pharmacies. However, between the producer and the patient, so many
intermediaries could manipulate medicines (Vanderdonck, 2007). Although the legal
medicine trade cannot be blamed for the issue of falsification of medicines, it is
important to note that its globalisation and the complications surrounding the
distribution of medicines worldwide aid the activities of medicine falsifiers (Shepherd,
2010).
2.1.6 Falsified and substandard medicines: the consequences
The proliferation of falsified and substandard medicines could have far-reaching effects
not only on the patient taking the medicine but also on the licensed manufacturers and
the government. Non-compliance with good manufacturing practices allows falsifiers of
medicine to cut production costs to maximise profit while manufacturing medicines that
could potentially cause harm to patients (Vanderdonck, 2007; Seiter, 2009). Since
falsifiers of medicine operate in an unregulated environment, manufacturing FSMs
might not require much workspace and can often be carried out in small workshops
usually by unskilled workers. Falsifiers of medicine could also use bigger
manufacturing plants for large-scale production (Dégardin et al, 2014).
2.1.6.1 Wrong level of APIs
If the FSM contains more than the stated amount of the expected API, too high doses
will usually be toxic or harmful with adverse reactions that could result in the death of
the patient. When the API is absent or present in amounts lower than expected, the
medicine does not offer any therapeutic benefit. This could lead to the deterioration of
the patient’s condition or could ultimately lead to death in certain disease conditions.
Again, when lower than expected amounts of API are present in FSMs, this could lead
41 | P a g e
to drug resistance, which will weaken the patient’s response to future medication
(Newton et al, 2010; Kelesidis and Falagas, 2015). A typical example is the case in the
UK, mentioned in 2.1.3 where patients being treated for malaria did not respond to the
antimalarial medicine (Artemether-Lumefantrine) administered (Gallagher, 2017). The
reason for the patients’ non-response to the antimalarial medicine is not yet known but
could be as a result of absence of the API or a case of resistance to the medicine. The
adverse effects of FSMs can be fatal if other APIs not declared on the packaging are
present (Vanderdonck, 2007).
2.1.6.2 Lack of patient information
Some FSMs are sold without patient-information leaflets making it easy for patients to
self-medicate or abuse the medicines. Self-medication with FSMs could be very
dangerous especially when the falsified medicines within a pack contain varying
amounts of the expected API. No therapeutic benefit observed after taking medicine
with lower than expected API might lead to increasing the dosage. However, increasing
dosage with medicine from the same pack, which contains higher amounts of API than
the one previously administered, might result in toxicity due to higher than expected
levels of API in the patient (Degardin et al, 2014).
No one will want to continue taking a particular medicine if it does not work or has
adverse effects. This could lead to fear and lack of trust in the medical system which
goes beyond fear of the medicine itself to lack of trust in those involved in the
prescription of such medications like the doctors, pharmacists and nurses (Martino et
al, 2010; Davison, 2011; Degardin et al, 2014).
2.1.6.3 Economic consequences
Although the health repercussions on the consumer are the most important, the
economic impact of falsification of medicines must not be ignored. The European Union
42 | P a g e
Intellectual Property Office (EUIPO) reports that FSMs cost the European Union
pharmaceutical sector about 10.2 billion every year with about 37,700 jobs lost
(EUIPO, 2016). Previous reports from the Centre for Medicines in the Public Interest
estimated the worldwide trade of FSMs to be worth around $75 billion by 2010,
exceeding the illicit drug market, valued to be $50 billion at the time (Vanderdonck,
2007). Falsification of medicines engenders costs for society as a whole, especially in
the developing world where the resources are not readily available (Seiter, 2009; Mori
et al, 2018).
Economic losses due to FSMs affect not only the pharmaceutical industry and the
government but also the patients who suffer losses in income if cost of medicine is
borne by them. The patient taking these FSMs also loses the money spent in purchase
costs since the medicines do not work and further help or medical advice is required.
Falsifiers of medicines tarnish the image of the licensed pharmaceutical industries, and
so, there is the constant burden of protecting their products against the falsifiers (Jack,
2007; Berman and Swani, 2010). This burden is in turn transferred to the patients
buying these medicines as prices are hiked so as to account for the extra costs
involved in the production and protection of the product. Generally, healthcare systems
are also affected since there is an increase in social and healthcare costs even in
countries with health insurance cover. Recent reports by the UK National Health
Service (NHS) suggest that prescribing common painkillers like paracetamol costs
about four times the cost of the same medicines over the counter (NHS News, 2017).
This has led to on-going deliberations about removing such medicines that can be
purchased over-the-counter, at a lower cost, off the NHS prescription list. This would
save money and free up more funds for frontline care in the NHS. This will in turn
transfer the cost of the medicines to the patients and could expose them to falsified
medicines especially over the internet where there are fewer restrictions. With the
43 | P a g e
steady rise in the number of medicine counterfeiting cases, specialists have even
warned of a macroeconomic pandemic (downturn in the economies of many nations) if
effective measures are not taken (Dégardin et al, 2014). According to Wertheimer and
Norris (2009) and Van Baelen et al (2017), the health and economic challenges due to
falsification of medicines would be so disastrous that the resources in the health sector
would be completely overwhelmed if nothing were done to curb the situation.
2.1.7 Tackling the challenges posed by falsified and substandard medicines
The WHO Programme for International Drug Monitoring (WHO PIDM) refers to “the
science and activities relating to the detection, assessment, understanding and
prevention of adverse effects or any other drug-related problem” as
Pharmacovigilance- PV (WHO PIDM, 2016). Considering the public health risk
associated with falsified medicines, it is important that response to this phenomenon be
rapid and globalised in order to get them out of the market and the global supply chain
within the shortest possible time (Dégardin et al, 2014). To achieve this, the National
agencies involved in the regulation and control of medicines need to work towards
developing easier methods for detection of FSMs especially on the field- hence the
need for this research. Various information dissemination systems should create
awareness about FSMs among all stakeholders (from manufacturers to patients)
involved in the pharmaceutical market. Television, radio, newspaper adverts and even
social media platforms could provide accurate information on the risks of FSMs and
even more information on how to detect them, how to avoid them and how to report
suspect cases of medicine falsification. Consumers should learn what features to look
out for when purchasing medicines and the dangers of purchasing medicines from
informal markets. While education and awareness is crucial in the fight against falsified
medicines, the amount of information available to the public should be just enough for
44 | P a g e
basic first-line screening or visual inspection of medicines in order not to provide
falsifiers of medicines with enough information to circumvent the system.
Davison (2011) and Dégardin et al (2014), propose multi-layered protection as an
effective approach towards safeguarding medicines since they will be more expensive
and hence, difficult for counterfeiters to replicate. This will involve simple and easily
detectable features, such as the shape, embossing (raised features), or debossing
(sunken/lowered features) on the medicine or labels, logos, barcodes and seals on its
packaging.
The more overt security features on the medicine and the packaging can be
supplemented with other covert features known to a select few involved in the
regulatory process (Fig. 2.6). Figure 2.6 illustrates the “authentication pyramid” with the
vertical dimension indicating the number of individuals participating at various security
levels in the authentication of medicines. From the base of the pyramid to the apex, a
gradation of simple to more complicated authentication techniques/methods are
employed. Consequently, the number of individuals involved in the authentication
process decreases going up the pyramid from the base where the general public are
involved in simple visual inspection tests to the apex where one or two highly skilled
individuals are involved in more complex authentication forensic investigation.
It is also evident from the authentication pyramid that pharmacovigilance is improved
when consumers and those closest to them in the medicines distribution chain (such as
pharmacists) are provided with simple tools or information for spotting falsified and
substandard medicines.
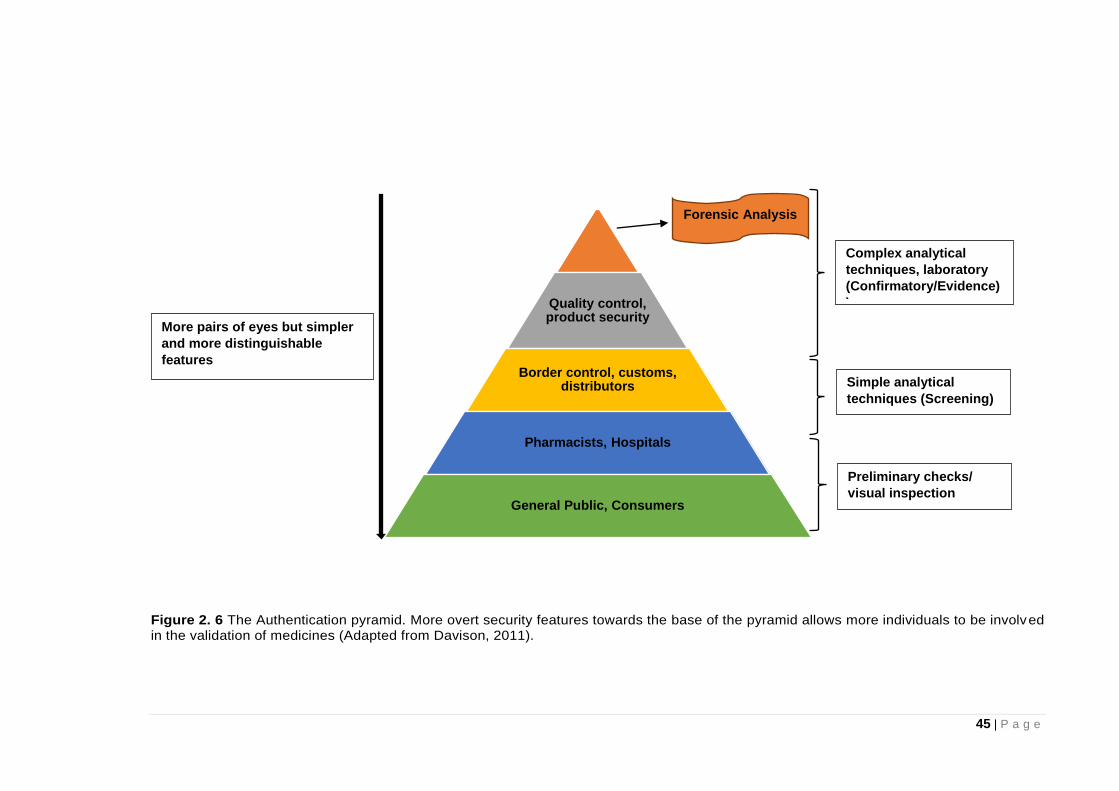
45 | P a g e
Figure 2. 6 The Authentication pyramid. More overt security features towards the base of the pyramid allows more individuals to be involved in the validation of medicines (Adapted from Davison, 2011).
Quality control, product security
Border control, customs, distributors
Pharmacists, Hospitals
General Public, Consumers
Forensic Analysis
Preliminary checks/
visual inspection
Simple analytical
techniques (Screening)
Complex analytical
techniques, laboratory
(Confirmatory/Evidence)
)
More pairs of eyes but simpler
and more distinguishable
features
46 | P a g e
Consumers will therefore be more alert with more information about the medicine being
administered to them. On the other hand, there is the conflicting factor that wider
dissemination of security features on products will also make them more vulnerable to
falsifiers as highlighted earlier. Therefore, a combination of techniques and security
features is necessary to provide individuals at all levels of the pyramid with various
ways of medicine authentication.
Collaboration between government agencies is necessary for effective results since the
distribution channels for these medicines are very complicated. International
cooperation between National regulatory agencies will also help in effective border
control and monitoring which will in turn help in curbing the menace caused by falsified
and substandard medicines. To this effect, the WHO launched the Global Surveillance
and Monitoring System (WHO GSMS) in 2013 with the number of participating
countries currently put at 113 (WHO, 2016). The WHO GSMS was supposed to help in
linking information on incidents of medicine counterfeiting between countries as well as
provide more data to enable a better understanding of the extent of the problem
worldwide. Collaboration between countries could also facilitate prompt arrest and
prosecution of the counterfeiters of medicine. An example of collaboration between
countries or regional collaboration is the European Union (EU) medicines verification
system (EMVS) expected to take effect by February 2019, which will facilitate
verification of medicines throughout the medicines distribution chain in the region until
the time the medicine is dispensed to the patient (EU, 2016).
As is the case with drugs of abuse, legislation with stiff penalties for counterfeiters of
medicines should be enforced by the National regulatory agencies to serve as a
deterrent to others. Considering the number of individuals exposed to falsified and
substandard medicines, it can be argued that counterfeiters of medicines should face
even stiffer penalties than those involved in drugs of abuse because the drugs of abuse
47 | P a g e
market is smaller with fewer individuals exposed to these addictive substances. The
FSMs market is much bigger because it affects both therapeutic and lifestyle medicines
with anyone around the world being susceptible to these medicines. In addition, most
individuals at the receiving end (consumers) in the drugs of abuse/ legal highs market
are in it as a matter of choice even though the substances are addictive. Consumers of
FSMs on the other hand do not have a choice because it is the intent of the
counterfeiter to deceive the consumers of such medicines being well aware that no one
will take medicine knowing it is not what it says on the box.
Efforts towards reducing the cost of production and by extension the burden transferred
to the consumer in terms of the cost of the medicines should be further explored.
Import duty on medicines could be subsidised by individual countries. This will help in
reducing the costs of medicines and making them more affordable.
Finally, further development of suitable analytical methods for the detection of
counterfeit medicines within the quickest time possible and closest to the final
consumers of the medicines (where most counterfeiting would most likely occur) will go
a long way in addressing this problem. This is because public safety with reference to
FSMs is dependent on how fast the suspect medicines are detected and taken off the
market. It is in this regard that this research considers more effective, efficient and
robust methods for the authentication of FSMs both in-field and in laboratories and also
in different regions of the globe. Referring back to the authentication pyramid (Fig 2.6),
we established that at different levels of the medicine distribution chain, the analytical
method required for screening of medicines are different. The analytical method of
choice for screening medicines will be dependent on a number of factors such as the
amount and type of information needed ranging from a quick “YES” or “NO” check to
comprehensive forensic analysis. Analytical methods for screening FSMs will be the
focus in the next section.
48 | P a g e
2.2 Analytical methods for screening falsified and substandard medicines
The fight against the falsification of medicines has led to the investigation of several
analytical methods for the detection of FSMs, which include both spectrometric and
separation techniques as discussed in detail in successive subsections (Deisingh,
2005; Martino et al, 2010; Anzanello et al, 2014; Dégardin et al, 2014). As falsifiers of
medicines get more sophisticated in the act, the pharmaceutical industries and
agencies have to keep improving their analytical methods with more reliable and up-to-
date techniques in order to detect their activities (Deconinck et al, 2013; Dégardin et al,
2014).
Recently, research by Armitage (2018), applied a collection of techniques in the
assessment of cardiovascular tablet medicines. Rebiere et al (2017), identifies
sampling of suspect medicines as a vital step because it should give information of a
representative portion of the test sample analysed. Information obtained from physical
and chemical study of medicines could provide a better understanding of medicine
counterfeiting at different levels. Marini (2010) and Dégardin et al (2014) suggest that
to initiate prompt action of pharmaceutical companies and other relevant regulatory
authorities involved in curbing medicine falsification, analytical methods for
authentication of medicines must first be able to identify or distinguish genuine and
counterfeit pharmaceutical products. The analytical method for authentication must
also be able to do so as fast as possible as mentioned earlier in 2.1.7.
2.2.1 Preliminary Screening for falsified and substandard medicines
The screening process for falsified and substandard medicines begins with visual
inspection of the medicines. A detailed study of the label, package and content of the
suspected medicine yields data that are then compared with that of the genuine
product. Visual inspection of packaging items, like boxes, leaflet inserts, blister packs,
49 | P a g e
and vials, entails the study of features like holograms, logos, taggants and printing
(Deisingh, 2005; Rodomonte et al, 2010; Shah et al, 2010; Ortiz et al, 2012). Electronic
tracking systems using Radio Frequency Identification (RFID) or the Global Positioning
System (GPS) can be used to track genuine medicines and isolate counterfeit
medicines (Catarinucci et al, 2012). The RFID is based on a two-way radio
communication system between an RFID tag on an item being tracked and a receiver
within range of the tracked item. They can be employed for spot checks by the police or
border control agencies but the short range of the signal implies they can only be used
for screening medicines in-field and not for remote tracking (Davison, 2011). On the
other hand, the GPS tracking system is similar to the satellite navigation systems used
in cars and phones where satellite signals received by small devices hidden in the
cargo, truck or the medicine boxes are transmitted to a control centre via cellular phone
networks. The information received by the GPS system is used to ascertain the
position or location of the item being tracked in real time. Real-time monitoring of the
movement of medicines will help provide alerts to regulatory agencies when there is a
deviation or unplanned stop while medicines are transported along the expected route
of the medicines distribution chain. Although GPS can function remotely, it is also
dependent on the strength of the satellite signal, which can be interrupted if the signal
is impeded along its path. In criminal cases, the system could be jammed so the control
centre is not able to receive positional information. Tracking systems are more suited
for monitoring bulk items in transit due to the high cost of production of tracking
devices. It is therefore important to consider screening methods for small quantities of
medicines, within the medicines distribution chain from manufacturer to consumer
(Davison, 2011).
Physical characteristics of the medicine dosage form, like their colour, weight or shape,
can be evaluated and compared with reference samples of the medicine though this is
50 | P a g e
not always possible. Nevertheless, physical inspection is not sufficient to identify
counterfeit and authentic medicines due to increased sophistication by the
counterfeiters who use technologically advanced equipment to produce almost identical
copies of genuine medicines (Rodomonte et al, 2010; WHO, 2017). Simple tests,
consisting for instance in disintegration tests (Martino et al, 2010; Kaale et al, 2016)
and simple density or viscosity measurements (Dégardin et al, 2014) are cheap and
quick methods that sometimes prove very effective for the initial screening of
medicines. Furthermore, with advancement in technology and mobile connectivity,
unique mobile phone apps are now available for the authentication of medicines by
scanning the medicines or packaging for particular security features, in order to
distinguish between genuine and falsified medicines (Steinhubl et al, 2015; Yu et al,
2016).
Apart from the various visual inspection methods for screening FSMs, other simple
analytical techniques have been employed. Table 2.2 highlights techniques like
colorimetry (Green et al, 2000; Rodomonte et al, 2010; Chikowe et al, 2015), and in
recent times, the Global Pharma Health Fund (GPHF) MinilabTM (Petersen et al, 2017).
The GPHF MinilabTM combines thin layer chromatography (TLC) and colorimetric tests
which has been proven a useful low cost semi quantitative analytical method for an in-
field detection of counterfeit medicines. Due to the ease of use and the inexpensive
test kits, the GPHF has been the technique of choice for screening falsified and
substandard medicines in LMICs (Kovacs et al, 2014; Petersen et al, 2017). However,
Kovacs et al (2014), suggests that the GPHF-Minilab is only able to identify grossly
substandard medicines containing less than 80% of the expected API. Several studies
have considered more economical, rapid and efficient methods of screening counterfeit
medicines for use most especially in LMICs and also at the point of care (Hoellein and
Holzgrabe, 2014; Koesdjojo et al, 2014; Yemoa et al, 2017). The paper device or paper
51 | P a g e
chromatography cards for detecting antimalarial medicines (Koesdjojo et al, 2014), the
counterfeit detection device (CD-3) by the FDA (Ranieri et al, 2014; Platek et al, 2016)
and PharmaCheck (Amifar, 2016) are some of the portable devices developed recently
for on-site monitoring of FSMs. However, even though these simple tests based on the
physical or chemical properties of the medicine enable quick preliminary assessment of
medicines and are inexpensive (with prices ranging from about £1 per test with paper
test cards to £4000 per unit of the GPHF- Minilab), they are mostly qualitative (Kovacs
et al, 2014). In addition, they often suffer from a lack of specificity and do not provide
much information about either the identity or the amount of the API in the medicines
(Martino et al, 2010; Deconinck et al, 2013; Venhuis et al, 2014). Simple analytical
methods that are more robust providing both qualitative and quantitative forensic
information would therefore be valuable for efficient first line screening of medicines.
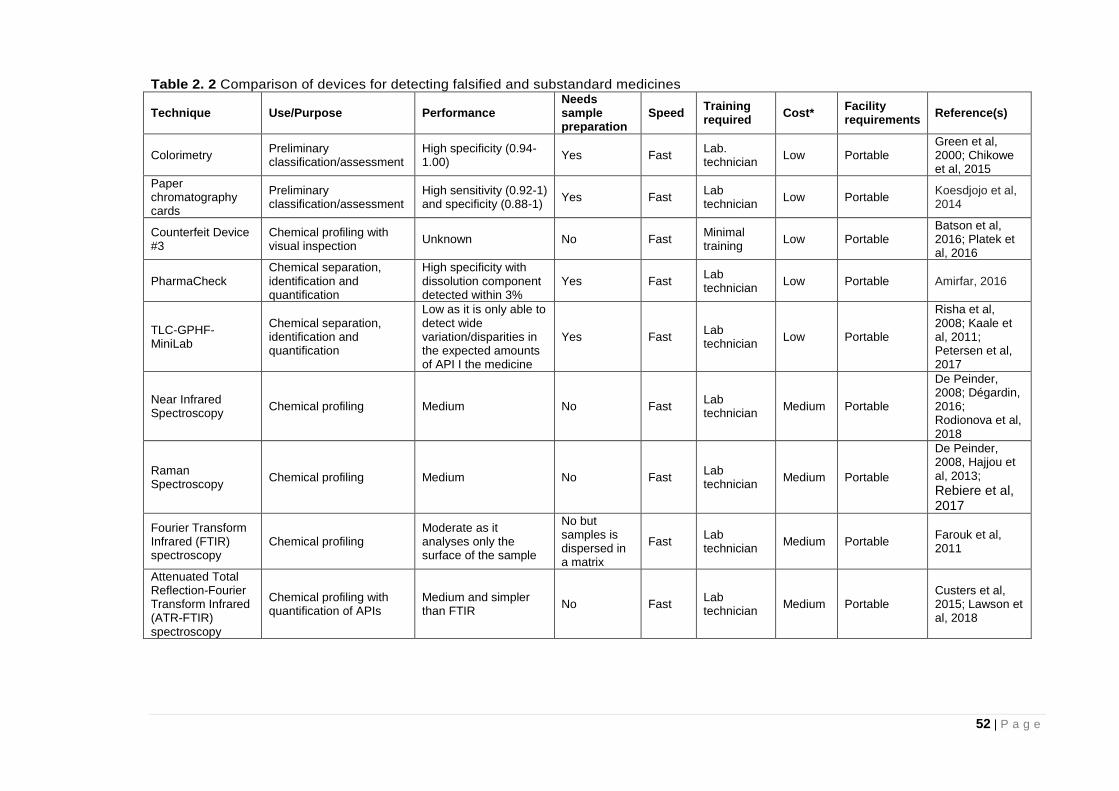
52 | P a g e
Table 2. 2 Comparison of devices for detecting falsified and substandard medicines
Technique Use/Purpose Performance Needs sample preparation
Speed Training required
Cost* Facility requirements
Reference(s)
Colorimetry Preliminary classification/assessment
High specificity (0.94-1.00)
Yes Fast Lab. technician
Low Portable Green et al, 2000; Chikowe et al, 2015
Paper chromatography cards
Preliminary classification/assessment
High sensitivity (0.92-1) and specificity (0.88-1)
Yes Fast Lab technician
Low Portable Koesdjojo et al, 2014
Counterfeit Device #3
Chemical profiling with visual inspection
Unknown No Fast Minimal training
Low Portable Batson et al, 2016; Platek et al, 2016
PharmaCheck Chemical separation, identification and quantification
High specificity with dissolution component detected within 3%
Yes Fast Lab technician
Low Portable Amirfar, 2016
TLC-GPHF-MiniLab
Chemical separation, identification and quantification
Low as it is only able to detect wide variation/disparities in the expected amounts of API I the medicine
Yes Fast Lab technician
Low Portable
Risha et al, 2008; Kaale et al, 2011; Petersen et al, 2017
Near Infrared Spectroscopy
Chemical profiling Medium No Fast Lab technician
Medium Portable
De Peinder, 2008; Dégardin, 2016; Rodionova et al, 2018
Raman Spectroscopy
Chemical profiling Medium No Fast Lab technician
Medium Portable
De Peinder, 2008, Hajjou et al, 2013;
Rebiere et al, 2017
Fourier Transform Infrared (FTIR) spectroscopy
Chemical profiling Moderate as it analyses only the surface of the sample
No but samples is dispersed in a matrix
Fast Lab technician
Medium Portable Farouk et al, 2011
Attenuated Total Reflection-Fourier Transform Infrared (ATR-FTIR) spectroscopy
Chemical profiling with quantification of APIs
Medium and simpler than FTIR
No Fast Lab technician
Medium Portable Custers et al, 2015; Lawson et al, 2018
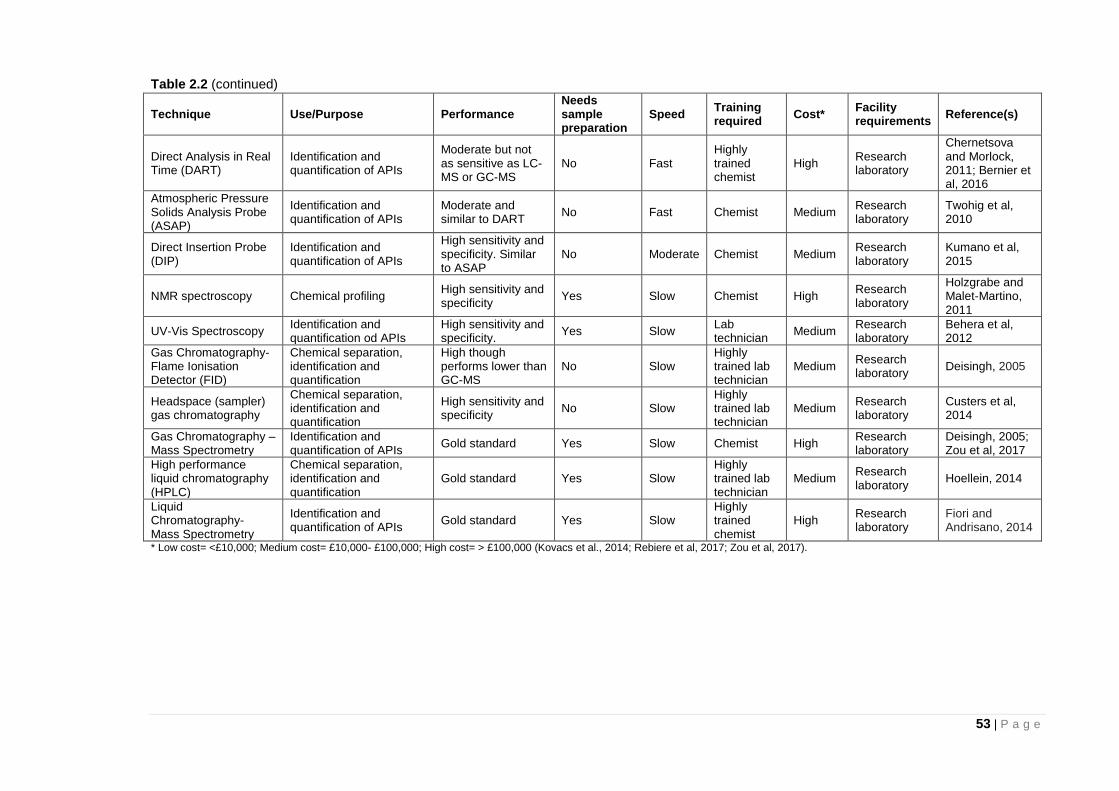
53 | P a g e
Table 2.2 (continued)
Technique Use/Purpose Performance Needs sample preparation
Speed Training required
Cost* Facility requirements
Reference(s)
Direct Analysis in Real Time (DART)
Identification and quantification of APIs
Moderate but not as sensitive as LC-MS or GC-MS
No Fast Highly trained chemist
High Research laboratory
Chernetsova and Morlock, 2011; Bernier et al, 2016
Atmospheric Pressure Solids Analysis Probe (ASAP)
Identification and quantification of APIs
Moderate and similar to DART
No Fast Chemist Medium Research laboratory
Twohig et al, 2010
Direct Insertion Probe (DIP)
Identification and quantification of APIs
High sensitivity and specificity. Similar to ASAP
No Moderate Chemist Medium Research laboratory
Kumano et al, 2015
NMR spectroscopy Chemical profiling High sensitivity and specificity
Yes Slow Chemist High Research laboratory
Holzgrabe and Malet-Martino, 2011
UV-Vis Spectroscopy Identification and quantification od APIs
High sensitivity and specificity.
Yes Slow Lab technician
Medium Research laboratory
Behera et al, 2012
Gas Chromatography- Flame Ionisation Detector (FID)
Chemical separation, identification and quantification
High though performs lower than GC-MS
No Slow Highly trained lab technician
Medium Research laboratory
Deisingh, 2005
Headspace (sampler) gas chromatography
Chemical separation, identification and quantification
High sensitivity and specificity
No Slow Highly trained lab technician
Medium Research laboratory
Custers et al, 2014
Gas Chromatography –Mass Spectrometry
Identification and quantification of APIs
Gold standard Yes Slow Chemist High Research laboratory
Deisingh, 2005; Zou et al, 2017
High performance liquid chromatography (HPLC)
Chemical separation, identification and quantification
Gold standard Yes Slow Highly trained lab technician
Medium Research laboratory
Hoellein, 2014
Liquid Chromatography- Mass Spectrometry
Identification and quantification of APIs
Gold standard Yes Slow Highly trained chemist
High Research laboratory
Fiori and Andrisano, 2014
* Low cost= <£10,000; Medium cost= £10,000- £100,000; High cost= > £100,000 (Kovacs et al., 2014; Rebiere et al, 2017; Zou et al, 2017).
54 | P a g e
2.2.2 Authentication Techniques for Falsified and Substandard Medicines
The portable technologies mentioned in 2.2.1 like the GPHF- Minilab, PharmaCheck
and paper chromatography test cards all require sample preparation before analysis
thereby increasing time of analysis. It is therefore important that techniques that
combine both speed of analysis with sensitivity and specificity be considered for the
authentication of medicines. Many analytical tools have proved effective for the
identification of counterfeit medicines (Talati, 2011; Zou et al, 2017). Appreciating the
fact that time is of essence in the detection of counterfeit medicines, there has been
increased use of vibrational spectroscopy for the analysis of suspect materials in recent
times (Custers et al, 2016; Höllein et al, 2016; Rebiere et al, 2017; Zou et al, 2017).
Spectroscopic techniques are often preferred for the assessment of falsified and
substandard medicines because they are fast and require little or no sample
preparation (Sacré et al, 2010; Kovacs et al, 2014). Although these spectroscopic
techniques are more expensive than the preliminary screening techniques mentioned
in 2.2.1 (circa £50,000), they are faster, more robust, sensitive and portable and so can
be used in the field for analysis. Mid-Infrared (MIR) more commonly known as Fourier-
Transform Infrared (FTIR) Spectroscopy (Farouk et al, 2011), Near Infrared (NIR)
(Moffat et al, 2010; Assi et al, 2011) and Raman spectroscopy (Dégardin et al, 2011)
are all individually capable of producing measurements and an interpretation of the
results within minutes. Direct observation of overlaid spectra or mathematical models
(chemometrics) can be used for the identification of suspect counterfeit medicines. A
limitation with these spectroscopic techniques is the dependence on the use of
reference libraries for the individual APIs and excipients. This implies that the reference
libraries have to be routinely updated when there are new compounds in the market
and this could limit their feasibility (Kovacs et al, 2014).
55 | P a g e
ATR-FTIR involves direct contact of the sample with the ATR crystal meaning samples
must be taken out of their packages for analysis. Raman spectroscopy is a scattering
technique whereas FTIR spectroscopy and NIR spectroscopy are both absorption
techniques (Martino et al, 2010; Zou et al, 2017). Also NIR imaging data (Puchert et al,
2010) and Raman microscopy (Kwok and Taylor, 2012) provide direct and simple
information about the genuineness of the medicine. Field-portable, hand-held
instruments, which are mostly Raman and NIR spectrometers, can be used for
screening of the authenticity of the content of the dosage form (Ricci et al, 2008; Hajjou
et al, 2013). The sensitivity of these hand-held devices has been questioned (Hajjou et
al, 2013).
These simple techniques as shown in Table 2.2 help ascertain the quality of the
pharmaceutical product, with respect to both packaging and dosage form (Martino et al,
2010; Kovacs et al, 2014). In other words, they provide initial “YES” or “NO” checks on
medicines. The case is closed if the medicine in question is confirmed to be genuine
otherwise further chemical analyses have to be performed.
2.2.3 Confirmatory Techniques for Falsified and Substandard Medicines
In the event that data for medicines based on the assessment techniques identified in
2.2.2 are inconclusive, several analytical methods can provide the chemical
composition of the sample to confirm if it is indeed falsified and not just a false positive
result. For counterfeits of pharmaceutical solid dosage forms, they can first be
identified by the measured spectra which is compared to the spectra of the reference
tablet sample during the detection/authentication step as mentioned in section 2.2.2
(Lanzarotta et al, 2011; Matousek et al, 2011). Confirmatory techniques are highly
sensitive but also quite expensive and so are more suited for national regulatory
laboratories where suspect FSMs identified in the field are taken for confirmation. As
highlighted in Table 2.2, these confirmatory techniques range from those with medium
56 | P a g e
costs (£10,000-£100,000) like direct insertion probe mass spectrometry (DIP-MS) and
Ultraviolet Visible (UV-vis) spectroscopy to those with high costs (about £100,000 and
above) like liquid chromatography and gas chromatography. Mass spectrometry (MS)
is useful for confirmatory testing of medicines by identification of APIs, excipients as
well as contaminants. Although the MS techniques are expensive, they can also be
used in tandem with other techniques. Direct Analysis in Real Time (DART) (Likar et al,
2011; Chernetsova and Morlock, 2011; Bernier et al, 2016) and Desorption
Electrospray Ionization (DESI) MS (Fernández, 2006; Culzoni et al, 2014) are ion
sources that can be used in tandem with MS techniques for the direct analysis of solid
pharmaceutical dosage forms (Culzoni et al, 2014; Bernier et al, 2016). Like DART and
DESI, direct insertion probe mass spectrometry (DIP-MS) is another important
technique that allows the direct analysis of samples without solvent extraction or
sample preparation. DIP-MS could either be by hard ionisation (electron ionisation) in a
vacuum or soft ionisation under atmospheric (ambient) conditions (also known as
atmospheric solids analysis probe mass spectrometry (ASAP- MS)). The application of
DIP-MS as a fast confirmatory technique in the screening of medicines is discussed in
detail in chapter 5.
Chromatographic techniques are also well known for confirmatory assessment of
medicines and like the other confirmatory techniques, they are expensive and much
slower than the preliminary screening and authentication techniques with analysis time
stretching to several hours per sample (Mwalwisi, 2016). Commonly used
chromatographic techniques range from the cheap and simple thin layer
chromatography –TLC used as an authentication technique (Sherma, 2007; Yemoa et
al, 2017) to the more sophisticated and expensive ones like high-performance liquid
chromatography (HPLC). The chromatographic techniques can be used to confirm or
validate the results of authentication tests like the spectroscopic techniques. Methods
57 | P a g e
like liquid and gas chromatography coupled with Mass Spectrometry (MS) (Deconinck
et al, 2012; Custers et al, 2014) might then help in the quantification of active
pharmaceutical ingredients (APIs) and provide information about possible impurities.
HPLC has been identified as the most popular instrumental technique for
pharmaceutical analysis and is noted as a gold standard for the quantitative analysis of
pharmaceutical formulation contents (Martino et al, 2010; Chikowe et al, 2015; Yemoa
et al, 2017). Ultraviolet Visible (UV-vis) spectroscopy is another solvent extraction
based confirmatory technique used mainly for the quantitative determination/ analysis
of different analytes identified in a particular medicine. Further details of the use of UV-
vis spectroscopy as a confirmatory technique in the assessment of medicines are
outlined in chapter 6.
One of the advantages of HPLC over the other techniques is that several detectors can
be coupled with it. These include ultraviolet (UV), electrochemical, photodiode array
(PDA) and MS detectors making it more versatile in its ability to detect the contents of
different pharmaceutical formulations (Cai et al, 2010; Martino et al, 2010). Nuclear
Magnetic Resonance (NMR) is also increasingly used for screening counterfeit
medicines, especially for the identification of high molecular APIs (Holzgrabe and
Malet-Martino, 2011; Barras, 2013). Chromatographic or NMR methods are necessary
to determine the composition of liquid products like protein based medicines.
The analytical data obtained using these more sophisticated confirmatory methods
could provide forensic intelligence information about the criminal activities of medicine
counterfeiters. The analytical profile also provides valuable information about the
spread and globalisation of medicine counterfeiting and its link to organised crime. As a
result, a trend can be established by tracing and comparing new falsified medicines
with former cases. This will help in characterising falsified medicines with respect to
source/origin (Deconinck et al, 2013; Dégardin et al, 2014) as was the case in
58 | P a g e
September, 2013 when falsified cough medicines found in Paraguay where identified to
be similar to those detected in Pakistan as mentioned earlier in section 2.1.3 (WHO,
2017). Assessment of the suspect cough medicines in Paraguay was therefore quicker
because forensic information was available to the WHO from a similar case of medicine
falsification in Pakistan.
All the analytical techniques employed in the analysis of falsified and substandard
medicines have been proven to enable the detection of these medicines (Table 2.2) but
no individual technique can be identified as the “magic bullet” to FSMs detection
(Martino et al, 2010, p.91; Rebiere et al, 2017). Therefore, the choice of the most
suitable technique to be employed at any given time will depend on the following
(Martino et al, 2010; Dégardin et al, 2014):
Expertise of the operator or analyst
Site where analysis is to be performed (developed or low income countries;
forensic laboratories or field).
Time limit for the screening exercise
Funds available for the analysis
Invasive or non-invasive method (Tampering or not tampering with sealed
packaging)
Purpose of testing/ required information (screening or confirmatory; Qualitative,
semi-quantitative or quantitative).
2.3 Conclusion
Despite all the efforts to address the issue, counterfeit medicines are still a challenge
globally. This is because the counterfeit medicine market thrives by taking advantage
of the loopholes in the regulatory system or breaching established guidelines locally or
internationally. Therefore, safeguarding of medicines or pharmacovigilance remains
59 | P a g e
continually relevant and crucial in order to ensure the safety of the medicines available
to the general public. Also, because these medicines are a potential public health risk,
the ease and speed of their detection will be a point to note if this phenomenon is to be
addressed. With studies showing that more counterfeit medicines are found further
away from the manufacturer in the distribution chain but closer to the final consumer, it
is important that more simple, cost effective and quick analytical screening methods be
developed so as to facilitate the process of authenticating medicines on the field.
This thesis will investigate the use of ATR-FTIR spectroscopy, Raman spectroscopy
and DIP-MS. The rationale for these choices is that they are readily available, low cost,
simple, rapid and can analyse solid mixtures. Although ATR-FTIR spectroscopy and
Raman spectroscopy have previously been used for screening medicines, this
research considers novel applications of these techniques in quantifying APIs and
discrimination of samples based on their constituents. On the other hand DIP-MS has
not been explored as a screening method for counterfeit solid pharmaceutical
formulations. Further details about the use of ATR-FTIR spectroscopy, Raman
spectroscopy and DIP-MS in the investigation of solid pharmaceutical formulations are
presented in chapters 3, 4 and 5 respectively.
Chapter 6 and 7 will cover quantitative analysis of counterfeit medicines based on UV-
vis spectroscopy and LC-MS respectively. These pharmacopoeia approved methods
(UV-vis and LC-MS) are used for validation of results obtained using the rapid methods
in earlier chapters. Chapter 8 is an assessment of the various techniques employed in
this study based on speed of analysis, cost, portability, sensitivity and specificity for
their feasibility in different settings or regions globally.
60 | P a g e
2.4 References
Advisory Council on the Misuse of Drugs (ACMD) (2016) Diversion and Illicit Supply of
Medicines. Available at:
https://assets.publishing.service.gov.uk/government/uploads/system/uploads/attachment_d
ata/file/580296/Meds_report-_final_report_15_December_LU__2_.pdf (accessed 27.07.18)
Almuzaini, T., Choonara, I. and Sammons, H. (2013) Substandard and counterfeit
medicines: a systematic review of the literature. British Medical Journal Open, 3(8):
e002923.
Amirfar, V.A. (2016) Tackling counterfeit medications through technology. Pharmacy
Today, 22(11): 40.
Anderson T. (2017) Bad medicine: the toxic fakes at the heart of an international criminal
racket. Available at: https://www.theguardian.com/global-development-professionals-
network/2017/oct/02/bad-medicine-the-toxic-fakes-at-the-heart-of-an-international-criminal-
racket (accessed 15.05.18).
Antignac, M., Diop, B.I., de Terline, D.M., Bernard, M., Do, B., Ikama, S.M., N'Guetta, R.,
Balde, D.M., Tchabi, Y., Aly, A.S. and Toure, I.A. (2017) Fighting fake medicines: first
quality evaluation of cardiac drugs in Africa. International Journal of Cardiology, 243: 523-
528.
Anzanello, M.J., Ortiz, R.S., Limberger, R. and Mariotti, K. (2014) A framework for selecting
analytical techniques in profiling authentic and counterfeit Viagra and Cialis. Forensic
Science International, 235: 1-7.
Arie, S. (2012) Contaminated drugs are held responsible for 120 deaths in Pakistan. BMJ:
British Medical Journal (Online), 344: e951.
Armitage, R. (2018) Rapid Screening Methods to Identify Substandard and Falsified
Medicines. PhD Thesis. De Montfort University, Leicester. Available at:
https://www.dora.dmu.ac.uk/handle/2086/16267 (accessed 15.01.19).
Assi, S., Watt, R.A. and Moffat, A.C. (2011) Identification of counterfeit medicines from the
Internet and the World market using near-infrared spectroscopy. Analytical Methods, 3(10):
2231-2236.
Attaran, A., Barry, D., Basheer, S., Bate, R., Benton, D., Chauvin, J., Garrett, L., Kickbusch,
I., Kohler, J.C., Midha, K. and Newton, P.N. (2012) How to achieve international action on
falsified and substandard medicines. British Medical Journal, 345: e7381.
Attaran, A., Bate, R. and Kendall, M. (2011) Why and how to make an international crime of
medicine counterfeiting. Journal of International Criminal Justice, 9: 325-354.
Baggaley K. (2017) Counterfeit drugs are putting the whole world at risk. Even if you don't
buy the fake pharmaceuticals yourself. Available at: https://www.popsci.com/what-can-we-
do-to-stop-fake-medicines (accessed 15.05.18)
Barras, J., Murnane, D., Althoefer, K., Assi, S., Rowe, M.D., Poplett, I.J., Kyriakidou, G. and
Smith, J.A. (2013) Nitrogen-14 nuclear quadrupole resonance spectroscopy: A promising
61 | P a g e
analytical methodology for medicines authentication and counterfeit antimalarial
analysis. Analytical Chemistry, 85(5): 2746-2753.
Barry F. (2015) Medline recalls mislabeled paracetamol. Available at: http://www.in-
pharmatechnologist.com/Regulatory-Safety/Medline-recalls-mislabelled-paracetamol
(accessed 22.10.16).
Bassat Orellana, Q., Tanner, M., Guerin, P.J., Stricker, K. and Hamed, K. (2016)
Combating poor-quality anti-malarial medicines: a call to action. Malaria Journal, 15 (302):
1-12.
Batson, J.S., Bempong, D.K., Lukulay, P.H., Ranieri, N., Satzger, R.D. and Verbois, L.
(2016) Assessment of the effectiveness of the CD3+ tool to detect counterfeit and
substandard anti-malarials. Malaria Journal, 15(1): 1.
Behera, S., Ghanty, S., Ahmad, F., Santra, S. and Banerjee, S. (2012) UV-visible
spectrophotometric method development and validation of assay of paracetamol tablet
formulation. Journal of Analytical & Bioanalytical Techniques, 3(6): 151.
Berman, B. and Swani, K. (2010) Managing product safety of imported Chinese
goods. Business Horizons, 53(1): 39-48.
Bernier, M.C., Li, F., Musselman, B., Newton, P.N. and Fernández, F.M. (2016)
Fingerprinting of falsified artemisinin combination therapies via direct analysis in real time
coupled to a compact single quadrupole mass spectrometer. Analytical Methods, 8(36):
6616-6624.
Bodkin, H. (2017) Big pharma cash and hospitality to doctors rises as one in three refuses
to reveal earnings. Available at: https://www.telegraph.co.uk/news/2017/06/30/big-pharma-
cash-hospitality-doctors-rises-one-three-refuses/ (01.08.18)
Bosch, M.E., Sánchez, A.R., Rojas, F.S. and Ojeda, C.B. (2006) Determination of
paracetamol: Historical evolution. Journal of Pharmaceutical and Biomedical Analysis,
42(3): 291-321.
Buchan, L. (2018) Brexit: Government admits plan to stockpile medicines and blood in case
UK leaves EU with no deal. Available at:
https://www.independent.co.uk/news/uk/politics/no-deal-brexit-blood-medicine-stockpile-
nhs-health-secretary-matt-hancock-a8462531.html (accessed 07.08.18)
Buckley, N.A., Dawson, A.H. and Isbister, G.K. (2016) Treatments for paracetamol
poisoning. British Medical Journal, 353: i2579.
Cai, Y., Cai, T.G., Shi, Y., Cheng, X.L., Ma, L.Y., Ma, S.C., Lin, R.C. and Feng, W. (2010)
Simultaneous determination of eight PDE5-IS potentially adulterated in herbal dietary
supplements with TLC and HPLC-PDA-MS methods. Journal of Liquid Chromatography &
Related Technologies, 33(13): 1287-1306.
Catarinucci, L., Colella, R., De Blasi, M., Patrono, L. and Tarricone, L. (2012) Enhanced
UHF RFID tags for drug tracing. Journal of Medical Systems, 36(6): 3451-3462.
62 | P a g e
Chernetsova, E.S. and Morlock, G.E. (2011) Determination of drugs and drug‐like
compounds in different samples with direct analysis in real time mass spectrometry. Mass
Spectrometry Reviews, 30(5): 875-883.
Chika, A., Bello, S.O., Jimoh, A.O. and Umar, M.T. (2011) The menace of fake drugs:
consequences, causes and possible solutions. Research Journal of Medical Sciences, 5(5):
257-261.
Chikowe, I., Osei-Safo, D., Harrison, J.J., Konadu, D.Y. and Addae-Mensah, I. (2015) Post-
marketing surveillance of anti-malarial medicines used in Malawi. Malaria Journal, 14(1):
127.
Custers, D., Canfyn, M., Courselle, P., De Beer, J.O., Apers, S. and Deconinck, E. (2014)
Headspace–gas chromatographic fingerprints to discriminate and classify counterfeit
medicines. Talanta, (123): 78-88.
Custers, D., Cauwenbergh, T., Bothy, J.L., Courselle, P., De Beer, J.O., Apers, S. and
Deconinck, E. (2015) ATR-FTIR spectroscopy and chemometrics: an interesting tool to
discriminate and characterize counterfeit medicines. Journal of Pharmaceutical and
Biomedical Analysis, 112: 181-189.
Custers, D., Vandemoortele, S., Bothy, J.L., De Beer, J.O., Courselle, P., Apers, S. and
Deconinck, E. (2016) Physical profiling and IR spectroscopy: simple and effective methods
to discriminate between genuine and counterfeit samples of Viagra® and Cialis®. Drug
Testing and Analysis, 8(3-4): 378-387.
Davison, M. (2011) Pharmaceutical anti-counterfeiting: combating the real danger from fake
drugs. New Jersey: John Wiley & Sons.
Deconinck, E., Canfyn, M., Sacré, P.Y., Courselle, P. and De Beer, J.O. (2013) Evaluation
of the residual solvent content of counterfeit tablets and capsules. Journal of
Pharmaceutical and Biomedical Analysis, 81: 80-88.
Deconinck, E., Sacré, P.Y., Coomans, D. and De Beer, J. (2012) Classification trees based
on infrared spectroscopic data to discriminate between genuine and counterfeit
medicines. Journal of Pharmaceutical and Biomedical Analysis, 57: 68-75.
Dégardin, K., Guillemain, A., Guerreiro, N.V. and Roggo, Y. (2016) Near infrared
spectroscopy for counterfeit detection using a large database of pharmaceutical tablets.
Journal of Pharmaceutical and Biomedical Analysis, 128: 89-97.
Dégardin, K., Roggo, Y. and Margot, P., (2015) Forensic intelligence for medicine anti-
counterfeiting. Forensic Science International, 248: 15-32.
Dégardin, K., Roggo, Y. and Margot, P., (2014) Understanding and fighting the medicine
counterfeit market. Journal of Pharmaceutical and Biomedical Analysis, 87: 167-175.
Dégardin, K., Roggo, Y., Been, F. and Margot, P. (2011) Detection and chemical profiling of
medicine counterfeits by Raman spectroscopy and chemometrics. Analytica Chimica
Acta, 705(1): 334-341.
63 | P a g e
Delepierre, A., Gayot, A., and Carpentier, A. (2012) Update on counterfeit antibiotics
worldwide; Public health risks. Médecine et maladies infectieuses. 42: 247-255.
Deisingh, A.K., (2005) Pharmaceutical counterfeiting. Analyst, 130(3): 271-279.
De Peinder, P., Vredenbregt, M.J., Visser, T. and De Kaste, D. (2008) Detection of Lipitor®
counterfeits: A comparison of NIR and Raman spectroscopy in combination with
chemometrics. Journal of Pharmaceutical and Biomedical Analysis, 47(4): 688-694.
de Veij, M., Vandenabeele, P., Hall, K.A., Fernandez, F.M., Green, M.D., White, N.J.,
Dondorp, A.M., Newton, P.N. and Moens, L. (2007) Fast detection and identification of
counterfeit antimalarial tablets by Raman spectroscopy. Journal of Raman Spectroscopy,
38(2): 181-187.
European Union (EU) (2016) Commission Delegated Regulation (EU) 2016/161 of 2
October 2015 supplementing Directive 2001/83/EC of the European Parliament and of the
Council by laying down detailed rules for the safety features appearing on the packaging of
medicinal products for human use. Available at:
https://ec.europa.eu/health/sites/health/files/files/eudralex/vol-
1/reg_2016_161/reg_2016_161_en.pdf (accessed at 17.04.18)
European Union Intellectual Property Office- EUIPO (2016) The economic cost of IPR
infringement on the pharmaceutical sector. Available at:
https://euipo.europa.eu/ohimportal/en/web/observatory/ipr-infringement-pharmaceutical-
sector (accessed 10.07.18).
Farouk, F., Moussa, B.A. and Azzazy, H.M.E.S. (2011) Fourier transform infrared
spectroscopy for in-process inspection, counterfeit detection and quality control of anti-
diabetic drugs. Journal of Spectroscopy, 26(4-5): 297-309.
Fernández, F.M., Cody, R.B., Green, M.D., Hampton, C.Y., McGready, R., Sengaloundeth,
S., White, N.J. and Newton, P.N. (2006) Characterization of solid counterfeit drug samples
by desorption electrospray ionization and direct‐analysis‐in‐real‐time coupled to
time‐of‐flight mass spectrometry. ChemMedChem, 1(7): 702-705.
Fiori, J. and Andrisano, V. (2014) LC–MS method for the simultaneous determination of six
glucocorticoids in pharmaceutical formulations and counterfeit cosmetic products. Journal
of Pharmaceutical and Biomedical Analysis, 91: 185-192.
Gallagher, J. (2017) Malaria drugs fail for first time on patients in UK. Available at:
http://www.bbc.co.uk/news/health-38796337 (accessed 07.02.17)
Green, M.D., Mount, D.L., Wirtz, R.A. and White, N.J. (2000) A colorimetric field method to
assess the authenticity of drugs sold as the antimalarial artesunate. Journal of
Pharmaceutical and Biomedical Analysis, 24(1): 65-70.
Hajjou, M., Qin, Y., Bradby, S., Bempong, D. and Lukulay, P. (2013) Assessment of the
performance of a handheld Raman device for potential use as a screening tool in
evaluating medicines quality. Journal of Pharmaceutical and Biomedical Analysis, 74: 47-
55.
64 | P a g e
Höllein, L. and Holzgrabe, U. (2014) Development of simplified HPLC methods for the
detection of counterfeit antimalarials in resource-restraint environments. Journal of
Pharmaceutical and Biomedical Analysis, 98: 434-445.
Höllein, L., Kaale, E., Mwalwisi, Y.H., Schulze, M.H. and Holzgrabe, U. (2016) Routine
quality control of medicines in developing countries: analytical challenges, regulatory
infrastructures and the prevalence of counterfeit medicines in Tanzania. TrAC Trends in
Analytical Chemistry, 76: 60-70.
Holzgrabe, U. and Malet-Martino, M. (2011) Analytical challenges in drug counterfeiting and
falsification—The NMR approach. Journal of Pharmaceutical and Biomedical
Analysis, 55(4): 679-687.
Jack, A. (2007) Bitter pills, British Medical Journal, 335: 1120–1121.
Kaale, E., Manyanga, V., Chambuso, M., Liana, J., Rutta, E., Embrey, M., Layloff, T. and
Johnson, K. (2016) The Quality of Selected Essential Medicines Sold in Accredited Drug
Dispensing Outlets and Pharmacies in Tanzania. PloS One, 11(11): e0165785.
Kaale, E., Risha, P. and Layloff, T. (2011) TLC for pharmaceutical analysis in resource
limited countries. Journal of Chromatography A, 1218(19): 2732-2736.
Kelesidis, T. and Falagas, M.E. (2015) Substandard/counterfeit antimicrobial drugs. Clinical
Microbiology Reviews, 28(2): 443-464.
Kessler, A., Cohen, E. and Grise K. (2018) CNN Exclusive: The more opioids doctors
prescribe, the more money they make. Available at:
https://edition.cnn.com/2018/03/11/health/prescription-opioid-payments-eprise/index.html
(accessed 30.07.18)
Khuluza, F., Kigera, S., Jähnke, R.W. and Heide, L. (2016) Use of thin-layer
chromatography to detect counterfeit sulfadoxine/pyrimethamine tablets with the wrong
active ingredient in Malawi. Malaria Journal, 15(1): 215.
Koesdjojo, M.T., Wu, Y., Boonloed, A., Dunfield, E.M. and Remcho, V.T. (2014) Low-cost,
high-speed identification of counterfeit antimalarial drugs on paper. Talanta, 130: 122-127.
Kovacs, S., Hawes, S.E., Maley, S.N., Mosites, E., Wong, L. and Stergachis, A. (2014)
Technologies for detecting falsified and substandard drugs in low and middle-income
countries. PLoS One, 9(3): e90601.
Krakowska, B., Custers, D., Deconinck, E. and Daszykowski, M. (2016) Chemometrics and
the identification of counterfeit medicines—A review. Journal of Pharmaceutical and
Biomedical Analysis, 127: 112-122.
Kumano, S., Sugiyama, M., Yamada, M., Nishimura, K., Hasegawa, H., Morokuma, H.,
Inoue, H. and Hashimoto, Y. (2015) Probe Heating Method for the Analysis of Solid
Samples Using a Portable Mass Spectrometer. Mass Spectrometry, 4(1): A0038-A0038.
Kwok, K. and Taylor, L.S. (2012) Analysis of counterfeit Cialis® tablets using Raman
microscopy and multivariate curve resolution. Journal of Pharmaceutical and Biomedical
Analysis, 66: 126-135.
65 | P a g e
Lanzarotta, A., Lakes, K., Marcott, C.A., Witkowski, M.R. and Sommer, A.J. (2011) Analysis
of counterfeit pharmaceutical tablet cores utilizing macroscopic infrared spectroscopy and
infrared spectroscopic imaging. Analytical Chemistry, 83(15): 5972-5978.
Lavorgna, A. (2015) The online trade in counterfeit pharmaceuticals: new criminal
opportunities, trends and challenges. European Journal of Criminology, 12(2): 226-241.
Lawson, G., Ogwu, J. and Tanna, S. (2018) Quantitative screening of the pharmaceutical
ingredient for the rapid identification of substandard and falsified medicines using
reflectance infrared spectroscopy. PLoS ONE, 13 (8): e0202059.
Lee, K.S., Yee, S.M., Zaidi, S.T.R., Patel, R.P., Yang, Q., Al-Worafi, Y.M. and Ming, L.C.
(2017) Combating sale of counterfeit and falsified medicines online: a losing battle.
Frontiers in Pharmacology, 8: 268.
Likar, M.D., Cheng, G., Mahajan, N. and Zhang, Z. (2011) Rapid identification and absence
of drug tests for AG-013736 in 1mg Axitinib tablets by ion mobility spectrometry and
DART™ mass spectrometry. Journal of Pharmaceutical and Biomedical Analysis, 55(3):
569-573.
Macias Jr, M. (2018) Los Angeles Cracks Down On Counterfeit Drugs. Available at:
https://www.courthousenews.com/los-angeles-cracks-down-on-counterfeit-drugs/
(accessed 30.05.18)
Mackey, T.K., Liang, B.A., York, P. and Kubic, T. (2015) Counterfeit drug penetration into
global legitimate medicine supply chains: a global assessment. The American Journal of
Tropical Medicine and Hygiene, 92(6_Suppl): 59-67.
Marini, R.D., Kindenge, J.M., Montes, M.L.A., Debrus, B., Lebrun, P., Mantanus, J.,
Ziemons, E., Rohrbasser, C., Rudaz, S. and Hubert, P. (2010a) Implementation of generic
analytical methods to fight against counterfeit medicines. Chemistry Today, 28(5): 10-14.
Martino, R., Malet-Martino, M., Gilard, V. and Balayssac, S. (2010) Counterfeit drugs:
analytical techniques for their identification. Analytical and Bioanalytical Chemistry, 398(1):
77-92.
Matousek, P., Thorley, F., Chen, P., Hargreaves, M., Tombling, C., Loeffen, P., Bloomfield,
M. and Andrews, D. (2011) Emerging Raman Techniques for Rapid Noninvasive
Characterization of Pharmaceutical Samples and Containers. Spectroscopy, 26(3): 44-51.
Maurin, J.K., Pluciński, F., Mazurek, A.P. and Fijałek, Z. (2007) The usefulness of simple X-
ray powder diffraction analysis for counterfeit control—The Viagra® example. Journal of
Pharmaceutical and Biomedical Analysis, 43(4): 1514-1518.
Mc Gillicuddy, A., Kelly, M., Crean, A.M. and Sahm, L.J. (2017) The knowledge, attitudes
and beliefs of patients and their healthcare professionals around oral dosage form
modification: A systematic review of the qualitative literature. Research in Social and
Administrative Pharmacy, 13(4): 717-726.
Megget, K. (2016) Study explores activity on dark web. Available at
https://www.securingindustry.com/pharmaceuticals/study-explores-activity-on-dark-
web/s40/a3015/#.WCGyKNWLSUk (accessed 22.09.16)
66 | P a g e
Moffat, A.C., Assi, S. and Watt, R.A. (2010) Identifying counterfeit medicines using near
infrared spectroscopy. Journal of Near Infrared Spectroscopy, 18(1): 1-15.
Moon, S. (2017) Powerful ideas for global access to medicines. New England Journal of
Medicine, 376(6): 505-507.
Mori, A.T., Meena, E. and Kaale, E.A. (2018) Economic cost of substandard and falsified
human medicines and cosmetics with banned ingredients in Tanzania from 2005 to 2015: a
retrospective review of data from the regulatory authority. British Medical Journal Open,
8(6): e021825.
Mukhopadhyay, R. (2007) The hunt for counterfeit medicine, Analytical Chemistry, 79:
2622–2627.
Mwalwisi, Y.H., Hoellein, L., Kaale, E. and Holzgrabe, U. (2016) Development of a simple,
rapid, and robust liquid chromatographic method for the simultaneous determination of
sulfalene, sulfadoxine, and pyrimethamine in tablets. Journal of Pharmaceutical and
Biomedical Analysis, 129: 558-570.
Nayyar, G.M., Breman, J.G., Newton, P.N. and Herrington, J. (2012) Poor-quality
antimalarial drugs in southeast Asia and sub-Saharan Africa. The Lancet Infectious
Diseases, 12(6): 488-496.
Newton, P.N., Amin, A.A., Bird, C., Passmore, P., Dukes, G., Tomson, G., Simons, B.,
Bate, R., Guerin, P.J. and White, N.J. (2011) The primacy of public health considerations in
defining poor quality medicines. PLoS Med, 8(12): e1001139.
Newton, P.N., Green, M.D. and Fernández, F.M. (2010) Impact of poor-quality medicines in
the ‘developing’world. Trends in Pharmacological Sciences, 31(3): 99-101.
Newton, P.N., Fernández, F.M., Plançon, A., Mildenhall, D.C., Green, M.D., Ziyong, L.,
Christophel, E.M., Phanouvong, S., Howells, S., McIntosh, E. and Laurin, P. (2008) A
collaborative epidemiological investigation into the criminal fake artesunate trade in South
East Asia. PLoS Med, 5(2): e32.
NHS News (2017) Prescription curbs to free up hundreds of millions of pounds for frontline
care. Available at: https://www.england.nhs.uk/2017/11/prescription-curbs-to-free-up-
hundreds-of-millions-of-pounds-for-frontline-care/ (accessed 10.08.18).
Orizio, G., Schulz, P., Domenighini, S., Caimi, L., Rosati, C., Rubinelli, S. and Gelatti, U.
(2009) Cyberdrugs: a cross-sectional study of online pharmacies characteristics. The
European Journal of Public Health, 19(4): 375-377.
Ortiz, R.S., Mariotti, K.D.C., Limberger, R.P. and Mayorga, P. (2012) Physical profile of
counterfeit tablets Viagra® and Cialis®. Brazilian Journal of Pharmaceutical
Sciences, 48(3): 487-495.
Palumbo, F.B., Mullins, C.D., Slagle, A.F. and Rizer, J. (2007) Policy implications of drug
importation. Clinical Therapeutics, 29(12): 2758-2767.
Petersen, A., Held, N. and Heide, L. (2017) Surveillance for falsified and substandard
medicines in Africa and Asia by local organizations using the low-cost GPHF Minilab. PloS
One, 12(9): e0184165.
67 | P a g e
Pharmaceutical Security Institute -PSI (2018) Counterfeit Situation, Washington,DC,
Available at http://www.psi-inc.org/geographicDistributions.cfm (accessed 02.05.18)
Platek, S.F., Ranieri, N. and Batson, J. (2016) Applications of the FDA’s Counterfeit
Detection Device (CD3+) to the Examination of Suspect Counterfeit Pharmaceutical
Tablets and Packaging. Microscopy and Microanalysis, 22: 3.
Puchert, T., Lochmann, D., Menezes, J.C. and Reich, G., (2010) Near-infrared chemical
imaging (NIR-CI) for counterfeit drug identification - A four-stage concept with a novel
approach of data processing (Linear Image Signature). Journal of Pharmaceutical and
Biomedical Analysis, 51(1): 138-145.
Qiu, Y., Chen, Y., Zhang, G.G., Yu, L. and Mantri, R.V. eds. (2016) Developing solid oral
dosage forms: pharmaceutical theory and practice. London: Academic press.
Ranieri, N., Tabernero, P., Green, M.D., Verbois, L., Herrington, J., Sampson, E., Satzger,
R.D., Phonlavong, C., Thao, K., Newton, P.N. and Witkowski, M.R. (2014) Evaluation of a
new handheld instrument for the detection of counterfeit artesunate by visual fluorescence
comparison. The American Journal of Tropical Medicine and Hygiene, 91(5): 920-924.
Rebiere, H., Guinot, P., Chauvey, D. and Brenier, C. (2017) Fighting falsified medicines:
The analytical approach. Journal of Pharmaceutical and Biomedical Analysis, 142: 286-
306.
Reggi, V. (2007) Counterfeit medicines: An intent to deceive, WHO News. International
Journal of Risk and Safety in Medicine, 19: 105-108.
Reuter, P. and Greenfield, V. (2001) Measuring global drug markets. World
Economics, 2(4): 159-173.
Reuters News (2018) Philippines' Duterte now targets fake drugs. Available at:
https://uk.reuters.com/article/uk-philippines-duterte-medicines/philippines-duterte-now-
targets-fake-drugs-idUKKBN1H40XC (accessed 02.08.18).
Reynolds, L. and McKee, M. (2010) Organised crime and the efforts to combat it: a concern
for public health. Globalization and Health, 6(1): 1.
Ricci, C., Nyadong, L., Yang, F., Fernandez, F.M., Brown, C.D., Newton, P.N. and
Kazarian, S.G. (2008) Assessment of hand-held Raman instrumentation for in situ
screening for potentially counterfeit artesunate antimalarial tablets by FT-Raman
spectroscopy and direct ionization mass spectrometry. Analytica chimica acta, 623(2): 178-
186.
Risha, P.G., Msuya, Z., Clark, M., Johnson, K., Ndomondo-Sigonda, M. and Layloff, T.
(2008) The use of Minilabs® to improve the testing capacity of regulatory authorities in
resource limited settings: Tanzanian experience. Health Policy, 87(2): 217-222.
Rodionova, O.Y., Balyklova, K.S., Titova, A.V. and Pomerantsev, A.L. (2018) Application of
NIR spectroscopy and chemometrics for revealing of the ‘high quality fakes’ among the
medicines. Forensic Chemistry, 8: 82-89.
68 | P a g e
Rodomonte, A.L., Gaudiano, M.C., Antoniella, E., Lucente, D., Crusco, V., Bartolomei, M.,
Bertocchi, P., Manna, L., Valvo, L., Alhaique, F. and Muleri, N. (2010) Counterfeit drugs
detection by measurement of tablets and secondary packaging colour. Journal of
Pharmaceutical and Biomedical Analysis, 53(2): 215-220.
Roudaut, M.R., (2011) Contrefac¸ on: un crime invisible (Counterfeit: an invisible crime),
Cahiers de la Sécurité, 5: 25–35.
Sacré, P.Y., Deconinck, E., De Beer, T., Courselle, P., Vancauwenberghe, R., Chiap, P.,
Crommen, J. and De Beer, J.O. (2010) Comparison and combination of spectroscopic
techniques for the detection of counterfeit medicines. Journal of Pharmaceutical and
Biomedical Analysis, 53(3): 445-453.
Sammons, H.M. and Choonara, I. (2017) Substandard medicines: a greater problem than
counterfeit medicines? BMJ Paediatrics Open, 1(1): e000007. doi: 10.1136/bmjpo-2017-
000007.
Seiter, A. (2009) Health and economic consequences of counterfeit drugs. Clinical
Pharmacology and Therapeutics, 85: 576–578.
Shah, R.Y., Prajapati, P.N. and Agrawal, Y.K. (2010) Anticounterfeit packaging
technologies. Journal of Advanced Pharmaceutical Technology & Research, 1(4): 368-373.
Shepherd, M. (2010) Beef up international cooperation on counterfeits. Nature
Medicine, 16(4): 366-366.
Sherma, J. (2007) Analysis of counterfeit drugs by thin layer chromatography. Acta
Chromatographica, 19: 5.
Star, K. and Choonara, I. (2015) How safe is paracetamol? Archives of Diseases in
Childhood, 100: 73-74.
Steinhubl, S.R., Muse, E.D. and Topol, E.J. (2015) The emerging field of mobile health.
Science Translational Medicine, 7(283): 283rv3.
Talati, R., Parikh, S. and K Agrawal, Y. (2011) Pharmaceutical counterfeiting and analytical
authentication. Current Pharmaceutical Analysis, 7(1): 54-61.
Townsend, M. (2009) Health fears grow as fake drugs flood into Britain, Available at:
https://www.theguardian.com/business/2009/jan/04/fake-pharmaceuticals-drugs-china-nhs
(accessed 02.08.18).
Twohig, M., Skilton, S.J., Fujimoto, G., Ellor, N., Plumb, R.S. (2010) Rapid detection and
identification of counterfeit of adulterated products of synthetic phosphodiesterase type-5
inhibitors with an atmospheric solids analysis probe. Drug Testing and Analysis, 2: 45–50.
Van Baelen, M., Dylst, P., Pereira, C.L., Verhaeghe, J., Nauwelaerts, K. and Lyddon, S.
(2017) Fighting Counterfeit Medicines in Europe: The Effect on Access to
Medicines. Medicine Access@ Point of Care, 1(1): e49-e54.
Vanderdonck, F. (2007) Counterfeit medicines: a threat to public health and safety Louvain
Médical 126: 138–143.
69 | P a g e
Venhuis, B.J., Zwaagstra, M.E., Keizers, P.H.J. and De Kaste, D. (2014) Dose-to-dose
variations with single packages of counterfeit medicines and adulterated dietary
supplements as a potential source of false negatives and inaccurate health risk
assessments. Journal of Pharmaceutical and Biomedical Analysis, 89: 158-165.
Wall, M. (2016) Counterfeit drugs: ‘People are dying every day’, Available at:
http://www.bbc.co.uk/news/business-37470667 (accessed 27.09.16).
Wertheimer, A.I. and Norris, J. (2009) Safeguarding against substandard/counterfeit drugs:
mitigating a macroeconomic pandemic. Research in Social and Administrative
Pharmacy, 5(1): 4-16.
World Health Organisation- WHO (2012) Medicines: spurious/falsely-
labelled/falsified/counterfeit (SFFC) medicines. Available at:
http://www.who.int/mediacentre/factsheets/fs275/en/ (accessed 30.09.14)
World Health Organisation -WHO (2016), Substandard, spurious, falsely labelled, falsified
and counterfeit (SSFFC) medical products, Available at:
http://www.who.int/mediacentre/factsheets/fs275/en/index.html (accessed 19.09.16)
World Health Organisation- WHO (2017) WHO Global Surveillance and Monitoring System
for Substandard and Falsified Medical Products. Geneva: World Health Organization.
Licence: CC BY-NC-SA 3.0 IGO. Available at:
http://www.who.int/medicines/regulation/ssffc/publications/GSMS_executive_Summary.pdf
(accessed 04.05.2018)
WHO Programme for International Drug Monitoring -WHO PIDM (2016) essential
medicines and health products, Available at:
http://www.who.int/medicines/regulation/medicines-safety/about/drug_monitoring_prog/en/
(accessed 03.11.16)
World Trade Organization- WTO (2016), Uruguay Round Agreement: TRIPS Part III —
Enforcement of Intellectual Property Rights WTO, Geneva, Switzerland. Available at:
https://www.wto.org/english/docs_e/legal_e/27-trips_05_e.htm (accessed 15.08.16).
Yemoa, A., Habyalimana, V., K Mbinze, J., Crickboom, V., Muhigirwa, B., Ngoya, A., Sacre,
P.Y., Gbaguidi, F., Quetin-Leclercq, J., Hubert, P. and D Marini, R. (2017) Detection of
Poor Quality Artemisinin-based Combination Therapy (ACT) Medicines Marketed in Benin
Using Simple and Advanced Analytical Techniques. Current Drug Safety, 12(3): 178-186
Yu, H., Le, H.M., Kaale, E., Long, K.D., Layloff, T., Lumetta, S.S. and Cunningham, B.T.
(2016) Characterization of drug authenticity using thin-layer chromatography imaging with a
mobile phone. Journal of Pharmaceutical and Biomedical Analysis, 125: 85-93.
Zou, W.B., Yin, L.H. and Jin, S.H. (2017) Advances in rapid drug detection technology.
Journal of Pharmaceutical and Biomedical Analysis, 147: 81-88.
70 | P a g e
CHAPTER THREE
Rapid identification of falsified
and substandard medicines:
Reflectance infrared
spectroscopy for quantitative
screening of the pharmaceutical
ingredient
71 | P a g e
3.1 Introduction
With the growing prevalence of falsified and substandard medicines globally, the
provision of simple, fast and cost effective methods of analysis for screening
these medications would be beneficial especially in low and middle income
countries (LMICs) (Glass, 2014; Hoellein and Holzgrabe, 2014; Koesdjojo et al,
2014; Mackey et al, 2015; Otte et al, 2015). Vibrational spectroscopic techniques
are widely-documented as being suitable analytical methods for the
authentication of pharmaceuticals (Sacré et al, 2010; Ortiz et al, 2013; Custers et
al, 2015; Neuberger and Neusüß, 2015; Hoellein et al, 2016). There has also
been increased interest in the use of handheld devices that combine
spectroscopic and chemical analyses for screening medicines in the field (Kwok
and Taylor, 2012; Kovacs et al, 2014; Ranieri et al, 2014; Sukkar, 2014). Raman
spectroscopy in particular has been applied extensively in the characterization
and identification of suspected medicines (De Veij et al, 2008; Dégardin et al,
2011; Neuberger and Neusüß, 2015) and also in quantification of paracetamol
(Lyndgaard et al, 2013). Furthermore, Near Infrared spectroscopy (NIR) in
combination with Raman spectroscopy, has been used for authentication of
counterfeit medicines (Vredenbregt et al, 2006; Sacré et al, 2010). However,
Neuberger and Neusüß (2015) identifies the limitations of Raman spectroscopy
in its inability to discriminate between variations in mixing quality. Fourier
Transform Infrared spectroscopy (FTIR) addresses this limitation as it is
sensitive to mixing quality and granulation (Farouk et al, 2011).
There is also the issue of chemical peaks not being well defined or separated
(poor chemical peak specificity) in NIR spectroscopy making spectra difficult to
interpret (Roggo et al, 2007; Kovacs et al, 2014). Interest in this area is
increasing by the day with the development of new equipment such as the
72 | P a g e
combination of optical microscopy with sensitive Raman analysis for forensic and
analytical testing (Horiba, 2016).
Most applications of FTIR to pharmaceuticals like other spectroscopic
techniques include characterisation and identifying the presence or absence of
APIs and excipients (Sacré et al, 2010; Custers et al, 2015). Conventional FTIR
with multivariate analysis has also been used for the quantification of APIs in
antidiabetic drugs (Farouk et al, 2011) and paracetamol (Mallah et al, 2015) in
solid pharmaceutical dosage forms. This approach requires skilled personnel
since samples must be prepared as crushed powders finely dispersed in a KBr
matrix which is then compressed into discs before analysis. This is both tedious
and time consuming.
Attenuated Total Reflectance Fourier Transform Infrared Spectroscopy (ATR-
FTIR) has revolutionized conventional FTIR by eliminating the main challenges
in the analysis of pharmaceutical solid dosage forms notably the time spent in
sample preparation: sample extraction or KBr disc preparation and the lack of
spectral reproducibility. ATR-FTIR is quicker than the pharmacopoeia approved
methods and conventional FTIR since the samples only need to be powdered
before analysis (Lawson et al, 2018). The ATR accessory measures the changes
that occur in a totally internally reflected infrared beam when the beam comes
into contact with a sample (Fig. 3.1). The spectrum obtained is a fingerprint of
the analyzed sample indicative of its unique features such as the functional
groups and the chemical bonds in the sample (PerkinElmer, 2005).
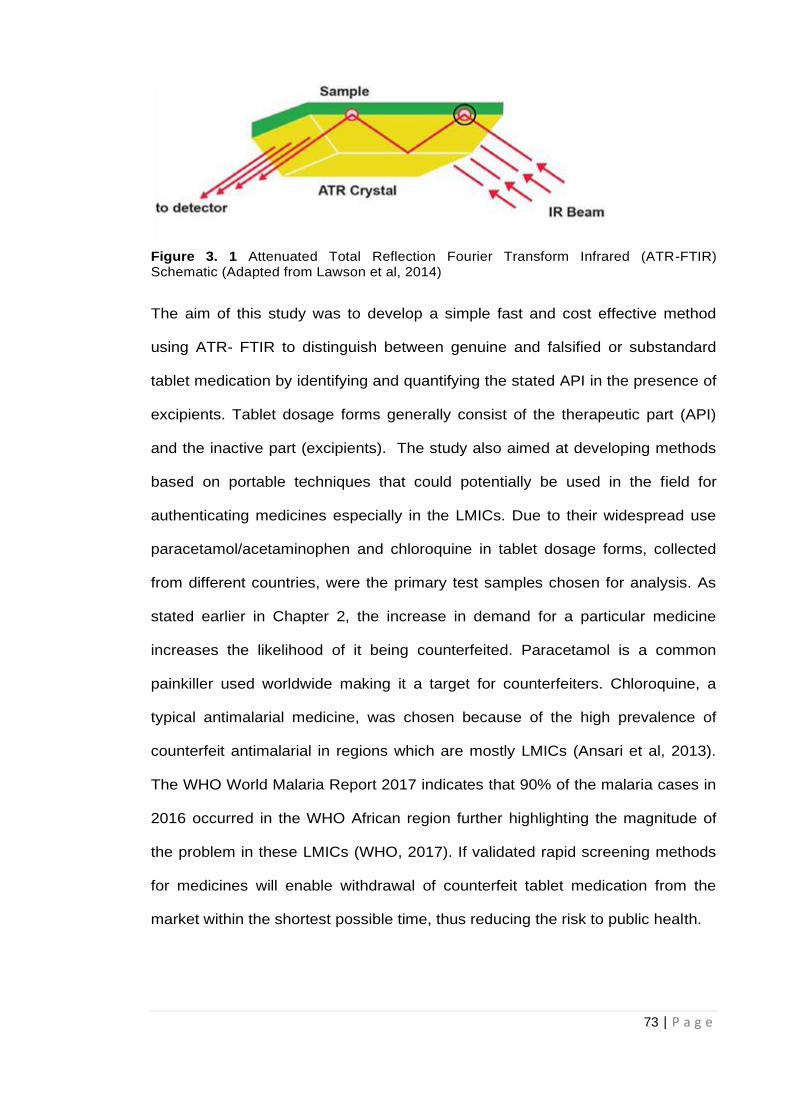
73 | P a g e
Figure 3. 1 Attenuated Total Reflection Fourier Transform Infrared (ATR-FTIR) Schematic (Adapted from Lawson et al, 2014)
The aim of this study was to develop a simple fast and cost effective method
using ATR- FTIR to distinguish between genuine and falsified or substandard
tablet medication by identifying and quantifying the stated API in the presence of
excipients. Tablet dosage forms generally consist of the therapeutic part (API)
and the inactive part (excipients). The study also aimed at developing methods
based on portable techniques that could potentially be used in the field for
authenticating medicines especially in the LMICs. Due to their widespread use
paracetamol/acetaminophen and chloroquine in tablet dosage forms, collected
from different countries, were the primary test samples chosen for analysis. As
stated earlier in Chapter 2, the increase in demand for a particular medicine
increases the likelihood of it being counterfeited. Paracetamol is a common
painkiller used worldwide making it a target for counterfeiters. Chloroquine, a
typical antimalarial medicine, was chosen because of the high prevalence of
counterfeit antimalarial in regions which are mostly LMICs (Ansari et al, 2013).
The WHO World Malaria Report 2017 indicates that 90% of the malaria cases in
2016 occurred in the WHO African region further highlighting the magnitude of
the problem in these LMICs (WHO, 2017). If validated rapid screening methods
for medicines will enable withdrawal of counterfeit tablet medication from the
market within the shortest possible time, thus reducing the risk to public health.
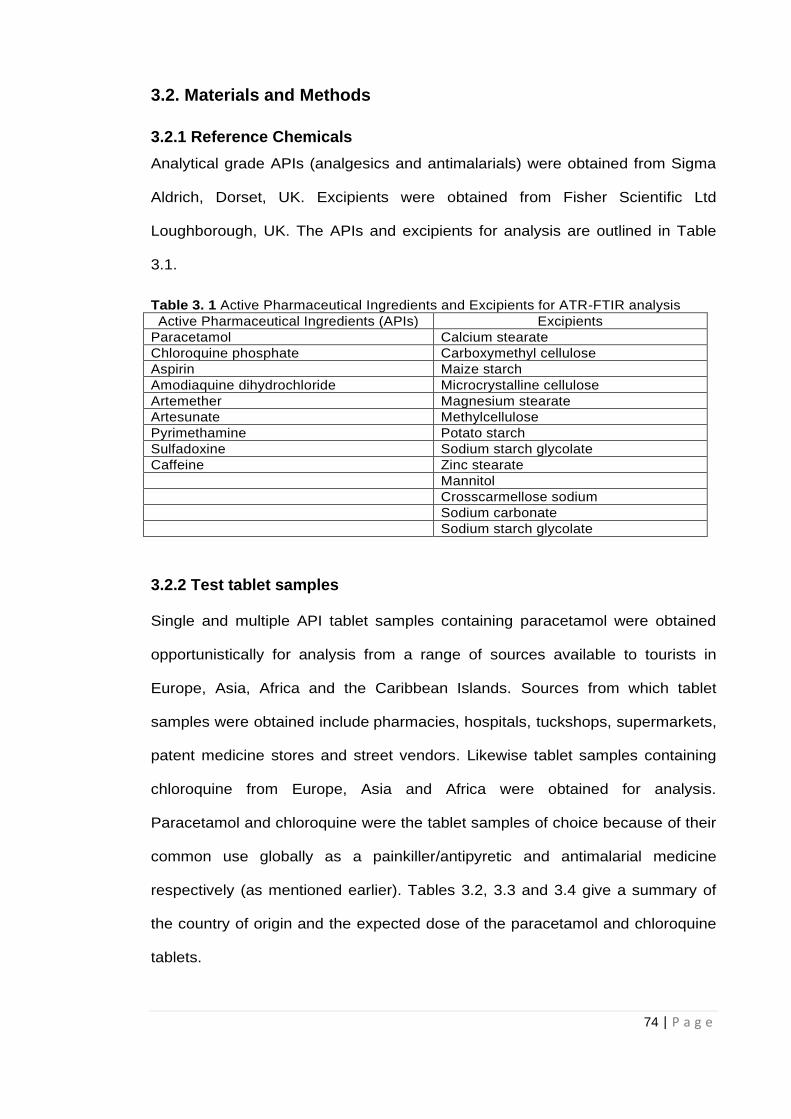
74 | P a g e
3.2. Materials and Methods
3.2.1 Reference Chemicals
Analytical grade APIs (analgesics and antimalarials) were obtained from Sigma
Aldrich, Dorset, UK. Excipients were obtained from Fisher Scientific Ltd
Loughborough, UK. The APIs and excipients for analysis are outlined in Table
3.1.
Table 3. 1 Active Pharmaceutical Ingredients and Excipients for ATR-FTIR analysis
Active Pharmaceutical Ingredients (APIs) Excipients
Paracetamol Calcium stearate
Chloroquine phosphate Carboxymethyl cellulose
Aspirin Maize starch
Amodiaquine dihydrochloride Microcrystalline cellulose
Artemether Magnesium stearate
Artesunate Methylcellulose
Pyrimethamine Potato starch
Sulfadoxine Sodium starch glycolate
Caffeine Zinc stearate
Mannitol
Crosscarmellose sodium
Sodium carbonate
Sodium starch glycolate
3.2.2 Test tablet samples
Single and multiple API tablet samples containing paracetamol were obtained
opportunistically for analysis from a range of sources available to tourists in
Europe, Asia, Africa and the Caribbean Islands. Sources from which tablet
samples were obtained include pharmacies, hospitals, tuckshops, supermarkets,
patent medicine stores and street vendors. Likewise tablet samples containing
chloroquine from Europe, Asia and Africa were obtained for analysis.
Paracetamol and chloroquine were the tablet samples of choice because of their
common use globally as a painkiller/antipyretic and antimalarial medicine
respectively (as mentioned earlier). Tables 3.2, 3.3 and 3.4 give a summary of
the country of origin and the expected dose of the paracetamol and chloroquine
tablets.
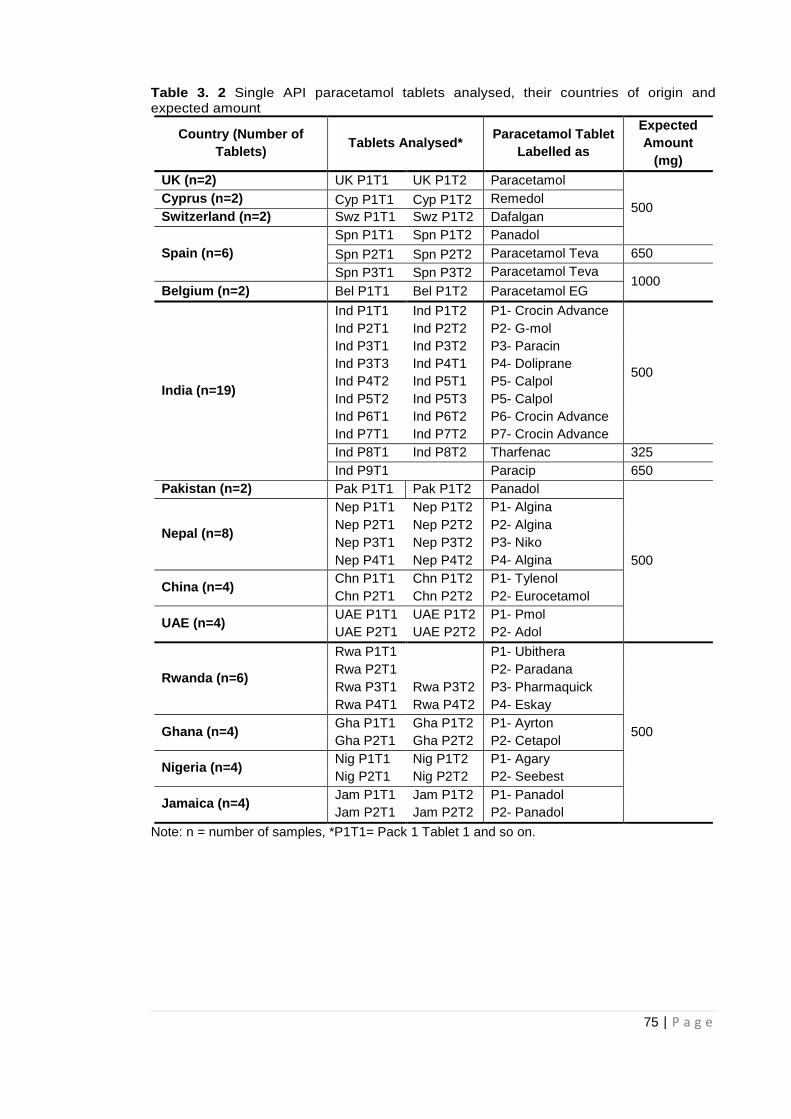
75 | P a g e
Table 3. 2 Single API paracetamol tablets analysed, their countries of origin and expected amount
Country (Number of
Tablets) Tablets Analysed*
Paracetamol Tablet
Labelled as
Expected
Amount
(mg)
UK (n=2) UK P1T1 UK P1T2 Paracetamol
500 Cyprus (n=2) Cyp P1T1 Cyp P1T2 Remedol
Switzerland (n=2) Swz P1T1 Swz P1T2 Dafalgan
Spain (n=6)
Spn P1T1 Spn P1T2 Panadol
Spn P2T1 Spn P2T2 Paracetamol Teva 650
Spn P3T1 Spn P3T2 Paracetamol Teva 1000
Belgium (n=2) Bel P1T1 Bel P1T2 Paracetamol EG
India (n=19)
Ind P1T1 Ind P1T2 P1- Crocin Advance
500
Ind P2T1 Ind P2T2 P2- G-mol
Ind P3T1 Ind P3T2 P3- Paracin
Ind P3T3 Ind P4T1 P4- Doliprane
Ind P4T2 Ind P5T1 P5- Calpol
Ind P5T2 Ind P5T3 P5- Calpol
Ind P6T1 Ind P6T2 P6- Crocin Advance
Ind P7T1 Ind P7T2 P7- Crocin Advance
Ind P8T1 Ind P8T2 Tharfenac 325
Ind P9T1 Paracip 650
Pakistan (n=2) Pak P1T1 Pak P1T2 Panadol
500
Nepal (n=8)
Nep P1T1 Nep P1T2 P1- Algina
Nep P2T1 Nep P2T2 P2- Algina
Nep P3T1 Nep P3T2 P3- Niko
Nep P4T1 Nep P4T2 P4- Algina
China (n=4) Chn P1T1 Chn P1T2 P1- Tylenol
Chn P2T1 Chn P2T2 P2- Eurocetamol
UAE (n=4) UAE P1T1 UAE P1T2 P1- Pmol
UAE P2T1 UAE P2T2 P2- Adol
Rwanda (n=6)
Rwa P1T1 P1- Ubithera
500
Rwa P2T1 P2- Paradana
Rwa P3T1 Rwa P3T2 P3- Pharmaquick
Rwa P4T1 Rwa P4T2 P4- Eskay
Ghana (n=4) Gha P1T1 Gha P1T2 P1- Ayrton
Gha P2T1 Gha P2T2 P2- Cetapol
Nigeria (n=4) Nig P1T1 Nig P1T2 P1- Agary
Nig P2T1 Nig P2T2 P2- Seebest
Jamaica (n=4) Jam P1T1 Jam P1T2 P1- Panadol
Jam P2T1 Jam P2T2 P2- Panadol
Note: n = number of samples, *P1T1= Pack 1 Tablet 1 and so on.
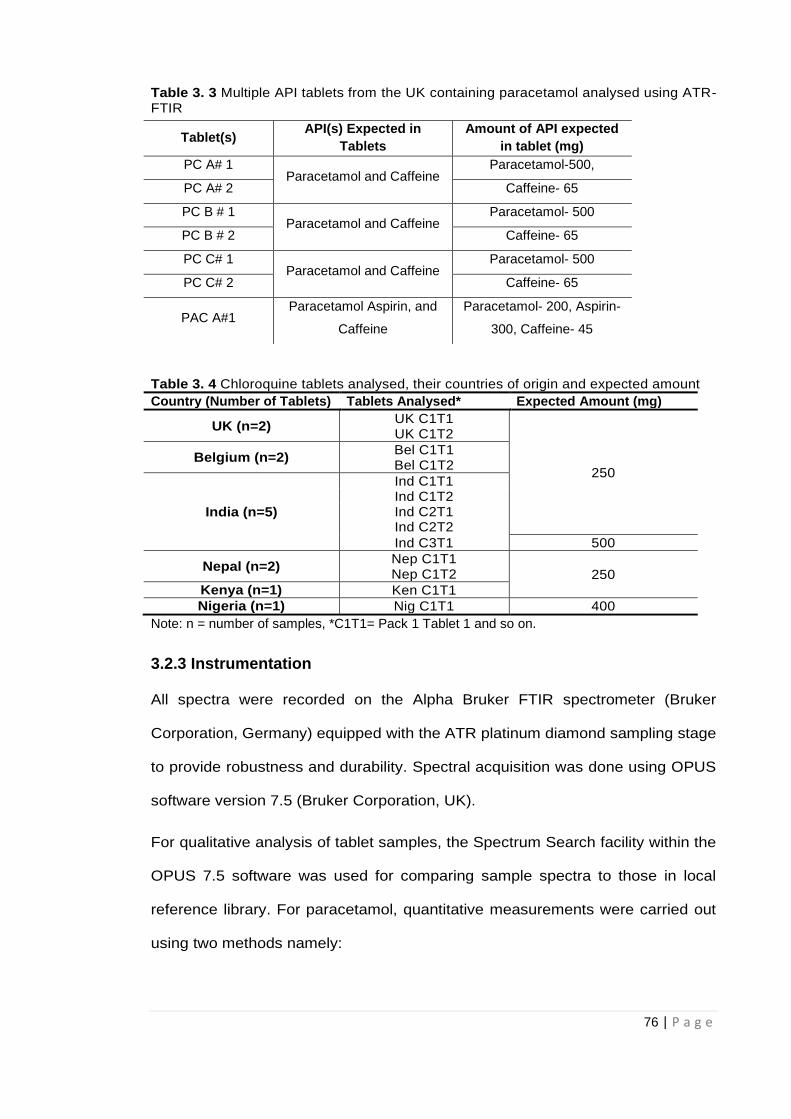
76 | P a g e
Table 3. 3 Multiple API tablets from the UK containing paracetamol analysed using ATR-FTIR
Table 3. 4 Chloroquine tablets analysed, their countries of origin and expected amount
Country (Number of Tablets) Tablets Analysed* Expected Amount (mg)
UK (n=2) UK C1T1
250
UK C1T2
Belgium (n=2) Bel C1T1 Bel C1T2
India (n=5)
Ind C1T1 Ind C1T2 Ind C2T1 Ind C2T2
Ind C3T1 500
Nepal (n=2) Nep C1T1
250 Nep C1T2
Kenya (n=1) Ken C1T1
Nigeria (n=1) Nig C1T1 400
Note: n = number of samples, *C1T1= Pack 1 Tablet 1 and so on.
3.2.3 Instrumentation
All spectra were recorded on the Alpha Bruker FTIR spectrometer (Bruker
Corporation, Germany) equipped with the ATR platinum diamond sampling stage
to provide robustness and durability. Spectral acquisition was done using OPUS
software version 7.5 (Bruker Corporation, UK).
For qualitative analysis of tablet samples, the Spectrum Search facility within the
OPUS 7.5 software was used for comparing sample spectra to those in local
reference library. For paracetamol, quantitative measurements were carried out
using two methods namely:
Tablet(s) API(s) Expected in
Tablets
Amount of API expected
in tablet (mg)
PC A# 1 Paracetamol and Caffeine
Paracetamol-500,
PC A# 2 Caffeine- 65
PC B # 1 Paracetamol and Caffeine
Paracetamol- 500
PC B # 2 Caffeine- 65
PC C# 1 Paracetamol and Caffeine
Paracetamol- 500
PC C# 2 Caffeine- 65
PAC A#1 Paracetamol Aspirin, and
Caffeine
Paracetamol- 200, Aspirin-
300, Caffeine- 45
77 | P a g e
Manual integration of characteristic peaks identified using the integration
mode facility on the software.
Automatic multivariate partial least squares (PLS) calibration by using the
Quant 2 facility within the software to provide calibration spectra from
different concentrations (%w/w) of paracetamol prepared in selected
excipients.
Quantification of chloroquine was based on Quant 2 methods validated for
paracetamol providing calibration spectra from different concentrations (% w/w)
of chloroquine in maize starch.
3.2.4 Methods
3.2.4.1 Reference Spectra
All sample spectra were measured in absorbance mode. A fresh background
spectrum was measured against air before starting measurements and
subsequently after every 5 runs. Small amounts of finely ground samples of the
individual reference materials, paracetamol, chloroquine, other APIs and
excipients often found in pharmaceutical formulations, were placed on the
diamond sampling crystal and pressed using a clamp to ensure proper contact.
Each spectrum was measured by averaging 20 scans over the range 4000-
400cm-1 and spectral resolution for measurement was 2cm-1. Estimated scan
time for spectral acquisition was 25 seconds. This process was repeated 5 times
to ensure replicate data was produced. The platinum diamond sampling surface
was cleaned after each sample using paper tissue with isopropanol and allowed
to dry. Recorded fingerprint spectra for the reference materials were assessed
for spectral reproducibility by comparing replicate spectra. Reproducible spectral
data were used to create a local reference library to help in the identification of
sample spectra. Identification was based on characteristic peaks chosen by
78 | P a g e
comparing test sample to reference. Members of the same excipient groups,
starches, stearates and celluloses all had very similar spectra (Fig 3.5).
Characteristic regions of paracetamol and chloroquine spectra were identified
where there was little or no interference from other materials.
3.2.4.2 Preparation of API-excipient calibration mixtures
3.2.4.2.1 Paracetamol calibration
Excipients used were representative of different excipient groups commonly
used in formulation for particular functions. Microcrystalline cellulose (binder,
disintegrant), maize starch (diluent, binder) and magnesium stearate (lubricant)
were the excipients selected as examples of excipients commonly used in
paracetamol formulations (Haywood and Glass, 2011; Rowe, 2012).
For calibration by manual integration of peaks, different concentrations of
paracetamol at 20, 30, 40, 60 70, 80 and 90% w/w in magnesium stearate were
prepared mixing paracetamol and the excipient for 120 seconds. For the
API/excipient mixtures, a uniform total weight of 200mg was measured each
time. These concentrations covered the different dosages in common over-the-
counter medicines. Calibration curves based on the recorded spectra of the
paracetamol/excipient mixtures were prepared by determining the areas under
the paracetamol peaks where there was no contribution from the excipients
using the manual Integration facility on the OPUS 7.5 software. The final result
was the mean of three separate runs per sample.
The same protocol was followed for preparation of paracetamol/ excipient
mixture for calibration using the automatic Quant 2 method but concentrations of
paracetamol at 10.0%, 20.0%, 30.0%, 50.0%, 70.0% and 90.0% w/w in maize
starch, MCC and magnesium stearate respectively were prepared. Calibration
data was generated for the different paracetamol concentrations in the three
79 | P a g e
excipients considered. Final results were the mean of five replicate runs per
sample.
3.2.4.2.2 Chloroquine calibration
Quant 2 methods based on validated data from paracetamol analysis were
adopted for analysis of chloroquine tablets. Different concentrations of
chloroquine in maize starch (10.0%, 30.0%, 50.0%, 60.0%, 70.0% and 90.0%
w/w) were prepared by mixing chloroquine in maize starch for 120 seconds.
Maize starch was used as the only excipient for analysis of chloroquine tablets
as it was identified to produce more accurate and reproducible results in the
analysis of paracetamol tablets. Areas under characteristic peaks for chloroquine
were determined for the calibration curve using the Quant 2 application on the
software. The automatic Quant 2 application on the software was the only
approach used for chloroquine analysis since it was quicker and gave more
reproducible results for paracetamol tablet analysis making it more efficient.
Furthermore, considering good reproducibility obtained for paracetamol studies
three separate runs were performed per chloroquine sample. Hence, final results
were the mean of three separate runs.
3.2.4.3 Preparation of test tablets- Qualitative analyses
Individual tablet samples were taken out of their blister packs and placed on to the
diamond crystal on the sampling head of the ATR unit. Measurement was done using
the same parameters as with the reference spectra in section 3.2.4.1. Several points
on each side of the tablet were assessed with spectral data recorded each time in
order to investigate reproducibility and to check if the presence of the API could be
confirmed based on the data.
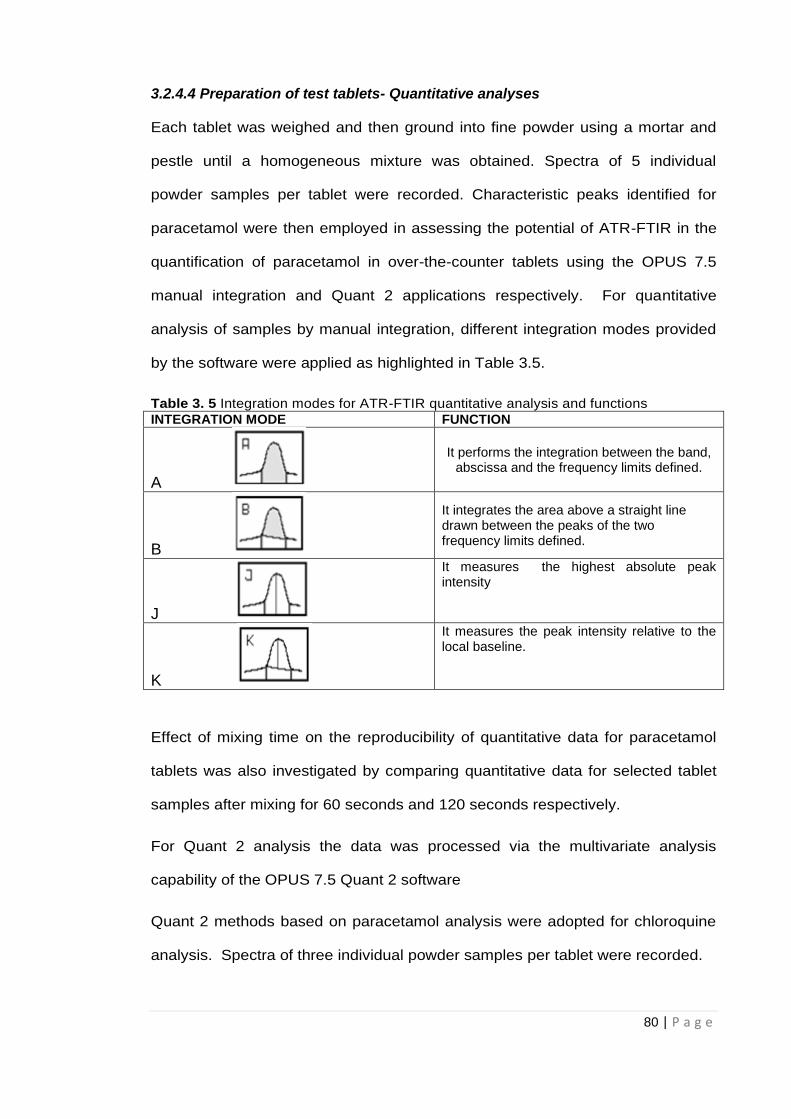
80 | P a g e
3.2.4.4 Preparation of test tablets- Quantitative analyses
Each tablet was weighed and then ground into fine powder using a mortar and
pestle until a homogeneous mixture was obtained. Spectra of 5 individual
powder samples per tablet were recorded. Characteristic peaks identified for
paracetamol were then employed in assessing the potential of ATR-FTIR in the
quantification of paracetamol in over-the-counter tablets using the OPUS 7.5
manual integration and Quant 2 applications respectively. For quantitative
analysis of samples by manual integration, different integration modes provided
by the software were applied as highlighted in Table 3.5.
Table 3. 5 Integration modes for ATR-FTIR quantitative analysis and functions
INTEGRATION MODE FUNCTION
A
It performs the integration between the band, abscissa and the frequency limits defined.
B
It integrates the area above a straight line drawn between the peaks of the two frequency limits defined.
J
It measures the highest absolute peak intensity
K
It measures the peak intensity relative to the local baseline.
Effect of mixing time on the reproducibility of quantitative data for paracetamol
tablets was also investigated by comparing quantitative data for selected tablet
samples after mixing for 60 seconds and 120 seconds respectively.
For Quant 2 analysis the data was processed via the multivariate analysis
capability of the OPUS 7.5 Quant 2 software
Quant 2 methods based on paracetamol analysis were adopted for chloroquine
analysis. Spectra of three individual powder samples per tablet were recorded.
81 | P a g e
For both paracetamol and chloroquine analysis;
Measured levels of API were indicative of the percentage amount of API in
tablet. The relationship between the results in % w/w and the actual dosage can
be expressed as:
Actual Dosage of API in tablet (mg) = R x W
Where R= Concentration of API in % w/w and W= Total weight of the tablet (mg)
The levels of paracetamol and chloroquine in tablet medication obtained from the
UK and several countries around the globe were then determined based on data
obtained from the calibration mixtures.
3.3. Results and Discussion
3.3.1 Reference Spectra
Reference samples for several APIs were recorded as part of the local ATR-FTIR
library created. Fig 3.2 (a) and (b) are the reference spectra for paracetamol and
chloroquine respectively. These spectra saved in the reference library could then be
used for identification purposes by the Spectrum search capability in the OPUS 7.5
software. If the spectral fingerprint of a test sample matched the reference wholly or in
part the sample could be said to contain the same reference material. Reference
spectra for other APIs are outlined in Figs 3.3 (a, b) and 3.4. (a, b). Fig 3.4(a) and
3.4(b) are artemether and artesunate which are artemisinin derivatives used as
antimalarials. The obvious similarity in their spectra suggests that they belong to the
same family of compounds or that they have similar structure. In addition, Fig 3.5
shows the spectra of different excipient groups (stearates, celluloses and starches) and
the similarity between individual spectra within each group.
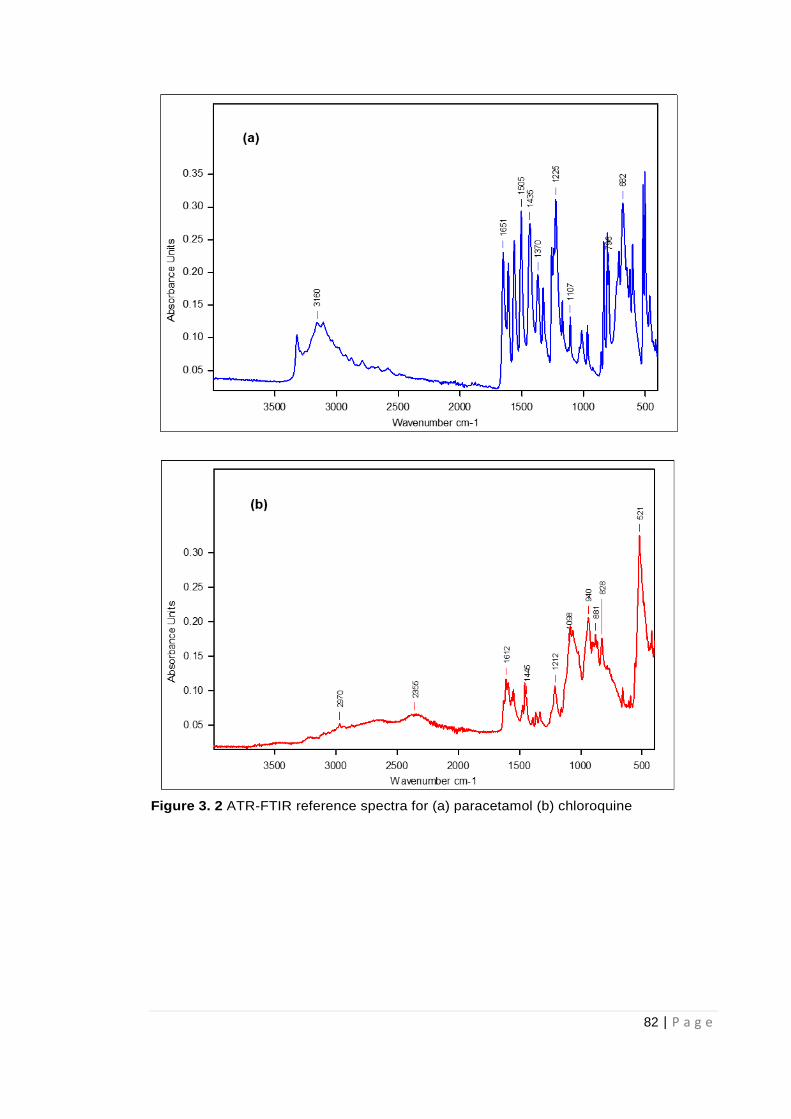
82 | P a g e
Figure 3. 2 ATR-FTIR reference spectra for (a) paracetamol (b) chloroquine
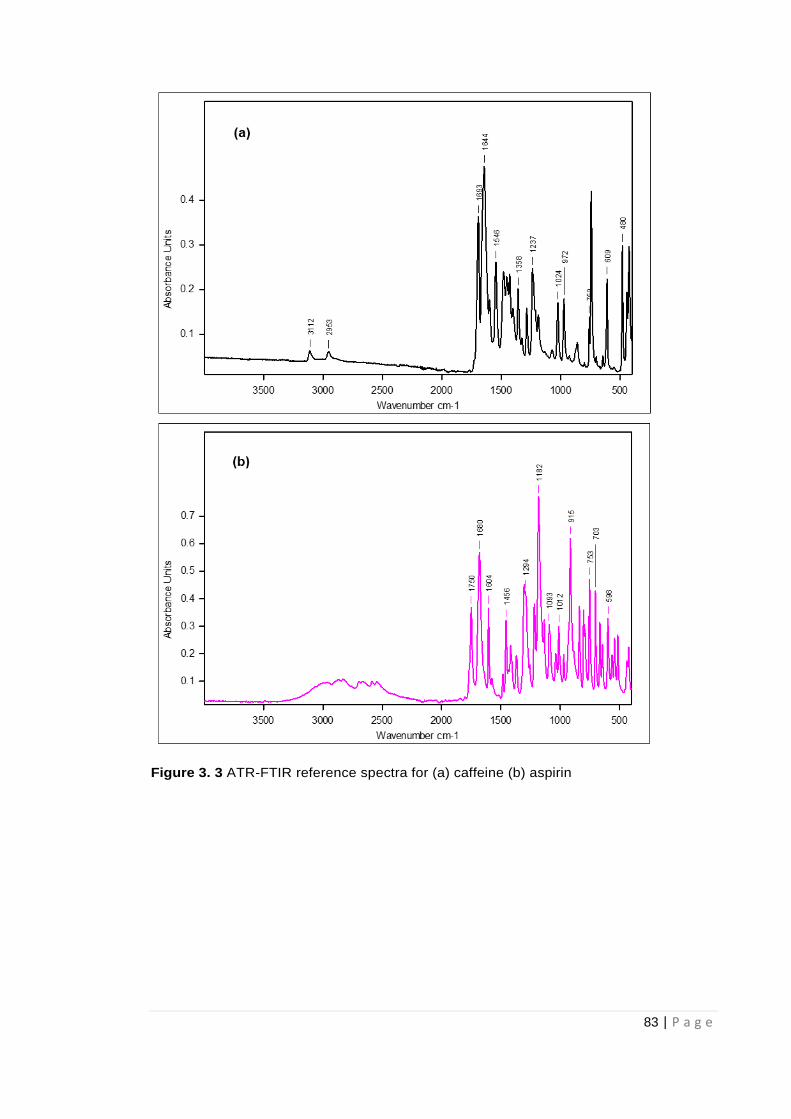
83 | P a g e
Figure 3. 3 ATR-FTIR reference spectra for (a) caffeine (b) aspirin
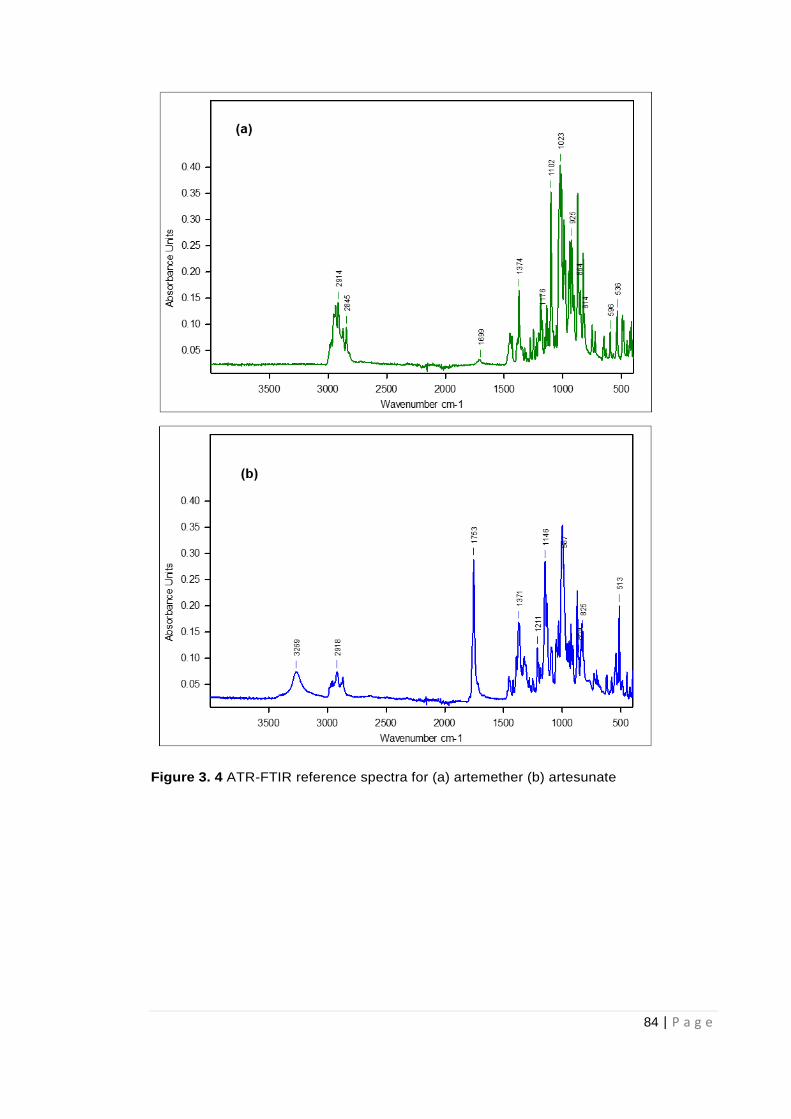
84 | P a g e
Figure 3. 4 ATR-FTIR reference spectra for (a) artemether (b) artesunate

85 | P a g e
Figure 3. 5 Comparing members of the same excipient group (a) Stearates: magnesium stearate (Blue), calcium stearate (Red), zinc stearate (Black) (b) Celluloses: microcrystalline celluose (Blue), carboxymethyl cellulose (Red), methylcellulose (Black) (c) Starches: maize starch (Blue), potato starch (Red), sodium starch glycolate (Black)
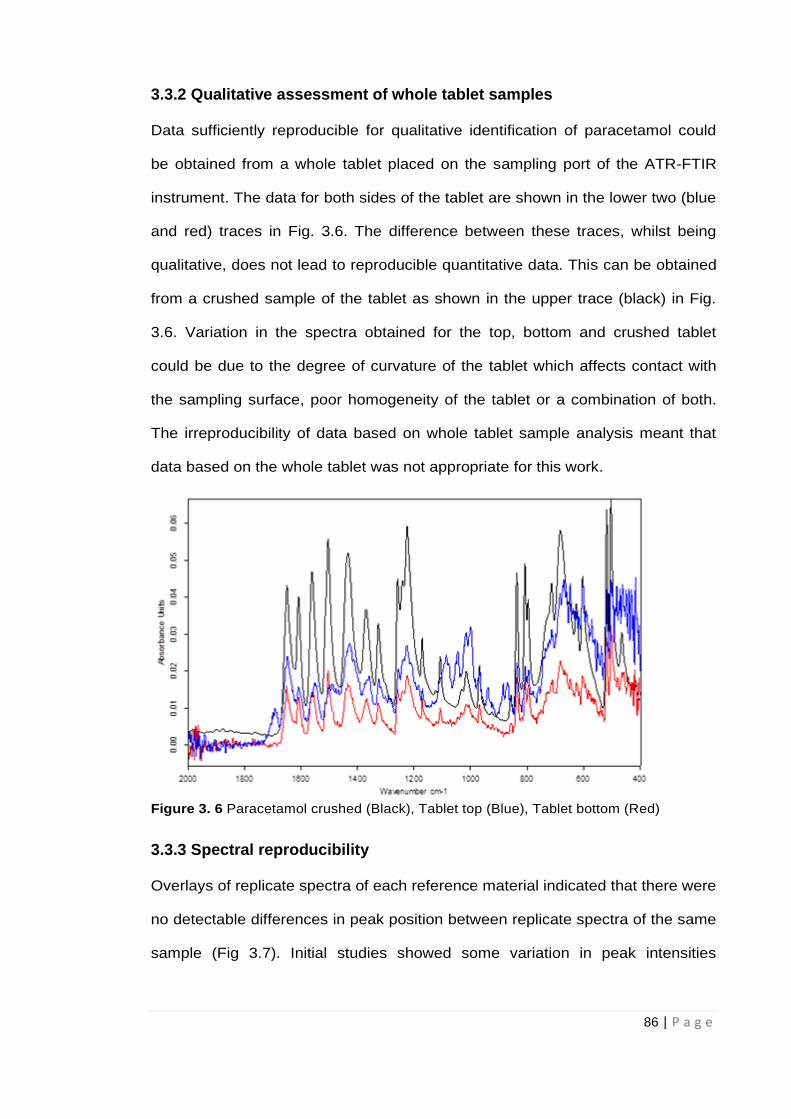
86 | P a g e
3.3.2 Qualitative assessment of whole tablet samples
Data sufficiently reproducible for qualitative identification of paracetamol could
be obtained from a whole tablet placed on the sampling port of the ATR-FTIR
instrument. The data for both sides of the tablet are shown in the lower two (blue
and red) traces in Fig. 3.6. The difference between these traces, whilst being
qualitative, does not lead to reproducible quantitative data. This can be obtained
from a crushed sample of the tablet as shown in the upper trace (black) in Fig.
3.6. Variation in the spectra obtained for the top, bottom and crushed tablet
could be due to the degree of curvature of the tablet which affects contact with
the sampling surface, poor homogeneity of the tablet or a combination of both.
The irreproducibility of data based on whole tablet sample analysis meant that
data based on the whole tablet was not appropriate for this work.
Figure 3. 6 Paracetamol crushed (Black), Tablet top (Blue), Tablet bottom (Red)
3.3.3 Spectral reproducibility
Overlays of replicate spectra of each reference material indicated that there were
no detectable differences in peak position between replicate spectra of the same
sample (Fig 3.7). Initial studies showed some variation in peak intensities
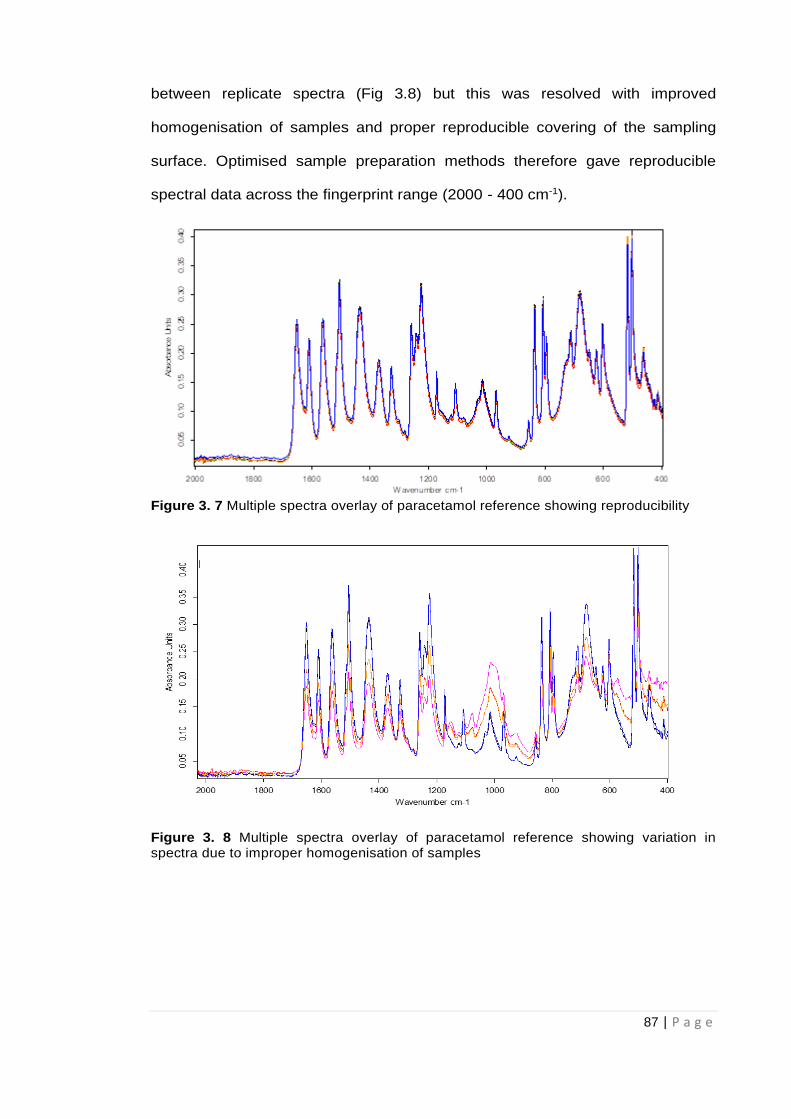
87 | P a g e
between replicate spectra (Fig 3.8) but this was resolved with improved
homogenisation of samples and proper reproducible covering of the sampling
surface. Optimised sample preparation methods therefore gave reproducible
spectral data across the fingerprint range (2000 - 400 cm-1).
Figure 3. 7 Multiple spectra overlay of paracetamol reference showing reproducibility
Figure 3. 8 Multiple spectra overlay of paracetamol reference showing variation in spectra due to improper homogenisation of samples
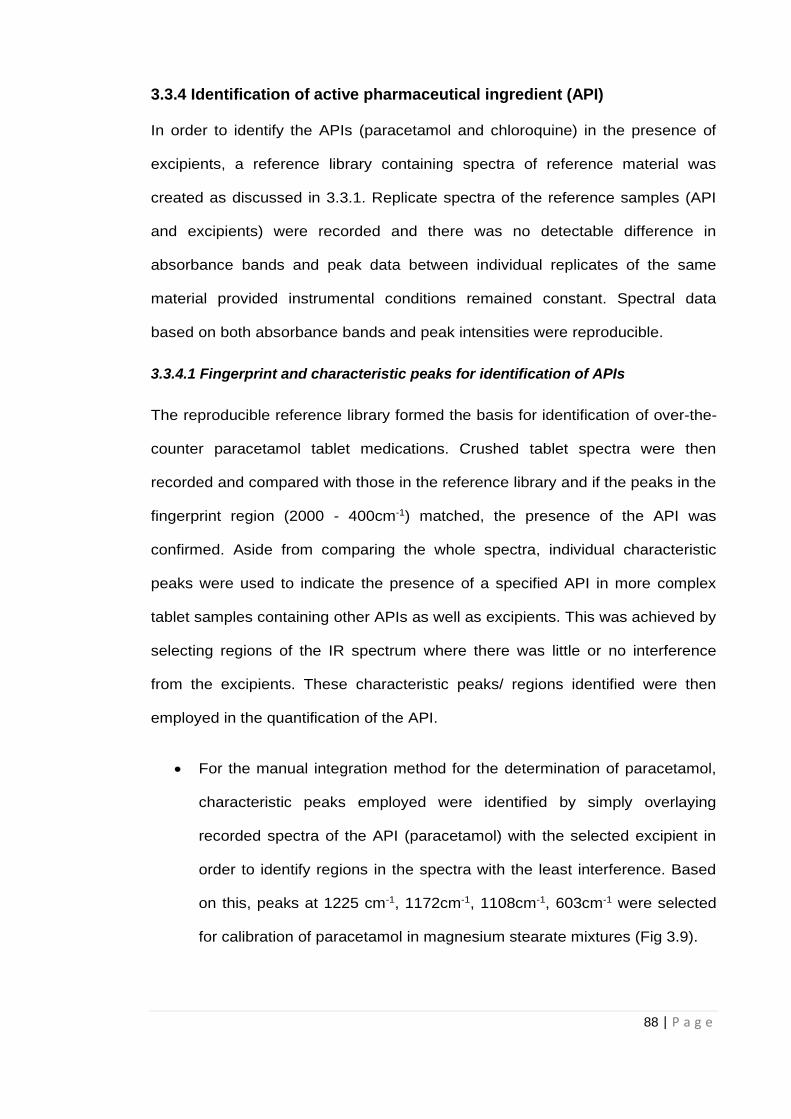
88 | P a g e
3.3.4 Identification of active pharmaceutical ingredient (API)
In order to identify the APIs (paracetamol and chloroquine) in the presence of
excipients, a reference library containing spectra of reference material was
created as discussed in 3.3.1. Replicate spectra of the reference samples (API
and excipients) were recorded and there was no detectable difference in
absorbance bands and peak data between individual replicates of the same
material provided instrumental conditions remained constant. Spectral data
based on both absorbance bands and peak intensities were reproducible.
3.3.4.1 Fingerprint and characteristic peaks for identification of APIs
The reproducible reference library formed the basis for identification of over-the-
counter paracetamol tablet medications. Crushed tablet spectra were then
recorded and compared with those in the reference library and if the peaks in the
fingerprint region (2000 - 400cm-1) matched, the presence of the API was
confirmed. Aside from comparing the whole spectra, individual characteristic
peaks were used to indicate the presence of a specified API in more complex
tablet samples containing other APIs as well as excipients. This was achieved by
selecting regions of the IR spectrum where there was little or no interference
from the excipients. These characteristic peaks/ regions identified were then
employed in the quantification of the API.
For the manual integration method for the determination of paracetamol,
characteristic peaks employed were identified by simply overlaying
recorded spectra of the API (paracetamol) with the selected excipient in
order to identify regions in the spectra with the least interference. Based
on this, peaks at 1225 cm-1, 1172cm-1, 1108cm-1, 603cm-1 were selected
for calibration of paracetamol in magnesium stearate mixtures (Fig 3.9).
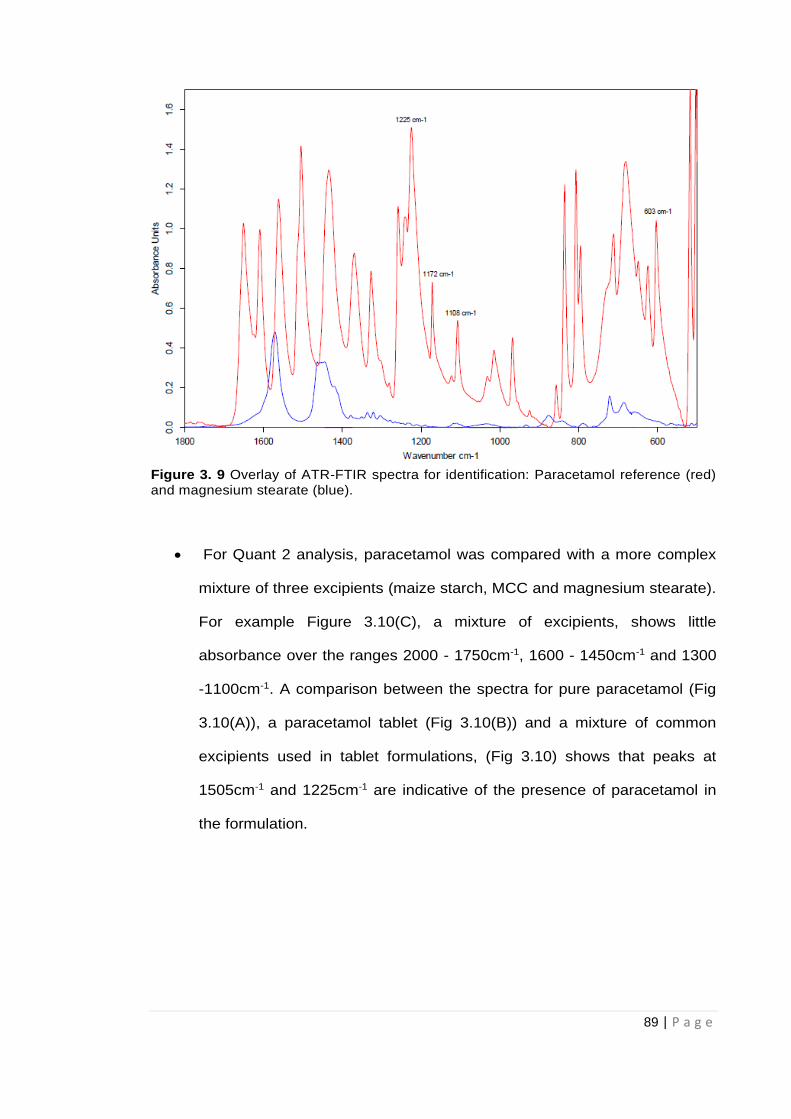
89 | P a g e
Figure 3. 9 Overlay of ATR-FTIR spectra for identification: Paracetamol reference (red) and magnesium stearate (blue).
For Quant 2 analysis, paracetamol was compared with a more complex
mixture of three excipients (maize starch, MCC and magnesium stearate).
For example Figure 3.10(C), a mixture of excipients, shows little
absorbance over the ranges 2000 - 1750cm-1, 1600 - 1450cm-1 and 1300
-1100cm-1. A comparison between the spectra for pure paracetamol (Fig
3.10(A)), a paracetamol tablet (Fig 3.10(B)) and a mixture of common
excipients used in tablet formulations, (Fig 3.10) shows that peaks at
1505cm-1 and 1225cm-1 are indicative of the presence of paracetamol in
the formulation.
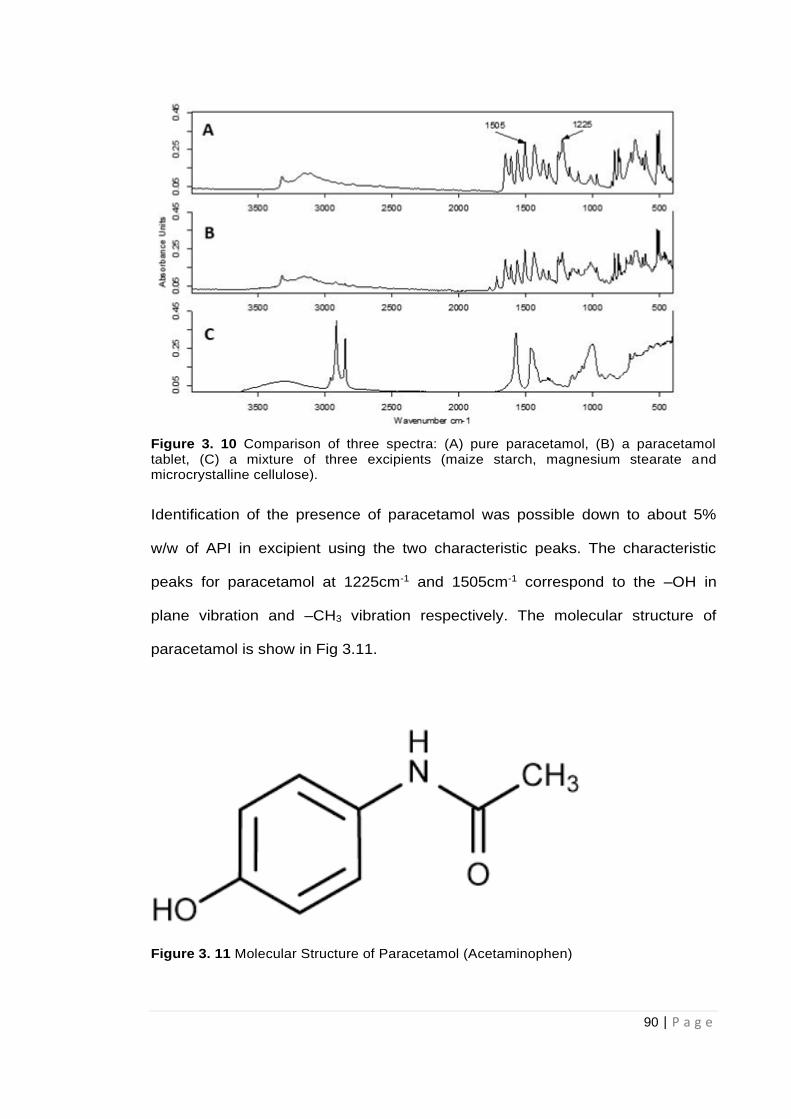
90 | P a g e
Figure 3. 10 Comparison of three spectra: (A) pure paracetamol, (B) a paracetamol tablet, (C) a mixture of three excipients (maize starch, magnesium stearate and microcrystalline cellulose).
Identification of the presence of paracetamol was possible down to about 5%
w/w of API in excipient using the two characteristic peaks. The characteristic
peaks for paracetamol at 1225cm-1 and 1505cm-1 correspond to the –OH in
plane vibration and –CH3 vibration respectively. The molecular structure of
paracetamol is show in Fig 3.11.
Figure 3. 11 Molecular Structure of Paracetamol (Acetaminophen)
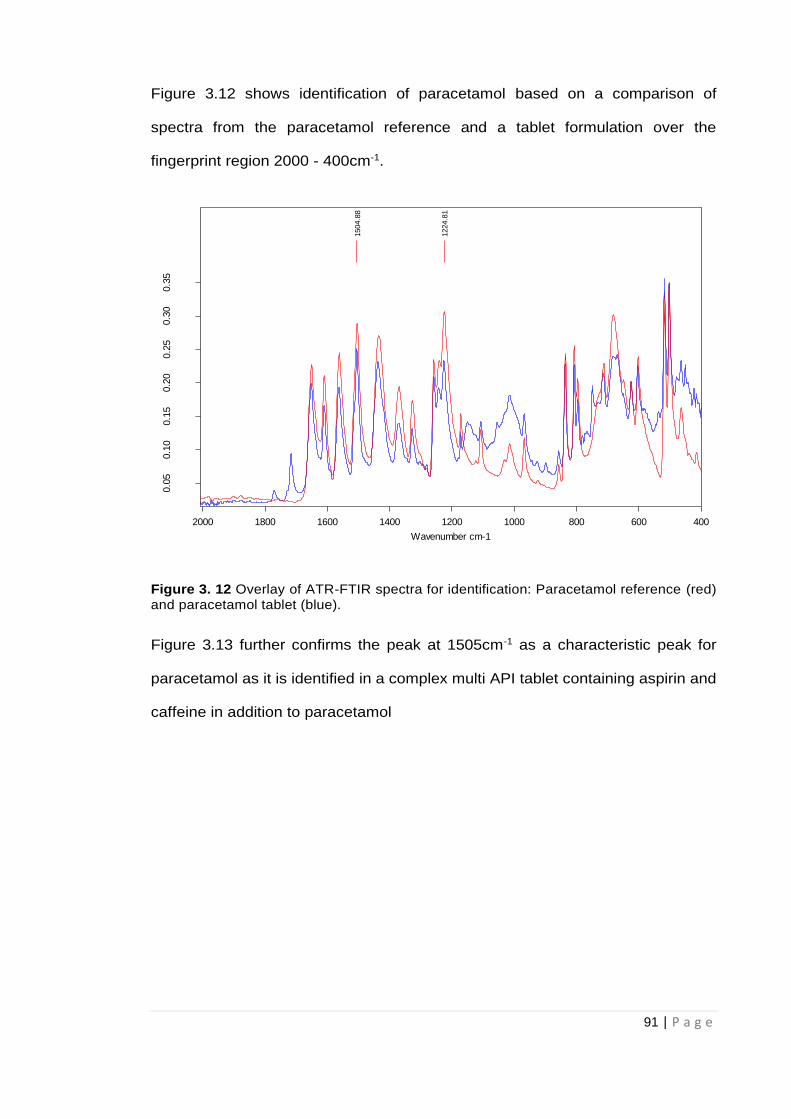
91 | P a g e
Figure 3.12 shows identification of paracetamol based on a comparison of
spectra from the paracetamol reference and a tablet formulation over the
fingerprint region 2000 - 400cm-1.
Figure 3. 12 Overlay of ATR-FTIR spectra for identification: Paracetamol reference (red) and paracetamol tablet (blue).
Figure 3.13 further confirms the peak at 1505cm-1 as a characteristic peak for
paracetamol as it is identified in a complex multi API tablet containing aspirin and
caffeine in addition to paracetamol
F:\JOHN\11022015\PARA 100% 1.0 PARA 100% 1
F:\JOHN\06082014\PARA THARF 2B.0 PARA THARF 2B
11/19/2014
8/6/2014
1504.8
8
1224.8
1
400600800100012001400160018002000
Wavenumber cm-1
0.0
50.1
00.1
50.2
00.2
50.3
00.3
5
Absorb
ance U
nits
Page 1/1
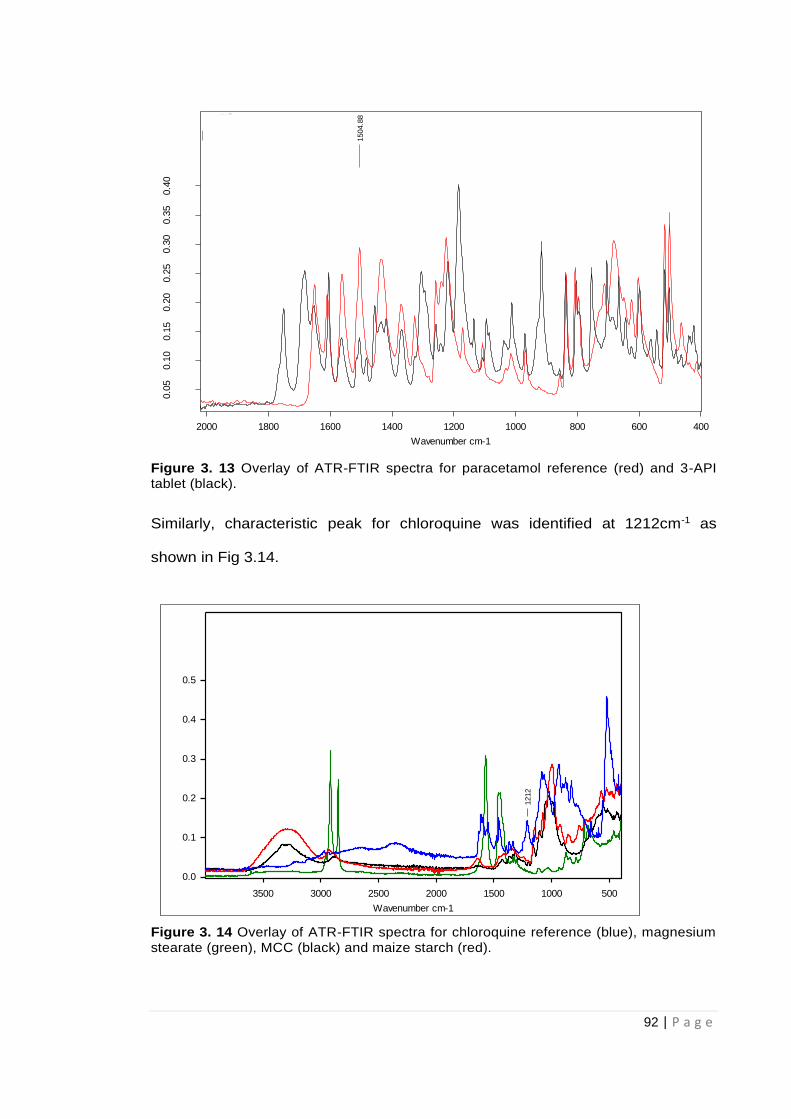
92 | P a g e
Figure 3. 13 Overlay of ATR-FTIR spectra for paracetamol reference (red) and 3-API tablet (black).
Similarly, characteristic peak for chloroquine was identified at 1212cm-1 as
shown in Fig 3.14.
Figure 3. 14 Overlay of ATR-FTIR spectra for chloroquine reference (blue), magnesium stearate (green), MCC (black) and maize starch (red).
C:\Documents and Settings\Administrator\Desktop\Research\JOHN\11022015\PARA 100% 1.0 PARA 100% 1
C:\Documents and Settings\Administrator\Desktop\Research\JOHN\18112015\ANADIN 3.0 ANADIN 3
19/11/2014
18/11/2015
1504.8
8
400600800100012001400160018002000
Wavenumber cm-1
0.0
50.1
00.1
50.2
00.2
50.3
00.3
50.4
0
Absorb
ance U
nits
Page 1/1
SAMP CHOLO2
1212
500100015002000250030003500
Wavenumber cm-1
0.0
0.1
0.2
0.3
0.4
0.5
Absorb
ance U
nits
C:\Users\as104\Desktop\UNDERGRAD 2017-2018\PROJECTS\PHAR4602 PR0JECT STUDENTS\NAISARGI JOSHI\WEEK 2 22112017\SAMP CHOLO2.0 17/08/2018 19:12:44
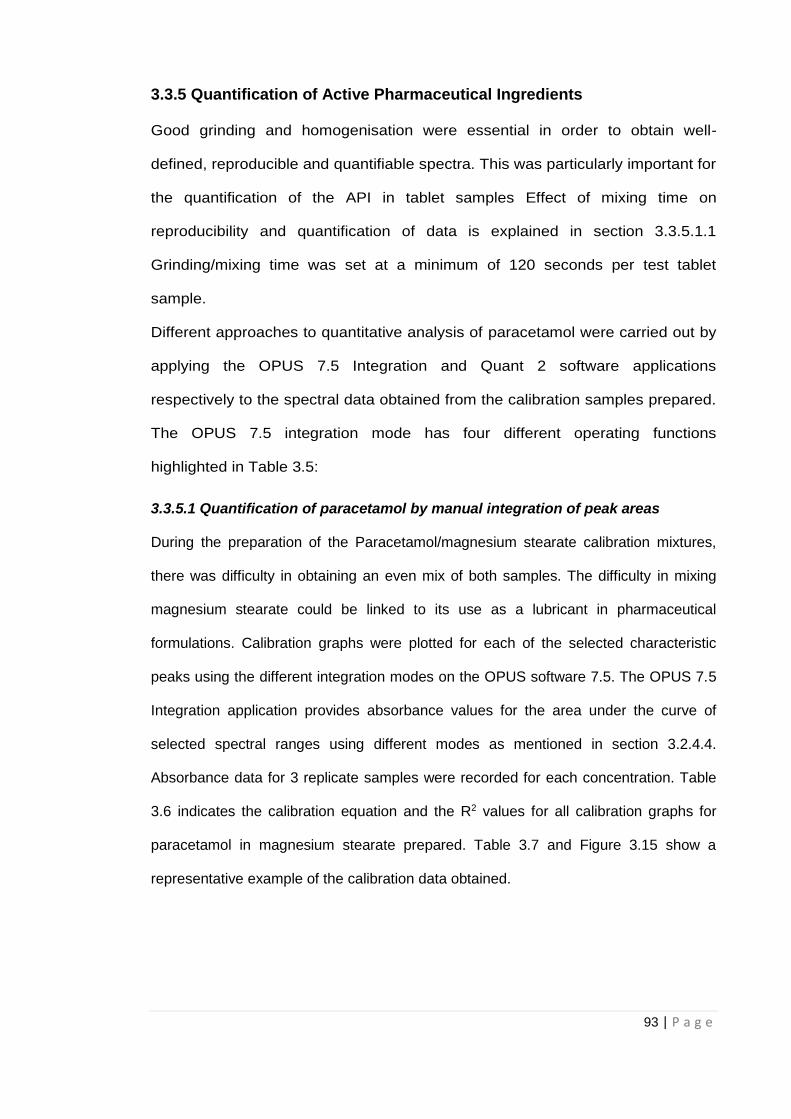
93 | P a g e
3.3.5 Quantification of Active Pharmaceutical Ingredients
Good grinding and homogenisation were essential in order to obtain well-
defined, reproducible and quantifiable spectra. This was particularly important for
the quantification of the API in tablet samples Effect of mixing time on
reproducibility and quantification of data is explained in section 3.3.5.1.1
Grinding/mixing time was set at a minimum of 120 seconds per test tablet
sample.
Different approaches to quantitative analysis of paracetamol were carried out by
applying the OPUS 7.5 Integration and Quant 2 software applications
respectively to the spectral data obtained from the calibration samples prepared.
The OPUS 7.5 integration mode has four different operating functions
highlighted in Table 3.5:
3.3.5.1 Quantification of paracetamol by manual integration of peak areas
During the preparation of the Paracetamol/magnesium stearate calibration mixtures,
there was difficulty in obtaining an even mix of both samples. The difficulty in mixing
magnesium stearate could be linked to its use as a lubricant in pharmaceutical
formulations. Calibration graphs were plotted for each of the selected characteristic
peaks using the different integration modes on the OPUS software 7.5. The OPUS 7.5
Integration application provides absorbance values for the area under the curve of
selected spectral ranges using different modes as mentioned in section 3.2.4.4.
Absorbance data for 3 replicate samples were recorded for each concentration. Table
3.6 indicates the calibration equation and the R2 values for all calibration graphs for
paracetamol in magnesium stearate prepared. Table 3.7 and Figure 3.15 show a
representative example of the calibration data obtained.
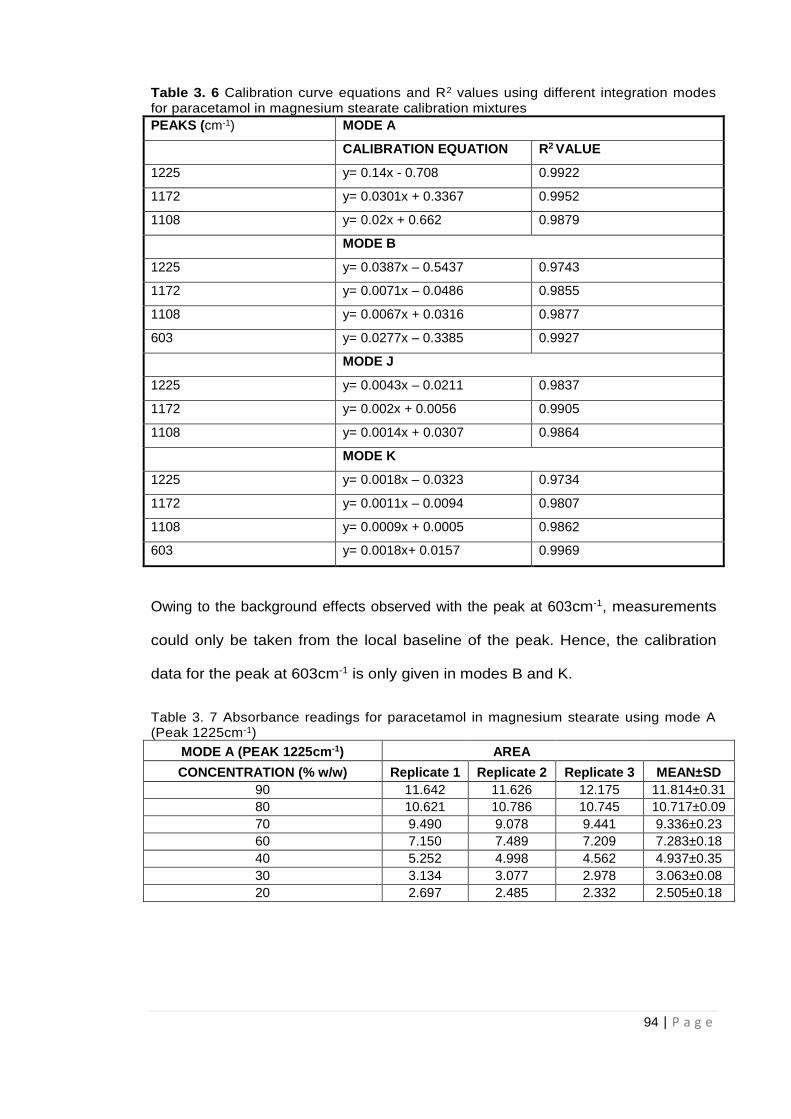
94 | P a g e
Table 3. 6 Calibration curve equations and R2 values using different integration modes for paracetamol in magnesium stearate calibration mixtures
PEAKS (cm-1) MODE A
CALIBRATION EQUATION R2 VALUE
1225 y= 0.14x - 0.708 0.9922
1172 y= 0.0301x + 0.3367 0.9952
1108 y= 0.02x + 0.662 0.9879
MODE B
1225 y= 0.0387x – 0.5437 0.9743
1172 y= 0.0071x – 0.0486 0.9855
1108 y= 0.0067x + 0.0316 0.9877
603 y= 0.0277x – 0.3385 0.9927
MODE J
1225 y= 0.0043x – 0.0211 0.9837
1172 y= 0.002x + 0.0056 0.9905
1108 y= 0.0014x + 0.0307 0.9864
MODE K
1225 y= 0.0018x – 0.0323 0.9734
1172 y= 0.0011x – 0.0094 0.9807
1108 y= 0.0009x + 0.0005 0.9862
603 y= 0.0018x+ 0.0157 0.9969
Owing to the background effects observed with the peak at 603cm-1, measurements
could only be taken from the local baseline of the peak. Hence, the calibration
data for the peak at 603cm-1 is only given in modes B and K.
Table 3. 7 Absorbance readings for paracetamol in magnesium stearate using mode A (Peak 1225cm-1)
MODE A (PEAK 1225cm-1)
AREA
CONCENTRATION (% w/w) Replicate 1 Replicate 2 Replicate 3 MEAN±SD
90 11.642 11.626 12.175 11.814±0.31
80 10.621 10.786 10.745 10.717±0.09
70 9.490 9.078 9.441 9.336±0.23
60 7.150 7.489 7.209 7.283±0.18
40 5.252 4.998 4.562 4.937±0.35
30 3.134 3.077 2.978 3.063±0.08
20 2.697 2.485 2.332 2.505±0.18
95 | P a g e
Figure 3. 15 Calibration curve for paracetamol in magnesium stearate at 1225cm‾¹ using mode A (Data represents the mean±SD of 3 replicate samples).
Calibration data in Fig 3.15 indicates the reproducibility of the data obtained with a high
correlation coefficient of 0.99. Similar results were obtained for calibration based on the
characteristic peaks identified and the different integration modes as highlighted in
Table 3.6. Correlation coefficients for all calibration curves were between 0.97 and 0.99
showing linearity of the data. Calibration equations were then used in working out the
concentration of paracetamol in selected tablets (in % w/w).
3.3.5.1.1 Effect of grinding/ mixing on the quantification of paracetamol tablet samples
The effect of mixing time for crushed tablet samples on the quantification data for
paracetamol tablets was assessed by mixing paracetamol tablets for 60 seconds and
120 seconds respectively It was observed that good grinding/mixing to obtain fine
powder was essential in the quantification of the API in the tablet samples.
Grinding/mixing time of the tablet samples also had an impact on the final results
obtained as shown graphically in Fig. 3.16a and 3.16b.
y = 0.14x - 0.708R² = 0.9922
0.000
2.000
4.000
6.000
8.000
10.000
12.000
14.000
0 20 40 60 80 100
ME
AN
PE
AK
AR
EA
Paracetamol Concentration (% w/w)
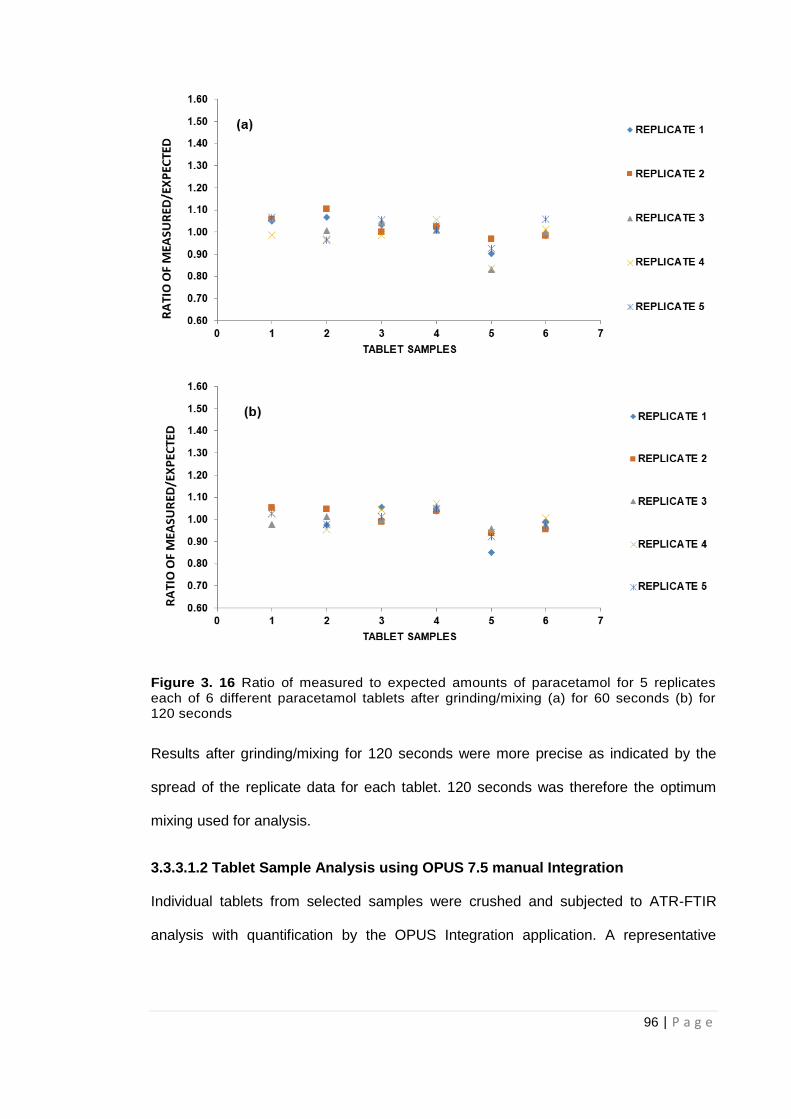
96 | P a g e
Figure 3. 16 Ratio of measured to expected amounts of paracetamol for 5 replicates each of 6 different paracetamol tablets after grinding/mixing (a) for 60 seconds (b) for 120 seconds
Results after grinding/mixing for 120 seconds were more precise as indicated by the
spread of the replicate data for each tablet. 120 seconds was therefore the optimum
mixing used for analysis.
3.3.3.1.2 Tablet Sample Analysis using OPUS 7.5 manual Integration
Individual tablets from selected samples were crushed and subjected to ATR-FTIR
analysis with quantification by the OPUS Integration application. A representative
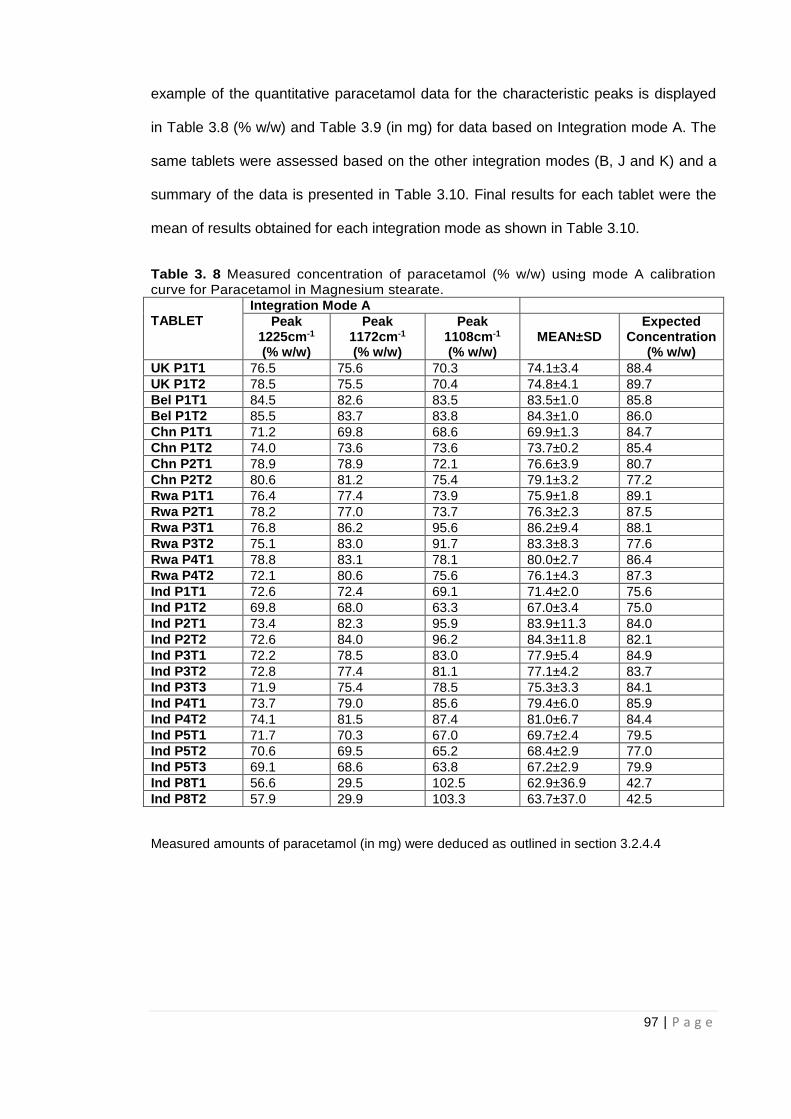
97 | P a g e
example of the quantitative paracetamol data for the characteristic peaks is displayed
in Table 3.8 (% w/w) and Table 3.9 (in mg) for data based on Integration mode A. The
same tablets were assessed based on the other integration modes (B, J and K) and a
summary of the data is presented in Table 3.10. Final results for each tablet were the
mean of results obtained for each integration mode as shown in Table 3.10.
Table 3. 8 Measured concentration of paracetamol (% w/w) using mode A calibration curve for Paracetamol in Magnesium stearate.
TABLET
Integration Mode A
Peak 1225cm-1 (% w/w)
Peak 1172cm-1 (% w/w)
Peak 1108cm-1 (% w/w)
MEAN±SD Expected
Concentration (% w/w)
UK P1T1 76.5 75.6 70.3 74.1±3.4 88.4
UK P1T2 78.5 75.5 70.4 74.8±4.1 89.7
Bel P1T1 84.5 82.6 83.5 83.5±1.0 85.8
Bel P1T2 85.5 83.7 83.8 84.3±1.0 86.0
Chn P1T1 71.2 69.8 68.6 69.9±1.3 84.7
Chn P1T2 74.0 73.6 73.6 73.7±0.2 85.4
Chn P2T1 78.9 78.9 72.1 76.6±3.9 80.7
Chn P2T2 80.6 81.2 75.4 79.1±3.2 77.2
Rwa P1T1 76.4 77.4 73.9 75.9±1.8 89.1
Rwa P2T1 78.2 77.0 73.7 76.3±2.3 87.5
Rwa P3T1 76.8 86.2 95.6 86.2±9.4 88.1
Rwa P3T2 75.1 83.0 91.7 83.3±8.3 77.6
Rwa P4T1 78.8 83.1 78.1 80.0±2.7 86.4
Rwa P4T2 72.1 80.6 75.6 76.1±4.3 87.3
Ind P1T1 72.6 72.4 69.1 71.4±2.0 75.6
Ind P1T2 69.8 68.0 63.3 67.0±3.4 75.0
Ind P2T1 73.4 82.3 95.9 83.9±11.3 84.0
Ind P2T2 72.6 84.0 96.2 84.3±11.8 82.1
Ind P3T1 72.2 78.5 83.0 77.9±5.4 84.9
Ind P3T2 72.8 77.4 81.1 77.1±4.2 83.7
Ind P3T3 71.9 75.4 78.5 75.3±3.3 84.1
Ind P4T1 73.7 79.0 85.6 79.4±6.0 85.9
Ind P4T2 74.1 81.5 87.4 81.0±6.7 84.4
Ind P5T1 71.7 70.3 67.0 69.7±2.4 79.5
Ind P5T2 70.6 69.5 65.2 68.4±2.9 77.0
Ind P5T3 69.1 68.6 63.8 67.2±2.9 79.9
Ind P8T1 56.6 29.5 102.5 62.9±36.9 42.7
Ind P8T2 57.9 29.9 103.3 63.7±37.0 42.5
Measured amounts of paracetamol (in mg) were deduced as outlined in section 3.2.4.4
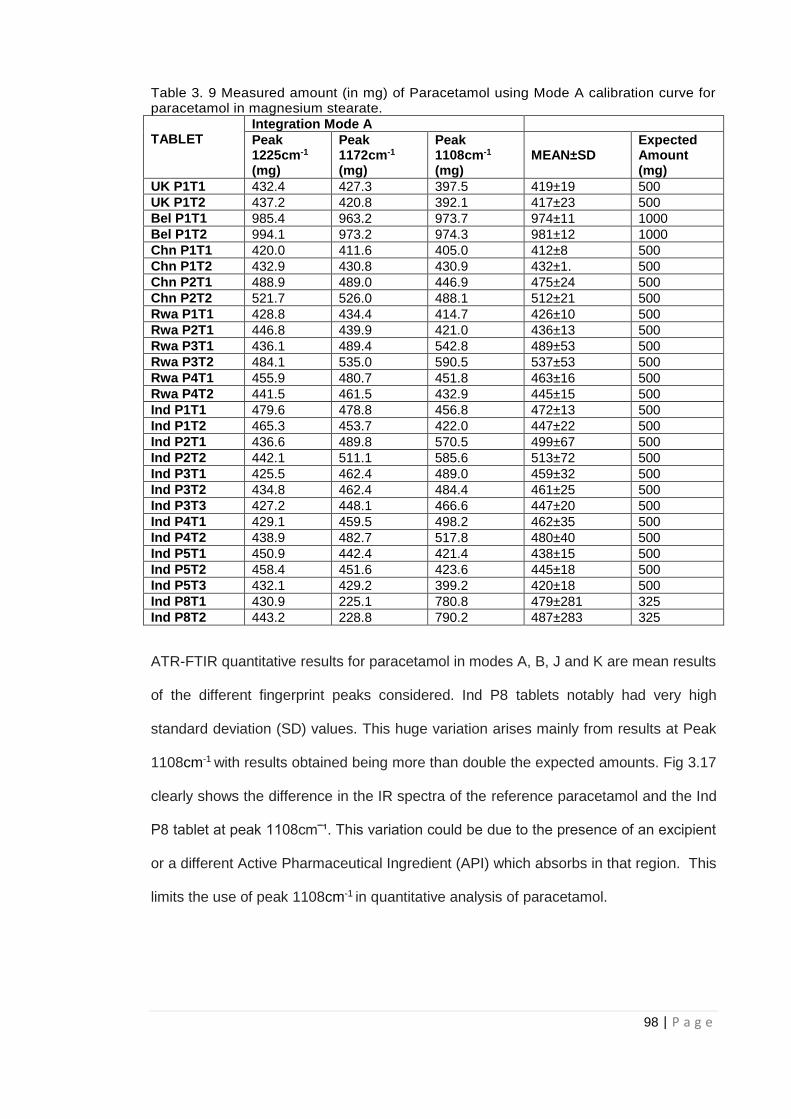
98 | P a g e
Table 3. 9 Measured amount (in mg) of Paracetamol using Mode A calibration curve for paracetamol in magnesium stearate.
TABLET
Integration Mode A
Peak 1225cm-1
(mg)
Peak 1172cm-1
(mg)
Peak 1108cm-1
(mg)
MEAN±SD
Expected Amount (mg)
UK P1T1 432.4 427.3 397.5 419±19 500
UK P1T2 437.2 420.8 392.1 417±23 500
Bel P1T1 985.4 963.2 973.7 974±11 1000
Bel P1T2 994.1 973.2 974.3 981±12 1000
Chn P1T1 420.0 411.6 405.0 412±8 500
Chn P1T2 432.9 430.8 430.9 432±1. 500
Chn P2T1 488.9 489.0 446.9 475±24 500
Chn P2T2 521.7 526.0 488.1 512±21 500
Rwa P1T1 428.8 434.4 414.7 426±10 500
Rwa P2T1 446.8 439.9 421.0 436±13 500
Rwa P3T1 436.1 489.4 542.8 489±53 500
Rwa P3T2 484.1 535.0 590.5 537±53 500
Rwa P4T1 455.9 480.7 451.8 463±16 500
Rwa P4T2 441.5 461.5 432.9 445±15 500
Ind P1T1 479.6 478.8 456.8 472±13 500
Ind P1T2 465.3 453.7 422.0 447±22 500
Ind P2T1 436.6 489.8 570.5 499±67 500
Ind P2T2 442.1 511.1 585.6 513±72 500
Ind P3T1 425.5 462.4 489.0 459±32 500
Ind P3T2 434.8 462.4 484.4 461±25 500
Ind P3T3 427.2 448.1 466.6 447±20 500
Ind P4T1 429.1 459.5 498.2 462±35 500
Ind P4T2 438.9 482.7 517.8 480±40 500
Ind P5T1 450.9 442.4 421.4 438±15 500
Ind P5T2 458.4 451.6 423.6 445±18 500
Ind P5T3 432.1 429.2 399.2 420±18 500
Ind P8T1 430.9 225.1 780.8 479±281 325
Ind P8T2 443.2 228.8 790.2 487±283 325
ATR-FTIR quantitative results for paracetamol in modes A, B, J and K are mean results
of the different fingerprint peaks considered. Ind P8 tablets notably had very high
standard deviation (SD) values. This huge variation arises mainly from results at Peak
1108cm-1 with results obtained being more than double the expected amounts. Fig 3.17
clearly shows the difference in the IR spectra of the reference paracetamol and the Ind
P8 tablet at peak 1108cm‾¹. This variation could be due to the presence of an excipient
or a different Active Pharmaceutical Ingredient (API) which absorbs in that region. This
limits the use of peak 1108cm-1 in quantitative analysis of paracetamol.
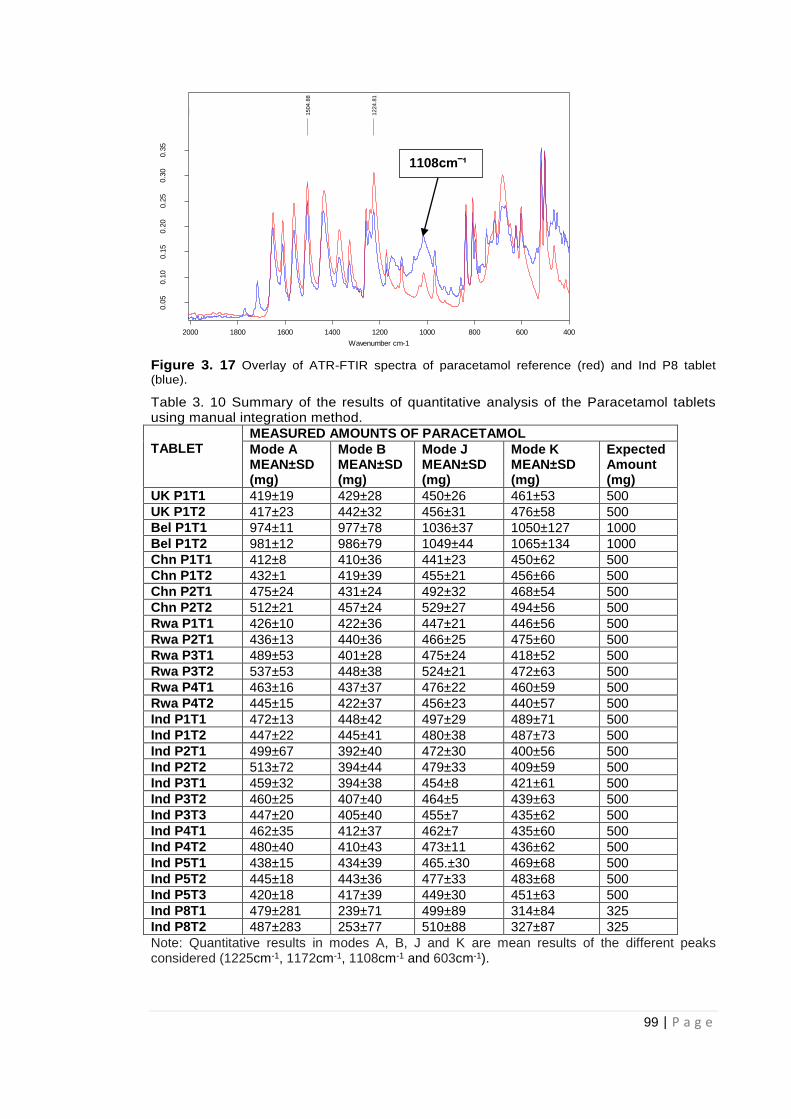
99 | P a g e
Figure 3. 17 Overlay of ATR-FTIR spectra of paracetamol reference (red) and Ind P8 tablet
(blue).
Table 3. 10 Summary of the results of quantitative analysis of the Paracetamol tablets using manual integration method.
TABLET
MEASURED AMOUNTS OF PARACETAMOL
Mode A MEAN±SD (mg)
Mode B MEAN±SD (mg)
Mode J MEAN±SD (mg)
Mode K MEAN±SD (mg)
Expected Amount (mg)
UK P1T1 419±19 429±28 450±26 461±53 500
UK P1T2 417±23 442±32 456±31 476±58 500
Bel P1T1 974±11 977±78 1036±37 1050±127 1000
Bel P1T2 981±12 986±79 1049±44 1065±134 1000
Chn P1T1 412±8 410±36 441±23 450±62 500
Chn P1T2 432±1 419±39 455±21 456±66 500
Chn P2T1 475±24 431±24 492±32 468±54 500
Chn P2T2 512±21 457±24 529±27 494±56 500
Rwa P1T1 426±10 422±36 447±21 446±56 500
Rwa P2T1 436±13 440±36 466±25 475±60 500
Rwa P3T1 489±53 401±28 475±24 418±52 500
Rwa P3T2 537±53 448±38 524±21 472±63 500
Rwa P4T1 463±16 437±37 476±22 460±59 500
Rwa P4T2 445±15 422±37 456±23 440±57 500
Ind P1T1 472±13 448±42 497±29 489±71 500
Ind P1T2 447±22 445±41 480±38 487±73 500
Ind P2T1 499±67 392±40 472±30 400±56 500
Ind P2T2 513±72 394±44 479±33 409±59 500
Ind P3T1 459±32 394±38 454±8 421±61 500
Ind P3T2 460±25 407±40 464±5 439±63 500
Ind P3T3 447±20 405±40 455±7 435±62 500
Ind P4T1 462±35 412±37 462±7 435±60 500
Ind P4T2 480±40 410±43 473±11 436±62 500
Ind P5T1 438±15 434±39 465.±30 469±68 500
Ind P5T2 445±18 443±36 477±33 483±68 500
Ind P5T3 420±18 417±39 449±30 451±63 500
Ind P8T1 479±281 239±71 499±89 314±84 325
Ind P8T2 487±283 253±77 510±88 327±87 325
Note: Quantitative results in modes A, B, J and K are mean results of the different peaks considered (1225cm-1, 1172cm-1, 1108cm-1 and 603cm-1).
F:\JOHN\11022015\PARA 100% 1.0 PARA 100% 1
F:\JOHN\06082014\PARA THARF 2B.0 PARA THARF 2B
11/19/2014
8/6/2014
1504.8
8
1224.8
1
400600800100012001400160018002000
Wavenumber cm-1
0.0
50.1
00.1
50.2
00.2
50.3
00.3
5
Absorb
ance U
nits
Page 1/1
1108cm‾¹
100 | P a g e
A summary of the results based on different modes indicated that the paracetamol
amounts in the tablets assessed were mostly within acceptable limits except the Ind P8
tablets which suggests interference with the peak at 1108cm‾¹ as mentioned earlier.
The quantitative data is better appreciated as a plot of measured to expected amounts
of paracetamol versus the individual tablets. These data for all integration modes is
presented in Figs 3.18-3.21 with tablet samples split into regions.
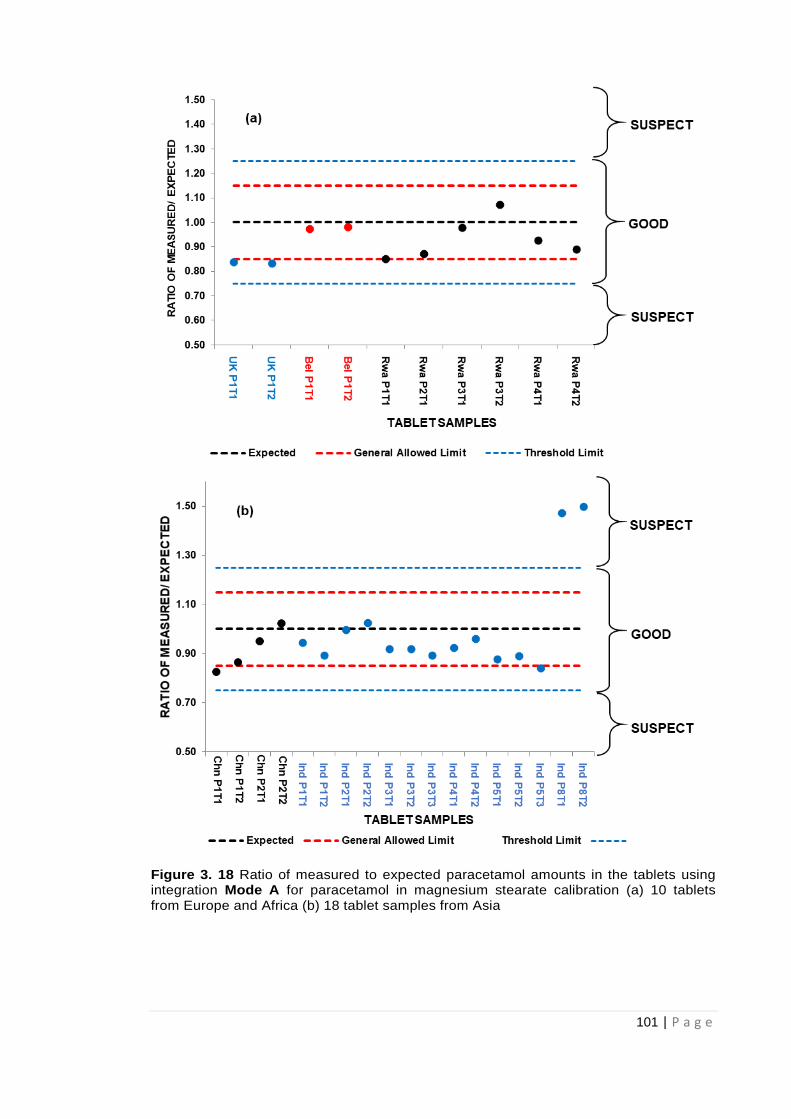
101 | P a g e
Figure 3. 18 Ratio of measured to expected paracetamol amounts in the tablets using integration Mode A for paracetamol in magnesium stearate calibration (a) 10 tablets from Europe and Africa (b) 18 tablet samples from Asia
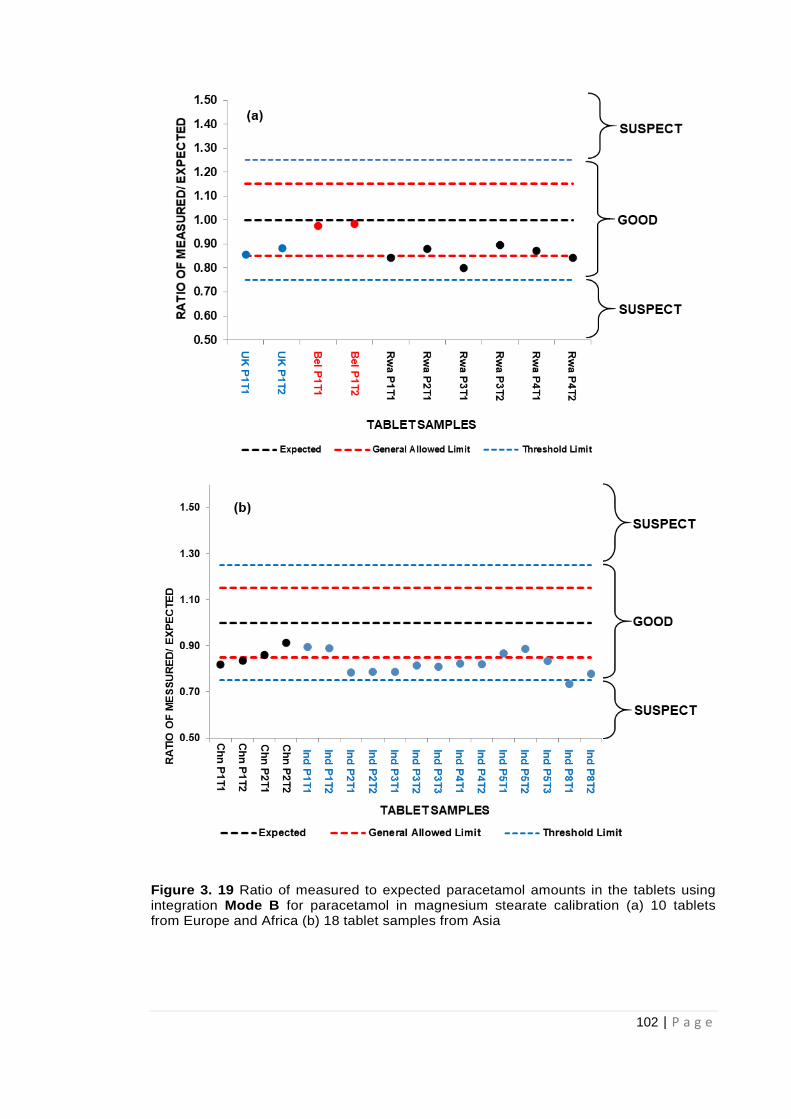
102 | P a g e
Figure 3. 19 Ratio of measured to expected paracetamol amounts in the tablets using integration Mode B for paracetamol in magnesium stearate calibration (a) 10 tablets from Europe and Africa (b) 18 tablet samples from Asia

103 | P a g e
Figure 3. 20 Ratio of measured to expected paracetamol amounts in the tablets using integration Mode J for paracetamol in magnesium stearate calibration (a) 10 tablets from Europe and Africa (b) 18 tablet samples from Asia
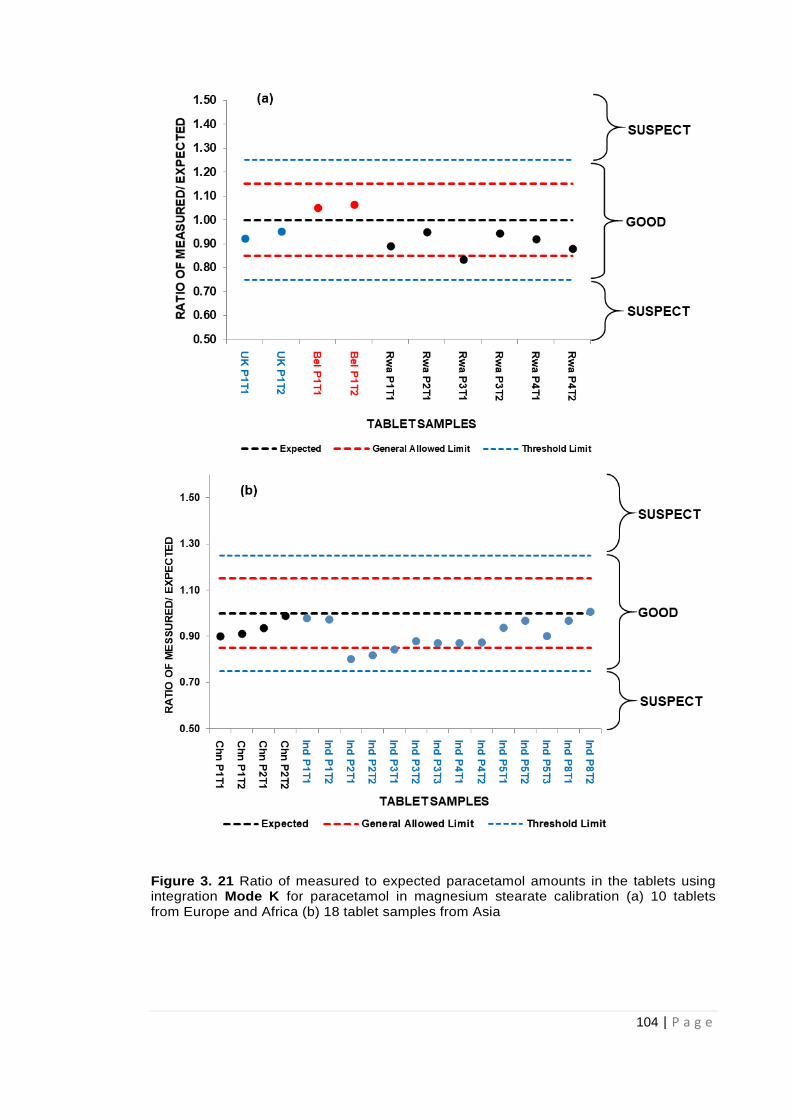
104 | P a g e
Figure 3. 21 Ratio of measured to expected paracetamol amounts in the tablets using integration Mode K for paracetamol in magnesium stearate calibration (a) 10 tablets from Europe and Africa (b) 18 tablet samples from Asia
105 | P a g e
According to British Pharmacopoeia’s uniformity of dosage units test (BP, 2017), the
test tablets comply and pass the test if not more than one tablet out of 30 tablets taken
at random is outside the allowed limits of 85- 115% of the average content. The tablets
fail the uniformity of dosage units test if more than one tablet is outside of the allowed
limits of 85-115% of the average API content or if one tablet out of the 30 tablets taken
at random, is outside the threshold limits of 75-125% of the expected API amounts.
The FDA (FDA, 2014) also adopted the 75-125% threshold limit recommended by the
International Conference on Harmonisation of Technical Requirements for Registration
of Pharmaceuticals for Human Use (ICH), which is an acceptance criteria harmonised
between 3 different pharmacopoeias namely: the European Pharmacopoeia (Ph Eur),
the Japanese Pharmacopoeia and the United States Pharamcopoeia (USP).
It is clear from Figs 3.18-3.21 that higher values for Ind P8 samples occurred when
integration modes A and J were employed. Integration modes A and J carry out
measurements relative to the axis and not the local baseline of the peaks as with
modes B and K. The measurements relative to the axis might therefore be measuring
extra background information in addition to the actual data from the peak analysed.
The data obtained from quantitative analysis of paracetamol via the integration method,
showed that ATR-FTIR was not only able to identify the presence of the API but also
quantify paracetamol amounts. This ATR-FTIR method was also able to identify
suspect tablets (Ind P8) needing further analysis. The results therefore highlight the
potential of the ATR-FTIR in the screening of medicines. Since the study is aimed at
developing rapid analytical methods for the identification of falsified medicines, further
analysis on paracetamol tablets was done using the automated Quant 2 facility on the
OPUS 7.5 software. This would speed up the process since calibration is automated
making the process even simpler. Quant 2 study is considered in the next section.
106 | P a g e
3.3.5.2 Quantification of Paracetamol by automated Quant 2 analysis (using a multivariate PLS calibration model)
The OPUS 7.5 Quant 2 application automatically employs a partial least square
(PLS) regression approach to find the best correlation function between spectral
and concentration data matrix. In addition to magnesium stearate used for
calibration of paracetamol by integration, maize starch and MCC were also used
as excipients for calibration via the Quant 2 method. Unlike with magnesium
stearate, both maize starch and MCC were easy to mix with paracetamol but the
lower density of MCC may be an issue when trying to ensure good contact on
the sampling head.
The approaches assessed with Quant 2 included the use of the 3 individual
excipients: MCC, maize starch and magnesium stearate with absorbance area
measurements collected for:
the ranges 1524 - 1493cm-1 and 1236 - 1210cm-1 corresponding to the
1505cm-1 and 1225cm-1 peaks,
the range 1524 – 1210cm-1
the whole recorded spectral range 4000 – 400cm-1.
Individual calibration curves for paracetamol in the three different excipients,
were plotted using the selected spectral ranges.
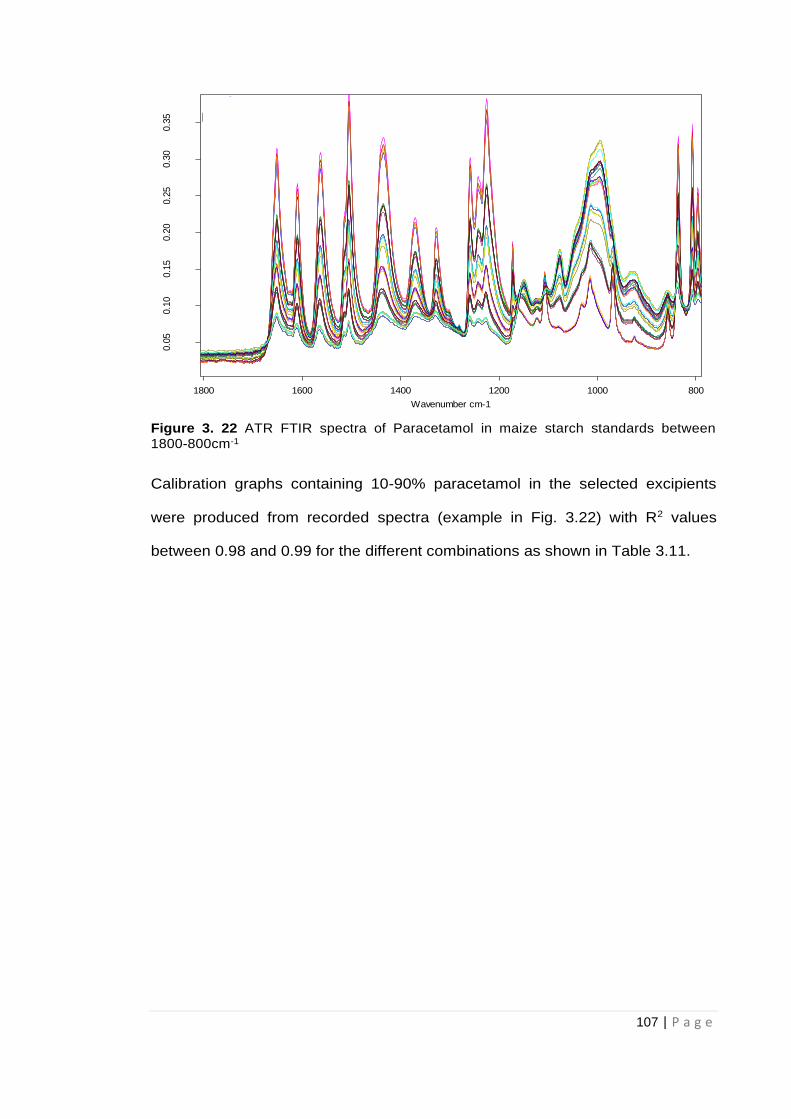
107 | P a g e
Figure 3. 22 ATR FTIR spectra of Paracetamol in maize starch standards between 1800-800cm-1
Calibration graphs containing 10-90% paracetamol in the selected excipients
were produced from recorded spectra (example in Fig. 3.22) with R2 values
between 0.98 and 0.99 for the different combinations as shown in Table 3.11.
G:\JOHN\10092015\10% PARAMST_1.0 10% PARAMST_1 G:\JOHN\10092015\10% PARAMST_2.0 10% PARAMST_2 G:\JOHN\10092015\10% PARAMST_3.0 10% PARAMST_3 G:\JOHN\10092015\10% PARAMST_4.0 10% PARAMST_4 G:\JOHN\10092015\10% PARAMST_5.0 10% PARAMST_5 G:\JOHN\10092015\20% PARAMST_1.0 20% PARAMST_1 G:\JOHN\10092015\20% PARAMST_2.0 20% PARAMST_2 G:\JOHN\10092015\20% PARAMST_3.0 20% PARAMST_3 G:\JOHN\10092015\20% PARAMST_4.0 20% PARAMST_4 G:\JOHN\10092015\20% PARAMST_5.0 20% PARAMST_5 G:\JOHN\10092015\30% PARAMST_1.0 30% PARAMST_1 G:\JOHN\10092015\30% PARAMST_2.0 30% PARAMST_2 G:\JOHN\10092015\30% PARAMST_3.0 30% PARAMST_3 G:\JOHN\10092015\30% PARAMST_4.0 30% PARAMST_4 G:\JOHN\10092015\30% PARAMST_5.0 30% PARAMST_5 G:\JOHN\10092015\50% PARAMST_1.0 50% PARAMST_1 G:\JOHN\10092015\50% PARAMST_2.0 50% PARAMST_2 G:\JOHN\10092015\50% PARAMST_3.0 50% PARAMST_3 G:\JOHN\10092015\50% PARAMST_4.0 50% PARAMST_4 G:\JOHN\10092015\50% PARAMST_5.0 50% PARAMST_5 G:\JOHN\10092015\70% PARAMST_1.0 70% PARAMST_1A G:\JOHN\10092015\70% PARAMST_2.0 70% PARAMST_2 G:\JOHN\10092015\70% PARAMST_3.0 70% PARAMST_4 G:\JOHN\10092015\70% PARAMST_4.0 70% PARAMST_5 G:\JOHN\10092015\70% PARAMST_5.0 70% PARAMST_6 G:\JOHN\10092015\90% PARAMST_1.0 70% PARAMST_2 G:\JOHN\10092015\90% PARAMST_2.0 70% PARAMST_3 G:\JOHN\10092015\90% PARAMST_3.0 70% PARAMST_4 G:\JOHN\10092015\90% PARAMST_4.0 70% PARAMST_5 G:\JOHN\10092015\90% PARAMST_5.0 70% PARAMST_6
9/10/20159/10/20159/10/20159/10/20159/10/20159/10/20159/10/20159/10/20159/10/20159/10/20159/10/20159/10/20159/10/20159/10/20159/10/20159/10/20159/10/20159/10/20159/10/20159/10/20159/10/20159/10/20159/10/20159/10/20159/10/20159/10/20159/10/20159/10/20159/10/20159/10/2015
80010001200140016001800
Wavenumber cm-1
0.0
50.1
00.1
50.2
00.2
50.3
00.3
5
Absorb
ance U
nits
Page 1/1
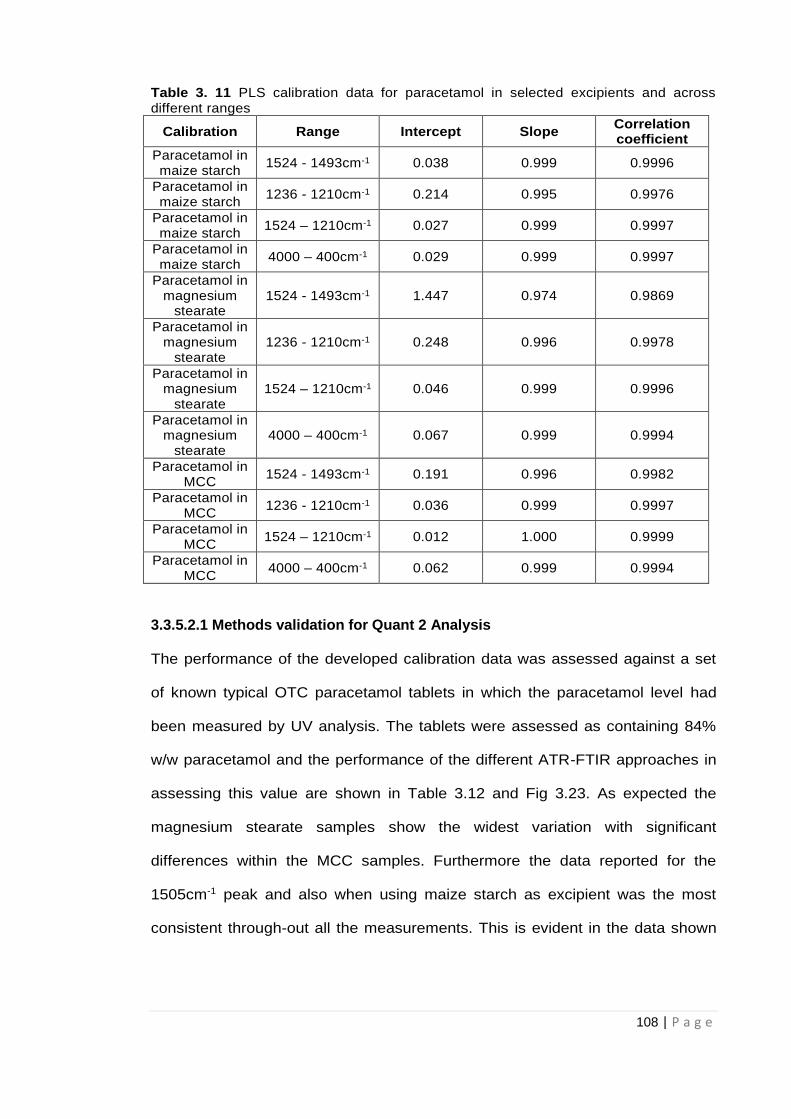
108 | P a g e
Table 3. 11 PLS calibration data for paracetamol in selected excipients and across different ranges
Calibration Range Intercept Slope Correlation coefficient
Paracetamol in maize starch
1524 - 1493cm-1 0.038 0.999 0.9996
Paracetamol in maize starch
1236 - 1210cm-1 0.214 0.995 0.9976
Paracetamol in maize starch
1524 – 1210cm-1 0.027 0.999 0.9997
Paracetamol in maize starch
4000 – 400cm-1 0.029 0.999 0.9997
Paracetamol in magnesium
stearate 1524 - 1493cm-1 1.447 0.974 0.9869
Paracetamol in magnesium
stearate 1236 - 1210cm-1 0.248 0.996 0.9978
Paracetamol in magnesium
stearate 1524 – 1210cm-1 0.046 0.999 0.9996
Paracetamol in magnesium
stearate 4000 – 400cm-1 0.067 0.999 0.9994
Paracetamol in MCC
1524 - 1493cm-1 0.191 0.996 0.9982
Paracetamol in MCC
1236 - 1210cm-1 0.036 0.999 0.9997
Paracetamol in MCC
1524 – 1210cm-1 0.012 1.000 0.9999
Paracetamol in MCC
4000 – 400cm-1 0.062 0.999 0.9994
3.3.5.2.1 Methods validation for Quant 2 Analysis
The performance of the developed calibration data was assessed against a set
of known typical OTC paracetamol tablets in which the paracetamol level had
been measured by UV analysis. The tablets were assessed as containing 84%
w/w paracetamol and the performance of the different ATR-FTIR approaches in
assessing this value are shown in Table 3.12 and Fig 3.23. As expected the
magnesium stearate samples show the widest variation with significant
differences within the MCC samples. Furthermore the data reported for the
1505cm-1 peak and also when using maize starch as excipient was the most
consistent through-out all the measurements. This is evident in the data shown
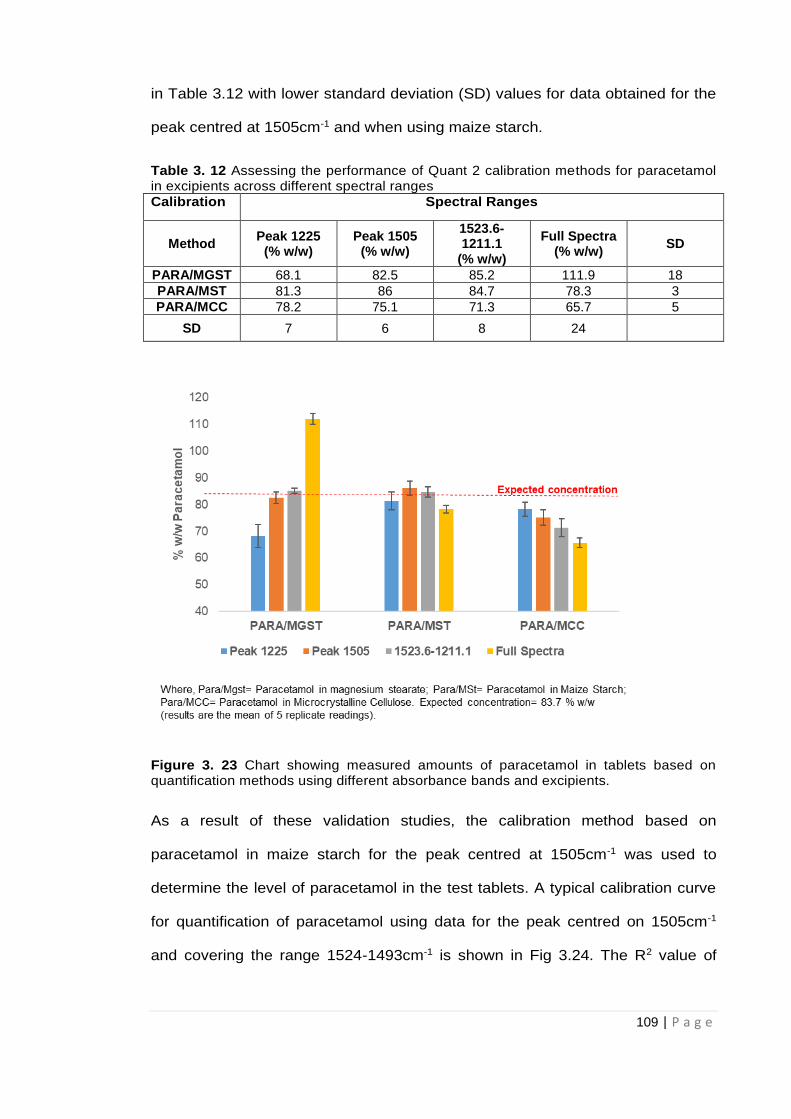
109 | P a g e
in Table 3.12 with lower standard deviation (SD) values for data obtained for the
peak centred at 1505cm-1 and when using maize starch.
Table 3. 12 Assessing the performance of Quant 2 calibration methods for paracetamol in excipients across different spectral ranges
Calibration Spectral Ranges
Method Peak 1225
(% w/w) Peak 1505
(% w/w)
1523.6-1211.1
(% w/w)
Full Spectra (% w/w)
SD
PARA/MGST 68.1 82.5 85.2 111.9 18
PARA/MST 81.3 86 84.7 78.3 3
PARA/MCC 78.2 75.1 71.3 65.7 5
SD 7 6 8 24
Figure 3. 23 Chart showing measured amounts of paracetamol in tablets based on quantification methods using different absorbance bands and excipients.
As a result of these validation studies, the calibration method based on
paracetamol in maize starch for the peak centred at 1505cm-1 was used to
determine the level of paracetamol in the test tablets. A typical calibration curve
for quantification of paracetamol using data for the peak centred on 1505cm-1
and covering the range 1524-1493cm-1 is shown in Fig 3.24. The R2 value of
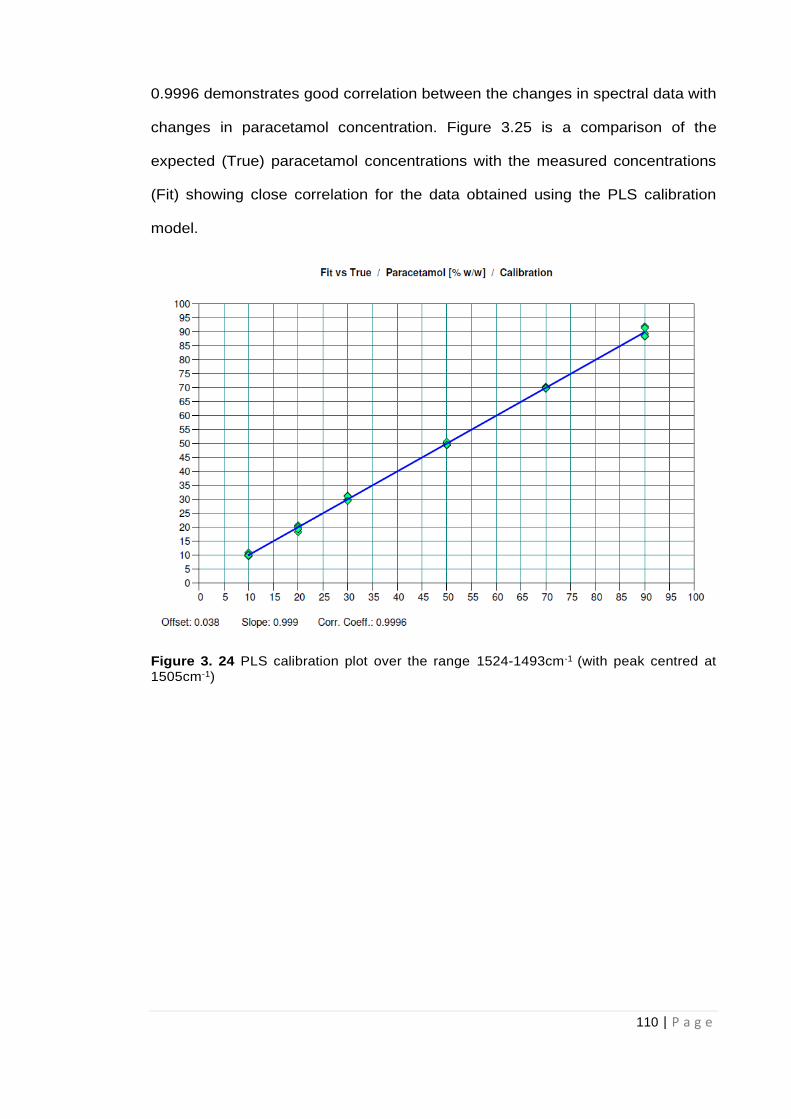
110 | P a g e
0.9996 demonstrates good correlation between the changes in spectral data with
changes in paracetamol concentration. Figure 3.25 is a comparison of the
expected (True) paracetamol concentrations with the measured concentrations
(Fit) showing close correlation for the data obtained using the PLS calibration
model.
Figure 3. 24 PLS calibration plot over the range 1524-1493cm-1 (with peak centred at 1505cm-1)
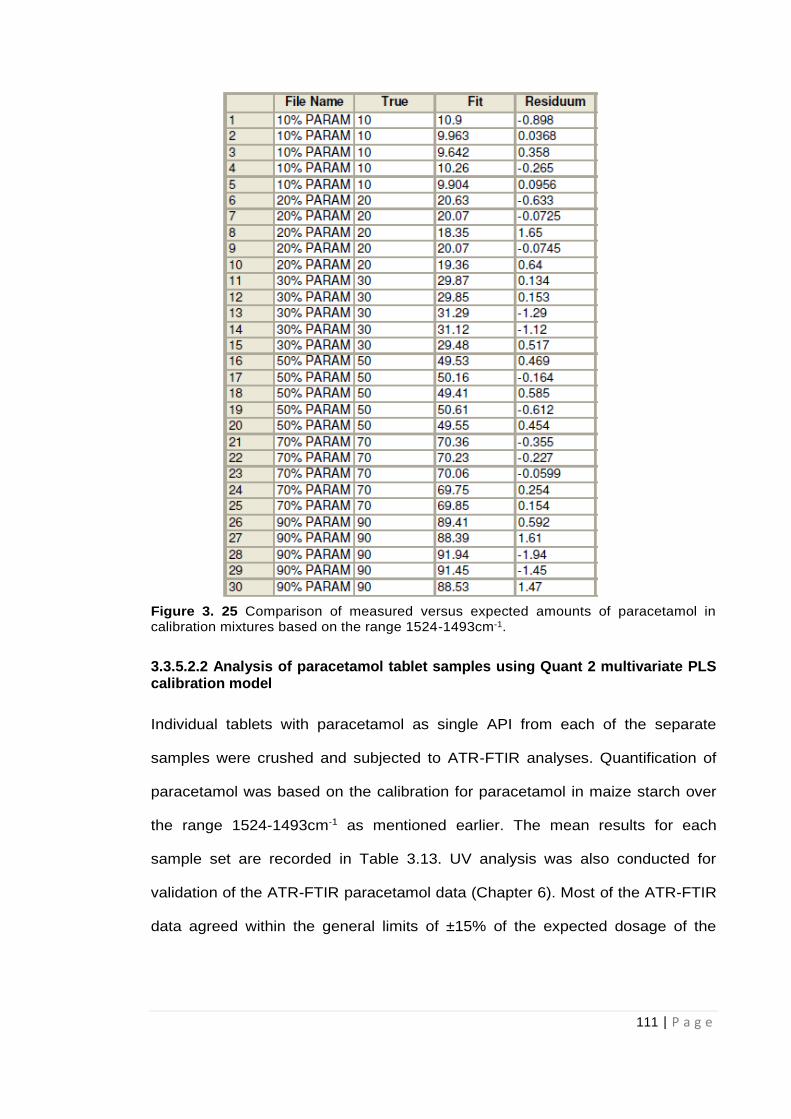
111 | P a g e
Figure 3. 25 Comparison of measured versus expected amounts of paracetamol in calibration mixtures based on the range 1524-1493cm-1.
3.3.5.2.2 Analysis of paracetamol tablet samples using Quant 2 multivariate PLS calibration model
Individual tablets with paracetamol as single API from each of the separate
samples were crushed and subjected to ATR-FTIR analyses. Quantification of
paracetamol was based on the calibration for paracetamol in maize starch over
the range 1524-1493cm-1 as mentioned earlier. The mean results for each
sample set are recorded in Table 3.13. UV analysis was also conducted for
validation of the ATR-FTIR paracetamol data (Chapter 6). Most of the ATR-FTIR
data agreed within the general limits of ±15% of the expected dosage of the
112 | P a g e
paracetamol tablets (BP, 2017) but some significant differences were identified.
Whilst there was close agreement for many of the samples the ATR-FTIR Quant
2 approach gave high values for some samples from Belgium (Bel P1T1 and Bel
P1T2), India (Ind P8T1 and P8T2) and Cyprus (Cyp P1T1 and Cyp P1T2). Low
levels of API for a tablet sample from Pakistan (Pak P1T1) were also obtained
from Quant 2 ATR measurements.
The ATR-FTIR data is displayed as a plot of the ratio of expected to measured
paracetamol levels versus sample origin as shown in Fig 3.26. This figure clearly
shows that whilst the majority of tablet samples were within the general
acceptable limits, seven samples merited further investigation. The first of these,
the Belgian samples, gave high results using the Quant 2 ATR-FTIR tests but
results based on quantification by the Integration mode were within allowed limits
for these tablets. The Belgian samples would therefore be allowed to pass a
screening test. Two of the Indian samples tested high on both Integration and
Quant 2 ATR-FTIR methods for quantification but the ATR signal suggested the
presence of other material in the fingerprint region and would therefore fail a
screening test. Further investigation of the reason for failure would be required.
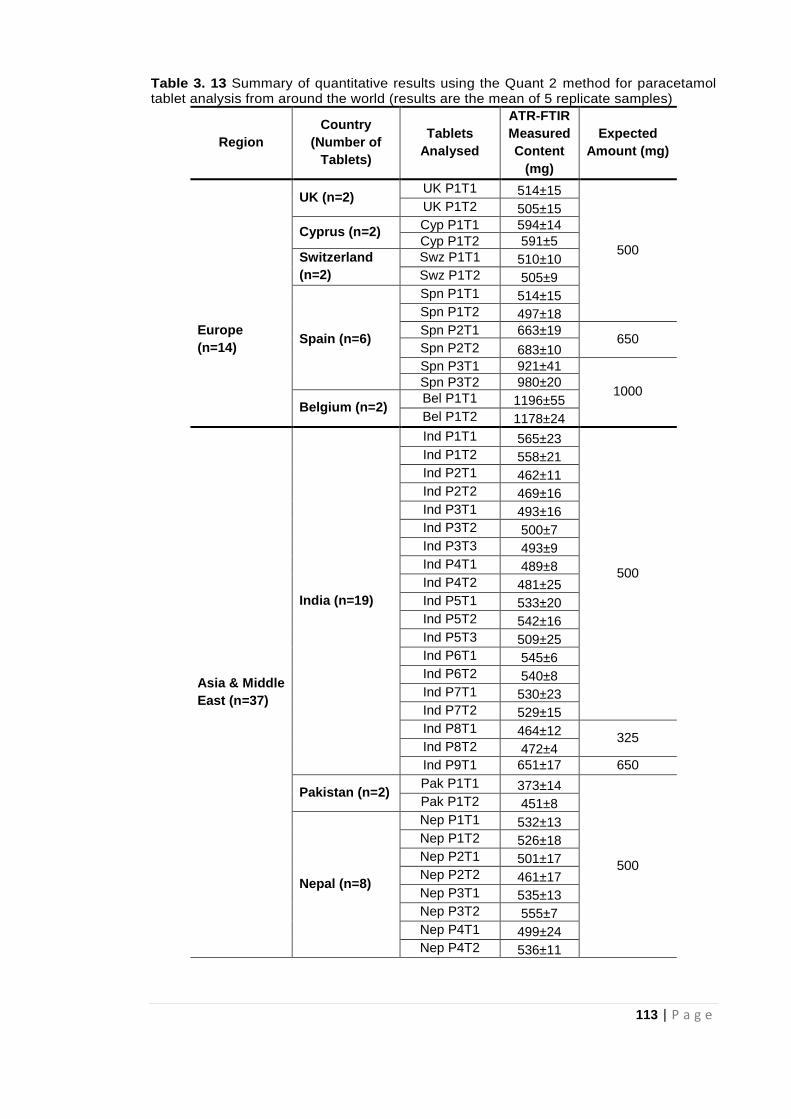
113 | P a g e
Table 3. 13 Summary of quantitative results using the Quant 2 method for paracetamol tablet analysis from around the world (results are the mean of 5 replicate samples)
Region
Country
(Number of
Tablets)
Tablets
Analysed
ATR-FTIR
Measured
Content
(mg)
Expected
Amount (mg)
UK (n=2) UK P1T1 514±15
500
UK P1T2 505±15
Cyprus (n=2) Cyp P1T1 594±14
Cyp P1T2 591±5
Switzerland
(n=2)
Swz P1T1 510±10
Swz P1T2 505±9
Spn P1T1 514±15
Spn P1T2 497±18
Europe
(n=14) Spain (n=6)
Spn P2T1 663±19 650
Spn P2T2 683±10
Spn P3T1 921±41
1000 Spn P3T2 980±20
Belgium (n=2) Bel P1T1 1196±55
Bel P1T2 1178±24
Asia & Middle
East (n=37)
India (n=19)
Ind P1T1 565±23
500
Ind P1T2 558±21
Ind P2T1 462±11
Ind P2T2 469±16
Ind P3T1 493±16
Ind P3T2 500±7
Ind P3T3 493±9
Ind P4T1 489±8
Ind P4T2 481±25
Ind P5T1 533±20
Ind P5T2 542±16
Ind P5T3 509±25
Ind P6T1 545±6
Ind P6T2 540±8
Ind P7T1 530±23
Ind P7T2 529±15
Ind P8T1 464±12 325
Ind P8T2 472±4
Ind P9T1 651±17 650
Pakistan (n=2) Pak P1T1 373±14
500
Pak P1T2 451±8
Nepal (n=8)
Nep P1T1 532±13
Nep P1T2 526±18
Nep P2T1 501±17
Nep P2T2 461±17
Nep P3T1 535±13
Nep P3T2 555±7
Nep P4T1 499±24
Nep P4T2 536±11
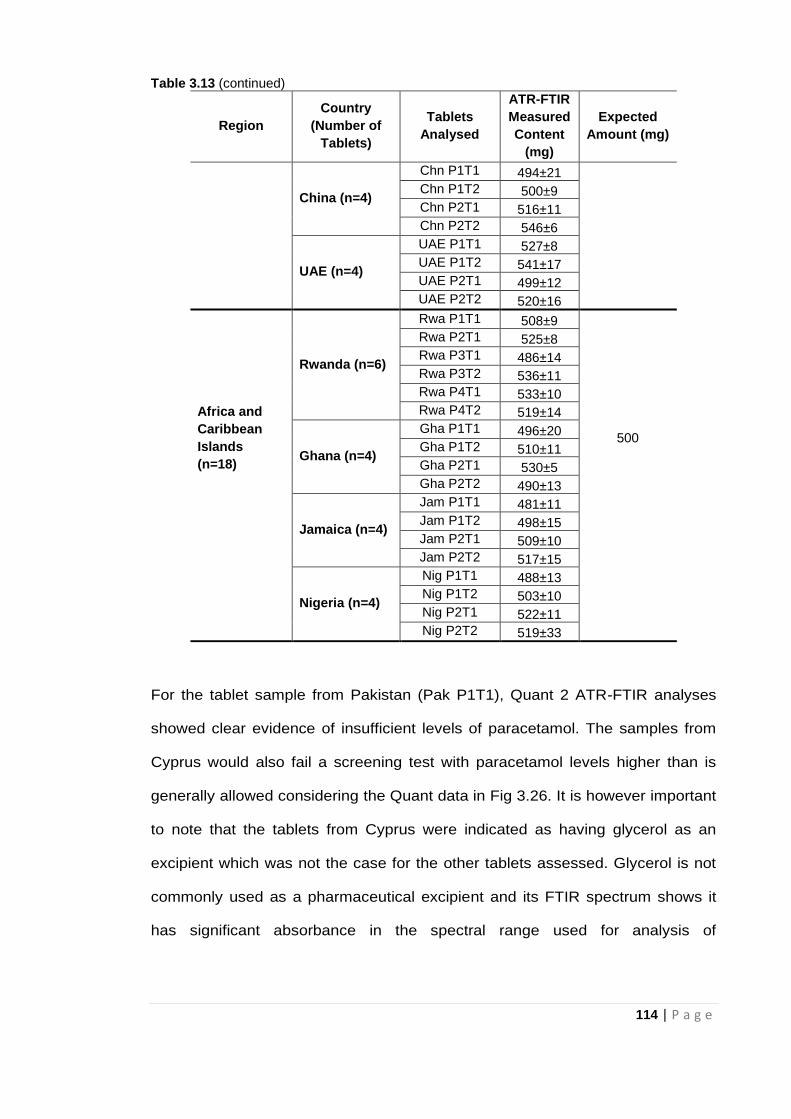
114 | P a g e
Table 3.13 (continued)
Region
Country
(Number of
Tablets)
Tablets
Analysed
ATR-FTIR
Measured
Content
(mg)
Expected
Amount (mg)
China (n=4)
Chn P1T1 494±21
Chn P1T2 500±9
Chn P2T1 516±11
Chn P2T2 546±6
UAE (n=4)
UAE P1T1 527±8
UAE P1T2 541±17
UAE P2T1 499±12
UAE P2T2 520±16
Africa and
Caribbean
Islands
(n=18)
Rwanda (n=6)
Rwa P1T1 508±9
500
Rwa P2T1 525±8
Rwa P3T1 486±14
Rwa P3T2 536±11
Rwa P4T1 533±10
Rwa P4T2 519±14
Ghana (n=4)
Gha P1T1 496±20
Gha P1T2 510±11
Gha P2T1 530±5
Gha P2T2 490±13
Jamaica (n=4)
Jam P1T1 481±11
Jam P1T2 498±15
Jam P2T1 509±10
Jam P2T2 517±15
Nigeria (n=4)
Nig P1T1 488±13
Nig P1T2 503±10
Nig P2T1 522±11
Nig P2T2 519±33
For the tablet sample from Pakistan (Pak P1T1), Quant 2 ATR-FTIR analyses
showed clear evidence of insufficient levels of paracetamol. The samples from
Cyprus would also fail a screening test with paracetamol levels higher than is
generally allowed considering the Quant data in Fig 3.26. It is however important
to note that the tablets from Cyprus were indicated as having glycerol as an
excipient which was not the case for the other tablets assessed. Glycerol is not
commonly used as a pharmaceutical excipient and its FTIR spectrum shows it
has significant absorbance in the spectral range used for analysis of
115 | P a g e
paracetamol (1524-1493cm-1) (Nanda et al, 2014). This could be the reason for
the higher than expected ATR-FTIR signals for the Cyprus tablets.
Consequently, this set of tablets identified as suspect, would require further
analysis.
Based on the results obtained from the analysis of single API tablets containing
paracetamol, ATR-FTIR spectroscopy showed its potential in rapidly identifying
and quantifying paracetamol in tablet dosage forms. It was also able to identify
suspect tablets based on the data obtained.
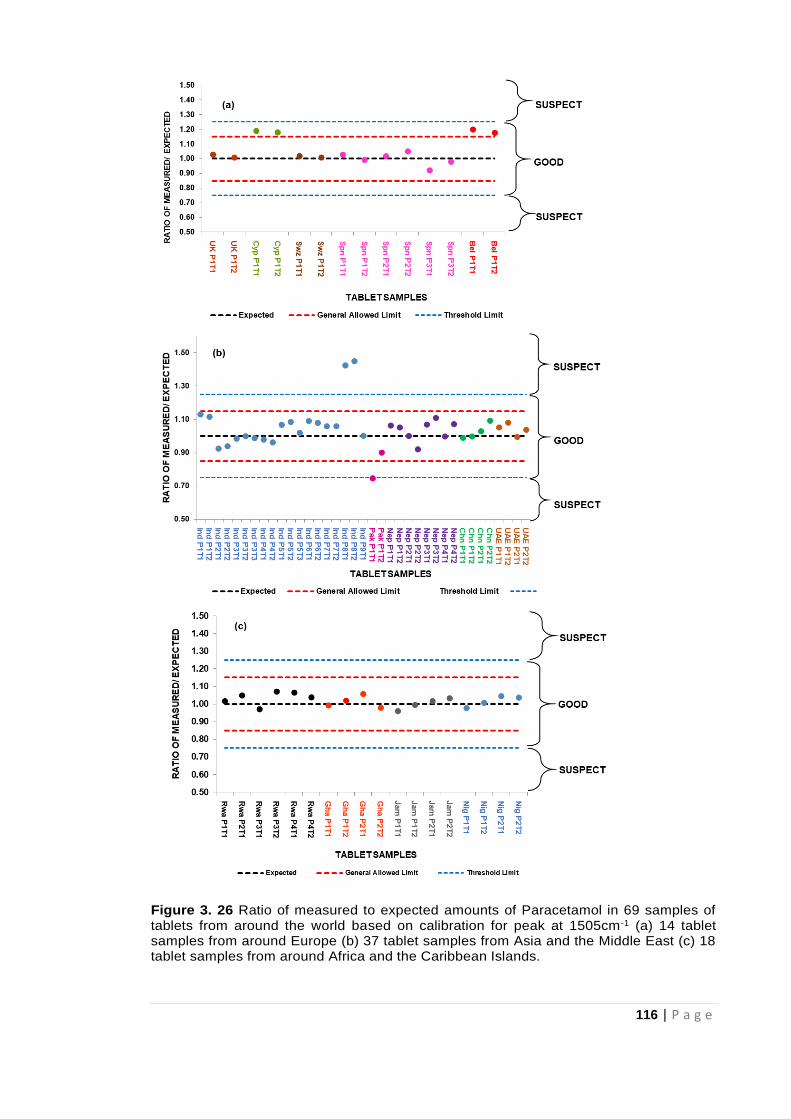
116 | P a g e
Figure 3. 26 Ratio of measured to expected amounts of Paracetamol in 69 samples of tablets from around the world based on calibration for peak at 1505cm-1 (a) 14 tablet samples from around Europe (b) 37 tablet samples from Asia and the Middle East (c) 18 tablet samples from around Africa and the Caribbean Islands.
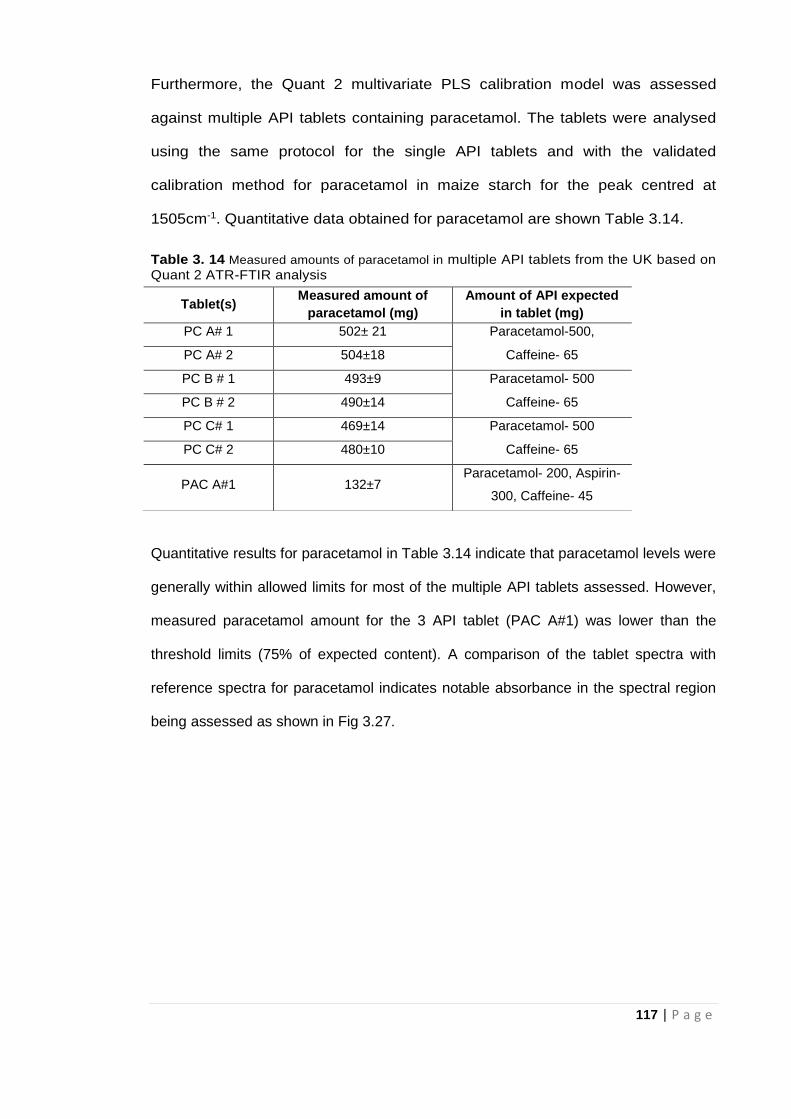
117 | P a g e
Furthermore, the Quant 2 multivariate PLS calibration model was assessed
against multiple API tablets containing paracetamol. The tablets were analysed
using the same protocol for the single API tablets and with the validated
calibration method for paracetamol in maize starch for the peak centred at
1505cm-1. Quantitative data obtained for paracetamol are shown Table 3.14.
Table 3. 14 Measured amounts of paracetamol in multiple API tablets from the UK based on Quant 2 ATR-FTIR analysis
Quantitative results for paracetamol in Table 3.14 indicate that paracetamol levels were
generally within allowed limits for most of the multiple API tablets assessed. However,
measured paracetamol amount for the 3 API tablet (PAC A#1) was lower than the
threshold limits (75% of expected content). A comparison of the tablet spectra with
reference spectra for paracetamol indicates notable absorbance in the spectral region
being assessed as shown in Fig 3.27.
Tablet(s) Measured amount of
paracetamol (mg)
Amount of API expected
in tablet (mg)
PC A# 1 502± 21 Paracetamol-500,
PC A# 2 504±18 Caffeine- 65
PC B # 1 493±9 Paracetamol- 500
PC B # 2 490±14 Caffeine- 65
PC C# 1 469±14 Paracetamol- 500
PC C# 2 480±10 Caffeine- 65
PAC A#1 132±7 Paracetamol- 200, Aspirin-
300, Caffeine- 45
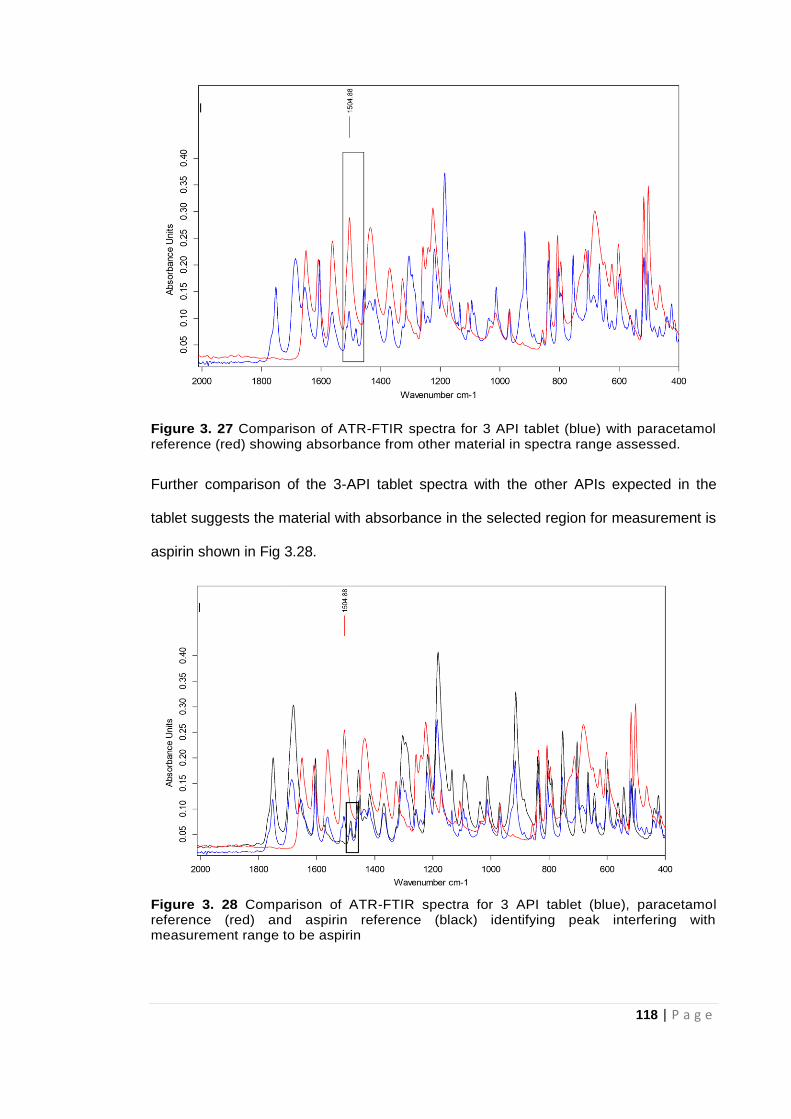
118 | P a g e
Figure 3. 27 Comparison of ATR-FTIR spectra for 3 API tablet (blue) with paracetamol reference (red) showing absorbance from other material in spectra range assessed.
Further comparison of the 3-API tablet spectra with the other APIs expected in the
tablet suggests the material with absorbance in the selected region for measurement is
aspirin shown in Fig 3.28.
Figure 3. 28 Comparison of ATR-FTIR spectra for 3 API tablet (blue), paracetamol reference (red) and aspirin reference (black) identifying peak interfering with measurement range to be aspirin
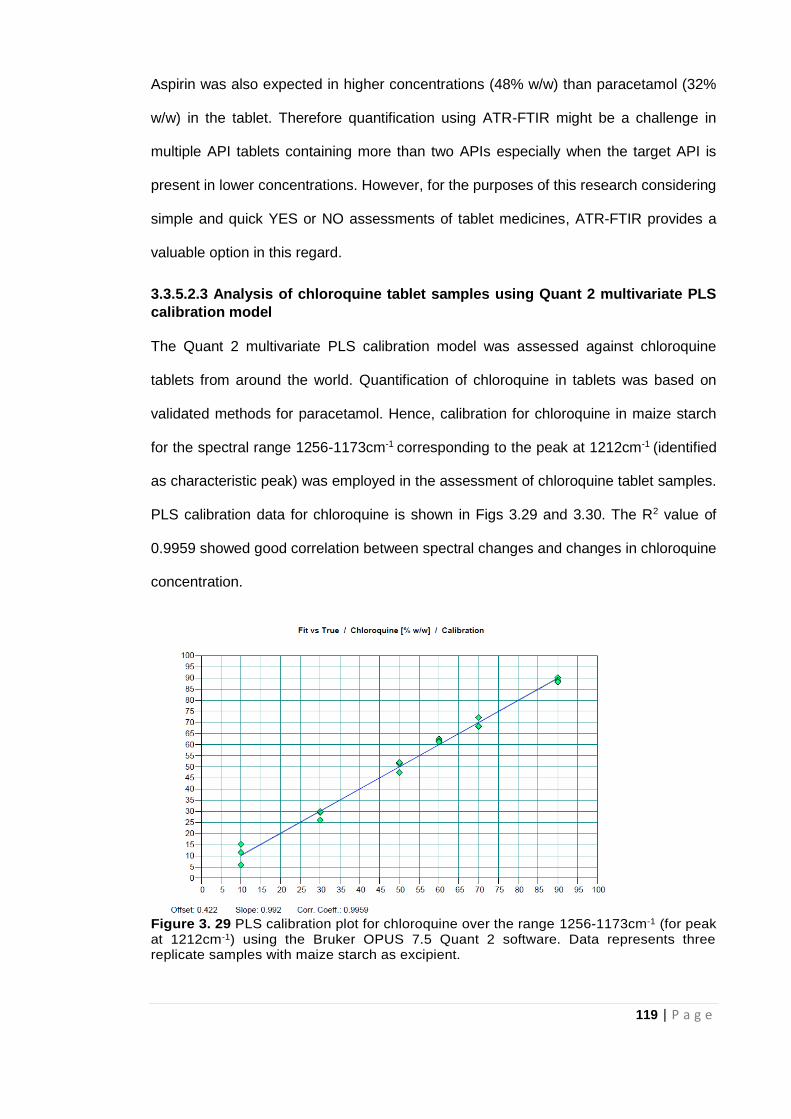
119 | P a g e
Aspirin was also expected in higher concentrations (48% w/w) than paracetamol (32%
w/w) in the tablet. Therefore quantification using ATR-FTIR might be a challenge in
multiple API tablets containing more than two APIs especially when the target API is
present in lower concentrations. However, for the purposes of this research considering
simple and quick YES or NO assessments of tablet medicines, ATR-FTIR provides a
valuable option in this regard.
3.3.5.2.3 Analysis of chloroquine tablet samples using Quant 2 multivariate PLS
calibration model
The Quant 2 multivariate PLS calibration model was assessed against chloroquine
tablets from around the world. Quantification of chloroquine in tablets was based on
validated methods for paracetamol. Hence, calibration for chloroquine in maize starch
for the spectral range 1256-1173cm-1 corresponding to the peak at 1212cm-1 (identified
as characteristic peak) was employed in the assessment of chloroquine tablet samples.
PLS calibration data for chloroquine is shown in Figs 3.29 and 3.30. The R2 value of
0.9959 showed good correlation between spectral changes and changes in chloroquine
concentration.
Figure 3. 29 PLS calibration plot for chloroquine over the range 1256-1173cm-1 (for peak at 1212cm-1) using the Bruker OPUS 7.5 Quant 2 software. Data represents three replicate samples with maize starch as excipient.
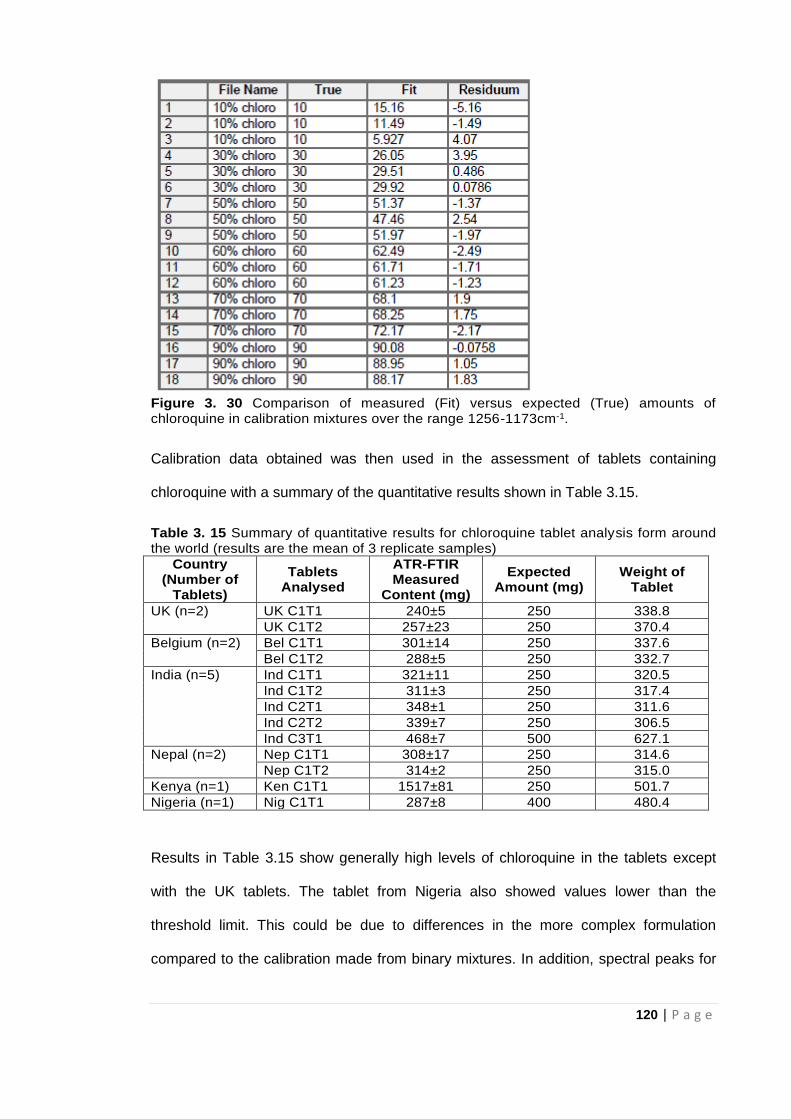
120 | P a g e
Figure 3. 30 Comparison of measured (Fit) versus expected (True) amounts of chloroquine in calibration mixtures over the range 1256-1173cm-1.
Calibration data obtained was then used in the assessment of tablets containing
chloroquine with a summary of the quantitative results shown in Table 3.15.
Table 3. 15 Summary of quantitative results for chloroquine tablet analysis form around the world (results are the mean of 3 replicate samples)
Country (Number of
Tablets)
Tablets Analysed
ATR-FTIR Measured
Content (mg)
Expected Amount (mg)
Weight of Tablet
UK (n=2) UK C1T1 240±5 250 338.8
UK C1T2 257±23 250 370.4
Belgium (n=2) Bel C1T1 301±14 250 337.6
Bel C1T2 288±5 250 332.7
India (n=5) Ind C1T1 321±11 250 320.5
Ind C1T2 311±3 250 317.4
Ind C2T1 348±1 250 311.6
Ind C2T2 339±7 250 306.5
Ind C3T1 468±7 500 627.1
Nepal (n=2) Nep C1T1 308±17 250 314.6
Nep C1T2 314±2 250 315.0
Kenya (n=1) Ken C1T1 1517±81 250 501.7
Nigeria (n=1) Nig C1T1 287±8 400 480.4
Results in Table 3.15 show generally high levels of chloroquine in the tablets except
with the UK tablets. The tablet from Nigeria also showed values lower than the
threshold limit. This could be due to differences in the more complex formulation
compared to the calibration made from binary mixtures. In addition, spectral peaks for
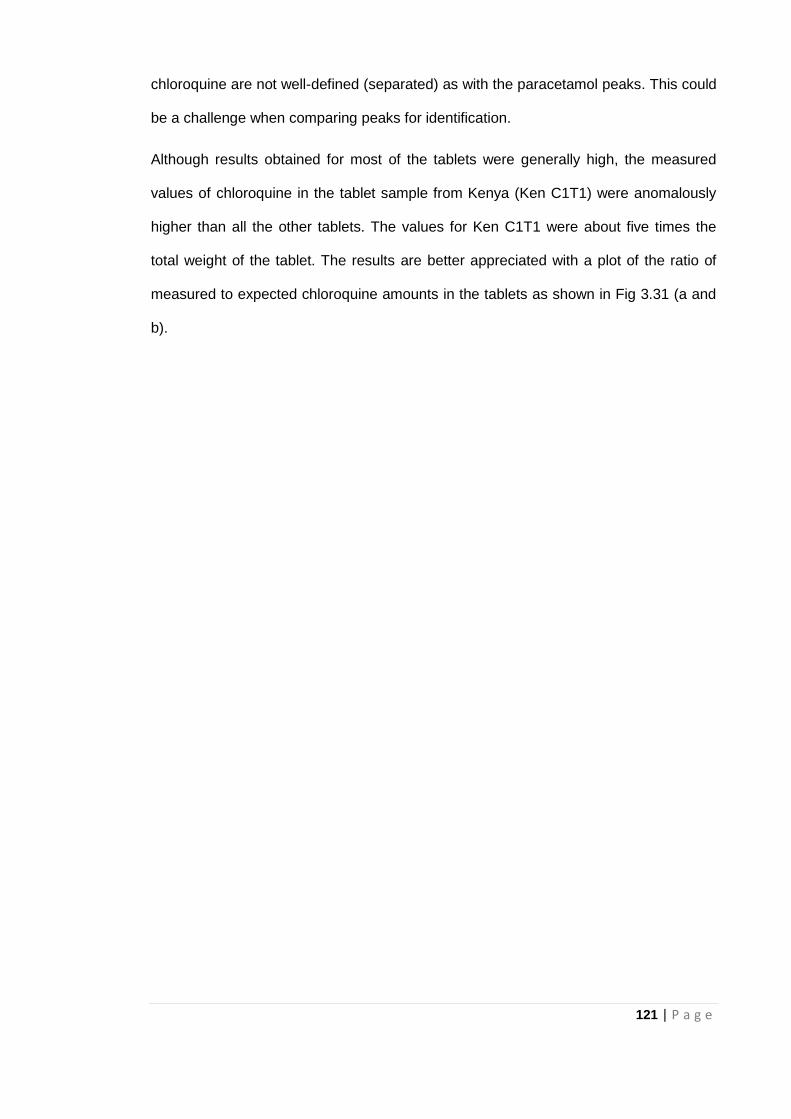
121 | P a g e
chloroquine are not well-defined (separated) as with the paracetamol peaks. This could
be a challenge when comparing peaks for identification.
Although results obtained for most of the tablets were generally high, the measured
values of chloroquine in the tablet sample from Kenya (Ken C1T1) were anomalously
higher than all the other tablets. The values for Ken C1T1 were about five times the
total weight of the tablet. The results are better appreciated with a plot of the ratio of
measured to expected chloroquine amounts in the tablets as shown in Fig 3.31 (a and
b).
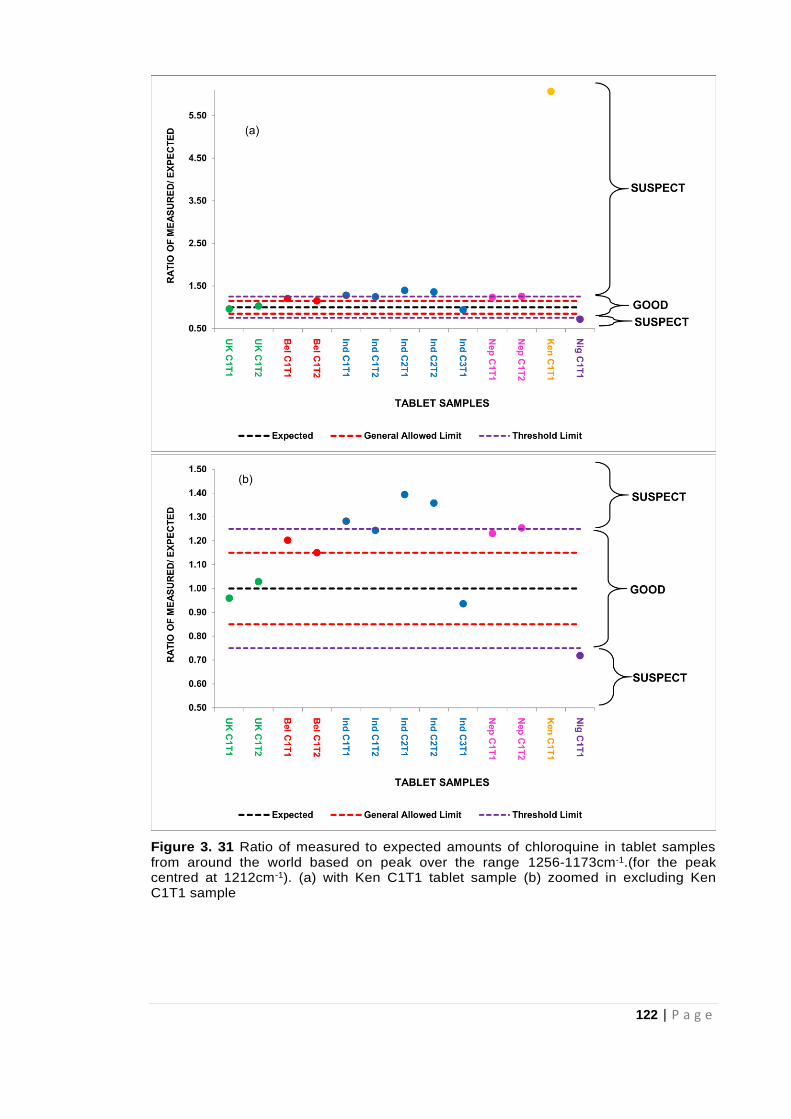
122 | P a g e
Figure 3. 31 Ratio of measured to expected amounts of chloroquine in tablet samples from around the world based on peak over the range 1256-1173cm-1.(for the peak centred at 1212cm-1). (a) with Ken C1T1 tablet sample (b) zoomed in excluding Ken C1T1 sample
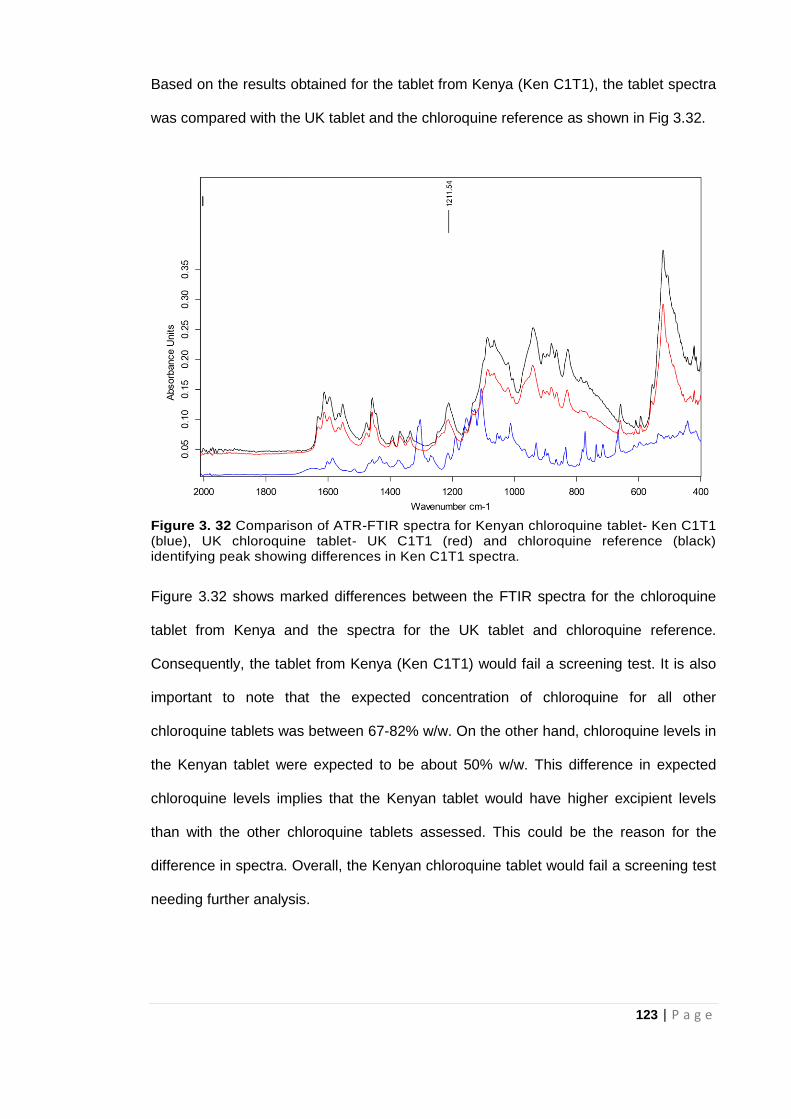
123 | P a g e
Based on the results obtained for the tablet from Kenya (Ken C1T1), the tablet spectra
was compared with the UK tablet and the chloroquine reference as shown in Fig 3.32.
Figure 3. 32 Comparison of ATR-FTIR spectra for Kenyan chloroquine tablet- Ken C1T1 (blue), UK chloroquine tablet- UK C1T1 (red) and chloroquine reference (black) identifying peak showing differences in Ken C1T1 spectra.
Figure 3.32 shows marked differences between the FTIR spectra for the chloroquine
tablet from Kenya and the spectra for the UK tablet and chloroquine reference.
Consequently, the tablet from Kenya (Ken C1T1) would fail a screening test. It is also
important to note that the expected concentration of chloroquine for all other
chloroquine tablets was between 67-82% w/w. On the other hand, chloroquine levels in
the Kenyan tablet were expected to be about 50% w/w. This difference in expected
chloroquine levels implies that the Kenyan tablet would have higher excipient levels
than with the other chloroquine tablets assessed. This could be the reason for the
difference in spectra. Overall, the Kenyan chloroquine tablet would fail a screening test
needing further analysis.
124 | P a g e
Although there were limitations in quantifying chloroquine tablets using the ATR-FTIR
method (as with the 3-API tablet containing paracetamol), the ATR-FTIR method was
able to identify suspect samples like the Ken C1T1. Identifying the suspect sample is
priority in the quick screening of medicines and this is the purpose for which the ATR-
FTIR is being assessed.
One advantage of the approach taken here, recording reference and sample
spectra over the range 4000-400cm-1 means that the Spectrum Search
capabilities of the OPUS 7.5 software can be used. This approach should allow
identification of the compound/s contributing to anomalously high peak areas in
characteristic spectral ranges for measurement of target APIs as demonstrated
in this research.
The limit of quantification (LOQ) of the method is dependent on the type of excipient
used and the weight of the tablet and so is not fixed for all investigations.
Consequently, quantification of APIs in the presence of excipients was possible down
to concentrations between 10-20% w/w. These results were based on the excipients
considered in the study and the actual weight of the tablets.
Overall, this novel method developed based on the ATR-FTIR technique has a
few advantages as it not only identifies the presence or absence of the API but
also indicates how much of the API could be in the tablet in a short time. It also
reduces exposure to toxic chemicals used in solvent extraction of the API(s) for
analysis using conventional pharmacopoeia approved methods. Its portability
makes it valuable for in-field analysis such as quality control by pharmaceutical
companies and post marketing surveillance by regulatory bodies. Furthermore,
its potential in the identification of FSMs with incorrect amounts of API will also
reduce the public health risk posed by these medications such as antimicrobial
resistance and ultimately therapeutic failure. The dangers of under dosing or
125 | P a g e
exceeding the allowed limits for API(s) in medication especially those with a
narrow therapeutic range will also be reduced (Blackstone et al, 2014).
Economically, funds spent on these medications which are toxic or have no
therapeutic effect will be reduced.
3. 4 Conclusion
Based on the rapid ATR-FTIR method examined, this study was able to identify
10% (7 tablet samples) of the paracetamol tablet samples and 8% (1 tablet) of
the antimalarial chloroquine tablets as suspect samples needing further analysis.
These results are also in line with the WHO estimates of the level of FSMs
globally, highlighting the wide range of samples assessed.
This study shows that the simple ATR-FTIR approach employed has the
capacity to rapidly identify and also quantify paracetamol in the presence of
excipients and other APIs. The whole process of crushing, identifying and
quantifying a tablet would take about 5 minutes per tablet sample after the
method has been optimised. However, this is not meant to replace the more
established and highly sensitive conventional solvent extraction methods but to
serve as a valuable alternative to the expensive Raman systems as an in-field
technique for quick screening of medicines. It is also a green technique as the
elimination of solvent extraction of APIs reduces the amounts of toxic chemicals
used thus, reducing chemical waste. Furthermore, the technique will enable
quick withdrawal of counterfeit medicines from the market thereby reducing the
threat to public health. It is also relatively inexpensive and easy to use compared
to the pharmacopoeia approved techniques so can also be used in developing
countries where facilities are not readily available. This approach employed in
the identification and quantification of paracetamol could potentially be applied in
the analysis of other APIs in tablet dosage forms.
126 | P a g e
3.5 References
Ansari, M. T., Saeed Saify, Z., Sultana, N., Ahmad, I., Saeed-Ul-Hassan, S., Tariq, I.
and Khanum, M. (2013) Malaria and artemisinin derivatives: an updated review. Mini
Reviews in Medicinal Chemistry, 13(13): 1879-1902.
Blackstone, E. A. Fuhr Jr J. P. and Pociask, S. (2014) The health and economic effects
of counterfeit drugs. American Health & Drug Benefits, 7: 216.
British Pharmacopoeia Commission. British Pharmacopoeia (2017). London: TSO.
Available at: https://www.pharmacopoeia.com/bp-2018/appendices/appendix-
12/appendix-xii-c--consistency-of-formulated-preparations.html?published-date=2017-
08-01#p2p05333 (accessed 28.10.17).
Custers, D. Cauwenbergh, T., Bothy, J. L., Courselle, P., De Beer, J. O., Apers, S. and
Deconinck, E. (2015) ATR-FTIR spectroscopy and chemometrics: An interesting tool to
discriminate and characterize counterfeit medicines. Journal of Pharmaceutical and
Biomedical Analysis, 112: 181-189.
Dégardin, K., Roggo, Y., Been, F. and Margot, P. (2011) Detection and chemical
profiling of medicine counterfeits by Raman spectroscopy and chemometrics. Analytica
Chimica Acta, 705: 334-341.
De Veij, M., Deneckere, A., Vandenabeele, P., de Kaste, D. and Moens, L. (2008)
Detection of counterfeit Viagra® with Raman spectroscopy. Journal of Pharmaceutical
and Biomedical Analysis, 46: 303-309.
Farouk, F. Moussa B. A. and Azzazy, H. M. E. (2011) Fourier transform infrared
spectroscopy for in-process inspection, counterfeit detection and quality control of anti-
diabetic drugs. Spectroscopy, 26: 297-30.
Food and Drug Administration- FDA (2014) Q4B: Annex 6: Uniformity of Dosage Units
General Chapter. Available at
https://www.fda.gov/downloads/Drugs/GuidanceComplianceRegulatoryInformation/Gui
dances/UCM085364.pdf (accessed 01.11.17).
Glass, B.D. (2014) Counterfeit drugs and medical devices in developing
countries. Research and Reports in Tropical Medicine, 2014: 11-22.
127 | P a g e
Haywood, A. and Glass, B. D. (2011) Pharmaceutical excipients- where do we begin.
Australian Prescriber, 34: 112-114.
Hoellein L. and Holzgrabe, U. (2014) Development of simplified HPLC methods for the
detection of counterfeit antimalarials in resource-restraint environments. Journal of
Pharmaceutical and Biomedical Analysis, 98: 434-445.
Hoellein,L., Kaale, E., Mwalwisi, Y. H., Schulze, M. H. and Holzgrabe, U. (2016)
Routine quality control of medicines in developing countries: Analytical challenges,
regulatory infrastructures and the prevalence of counterfeit medicines in
Tanzania. TrAC Trends in Analytical Chemistry, 76: 60-70.
Horiba Scientific. XP Examina, (2016) XploRA™ PLUS Raman Spectrometer. Available
at: http://www.horiba.com/scientific/products/raman-spectroscopy/raman-
spectrometers/raman-microscopes/xp-examina/xp-examina-27571/ (accessed
13.03.16).
Koesdjojo, M. T., Wu, Y., Boonloed, A., Dunfield, E. M. and Remcho, V. T. (2014) Low-
cost, high-speed identification of counterfeit antimalarial drugs on paper. Talanta, 130:
122-127.
Kovacs, S., Hawes, S.E., Maley, S. N., Mosites, E., Wong L. and Stergachis, A. (2014)
Technologies for detecting falsified and substandard drugs in low and middle-income
countries. PloS ONE, 9: e90601.
Kwok K. and Taylor, L. S. (2012) Analysis of the packaging enclosing a counterfeit
pharmaceutical tablet using Raman microscopy and two-dimensional correlation
spectroscopy. Vibrational Spectroscopy, 61: 176-182.
Lawson, G. Ogwu, J. and Tanna, S. (2014) Counterfeit Tablet Investigations: Can ATR
FT/IR Provide Rapid Targeted Quantitative Analyses? Journal of Analytical and.
Bioanalytical Techniques, 5: 214. http://dx.doi.org/10.4172/2155-9872.1000214.
Lawson G, Ogwu J, Tanna S (2018) Quantitative screening of the pharmaceutical
ingredient for the rapid identification of substandard and falsified medicines using
reflectance infrared spectroscopy. PLoS ONE, 13 (8): e0202059
Lyndgaard, L. B. van den Berg, F. and de Juan, A. (2013) Quantification of
paracetamol through tablet blister packages by Raman spectroscopy and multivariate
128 | P a g e
curve resolution-alternating least squares. Chemometrics and Intelligent Laboratory
Systems, 125: 58-66.
Mackey, T.K., Liang, B.A., York, P. and Kubic, T. (2015) Counterfeit drug penetration
into global legitimate medicine supply chains: a global assessment. The American
Journal of Tropical Medicine and Hygiene, 92(6_Suppl): 59-67.
Mallah, M. A., Sherazi, S. T. H., Bhanger, M. I., Mahesar, S. A. and Bajeer, M. A.
(2015) A rapid Fourier-transform infrared (FTIR) spectroscopic method for direct
quantification of paracetamol content in solid pharmaceutical formulations.
Spectrochimica Acta Part A: Molecular and Biomolecular Spectroscopy, 141: 64-70.
Nanda, M.R., Yuan, Z., Qin, W., Poirier, M.A. and Chunbao, X. (2014) Purification of
crude glycerol using acidification: effects of acid types and product characterization.
Austin Journal of Chemical Engineering, 1(1): 1-7.
Neuberger, S. and Neusüß, C. (2015) Determination of counterfeit medicines by
Raman spectroscopy: Systematic study based on a large set of model tablets. Journal
of Pharmaceutical and Biomedical Analysis, 112: 70-78.
Ortiz, R. S., de Cássia Mariotti, K., Fank, B., Limberger, R. P., Anzanello, M. J. and
Mayorga, P. (2013) Counterfeit Cialis and Viagra fingerprinting by ATR-FTIR
spectroscopy with chemometry: Can the same pharmaceutical powder mixture be used
to falsify two medicines? Forensic Science International, 226: 282-289.
Otte, W.M., van Diessen, E., van Eijsden, P., van der Maas, F., Patsalos, P.N.,
Newton, P.N., Alvarenga, I.C., Braun, K.P. and Sander, J.W. (2015) Counterfeit
antiepileptic drugs threaten community services in Guinea-Bissau and Nigeria. The
Lancet Neurology, 14(11): 1075-1076.
PerkinElmer (2005) A multiple reflection ATR system. Available at:
https://shop.perkinelmer.co.uk/Content/TechnicalInfo/TCH_ATRAccessories.pdf
(accessed 15.05.16).
Ranieri, N., Tabernero, P., Green, M. D., Verbois, L., Herrington, J., Sampson, E.,
Satzger, R. D., Phonlavong, C., Thao, K., Newton, P. N. and WitkowskI, M. R. (2014)
Evaluation of a New Handheld Instrument for the Detection of Counterfeit Artesunate
by Visual Fluorescence Comparison. The American Journal of Tropical Medicine and
Hygiene, 91: 920-924.
129 | P a g e
Roggo, Y., Chalus, P., Maurer, L., Lema-Martinez, C., Edmond A. and Jent, N. (2007)
A review of near infrared spectroscopy and chemometrics in pharmaceutical
technologies. Journal of Pharmaceutical and Biomedical Analysis, 44 (3) 683–700.
Rowe, R. C. Sheskey, P. J. Cook, W. G. and Fenton, M. E. (2012) Handbook of
pharmaceutical excipients. Seventh ed., Pharmaceutical Press, London.
Sacré, P. Y., Deconinck, E., De Beer, T., Courselle, P., Vancauwenberghe, R., Chiap,
P., Crommen, J. and De Beer, J.O. (2010) Comparison and combination of
spectroscopic techniques for the detection of counterfeit medicines. Journal of
Pharmaceutical and Biomedical Analysis, 53: 445-453.
Sukkar, E. (2014) Taking stock of counterfeit medicines. The Pharmaceutical Journal,
292: 570.
Vredenbregt, M. J., Blok-Tip, L., Hoogerbrugge, R.,. Barends. D. M. and De Kaste, D.
(2006) Screening suspected counterfeit Viagra® and imitations of Viagra® with near-
infrared spectroscopy. Journal of Pharmaceutical and Biomedical Analysis, 40: 840-
849.
World Health Organisation (WHO) (2017) Key points: World malaria report 2017.
Available at: http://www.who.int/malaria/media/world-malaria-report-2017/en/
(accessed 29.09.18).
130 | P a g e
CHAPTER FOUR
Raman Spectroscopy for rapid
discrimination of tablet medicines
131 | P a g e
4.1 Introduction
As mentioned in Chapter 2, several techniques can, and have been used for the
confirmation of FSMs, depending on the type of information needed. Among these
techniques, Raman spectroscopy is one of the most commonly used for assessing
FSMs (Dégardin et al, 2011; Kwok and Taylor, 2012; Neuberger and Neusüß, 2015;
Peters et al, 2016) because it is largely non-destructive and sample measurement can
be made directly through packaging. In addition, Raman spectroscopy as with other
spectroscopic techniques like the ATR-FTIR, does not require sample preparation and
is environmentally friendly. These features of the Raman technique along with
availability of portable handheld models of the equipment makes it valuable for fast in-
field screening of medicines (Dégardin et al, 2017).
Raman spectroscopy investigates vibrational transitions in molecules and is similar to
both mid and near infrared (IR) spectroscopy. However, Raman spectroscopy depends
on light scattering while IR spectroscopy is hinged on absorption. Monochromatic laser
light (whether visible or near-IR) is used to irradiate samples in Raman spectroscopy.
At the same wave number, most of the light with which the sample is irradiated is
scattered back and this is called Rayleigh scattering (Gala and Chauhan, 2015).
However, in a very small percentage of cases this light is scattered at wave numbers
which are slightly higher (anti-Stokes scattering) or, less often, at lower wave numbers
(Stokes scattering). Collectively, this change from the exact wave number of irradiation
is known as Raman scattering, although Stokes scattering is more commonly reported
since anti-Stokes is much weaker. The difference between the wavenumber of the
incident radiation and the scattered radiation amounts to vibrational energy transitions.
Consequently, it is this vibrational energy change, indicated at the corresponding
wavenumber, Raman spectroscopy detects (Strachan et al, 2007; Gala and Chauhan,
2015). Not only are there vibrational transitions within the molecule but changes
132 | P a g e
between electronic states can also occur giving rise to fluorescence. Fluorescence is
evident as a non-uniform increase in the base line level in the recorded spectrum.
Sample fluorescence masks the Raman response and posed a huge challenge for the
use of Raman spectrometers in the pharmaceutical industry until the advent of novel
experimental methods such as charge coupled device (CCD)-based experiments and
Fourier transform (FT) spectrometers.
Raman scattering is dependent on a change in the electronic polarisability of a
molecule along with the vibrational mode. Polarisability refers to the electron charge
being susceptible to having an induced dipole within it. As a result, large polarisability
changes and in turn strong Raman scattering, are generally linked to molecules with
delocalised electron systems (for example, aromatic conjugated systems). On the other
hand, polar molecules exhibit the strongest IR absorption. Therefore, information
provided by IR and Raman spectroscopy are complementary (Strachan et al, 2007;
Gala and Chauhan, 2015).
Several practical features of Raman spectroscopy make it attractive for solid-state
analysis in the pharmaceutical industry. Most active pharmaceutical ingredients (APIs)
are aromatics making them strong Raman scatterers. In contrast, many excipients are
aliphatic and as a result produce much weaker Raman spectra. Thus, Raman
spectroscopy has its advantages compared to mid- and near-IR spectroscopy when
studying APIs in formulations, especially in low dosage formulations. Furthermore,
while it may be very challenging to conduct mid- and near-IR spectroscopic analyses in
aqueous environments, this will not be the case with Raman spectroscopy since water
is a very poor Raman scatterer. Consequently, Raman spectroscopy will be suitable for
solid-state analysis even in the presence of water (Strachan et al, 2007; Gala and
Chauhan, 2015).
133 | P a g e
Several applications of Raman spectroscopy in pharmaceutical research have been
evaluated from drug formulation to quality control in the pharmaceutical industry (Izake,
2010; Gala and Chauhan, 2015). Kalyanaraman et al (2012) in their review discuss the
general use of the Raman device in the detection of falsified medicines. Luczak and
Kalyanaraman (2014), evaluated results for falsified medicines of three products using
both portable and bench top Raman technologies. A case study assessing the use of
the Raman handheld device for the authentication of medicines in Nigeria is presented
by Spink et al (2016). Hajjou et al (2013) evaluated the specificity and precision of the
handheld Raman device in the screening of six pharmaceutical products including
analgesics, antimalarial and antidiarrheal medicines. Assi (2016) successfully used
dual laser handheld Raman spectroscopy for the authentication and chemical
characterisation of type 5 phosphodiesterase inhibitors with concentrations of API in
the range 5-15% w/w.
Raman spectroscopy has its own draw backs such as fluorescence of some samples
which hampers the accuracy of analytical data and the possibility of samples getting
burnt due to overheating when illuminated with the laser beam. Assi (2016) suggests
different laser excitation wavelengths should be explored to identify wavelength at
which fluorescence is least observed. The difficulty however would be getting a
balance between the right laser excitation wavelength and sensitivity. Overheating or
burning of test samples while using Raman spectroscopy is more likely when the
sample is illuminated with the laser beam on the same spot for a long period. Shin and
Chung (2013) proposed rotating of test samples during analysis to reduce overheating
or burning of the sample. Beyond qualitative analysis and general characterisation of
medicines, Raman spectroscopy has proven useful in the quantitative determination of
APIs in solid dosage forms. Just as with the optimised methods based on ATR-FTIR in
Chapter 3, quantitative determination of tablet samples using the Raman device has
134 | P a g e
been done mostly in combination with chemometric analysis (Strachan et al, 2007;
Fransson et al, 2010; Fraser et al, 2013; Shin and Chung, 2013; Griffen et al, 2015).
Cailletaud et al (2017) in their review and Zheng et al (2014) considered different ways
of improving sensitivity of the Raman device for low dosage quantification. Tondepu et
al (2017) considered the use of portable Raman spectroscopy for the qualitative
analysis and quantification of antiviral and antibiotic drugs but solvent dissolution of
samples was involved. On the other hand, Rebiere et al (2018) applied Raman
spectroscopy and chemometric methods in the screening and direct quantification of
Viagra® and Plavix® test tablet samples and their results showed the deviation of
quantitative data from the reference method was between −15% and +24% of the API
content which was considered acceptable for screening purposes.
Besides the quantitative abilities of the Raman device, it can also be used in forensic
analysis of medicines. Neuberger and Neusüß (2015) considered the use of Raman
spectroscopy in the characterisation of medicines based on differences in the their
excipients, API amounts and mixing quality but they achieved this by extensive pre-
processing of data including normalisation, baseline correction of the spectra and a
reduction in spectral range used for analysis. For valuable forensic information to be
presented in court for instance, it is important that analysis is done using the raw data
to obtain as much information as possible.
This chapter explores the potential of Raman spectroscopy in forensic analysis of
FSMs, its ability to discriminate between different batches of medicines and
characterise them from raw data obtained without any data pre-processing. This
research also proposes its potential use in collecting quick valuable forensic
information tenable in a law court during investigations.
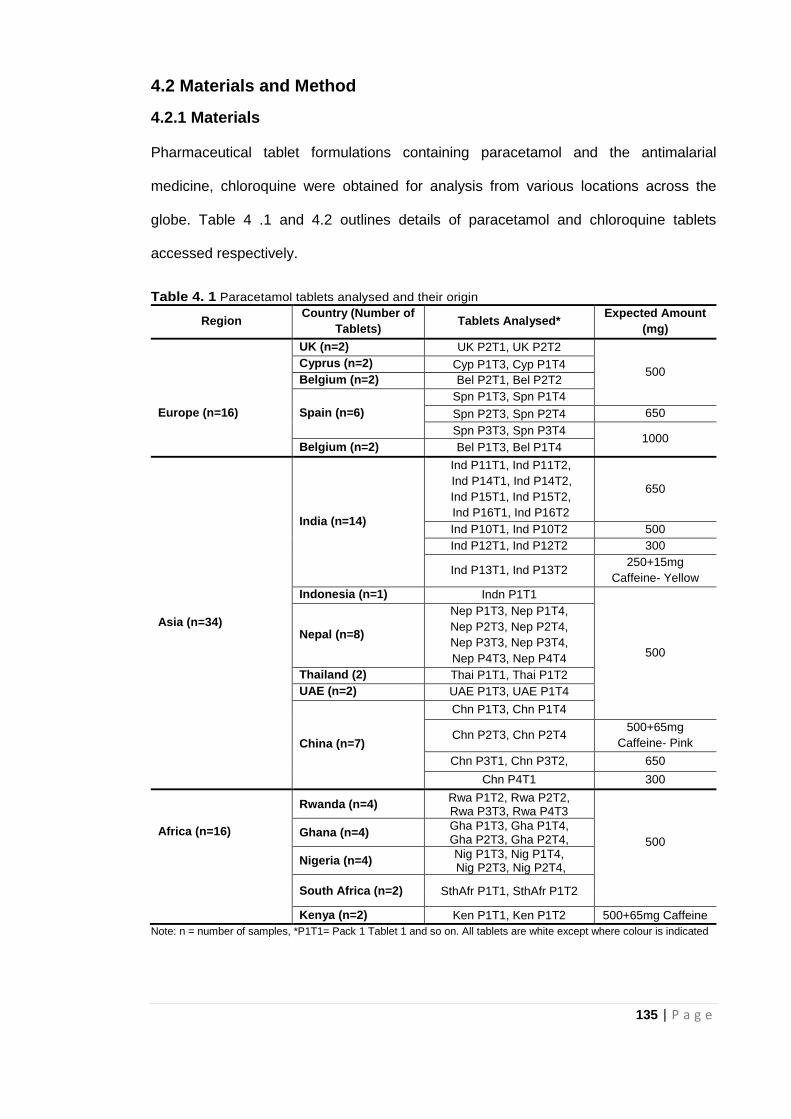
135 | P a g e
4.2 Materials and Method
4.2.1 Materials
Pharmaceutical tablet formulations containing paracetamol and the antimalarial
medicine, chloroquine were obtained for analysis from various locations across the
globe. Table 4 .1 and 4.2 outlines details of paracetamol and chloroquine tablets
accessed respectively.
Table 4. 1 Paracetamol tablets analysed and their origin
Region Country (Number of
Tablets) Tablets Analysed*
Expected Amount
(mg)
UK (n=2) UK P2T1, UK P2T2
500 Cyprus (n=2) Cyp P1T3, Cyp P1T4
Belgium (n=2) Bel P2T1, Bel P2T2
Spn P1T3, Spn P1T4
Europe (n=16) Spain (n=6) Spn P2T3, Spn P2T4 650
Spn P3T3, Spn P3T4 1000
Belgium (n=2) Bel P1T3, Bel P1T4
Asia (n=34)
India (n=14)
Ind P11T1, Ind P11T2,
Ind P14T1, Ind P14T2,
Ind P15T1, Ind P15T2,
Ind P16T1, Ind P16T2
650
Ind P10T1, Ind P10T2 500
Ind P12T1, Ind P12T2 300
Ind P13T1, Ind P13T2 250+15mg
Caffeine- Yellow
Indonesia (n=1) Indn P1T1
500
Nepal (n=8)
Nep P1T3, Nep P1T4,
Nep P2T3, Nep P2T4,
Nep P3T3, Nep P3T4,
Nep P4T3, Nep P4T4
Thailand (2) Thai P1T1, Thai P1T2
UAE (n=2) UAE P1T3, UAE P1T4
China (n=7)
Chn P1T3, Chn P1T4
Chn P2T3, Chn P2T4 500+65mg
Caffeine- Pink
Chn P3T1, Chn P3T2, 650
Chn P4T1 300
Africa (n=16)
Rwanda (n=4) Rwa P1T2, Rwa P2T2, Rwa P3T3, Rwa P4T3
500 Ghana (n=4)
Gha P1T3, Gha P1T4, Gha P2T3, Gha P2T4,
Nigeria (n=4) Nig P1T3, Nig P1T4, Nig P2T3, Nig P2T4,
South Africa (n=2) SthAfr P1T1, SthAfr P1T2
Kenya (n=2) Ken P1T1, Ken P1T2 500+65mg Caffeine
Note: n = number of samples, *P1T1= Pack 1 Tablet 1 and so on. All tablets are white except where colour is indicated
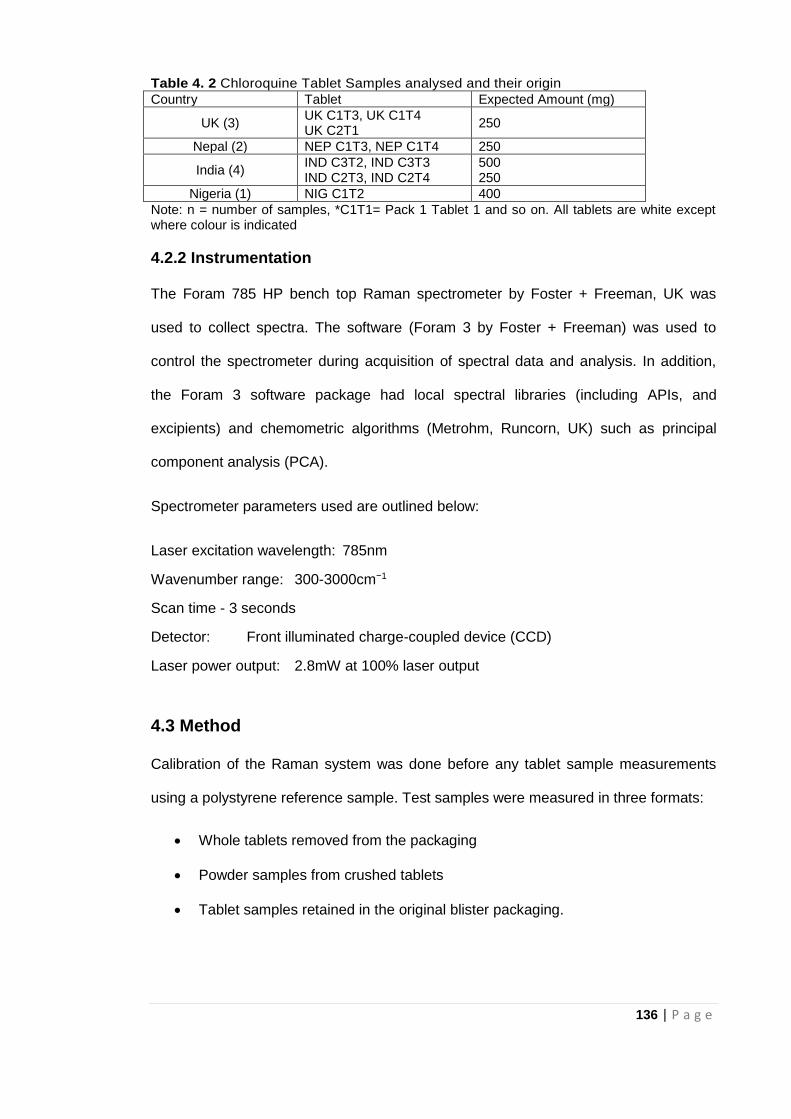
136 | P a g e
Table 4. 2 Chloroquine Tablet Samples analysed and their origin
Country Tablet Expected Amount (mg)
UK (3) UK C1T3, UK C1T4 UK C2T1
250
Nepal (2) NEP C1T3, NEP C1T4 250
India (4) IND C3T2, IND C3T3 IND C2T3, IND C2T4
500 250
Nigeria (1) NIG C1T2 400
Note: n = number of samples, *C1T1= Pack 1 Tablet 1 and so on. All tablets are white except where colour is indicated
4.2.2 Instrumentation
The Foram 785 HP bench top Raman spectrometer by Foster + Freeman, UK was
used to collect spectra. The software (Foram 3 by Foster + Freeman) was used to
control the spectrometer during acquisition of spectral data and analysis. In addition,
the Foram 3 software package had local spectral libraries (including APIs, and
excipients) and chemometric algorithms (Metrohm, Runcorn, UK) such as principal
component analysis (PCA).
Spectrometer parameters used are outlined below:
Laser excitation wavelength: 785nm
Wavenumber range: 300-3000cm−1
Scan time - 3 seconds
Detector: Front illuminated charge-coupled device (CCD)
Laser power output: 2.8mW at 100% laser output
4.3 Method
Calibration of the Raman system was done before any tablet sample measurements
using a polystyrene reference sample. Test samples were measured in three formats:
Whole tablets removed from the packaging
Powder samples from crushed tablets
Tablet samples retained in the original blister packaging.
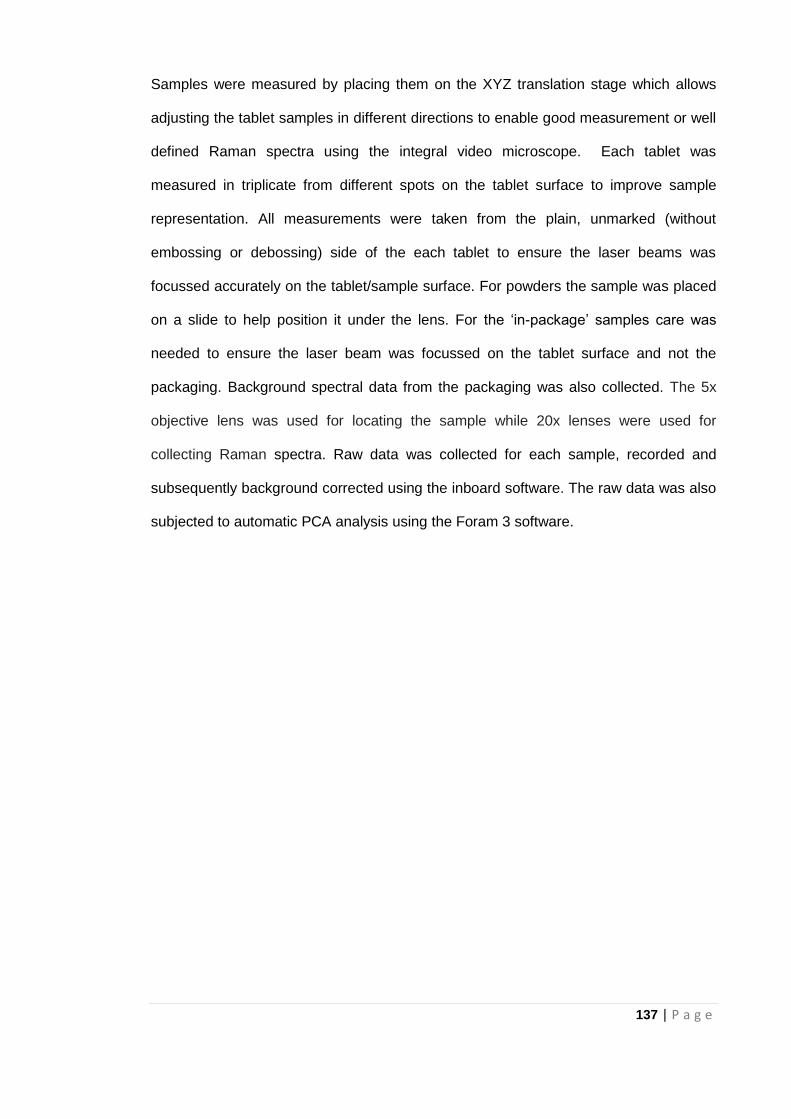
137 | P a g e
Samples were measured by placing them on the XYZ translation stage which allows
adjusting the tablet samples in different directions to enable good measurement or well
defined Raman spectra using the integral video microscope. Each tablet was
measured in triplicate from different spots on the tablet surface to improve sample
representation. All measurements were taken from the plain, unmarked (without
embossing or debossing) side of the each tablet to ensure the laser beams was
focussed accurately on the tablet/sample surface. For powders the sample was placed
on a slide to help position it under the lens. For the ‘in-package’ samples care was
needed to ensure the laser beam was focussed on the tablet surface and not the
packaging. Background spectral data from the packaging was also collected. The 5x
objective lens was used for locating the sample while 20x lenses were used for
collecting Raman spectra. Raw data was collected for each sample, recorded and
subsequently background corrected using the inboard software. The raw data was also
subjected to automatic PCA analysis using the Foram 3 software.
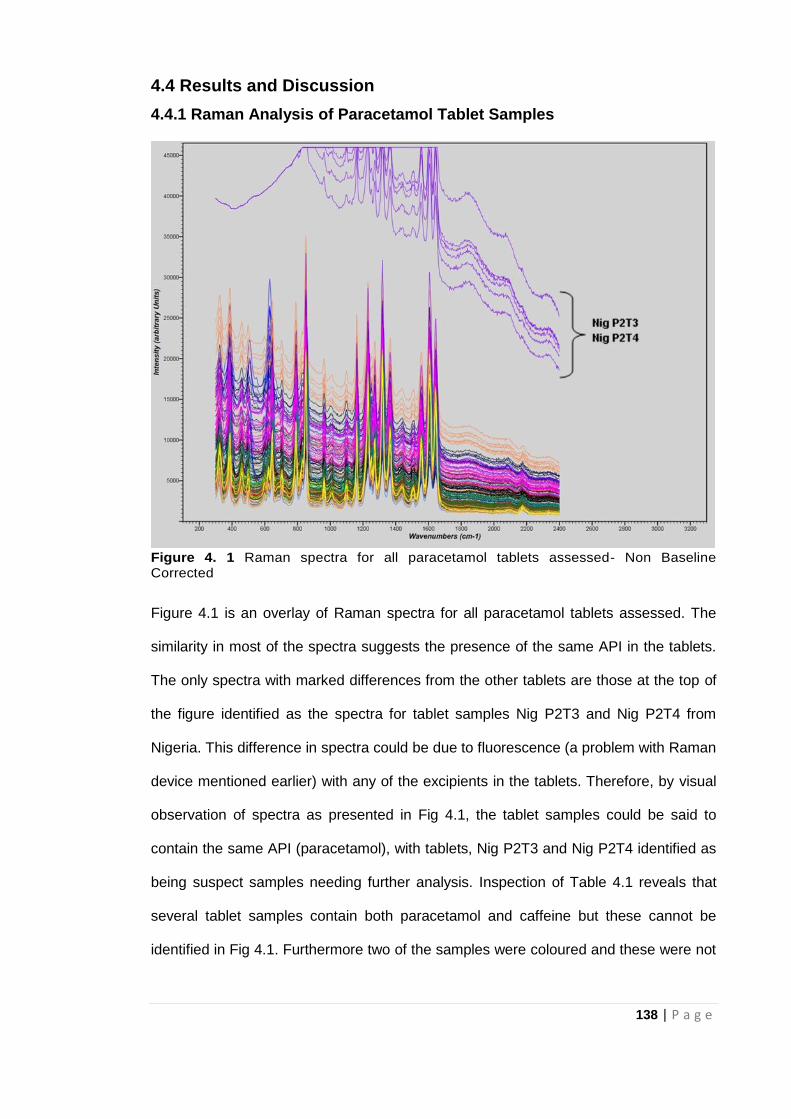
138 | P a g e
4.4 Results and Discussion
4.4.1 Raman Analysis of Paracetamol Tablet Samples
Figure 4. 1 Raman spectra for all paracetamol tablets assessed- Non Baseline Corrected
Figure 4.1 is an overlay of Raman spectra for all paracetamol tablets assessed. The
similarity in most of the spectra suggests the presence of the same API in the tablets.
The only spectra with marked differences from the other tablets are those at the top of
the figure identified as the spectra for tablet samples Nig P2T3 and Nig P2T4 from
Nigeria. This difference in spectra could be due to fluorescence (a problem with Raman
device mentioned earlier) with any of the excipients in the tablets. Therefore, by visual
observation of spectra as presented in Fig 4.1, the tablet samples could be said to
contain the same API (paracetamol), with tablets, Nig P2T3 and Nig P2T4 identified as
being suspect samples needing further analysis. Inspection of Table 4.1 reveals that
several tablet samples contain both paracetamol and caffeine but these cannot be
identified in Fig 4.1. Furthermore two of the samples were coloured and these were not
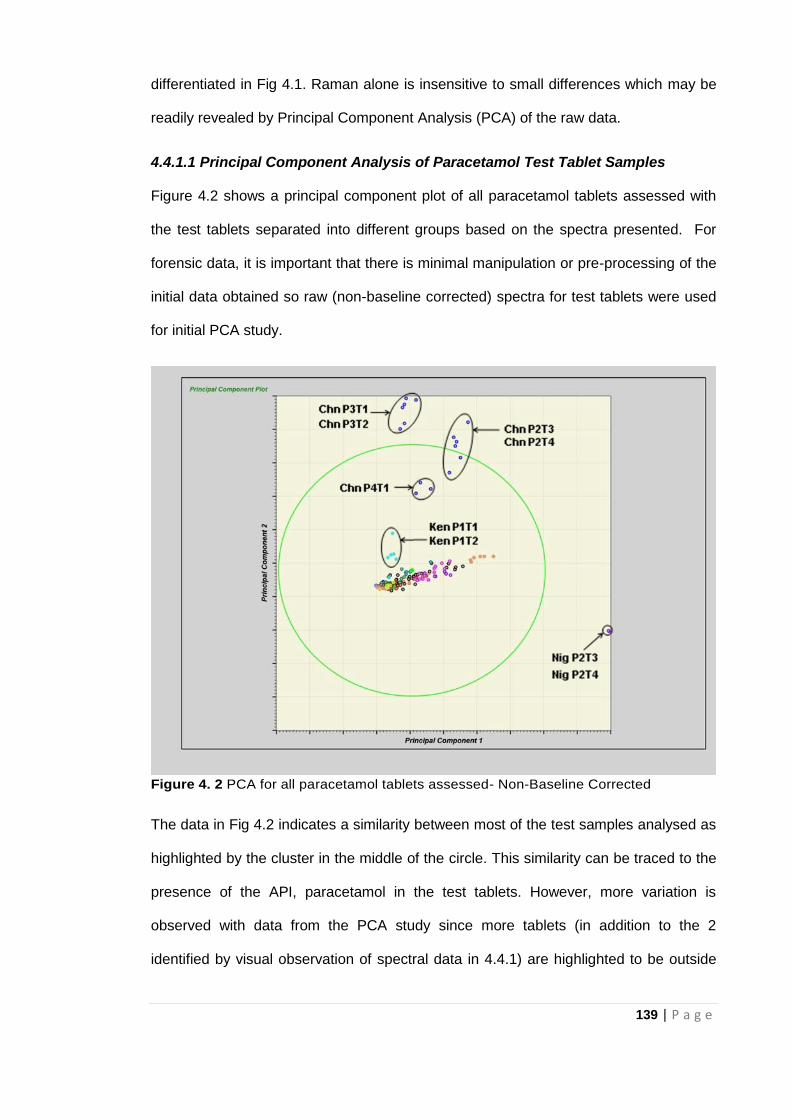
139 | P a g e
differentiated in Fig 4.1. Raman alone is insensitive to small differences which may be
readily revealed by Principal Component Analysis (PCA) of the raw data.
4.4.1.1 Principal Component Analysis of Paracetamol Test Tablet Samples
Figure 4.2 shows a principal component plot of all paracetamol tablets assessed with
the test tablets separated into different groups based on the spectra presented. For
forensic data, it is important that there is minimal manipulation or pre-processing of the
initial data obtained so raw (non-baseline corrected) spectra for test tablets were used
for initial PCA study.
Figure 4. 2 PCA for all paracetamol tablets assessed- Non-Baseline Corrected
The data in Fig 4.2 indicates a similarity between most of the test samples analysed as
highlighted by the cluster in the middle of the circle. This similarity can be traced to the
presence of the API, paracetamol in the test tablets. However, more variation is
observed with data from the PCA study since more tablets (in addition to the 2
identified by visual observation of spectral data in 4.4.1) are highlighted to be outside
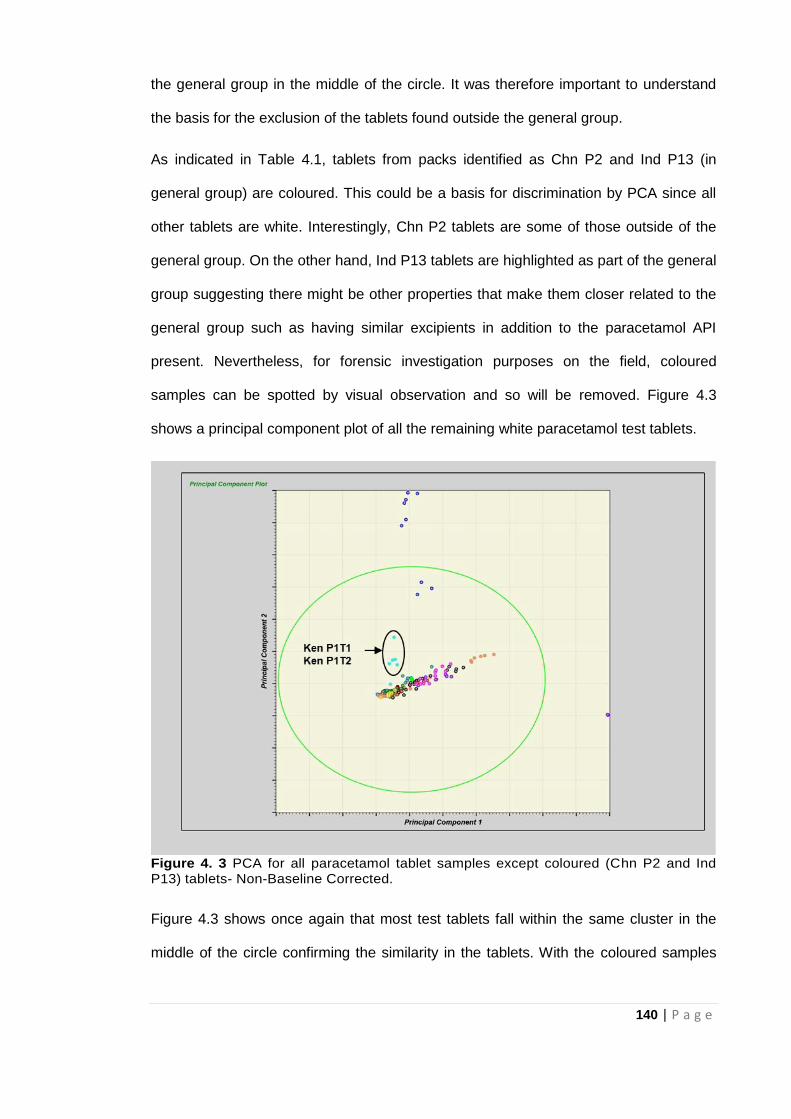
140 | P a g e
the general group in the middle of the circle. It was therefore important to understand
the basis for the exclusion of the tablets found outside the general group.
As indicated in Table 4.1, tablets from packs identified as Chn P2 and Ind P13 (in
general group) are coloured. This could be a basis for discrimination by PCA since all
other tablets are white. Interestingly, Chn P2 tablets are some of those outside of the
general group. On the other hand, Ind P13 tablets are highlighted as part of the general
group suggesting there might be other properties that make them closer related to the
general group such as having similar excipients in addition to the paracetamol API
present. Nevertheless, for forensic investigation purposes on the field, coloured
samples can be spotted by visual observation and so will be removed. Figure 4.3
shows a principal component plot of all the remaining white paracetamol test tablets.
Figure 4. 3 PCA for all paracetamol tablet samples except coloured (Chn P2 and Ind P13) tablets- Non-Baseline Corrected.
Figure 4.3 shows once again that most test tablets fall within the same cluster in the
middle of the circle confirming the similarity in the tablets. With the coloured samples
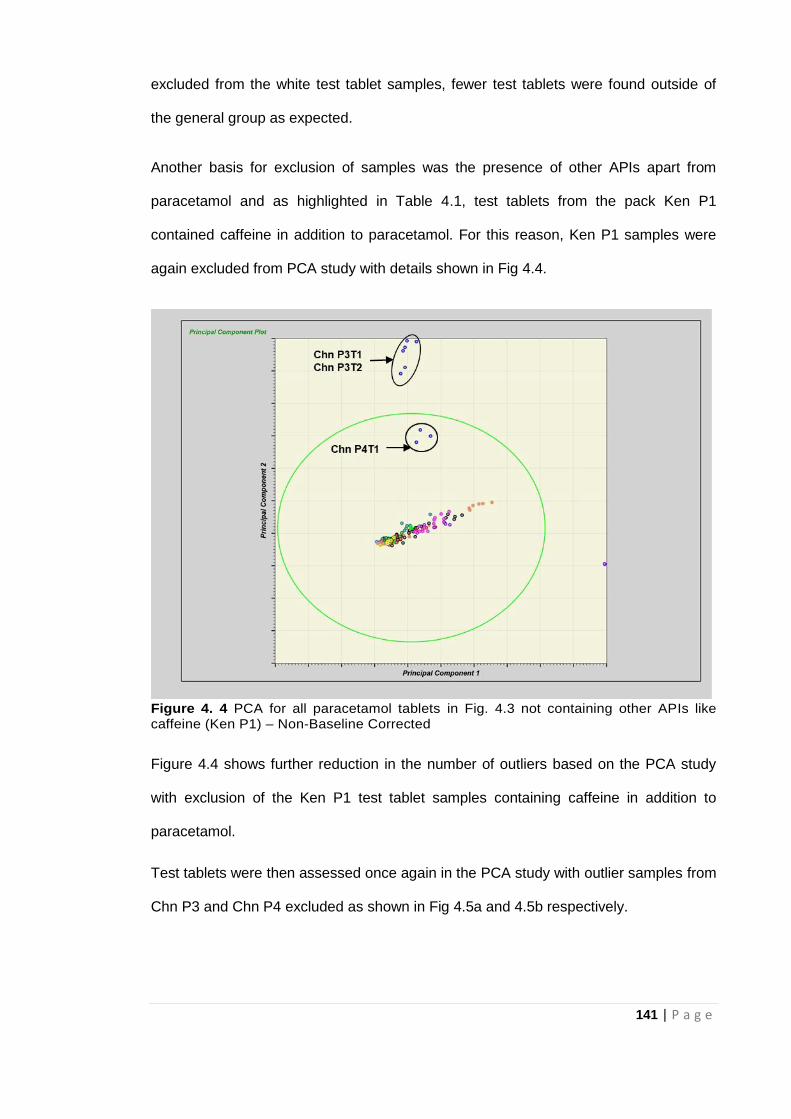
141 | P a g e
excluded from the white test tablet samples, fewer test tablets were found outside of
the general group as expected.
Another basis for exclusion of samples was the presence of other APIs apart from
paracetamol and as highlighted in Table 4.1, test tablets from the pack Ken P1
contained caffeine in addition to paracetamol. For this reason, Ken P1 samples were
again excluded from PCA study with details shown in Fig 4.4.
Figure 4. 4 PCA for all paracetamol tablets in Fig. 4.3 not containing other APIs like caffeine (Ken P1) – Non-Baseline Corrected
Figure 4.4 shows further reduction in the number of outliers based on the PCA study
with exclusion of the Ken P1 test tablet samples containing caffeine in addition to
paracetamol.
Test tablets were then assessed once again in the PCA study with outlier samples from
Chn P3 and Chn P4 excluded as shown in Fig 4.5a and 4.5b respectively.
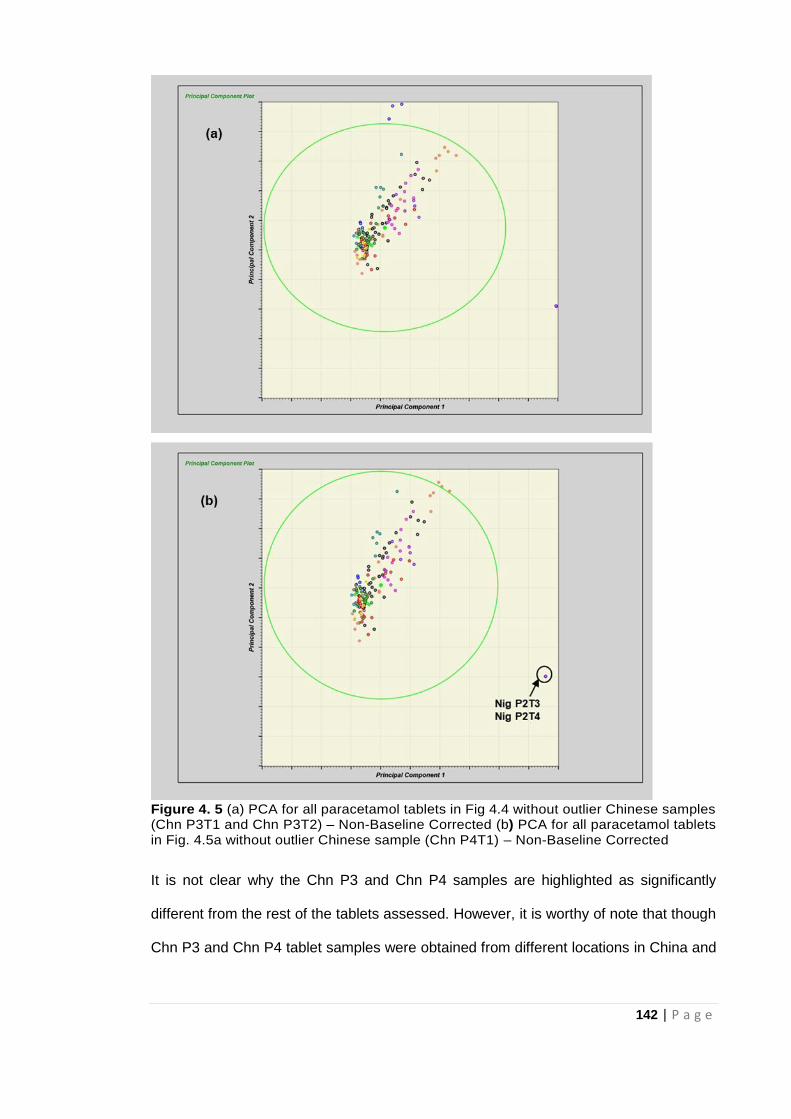
142 | P a g e
Figure 4. 5 (a) PCA for all paracetamol tablets in Fig 4.4 without outlier Chinese samples (Chn P3T1 and Chn P3T2) – Non-Baseline Corrected (b) PCA for all paracetamol tablets in Fig. 4.5a without outlier Chinese sample (Chn P4T1) – Non-Baseline Corrected
It is not clear why the Chn P3 and Chn P4 samples are highlighted as significantly
different from the rest of the tablets assessed. However, it is worthy of note that though
Chn P3 and Chn P4 tablet samples were obtained from different locations in China and
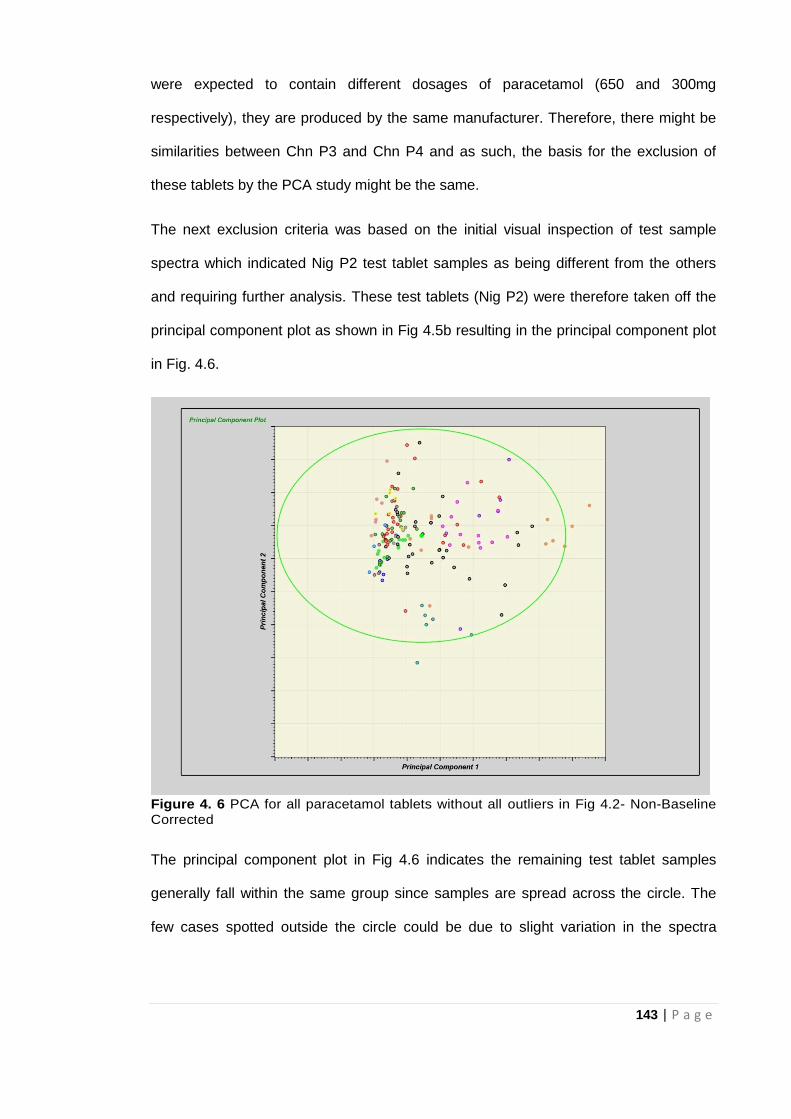
143 | P a g e
were expected to contain different dosages of paracetamol (650 and 300mg
respectively), they are produced by the same manufacturer. Therefore, there might be
similarities between Chn P3 and Chn P4 and as such, the basis for the exclusion of
these tablets by the PCA study might be the same.
The next exclusion criteria was based on the initial visual inspection of test sample
spectra which indicated Nig P2 test tablet samples as being different from the others
and requiring further analysis. These test tablets (Nig P2) were therefore taken off the
principal component plot as shown in Fig 4.5b resulting in the principal component plot
in Fig. 4.6.
Figure 4. 6 PCA for all paracetamol tablets without all outliers in Fig 4.2- Non-Baseline Corrected
The principal component plot in Fig 4.6 indicates the remaining test tablet samples
generally fall within the same group since samples are spread across the circle. The
few cases spotted outside the circle could be due to slight variation in the spectra
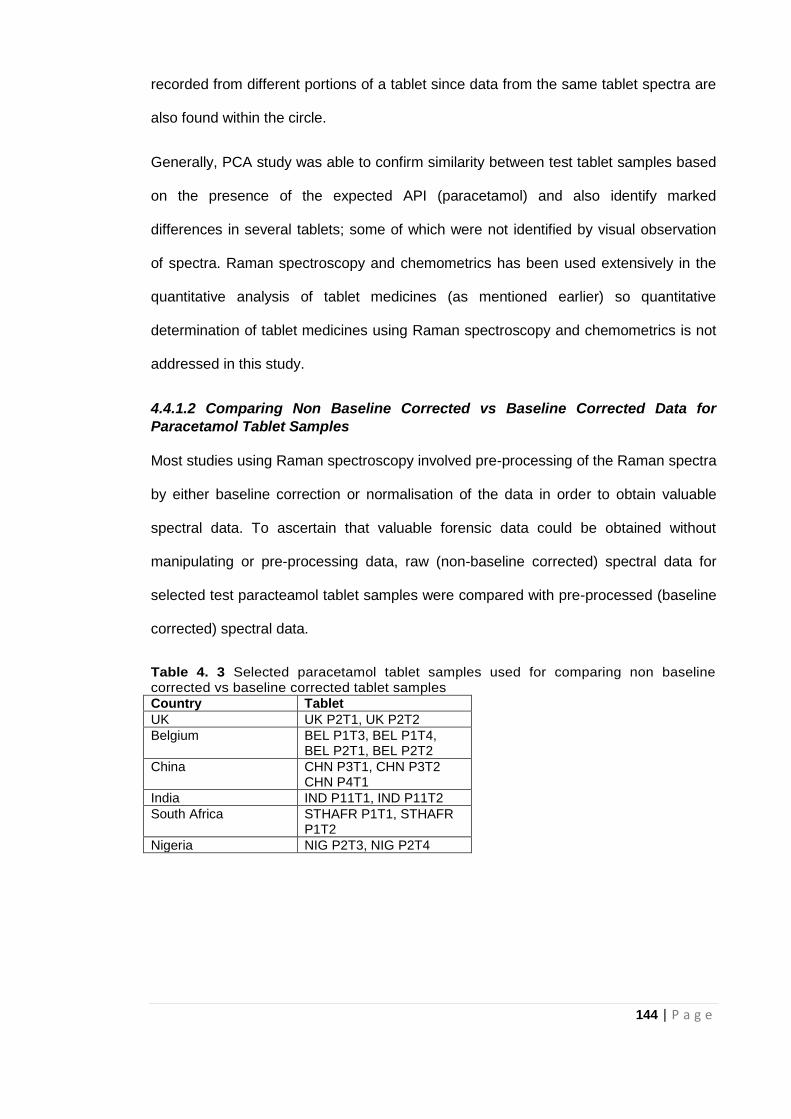
144 | P a g e
recorded from different portions of a tablet since data from the same tablet spectra are
also found within the circle.
Generally, PCA study was able to confirm similarity between test tablet samples based
on the presence of the expected API (paracetamol) and also identify marked
differences in several tablets; some of which were not identified by visual observation
of spectra. Raman spectroscopy and chemometrics has been used extensively in the
quantitative analysis of tablet medicines (as mentioned earlier) so quantitative
determination of tablet medicines using Raman spectroscopy and chemometrics is not
addressed in this study.
4.4.1.2 Comparing Non Baseline Corrected vs Baseline Corrected Data for
Paracetamol Tablet Samples
Most studies using Raman spectroscopy involved pre-processing of the Raman spectra
by either baseline correction or normalisation of the data in order to obtain valuable
spectral data. To ascertain that valuable forensic data could be obtained without
manipulating or pre-processing data, raw (non-baseline corrected) spectral data for
selected test paracteamol tablet samples were compared with pre-processed (baseline
corrected) spectral data.
Table 4. 3 Selected paracetamol tablet samples used for comparing non baseline corrected vs baseline corrected tablet samples
Country Tablet
UK UK P2T1, UK P2T2
Belgium BEL P1T3, BEL P1T4, BEL P2T1, BEL P2T2
China CHN P3T1, CHN P3T2 CHN P4T1
India IND P11T1, IND P11T2
South Africa STHAFR P1T1, STHAFR P1T2
Nigeria NIG P2T3, NIG P2T4
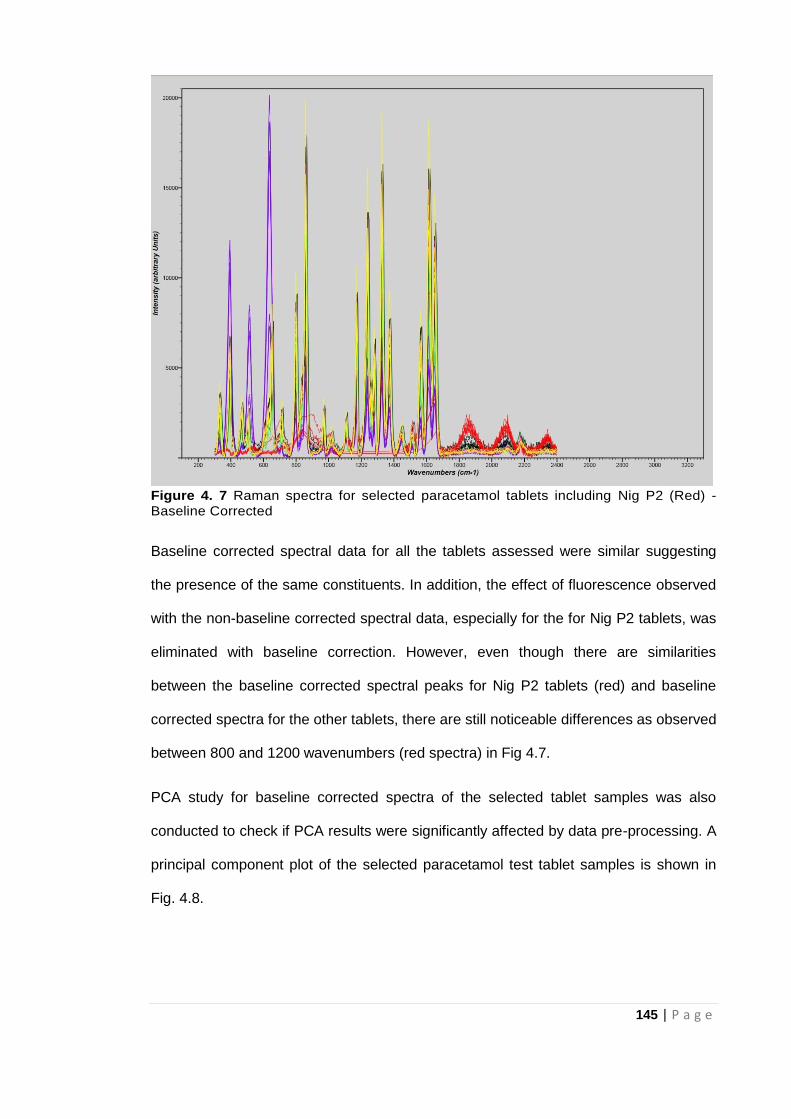
145 | P a g e
Figure 4. 7 Raman spectra for selected paracetamol tablets including Nig P2 (Red) - Baseline Corrected
Baseline corrected spectral data for all the tablets assessed were similar suggesting
the presence of the same constituents. In addition, the effect of fluorescence observed
with the non-baseline corrected spectral data, especially for the for Nig P2 tablets, was
eliminated with baseline correction. However, even though there are similarities
between the baseline corrected spectral peaks for Nig P2 tablets (red) and baseline
corrected spectra for the other tablets, there are still noticeable differences as observed
between 800 and 1200 wavenumbers (red spectra) in Fig 4.7.
PCA study for baseline corrected spectra of the selected tablet samples was also
conducted to check if PCA results were significantly affected by data pre-processing. A
principal component plot of the selected paracetamol test tablet samples is shown in
Fig. 4.8.
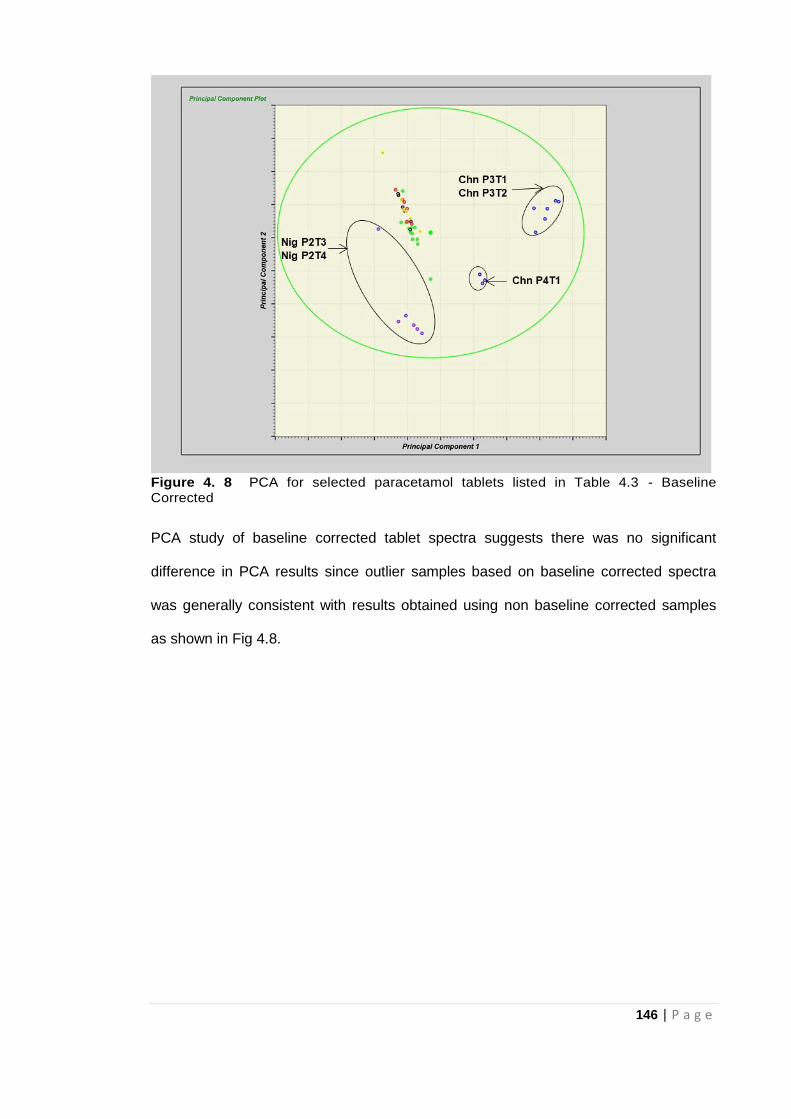
146 | P a g e
Figure 4. 8 PCA for selected paracetamol tablets listed in Table 4.3 - Baseline Corrected
PCA study of baseline corrected tablet spectra suggests there was no significant
difference in PCA results since outlier samples based on baseline corrected spectra
was generally consistent with results obtained using non baseline corrected samples
as shown in Fig 4.8.

147 | P a g e
Figure 4. 9 PCA for selected paracetamol tablets - Baseline Corrected vs Non-Baseline Corrected
Both baseline corrected and non-baseline corrected spectra for the selected
paracetamol tablets were subjected to PCA study at the same time to check if the
system could identify differences between raw and pre-processed (manipulated) data.
Figure 4.9 indicates the system is clearly able to discriminate between baseline
corrected and non-baseline corrected spectra. It can also be observed that variation
between baseline corrected spectra is not as pronounced as with non-baseline
corrected spectra.
4.4.1.3 Comparing Raman data for whole tablet vs crushed (powder) samples of
selected paracetamol tablets
Raman data for selected whole paracetamol tablets (Table 4.4) was compared with
crushed powder samples of the same tablets to check if this made a huge difference on
the final outcome. Non baseline corrected spectral data was used for this.

148 | P a g e
Table 4. 4 Selected Paracetamol tablet samples used for comparing tablet vs powder data
Country Tablet
Belgium BEL P2T1
Spain SPN P1T3
China CHN P2T3
Nepal NEP P1T3
UAE UAE P1T3
Rwanda RWA P3T3, RWA P4T3
Nigeria NIG P1T1, NIG P2T3
Figure 4. 10 Spectra for powder samples of selected paracetamol tablets- Non-Baseline Corrected
Figure 4.10 shows non-baseline corrected spectra for powder samples of the selected
paracetamol tablets. The same peaks are present in the spectra of the powdered
samples but at significantly reduced intensity. The effect of fluorescence on the spectra
for the crushed Nig P2 tablet is not as strong as it was with the whole tablet since
spectral peaks are better defined. PCA studies were also conducted for the powder
samples as highlighted in Fig 4.11.
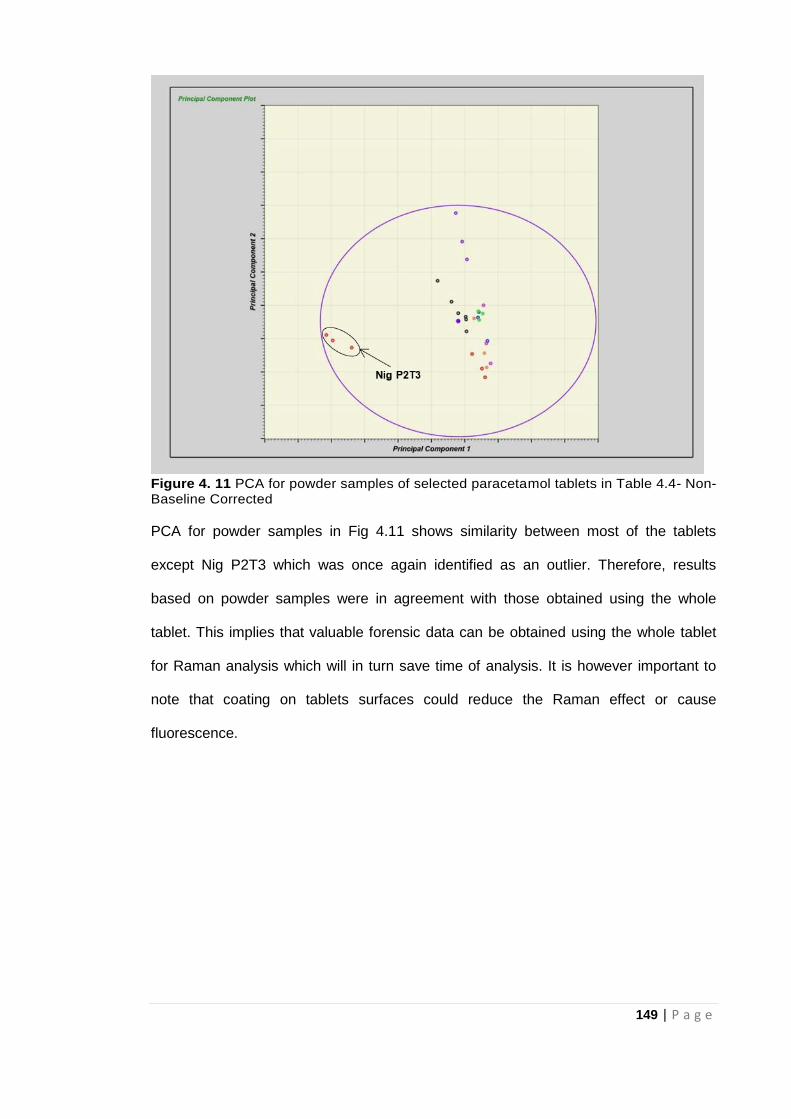
149 | P a g e
Figure 4. 11 PCA for powder samples of selected paracetamol tablets in Table 4.4- Non- Baseline Corrected
PCA for powder samples in Fig 4.11 shows similarity between most of the tablets
except Nig P2T3 which was once again identified as an outlier. Therefore, results
based on powder samples were in agreement with those obtained using the whole
tablet. This implies that valuable forensic data can be obtained using the whole tablet
for Raman analysis which will in turn save time of analysis. It is however important to
note that coating on tablets surfaces could reduce the Raman effect or cause
fluorescence.
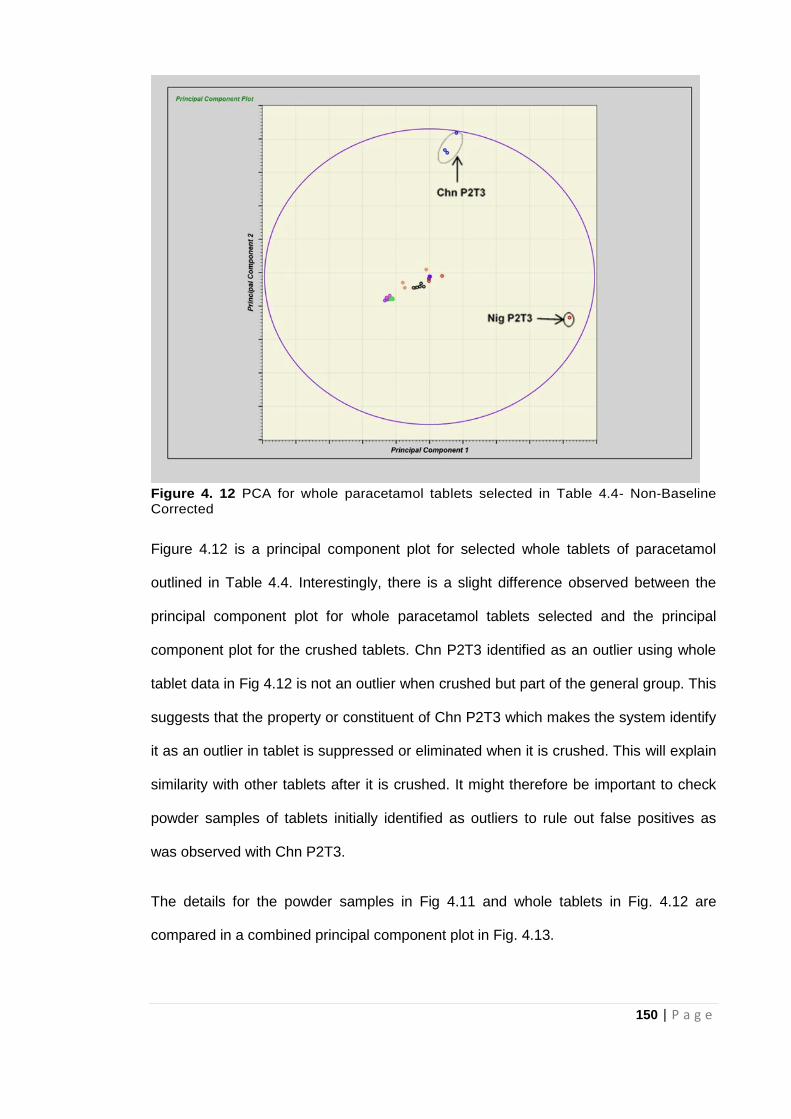
150 | P a g e
Figure 4. 12 PCA for whole paracetamol tablets selected in Table 4.4- Non-Baseline Corrected
Figure 4.12 is a principal component plot for selected whole tablets of paracetamol
outlined in Table 4.4. Interestingly, there is a slight difference observed between the
principal component plot for whole paracetamol tablets selected and the principal
component plot for the crushed tablets. Chn P2T3 identified as an outlier using whole
tablet data in Fig 4.12 is not an outlier when crushed but part of the general group. This
suggests that the property or constituent of Chn P2T3 which makes the system identify
it as an outlier in tablet is suppressed or eliminated when it is crushed. This will explain
similarity with other tablets after it is crushed. It might therefore be important to check
powder samples of tablets initially identified as outliers to rule out false positives as
was observed with Chn P2T3.
The details for the powder samples in Fig 4.11 and whole tablets in Fig. 4.12 are
compared in a combined principal component plot in Fig. 4.13.
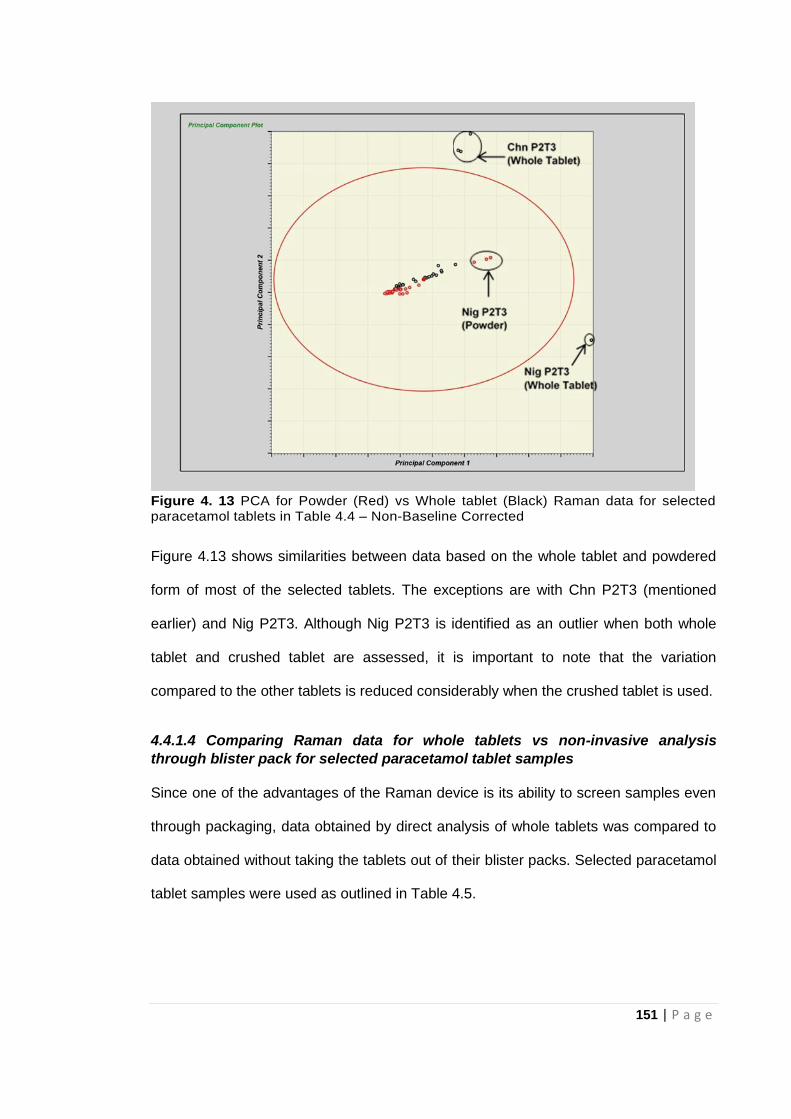
151 | P a g e
Figure 4. 13 PCA for Powder (Red) vs Whole tablet (Black) Raman data for selected paracetamol tablets in Table 4.4 – Non-Baseline Corrected
Figure 4.13 shows similarities between data based on the whole tablet and powdered
form of most of the selected tablets. The exceptions are with Chn P2T3 (mentioned
earlier) and Nig P2T3. Although Nig P2T3 is identified as an outlier when both whole
tablet and crushed tablet are assessed, it is important to note that the variation
compared to the other tablets is reduced considerably when the crushed tablet is used.
4.4.1.4 Comparing Raman data for whole tablets vs non-invasive analysis
through blister pack for selected paracetamol tablet samples
Since one of the advantages of the Raman device is its ability to screen samples even
through packaging, data obtained by direct analysis of whole tablets was compared to
data obtained without taking the tablets out of their blister packs. Selected paracetamol
tablet samples were used as outlined in Table 4.5.
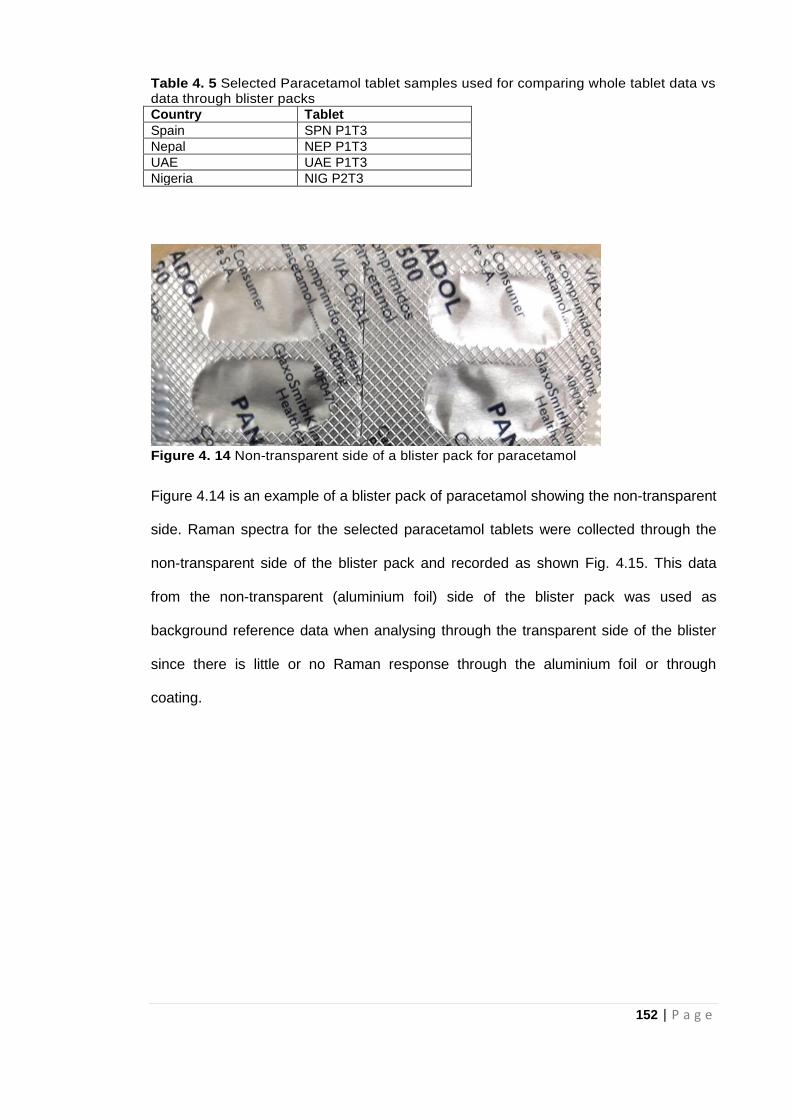
152 | P a g e
Table 4. 5 Selected Paracetamol tablet samples used for comparing whole tablet data vs data through blister packs
Country Tablet
Spain SPN P1T3
Nepal NEP P1T3
UAE UAE P1T3
Nigeria NIG P2T3
Figure 4. 14 Non-transparent side of a blister pack for paracetamol
Figure 4.14 is an example of a blister pack of paracetamol showing the non-transparent
side. Raman spectra for the selected paracetamol tablets were collected through the
non-transparent side of the blister pack and recorded as shown Fig. 4.15. This data
from the non-transparent (aluminium foil) side of the blister pack was used as
background reference data when analysing through the transparent side of the blister
since there is little or no Raman response through the aluminium foil or through
coating.
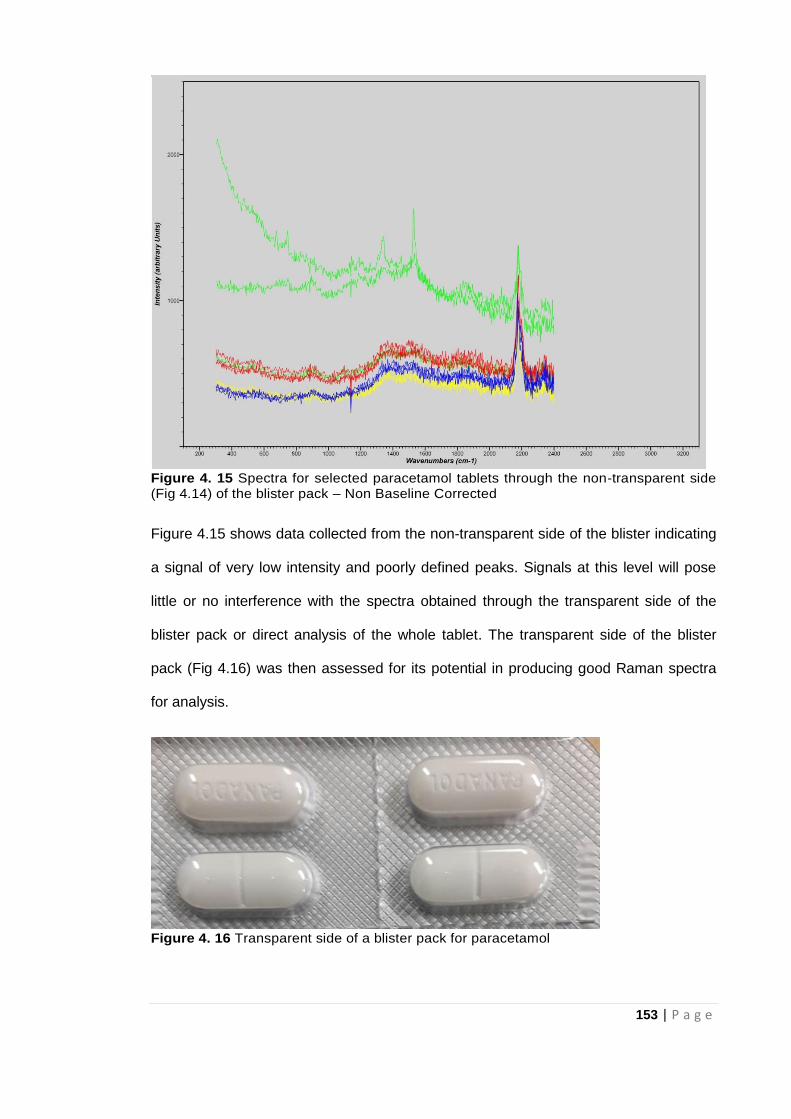
153 | P a g e
Figure 4. 15 Spectra for selected paracetamol tablets through the non-transparent side (Fig 4.14) of the blister pack – Non Baseline Corrected
Figure 4.15 shows data collected from the non-transparent side of the blister indicating
a signal of very low intensity and poorly defined peaks. Signals at this level will pose
little or no interference with the spectra obtained through the transparent side of the
blister pack or direct analysis of the whole tablet. The transparent side of the blister
pack (Fig 4.16) was then assessed for its potential in producing good Raman spectra
for analysis.
Figure 4. 16 Transparent side of a blister pack for paracetamol
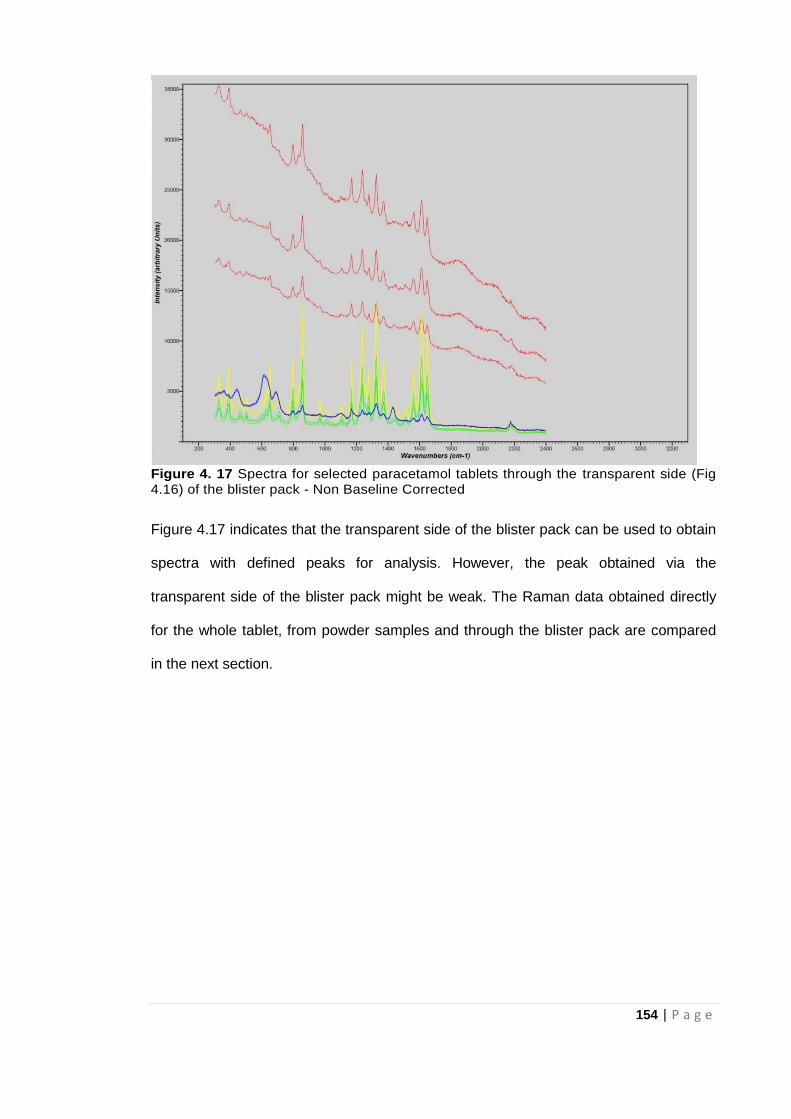
154 | P a g e
Figure 4. 17 Spectra for selected paracetamol tablets through the transparent side (Fig 4.16) of the blister pack - Non Baseline Corrected
Figure 4.17 indicates that the transparent side of the blister pack can be used to obtain
spectra with defined peaks for analysis. However, the peak obtained via the
transparent side of the blister pack might be weak. The Raman data obtained directly
for the whole tablet, from powder samples and through the blister pack are compared
in the next section.
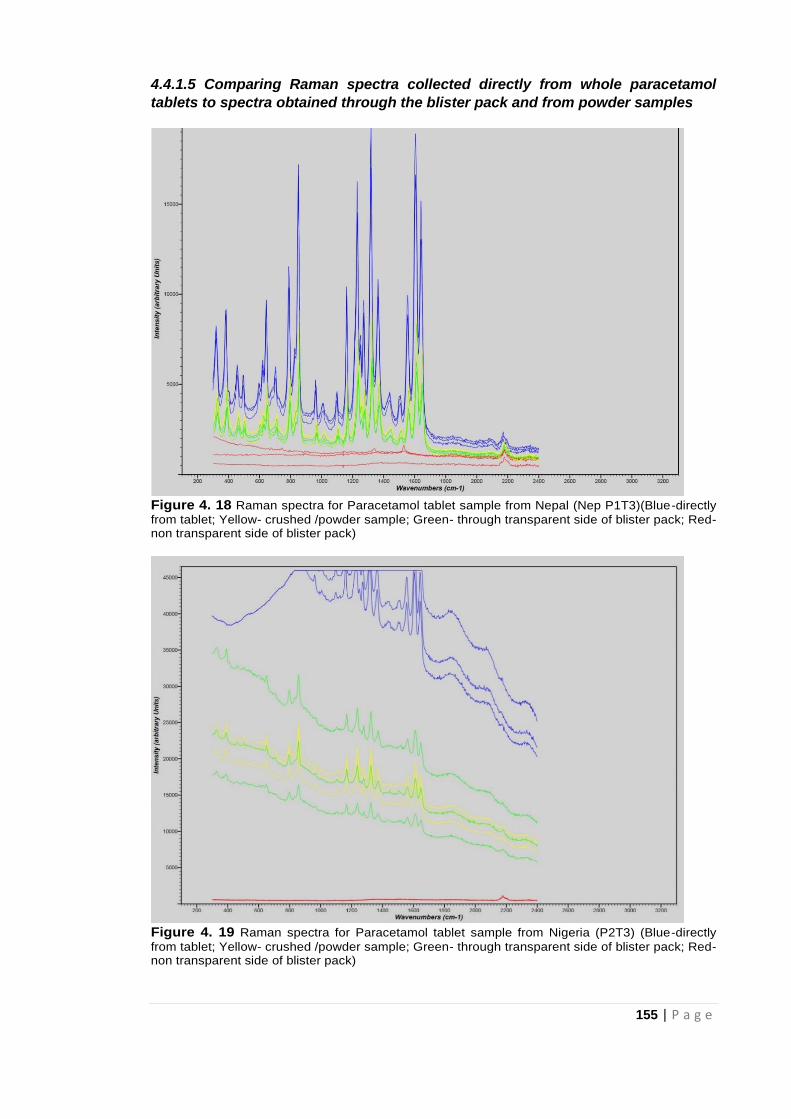
155 | P a g e
4.4.1.5 Comparing Raman spectra collected directly from whole paracetamol
tablets to spectra obtained through the blister pack and from powder samples
Figure 4. 18 Raman spectra for Paracetamol tablet sample from Nepal (Nep P1T3)(Blue-directly
from tablet; Yellow- crushed /powder sample; Green- through transparent side of blister pack; Red- non transparent side of blister pack)
Figure 4. 19 Raman spectra for Paracetamol tablet sample from Nigeria (P2T3) (Blue-directly
from tablet; Yellow- crushed /powder sample; Green- through transparent side of blister pack; Red- non transparent side of blister pack)
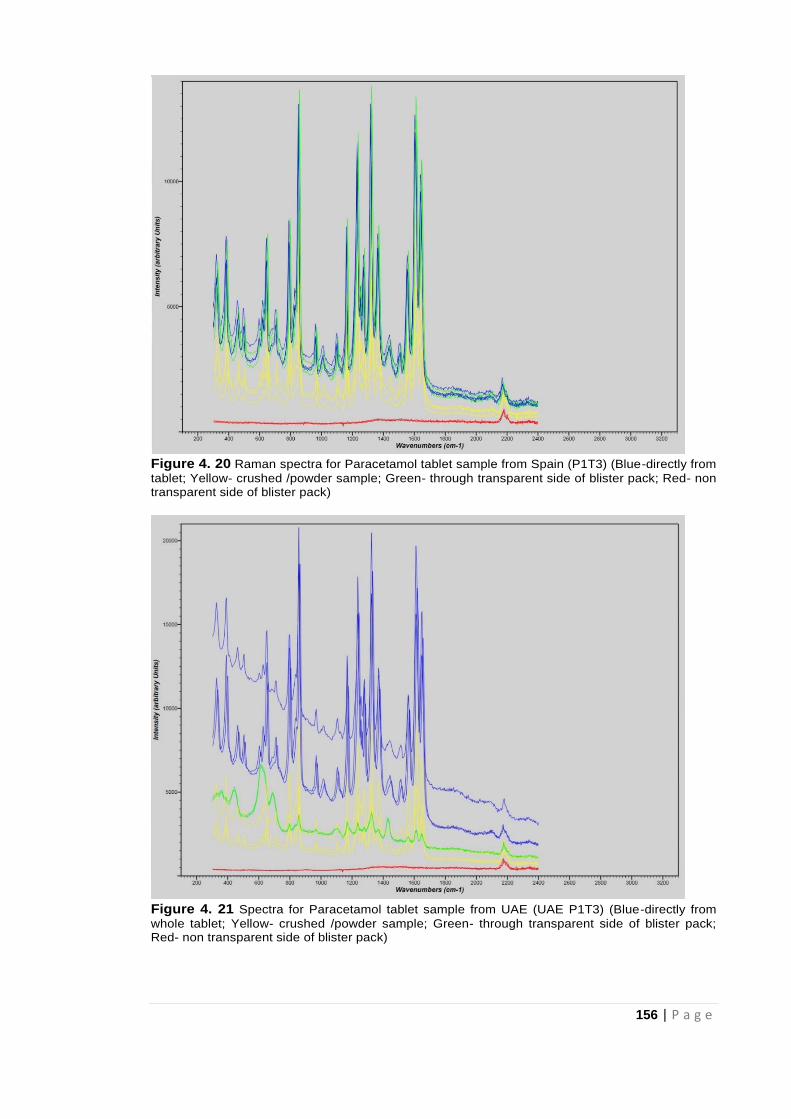
156 | P a g e
Figure 4. 20 Raman spectra for Paracetamol tablet sample from Spain (P1T3) (Blue-directly from
tablet; Yellow- crushed /powder sample; Green- through transparent side of blister pack; Red- non transparent side of blister pack)
Figure 4. 21 Spectra for Paracetamol tablet sample from UAE (UAE P1T3) (Blue-directly from
whole tablet; Yellow- crushed /powder sample; Green- through transparent side of blister pack; Red- non transparent side of blister pack)
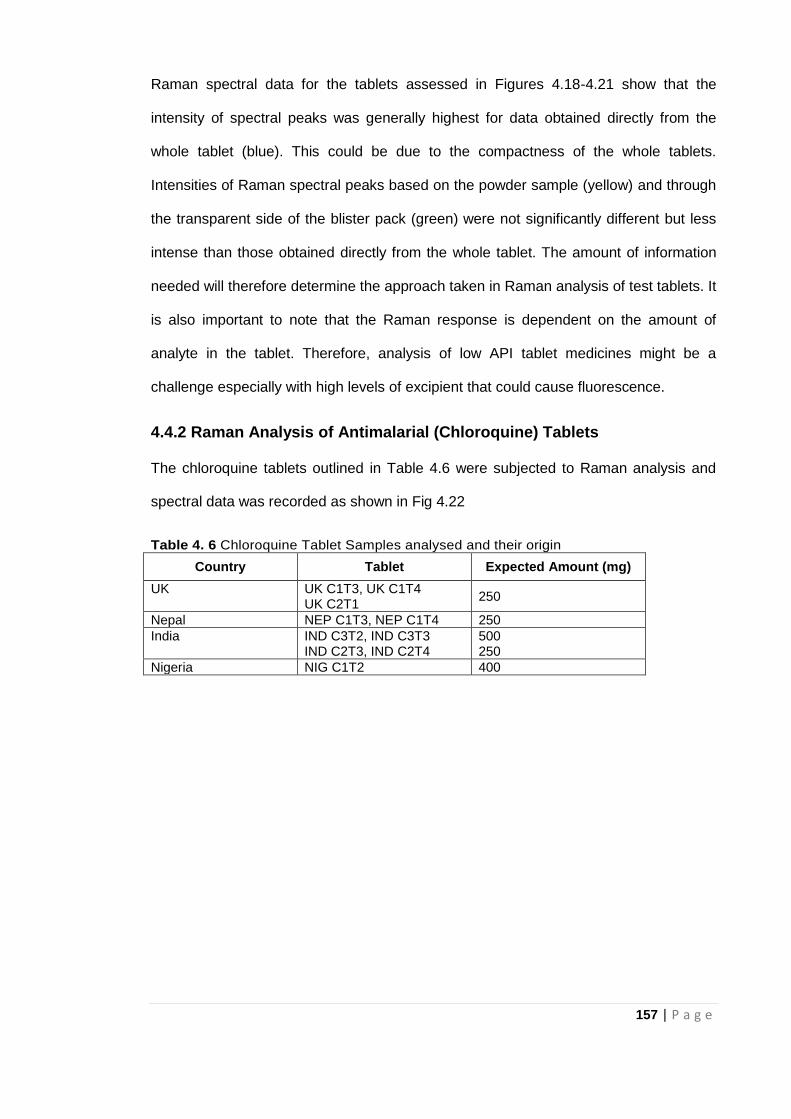
157 | P a g e
Raman spectral data for the tablets assessed in Figures 4.18-4.21 show that the
intensity of spectral peaks was generally highest for data obtained directly from the
whole tablet (blue). This could be due to the compactness of the whole tablets.
Intensities of Raman spectral peaks based on the powder sample (yellow) and through
the transparent side of the blister pack (green) were not significantly different but less
intense than those obtained directly from the whole tablet. The amount of information
needed will therefore determine the approach taken in Raman analysis of test tablets. It
is also important to note that the Raman response is dependent on the amount of
analyte in the tablet. Therefore, analysis of low API tablet medicines might be a
challenge especially with high levels of excipient that could cause fluorescence.
4.4.2 Raman Analysis of Antimalarial (Chloroquine) Tablets
The chloroquine tablets outlined in Table 4.6 were subjected to Raman analysis and
spectral data was recorded as shown in Fig 4.22
Table 4. 6 Chloroquine Tablet Samples analysed and their origin
Country Tablet Expected Amount (mg)
UK UK C1T3, UK C1T4 UK C2T1
250
Nepal NEP C1T3, NEP C1T4 250
India IND C3T2, IND C3T3 IND C2T3, IND C2T4
500 250
Nigeria NIG C1T2 400

158 | P a g e
Figure 4. 22 Raman spectra for chloroquine tablet samples- Non Baseline Corrected
Figure 4.22 shows the Raman spectra of all the chloroquine tablets which contain the
anticipated characteristic Raman peaks for chloroquine (740, 900, 1110, 1360, 1380
and 1550 wavenumbers) thus confirming the presence of the same constituent/API
(chloroquine). The different levels of fluorescence (IndC2 vs Ind C3 suggests different
excipient concentrations and the variations in the TiO2 peaks (650, 500 and 370 cm-1)
confirm this. Baseline corrected data for the chloroquine tablets are displayed in Fig
4.23.
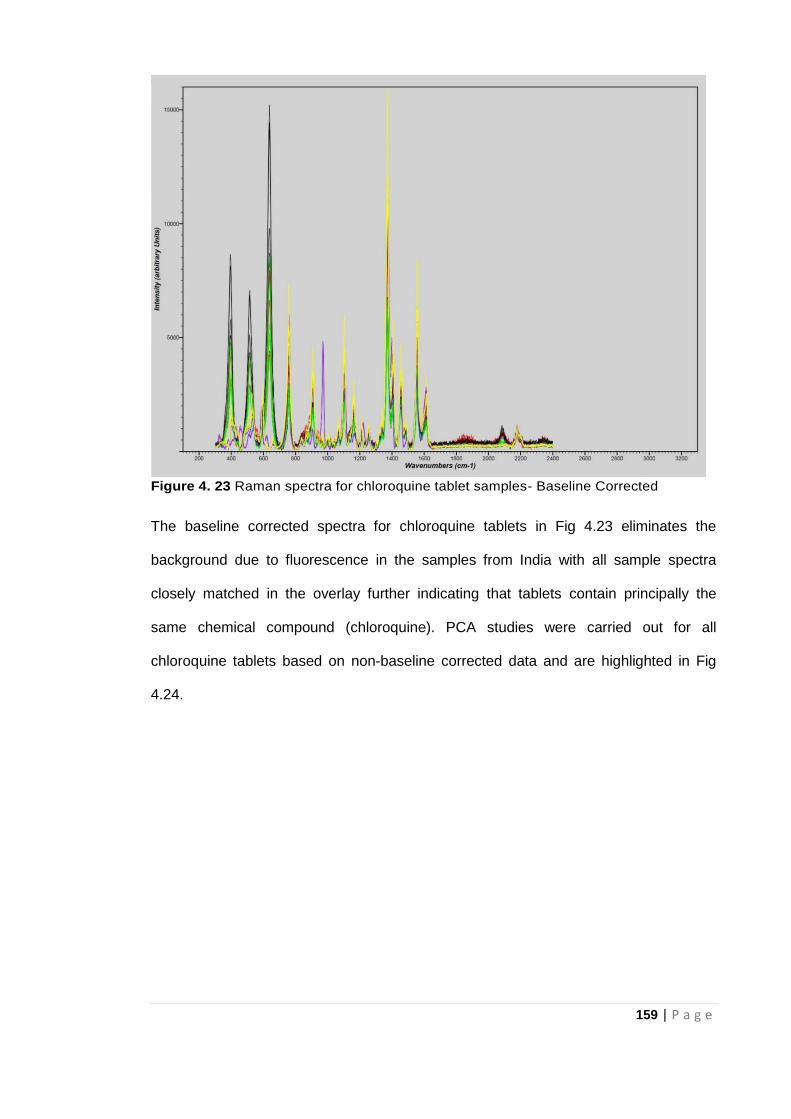
159 | P a g e
Figure 4. 23 Raman spectra for chloroquine tablet samples- Baseline Corrected
The baseline corrected spectra for chloroquine tablets in Fig 4.23 eliminates the
background due to fluorescence in the samples from India with all sample spectra
closely matched in the overlay further indicating that tablets contain principally the
same chemical compound (chloroquine). PCA studies were carried out for all
chloroquine tablets based on non-baseline corrected data and are highlighted in Fig
4.24.
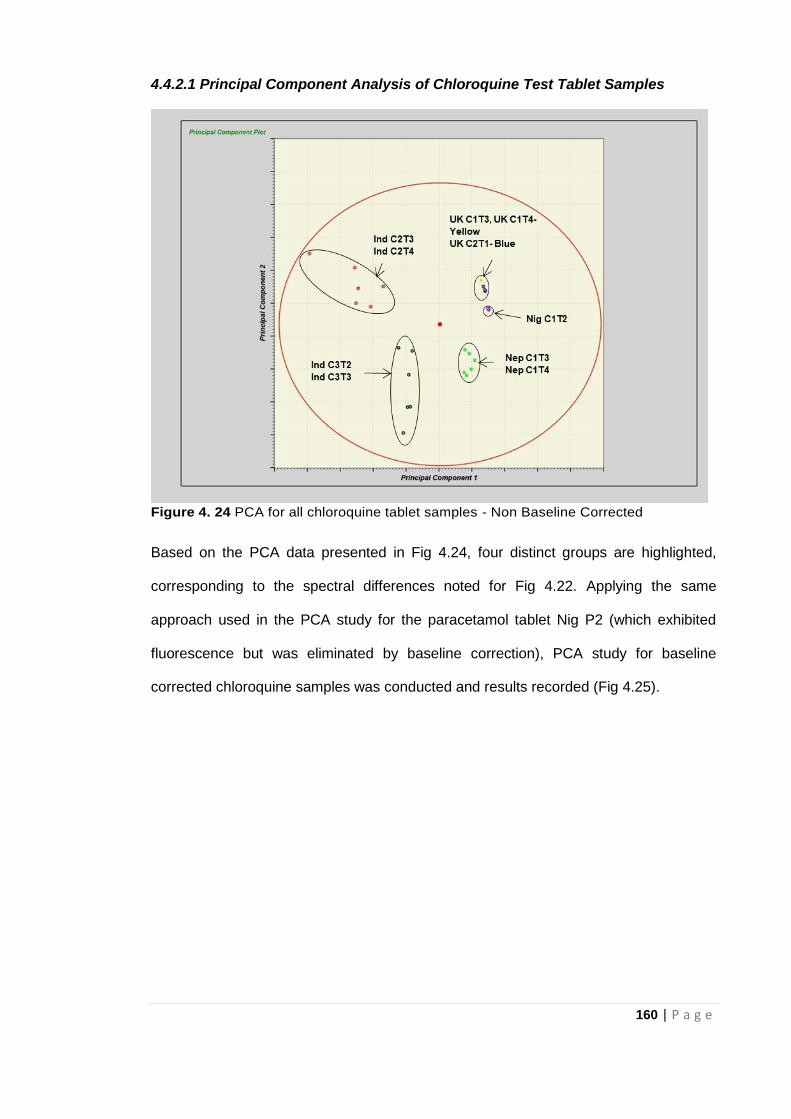
160 | P a g e
4.4.2.1 Principal Component Analysis of Chloroquine Test Tablet Samples
Figure 4. 24 PCA for all chloroquine tablet samples - Non Baseline Corrected
Based on the PCA data presented in Fig 4.24, four distinct groups are highlighted,
corresponding to the spectral differences noted for Fig 4.22. Applying the same
approach used in the PCA study for the paracetamol tablet Nig P2 (which exhibited
fluorescence but was eliminated by baseline correction), PCA study for baseline
corrected chloroquine samples was conducted and results recorded (Fig 4.25).
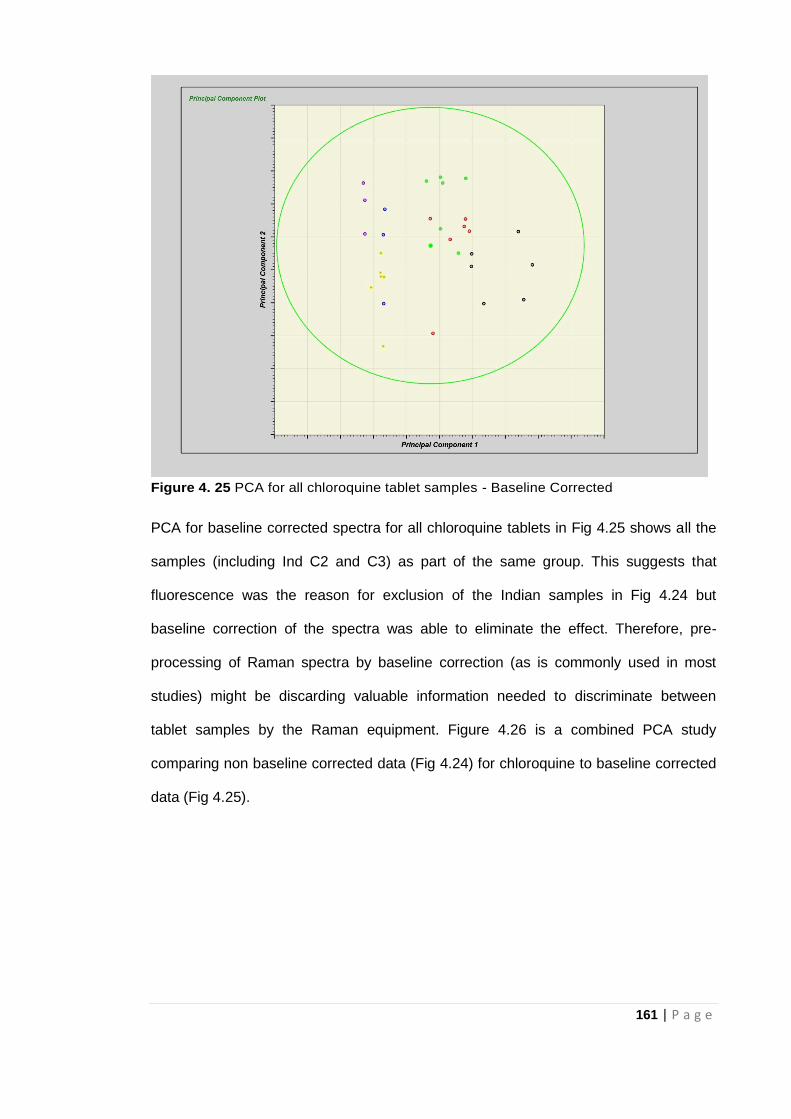
161 | P a g e
Figure 4. 25 PCA for all chloroquine tablet samples - Baseline Corrected
PCA for baseline corrected spectra for all chloroquine tablets in Fig 4.25 shows all the
samples (including Ind C2 and C3) as part of the same group. This suggests that
fluorescence was the reason for exclusion of the Indian samples in Fig 4.24 but
baseline correction of the spectra was able to eliminate the effect. Therefore, pre-
processing of Raman spectra by baseline correction (as is commonly used in most
studies) might be discarding valuable information needed to discriminate between
tablet samples by the Raman equipment. Figure 4.26 is a combined PCA study
comparing non baseline corrected data (Fig 4.24) for chloroquine to baseline corrected
data (Fig 4.25).
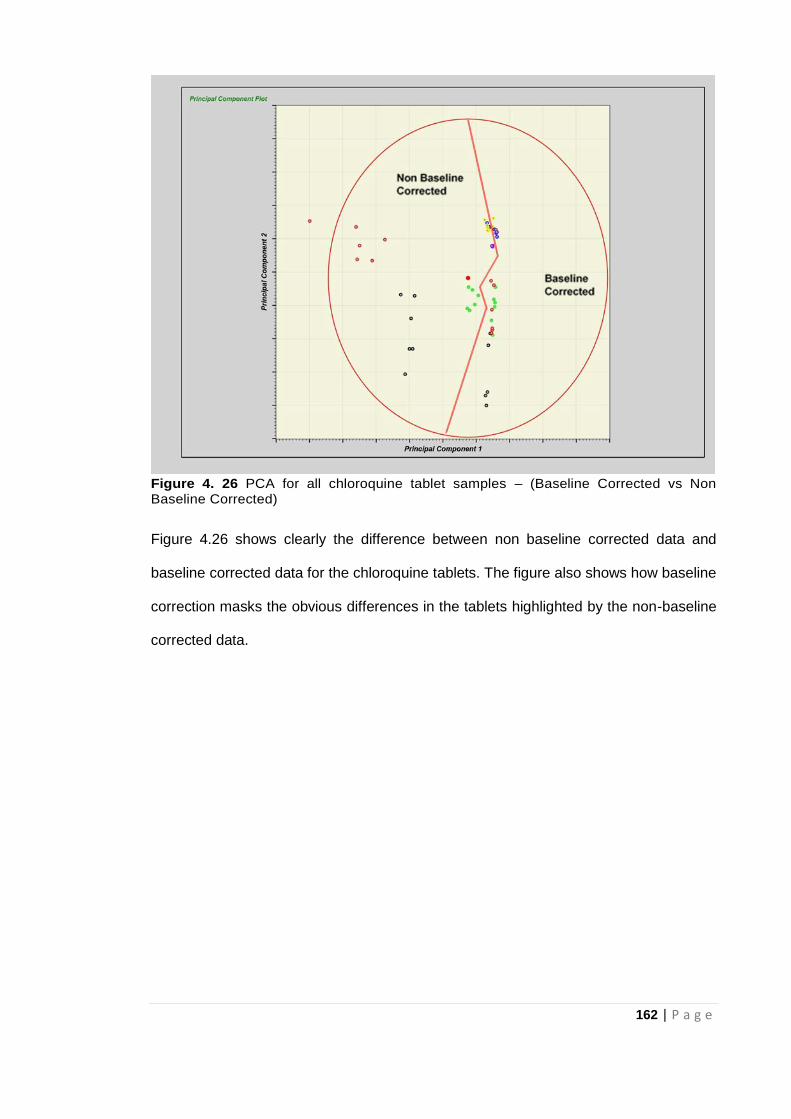
162 | P a g e
Figure 4. 26 PCA for all chloroquine tablet samples – (Baseline Corrected vs Non Baseline Corrected)
Figure 4.26 shows clearly the difference between non baseline corrected data and
baseline corrected data for the chloroquine tablets. The figure also shows how baseline
correction masks the obvious differences in the tablets highlighted by the non-baseline
corrected data.
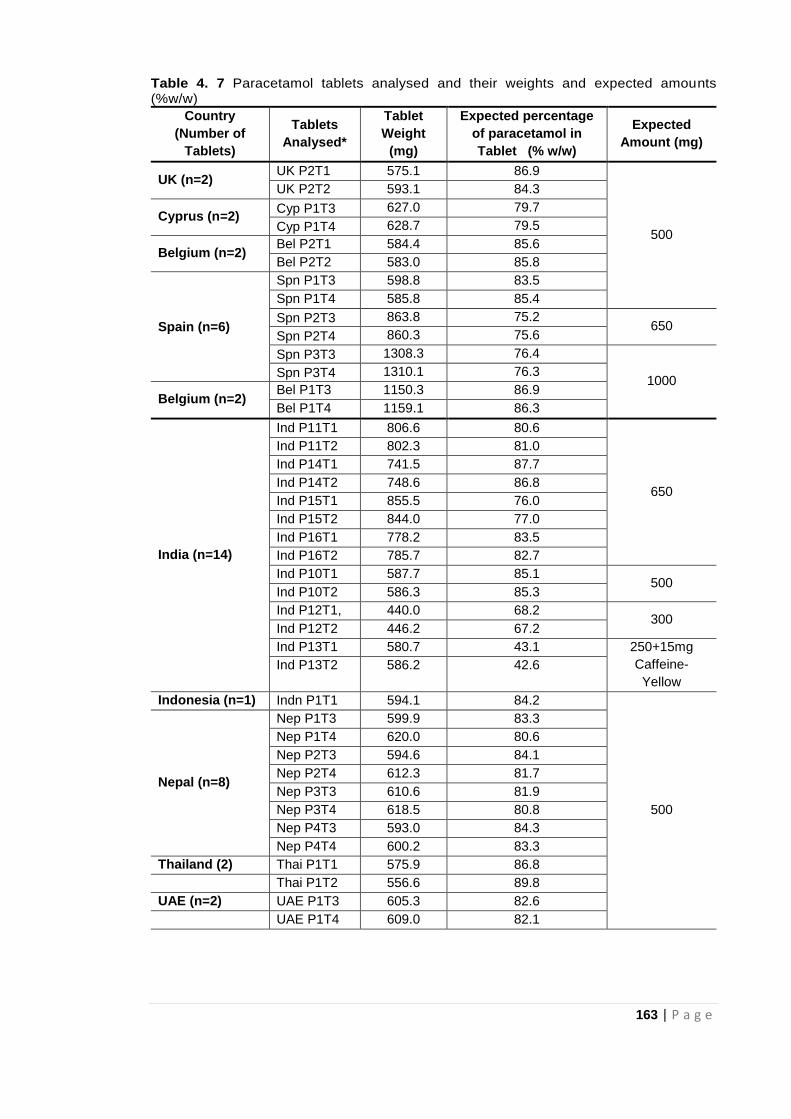
163 | P a g e
Table 4. 7 Paracetamol tablets analysed and their weights and expected amounts (%w/w)
Country
(Number of
Tablets)
Tablets
Analysed*
Tablet
Weight
(mg)
Expected percentage
of paracetamol in
Tablet (% w/w)
Expected
Amount (mg)
UK (n=2) UK P2T1 575.1 86.9
500
UK P2T2 593.1 84.3
Cyprus (n=2) Cyp P1T3 627.0 79.7
Cyp P1T4 628.7 79.5
Belgium (n=2) Bel P2T1 584.4 85.6
Bel P2T2 583.0 85.8
Spain (n=6)
Spn P1T3 598.8 83.5
Spn P1T4 585.8 85.4
Spn P2T3 863.8 75.2 650
Spn P2T4 860.3 75.6
Spn P3T3 1308.3 76.4
1000 Spn P3T4 1310.1 76.3
Belgium (n=2) Bel P1T3 1150.3 86.9
Bel P1T4 1159.1 86.3
India (n=14)
Ind P11T1 806.6 80.6
650
Ind P11T2 802.3 81.0
Ind P14T1 741.5 87.7
Ind P14T2 748.6 86.8
Ind P15T1 855.5 76.0
Ind P15T2 844.0 77.0
Ind P16T1 778.2 83.5
Ind P16T2 785.7 82.7
Ind P10T1 587.7 85.1 500
Ind P10T2 586.3 85.3
Ind P12T1, 440.0 68.2 300
Ind P12T2 446.2 67.2
Ind P13T1 580.7 43.1 250+15mg
Caffeine-
Yellow
Ind P13T2 586.2 42.6
Indonesia (n=1) Indn P1T1 594.1 84.2
500
Nepal (n=8)
Nep P1T3 599.9 83.3
Nep P1T4 620.0 80.6
Nep P2T3 594.6 84.1
Nep P2T4 612.3 81.7
Nep P3T3 610.6 81.9
Nep P3T4 618.5 80.8
Nep P4T3 593.0 84.3
Nep P4T4 600.2 83.3
Thailand (2) Thai P1T1 575.9 86.8
Thai P1T2 556.6 89.8
UAE (n=2) UAE P1T3 605.3 82.6
UAE P1T4 609.0 82.1
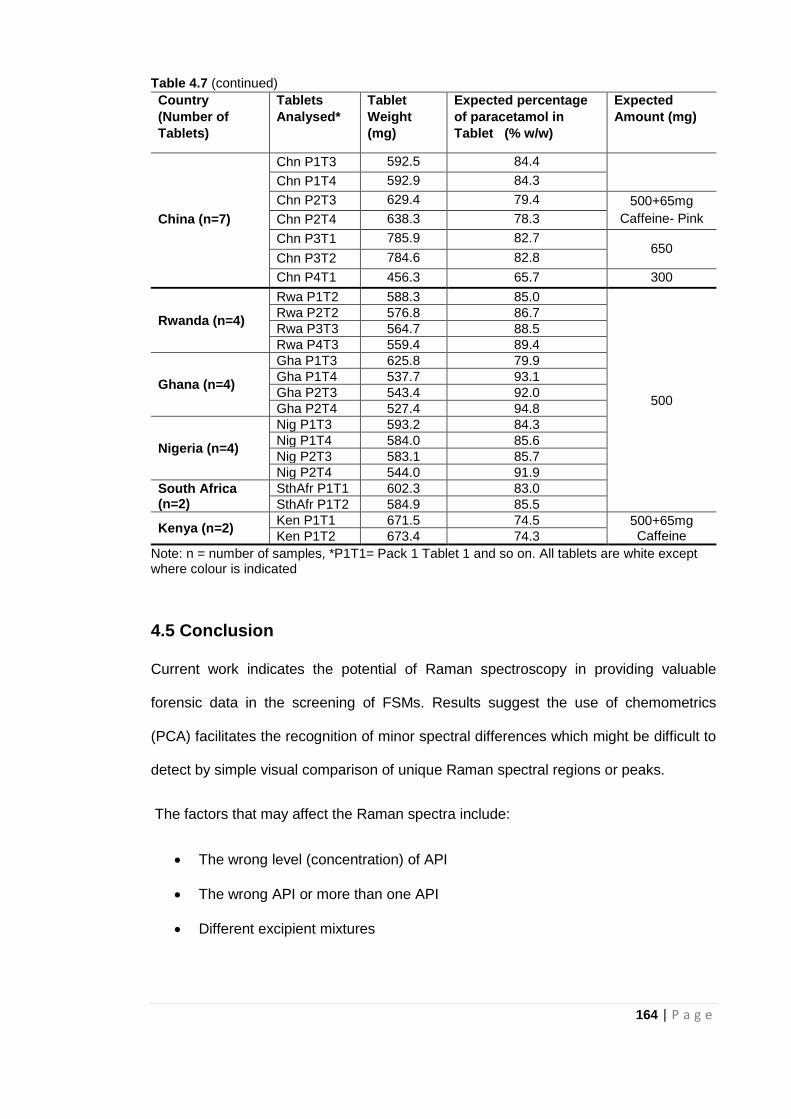
164 | P a g e
Table 4.7 (continued)
Country
(Number of
Tablets)
Tablets
Analysed*
Tablet
Weight
(mg)
Expected percentage
of paracetamol in
Tablet (% w/w)
Expected
Amount (mg)
China (n=7)
Chn P1T3 592.5 84.4
Chn P1T4 592.9 84.3
Chn P2T3 629.4 79.4 500+65mg
Caffeine- Pink Chn P2T4 638.3 78.3
Chn P3T1 785.9 82.7 650
Chn P3T2 784.6 82.8
Chn P4T1 456.3 65.7 300
Rwanda (n=4)
Rwa P1T2 588.3 85.0
500
Rwa P2T2 576.8 86.7
Rwa P3T3 564.7 88.5
Rwa P4T3 559.4 89.4
Ghana (n=4)
Gha P1T3 625.8 79.9
Gha P1T4 537.7 93.1
Gha P2T3 543.4 92.0
Gha P2T4 527.4 94.8
Nigeria (n=4)
Nig P1T3 593.2 84.3
Nig P1T4 584.0 85.6
Nig P2T3 583.1 85.7
Nig P2T4 544.0 91.9
South Africa (n=2)
SthAfr P1T1 602.3 83.0
SthAfr P1T2 584.9 85.5
Kenya (n=2) Ken P1T1 671.5 74.5 500+65mg
Caffeine Ken P1T2 673.4 74.3
Note: n = number of samples, *P1T1= Pack 1 Tablet 1 and so on. All tablets are white except where colour is indicated
4.5 Conclusion
Current work indicates the potential of Raman spectroscopy in providing valuable
forensic data in the screening of FSMs. Results suggest the use of chemometrics
(PCA) facilitates the recognition of minor spectral differences which might be difficult to
detect by simple visual comparison of unique Raman spectral regions or peaks.
The factors that may affect the Raman spectra include:
The wrong level (concentration) of API
The wrong API or more than one API
Different excipient mixtures
165 | P a g e
Surface coatings or colours
The data recorded in Table 4.7, for European samples, shows that tablets covering
500, 650 and 1000mg all contain about the same concentration (68-85%) of
paracetamol on a w/w basis. The spectra are very similar and the PCA signals all
cluster in the centre of Figure 4.2 Similarly all the other samples with a paracetamol
concentration within the range 68-85% lie within the central group on Fig 4.2 except for
the Chn P2 and Ken P1 tablets which both contain a second API and are therefore
outliers. Of the remaining outliers samples Nig P2 clearly has different excipients
present and ChnP4 has a reduced concentration of paracetamol (66%).
One sample, Ind P13 challenges the Raman/PCA methodology reported here. These
tablets contain 2 APIs, are coloured only contain 250mg of the API and yet appear to
be bona fide 500mg tablets.
In addition to the spectroscopic techniques considered in Chapters 3 and 4, the next
chapter will focus on direct insertion probe mass spectrometry (DIP-MS) and its
potential use in the fast detection of falsified and substandard medicines.
166 | P a g e
4.6 References
Assi, S. (2014) Investigating the quality of medicines using handheld Raman
spectroscopy. European Pharmaceutical Review, 19(5): 56-60.
Assi, S. (2016) Authenticating medicines with dual laser handheld Raman
spectroscopy. European Pharmaceutical Review, 21(6): 30-34.
Cailletaud, J., De Bleye, C., Dumont, E., Sacré, P.Y., Netchacovitch, L., Gut, Y., Boiret,
M., Ginot, Y.M., Hubert, P. and Ziemons, E. (2017) Critical review of surface-enhanced
Raman spectroscopy applications in the pharmaceutical field. Journal of
Pharmaceutical and Biomedical Analysis, 147: 458-472.
Dégardin, K., Guillemain, A. and Roggo, Y. (2017) Comprehensive study of a handheld
Raman spectrometer for the analysis of counterfeits of solid-dosage form
medicines. Journal of Spectroscopy, 2017: 1- 13.
Dégardin, K., Roggo, Y., Been, F. and Margot, P. (2011) Detection and chemical
profiling of medicine counterfeits by Raman spectroscopy and chemometrics. Analytica
Chimica Acta, 705(1-2): 334-341.
Fransson, M., Johansson, J., Sparén, A. and Svensson, O. (2010) Comparison of
multivariate methods for quantitative determination with transmission Raman
spectroscopy in pharmaceutical formulations. Journal of Chemometrics, 24(11‐12):
674-680.
Fraser, S.J., Oughton, J., Batten, W.A., Clark, A.S., Schmierer, D.M., Gordon, K.C. and
Strachan, C.J. (2013) Simultaneous qualitative and quantitative analysis of counterfeit
and unregistered medicines using Raman spectroscopy. Journal of Raman
Spectroscopy, 44(8): 1172-1180.
Gala, U. and Chauhan, H. (2015) Principles and applications of Raman spectroscopy in
pharmaceutical drug discovery and development. Expert Opinion on Drug
Discovery, 10(2): 187-206.
Griffen, J., Owen, A. and Matousek, P. (2015) Comprehensive quantification of tablets
with multiple active pharmaceutical ingredients using transmission Raman
spectroscopy— A proof of concept study. Journal of Pharmaceutical and Biomedical
Analysis, 115: 277-282.
Hajjou, M., Qin, Y., Bradby, S., Bempong, D. and Lukulay, P. (2013) Assessment of the
performance of a handheld Raman device for potential use as a screening tool in
evaluating medicines quality. Journal of Pharmaceutical and Biomedical Analysis, 74:
47-55.
Izake, E.L. (2010) Forensic and homeland security applications of modern portable
Raman spectroscopy. Forensic Science International, 202(1-3): 1-8.
167 | P a g e
Kalyanaraman, R., Ribick, M. and Dobler, G. (2012) Portable Raman spectroscopy for
pharmaceutical counterfeit detection. European Pharmaceutical Review, 17(5): 35-39.
Kwok, K. and Taylor, L.S. (2012) Analysis of the packaging enclosing a counterfeit
pharmaceutical tablet using Raman microscopy and two-dimensional correlation
spectroscopy. Vibrational Spectroscopy, 61: 176-182.
Luczak, A. and Kalyanaraman, R. (2014) Portable and benchtop Raman technologies
for product authentication and counterfeit detection. American Pharmaceutical
Review, 2014: 1-9.
Neuberger, S. and Neusüß, C. (2015) Determination of counterfeit medicines by
Raman spectroscopy: systematic study based on a large set of model tablets. Journal
of Pharmaceutical and Biomedical Analysis, 112: 70-78.
Peters, J., Luczak, A., Ganesh, V., Park, E. and Kalyanaraman, R. (2016) Raman
spectral fingerprinting for biologics counterfeit drug detection. American
Pharmaceutical Review, 19(2).
Rebiere, H., Martin, M., Ghyselinck, C., Bonnet, P.A. and Brenier, C. (2018) Raman
chemical imaging for spectroscopic screening and direct quantification of falsified
drugs. Journal of Pharmaceutical and Biomedical Analysis, 148: 316-323.
Shin, K. and Chung, H. (2013) Wide area coverage Raman spectroscopy for reliable
quantitative analysis and its applications. Analyst, 138(12): 3335-3346.
Spink, J., Moyer, D.C. and Rip, M.R. (2016) Addressing the risk of product fraud: a
case study of the Nigerian combating counterfeiting and sub-standard medicines
initiatives. Journal of Forensic Science & Criminology, 4(2): 1-13.
Strachan, C.J., Rades, T., Gordon, K.C. and Rantanen, J. (2007) Raman spectroscopy
for quantitative analysis of pharmaceutical solids. Journal of Pharmacy and
Pharmacology, 59(2): 179-192.
Tondepu, C., Toth, R., Navin, C.V., Lawson, L.S. and Rodriguez, J.D. (2017) Screening
of unapproved drugs using portable Raman spectroscopy. Analytica Chimica
Acta, 973: 75-81.
Zheng, J., Pang, S., Labuza, T.P. and He, L. (2014) Evaluation of surface-enhanced
Raman scattering detection using a handheld and a bench-top Raman spectrometer: A
comparative study. Talanta, 129: 79-85.
168 | P a g e
CHAPTER FIVE
Falsified and Substandard
Medicines: Probe Mass
Spectrometry for rapid
characterisation of tablet content
169 | P a g e
5.1 Introduction
As established earlier, falsified and substandard medicines pose a huge threat to public
health not only in many small and middle-income countries but also in developed
countries as well. In a recent report, key malaria treatment was unable to cure four
patients in the UK who had all visited Africa suggesting early signs of the parasite
being resistant to the medication (Gallagher, 2017). The United Nations Office on
Drugs and Crime has also identified medicine counterfeiting as a global threat (Kaur,
2015).
One way to prevent the spread of falsified and substandard medicines as spelt out in
Chapter 2 is to carry out onsite screening of medicines. This type of screening is
generally done either by batch number/ bar code searching using special apps on
mobiles phones or by simple colorimetric or thin layer chromatography (TLC) kits.
There is also the issue of sensitivity (false positives) and the largely qualitative nature
of these TLC tests which neglects or doesn’t take into account falsified medicines with
insufficient amounts of the active ingredient (Rebiere et al, 2017; Zou et al, 2017). In
addition, it is even more difficult to prevent the spread of clones of particular tablet
medications especially where chiral compounds are involved with cheaper analogues
substituted for genuine and more expensive APIs. With the analogues being very
similar in that they have the same chemical species or functional groups and are
basically mirror images of each other, they are more difficult to detect (Kovacs et al,
2014; Rebiere et al, 2017).
Mass spectrometry has been identified as one of the most popular techniques for
chemical analysis due to its high accuracy, selectivity and quantitative capabilities
provided that the analytes in question can be converted efficiently to gas phase ions.
170 | P a g e
While results that are more accurate are obtained using mass spectrometers than with
conventional immunoassay kits such as the GPHF Minilab and simpler techniques like
the TLC, mass spectrometers until recently, were considered to be too complex and
expensive to be used for in situ screening of pharmaceutical formulations. It is in a bid
to address the challenge posed by using large laboratory based equipment for in-field
analysis that efforts towards the miniaturisation of mass spectrometers have been on
the rise in recent times (Kumano et al, 2015).
5.1.1 Introduction to Mass Spectrometry
Mass spectrometers need a vacuum system to function and measure the mass to
charge ratio of ions in order to determine the identity of a sample. For many years
mass spectrometers have been used, generally in combination with a gas
chromatograph (GC), to identify the components of mixtures. The identification of the
components of mixtures which could be in different physical states (solid, liquid or gas)
have been based on the characteristic fragmentation patterns produced by high energy
electron impact ionisation processes employed in the mass spectrometer. The GC acts
both as a separation technique and a means of introducing the samples into the MS.
Separation of mixtures by GC requires the mixture components to be both readily
volatile and thermally stable but this is unlikely to be the case for the components of a
tablet and so an alternative means of introducing a solid sample into the mass
spectrometer is needed. It was common practice in the 60s and 70s to use a heated
direct insertion probe (DIP), via a vacuum lock, to introduce samples directly into the
ion source of a mass spectrometer where the sample was volatilised, ionised and
analysed. This technique is referred to as DIP-MS and can be applied to crushed tablet
samples with no other sample preparation required prior to analysis. Conventionally,
identifications are based on the characteristic positive ion fragmentation patterns
171 | P a g e
produced by the high energy electron impact (EI) ionisation processes used in the
mass spectrometer. This process can be summarised:
M + e- (H) = [M+] + 2e- (L) = m1
+ + m2+
Note e- (H) = high energy electron and e- (L) = low energy electron
[M+] = excited short-lived molecular ion
It is also possible for the sample to be ionised by a low energy electron to produce a
negatively charged molecular ion which is unlikely to fragment. Both approaches have
been used here and the results compared with data from an example of the new
atmospheric pressure or ambient ionisation technique (Culzoni et al, 2014, Fernandez
et al, 2014). In these techniques, the ionisation processes can be represented as:
M + H+ (M+H)+ where (M+H)+ is known as the pseudomolecular ion. Atmospheric
pressure or ambient ionisation techniques offer two technical differences to the EI-MS
process. In these systems ions are created outside of the MS vacuum system, usually
by the addition of a proton rather than the removal of an electron. Under these
conditions, the energy transferred to the target molecule is low and therefore little
fragmentation is observed and the target signal is the anticipated molecular weight
(Mwt) plus 1 mass unit.
Exactly what is meant by a molecular ion needs to be clarified. There are three different
ways to calculate the molecular mass from the empirical formula:
Average mass – based on the average atomic weights over all isotopes
Monoisotopic mass – based on the mass of the most abundant isotopes
Nominal mass – based on the integer mass of the most abundant isotopes
In mass spectrometry the monoisotopic mass should be used and thus any compound
containing chlorine, for example, will have two molecular ions separated by 2 mass
units corresponding to the 35 and 37 isotopes of chlorine.
172 | P a g e
Ambient sampling/ionisation MS has shown great potential (Culzoni et al, 2014,
Fernandez et al, 2014) with direct analysis in real time (DART) and desorption
electrospray ionisation (DESI) identified as the most frequently used techniques
(Bernier et al, 2016). Culzoni et al (2014) asserts that high throughput and very
sensitive ambient mass spectrometry techniques will enhance the investigation of
pharmaceutical formulations with little or no sample preparation. Bernier et al (2016)
employed DART ionisation coupled with a compact single quadrupole mass
spectrometer in fingerprinting antimalarial tablets and compared them to high-
resolution equipment with both systems producing similar results thereby suggesting its
possible use on the field. There have also been instances where thermal desorption of
the sample was followed by ambient ionization. Atmospheric pressure chemical
ionisation (APCI), dielectric barrier discharge ionisation (DBDI), electrospray ionisation
and atmospheric pressure photoionization are further examples of ambient ionisation
methods coupled with thermal desorption (Culzoni et al, 2014). All these methods
have proven to be useful but Kumano et al (2015) points out the challenge using bulky
equipment for a portable spectrometer.
Efforts to miniaturize mass spectrometers making them more portable have targeted
improving sensitivity (Snyder et al, 2015; Bernier et al, 2016; Brown et al, 2016; Lawton
et al, 2017; Li et al, 2017). The weight of the mass spectrometer is predominantly
attributed to the vacuum pump. As such, reducing the weight of the whole system will
involve using a smaller pump but this in turn lowers pumping speed which results in
lower sensitivity for analysis due to the necessary reduction in sample size (Kumano et
al, 2015).
Several techniques have been developed to address this lower sensitivity challenge.
Contreras et al (2008) employed a portable mass spectrometer with a gas
chromatograph, a toroidal iron trap and an electron ionisation source where a solid
173 | P a g e
phase micro extraction method was used in concentrating the sample. This in turn
improved sensitivity. Ouyang et al (2009) designed a portable mass spectrometer with
an electrospray ionisation source and a rectilinear ion trap. They enhanced the
efficiency of ion transfer (from an ionisation source at atmospheric pressure to a mass
analyser in a vacuum) by designing a discontinuous atmospheric interface.
Kumano et al (2015) in their quest to find an alternative to the use of immunoassay kits
(involving solvent extraction) for the screening of illicit drugs, developed a prototype of
a portable mass spectrometer. It employs a low-pressure dielectric barrier discharge
ionisation (LP-DBDI) source which is highly sensitive. To allow for efficient transport of
the sample vapour to the LP-DBDI source, a vacuum headspace method and a
discontinuous sample gas introduction technique was used. The spectrometer had the
ability to detect 0.1 ppm of methamphetamine in a liquid, making it adequately sensitive
for the screening illicit of drugs. The limitation with this portable mass spectrometer
however, is that it can only be used for analysis of liquid samples. Kumano et al (2015)
in their work also suggested that a portable mass spectrometer with solid sampling
capabilities will be required to and possibly enhance the early detection of illicit drugs
before they fall into the hands of criminals. To achieve this, they developed a probe
heating method which they incorporated in the portable mass spectrometer to facilitate
the screening of solid samples (illicit drugs). This technique (probe heating method),
they identified as being important for public safety. Li et al (2017) also used portable
ion mobility spectrometry in the rapid screening of non-steroidal anti-inflammatory
drugs which were illegally added in anti-rheumatic herbal supplements. Furthermore,
Ma and Ouyang (2016) are also of the opinion that integrating ambient ionization and
miniature mass spectrometry systems would facilitate chemical and biological analysis.
Besides analgesics/ antipyretics, antimalarial medicines have been identified as one of
the most falsified medicines globally and more prevalent in tropical low and middle
174 | P a g e
income countries (Chaccour et al, 2015). This is because individuals are poor and so
will settle for cheaper options they can get even if they are not genuine. Karunamoorthi
(2014), puts the global annual death rate due to falsified antimalarial medicines at
nearly 660, 000. Chaccour et al, (2015) further indicates that over 584,000 deaths
occurred in 2013 due to falsified antimalarial medicines with about 453,000 being
children under 5yrs highlighting the severity of the situation. Different antimalarial
combination therapies have been in use in malaria endemic countries for the treatment
of drug-resistant malaria. Artesunate, artemether, lumefantrine, amodiaquine,
sulfadoxine and pyrimethamine are key drugs used mostly in combined doses in the
treatment of multi-drug resistant Plasmodium falciparum malaria (Kaur et al, 2016).
Reports suggest that counterfeit antimalarials contain either insufficient amounts of API
or, in some cases, no APIs (Chaccour et al, 2015). The ignorant consumer of such
medicines is at substantial risk of not getting any therapeutic relief, becoming resistant
to the illness and may even die due to ineffective treatment (Karunamoorthi, 2014).
In a bid to address the challenges encountered with ATR-FTIR outlined in chapter 3
(such as limit of detection and difficulty in characterising/quantifying mixtures of APIs
due to complex non well-defined spectra), it was important to consider a more sensitive
technique for example DIP-MS which is rapid and provides simpler and more
compound specific information about both API(s) and other components of a tablet
including impurities/contaminants. DIP-MS also has the potential to be used for in-field
analysis of pharmaceutical tablet formulations. Until now, DIP-MS has not been
identified for its use in the identification of falsified and substandard pharmaceutical
tablet formulations.
This chapter describes the fast analysis of analgesic/antipyretic and antimalarial tablets
by direct insertion probe mass spectrometry (DIP-MS). Furthermore, the potential of
DIP-MS in the analysis of more complex tablets having multiple APIs/excipients and
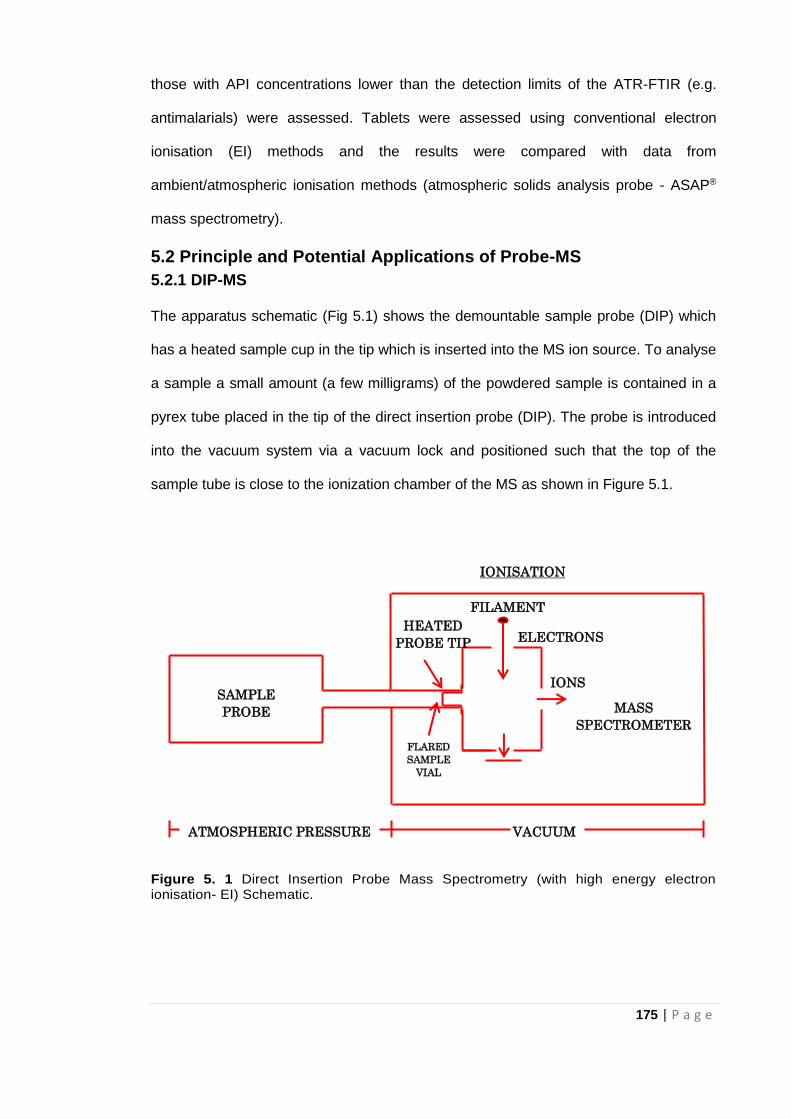
175 | P a g e
those with API concentrations lower than the detection limits of the ATR-FTIR (e.g.
antimalarials) were assessed. Tablets were assessed using conventional electron
ionisation (EI) methods and the results were compared with data from
ambient/atmospheric ionisation methods (atmospheric solids analysis probe - ASAP®
mass spectrometry).
5.2 Principle and Potential Applications of Probe-MS
5.2.1 DIP-MS
The apparatus schematic (Fig 5.1) shows the demountable sample probe (DIP) which
has a heated sample cup in the tip which is inserted into the MS ion source. To analyse
a sample a small amount (a few milligrams) of the powdered sample is contained in a
pyrex tube placed in the tip of the direct insertion probe (DIP). The probe is introduced
into the vacuum system via a vacuum lock and positioned such that the top of the
sample tube is close to the ionization chamber of the MS as shown in Figure 5.1.
Figure 5. 1 Direct Insertion Probe Mass Spectrometry (with high energy electron ionisation- EI) Schematic.
SAMPLE
PROBE
MASS
SPECTROMETER VACUUM
IONS
IONISATION
FLARED
SAMPLE
VIAL
ATMOSPHERIC PRESSURE VACUUM
ELECTRONS
FILAMENT
HEATED
PROBE TIP
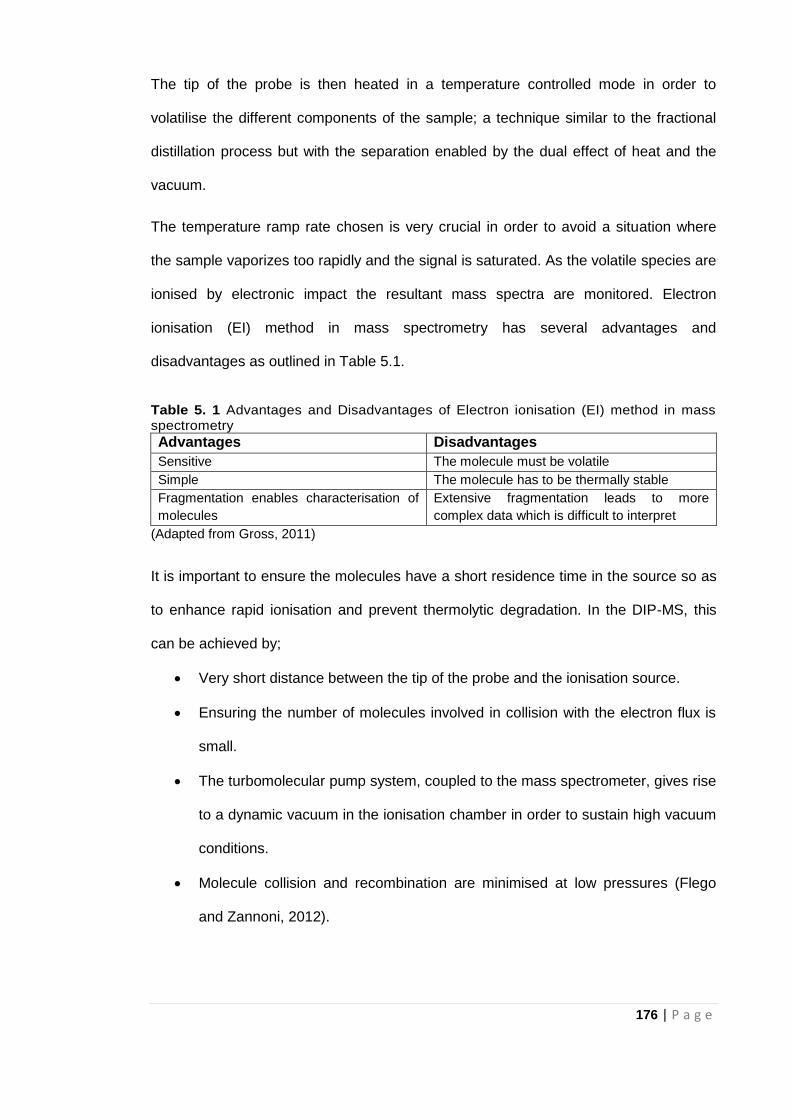
176 | P a g e
The tip of the probe is then heated in a temperature controlled mode in order to
volatilise the different components of the sample; a technique similar to the fractional
distillation process but with the separation enabled by the dual effect of heat and the
vacuum.
The temperature ramp rate chosen is very crucial in order to avoid a situation where
the sample vaporizes too rapidly and the signal is saturated. As the volatile species are
ionised by electronic impact the resultant mass spectra are monitored. Electron
ionisation (EI) method in mass spectrometry has several advantages and
disadvantages as outlined in Table 5.1.
Table 5. 1 Advantages and Disadvantages of Electron ionisation (EI) method in mass spectrometry
Advantages Disadvantages
Sensitive The molecule must be volatile
Simple The molecule has to be thermally stable
Fragmentation enables characterisation of
molecules
Extensive fragmentation leads to more
complex data which is difficult to interpret
(Adapted from Gross, 2011)
It is important to ensure the molecules have a short residence time in the source so as
to enhance rapid ionisation and prevent thermolytic degradation. In the DIP-MS, this
can be achieved by;
Very short distance between the tip of the probe and the ionisation source.
Ensuring the number of molecules involved in collision with the electron flux is
small.
The turbomolecular pump system, coupled to the mass spectrometer, gives rise
to a dynamic vacuum in the ionisation chamber in order to sustain high vacuum
conditions.
Molecule collision and recombination are minimised at low pressures (Flego
and Zannoni, 2012).
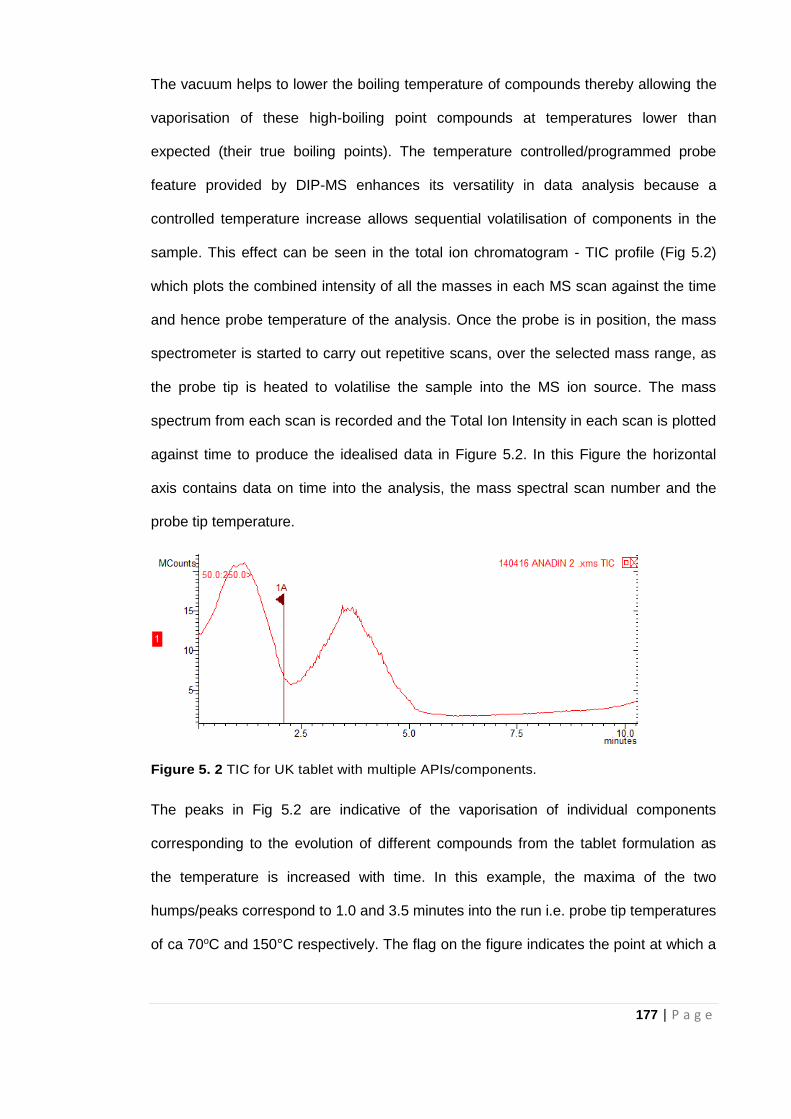
177 | P a g e
The vacuum helps to lower the boiling temperature of compounds thereby allowing the
vaporisation of these high-boiling point compounds at temperatures lower than
expected (their true boiling points). The temperature controlled/programmed probe
feature provided by DIP-MS enhances its versatility in data analysis because a
controlled temperature increase allows sequential volatilisation of components in the
sample. This effect can be seen in the total ion chromatogram - TIC profile (Fig 5.2)
which plots the combined intensity of all the masses in each MS scan against the time
and hence probe temperature of the analysis. Once the probe is in position, the mass
spectrometer is started to carry out repetitive scans, over the selected mass range, as
the probe tip is heated to volatilise the sample into the MS ion source. The mass
spectrum from each scan is recorded and the Total Ion Intensity in each scan is plotted
against time to produce the idealised data in Figure 5.2. In this Figure the horizontal
axis contains data on time into the analysis, the mass spectral scan number and the
probe tip temperature.
Figure 5. 2 TIC for UK tablet with multiple APIs/components.
The peaks in Fig 5.2 are indicative of the vaporisation of individual components
corresponding to the evolution of different compounds from the tablet formulation as
the temperature is increased with time. In this example, the maxima of the two
humps/peaks correspond to 1.0 and 3.5 minutes into the run i.e. probe tip temperatures
of ca 70oC and 150°C respectively. The flag on the figure indicates the point at which a
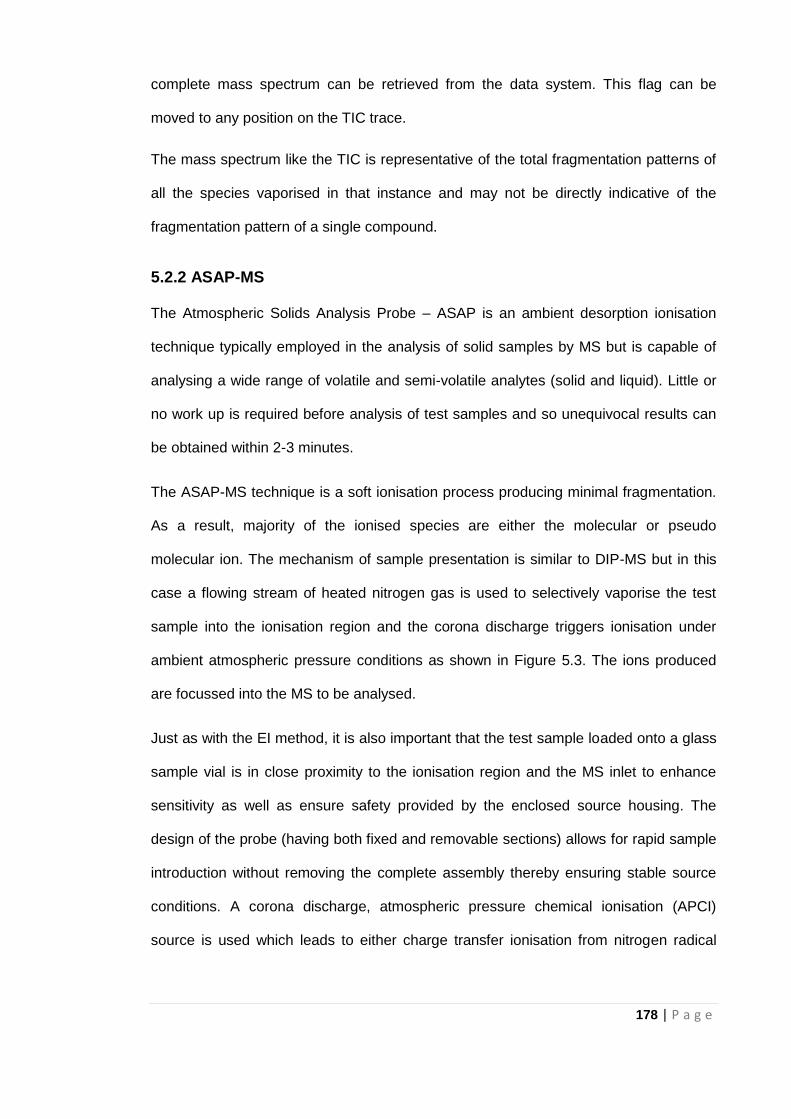
178 | P a g e
complete mass spectrum can be retrieved from the data system. This flag can be
moved to any position on the TIC trace.
The mass spectrum like the TIC is representative of the total fragmentation patterns of
all the species vaporised in that instance and may not be directly indicative of the
fragmentation pattern of a single compound.
5.2.2 ASAP-MS
The Atmospheric Solids Analysis Probe – ASAP is an ambient desorption ionisation
technique typically employed in the analysis of solid samples by MS but is capable of
analysing a wide range of volatile and semi-volatile analytes (solid and liquid). Little or
no work up is required before analysis of test samples and so unequivocal results can
be obtained within 2-3 minutes.
The ASAP-MS technique is a soft ionisation process producing minimal fragmentation.
As a result, majority of the ionised species are either the molecular or pseudo
molecular ion. The mechanism of sample presentation is similar to DIP-MS but in this
case a flowing stream of heated nitrogen gas is used to selectively vaporise the test
sample into the ionisation region and the corona discharge triggers ionisation under
ambient atmospheric pressure conditions as shown in Figure 5.3. The ions produced
are focussed into the MS to be analysed.
Just as with the EI method, it is also important that the test sample loaded onto a glass
sample vial is in close proximity to the ionisation region and the MS inlet to enhance
sensitivity as well as ensure safety provided by the enclosed source housing. The
design of the probe (having both fixed and removable sections) allows for rapid sample
introduction without removing the complete assembly thereby ensuring stable source
conditions. A corona discharge, atmospheric pressure chemical ionisation (APCI)
source is used which leads to either charge transfer ionisation from nitrogen radical
179 | P a g e
cations or proton transfer reactions generated from moisture in the sample or ambient
air.
Figure 5. 3 Direct Insertion Probe Mass Spectrometry (ASAP-MS with low energy ionisation under atmospheric pressure) Schematic
The proposed methods do not need highly sophisticated and expensive high resolution
mass spectrometers since they are mainly targeted towards screening for the presence
of the compound(s) stated to be present (Gross, 2011; Flego and Zannoni, 2012). The
accumulated data can be retrospectively searched for ions (m/z values) characteristic
of the compounds expected to be present. The process is known as extracted ion
analysis and is described in Section 5.4.
5.3 Materials and Methods
5.3.1 Materials
Reference samples of paracetamol (acetaminophen), aspirin, caffeine, chloroquine
diphosphate, sulfadoxine were obtained from Sigma Aldrich, UK and the excipient,
maize starch was obtained from Fisher Scientific Ltd, Loughborough, UK.
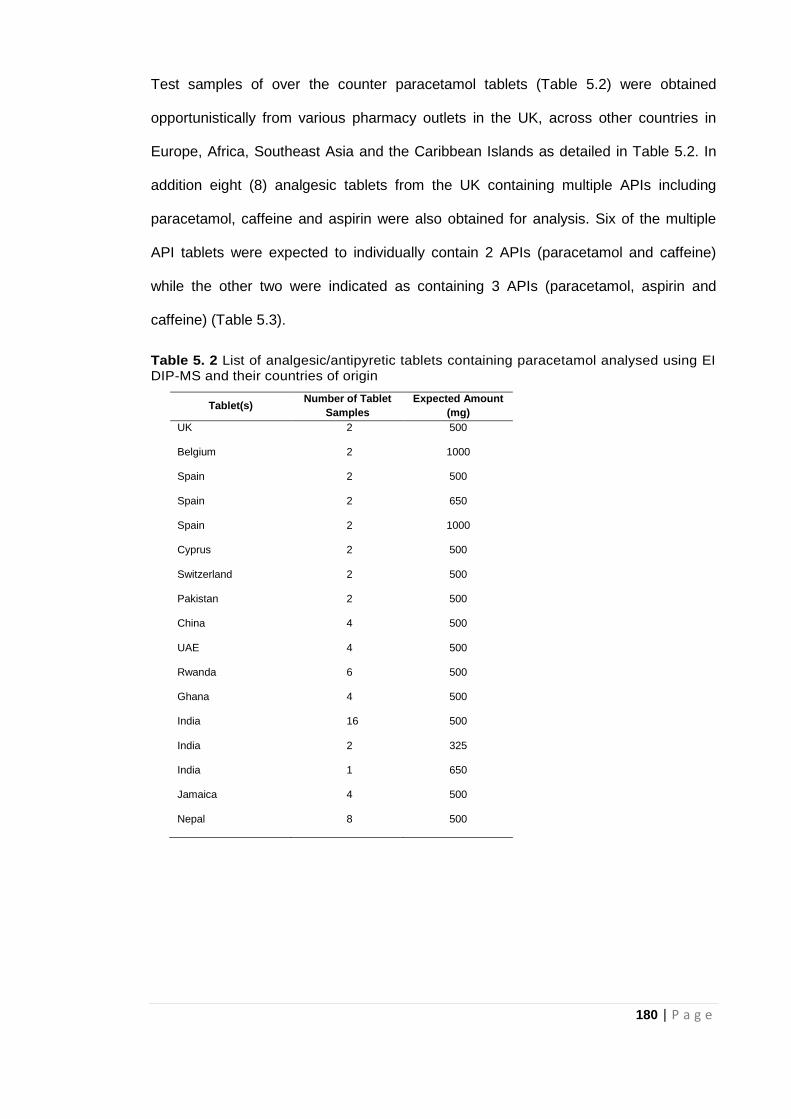
180 | P a g e
Test samples of over the counter paracetamol tablets (Table 5.2) were obtained
opportunistically from various pharmacy outlets in the UK, across other countries in
Europe, Africa, Southeast Asia and the Caribbean Islands as detailed in Table 5.2. In
addition eight (8) analgesic tablets from the UK containing multiple APIs including
paracetamol, caffeine and aspirin were also obtained for analysis. Six of the multiple
API tablets were expected to individually contain 2 APIs (paracetamol and caffeine)
while the other two were indicated as containing 3 APIs (paracetamol, aspirin and
caffeine) (Table 5.3).
Table 5. 2 List of analgesic/antipyretic tablets containing paracetamol analysed using EI DIP-MS and their countries of origin
Tablet(s) Number of Tablet
Samples
Expected Amount
(mg)
UK 2 500
Belgium 2 1000
Spain 2 500
Spain 2 650
Spain 2 1000
Cyprus 2 500
Switzerland 2 500
Pakistan 2 500
China 4 500
UAE 4 500
Rwanda 6 500
Ghana 4 500
India 16 500
India 2 325
India 1 650
Jamaica 4 500
Nepal 8 500
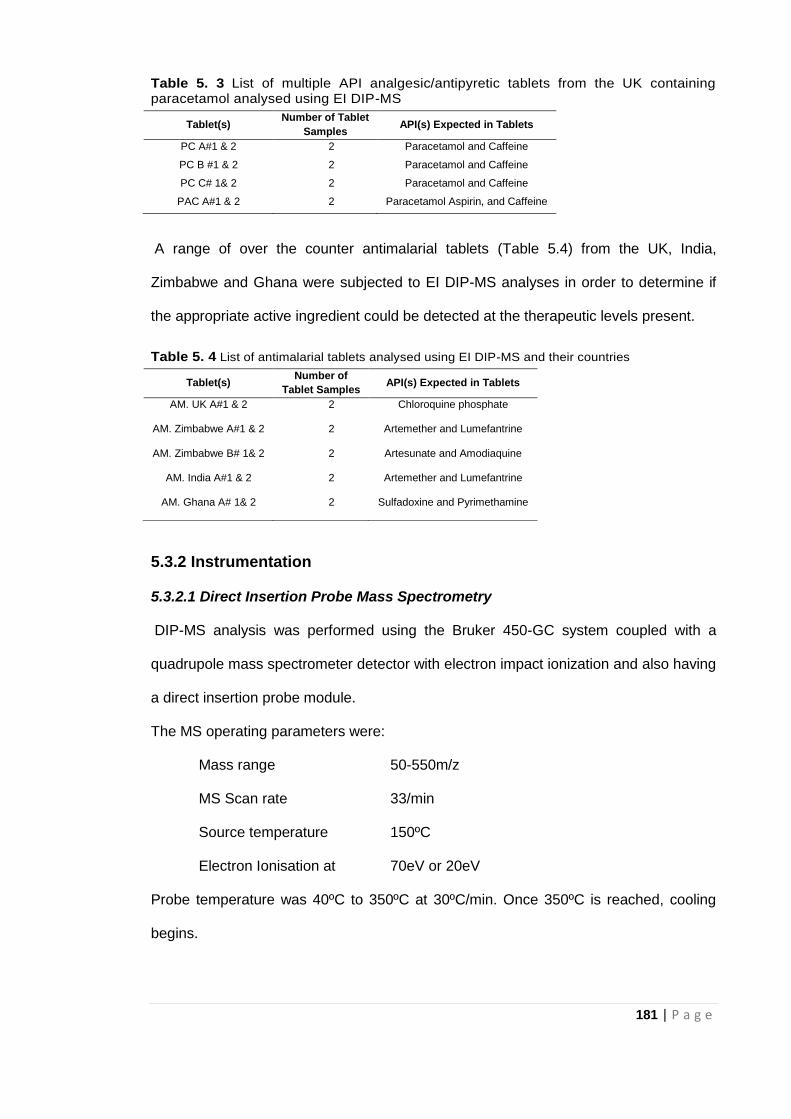
181 | P a g e
Table 5. 3 List of multiple API analgesic/antipyretic tablets from the UK containing paracetamol analysed using EI DIP-MS
A range of over the counter antimalarial tablets (Table 5.4) from the UK, India,
Zimbabwe and Ghana were subjected to EI DIP-MS analyses in order to determine if
the appropriate active ingredient could be detected at the therapeutic levels present.
Table 5. 4 List of antimalarial tablets analysed using EI DIP-MS and their countries
5.3.2 Instrumentation
5.3.2.1 Direct Insertion Probe Mass Spectrometry
DIP-MS analysis was performed using the Bruker 450-GC system coupled with a
quadrupole mass spectrometer detector with electron impact ionization and also having
a direct insertion probe module.
The MS operating parameters were:
Mass range 50-550m/z
MS Scan rate 33/min
Source temperature 150ºC
Electron Ionisation at 70eV or 20eV
Probe temperature was 40ºC to 350ºC at 30ºC/min. Once 350ºC is reached, cooling
begins.
Tablet(s) Number of Tablet
Samples API(s) Expected in Tablets
PC A#1 & 2 2 Paracetamol and Caffeine
PC B #1 & 2 2 Paracetamol and Caffeine
PC C# 1& 2 2 Paracetamol and Caffeine
PAC A#1 & 2 2 Paracetamol Aspirin, and Caffeine
Tablet(s) Number of
Tablet Samples API(s) Expected in Tablets
AM. UK A#1 & 2 2 Chloroquine phosphate
AM. Zimbabwe A#1 & 2 2 Artemether and Lumefantrine
AM. Zimbabwe B# 1& 2 2 Artesunate and Amodiaquine
AM. India A#1 & 2 2 Artemether and Lumefantrine
AM. Ghana A# 1& 2 2 Sulfadoxine and Pyrimethamine
182 | P a g e
5.3.2.2 Atmospheric solids analysis Probe Mass Spectrometry (ASAP-MS)
ASAP-MS analysis was performed using the Advion Expression compact mass
spectrometer (CMS) with atmospheric pressure chemical ionisation (APCI) and also
having an Atmospheric Solids Analysis Probe (a direct insertion probe module).
Operating parameters for CMS were as follows:
Ionisation mode: APCI positive or negative
Nitrogen gas temperature: 300°C
Mass range 100-550m/z
5.3.3 Methods- Sample analysis
5.3.3.1 DIP-MS
Crushed tablet powder sample was placed in the sample vial using TLC spotters to
ensure minimal amount of sample. Sample vial containing analyte affixed to the tip of
the sampling probe was introduced into the mass spectrometer via a gate valve. This
valve was only opened when the sample was introduced to maintain the vacuum state
of the mass spectrometer. Once the sample was in position, the mass spectrometer
was set to scan and controlled temperature increase on the system caused
vaporisation of the sample which was then ionised and mass spectral data recorded. A
blank (empty sample vial) was run after every measurement to avoid any carry over
from previous run. After each run, cooling time was needed to allow both probe
temperature and the ion source pressure to drop prior to further scanning.
For quantitative study using, different concentrations of paracetamol at 1, 2, 5, 10, 20,
30, 50, 70, and 90% w/w in maize starch were prepared. The data obtained was used
in preparing a calibration curve (Section 5.4.5) to assess the potential of DIP-MS in
direct quantification of tablet samples
183 | P a g e
5.3.3.2 ASAP-MS
First of all, the crushed test tablet sample (powder) was loaded onto the closed end of
a glass melting point capillary tube by dipping the tip into the sample of interest and
then placing it into the compact mass spectrometer (CMS) for analysis. For each run,
after placing the melting point tube in contact with the test powder sample at the rim of
the sample bottle, excess test powder was removed before inserting the probe into the
CMS. With the ASAP probe already in the sealed MS source enclosure, and in order
for MS acquisition to proceed, the flowing stream of heated nitrogen gas was rapidly
heated to 300°C. Only relatively low temperatures, up to 300°C were applied in order to
avoid pyrolysis and in-source fragmentation. To minimize any background ions, a
clean, new and empty glass capillary tube was inserted into the MS and heated up for
approximately 15seconds. The acquisition of MS data was initiated while the newly
heated capillary tube was still inserted into the source in order to obtain reference
background scans. When collection of MS data for the blank glass capillary tube was
complete, the probe was taken out from the source and the test sample was applied.
The probe was re-introduced into the MS source and data acquisition re-started.
5.4 Results and Discussion
5.4.1 Application of DIP-MS to Analgesics/Antipyretics
5.4.1.1 Analysis of Reference Samples for Common Analgesics/Antipyretics
High purity/reference samples of paracetamol, aspirin and caffeine were subjected to
the DIP process and the mass spectra recorded at the maximum TIC signal using 70eV
electron ionisation (EI) are shown in Fig 5.4. Molecular ions for paracetamol and
caffeine were detected at m/z 151 and 194 respectively whilst both compounds
produced fragment ions at m/z 109 (Fig 5.4a and 5.4b). In samples stated to contain
paracetamol and/or caffeine the detection of these ions would be sufficient confirmation
of the presence of the correct API.
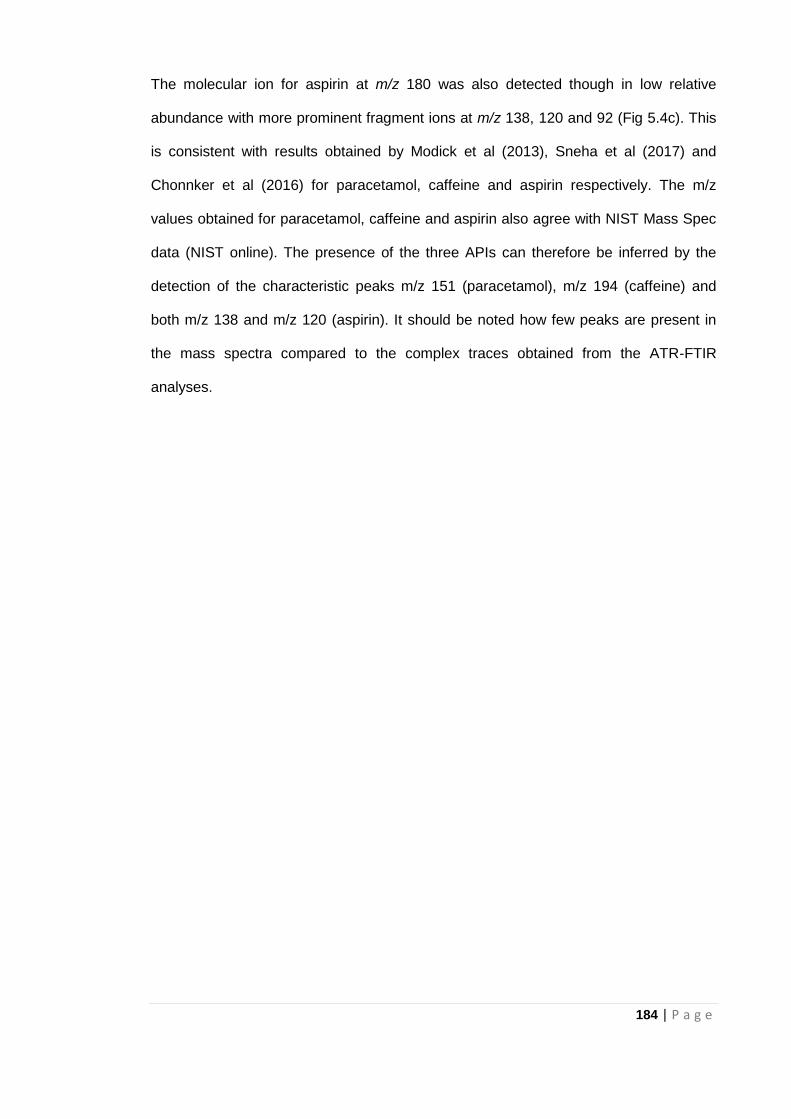
184 | P a g e
The molecular ion for aspirin at m/z 180 was also detected though in low relative
abundance with more prominent fragment ions at m/z 138, 120 and 92 (Fig 5.4c). This
is consistent with results obtained by Modick et al (2013), Sneha et al (2017) and
Chonnker et al (2016) for paracetamol, caffeine and aspirin respectively. The m/z
values obtained for paracetamol, caffeine and aspirin also agree with NIST Mass Spec
data (NIST online). The presence of the three APIs can therefore be inferred by the
detection of the characteristic peaks m/z 151 (paracetamol), m/z 194 (caffeine) and
both m/z 138 and m/z 120 (aspirin). It should be noted how few peaks are present in
the mass spectra compared to the complex traces obtained from the ATR-FTIR
analyses.
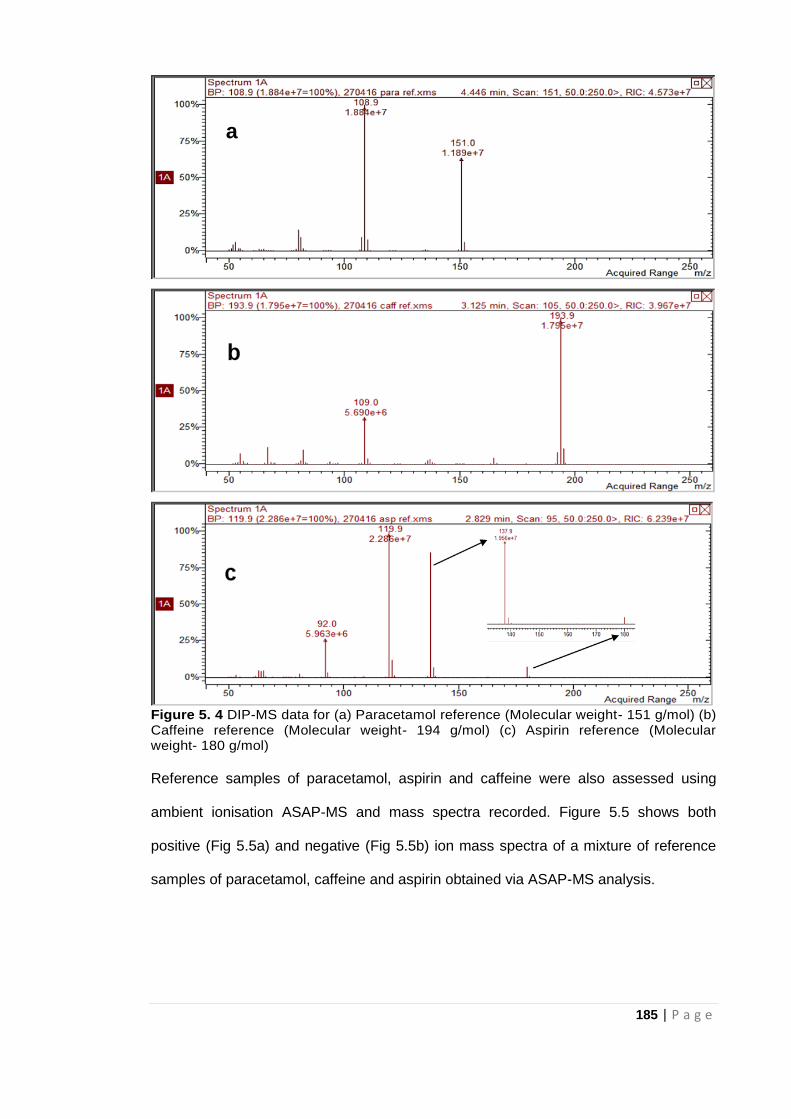
185 | P a g e
Figure 5. 4 DIP-MS data for (a) Paracetamol reference (Molecular weight- 151 g/mol) (b) Caffeine reference (Molecular weight- 194 g/mol) (c) Aspirin reference (Molecular weight- 180 g/mol)
Reference samples of paracetamol, aspirin and caffeine were also assessed using
ambient ionisation ASAP-MS and mass spectra recorded. Figure 5.5 shows both
positive (Fig 5.5a) and negative (Fig 5.5b) ion mass spectra of a mixture of reference
samples of paracetamol, caffeine and aspirin obtained via ASAP-MS analysis.
a
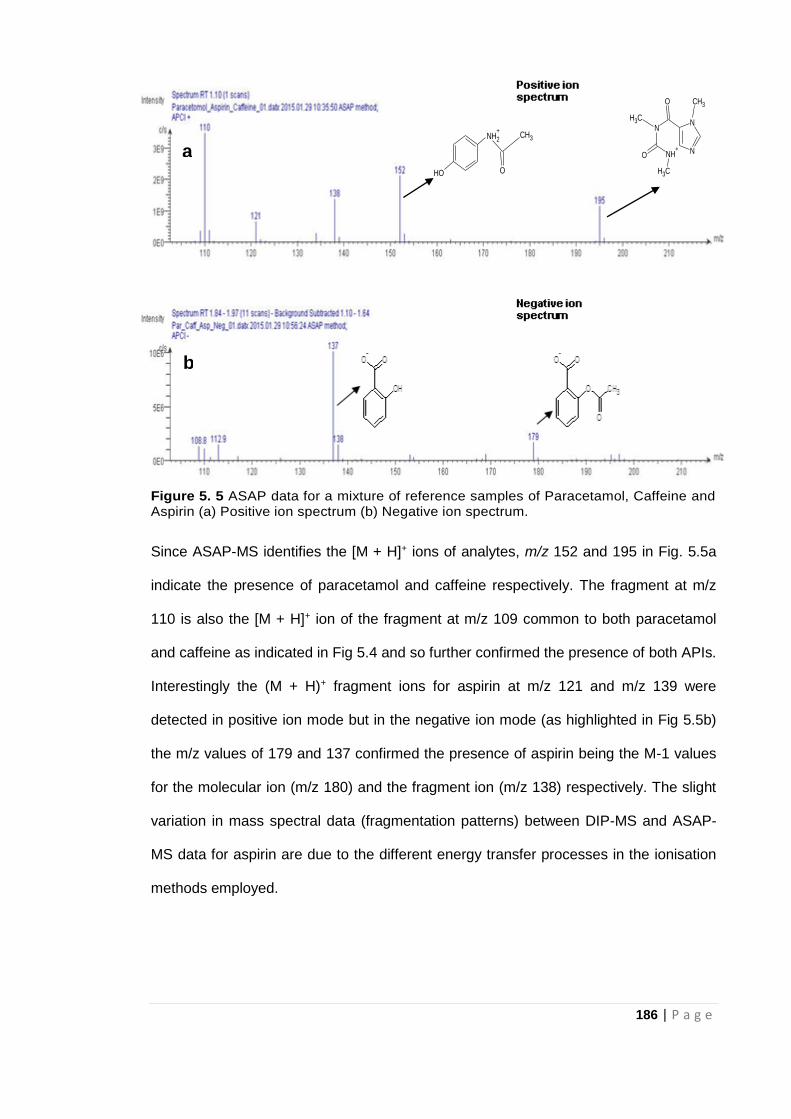
186 | P a g e
Figure 5. 5 ASAP data for a mixture of reference samples of Paracetamol, Caffeine and Aspirin (a) Positive ion spectrum (b) Negative ion spectrum.
Since ASAP-MS identifies the [M + H]+ ions of analytes, m/z 152 and 195 in Fig. 5.5a
indicate the presence of paracetamol and caffeine respectively. The fragment at m/z
110 is also the [M + H]+ ion of the fragment at m/z 109 common to both paracetamol
and caffeine as indicated in Fig 5.4 and so further confirmed the presence of both APIs.
Interestingly the (M + H)+ fragment ions for aspirin at m/z 121 and m/z 139 were
detected in positive ion mode but in the negative ion mode (as highlighted in Fig 5.5b)
the m/z values of 179 and 137 confirmed the presence of aspirin being the M-1 values
for the molecular ion (m/z 180) and the fragment ion (m/z 138) respectively. The slight
variation in mass spectral data (fragmentation patterns) between DIP-MS and ASAP-
MS data for aspirin are due to the different energy transfer processes in the ionisation
methods employed.
NH2
+
OH
CH3
O
NH+
NN
N
CH3
O
CH3
O CH3
a
b
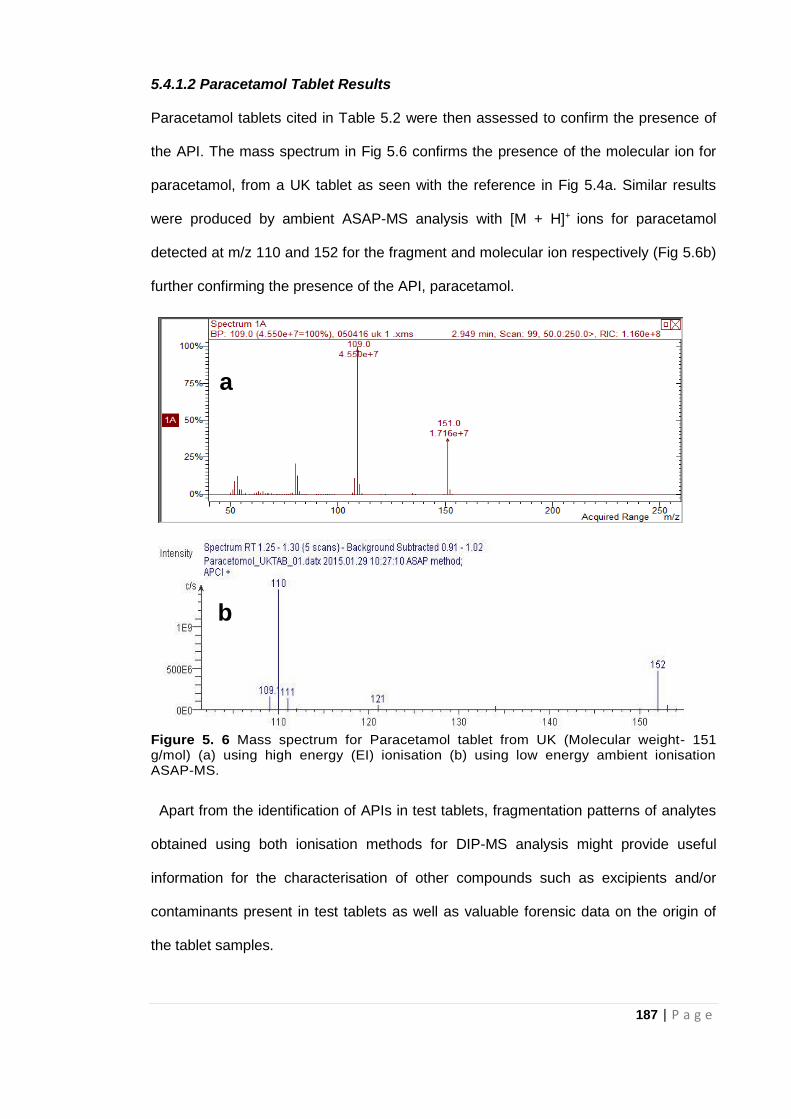
187 | P a g e
5.4.1.2 Paracetamol Tablet Results
Paracetamol tablets cited in Table 5.2 were then assessed to confirm the presence of
the API. The mass spectrum in Fig 5.6 confirms the presence of the molecular ion for
paracetamol, from a UK tablet as seen with the reference in Fig 5.4a. Similar results
were produced by ambient ASAP-MS analysis with [M + H]+ ions for paracetamol
detected at m/z 110 and 152 for the fragment and molecular ion respectively (Fig 5.6b)
further confirming the presence of the API, paracetamol.
Figure 5. 6 Mass spectrum for Paracetamol tablet from UK (Molecular weight- 151 g/mol) (a) using high energy (EI) ionisation (b) using low energy ambient ionisation ASAP-MS.
Apart from the identification of APIs in test tablets, fragmentation patterns of analytes
obtained using both ionisation methods for DIP-MS analysis might provide useful
information for the characterisation of other compounds such as excipients and/or
contaminants present in test tablets as well as valuable forensic data on the origin of
the tablet samples.
a
b
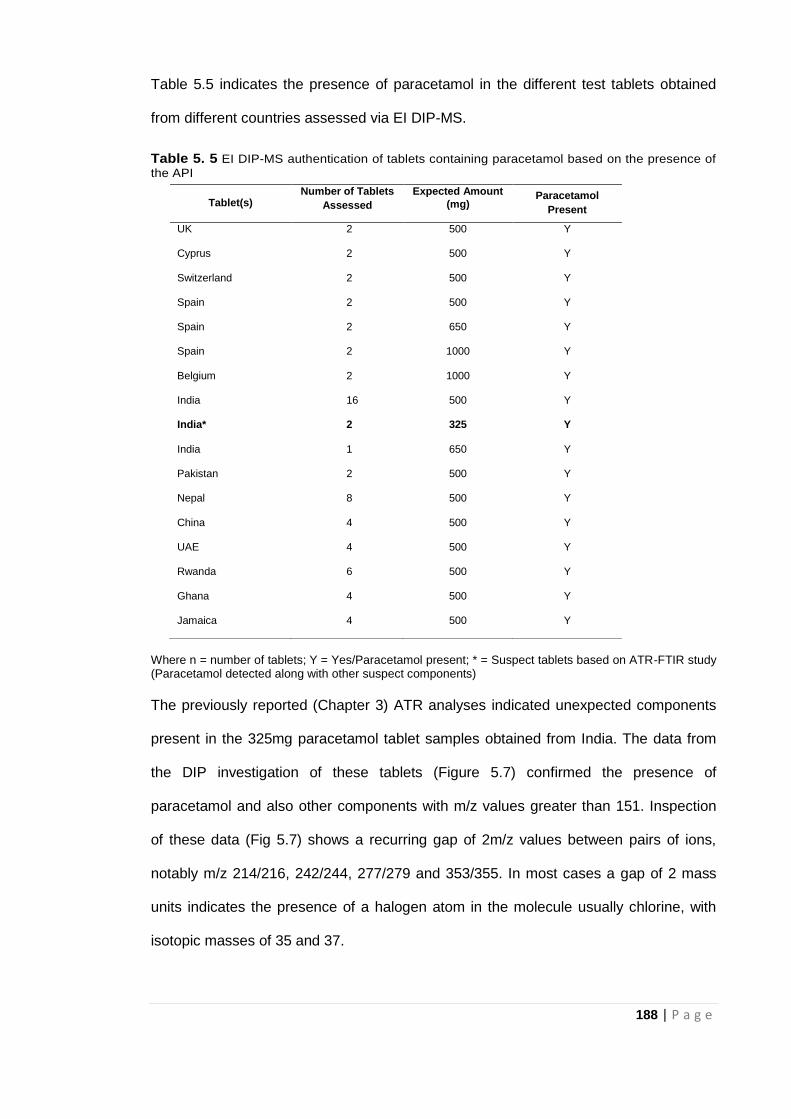
188 | P a g e
Table 5.5 indicates the presence of paracetamol in the different test tablets obtained
from different countries assessed via EI DIP-MS.
Table 5. 5 EI DIP-MS authentication of tablets containing paracetamol based on the presence of
the API
Where n = number of tablets; Y = Yes/Paracetamol present; * = Suspect tablets based on ATR-FTIR study (Paracetamol detected along with other suspect components)
The previously reported (Chapter 3) ATR analyses indicated unexpected components
present in the 325mg paracetamol tablet samples obtained from India. The data from
the DIP investigation of these tablets (Figure 5.7) confirmed the presence of
paracetamol and also other components with m/z values greater than 151. Inspection
of these data (Fig 5.7) shows a recurring gap of 2m/z values between pairs of ions,
notably m/z 214/216, 242/244, 277/279 and 353/355. In most cases a gap of 2 mass
units indicates the presence of a halogen atom in the molecule usually chlorine, with
isotopic masses of 35 and 37.
Tablet(s) Number of Tablets
Assessed
Expected Amount
(mg) Paracetamol
Present
UK 2 500 Y
Cyprus 2 500 Y
Switzerland 2 500 Y
Spain 2 500 Y
Spain 2 650 Y
Spain 2 1000 Y
Belgium 2 1000 Y
India 16 500 Y
India* 2 325 Y
India 1 650 Y
Pakistan 2 500 Y
Nepal 8 500 Y
China 4 500 Y
UAE 4 500 Y
Rwanda 6 500 Y
Ghana 4 500 Y
Jamaica 4 500 Y
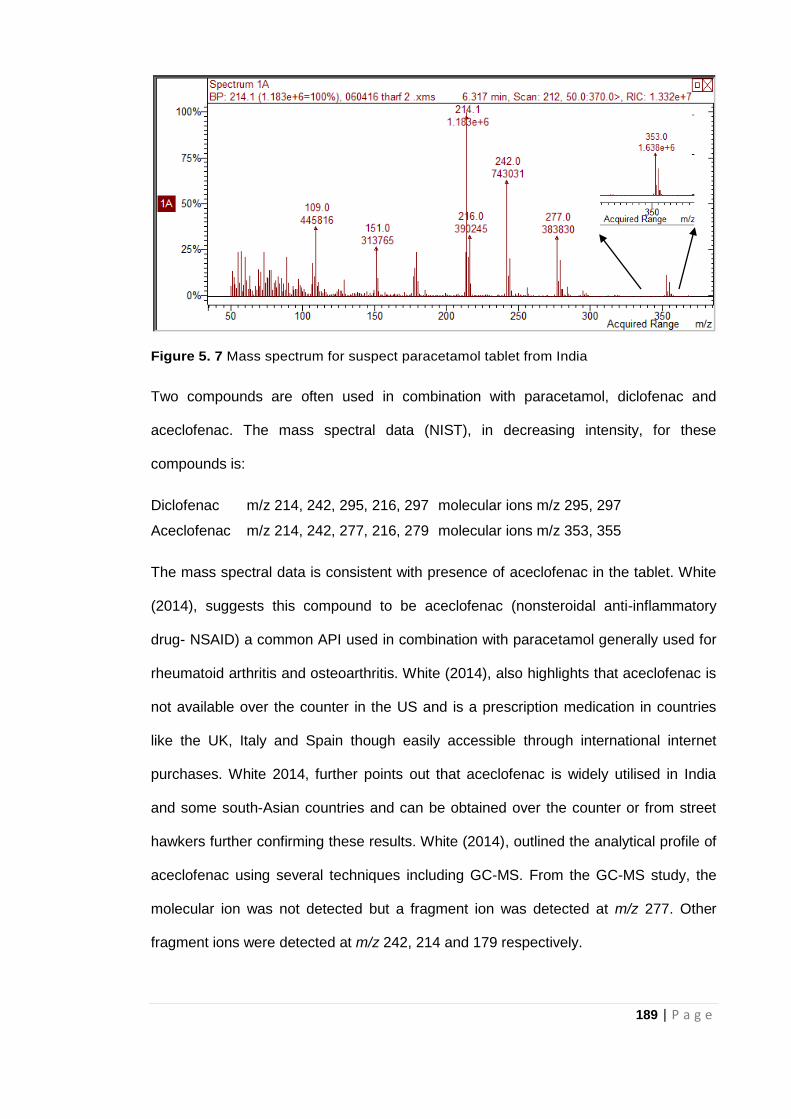
189 | P a g e
Figure 5. 7 Mass spectrum for suspect paracetamol tablet from India
Two compounds are often used in combination with paracetamol, diclofenac and
aceclofenac. The mass spectral data (NIST), in decreasing intensity, for these
compounds is:
Diclofenac m/z 214, 242, 295, 216, 297 molecular ions m/z 295, 297
Aceclofenac m/z 214, 242, 277, 216, 279 molecular ions m/z 353, 355
The mass spectral data is consistent with presence of aceclofenac in the tablet. White
(2014), suggests this compound to be aceclofenac (nonsteroidal anti-inflammatory
drug- NSAID) a common API used in combination with paracetamol generally used for
rheumatoid arthritis and osteoarthritis. White (2014), also highlights that aceclofenac is
not available over the counter in the US and is a prescription medication in countries
like the UK, Italy and Spain though easily accessible through international internet
purchases. White 2014, further points out that aceclofenac is widely utilised in India
and some south-Asian countries and can be obtained over the counter or from street
hawkers further confirming these results. White (2014), outlined the analytical profile of
aceclofenac using several techniques including GC-MS. From the GC-MS study, the
molecular ion was not detected but a fragment ion was detected at m/z 277. Other
fragment ions were detected at m/z 242, 214 and 179 respectively.
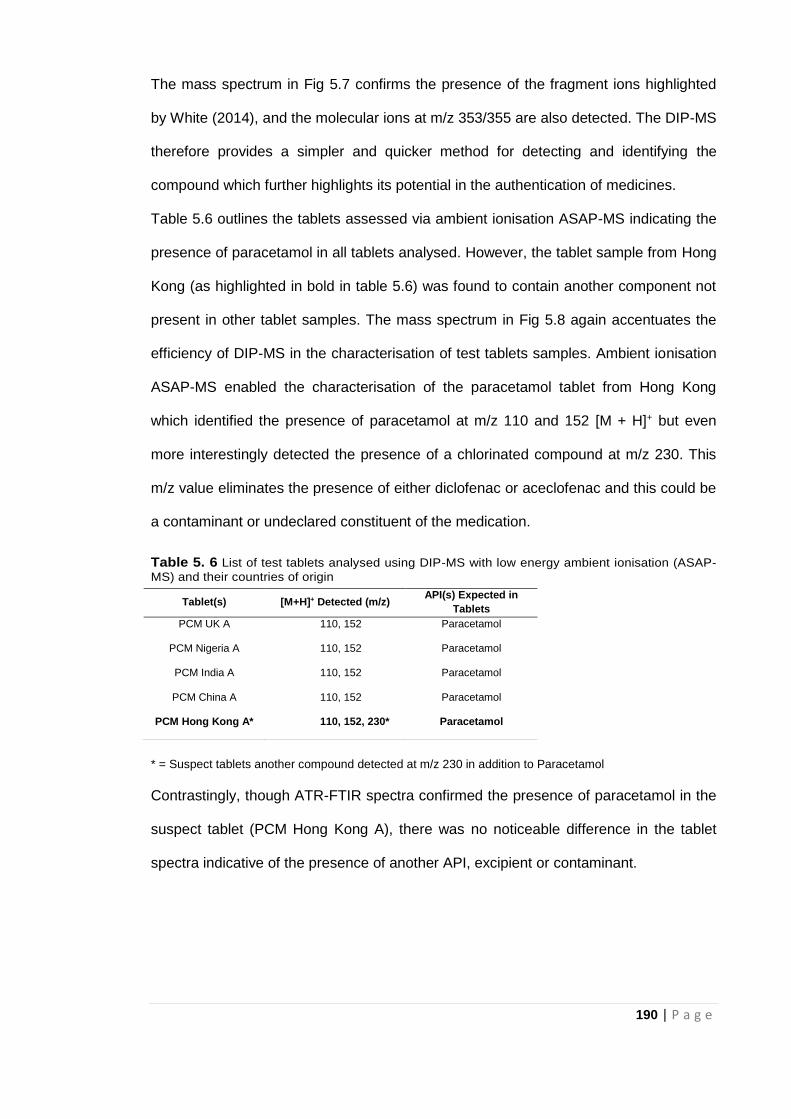
190 | P a g e
The mass spectrum in Fig 5.7 confirms the presence of the fragment ions highlighted
by White (2014), and the molecular ions at m/z 353/355 are also detected. The DIP-MS
therefore provides a simpler and quicker method for detecting and identifying the
compound which further highlights its potential in the authentication of medicines.
Table 5.6 outlines the tablets assessed via ambient ionisation ASAP-MS indicating the
presence of paracetamol in all tablets analysed. However, the tablet sample from Hong
Kong (as highlighted in bold in table 5.6) was found to contain another component not
present in other tablet samples. The mass spectrum in Fig 5.8 again accentuates the
efficiency of DIP-MS in the characterisation of test tablets samples. Ambient ionisation
ASAP-MS enabled the characterisation of the paracetamol tablet from Hong Kong
which identified the presence of paracetamol at m/z 110 and 152 [M + H]+ but even
more interestingly detected the presence of a chlorinated compound at m/z 230. This
m/z value eliminates the presence of either diclofenac or aceclofenac and this could be
a contaminant or undeclared constituent of the medication.
Table 5. 6 List of test tablets analysed using DIP-MS with low energy ambient ionisation (ASAP-
MS) and their countries of origin
* = Suspect tablets another compound detected at m/z 230 in addition to Paracetamol
Contrastingly, though ATR-FTIR spectra confirmed the presence of paracetamol in the
suspect tablet (PCM Hong Kong A), there was no noticeable difference in the tablet
spectra indicative of the presence of another API, excipient or contaminant.
Tablet(s) [M+H]+ Detected (m/z) API(s) Expected in
Tablets
PCM UK A 110, 152 Paracetamol
PCM Nigeria A 110, 152 Paracetamol
PCM India A 110, 152 Paracetamol
PCM China A 110, 152 Paracetamol
PCM Hong Kong A* 110, 152, 230* Paracetamol
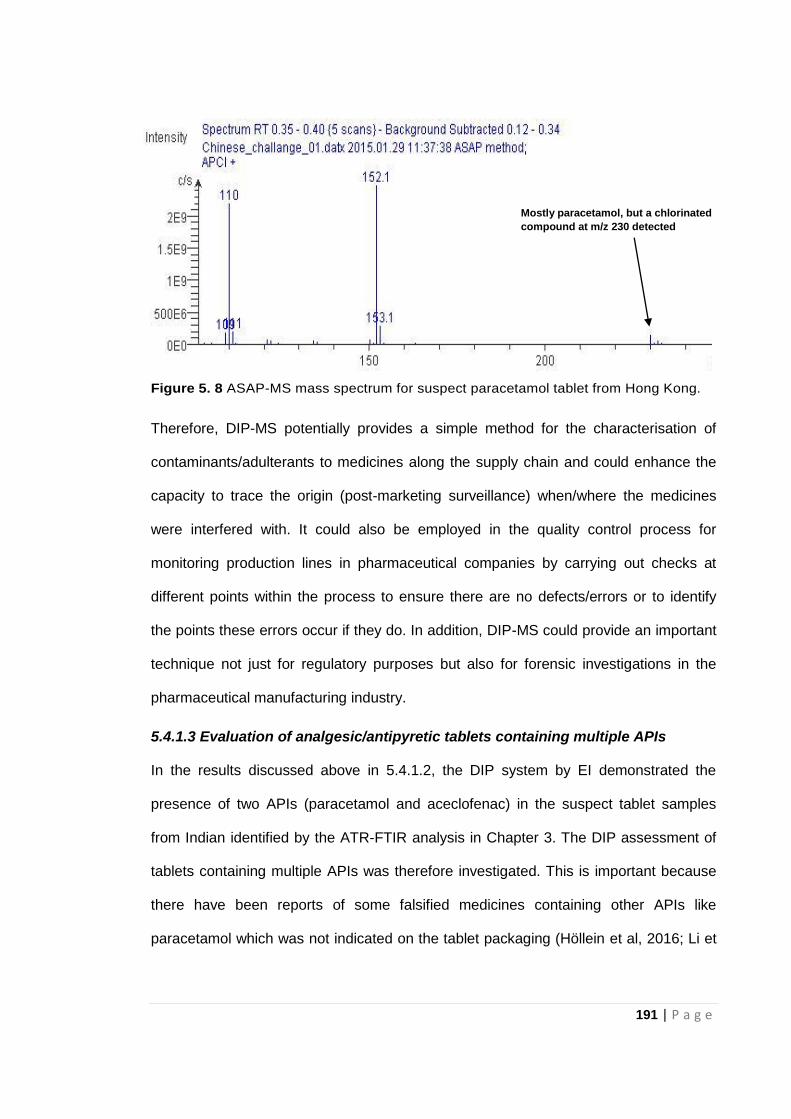
191 | P a g e
Figure 5. 8 ASAP-MS mass spectrum for suspect paracetamol tablet from Hong Kong.
Therefore, DIP-MS potentially provides a simple method for the characterisation of
contaminants/adulterants to medicines along the supply chain and could enhance the
capacity to trace the origin (post-marketing surveillance) when/where the medicines
were interfered with. It could also be employed in the quality control process for
monitoring production lines in pharmaceutical companies by carrying out checks at
different points within the process to ensure there are no defects/errors or to identify
the points these errors occur if they do. In addition, DIP-MS could provide an important
technique not just for regulatory purposes but also for forensic investigations in the
pharmaceutical manufacturing industry.
5.4.1.3 Evaluation of analgesic/antipyretic tablets containing multiple APIs
In the results discussed above in 5.4.1.2, the DIP system by EI demonstrated the
presence of two APIs (paracetamol and aceclofenac) in the suspect tablet samples
from Indian identified by the ATR-FTIR analysis in Chapter 3. The DIP assessment of
tablets containing multiple APIs was therefore investigated. This is important because
there have been reports of some falsified medicines containing other APIs like
paracetamol which was not indicated on the tablet packaging (Höllein et al, 2016; Li et
Mostly paracetamol, but a chlorinated
compound at m/z 230 detected
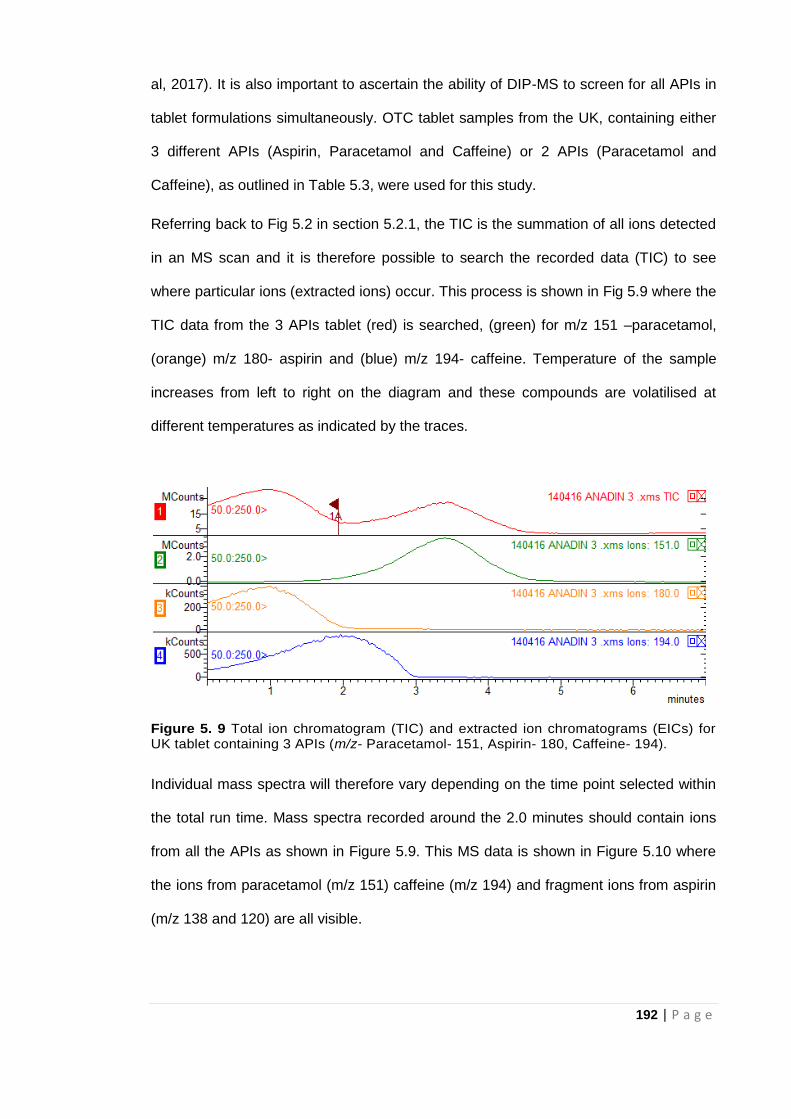
192 | P a g e
al, 2017). It is also important to ascertain the ability of DIP-MS to screen for all APIs in
tablet formulations simultaneously. OTC tablet samples from the UK, containing either
3 different APIs (Aspirin, Paracetamol and Caffeine) or 2 APIs (Paracetamol and
Caffeine), as outlined in Table 5.3, were used for this study.
Referring back to Fig 5.2 in section 5.2.1, the TIC is the summation of all ions detected
in an MS scan and it is therefore possible to search the recorded data (TIC) to see
where particular ions (extracted ions) occur. This process is shown in Fig 5.9 where the
TIC data from the 3 APIs tablet (red) is searched, (green) for m/z 151 –paracetamol,
(orange) m/z 180- aspirin and (blue) m/z 194- caffeine. Temperature of the sample
increases from left to right on the diagram and these compounds are volatilised at
different temperatures as indicated by the traces.
Figure 5. 9 Total ion chromatogram (TIC) and extracted ion chromatograms (EICs) for UK tablet containing 3 APIs (m/z- Paracetamol- 151, Aspirin- 180, Caffeine- 194).
Individual mass spectra will therefore vary depending on the time point selected within
the total run time. Mass spectra recorded around the 2.0 minutes should contain ions
from all the APIs as shown in Figure 5.9. This MS data is shown in Figure 5.10 where
the ions from paracetamol (m/z 151) caffeine (m/z 194) and fragment ions from aspirin
(m/z 138 and 120) are all visible.
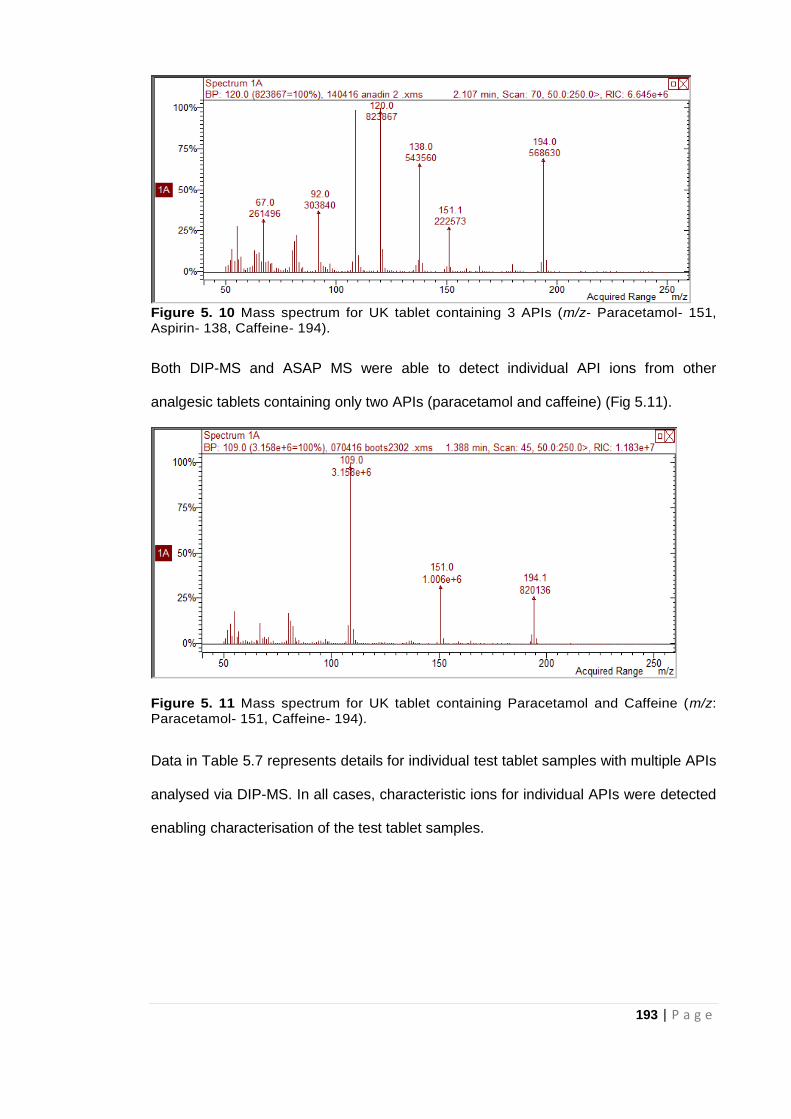
193 | P a g e
Figure 5. 10 Mass spectrum for UK tablet containing 3 APIs (m/z- Paracetamol- 151, Aspirin- 138, Caffeine- 194).
Both DIP-MS and ASAP MS were able to detect individual API ions from other
analgesic tablets containing only two APIs (paracetamol and caffeine) (Fig 5.11).
Figure 5. 11 Mass spectrum for UK tablet containing Paracetamol and Caffeine (m/z: Paracetamol- 151, Caffeine- 194).
Data in Table 5.7 represents details for individual test tablet samples with multiple APIs
analysed via DIP-MS. In all cases, characteristic ions for individual APIs were detected
enabling characterisation of the test tablet samples.
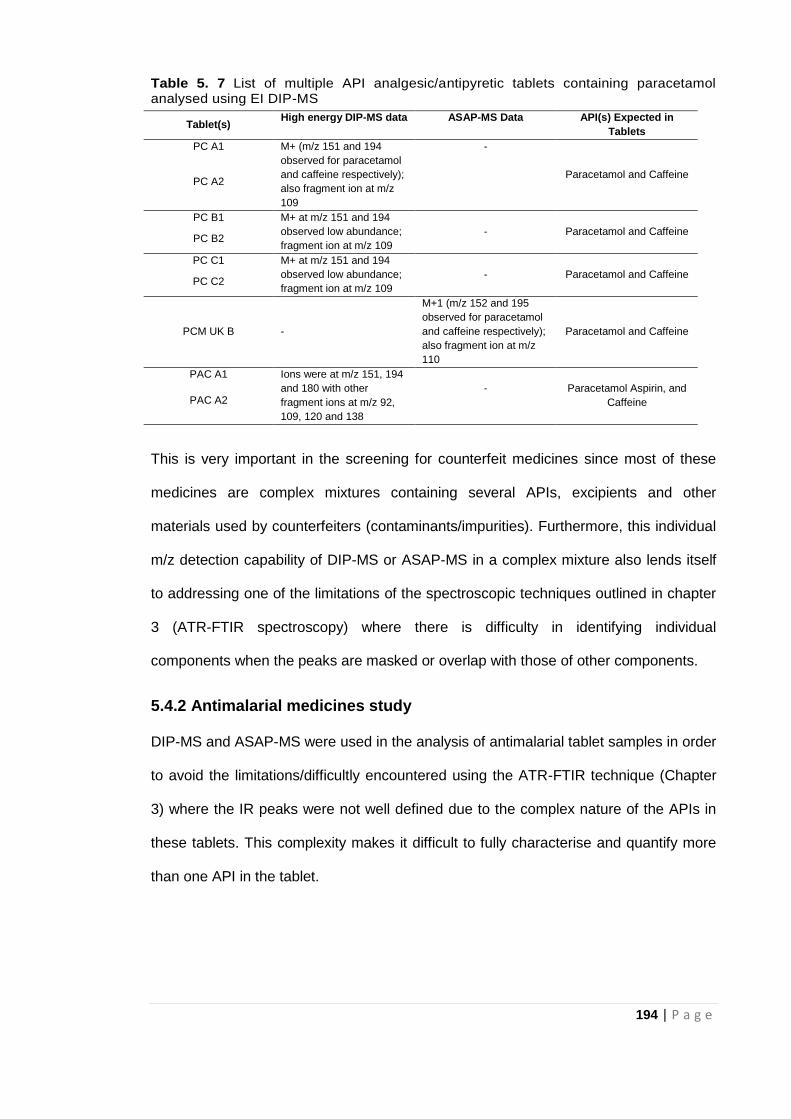
194 | P a g e
Table 5. 7 List of multiple API analgesic/antipyretic tablets containing paracetamol analysed using EI DIP-MS
This is very important in the screening for counterfeit medicines since most of these
medicines are complex mixtures containing several APIs, excipients and other
materials used by counterfeiters (contaminants/impurities). Furthermore, this individual
m/z detection capability of DIP-MS or ASAP-MS in a complex mixture also lends itself
to addressing one of the limitations of the spectroscopic techniques outlined in chapter
3 (ATR-FTIR spectroscopy) where there is difficulty in identifying individual
components when the peaks are masked or overlap with those of other components.
5.4.2 Antimalarial medicines study
DIP-MS and ASAP-MS were used in the analysis of antimalarial tablet samples in order
to avoid the limitations/difficultly encountered using the ATR-FTIR technique (Chapter
3) where the IR peaks were not well defined due to the complex nature of the APIs in
these tablets. This complexity makes it difficult to fully characterise and quantify more
than one API in the tablet.
Tablet(s) High energy DIP-MS data ASAP-MS Data API(s) Expected in
Tablets
PC A1 M+ (m/z 151 and 194
observed for paracetamol
and caffeine respectively);
also fragment ion at m/z
109
-
Paracetamol and Caffeine PC A2
PC B1 M+ at m/z 151 and 194
observed low abundance;
fragment ion at m/z 109
Paracetamol and Caffeine PC B2
-
PC C1 M+ at m/z 151 and 194
observed low abundance;
fragment ion at m/z 109
Paracetamol and Caffeine PC C2
-
PCM UK B -
M+1 (m/z 152 and 195
observed for paracetamol
and caffeine respectively);
also fragment ion at m/z
110
Paracetamol and Caffeine
PAC A1 Ions were at m/z 151, 194
and 180 with other
fragment ions at m/z 92,
109, 120 and 138
Paracetamol Aspirin, and
Caffeine PAC A2 -
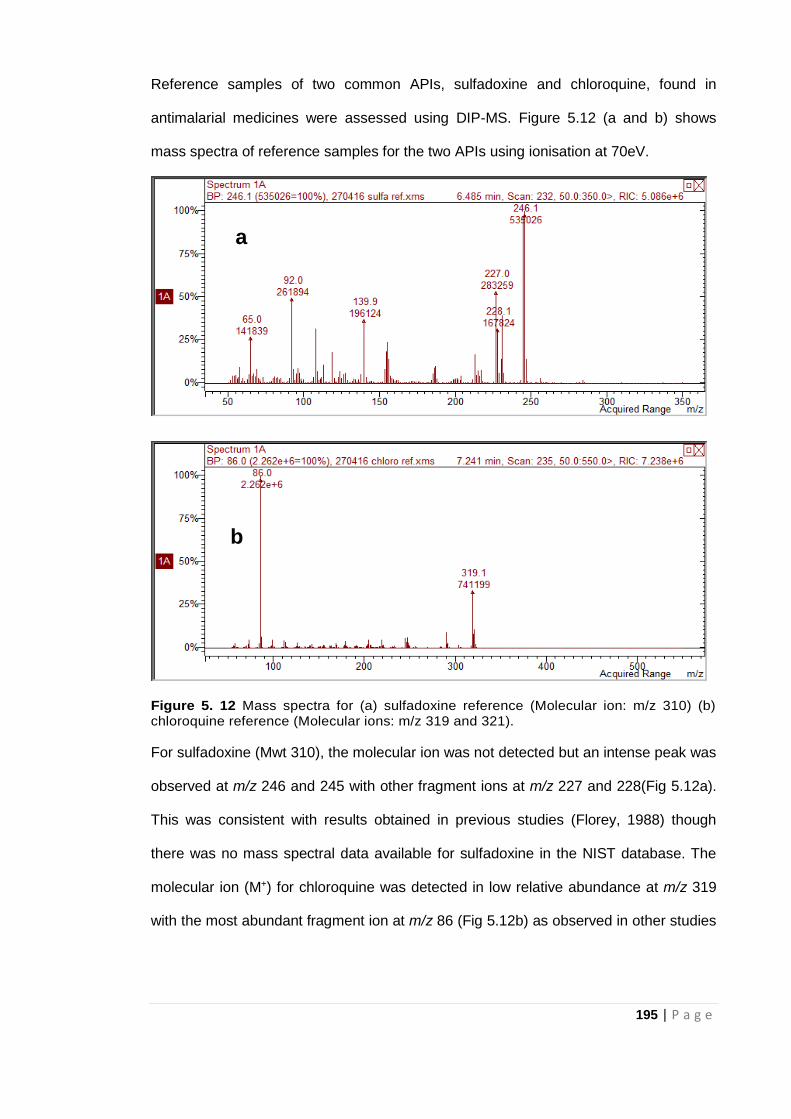
195 | P a g e
Reference samples of two common APIs, sulfadoxine and chloroquine, found in
antimalarial medicines were assessed using DIP-MS. Figure 5.12 (a and b) shows
mass spectra of reference samples for the two APIs using ionisation at 70eV.
Figure 5. 12 Mass spectra for (a) sulfadoxine reference (Molecular ion: m/z 310) (b) chloroquine reference (Molecular ions: m/z 319 and 321).
For sulfadoxine (Mwt 310), the molecular ion was not detected but an intense peak was
observed at m/z 246 and 245 with other fragment ions at m/z 227 and 228(Fig 5.12a).
This was consistent with results obtained in previous studies (Florey, 1988) though
there was no mass spectral data available for sulfadoxine in the NIST database. The
molecular ion (M+) for chloroquine was detected in low relative abundance at m/z 319
with the most abundant fragment ion at m/z 86 (Fig 5.12b) as observed in other studies
a
b
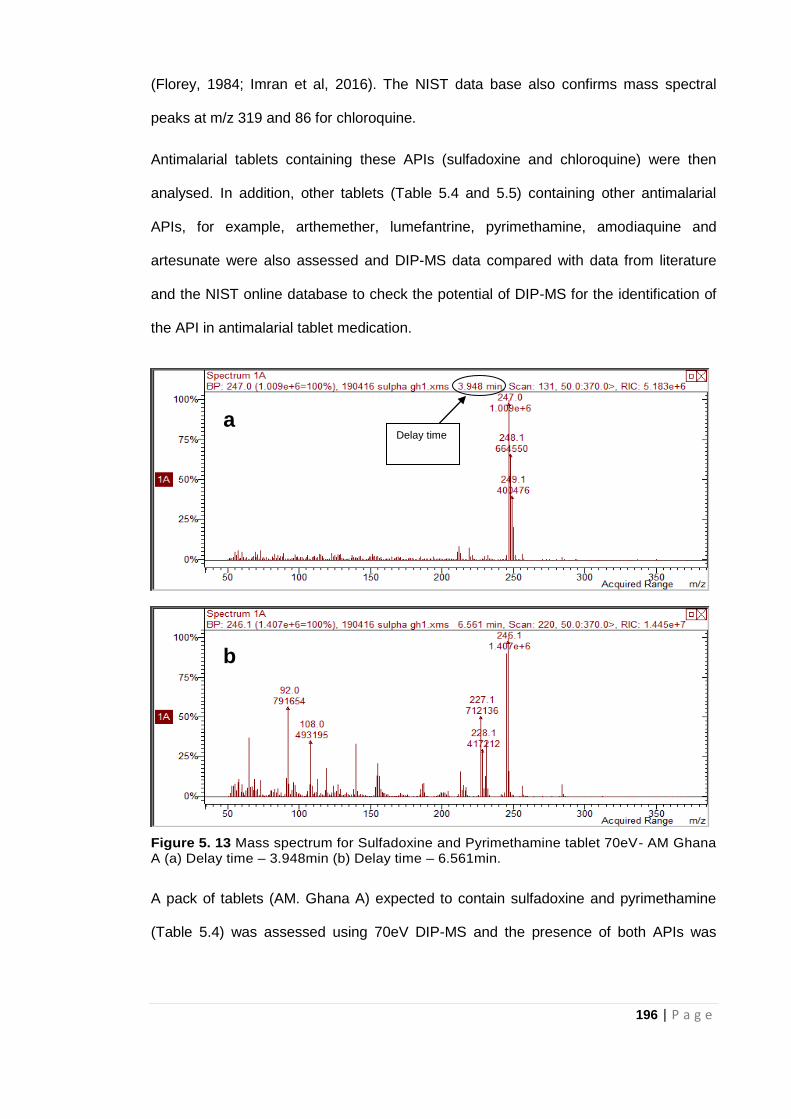
196 | P a g e
(Florey, 1984; Imran et al, 2016). The NIST data base also confirms mass spectral
peaks at m/z 319 and 86 for chloroquine.
Antimalarial tablets containing these APIs (sulfadoxine and chloroquine) were then
analysed. In addition, other tablets (Table 5.4 and 5.5) containing other antimalarial
APIs, for example, arthemether, lumefantrine, pyrimethamine, amodiaquine and
artesunate were also assessed and DIP-MS data compared with data from literature
and the NIST online database to check the potential of DIP-MS for the identification of
the API in antimalarial tablet medication.
Figure 5. 13 Mass spectrum for Sulfadoxine and Pyrimethamine tablet 70eV- AM Ghana A (a) Delay time – 3.948min (b) Delay time – 6.561min.
A pack of tablets (AM. Ghana A) expected to contain sulfadoxine and pyrimethamine
(Table 5.4) was assessed using 70eV DIP-MS and the presence of both APIs was
Delay time a
b
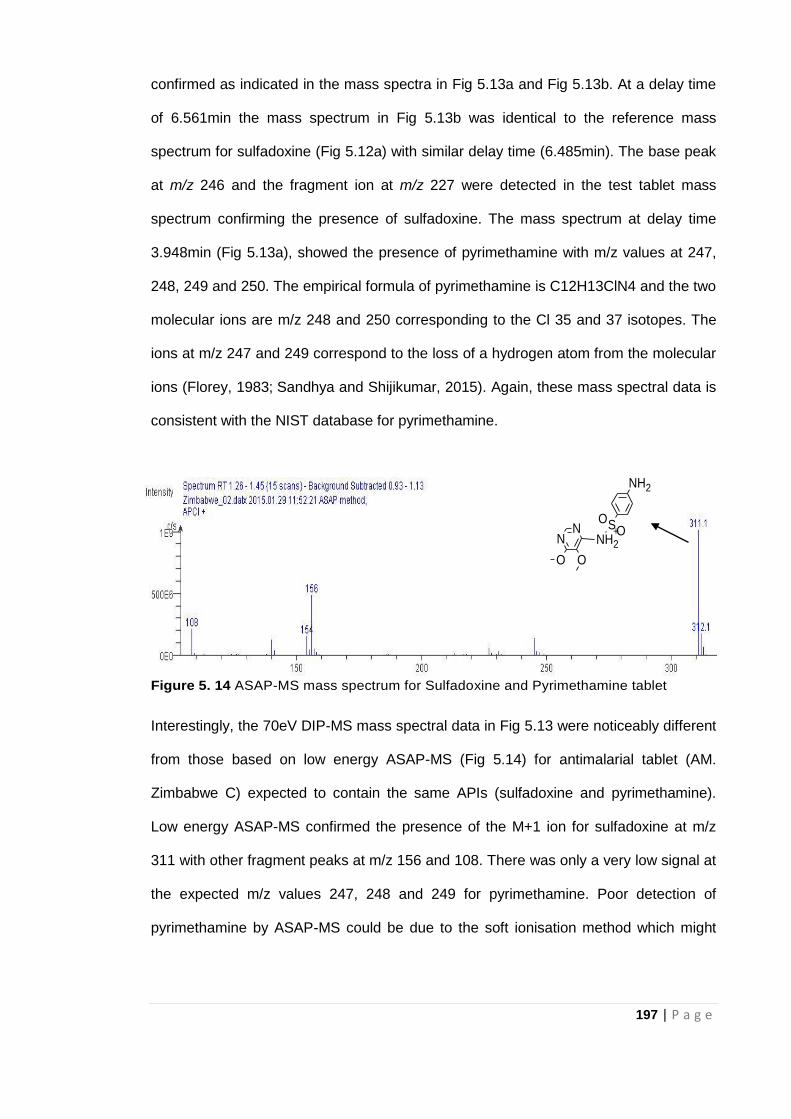
197 | P a g e
confirmed as indicated in the mass spectra in Fig 5.13a and Fig 5.13b. At a delay time
of 6.561min the mass spectrum in Fig 5.13b was identical to the reference mass
spectrum for sulfadoxine (Fig 5.12a) with similar delay time (6.485min). The base peak
at m/z 246 and the fragment ion at m/z 227 were detected in the test tablet mass
spectrum confirming the presence of sulfadoxine. The mass spectrum at delay time
3.948min (Fig 5.13a), showed the presence of pyrimethamine with m/z values at 247,
248, 249 and 250. The empirical formula of pyrimethamine is C12H13ClN4 and the two
molecular ions are m/z 248 and 250 corresponding to the Cl 35 and 37 isotopes. The
ions at m/z 247 and 249 correspond to the loss of a hydrogen atom from the molecular
ions (Florey, 1983; Sandhya and Shijikumar, 2015). Again, these mass spectral data is
consistent with the NIST database for pyrimethamine.
Figure 5. 14 ASAP-MS mass spectrum for Sulfadoxine and Pyrimethamine tablet
Interestingly, the 70eV DIP-MS mass spectral data in Fig 5.13 were noticeably different
from those based on low energy ASAP-MS (Fig 5.14) for antimalarial tablet (AM.
Zimbabwe C) expected to contain the same APIs (sulfadoxine and pyrimethamine).
Low energy ASAP-MS confirmed the presence of the M+1 ion for sulfadoxine at m/z
311 with other fragment peaks at m/z 156 and 108. There was only a very low signal at
the expected m/z values 247, 248 and 249 for pyrimethamine. Poor detection of
pyrimethamine by ASAP-MS could be due to the soft ionisation method which might
SOO
OO
NH2
+N
NH2
N
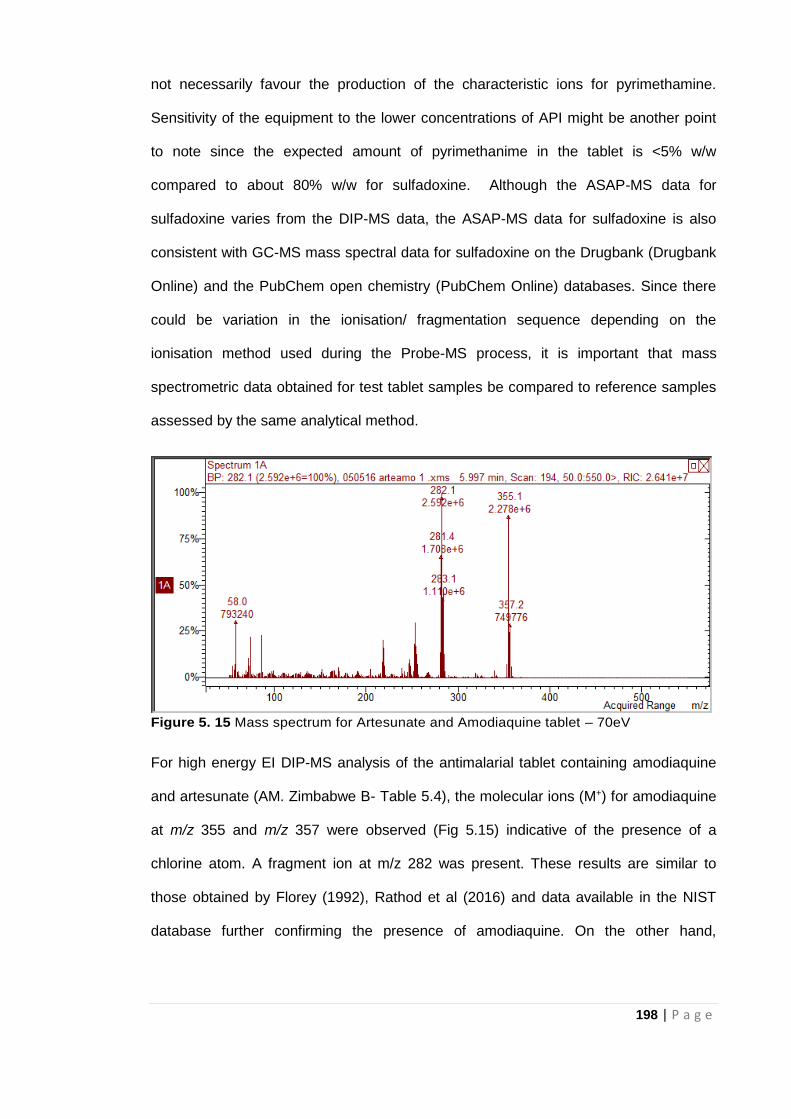
198 | P a g e
not necessarily favour the production of the characteristic ions for pyrimethamine.
Sensitivity of the equipment to the lower concentrations of API might be another point
to note since the expected amount of pyrimethanime in the tablet is <5% w/w
compared to about 80% w/w for sulfadoxine. Although the ASAP-MS data for
sulfadoxine varies from the DIP-MS data, the ASAP-MS data for sulfadoxine is also
consistent with GC-MS mass spectral data for sulfadoxine on the Drugbank (Drugbank
Online) and the PubChem open chemistry (PubChem Online) databases. Since there
could be variation in the ionisation/ fragmentation sequence depending on the
ionisation method used during the Probe-MS process, it is important that mass
spectrometric data obtained for test tablet samples be compared to reference samples
assessed by the same analytical method.
Figure 5. 15 Mass spectrum for Artesunate and Amodiaquine tablet – 70eV
For high energy EI DIP-MS analysis of the antimalarial tablet containing amodiaquine
and artesunate (AM. Zimbabwe B- Table 5.4), the molecular ions (M+) for amodiaquine
at m/z 355 and m/z 357 were observed (Fig 5.15) indicative of the presence of a
chlorine atom. A fragment ion at m/z 282 was present. These results are similar to
those obtained by Florey (1992), Rathod et al (2016) and data available in the NIST
database further confirming the presence of amodiaquine. On the other hand,
199 | P a g e
molecular ion for artesunate was not detected. Mass spectral data for artesunate is
also not available in the NIST and DrugBank databases. This could be due to thermal
stability issues attributed to artemisinin and its derivatives where degradation occurred
when stored above room temperature (Ansari et al, 2013). Artesunate is a derivative of
artemisinin so extreme temperatures might have caused degradation of the API during
analysis. Furthermore, it is also possible that artesunate is not present in the sample as
no other fragments were detected.
Two different packs of antimalarial tablets (AM. India A and AM. Zimbabwe A) with
artemether and lumefantrine as the specified APIs were assessed using 70eV DIP MS.
Under the current analytical conditions the APIs were volatilised between 6 and 8
minutes into the run. Examples of mass spectra recorded over this period are shown in
Figure 5.16. In positive ion mode, the only ions observed were at m/z 142 and 100 (Fig
5.16a). Absence of any NIST mass spectral data for artemether and lumefantrine
makes it difficult to characterise the individual APIs. However mass spectral data based
on the Drugbank database identifies ions at m/z 142 and 100 as indicative of the
presence of lumefantrine. Again, as observed with the tablet containing sulfadoxine
and pyrimethamine, the difficulty in characterising API ions was found with the API of
lower concentration (artemether). Expected concentration of artemether in each of
these antimalarial tablets was about 8% w/w with much higher concentrations of 49%
w/w expected for lumefantrine.
Molecular ion for lumefantrine at m/z 528.9 (Fig 5.16b) was also detected in EI
negative ion mode. Results for lumefantrine were similar to those obtained by Bernier
et al (2016). In the negative mode, an ion at m/z 298 was observed at an increased
delay time of 7.6 minutes suggesting the presence of artemether in the tablet.
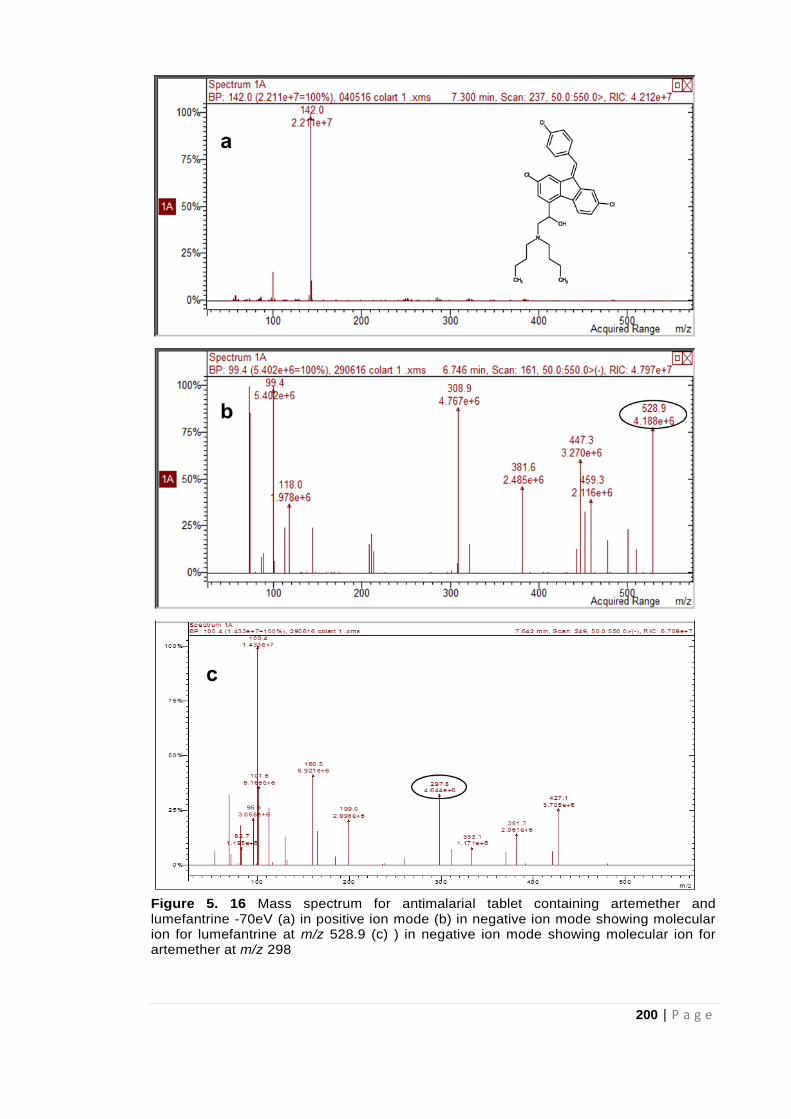
200 | P a g e
Figure 5. 16 Mass spectrum for antimalarial tablet containing artemether and lumefantrine -70eV (a) in positive ion mode (b) in negative ion mode showing molecular ion for lumefantrine at m/z 528.9 (c) ) in negative ion mode showing molecular ion for artemether at m/z 298
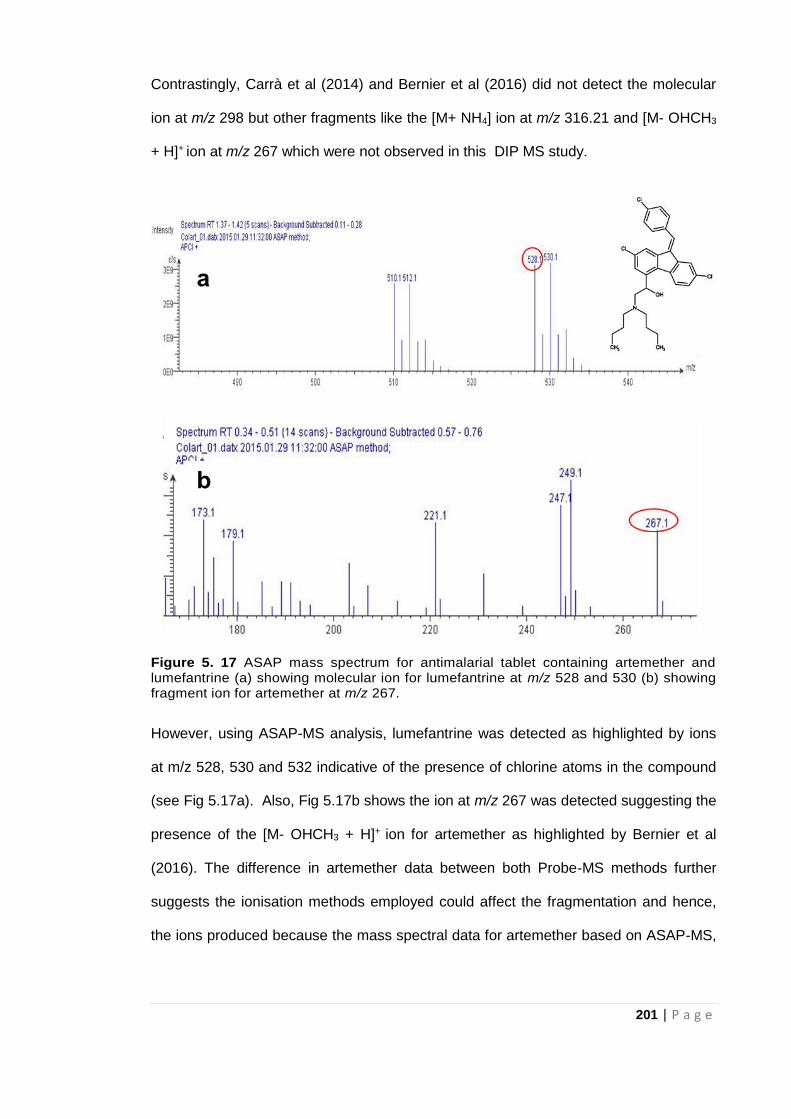
201 | P a g e
Contrastingly, Carrà et al (2014) and Bernier et al (2016) did not detect the molecular
ion at m/z 298 but other fragments like the [M+ NH4] ion at m/z 316.21 and [M- OHCH3
+ H]+ ion at m/z 267 which were not observed in this DIP MS study.
Figure 5. 17 ASAP mass spectrum for antimalarial tablet containing artemether and lumefantrine (a) showing molecular ion for lumefantrine at m/z 528 and 530 (b) showing fragment ion for artemether at m/z 267.
However, using ASAP-MS analysis, lumefantrine was detected as highlighted by ions
at m/z 528, 530 and 532 indicative of the presence of chlorine atoms in the compound
(see Fig 5.17a). Also, Fig 5.17b shows the ion at m/z 267 was detected suggesting the
presence of the [M- OHCH3 + H]+ ion for artemether as highlighted by Bernier et al
(2016). The difference in artemether data between both Probe-MS methods further
suggests the ionisation methods employed could affect the fragmentation and hence,
the ions produced because the mass spectral data for artemether based on ASAP-MS,
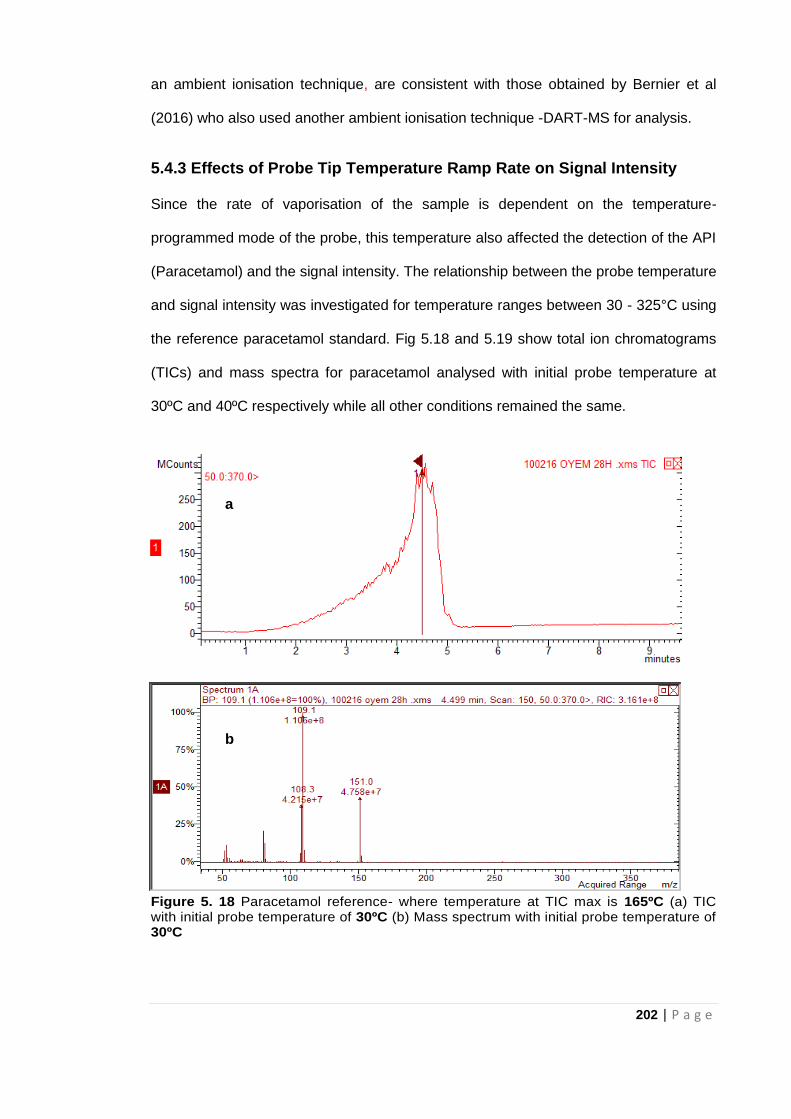
202 | P a g e
an ambient ionisation technique, are consistent with those obtained by Bernier et al
(2016) who also used another ambient ionisation technique -DART-MS for analysis.
5.4.3 Effects of Probe Tip Temperature Ramp Rate on Signal Intensity
Since the rate of vaporisation of the sample is dependent on the temperature-
programmed mode of the probe, this temperature also affected the detection of the API
(Paracetamol) and the signal intensity. The relationship between the probe temperature
and signal intensity was investigated for temperature ranges between 30 - 325°C using
the reference paracetamol standard. Fig 5.18 and 5.19 show total ion chromatograms
(TICs) and mass spectra for paracetamol analysed with initial probe temperature at
30ºC and 40ºC respectively while all other conditions remained the same.
Figure 5. 18 Paracetamol reference- where temperature at TIC max is 165ºC (a) TIC with initial probe temperature of 30ºC (b) Mass spectrum with initial probe temperature of 30ºC
a
b
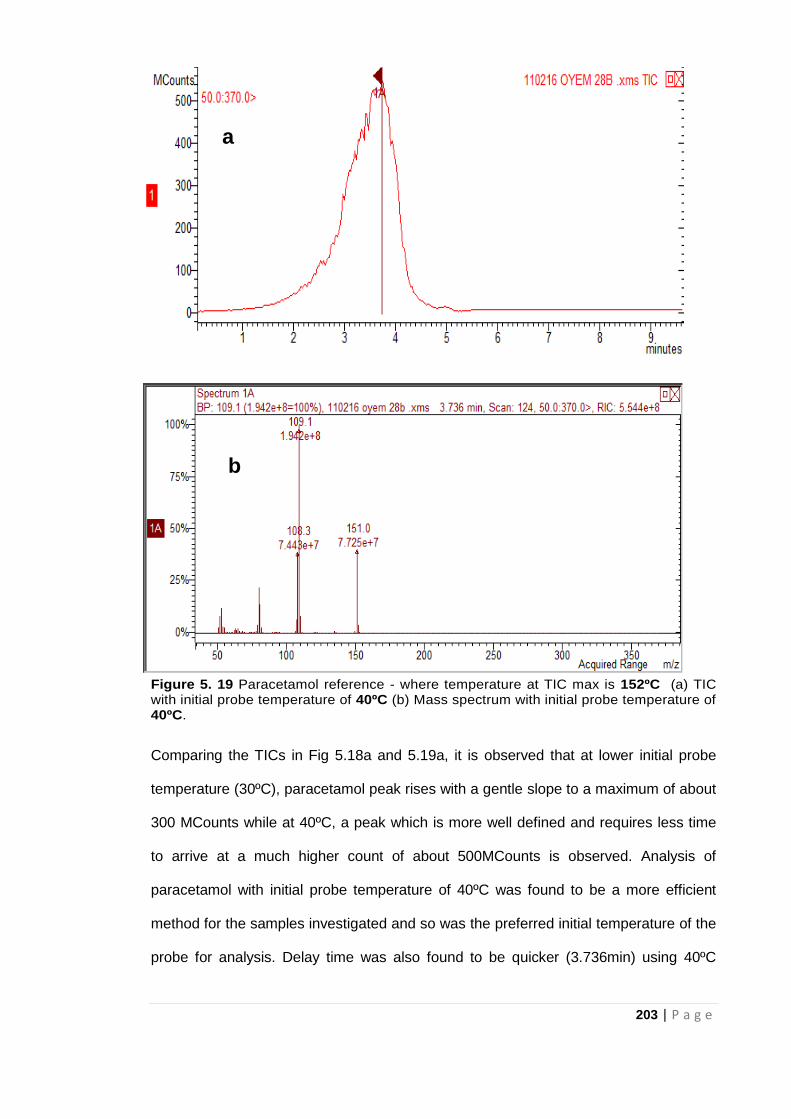
203 | P a g e
Figure 5. 19 Paracetamol reference - where temperature at TIC max is 152ºC (a) TIC with initial probe temperature of 40ºC (b) Mass spectrum with initial probe temperature of 40ºC.
Comparing the TICs in Fig 5.18a and 5.19a, it is observed that at lower initial probe
temperature (30ºC), paracetamol peak rises with a gentle slope to a maximum of about
300 MCounts while at 40ºC, a peak which is more well defined and requires less time
to arrive at a much higher count of about 500MCounts is observed. Analysis of
paracetamol with initial probe temperature of 40ºC was found to be a more efficient
method for the samples investigated and so was the preferred initial temperature of the
probe for analysis. Delay time was also found to be quicker (3.736min) using 40ºC
a
b
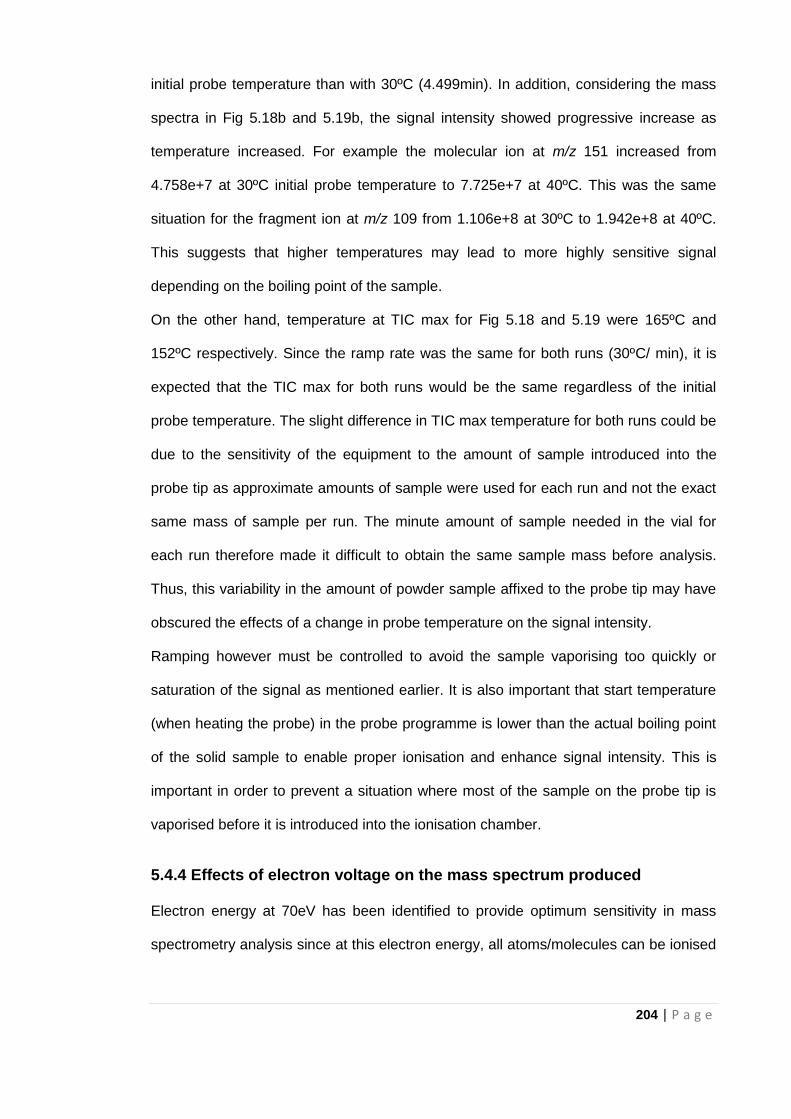
204 | P a g e
initial probe temperature than with 30ºC (4.499min). In addition, considering the mass
spectra in Fig 5.18b and 5.19b, the signal intensity showed progressive increase as
temperature increased. For example the molecular ion at m/z 151 increased from
4.758e+7 at 30ºC initial probe temperature to 7.725e+7 at 40ºC. This was the same
situation for the fragment ion at m/z 109 from 1.106e+8 at 30ºC to 1.942e+8 at 40ºC.
This suggests that higher temperatures may lead to more highly sensitive signal
depending on the boiling point of the sample.
On the other hand, temperature at TIC max for Fig 5.18 and 5.19 were 165ºC and
152ºC respectively. Since the ramp rate was the same for both runs (30ºC/ min), it is
expected that the TIC max for both runs would be the same regardless of the initial
probe temperature. The slight difference in TIC max temperature for both runs could be
due to the sensitivity of the equipment to the amount of sample introduced into the
probe tip as approximate amounts of sample were used for each run and not the exact
same mass of sample per run. The minute amount of sample needed in the vial for
each run therefore made it difficult to obtain the same sample mass before analysis.
Thus, this variability in the amount of powder sample affixed to the probe tip may have
obscured the effects of a change in probe temperature on the signal intensity.
Ramping however must be controlled to avoid the sample vaporising too quickly or
saturation of the signal as mentioned earlier. It is also important that start temperature
(when heating the probe) in the probe programme is lower than the actual boiling point
of the solid sample to enable proper ionisation and enhance signal intensity. This is
important in order to prevent a situation where most of the sample on the probe tip is
vaporised before it is introduced into the ionisation chamber.
5.4.4 Effects of electron voltage on the mass spectrum produced
Electron energy at 70eV has been identified to provide optimum sensitivity in mass
spectrometry analysis since at this electron energy, all atoms/molecules can be ionised
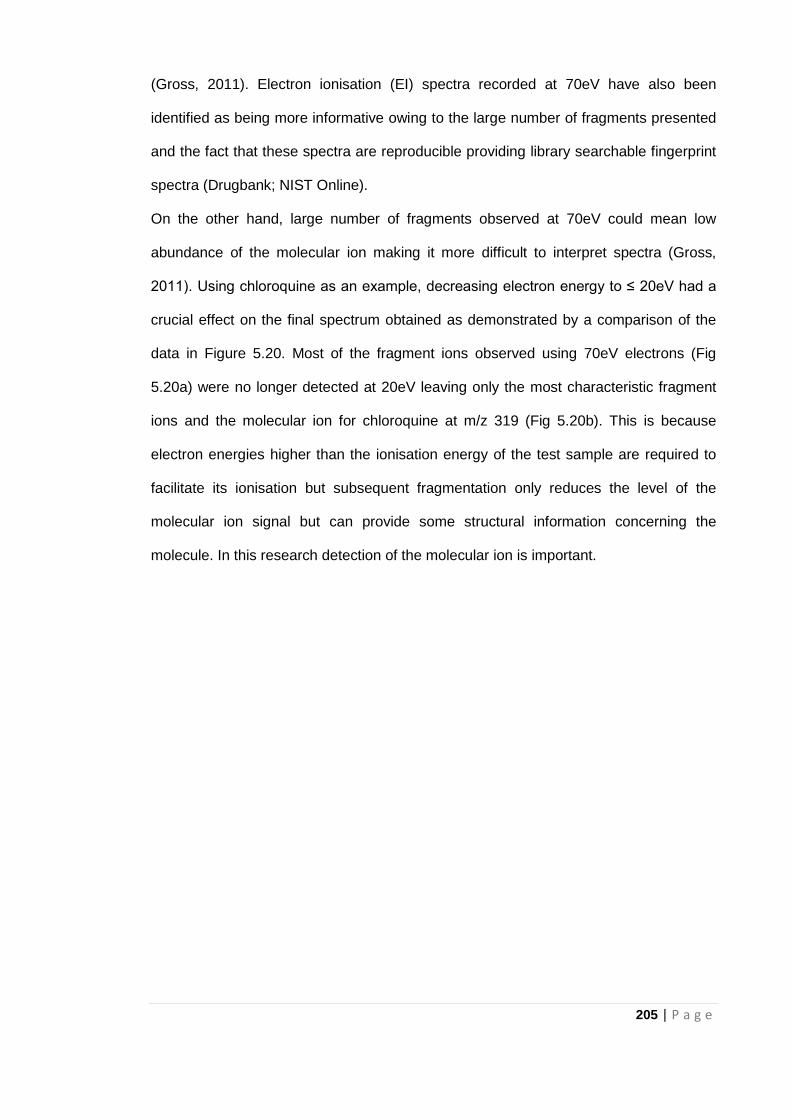
205 | P a g e
(Gross, 2011). Electron ionisation (EI) spectra recorded at 70eV have also been
identified as being more informative owing to the large number of fragments presented
and the fact that these spectra are reproducible providing library searchable fingerprint
spectra (Drugbank; NIST Online).
On the other hand, large number of fragments observed at 70eV could mean low
abundance of the molecular ion making it more difficult to interpret spectra (Gross,
2011). Using chloroquine as an example, decreasing electron energy to ≤ 20eV had a
crucial effect on the final spectrum obtained as demonstrated by a comparison of the
data in Figure 5.20. Most of the fragment ions observed using 70eV electrons (Fig
5.20a) were no longer detected at 20eV leaving only the most characteristic fragment
ions and the molecular ion for chloroquine at m/z 319 (Fig 5.20b). This is because
electron energies higher than the ionisation energy of the test sample are required to
facilitate its ionisation but subsequent fragmentation only reduces the level of the
molecular ion signal but can provide some structural information concerning the
molecule. In this research detection of the molecular ion is important.
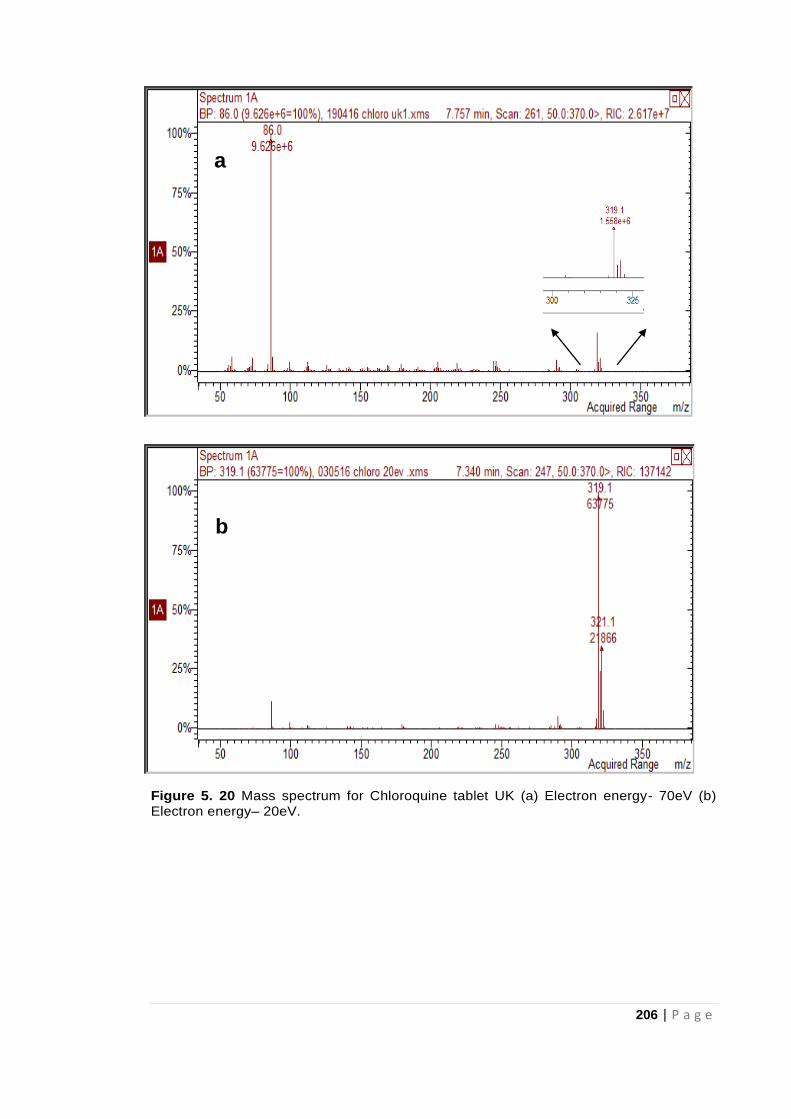
206 | P a g e
Figure 5. 20 Mass spectrum for Chloroquine tablet UK (a) Electron energy- 70eV (b) Electron energy– 20eV.
a
b
207 | P a g e
Table 5.8 is a list of tablets analysed and comments on the mass spectral data
observed at different at 70ev and 20eV respectively.
Table 5. 8 DIP-MS data for antimalarial tablets with 70eV and 20eV
5.4.5 Limit of Detection (LOD) and Quantification Study
The potential of DIP-MS in the quantification of APIs in tablet medication was
considered. Standard calibration mixtures of paracetamol (API) in maize starch
Tablet(s) 70eV 20eV API(s) Expected in
Tablets
AM. UK A1 & A2
M+ at m/z 319- low
abundance; fragment
at m/z 86 – high
abundance
M+ at m/z 319
enhanced- high
abundance; fragment
at m/z 86 low
abundance
Chloroquine phosphate
AM. Zimbabwe
A1 & A2
For artemether:
Ion(s) not detected.
For lumefantrine:
Ion at m/z 142 – high
abundance; at m/z
100 – low abundance
For artemether:
Ion(s) not detected.
For lumefantrine:
Ion at m/z 142 – high
abundance; at m/z
100 – not detected
Artemether and
Lumefantrine
AM. Zimbabwe
B1 & B2
For artesunate: Ion(s)
not detected.
For amodiaquine:
The molecular ion at
m/z 355 and 357 were
detected with the
fragment ion at m/z
282.
For artesunate:
Ion(s) not detected.
For amodiaquine:
The molecular ion at
m/z 355 was detected
but fragment ion at
m/z 282 was not
Artesunate and
Amodiaquine
AM. India A1 &
A2
For artemether:
Ion(s) not detected.
For lumefantrine:
Ion at m/z 142 – high
abundance; at m/z
100 – low abundance
For artemether:
Ion(s) not detected.
For lumefantrine:
Ion at m/z 142 – high
abundance; at m/z
100 – not detected
Artemether and
Lumefantrine
AM. Ghana A1
& A2
For sulfadoxine:
Intense peaks at m/z
246 and 245 were
detected with the
fragment ions at m/z
227 and 228.
For pyrimethamine:
Molecular Ion at m/z
248 indicative of the
Cl 35 isotope was
detected with ions at
m/z 247 and 249
indicating loss of
hydrogen ion in
molecular ions at m/z
248 and 250 (Cl 37
isotope) respectively.
Ion at m/z 247 was
the most prominent
For sulfadoxine: Ion
at m/z 246 detected
with high abundance
like 70eV but
fragment ion was
diminished/in low
abundance.
For pyrimethamine:
Molecular Ion at m/z
248 was detected
with ions at m/z 247
and. Ion at m/z 248
was the most
prominent
Sulfadoxine and
Pyrimethamine
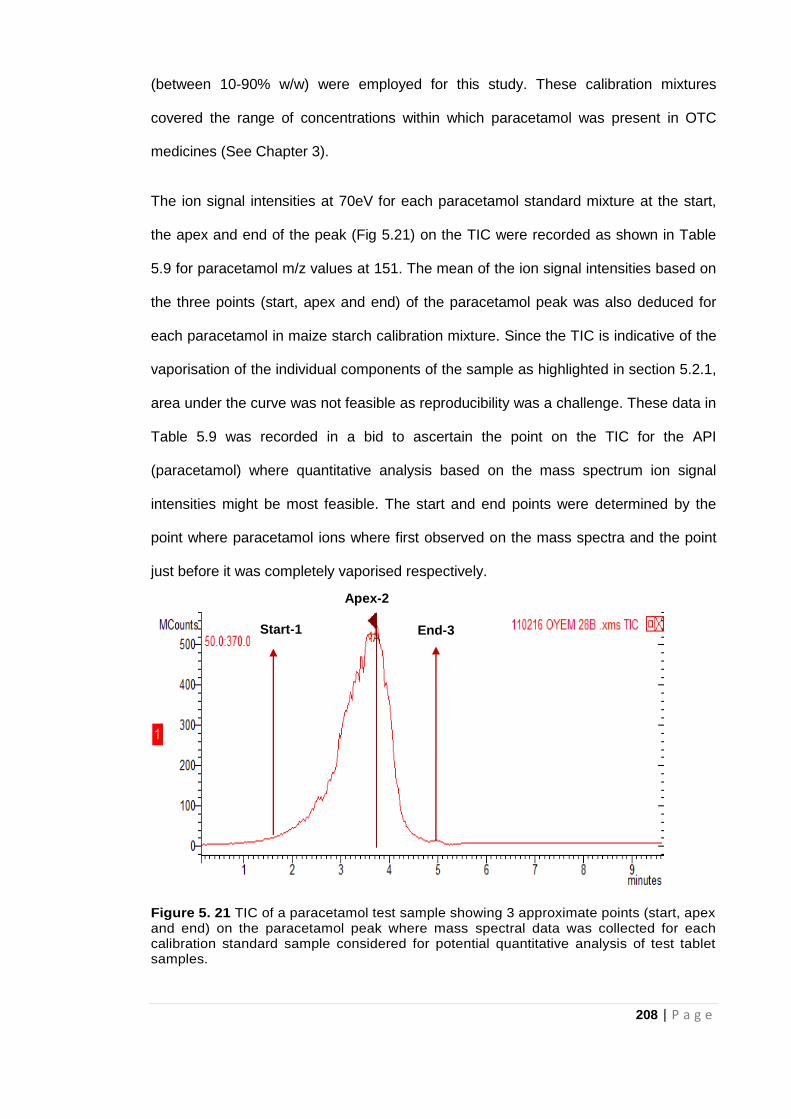
208 | P a g e
(between 10-90% w/w) were employed for this study. These calibration mixtures
covered the range of concentrations within which paracetamol was present in OTC
medicines (See Chapter 3).
The ion signal intensities at 70eV for each paracetamol standard mixture at the start,
the apex and end of the peak (Fig 5.21) on the TIC were recorded as shown in Table
5.9 for paracetamol m/z values at 151. The mean of the ion signal intensities based on
the three points (start, apex and end) of the paracetamol peak was also deduced for
each paracetamol in maize starch calibration mixture. Since the TIC is indicative of the
vaporisation of the individual components of the sample as highlighted in section 5.2.1,
area under the curve was not feasible as reproducibility was a challenge. These data in
Table 5.9 was recorded in a bid to ascertain the point on the TIC for the API
(paracetamol) where quantitative analysis based on the mass spectrum ion signal
intensities might be most feasible. The start and end points were determined by the
point where paracetamol ions where first observed on the mass spectra and the point
just before it was completely vaporised respectively.
Figure 5. 21 TIC of a paracetamol test sample showing 3 approximate points (start, apex and end) on the paracetamol peak where mass spectral data was collected for each calibration standard sample considered for potential quantitative analysis of test tablet samples.
Apex-2
Start-1 End-3
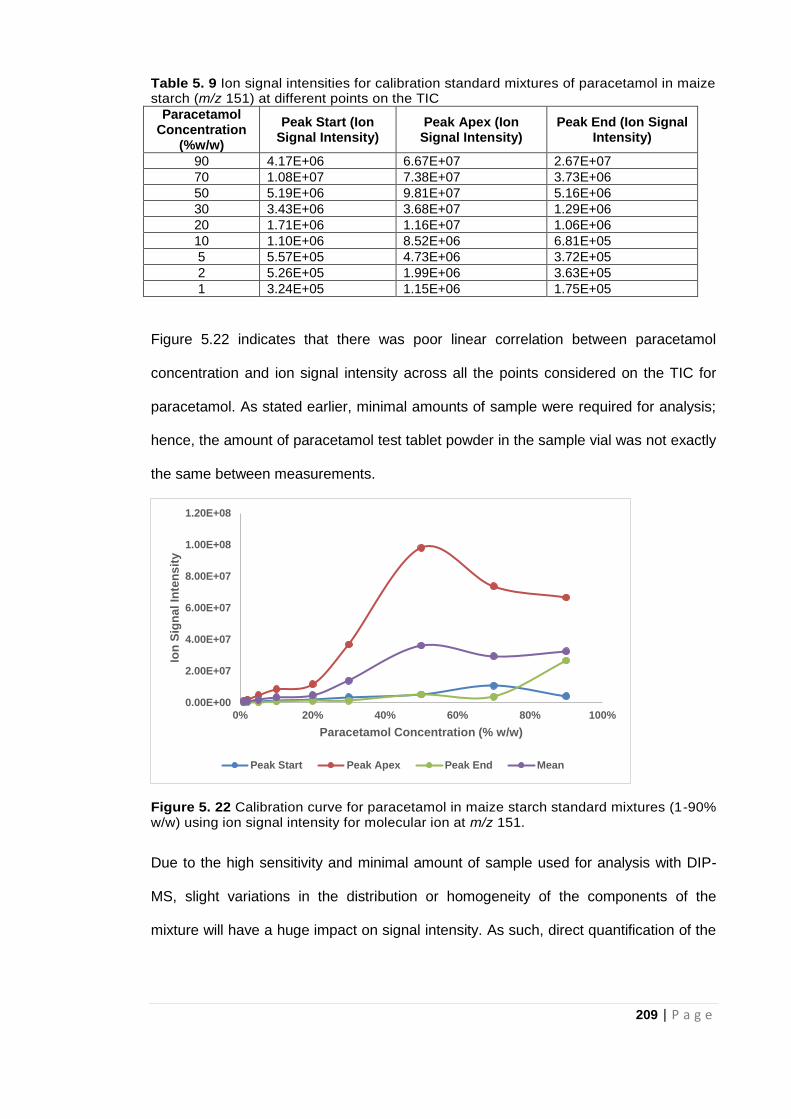
209 | P a g e
Table 5. 9 Ion signal intensities for calibration standard mixtures of paracetamol in maize starch (m/z 151) at different points on the TIC
Paracetamol Concentration
(%w/w)
Peak Start (Ion Signal Intensity)
Peak Apex (Ion Signal Intensity)
Peak End (Ion Signal Intensity)
90 4.17E+06 6.67E+07 2.67E+07
70 1.08E+07 7.38E+07 3.73E+06
50 5.19E+06 9.81E+07 5.16E+06
30 3.43E+06 3.68E+07 1.29E+06
20 1.71E+06 1.16E+07 1.06E+06
10 1.10E+06 8.52E+06 6.81E+05
5 5.57E+05 4.73E+06 3.72E+05
2 5.26E+05 1.99E+06 3.63E+05
1 3.24E+05 1.15E+06 1.75E+05
Figure 5.22 indicates that there was poor linear correlation between paracetamol
concentration and ion signal intensity across all the points considered on the TIC for
paracetamol. As stated earlier, minimal amounts of sample were required for analysis;
hence, the amount of paracetamol test tablet powder in the sample vial was not exactly
the same between measurements.
Figure 5. 22 Calibration curve for paracetamol in maize starch standard mixtures (1-90% w/w) using ion signal intensity for molecular ion at m/z 151.
Due to the high sensitivity and minimal amount of sample used for analysis with DIP-
MS, slight variations in the distribution or homogeneity of the components of the
mixture will have a huge impact on signal intensity. As such, direct quantification of the
0.00E+00
2.00E+07
4.00E+07
6.00E+07
8.00E+07
1.00E+08
1.20E+08
0% 20% 40% 60% 80% 100%
Ion
Sig
na
l In
ten
sit
y
Paracetamol Concentration (% w/w)
Peak Start Peak Apex Peak End Mean
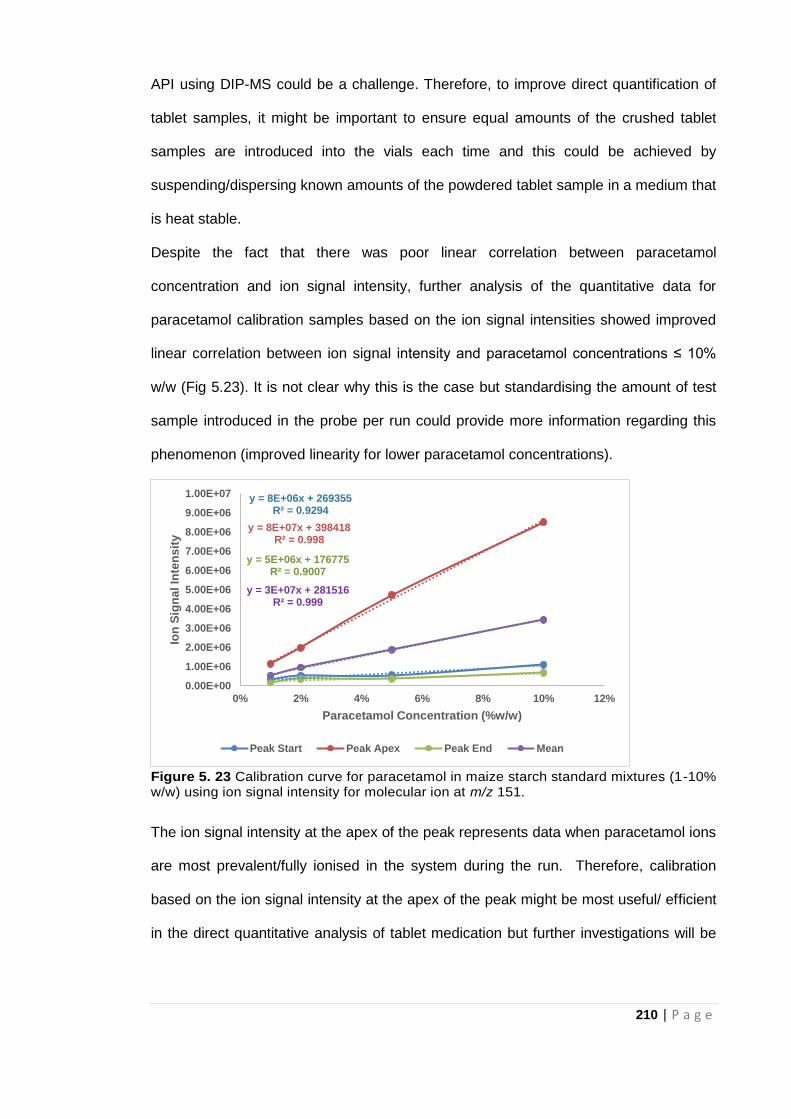
210 | P a g e
API using DIP-MS could be a challenge. Therefore, to improve direct quantification of
tablet samples, it might be important to ensure equal amounts of the crushed tablet
samples are introduced into the vials each time and this could be achieved by
suspending/dispersing known amounts of the powdered tablet sample in a medium that
is heat stable.
Despite the fact that there was poor linear correlation between paracetamol
concentration and ion signal intensity, further analysis of the quantitative data for
paracetamol calibration samples based on the ion signal intensities showed improved
linear correlation between ion signal intensity and paracetamol concentrations ≤ 10%
w/w (Fig 5.23). It is not clear why this is the case but standardising the amount of test
sample introduced in the probe per run could provide more information regarding this
phenomenon (improved linearity for lower paracetamol concentrations).
Figure 5. 23 Calibration curve for paracetamol in maize starch standard mixtures (1-10% w/w) using ion signal intensity for molecular ion at m/z 151.
The ion signal intensity at the apex of the peak represents data when paracetamol ions
are most prevalent/fully ionised in the system during the run. Therefore, calibration
based on the ion signal intensity at the apex of the peak might be most useful/ efficient
in the direct quantitative analysis of tablet medication but further investigations will be
y = 8E+06x + 269355R² = 0.9294
y = 8E+07x + 398418R² = 0.998
y = 5E+06x + 176775R² = 0.9007
y = 3E+07x + 281516R² = 0.999
0.00E+00
1.00E+06
2.00E+06
3.00E+06
4.00E+06
5.00E+06
6.00E+06
7.00E+06
8.00E+06
9.00E+06
1.00E+07
0% 2% 4% 6% 8% 10% 12%
Ion
Sig
na
l In
ten
sit
y
Paracetamol Concentration (%w/w)
Peak Start Peak Apex Peak End Mean
211 | P a g e
required to clarify this as data available so far are not enough to make any conclusive
statements.
Figure 5.24 shows that the presence of the API, paracetamol could be identified down
to 0.1% w/w of the paracetamol/maize starch powder mixture. In addition, the amount
of test sample powder used is much less than the amount needed for analysis in the
spectroscopic techniques thereby further reducing contact and exposure to the
samples/chemicals.
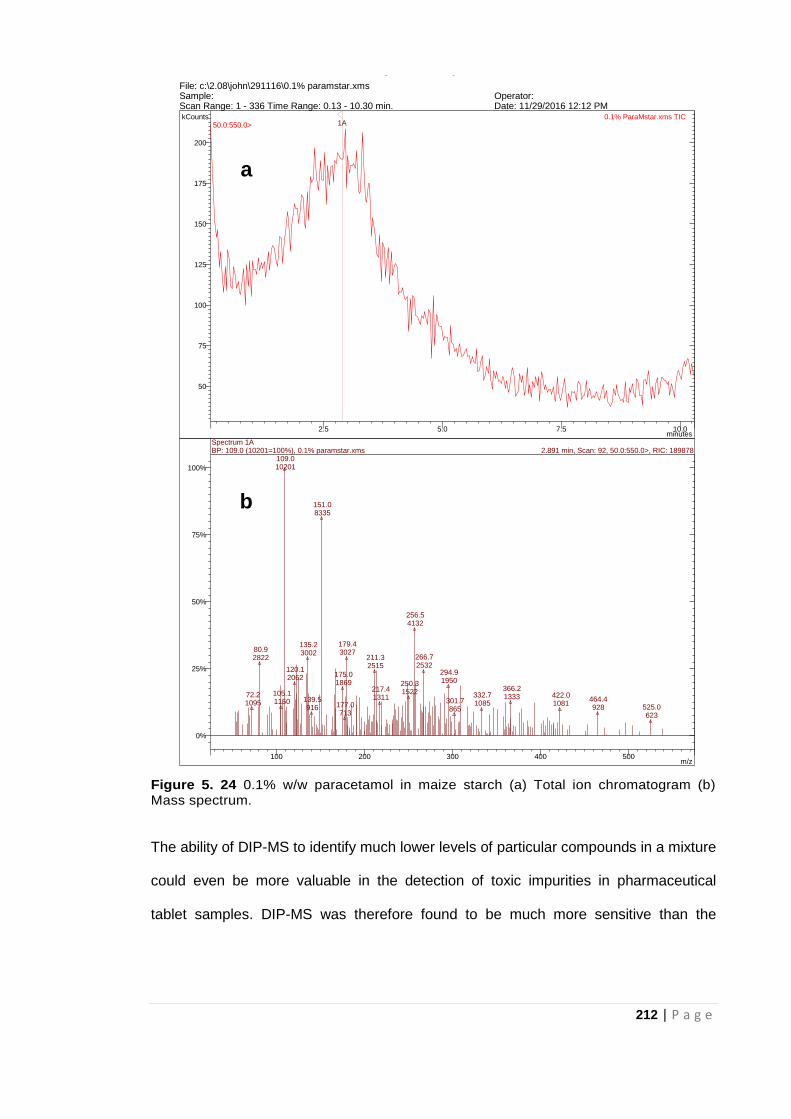
212 | P a g e
Figure 5. 24 0.1% w/w paracetamol in maize starch (a) Total ion chromatogram (b) Mass spectrum.
The ability of DIP-MS to identify much lower levels of particular compounds in a mixture
could even be more valuable in the detection of toxic impurities in pharmaceutical
tablet samples. DIP-MS was therefore found to be much more sensitive than the
MS Data Review Active Chromatogram and Spectrum Plots - 4/13/2017 4:45 PM
File: c:\2.08\john\291116\0.1% paramstar.xmsSample: Operator: Scan Range: 1 - 336 Time Range: 0.13 - 10.30 min. Date: 11/29/2016 12:12 PM
2.5 5.0 7.5 10.0minutes
50
75
100
125
150
175
200
kCounts 0.1% ParaMstar.xms TIC50.0:550.0> 1A
100 200 300 400 500m/z
0%
25%
50%
75%
100%
72.2 1095
80.9 2822
105.1 1150
109.0 10201
120.1 2062
135.2 3002
139.5 916
151.0 8335
175.0 1869
177.0 713
179.4 3027
211.3 2515
217.4 1311
250.3 1522
256.5 4132
266.7 2532
294.9 1950
301.7 865
332.7 1085
366.2 1333 422.0
1081 464.4 928 525.0
623
Spectrum 1A2.891 min, Scan: 92, 50.0:550.0>, RIC: 189878BP: 109.0 (10201=100%), 0.1% paramstar.xms
a
b
213 | P a g e
spectroscopic techniques even when analysing the powder mixture directly without
using any solvent extractive techniques and in full scan mode.
Consequently DIP-MS shows its propensity in the simple and rapid analysis of tablet
samples with concentrations much lower than the limit of detection of ATR-FTIR
spectroscopy. It is also non-destructive since no treatment is required for samples
before analysis safe crushing of the tablet.
5.5 Conclusion
DIP-MS therefore provides another simple and more sensitive option in the event that
samples to be analysed exceed the limit of detection of the cheaper but less sensitive
spectroscopic techniques. This is observed by its ability to identify individual
components in analgesic and antimalarial tablets. The probe MS method was able
characterise and identify unknown material in suspect tablets. Furthermore, samples
were analysed directly without solvent extraction thereby saving time spent in sample
preparation and the associated costs of solvent consumption. Probe MS data were
obtained in less than 10 minutes. Its non-destructive feature and the speed of analysis
compared to conventional solvent extraction techniques makes DIP-MS well-suited for
assessing possible falsified and substandard medicines. The potential of DIP-MS in the
direct quantification of APIs in pharmaceutical solid dosage forms can be further
explored.
Though the pharmacopoeia approved solvent extraction techniques are generally
employed in the analysis of known chemicals (including APIs, excipients and possible
impurites/contaminants) in pharmaceutical tablet formulations, these techniques might
not be the most efficient for the forensic analysis of unknowns. DIP-MS on the other
hand enables identification of unknowns as individual masses of the components
molecular or fragment ions are recorded which further helps in elucidation of the
structure of the compound.
214 | P a g e
Moreover, with the advent of mobile fibre optics spectrometers and their increasing
availability, portable spectrometry based instruments can be deployed for in-field
analysis of medicines.
Operation of the DIP-MS instrument including spectral interpretation can be automated
by comparing recorded mass spectra with those available in a local reference library
which in turn helps to provide logical results/data to non-specialist personnel in the
field.
In addition to the simpler and quicker analytical techniques already proposed in
Chapters 3 -5 for the screening of medicines in LMICs, conventional solvent extraction
techniques were examined in order to validate results based on the rapid methods
developed. Ultraviolet- visible (UV-vis) spectroscopy and Liquid Chromatography-
Mass Spectrometry (LC-MS) will be the solvent extraction techniques considered in the
next two chapters.

215 | P a g e
5.6 References
Ansari, M. T., Saeed Saify, Z., Sultana, N., Ahmad, I., Saeed-Ul-Hassan, S., Tariq, I.
and Khanum, M., (2013) Malaria and artemisinin derivatives: an updated review. Mini
Reviews in Medicinal Chemistry, 13(13): 1879-1902.
Bernier, M.C., Li, F., Musselman, B., Newton, P.N. and Fernández, F.M. (2016)
Fingerprinting of falsified artemisinin combination therapies via direct analysis in real
time coupled to a compact single quadrupole mass spectrometer. Analytical Methods,
8(36): 6616-6624.
Brittain, H. G. (1992) Profiles of drug substances, excipients and related methodology
(Vol. 21). London: Academic press.
Brown, H., Oktem, B., Windom, A., Doroshenko, V. and Evans-Nguyen, K. (2016)
Direct analysis in real time (DART) and a portable mass spectrometer for rapid
identification of common and designer drugs on-site. Forensic Chemistry, 1: 66-73.
Carrà, A., Bagnati, R., Fanelli, R. and Bonati, M. (2014) Fast and reliable artemisinin
determination from different Artemisia annua leaves based alimentary products by high
performance liquid chromatography–tandem mass spectrometry. Food Chemistry, 142:
114-120.
Chaccour, C., Kaur, H. and Del Pozo, J.L. (2015) Falsified antimalarials: a minireview.
Expert Review of Anti-infective Therapy, 13(4): 505-509.
Chhonker, Y.S., Pandey, C.P., Chandasana, H., Laxman, T.S., Prasad, Y.D., Narain,
V.S., Dikshit, M. and Bhatta, R.S. (2016) Simultaneous quantitation of acetylsalicylic
acid and clopidogrel along with their metabolites in human plasma using liquid
chromatography tandem mass spectrometry. Biomedical Chromatography, 30(3): 466-
473.
Contreras, J.A., Murray, J.A., Tolley, S.E., Oliphant, J.L., Tolley, H.D., Lammert, S.A.,
Lee, E.D., Later, D.W. and Lee, M.L. (2008) Hand-portable gas chromatograph-toroidal
ion trap mass spectrometer (GC-TMS) for detection of hazardous compounds. Journal
of the American Society for Mass Spectrometry, 19(10): 1425-1434.
Culzoni, M. J., Dwivedi, P., Green, M. D., Newton, P. N., and Fernández, F. M. (2014)
Ambient mass spectrometry technologies for the detection of falsified drugs. Medicinal
Chemistry Communication, 5(1): 9-19.
DrugBank. Available at: https://www.drugbank.ca/ (accessed 13.02.18).
Fernandez, F., McEwen, C., Syage, J.A., Ouyang, Z., Hieftje, G., Venter, A., Hiraoka,
K., Cooks, G., Vertes, A., Shiea, J.T. and Muddiman, D. (2014) Ambient ionization
mass spectrometry. Royal Society of Chemistry.
Flego, C. and Zannoni, C. (2012) Direct Insertion Probe- Mass Spectrometry in the
Characterization of Opportunity Crudes. Current Trends in Mass Spectrometry,
Available at http://www.spectroscopyonline.com/direct-insertion-probe-mass-
spectrometry-dip-ms-characterization-opportunity-crudes (accessed 13.05.16).
216 | P a g e
Florey, K. (1983) Profiles of drug substances, excipients and related methodology (Vol.
12). London: Academic press.
Florey, K. (1984) Profiles of drug substances, excipients and related methodology (Vol.
13). London: Academic press.
Florey, K. (1988) Profiles of drug substances, excipients and related methodology (Vol.
17). London: Academic press.
Gallagher, J. (2017) Malaria drugs fail for first time on patients in UK, Available at
http://www.bbc.co.uk/news/health-38796337 (accessed 31.01.17).
Gross, J.H. (2011) Mass Spectrometry: A Textbook, 2nd edition, Verlag Berlin,
Heidelberg: Springer.
Höllein, L., Kaale, E., Mwalwisi, Y.H., Schulze, M.H. and Holzgrabe, U. (2016) Routine
quality control of medicines in developing countries: analytical challenges, regulatory
infrastructures and the prevalence of counterfeit medicines in Tanzania. TrAC Trends
in Analytical Chemistry, 76: 60-70.
Imran, M., Ashiq, M.Z., Shafi, H., Usman, H.F., Wattoo, S.A., Sarwar, M. and Tahir,
M.A. (2016) Hair analysis of an unusual case of Chloroquine intoxication. Legal
Medicine, 19: 5-10.
Karunamoorthi, K. (2014) The counterfeit anti-malarial is a crime against humanity: a
systematic review of the scientific evidence. Malaria Journal, 13(1): 209.
Kaur, H. (2015) Counterfeit Pharmaceuticals and Methods to Test Them. In: Annual
Report of the Government Chief Scientific Adviser 2015: Forensic Science and
Beyond: Authenticity, Provenance and Assurance Evidence and Case Studies.
Government Office for Science, London: 132-137. Available at
http://researchonline.lshtm.ac.uk/2528148/ (accessed 19.08.16).
Kaur, H., Clarke, S., Lalani, M., Phanouvong, S., Guérin, P., McLoughlin, A., Wilson,
B.K., Deats, M., Plançon, A., Hopkins, H. and Miranda, D. (2016) Fake anti-malarials:
start with the facts. Malaria Journal, 15(1); 86.
Kovacs, S., Hawes, S.E., Maley, S.N., Mosites, E., Wong, L. and Stergachis, A. (2014)
Technologies for detecting falsified and substandard drugs in low and middle-income
countries. PLoS One, 9(3): e90601.
Kumano, S., Sugiyama, M., Yamada, M., Nishimura, K., Hasegawa, H., Morokuma, H.,
Inoue, H. and Hashimoto, Y. (2015) Probe Heating Method for the Analysis of Solid
Samples Using a Portable Mass Spectrometer. Mass Spectrometry, 4(1): A0038-
A0038.
Lawton, Z.E., Traub, A., Fatigante, W.L., Mancias, J., O’Leary, A.E., Hall, S.E.,
Wieland, J.R., Oberacher, H., Gizzi, M.C. and Mulligan, C.C. (2017) Analytical
validation of a portable mass spectrometer featuring interchangeable, ambient
ionization sources for high throughput forensic evidence screening. Journal of the
American Society for Mass Spectrometry, 28(6): 1048-1059.
Li, M., Ma, H., Gao, J., Zhang, L., Wang, X., Liu, D., Bian, J. and Jiang, Y. (2017)
Rapid screening of non-steroidal anti-inflammatory drugs illegally added in anti-
217 | P a g e
rheumatic herbal supplements and herbal remedies by portable ion mobility
spectrometry. Journal of Pharmaceutical and Biomedical Analysis, 145: 203-208.
Ma, X. and Ouyang, Z. (2016) Ambient ionization and miniature mass spectrometry
system for chemical and biological analysis. TrAC Trends in Analytical Chemistry, 85:
10-19.
Modick, H., Schütze, A., Pälmke, C., Weiss, T., Brüning, T. and Koch, H.M. (2013)
Rapid determination of N-acetyl-4-aminophenol (paracetamol) in urine by tandem mass
spectrometry coupled with on-line clean-up by two dimensional turbulent flow/reversed
phase liquid chromatography. Journal of Chromatography B, 925: 33-39.
NIST: National Institute of Standards and Technology Chemistry WebBook. Available
at: https://webbook.nist.gov/chemistry/ (accessed 20.02.18).
Ouyang, Z., Noll, R.J. and Cooks, R.G. (2009) Handheld miniature ion trap mass
spectrometers. Analytical Chemistry 81: 2421-2425.
PubChem Open Chemistry Database. Available at:
https://pubchem.ncbi.nlm.nih.gov/search/ (accessed 20.03.18).
Rathod, D.M., Patel, K.R., Mistri, H.N., Jangid, A.G., Shrivastav, P.S. and Sanyal, M.
(2016) Application of an LC–MS/MS method for reliable determination of amodiaquine,
N-desethylamodiaquine, artesunate and dihydroartemisinin in human plasma for a
bioequivalence study in healthy Indian subjects. Journal of Pharmaceutical and
Biomedical Analysis, 124: 67-78.
Rebiere, H., Guinot, P., Chauvey, D. and Brenier, C. (2017) Fighting falsified
medicines: The analytical approach. Journal of Pharmaceutical and Biomedical
Analysis, 142: 286-306.
Sandhya, S.M. and Shijikumar, P.S. (2015) A Simplified Liquid Chromatography-Mass
Spectrometry Method for Simultaneous Determination of Pyrimethamine, Sulphadoxine
and Artesunate in Human Plasma. Journal of Applied Pharmaceutical Science, 5 (06):
109-114.
Sneha, M., Dulay, M.T. and Zare, R.N. (2017) Introducing mass spectrometry to first-
year undergraduates: Analysis of caffeine and other components in energy drinks using
paper-spray mass spectrometry. International Journal of Mass Spectrometry, 418: 156-
161.
Snyder, D.T., Pulliam, C.J., Ouyang, Z. and Cooks, R.G. (2015) Miniature and fieldable
mass spectrometers: recent advances. Analytical Chemistry, 88(1): 2-29.
White, M. D. (2014) An Analytical Profile of Aceclofenac . Microgram Journal, 11: 1-4.
Zou, W.B., Yin, L.H. and Jin, S.H. (2017) Advances in rapid drug detection technology.
Journal of Pharmaceutical and Biomedical Analysis, 147: 81-88.
218 | P a g e
CHAPTER SIX
Ultraviolet-Visible (UV-Vis)
Spectrophotometry for validation
of quantitative ATR-FTIR data
219 | P a g e
6.1 Introduction
Advancement in technology has made authentication of medicines and
pharmacovigilance in general very complex as established in Chapter 2. Consequently,
it is essential that methods employed in the screening of medicines facilitate the prompt
removal of these medicines from the market (Dégardin et al, 2015).
Quantification of the API is very crucial in the quality control of medicines since
inconsistency in API content or absence of the API could pose a serious threat to
public health as highlighted in Chapter 2 (Dégardin et al, 2014). This is because
medicines are beneficial not just when the APIs are present but when the APIs are
present in the right amount. Quantitative analysis of medicines will help guard against
instances of drug toxicity due to higher than expected API or resistance to medication
as a result of lower than expected API (under dosage) as seen with antimalarials and
antibiotics (Kelesidis and Falagas, 2015; Koczwara and Dressman, 2017). It is
therefore very important that measures be put in place (as part of the
pharmacovigilance process) to determine drug content in medicines at every point in
the pharmaceutical distribution chain. In Chapter 3, this study demonstrates the novel
use of ATR-FTIR in the rapid quantification of APIs in tablet dosage forms and its
potential in the screening of medicines in-field and in LMICs. It is therefore important
that the data obtained via the proposed ATR-FTIR method be validated using
conventional approaches or pharmacopoeia approved methods. An assessment of the
correlation between the proposed ATR-FTIR method and conventional methods will
help in providing more comprehensive data about tablet medicines sent for test in order
to confirm if they are genuine.
Ultraviolet-Visible (UV-Vis) spectrophotometry is one of the most commonly used
techniques in pharmaceutical analysis (Behera et al, 2012; Ojeda and Rojas, 2013).
Misiuk (2010), identifies UV-Vis spectrophotometry and the liquid chromatography as
220 | P a g e
the most frequently applied in pharmacopoeial monographs. This technique (UV-Vis),
can be used for the quantification of the Active Pharmaceutical Ingredient (API) in
medicines while screening for FSMs, since the absorbance patterns are indicative of
the materials present and the intensity of the absorbance bands is directly proportional
to the concentration of the API being assessed (Rote et al, 2012; Figueroa et al, 2015).
Several studies have investigated the use of UV-Vis in the quantitative assessment of
medicines (Kumar Talluri et al, 2012; Khanage et al, 2013; Islam et al, 2016). Kumar
Talluri et al (2012) and Khanage et al (2013) considered the simultaneous
determination of paracetamol in the presence of other APIs (Iornoxicam and Eperisone
respectively) in pharmaceutical solid dosage forms. Islam et al (2016), on the other
hand developed UV-Vis methods for the determination of calcium orotate in tablet
dosage forms. UV-Vis has also been used together with chemometric methods in the
quantitative determination of paracetamol in pharmaceutical tablet formulations
(Khajehsharifi et al, 2010; Glavanović et al, 2016).
Although UV-Vis has proven useful in the quantitative assessment of medicines, it is
not as efficient as a qualitative analytical methodology since species are identified
based on absorbance ranges (with maximum absorption- λmax) in the ultraviolet or
visible region rather than a definite wavelength. This is because there could be shifts in
the absorption maxima (characteristic wavelength) of the species being assessed and
this has been linked to the use of different solvents or the ratios of the solvents
employed in the investigation (Figueroa et al, 2015).
Figueroa et al (2015) in their study using UV-Vis to detect counterfeit pharmaceuticals,
also attribute the decrease in the absorption of paracetamol at 245nm and slight
increase in other parts of the spectrum to contaminants which interact with the benzene
ring of paracetamol. Although the use of UV-Vis spectrophotometry for simply
identifying test species (analytes) is a challenge, Figueroa et al (2015) propose the
221 | P a g e
potential use of UV-Vis spectrophotometry in the identification of suspect samples
based on the change in absorbance at particular wavelengths as well as the unique
wavelength shifts observed when different solvents are employed on a particular
analyte.
Although UV-Vis has been used extensively for analysis of medicines, the approach
requires access to solvents and laboratory facilities which for the purpose of this study
are considered beyond the reach of the people in the LMICs. In addition since UV-Vis
is a solvent extraction technique, suggesting it requires a proper understanding of the
analyte in question. This entails training which might be a challenge in areas where
funds are not readily available.
Hence, this chapter describes UV-Vis as a technique used in the validation of
quantitative paracetamol data for tablet samples obtained via ATR-FTIR in Chapter 3.
Since there were challenges quantifying chloroquine based on the proposed ATR-
FTIR, only the paracetamol tablet data were considered for UV-Vis validation.
6.1.1 Ultraviolet-Visible Spectrophotometry Principle
As a quantitative technique, UV-Vis estimates the amount of molecular species based
on the radiation absorbed. UV-Vis use is however limited to the analysis of substances
that can absorb light in the UV-Vis region (200-700nm) (Behera et al, 2012; Rote et al,
2012). As such, UV-Vis spectrophotometry is not useful in the direct determination of
substances with poor light-absorbing capacity (e.g. aminoglycosidic antibiotics) (Ojeda
and Rojas, 2013). The groups within a molecule that are able to absorb light are
referred to as chromophores (Almeling et al, 2012). This technique is cheaper than
other pharmacopoeia approved techniques like the LC-MS but is also a solvent
extraction technique as mentioned earlier. Sample preparataion will therefore involve
222 | P a g e
lengthy processes. Quantitative UV-Vis spectrophotometric analysis of substances is
fundamentally governed by the Beer-Lambert’s law which states that:
When a beam of light is passed through a transparent cell containing a solution of an
absorbing substance, attenuation of the intensity of light may occur (Behera et al,
2012). Beer-Lambert’s law is expressed mathematically as;
A = abc
Where, A= absorbance or optical density, a= absorptivity/ extinction coefficient, b=
radiation path length through sample (cm), c= concentration of solute in solution
a and b are constant hence, A (absorbance) is directly proportional to c
(concentration).
It is also important to note that solutions to be analysed have to be dilute enough as
absorbance values are measured between 0 and 1.
Therefore, to quantify pharmaceutical solid dosage forms using the UV-Vis
spectrophotometer, a solution of the test tablet sample in transparent solvent is
prepared and its absorbance is measured at a suitable wavelength. Normally, the
wavelength of choice is the wavelength of maximum absorption (λmax) where there is
negligible effect on the measured absorbance even in the event of small errors in
setting the wavelength scale (Behera et al, 2012; Figueroa et al, 2015). To assay a
single component sample containing other absorbing substances, the absorbance
values of a range of standard solutions of the reference sample are recorded and used
to produce a calibration curve. The concentration of the analyte in the test solution is
then deduced from the calibration curve as the concentration corresponding to the
measured absorbance of the solution. Figure 5.1 is UV-Vis spectra for paracetamol
showing the λmax.
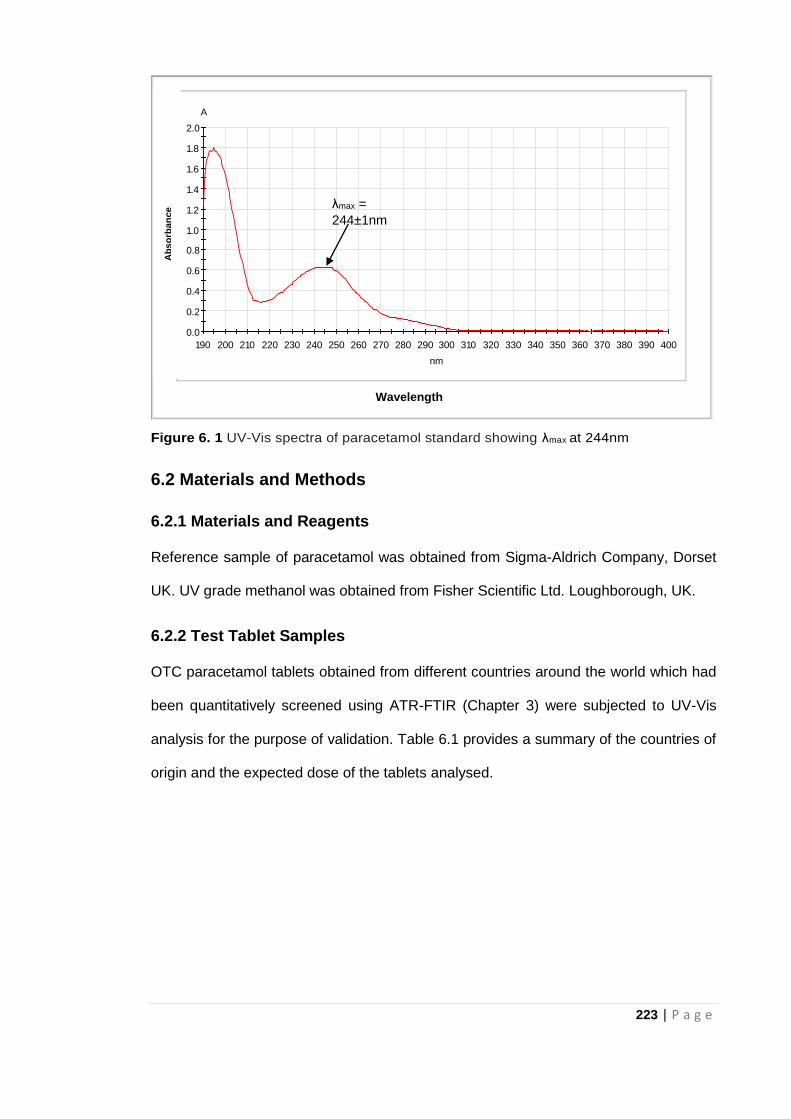
223 | P a g e
Figure 6. 1 UV-Vis spectra of paracetamol standard showing λmax at 244nm
6.2 Materials and Methods
6.2.1 Materials and Reagents
Reference sample of paracetamol was obtained from Sigma-Aldrich Company, Dorset
UK. UV grade methanol was obtained from Fisher Scientific Ltd. Loughborough, UK.
6.2.2 Test Tablet Samples
OTC paracetamol tablets obtained from different countries around the world which had
been quantitatively screened using ATR-FTIR (Chapter 3) were subjected to UV-Vis
analysis for the purpose of validation. Table 6.1 provides a summary of the countries of
origin and the expected dose of the tablets analysed.
0.0
0.2
0.4
0.6
0.8
1.0
1.2
1.4
1.6
1.8
2.0
190 200 210 220 230 240 250 260 270 280 290 300 310 320 330 340 350 360 370 380 390 400
A
nm
10ppm.dsp 10ppm Wavelength
Ab
so
rban
ce
λmax =
244±1nm
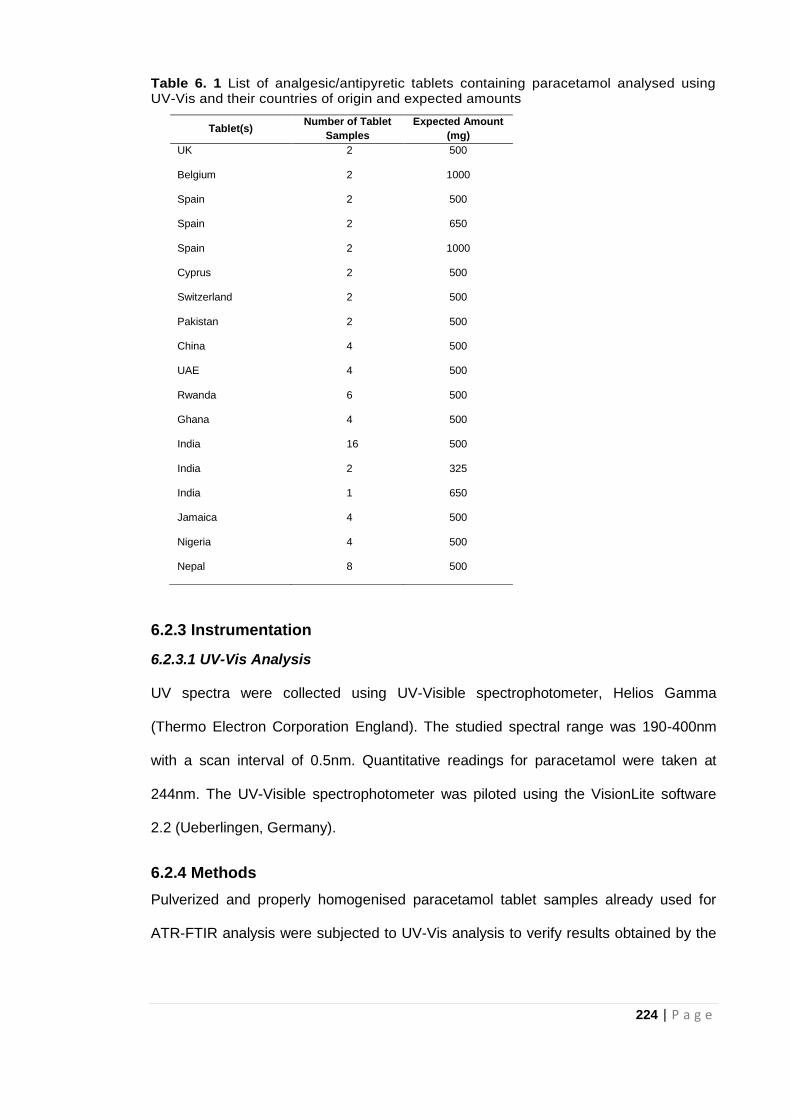
224 | P a g e
Table 6. 1 List of analgesic/antipyretic tablets containing paracetamol analysed using UV-Vis and their countries of origin and expected amounts
6.2.3 Instrumentation
6.2.3.1 UV-Vis Analysis
UV spectra were collected using UV-Visible spectrophotometer, Helios Gamma
(Thermo Electron Corporation England). The studied spectral range was 190-400nm
with a scan interval of 0.5nm. Quantitative readings for paracetamol were taken at
244nm. The UV-Visible spectrophotometer was piloted using the VisionLite software
2.2 (Ueberlingen, Germany).
6.2.4 Methods
Pulverized and properly homogenised paracetamol tablet samples already used for
ATR-FTIR analysis were subjected to UV-Vis analysis to verify results obtained by the
Tablet(s) Number of Tablet
Samples
Expected Amount
(mg)
UK 2 500
Belgium 2 1000
Spain 2 500
Spain 2 650
Spain 2 1000
Cyprus 2 500
Switzerland 2 500
Pakistan 2 500
China 4 500
UAE 4 500
Rwanda 6 500
Ghana 4 500
India 16 500
India 2 325
India 1 650
Jamaica 4 500
Nigeria 4 500
Nepal 8 500
225 | P a g e
ATR-FTIR. The protocol used by Behera et al (2012) was adopted for this part of the
study.
6.2.4.1 Preparation of paracetamol standard solutions for calibration graph
10mg Paracetamol standard was dissolved in 15ml methanol. 85ml double-distilled
water was then added to make up the volume to 100ml (100ppm). From the 100ppm
solution, 2ml was taken and made up to 20ml (10ppm) with diluent. UV grade methanol
and double-distilled water (15:85 v/v) was used as the diluent. Further dilutions of the
10ppm paracetamol standard were made to obtain concentrations between 2ppm and
10pmm (2, 4, 6, 8, and 10ppm) for paracetamol.
6.2.4.2 Test Tablet Sample Preparation for UV analysis
Each tablet was weighed and pulverised. 10mg of the pulverised paracetamol tablet
was weighed and dissolved in 15ml methanol in a 100ml volumetric flask. 85ml double-
distilled water was added to make up the volume to 100ml. The solution was also
filtered using Whatman® filter paper and 2ml was taken out of the filtered solution and
made up to 20ml with diluent in a 20ml volumetric flask (10ppm). Working solutions of
each tablet sample along with the paracetamol standard solutions were then subjected
to UV-Vis analysis.
6.2.4.3 Recording UV-Vis Spectra
All UV spectra were measured in absorbance mode. The solution to be analysed was
placed in a quartz cuvette and scanned across the range 190-400nm in the UV-Vis
spectrophotometer. Each test sample solution was analysed in triplicate to ensure
reproducibility and blanks were run after every sample. The cuvette was cleaned after
each measurement with diluent and dried with paper tissue before placing the next
sample in the cuvette to avoid contamination or sample carry over.
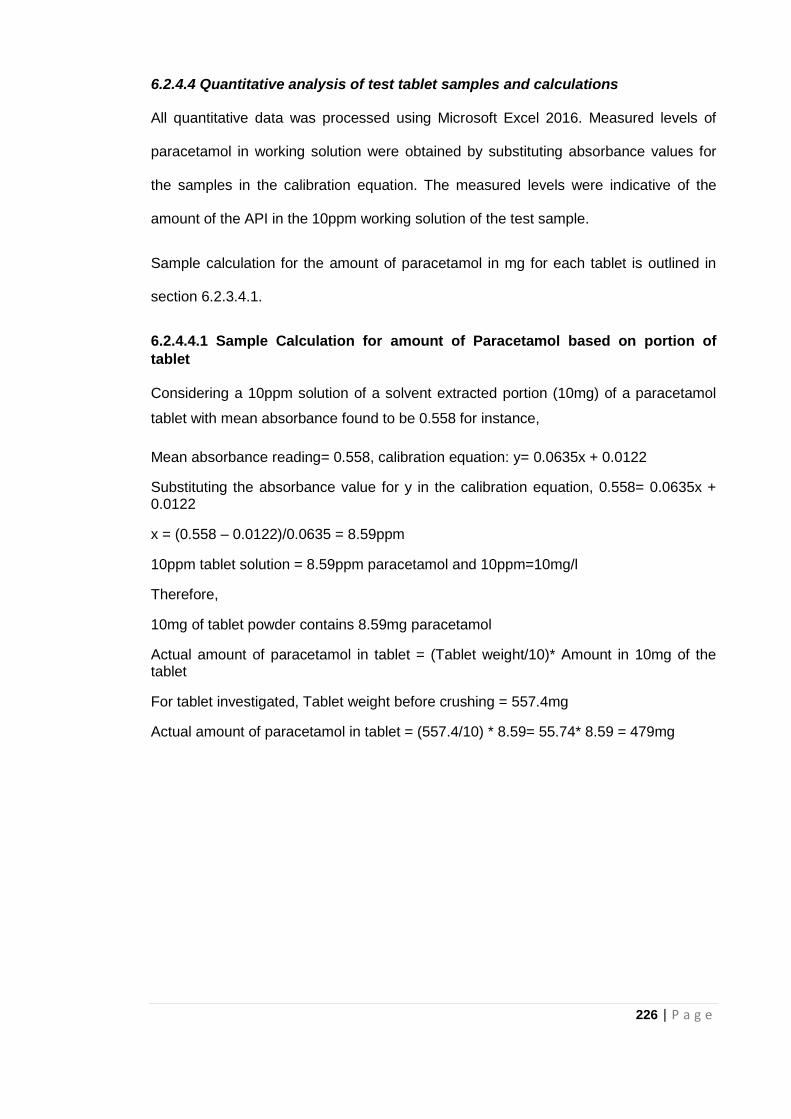
226 | P a g e
6.2.4.4 Quantitative analysis of test tablet samples and calculations
All quantitative data was processed using Microsoft Excel 2016. Measured levels of
paracetamol in working solution were obtained by substituting absorbance values for
the samples in the calibration equation. The measured levels were indicative of the
amount of the API in the 10ppm working solution of the test sample.
Sample calculation for the amount of paracetamol in mg for each tablet is outlined in
section 6.2.3.4.1.
6.2.4.4.1 Sample Calculation for amount of Paracetamol based on portion of
tablet
Considering a 10ppm solution of a solvent extracted portion (10mg) of a paracetamol
tablet with mean absorbance found to be 0.558 for instance,
Mean absorbance reading= 0.558, calibration equation: y= 0.0635x + 0.0122
Substituting the absorbance value for y in the calibration equation, 0.558= 0.0635x + 0.0122
x = (0.558 – 0.0122)/0.0635 = 8.59ppm
10ppm tablet solution = 8.59ppm paracetamol and 10ppm=10mg/l
Therefore,
10mg of tablet powder contains 8.59mg paracetamol
Actual amount of paracetamol in tablet = (Tablet weight/10)* Amount in 10mg of the tablet
For tablet investigated, Tablet weight before crushing = 557.4mg
Actual amount of paracetamol in tablet = (557.4/10) * 8.59= 55.74* 8.59 = 479mg
227 | P a g e
6.2.4.5 Validation of method
The adopted method for paracetamol was validated in terms of linearity, limit of
detection (LOD), limit of quantification (LOQ), accuracy and precision.
6.2.4.5.1 Linearity
Linearity was assessed based on the correlation coefficient (R2 - value) of the
calibration curve for the mean absorbance versus the paracetamol standard
concentrations. LOD and LOQ were determined based on the 3.3 σ/s and 10 σ/s
criteria, respectively; where σ refers to the standard deviation of peak area and ‘s’ is
the slope of the calibration curve. Paracetamol showed good linearity for the
concentration range assessed
6.2.4.5.2 Accuracy
To check accuracy of the method, an incurred sample analysis was employed in
assessing recovery for paracetamol standards based on the calibration curve.
Absorbance values, for test samples, were substituted into the calibration curve
equation to obtain measured concentrations of paracetamol standards and these were
compared to expected concentrations of the paracetamol standards.
6.2.4.5.3 Precision
Precision of the method was based on repeatability and variation in terms of the level
of the expected API shown by the relative standard deviation (%RSD).
6.3 Results and Discussion
6.3.1 UV Spectra
Maximum absorbance was at 244nm±1 which was in agreement with Behera et al
(2012) and Nnadi et al (2013) suggesting the presence of paracetamol in the samples
analysed.
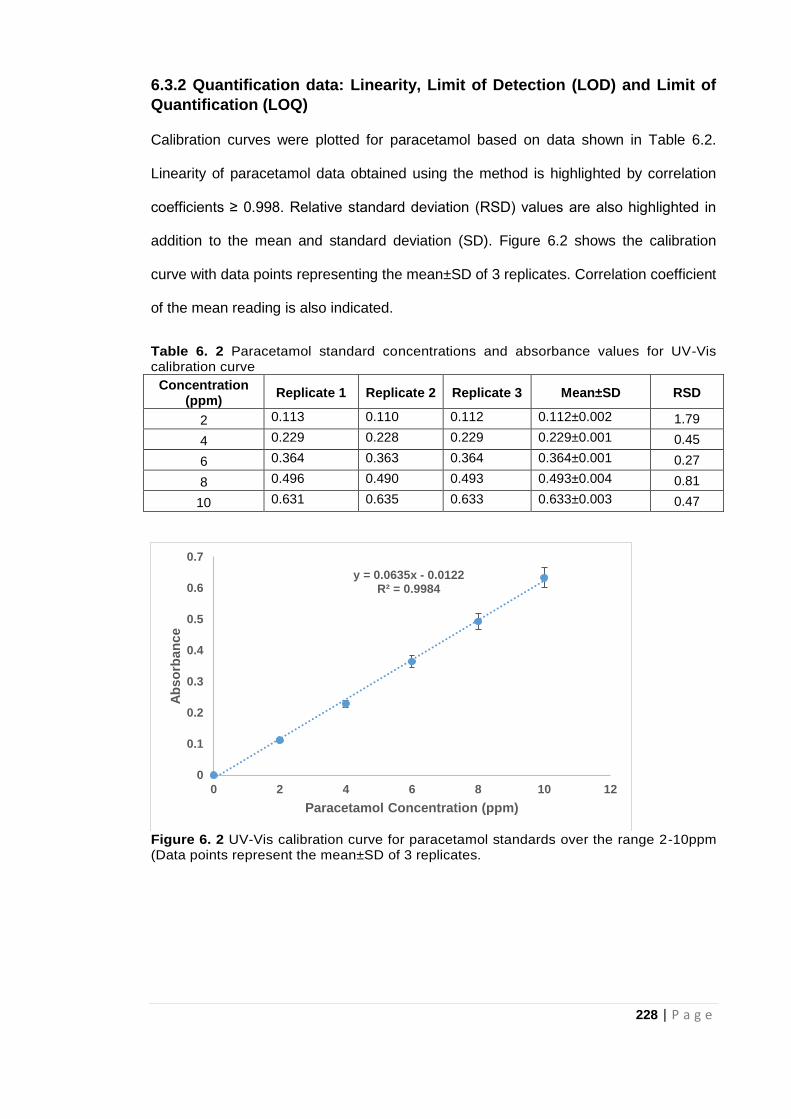
228 | P a g e
6.3.2 Quantification data: Linearity, Limit of Detection (LOD) and Limit of
Quantification (LOQ)
Calibration curves were plotted for paracetamol based on data shown in Table 6.2.
Linearity of paracetamol data obtained using the method is highlighted by correlation
coefficients ≥ 0.998. Relative standard deviation (RSD) values are also highlighted in
addition to the mean and standard deviation (SD). Figure 6.2 shows the calibration
curve with data points representing the mean±SD of 3 replicates. Correlation coefficient
of the mean reading is also indicated.
Table 6. 2 Paracetamol standard concentrations and absorbance values for UV-Vis calibration curve
Concentration (ppm)
Replicate 1 Replicate 2 Replicate 3 Mean±SD RSD
2 0.113 0.110 0.112 0.112±0.002 1.79
4 0.229 0.228 0.229 0.229±0.001 0.45
6 0.364 0.363 0.364 0.364±0.001 0.27
8 0.496 0.490 0.493 0.493±0.004 0.81
10 0.631 0.635 0.633 0.633±0.003 0.47
Figure 6. 2 UV-Vis calibration curve for paracetamol standards over the range 2-10ppm (Data points represent the mean±SD of 3 replicates.
y = 0.0635x - 0.0122R² = 0.9984
0
0.1
0.2
0.3
0.4
0.5
0.6
0.7
0 2 4 6 8 10 12
Ab
so
rban
ce
Paracetamol Concentration (ppm)
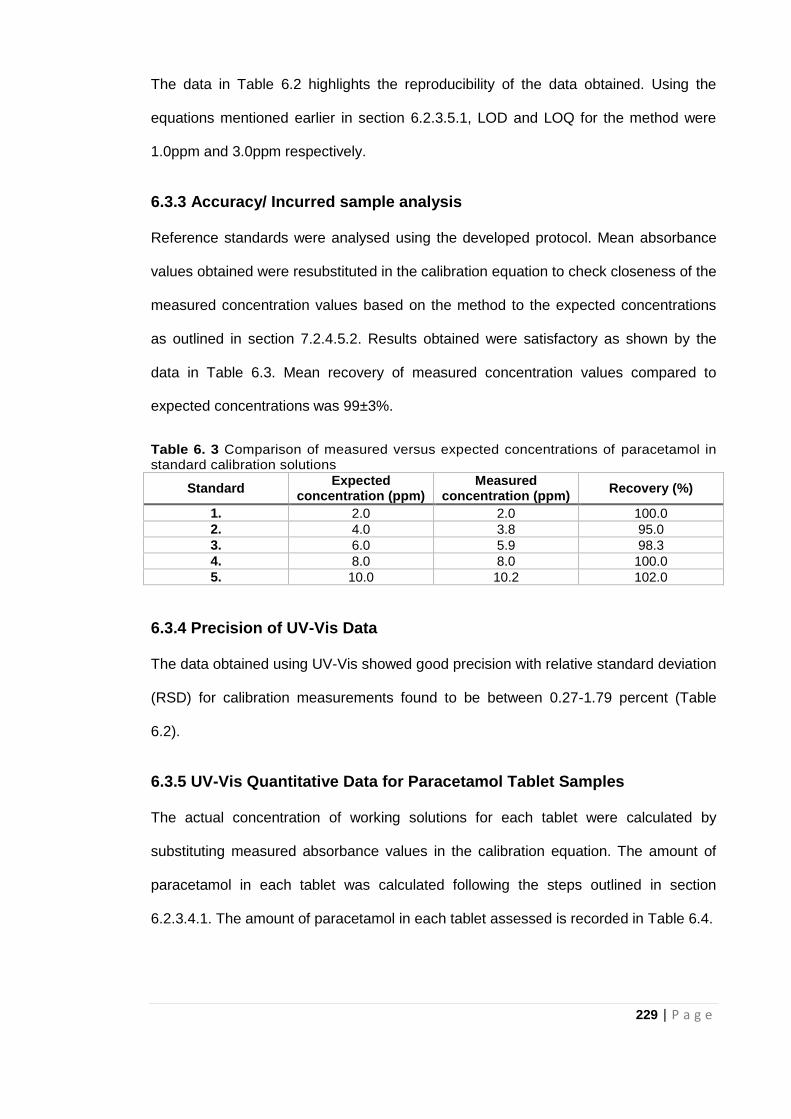
229 | P a g e
The data in Table 6.2 highlights the reproducibility of the data obtained. Using the
equations mentioned earlier in section 6.2.3.5.1, LOD and LOQ for the method were
1.0ppm and 3.0ppm respectively.
6.3.3 Accuracy/ Incurred sample analysis
Reference standards were analysed using the developed protocol. Mean absorbance
values obtained were resubstituted in the calibration equation to check closeness of the
measured concentration values based on the method to the expected concentrations
as outlined in section 7.2.4.5.2. Results obtained were satisfactory as shown by the
data in Table 6.3. Mean recovery of measured concentration values compared to
expected concentrations was 99±3%.
Table 6. 3 Comparison of measured versus expected concentrations of paracetamol in standard calibration solutions
Standard Expected
concentration (ppm) Measured
concentration (ppm) Recovery (%)
1. 2.0 2.0 100.0
2. 4.0 3.8 95.0
3. 6.0 5.9 98.3
4. 8.0 8.0 100.0
5. 10.0 10.2 102.0
6.3.4 Precision of UV-Vis Data
The data obtained using UV-Vis showed good precision with relative standard deviation
(RSD) for calibration measurements found to be between 0.27-1.79 percent (Table
6.2).
6.3.5 UV-Vis Quantitative Data for Paracetamol Tablet Samples
The actual concentration of working solutions for each tablet were calculated by
substituting measured absorbance values in the calibration equation. The amount of
paracetamol in each tablet was calculated following the steps outlined in section
6.2.3.4.1. The amount of paracetamol in each tablet assessed is recorded in Table 6.4.
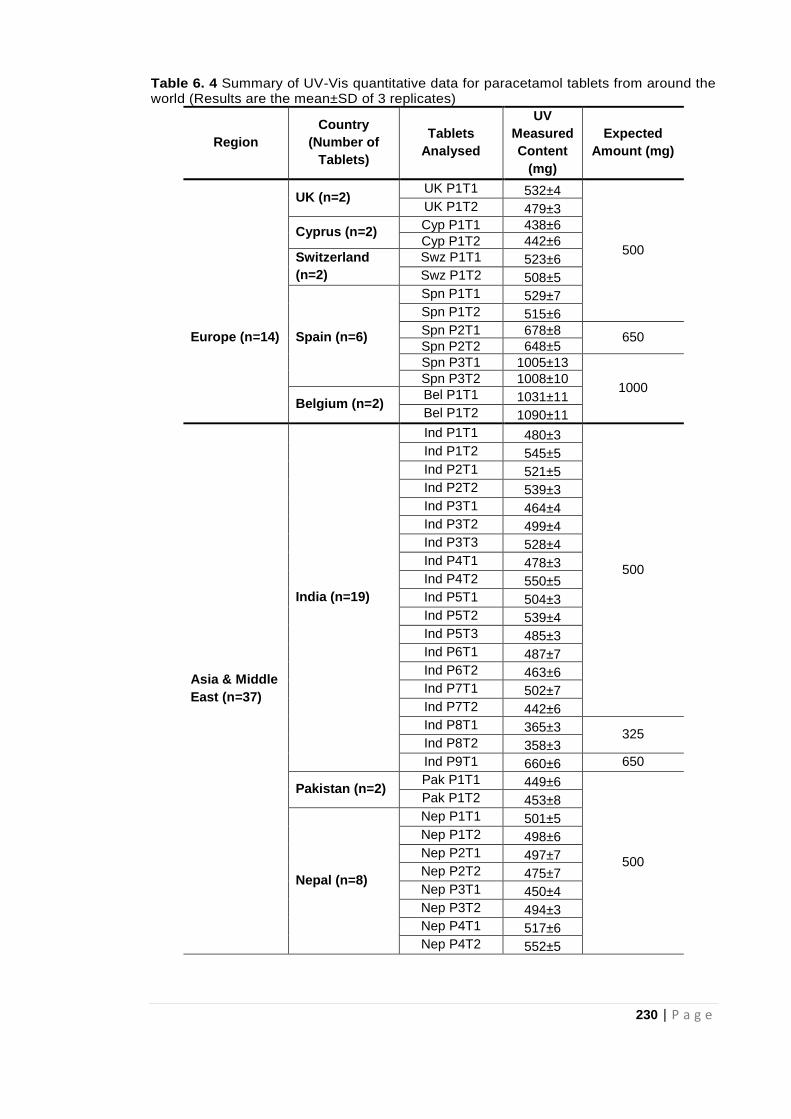
230 | P a g e
Table 6. 4 Summary of UV-Vis quantitative data for paracetamol tablets from around the world (Results are the mean±SD of 3 replicates)
Region
Country
(Number of
Tablets)
Tablets
Analysed
UV
Measured
Content
(mg)
Expected
Amount (mg)
UK (n=2) UK P1T1 532±4
500
UK P1T2 479±3
Cyprus (n=2) Cyp P1T1 438±6
Cyp P1T2 442±6
Switzerland
(n=2)
Swz P1T1 523±6
Swz P1T2 508±5
Spn P1T1 529±7
Spn P1T2 515±6
Europe (n=14) Spain (n=6) Spn P2T1 678±8
650 Spn P2T2 648±5
Spn P3T1 1005±13
1000 Spn P3T2 1008±10
Belgium (n=2) Bel P1T1 1031±11
Bel P1T2 1090±11
Asia & Middle
East (n=37)
India (n=19)
Ind P1T1 480±3
500
Ind P1T2 545±5
Ind P2T1 521±5
Ind P2T2 539±3
Ind P3T1 464±4
Ind P3T2 499±4
Ind P3T3 528±4
Ind P4T1 478±3
Ind P4T2 550±5
Ind P5T1 504±3
Ind P5T2 539±4
Ind P5T3 485±3
Ind P6T1 487±7
Ind P6T2 463±6
Ind P7T1 502±7
Ind P7T2 442±6
Ind P8T1 365±3 325
Ind P8T2 358±3
Ind P9T1 660±6 650
Pakistan (n=2) Pak P1T1 449±6
500
Pak P1T2 453±8
Nepal (n=8)
Nep P1T1 501±5
Nep P1T2 498±6
Nep P2T1 497±7
Nep P2T2 475±7
Nep P3T1 450±4
Nep P3T2 494±3
Nep P4T1 517±6
Nep P4T2 552±5
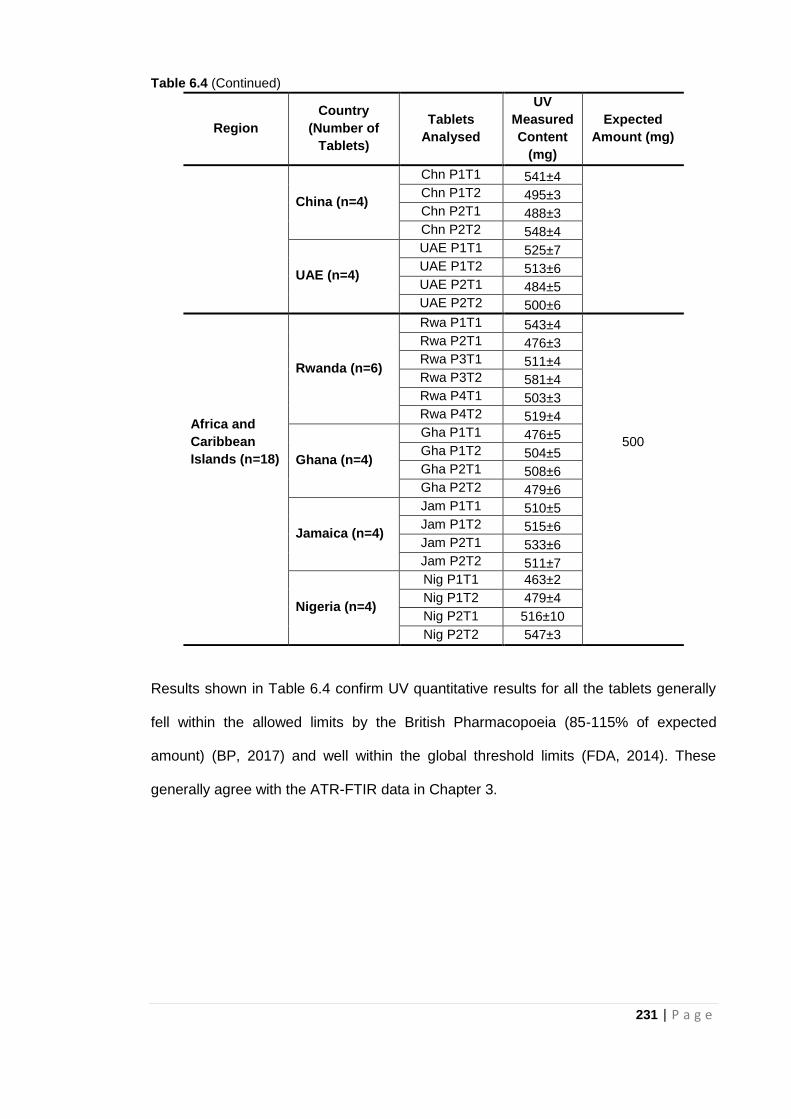
231 | P a g e
Table 6.4 (Continued)
Region
Country
(Number of
Tablets)
Tablets
Analysed
UV
Measured
Content
(mg)
Expected
Amount (mg)
China (n=4)
Chn P1T1 541±4
Chn P1T2 495±3
Chn P2T1 488±3
Chn P2T2 548±4
UAE (n=4)
UAE P1T1 525±7
UAE P1T2 513±6
UAE P2T1 484±5
UAE P2T2 500±6
Africa and
Caribbean
Islands (n=18)
Rwanda (n=6)
Rwa P1T1 543±4
500
Rwa P2T1 476±3
Rwa P3T1 511±4
Rwa P3T2 581±4
Rwa P4T1 503±3
Rwa P4T2 519±4
Ghana (n=4)
Gha P1T1 476±5
Gha P1T2 504±5
Gha P2T1 508±6
Gha P2T2 479±6
Jamaica (n=4)
Jam P1T1 510±5
Jam P1T2 515±6
Jam P2T1 533±6
Jam P2T2 511±7
Nigeria (n=4)
Nig P1T1 463±2
Nig P1T2 479±4
Nig P2T1 516±10
Nig P2T2 547±3
Results shown in Table 6.4 confirm UV quantitative results for all the tablets generally
fell within the allowed limits by the British Pharmacopoeia (85-115% of expected
amount) (BP, 2017) and well within the global threshold limits (FDA, 2014). These
generally agree with the ATR-FTIR data in Chapter 3.
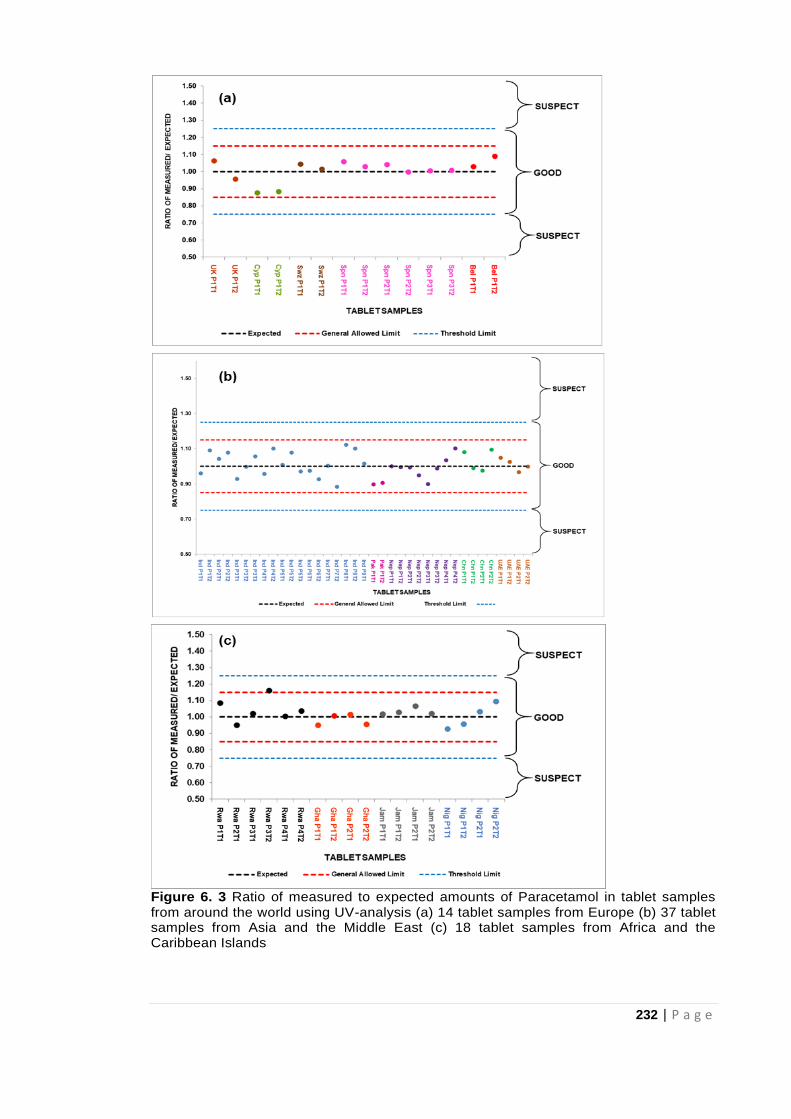
232 | P a g e
Figure 6. 3 Ratio of measured to expected amounts of Paracetamol in tablet samples from around the world using UV-analysis (a) 14 tablet samples from Europe (b) 37 tablet samples from Asia and the Middle East (c) 18 tablet samples from Africa and the Caribbean Islands
233 | P a g e
Just like with the ATR-FTIR data, the UV-Vis data is presented as a plot of the ratio of
measured to expected amounts of paracetamol versus the tablet sample origin in Fig
6.3(a-c). The diagrams showing paracetamol data from three regions (Europe; Asia
and the Middle East; Africa and the Caribbean Islands) clearly indicates that all
samples generally fall within the accepted limits as observed in Table 6.4. However,
some significant differences were noted. High values were obtained for some tablets
from Cyprus (Cyp P1T1, Cyp P1T2) and India (Ind P8T1, Ind P8T2) using ATR-FTIR
when compared to UV-Vis data for the same tablets. On the other hand, low
paracetamol levels were obtained from both ATR-FTIR and UV-Vis analysis for tablets
from Pakistan (Pak P1T1, Pak P1T2). Results based on probe mass spectrometry in
Chapter 4 identified a second API (aceclofenac) in addition to the paracetamol in the
Ind P8 tablets. Therefore, lower paracetamol values with UV-Vis further suggests that
although paracetamol is present in these tablets (Ind P8) as identified by the ATR-FTIR
technique, the second API could be the reason for higher paracetamol values in the
region of the ATR-FTIR spectra assessed. A detailed comparison of the techniques
employed in the study and possible reasons for variation in the data are discussed in
Chapter 8. In addition, the significance of the proposed rapid analytical methods in the
screening process for FSMs (especially in LMICs) is highlighted.
General agreement between ATR-FTIR further highlights the potential of ATR-FTIR in
the screening of medicines.
234 | P a g e
6.4 Conclusion
The quantitative determination of paracetamol in pharmaceutical tablet formulations
using UV-Vis spectrophotometry as outlined in this chapter produced some findings
worthy of note. UV-Vis results obtained for paracetamol test tablets confirmed the
presence of paracetamol in all the tablets analysed via ATR-FTIR in Chapter 3 further
validating the data obtained. UV-Vis spectrophotometry involves a lengthy (solvent
extraction) sample preparation process and would require adequate training of the
technician handling the equipment. Training of the technician or operator is also
important because sample specific method development (involving solvent extraction of
the analyte) is required in order to obtain reproducible data and this has to be done
manually.
With UV-Vis data indicating paracetamol levels for all the tablet samples assessed fell
within acceptable limits (and mostly in agreement with ATR-FTIR), it was therefore
important to reassess tablets samples where significant differences were observed
between the two techniques. Further tests will provide understanding on the reason for
the variance in data for the identified tablets. Therefore, investigations based on liquid
chromatography, identified as the pharmacopoeia gold standard was necessary. The
tablet samples with inconclusive paracetamol data based on UV-Vis and ATR-FTIR
formed the basis for liquid chromatography-mass spectrometry described in Chapter 7.
235 | P a g e
6.5 References
Almeling, S., Ilko, D. and Holzgrabe, U. (2012) Charged aerosol detection in
pharmaceutical analysis. Journal of Pharmaceutical and Biomedical Analysis, 69: 50-
63.
Behera, S., Ghanty, S., Ahmad, F., Santra, S. and Banerjee, S. (2012) UV-visible
spectrophotometric method development and validation of assay of paracetamol tablet
formulation. Journal of Analytical and Bioanalytical Techniques, 3(6): 2-6.
British Pharmacopoeia Commission. British Pharmacopoeia 2017. [BP online]. London:
TSO. Available at: https://www.pharmacopoeia.com/bp-2018/appendices/appendix-
12/appendix-xii-c--consistency-of-formulated-preparations.html?published-date=2017-
08-01#p2p05333 (accessed 28.10.17).
Davison, M. (2011) Pharmaceutical anti-counterfeiting: combating the real danger from
fake drugs. New Jersey: John Wiley & Sons.
Dégardin, K. Roggo Y. and Margot, P. (2014) Understanding and fighting the medicine
counterfeit market. Journal of Pharmaceutical and Biomedical Analysis, 87: 167-175.
Dégardin, K. Roggo, Y. and Margot, P. (2015) Forensic intelligence for medicine anti-
counterfeiting. Forensic Science International, 248: 15-32.
Figueroa, G., Palacio, L.A., Ray, B.D., Petrache, H.I. and Lopez-Yunez, A. (2015)
Detecting Counterfeit Pharmaceuticals through UV Spectrophotometry. Biophysical
Journal, 108(2): 622a.
Food and Drug Administration- FDA (2014) Q4B: Annex 6: Uniformity of Dosage Units
General Chapter. Available at
https://www.fda.gov/downloads/Drugs/GuidanceComplianceRegulatoryInformation/Gui
dances/UCM085364.pdf (accessed 01.11.17).
Glavanović, S., Glavanović, M. and Tomišić, V. (2016) Simultaneous quantitative
determination of paracetamol and tramadol in tablet formulation using UV
spectrophotometry and chemometric methods. Spectrochimica Acta Part A, 157: 258-
264.
Islam, M.S., Hossain, M.T., Kundu, S.K., Akter, M. and Rafiquzzaman, M. (2016)
Development and validation of UV spectroscopic method for determination of calcium
orotate in bulk and tablet dosage form. European Journal of Pharmaceutical and
Medical Research, 3(5): 165-170.
Kelesidis, T. and Falagas, M.E. (2015) Substandard/counterfeit antimicrobial drugs.
Clinical Microbiology Reviews, 28(2): 443-464.
Khajehsharifi, H., Eskandari, Z. and Asadipour, A. (2010) Application of some
chemometric methods in conventional and derivative spectrophotometric analysis of
acetaminophen and ascorbic acid. Drug Testing and Analysis, 2(4):162-167.
236 | P a g e
Khanage, S.G., Mohite, P.B. and Jadhav, S. (2013) Development and validation of UV-
visible spectrophotometric method for simultaneous determination of eperisone and
paracetamol in solid dosage form. Advanced Pharmaceutical Bulletin, 3(2): 447.
Koczwara, A. and Dressman, J. (2017) Poor-Quality and Counterfeit Drugs: A
Systematic Assessment of Prevalence and Risks Based on Data Published From 2007
to 2016. Journal of Pharmaceutical Sciences, 106(10): 2921-2929.
Kovacs, S., Hawes, S.E., Maley, S. N., Mosites, E., Wong L. and Stergachis, A. (2014)
Technologies for detecting falsified and substandard drugs in low and middle-income
countries, PloS One, 9: e90601.
Kumar Talluri, M.V.N., Bairwa, M.K., Theja Dugga, H.H. and Srinivas, R. (2012)
Development and validation of RP-HPLC and ultraviolet spectrophotometric methods of
analysis for simultaneous determination of paracetamol and lornoxicam in
pharmaceutical dosage forms. Journal of Liquid Chromatography and Related
Technologies, 35(1):129-140.
Misiuk, W. (2010) The role of assay methods in characterizing the quality of bulk
pharmaceuticals. Journal of Pharmacy and Bioallied Science, 2(2): 88.
Nnadi, C.O., Agbo, M.O., Uzor, P.F. and Ugwu, L.O. (2013) Development of Differential
Spectrophotometric Method for Assay of Paracetamol in Pure and Tablet Dosage
Forms. Indian Journal of Pharmacy Research, 1(1): 15-21.
Ojeda, C.B. and Rojas, F.S. (2013) Recent applications in derivative ultraviolet/visible
absorption spectrophotometry: 2009–2011: a review. Microchemical Journal, 106: 1-16.
Rote, A.R., Kumbhoje, P.A. and Bhambar, R.S. (2012) UV-visible spectrophotometric
simultaneous estimation of paracetamol and nabumetone by AUC method in combined
tablet dosage form. Pharmaceutical Methods, 3(1): 40-43.
237 | P a g e
CHAPTER SEVEN
Confirmatory testing for
pharmaceutical ingredient in
tablet dosage forms by liquid
chromatography- mass
spectrometry
238 | P a g e
7.1 Introduction
As established in previous chapters, the intent of falsifiers of medicine is to deceive and
anonymity allows falsifiers of medicines to thrive. As a result, the differences between
FSMs and genuine medicines need to be subtle to avoid being detected.
Comprehensive data is therefore needed in order to discriminate a falsified or
substandard medicine from a genuine one (Dégardin et al, 2015). It is difficult to find
one technique that provides all the necessary information when screening for FSMs. As
observed with the techniques employed in Chapters three to six, each technique
provides unique and valuable information about the medicines being analysed. A good
understanding of what information is needed at each stage of the screening process
will then inform the approach to be taken (Dégardin et al, 2014). Just as speed of
analysis is crucial in the forensic analysis of FSMs, sensitivity cannot be overlooked
especially if this information is to form the basis for criminal investigations. It is
important that cases of false positive or negative results are ruled out. This is to avoid a
situation where either genuine medicines are identified as falsified thereby denying the
patients access to these medicines or falsified medicines are identified as genuine
posing a threat to public health. Validation of data obtained during preliminary
analytical screening of medicines is therefore necessary in order to make conclusive
statements about the genuineness of medicines. Identification of an FSM is usually a
two stage process where rapid screening tests are used on site followed by
confirmatory tests using more sophisticated laboratory based equipment such as the
liquid chromatography mass spectrometer combination (LC-MS).
Liquid chromatography is one of those techniques identified as a gold standard for the
analysis of medicines (Kovacs et al, 2014; Zou et al, 2017; Montaseri and Forbes,
2018) as explained in detail in chapter two. Prior to LC analysis solvent extraction of
medicines from the tablet is required and so sampling time is much longer than with
239 | P a g e
simpler techniques such as the spectroscopic techniques (in chapters three and four)
and probe mass spectrometry (chapter five). However, LC can also be combined with
mass spectrometers to provide more information about the medicine in one study.
Liquid chromatography- mass spectrometry (LC-MS) combines the separation
capabilities of liquid chromatography with the mass detection capabilities of mass
spectrometry. Consequently, several studies have used (LC-MS) in the analysis of
medicines (Lohmann and Karst, 2006; Van Quekelberghe et al, 2008; Lou et al, 2010).
Fenk et al (2010) employed LC-MS in the quantitative analysis of paracetamol,
acetylsalicylic acid and caffeine. Fiori and Andrisano (2014) developed LC-MS
methods for quantifying six glucocorticoids in pharmaceutical formulations.
The aim of this study was to further validate data for the API (paracetamol) obtained via
ATR-FTIR spectroscopy in addition to the UV-Vis data presented in the previous
chapter. LC-MS is therefore proposed as a second check or second line validation
especially where there is variation in results between initial simple authentication
techniques and the first confirmatory techniques used (UV-Vis spectroscopy).
Beyond the validation of ATR-FTIR data for paracetamol, LC-MS results will also allow
a comparison of the performance of both the UV-Vis and LC-MS quantitative
techniques approved by the British Pharmacopoeia. Details of the performance of
different techniques forms the basis for the next Chapter. An assessment of the data
provided by different techniques will provide information on the choice of analytical
technique to be used during different stages of screening for falsified and substandard
medicines.
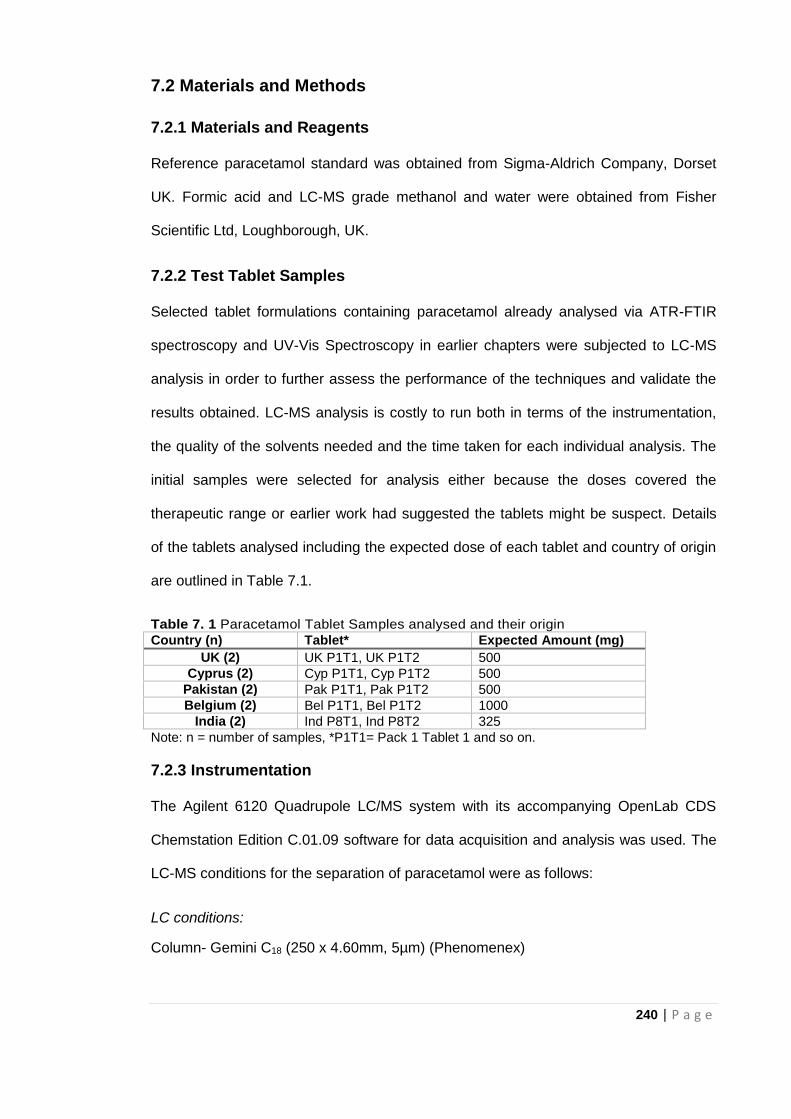
240 | P a g e
7.2 Materials and Methods
7.2.1 Materials and Reagents
Reference paracetamol standard was obtained from Sigma-Aldrich Company, Dorset
UK. Formic acid and LC-MS grade methanol and water were obtained from Fisher
Scientific Ltd, Loughborough, UK.
7.2.2 Test Tablet Samples
Selected tablet formulations containing paracetamol already analysed via ATR-FTIR
spectroscopy and UV-Vis Spectroscopy in earlier chapters were subjected to LC-MS
analysis in order to further assess the performance of the techniques and validate the
results obtained. LC-MS analysis is costly to run both in terms of the instrumentation,
the quality of the solvents needed and the time taken for each individual analysis. The
initial samples were selected for analysis either because the doses covered the
therapeutic range or earlier work had suggested the tablets might be suspect. Details
of the tablets analysed including the expected dose of each tablet and country of origin
are outlined in Table 7.1.
Table 7. 1 Paracetamol Tablet Samples analysed and their origin
Country (n) Tablet* Expected Amount (mg)
UK (2) UK P1T1, UK P1T2 500
Cyprus (2) Cyp P1T1, Cyp P1T2 500
Pakistan (2) Pak P1T1, Pak P1T2 500
Belgium (2) Bel P1T1, Bel P1T2 1000
India (2) Ind P8T1, Ind P8T2 325
Note: n = number of samples, *P1T1= Pack 1 Tablet 1 and so on.
7.2.3 Instrumentation
The Agilent 6120 Quadrupole LC/MS system with its accompanying OpenLab CDS
Chemstation Edition C.01.09 software for data acquisition and analysis was used. The
LC-MS conditions for the separation of paracetamol were as follows:
LC conditions:
Column- Gemini C18 (250 x 4.60mm, 5µm) (Phenomenex)
241 | P a g e
Mobile Phase: (A) 0.1% formic acid in water (B) 0.1% formic acid in Methanol;
A:B = 60:40
Flow rate: 0.7ml/min
Run time: 10mins
Sample injection volume: 20µl
MS conditions:
Ionisation: Atmospheric Pressure Ionisation- Electrospray (API-ES) positive ion mode
m/z range: 100-350
Fragmentor: 100V
Drying gas flow: 11l/min
Nebulizer pressure: 60psig
Drying gas temperature: 310°C
The Agilent 6120 Quadrupole LC/MS system comes with an autosampler that permits
the instrument to be set to run multiple injections of all the standard solutions and the
test samples in one go with experimental data collected and processed when all
analysis is completed. For this analysis, the instrument was programmed to run three
injections per sample with a blank run at the start and after each sample. No carry over
was observed from one sample to the next.
7.2.4 Methods
As mentioned earlier in the review chapter (Chapter 2), liquid chromatography (LC) is
one of the pharmacopoeial gold standards for analysis of medicines. Consequently,
already established LC methods for quantifying medicines were adopted and modified
for this validation study (Attimarad, 2011; Chandra et al, 2012; Akgeyik et al, 2016).
7.2.4.1 Preparation of Test Tablet Samples for LC-MS analysis
To determine the paracetamol content of the test tablet samples, an amount of powder
for each tablet (already crushed and used for ATR-FTIR and UV-Vis analysis)
242 | P a g e
equivalent to 15.1 mg of paracetamol, based on the stated dose, was accurately
weighed out and dissolved in 100ml of diluent in a 100ml volumetric flask. LC-MS
grade methanol and water (40:60 v/v) was used as the solvent. The solution was
sonicated for 30 minutes to make sure paracetamol in the tablet powder had dissolved
completely. Filtration was done with 0.45µm nylon syringe filters and the filtered
solution was further diluted to obtain working solutions of 50µM paracetamol for each
tablet. These working solutions for each tablet were then subjected to LC-MS analysis
along with calibration standard solutions using parameters mentioned earlier in section
7.2.3.
7.2.4.2 Preparation of paracetamol standard solutions and calibration graphs
A stock solution was prepared by dissolving 15.1mg of paracetamol reference standard
in 40ml methanol in a 100ml volumetric flask. This was shaken properly and made up
to the mark with water to obtain a 1mM solution of paracetamol. The solution was then
filtered with a 0.45µm nylon syringe filter. Serial dilutions of the 1mM stock solution
were made to obtain concentrations in the range of 5-80µM (5, 7.5, 10, 25, 50, 60, 75
and 80 µM) for paracetamol.
7.2.4.3 Chromatograms and Mass spectra- Qualitative analyses
All chromatograms and spectral data were collected for each sample in positive
ionisation mode using parameters as outlined in the instrumentation section.
Characteristic paracetamol peak was present and reproducibility of data in terms of
retention time of paracetamol was assessed. Data was collected in both scan mode
and single ion monitoring (SIM) mode for the protonated molecular ion [MH]+ of
paracetamol at m/z 152. In scan mode, characteristic ions for paracetamol were
identified from the mass spectra recorded.
243 | P a g e
7.2.4.4 Quantitative analysis of test tablet samples and calculations
All quantitative data was processed using Microsoft Excel 2016. Measured levels of
paracetamol in working solution were obtained by substituting peak area values for the
samples in the calibration equation. The measured levels were indicative of the amount
of the API in 50µM working solution of the test sample. Since working solution was a
20 fold dilution of the 1mM stock, actual concentration of paracetamol in stock was 20
times the amount in the 50µM solution. Test tablet sample equivalent of 15.1mg was
dissolved to obtain 1mM (1000µM) stock solution. Therefore,
If 15.1mg …………. 1000µM
Amount of API dissolved (mg) = (15.1 x Measured concentration (µM) x 20) /1000
Consequently,
Actual dosage of API in tablet (mg) = (W/AT) x AP
Where W = Total weight of the tablet; AT = Amount of tablet powder dissolved in
solvent and AP = Amount of API in tablet powder dissolved (mg).
7.2.4.5 Validation of method
The adopted method was validated in terms of linearity, limit of detection (LOD), limit of
quantification (LOQ), accuracy and precision.
7.2.4.5.1 Linearity
Linearity was assessed based on the correlation coefficient (R2 - value) of the
calibration curve for the mean peak area versus the paracetamol standard
concentrations. LOD and LOQ were determined based on the 3.3 σ/s and 10 σ/s
criteria, respectively; where σ refers to the standard deviation of peak area and ‘s’ is
the slope of the calibration curve. Paracetamol was found to obey Beer Lambert’s law
for these concentrations as it showed good linearity.
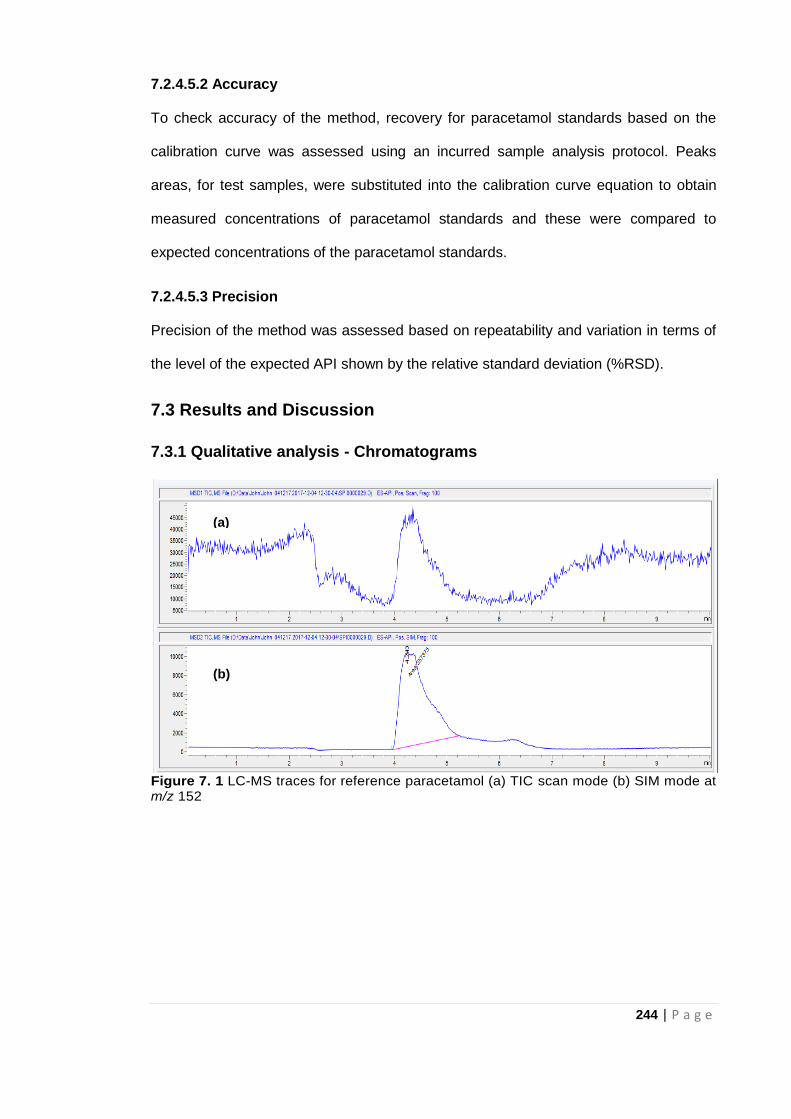
244 | P a g e
7.2.4.5.2 Accuracy
To check accuracy of the method, recovery for paracetamol standards based on the
calibration curve was assessed using an incurred sample analysis protocol. Peaks
areas, for test samples, were substituted into the calibration curve equation to obtain
measured concentrations of paracetamol standards and these were compared to
expected concentrations of the paracetamol standards.
7.2.4.5.3 Precision
Precision of the method was assessed based on repeatability and variation in terms of
the level of the expected API shown by the relative standard deviation (%RSD).
7.3 Results and Discussion
7.3.1 Qualitative analysis - Chromatograms
Figure 7. 1 LC-MS traces for reference paracetamol (a) TIC scan mode (b) SIM mode at m/z 152
(a)
(b)
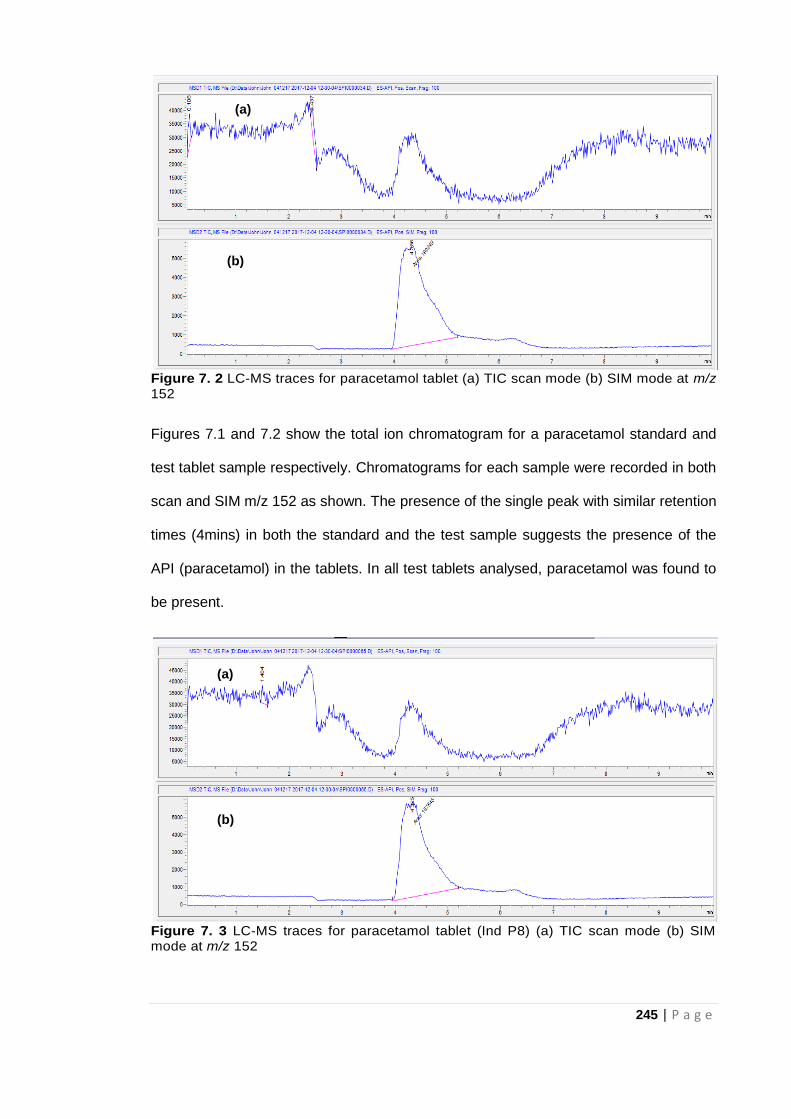
245 | P a g e
Figure 7. 2 LC-MS traces for paracetamol tablet (a) TIC scan mode (b) SIM mode at m/z 152
Figures 7.1 and 7.2 show the total ion chromatogram for a paracetamol standard and
test tablet sample respectively. Chromatograms for each sample were recorded in both
scan and SIM m/z 152 as shown. The presence of the single peak with similar retention
times (4mins) in both the standard and the test sample suggests the presence of the
API (paracetamol) in the tablets. In all test tablets analysed, paracetamol was found to
be present.
Figure 7. 3 LC-MS traces for paracetamol tablet (Ind P8) (a) TIC scan mode (b) SIM mode at m/z 152
(a)
(b)
(a)
(b)
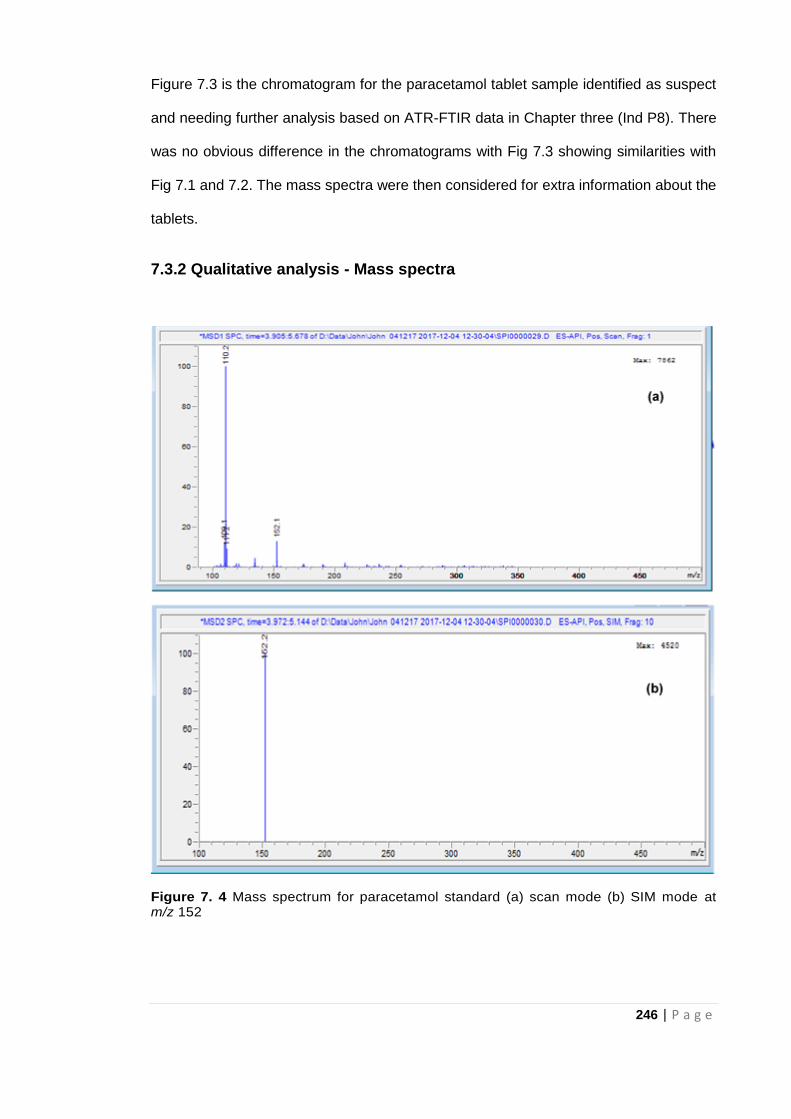
246 | P a g e
Figure 7.3 is the chromatogram for the paracetamol tablet sample identified as suspect
and needing further analysis based on ATR-FTIR data in Chapter three (Ind P8). There
was no obvious difference in the chromatograms with Fig 7.3 showing similarities with
Fig 7.1 and 7.2. The mass spectra were then considered for extra information about the
tablets.
7.3.2 Qualitative analysis - Mass spectra
Figure 7. 4 Mass spectrum for paracetamol standard (a) scan mode (b) SIM mode at m/z 152
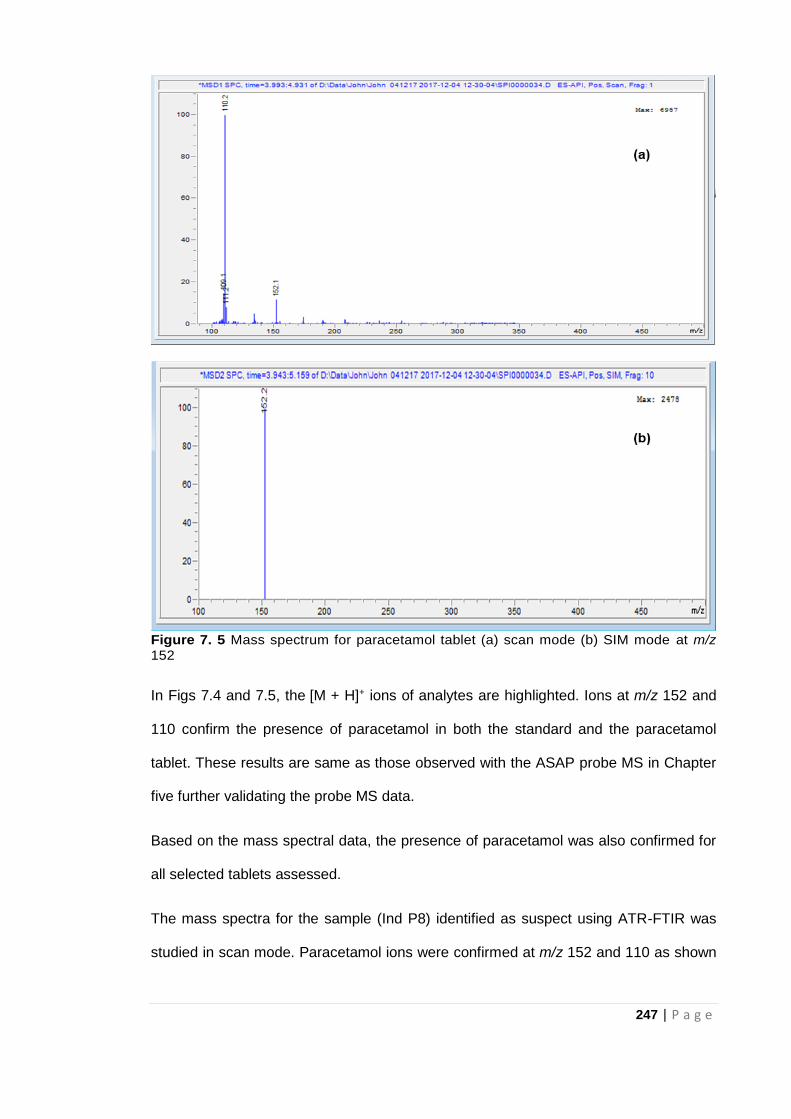
247 | P a g e
Figure 7. 5 Mass spectrum for paracetamol tablet (a) scan mode (b) SIM mode at m/z 152
In Figs 7.4 and 7.5, the [M + H]+ ions of analytes are highlighted. Ions at m/z 152 and
110 confirm the presence of paracetamol in both the standard and the paracetamol
tablet. These results are same as those observed with the ASAP probe MS in Chapter
five further validating the probe MS data.
Based on the mass spectral data, the presence of paracetamol was also confirmed for
all selected tablets assessed.
The mass spectra for the sample (Ind P8) identified as suspect using ATR-FTIR was
studied in scan mode. Paracetamol ions were confirmed at m/z 152 and 110 as shown
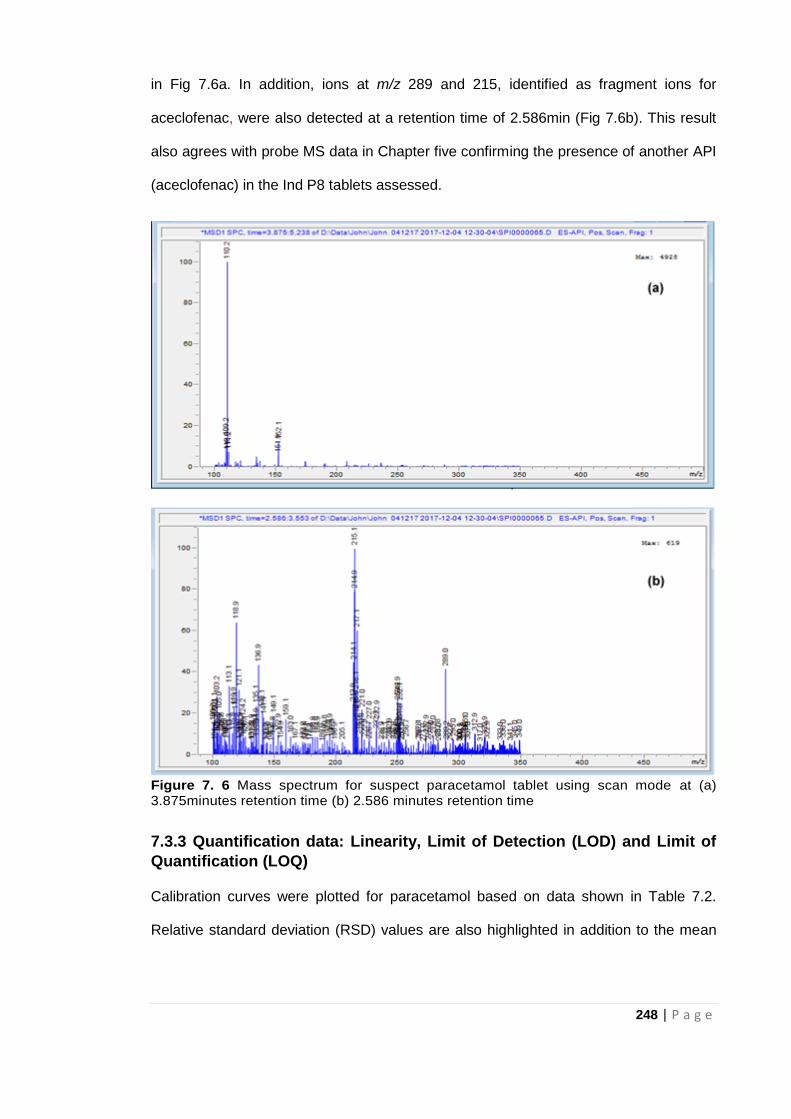
248 | P a g e
in Fig 7.6a. In addition, ions at m/z 289 and 215, identified as fragment ions for
aceclofenac, were also detected at a retention time of 2.586min (Fig 7.6b). This result
also agrees with probe MS data in Chapter five confirming the presence of another API
(aceclofenac) in the Ind P8 tablets assessed.
Figure 7. 6 Mass spectrum for suspect paracetamol tablet using scan mode at (a) 3.875minutes retention time (b) 2.586 minutes retention time
7.3.3 Quantification data: Linearity, Limit of Detection (LOD) and Limit of
Quantification (LOQ)
Calibration curves were plotted for paracetamol based on data shown in Table 7.2.
Relative standard deviation (RSD) values are also highlighted in addition to the mean
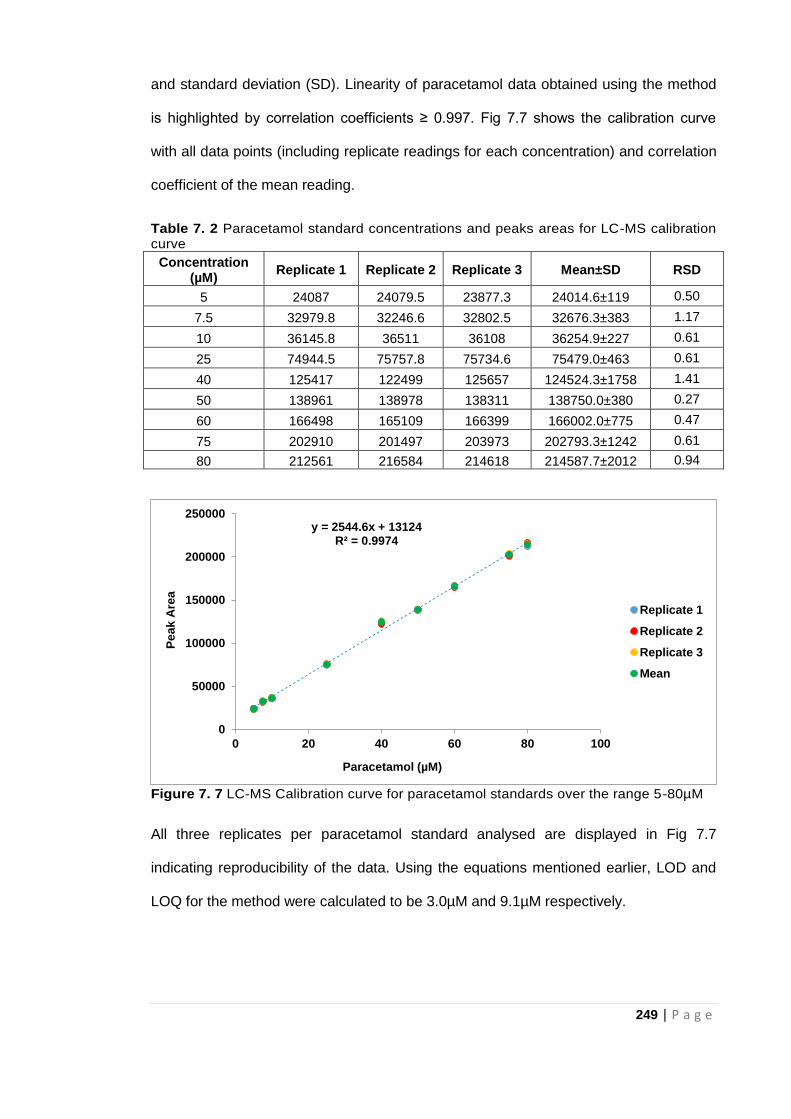
249 | P a g e
and standard deviation (SD). Linearity of paracetamol data obtained using the method
is highlighted by correlation coefficients ≥ 0.997. Fig 7.7 shows the calibration curve
with all data points (including replicate readings for each concentration) and correlation
coefficient of the mean reading.
Table 7. 2 Paracetamol standard concentrations and peaks areas for LC-MS calibration curve
Concentration (µM)
Replicate 1 Replicate 2 Replicate 3 Mean±SD RSD
5 24087 24079.5 23877.3 24014.6±119 0.50
7.5 32979.8 32246.6 32802.5 32676.3±383 1.17
10 36145.8 36511 36108 36254.9±227 0.61
25 74944.5 75757.8 75734.6 75479.0±463 0.61
40 125417 122499 125657 124524.3±1758 1.41
50 138961 138978 138311 138750.0±380 0.27
60 166498 165109 166399 166002.0±775 0.47
75 202910 201497 203973 202793.3±1242 0.61
80 212561 216584 214618 214587.7±2012 0.94
Figure 7. 7 LC-MS Calibration curve for paracetamol standards over the range 5-80µM
All three replicates per paracetamol standard analysed are displayed in Fig 7.7
indicating reproducibility of the data. Using the equations mentioned earlier, LOD and
LOQ for the method were calculated to be 3.0µM and 9.1µM respectively.
y = 2544.6x + 13124R² = 0.9974
0
50000
100000
150000
200000
250000
0 20 40 60 80 100
Pe
ak
Are
a
Paracetamol (µM)
Replicate 1
Replicate 2
Replicate 3
Mean
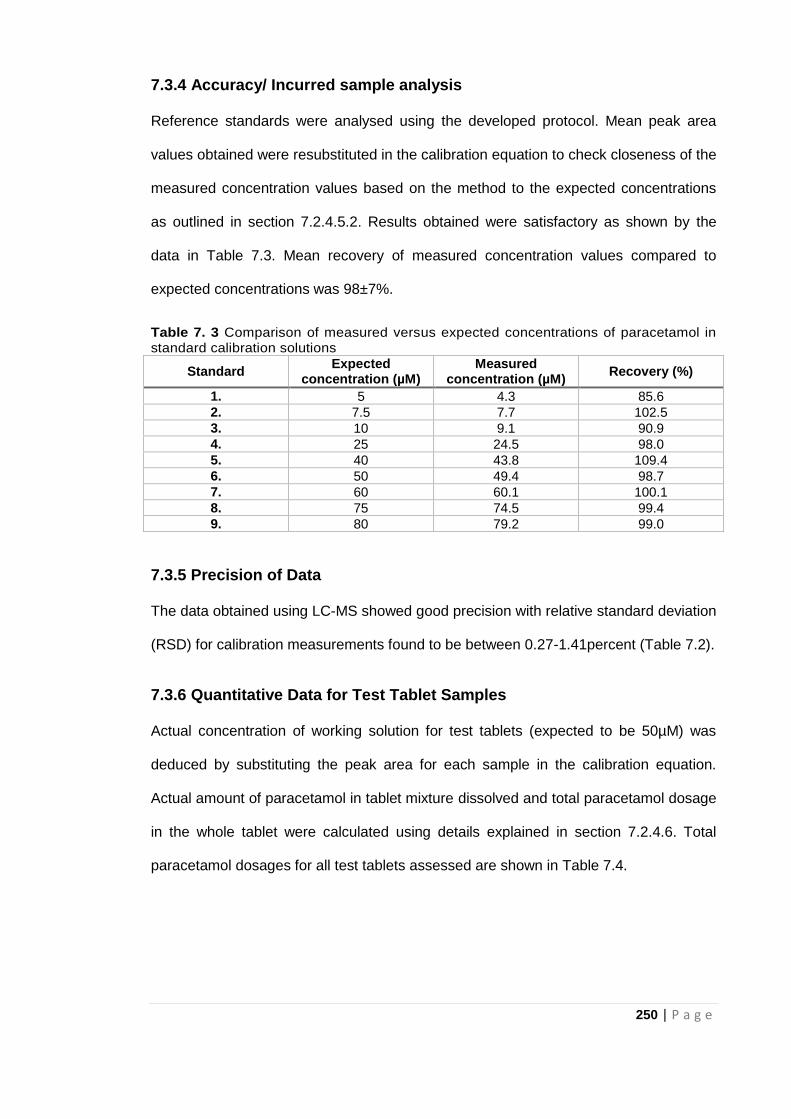
250 | P a g e
7.3.4 Accuracy/ Incurred sample analysis
Reference standards were analysed using the developed protocol. Mean peak area
values obtained were resubstituted in the calibration equation to check closeness of the
measured concentration values based on the method to the expected concentrations
as outlined in section 7.2.4.5.2. Results obtained were satisfactory as shown by the
data in Table 7.3. Mean recovery of measured concentration values compared to
expected concentrations was 98±7%.
Table 7. 3 Comparison of measured versus expected concentrations of paracetamol in standard calibration solutions
Standard Expected
concentration (µM) Measured
concentration (µM) Recovery (%)
1. 5 4.3 85.6
2. 7.5 7.7 102.5
3. 10 9.1 90.9
4. 25 24.5 98.0
5. 40 43.8 109.4
6. 50 49.4 98.7
7. 60 60.1 100.1
8. 75 74.5 99.4
9. 80 79.2 99.0
7.3.5 Precision of Data
The data obtained using LC-MS showed good precision with relative standard deviation
(RSD) for calibration measurements found to be between 0.27-1.41percent (Table 7.2).
7.3.6 Quantitative Data for Test Tablet Samples
Actual concentration of working solution for test tablets (expected to be 50µM) was
deduced by substituting the peak area for each sample in the calibration equation.
Actual amount of paracetamol in tablet mixture dissolved and total paracetamol dosage
in the whole tablet were calculated using details explained in section 7.2.4.6. Total
paracetamol dosages for all test tablets assessed are shown in Table 7.4.
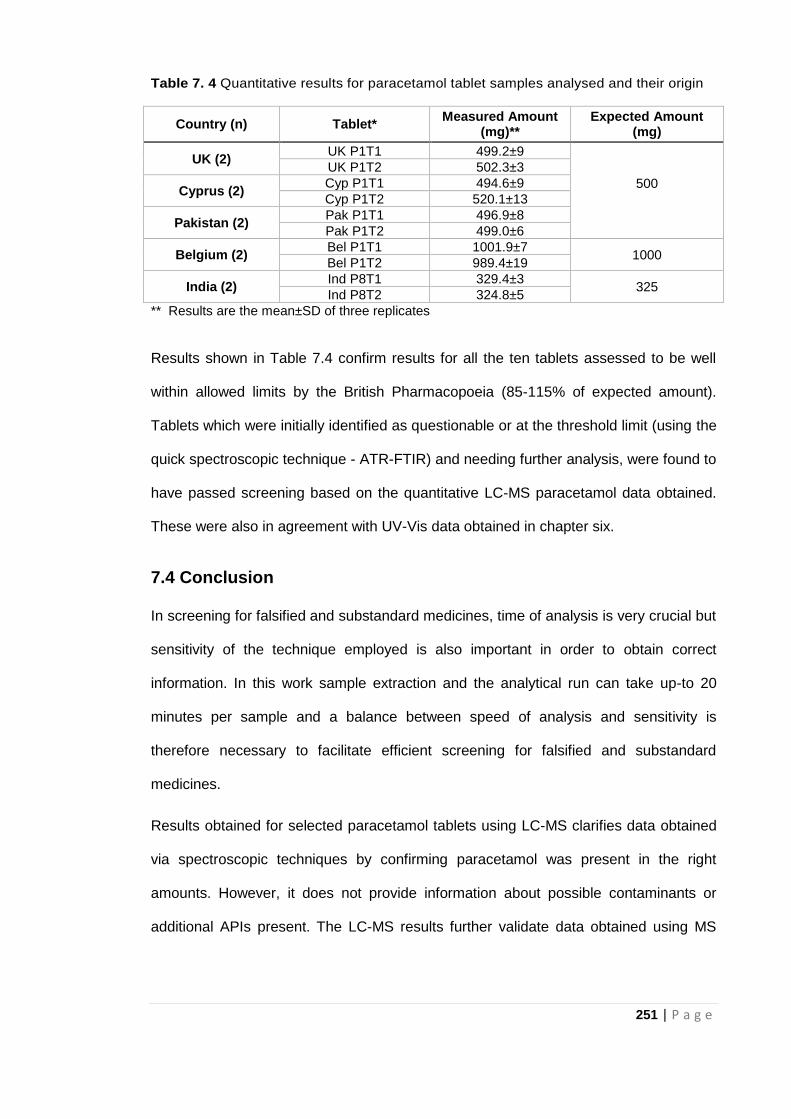
251 | P a g e
Table 7. 4 Quantitative results for paracetamol tablet samples analysed and their origin
Country (n) Tablet* Measured Amount
(mg)** Expected Amount
(mg)
UK (2) UK P1T1 499.2±9
500
UK P1T2 502.3±3
Cyprus (2) Cyp P1T1 494.6±9
Cyp P1T2 520.1±13
Pakistan (2) Pak P1T1 496.9±8
Pak P1T2 499.0±6
Belgium (2) Bel P1T1 1001.9±7
1000 Bel P1T2 989.4±19
India (2) Ind P8T1 329.4±3
325 Ind P8T2 324.8±5
** Results are the mean±SD of three replicates
Results shown in Table 7.4 confirm results for all the ten tablets assessed to be well
within allowed limits by the British Pharmacopoeia (85-115% of expected amount).
Tablets which were initially identified as questionable or at the threshold limit (using the
quick spectroscopic technique - ATR-FTIR) and needing further analysis, were found to
have passed screening based on the quantitative LC-MS paracetamol data obtained.
These were also in agreement with UV-Vis data obtained in chapter six.
7.4 Conclusion
In screening for falsified and substandard medicines, time of analysis is very crucial but
sensitivity of the technique employed is also important in order to obtain correct
information. In this work sample extraction and the analytical run can take up-to 20
minutes per sample and a balance between speed of analysis and sensitivity is
therefore necessary to facilitate efficient screening for falsified and substandard
medicines.
Results obtained for selected paracetamol tablets using LC-MS clarifies data obtained
via spectroscopic techniques by confirming paracetamol was present in the right
amounts. However, it does not provide information about possible contaminants or
additional APIs present. The LC-MS results further validate data obtained using MS
252 | P a g e
and solvent extraction techniques. Data based on LC-MS analysis together with data
already acquired using other techniques (in Chapters three to six) also support the call
for a sequential approach to screening medicines highlighted by the authentication
pyramid in Chapter two. Simpler techniques can be used identify suspect samples in
the field thereby cutting down the number of samples that need to be assessed in the
laboratories. LC-MS is therefore very useful as a confirmatory technique in reassessing
questionable samples identified based on simpler authentication techniques while
screening for FSMs.
Variation in data between the techniques can be linked to several factors including the
sensitivity of the technique which will be discussed in more detail in the next chapter
(Chapter eight). A more efficient approach to screening for falsified and substandard
medicines is also proposed in Chapter eight.
253 | P a g e
7.5 References
Akgeyik, E., Kaynak, M.S., Çelebier, M., Altınöz, S. and Şahin, S. (2016) Evaluation of
pharmaceutical quality of conventional dosage forms containing paracetamol and
caffeine available in the Turkish drug market. Dissolution Technology, 23(2): 36-41.
Attimarad, M. (2011) Simultaneous determination of paracetamol and lornoxicam by
RP-HPLC in bulk and tablet formulation. Pharmaceutical Methods, 2(1), p.61.
Chandra, P., Rathore, A.S., Lohidasan, S. and Mahadik, K.R. (2012) Application of
HPLC for the simultaneous determination of aceclofenac, paracetamol and tramadol
hydrochloride in pharmaceutical dosage form. Scientia Pharmaceutica, 80(2): 337.
Dégardin, K., Roggo, Y. and Margot, P. (2014) Understanding and fighting the
medicine counterfeit market. Journal of Pharmaceutical and Biomedical Analysis, 87:
167-175.
Dégardin, K., Roggo, Y. and Margot, P. (2015) Forensic intelligence for medicine anti-
counterfeiting. Forensic Science International, 248: 15-32.
Fenk, C.J., Hickman, N.M., Fincke, M.A., Motry, D.H. and Lavine, B. (2010)
Identification and Quantitative Analysis of Acetaminophen, Acetylsalicylic Acid, and
Caffeine in Commercial Analgesic Tablets by LC− MS. Journal of Chemical
Education, 87(8): 838-841.
Fiori, J. and Andrisano, V. (2014) LC–MS method for the simultaneous determination of
six glucocorticoids in pharmaceutical formulations and counterfeit cosmetic products.
Journal of Pharmaceutical and Biomedical Analysis, 91: 185-192.
Kovacs, S., Hawes, S.E., Maley, S.N., Mosites, E., Wong, L. and Stergachis, A. (2014)
Technologies for detecting falsified and substandard drugs in low and middle-income
countries. PLoS One, 9(3): e90601.
Lohmann, W. and Karst, U. (2006) Simulation of the detoxification of paracetamol using
on-line electrochemistry/liquid chromatography/mass spectrometry. Analytical and
Bioanalytical Chemistry, 386(6): 1701-1708.
Lou, H.G., Yuan, H., Ruan, Z.R. and Jiang, B. (2010) Simultaneous determination of
paracetamol, pseudoephedrine, dextrophan and chlorpheniramine in human plasma by
liquid chromatography–tandem mass spectrometry. Journal of Chromatography
B, 878(7-8): 682-688.
254 | P a g e
Montaseri, H. and Forbes, P.B. (2018) Analytical techniques for the determination of
acetaminophen. TrAC Trends in Analytical Chemistry.
https://doi.org/10.1016/j.trac.2018.08.023
Van Quekelberghe, S.A., Soomro, S.A., Cordonnier, J.A. and Jansen, F.H. (2008)
Optimization of an LC-MS method for the determination of artesunate and
dihydroartemisinin plasma levels using liquid-liquid extraction. Journal of Analytical
Toxicology, 32(2): 133-139.
Zou, W.B., Yin, L.H. and Jin, S.H. (2017) Advances in rapid drug detection
technology. Journal of Pharmaceutical and Biomedical Analysis, 147: 81-88.
255 | P a g e
CHAPTER EIGHT
Analytical Strategy for
Identification of Falsified and
Substandard Medicines
256 | P a g e
8.1 Introduction
In previous chapters, analytical methods were assessed individually for their potential
in the investigation of FSMs. Each analytical method employed provided unique and
relevant information about the test tablets analysed. Therefore, cumulative assessment
of these analytical methods and the corresponding data obtained will allow for an in-
depth understanding of the tablets samples and the analytical strategy required for the
control of FSMs (Mackey et al, 2015; Shore, 2015; Rebiere et al, 2017). As mentioned
in Chapter 2, the analytical strategy employed in the control of FSMs depends on
several factors. The principal factor will be the country in which the analysis takes
place, in this work, low and middle income countries (LMICs) are the concern. Within
these countries other factors include, time and location of analysis, availability of funds,
the purpose for the testing and the expertise of the operator (Martino et al, 2010;
Dégardin et al, 2014; Rebiere et al, 2017).
Based on the factors mentioned above, this chapter assesses the performance of the
different analytical methods employed and the context within which each one can be
applied to facilitate an efficient approach to the screening of FSMs. Furthermore, the
development of an analytical strategy combining data from several techniques to arrive
at conclusive decision about a suspect medicine is also outlined.
8.2 Cost of Technique/Analysis
The overall cost of using a particular analytical technique plays a major role in its
feasibility in the screening of FSMs (Davison, 2011; Hamilton et al, 2016; Zou et al,
2017). The gold standard confirmatory technique LC-MS (highlighted in Chapter 7) is a
pharmacopoeia approved method for the qualitative and quantitative analysis of
pharmaceutical formulations but is expensive. UV-Vis provides pharmacopoeia
approved quantitative data but both these techniques require solvent extraction and
trained technical staff and access to these confirmatory techniques will therefore be a
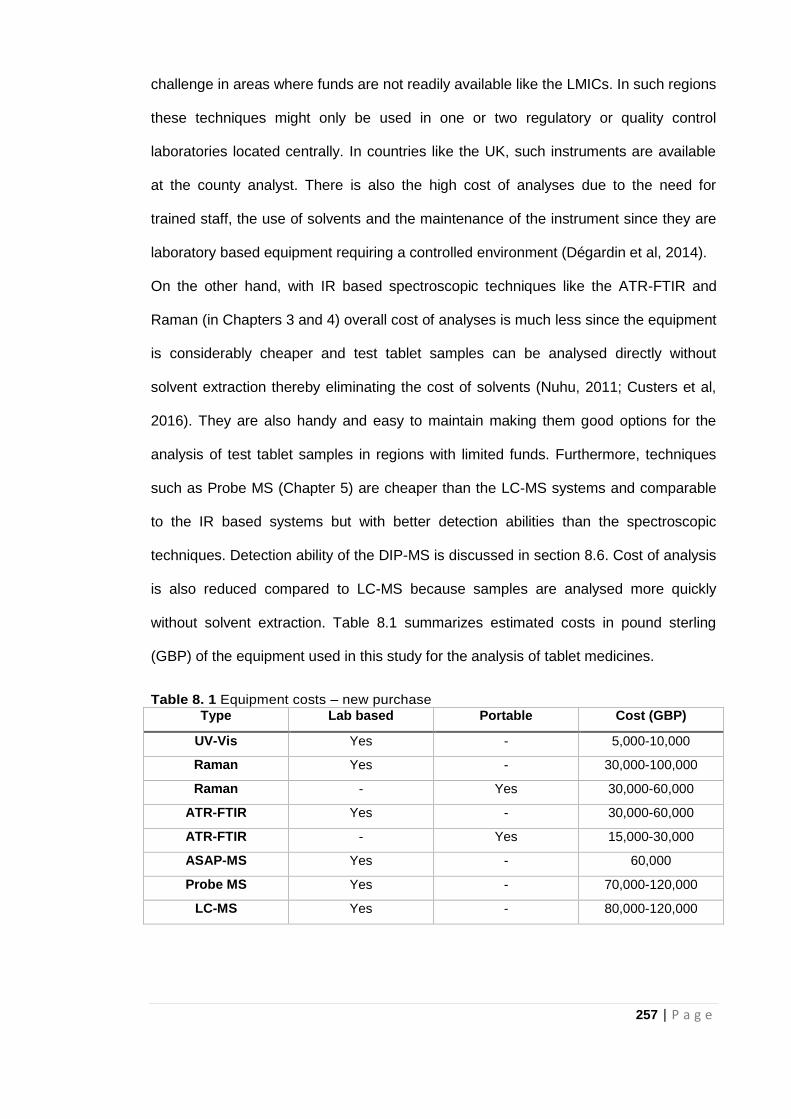
257 | P a g e
challenge in areas where funds are not readily available like the LMICs. In such regions
these techniques might only be used in one or two regulatory or quality control
laboratories located centrally. In countries like the UK, such instruments are available
at the county analyst. There is also the high cost of analyses due to the need for
trained staff, the use of solvents and the maintenance of the instrument since they are
laboratory based equipment requiring a controlled environment (Dégardin et al, 2014).
On the other hand, with IR based spectroscopic techniques like the ATR-FTIR and
Raman (in Chapters 3 and 4) overall cost of analyses is much less since the equipment
is considerably cheaper and test tablet samples can be analysed directly without
solvent extraction thereby eliminating the cost of solvents (Nuhu, 2011; Custers et al,
2016). They are also handy and easy to maintain making them good options for the
analysis of test tablet samples in regions with limited funds. Furthermore, techniques
such as Probe MS (Chapter 5) are cheaper than the LC-MS systems and comparable
to the IR based systems but with better detection abilities than the spectroscopic
techniques. Detection ability of the DIP-MS is discussed in section 8.6. Cost of analysis
is also reduced compared to LC-MS because samples are analysed more quickly
without solvent extraction. Table 8.1 summarizes estimated costs in pound sterling
(GBP) of the equipment used in this study for the analysis of tablet medicines.
Table 8. 1 Equipment costs – new purchase
Type Lab based Portable Cost (GBP)
UV-Vis Yes - 5,000-10,000
Raman Yes - 30,000-100,000
Raman - Yes 30,000-60,000
ATR-FTIR Yes - 30,000-60,000
ATR-FTIR - Yes 15,000-30,000
ASAP-MS Yes - 60,000
Probe MS Yes - 70,000-120,000
LC-MS Yes - 80,000-120,000
258 | P a g e
8.3 Sampling time and sample throughput
As established earlier, time is of essence in the detection of FSMs since unlike any
other falsified goods; they pose a huge risk to public health. Analytical strategies for the
detection of FSMs must therefore be able to spot these medicines within the shortest
possible time in order to facilitate their immediate withdrawal from the market and
improve patient safety (Fernandez et al, 2011).
Considering the techniques employed, the ATR-FTIR and Raman techniques allowed
rapid analysis of test tablet samples with results obtained in less than five minutes.
ASAP Probe MS results were also obtained within the same time frame as with ATR-
FTIR and Raman spectroscopy. These techniques therefore provide an avenue for
quick pass/fail tests on tablet samples and so many samples can be assessed within a
short period of time. The requirements for these rapid techniques are similar to the
airport scanners where the aim is to get as many individuals through the system
retaining only those who are suspect.
However, the pharmacopoeia approved techniques (UV-Vis and LC-MS) took much
longer to obtain results which involved solvent extraction of the API before analysis of
the sample to obtain data. These techniques were therefore more useful as second line
confirmation for tablet samples identified as suspect by the IR based techniques
(Chapters 6 and 7). Rapid pass/fail tests reduce the number of samples requiring
analysis via solvent extraction techniques thereby saving time and the cost of running
all samples available.
8.4 Ease of use
The ease of use determines the where and by whom the technique can be used in the
detection of FSMs. This cuts across the sample preparation phase to the analysis of
the test tablet sample. The rapid techniques employed in Chapters 3 -5 (ATR-FTIR,
Raman spectroscopy and probe MS) are considered easy to use since tablet samples
259 | P a g e
(whole or crushed) are analysed directly without any need for solvent extraction.
Eliminating the solvent extraction phase also helps in maintaining the integrity of the
original tablet sample (non-destructive). The simplicity of the rapid techniques implies
that they can be run by operators with minimal training if adequate software based
identification is incorporated into the software. Quantitative UV-Vis and LC-MS on the
other hand requires operators with advanced scientific training to correctly solvent
extract APIs for analysis and also ensure analysis proceeds under the right
experimental conditions.
8.5 Complexity of Data Output
Beyond the ease of use of the device, interpretation of experimental data is also
important in the analysis of FSMs. Results obtained showed that though the
spectroscopic techniques were quick and easy to use, data obtained using these
techniques were more challenging to interpret. Spectra obtained for samples using
ATR-FTIR and Raman spectroscopy (Chapters 3 and 4) had several peaks for the
same analyte providing a fingerprint which could be used to identify the API as long as
there was only one API present in the tablet. Multiple APIs produced complex
overlapping spectra difficult to interpret.
Conversely, Probe MS, and LC-MS were more specific with results showing peaks
unique to the API being assessed.
8.6 Detection Capability
It is one thing for a technique to be able to identify the target API. It is another thing for
that same technique to detect the API in the concentration at which it is present in the
test tablet or indeed the presence of multiple APIs.
Given the complexity of the spectral data obtained using IR based techniques (as
discussed above), analyses of tablet medicines was most feasible with simpler single
260 | P a g e
API tablets (as with paracetamol). The difficulty in quantifying chloroquine using ATR-
FTIR PCA algorithm highlights the challenges that abound in the analysis of such APIs
in tablets with spectral peaks that are not well defined or separated. In Chapter 4,
Raman spectroscopy with PCA was employed in successfully discriminating
paracetamol and chloroquine tablet samples into different groups depending on their
formulation. However, the inability to discriminate the paracetamol tablets, Ind P4,
(coloured and containing a second API), suggests that there might be a limit in the
degree of difference detectable by the PCA algorithm. Due to the specificity of the
probe MS, and LC-MS techniques, they are able to analyse complex/multiple API
samples more effectively (Jonahnsson et al, 2014; Rebiere et al, 2017). The specificity
of probe MS is evidenced by its use in this study for the characterisation of suspect
tablet samples identified using ATR-FTIR (Ind P8T1 and Ind P8T2) and confirming the
presence of another API in addition to paracetamol. However, there were challenges
using probe MS for the direct quantification of paracetamol (Chapter 5) due to the
negligible amounts of crushed tablet powder required for analysis.
Figure 8.1 assesses the performance of the rapid ATR-FTIR method developed in the
determination of paracetamol content of tablets versus the pharmacopoeia approved
UV-Vis analysis.
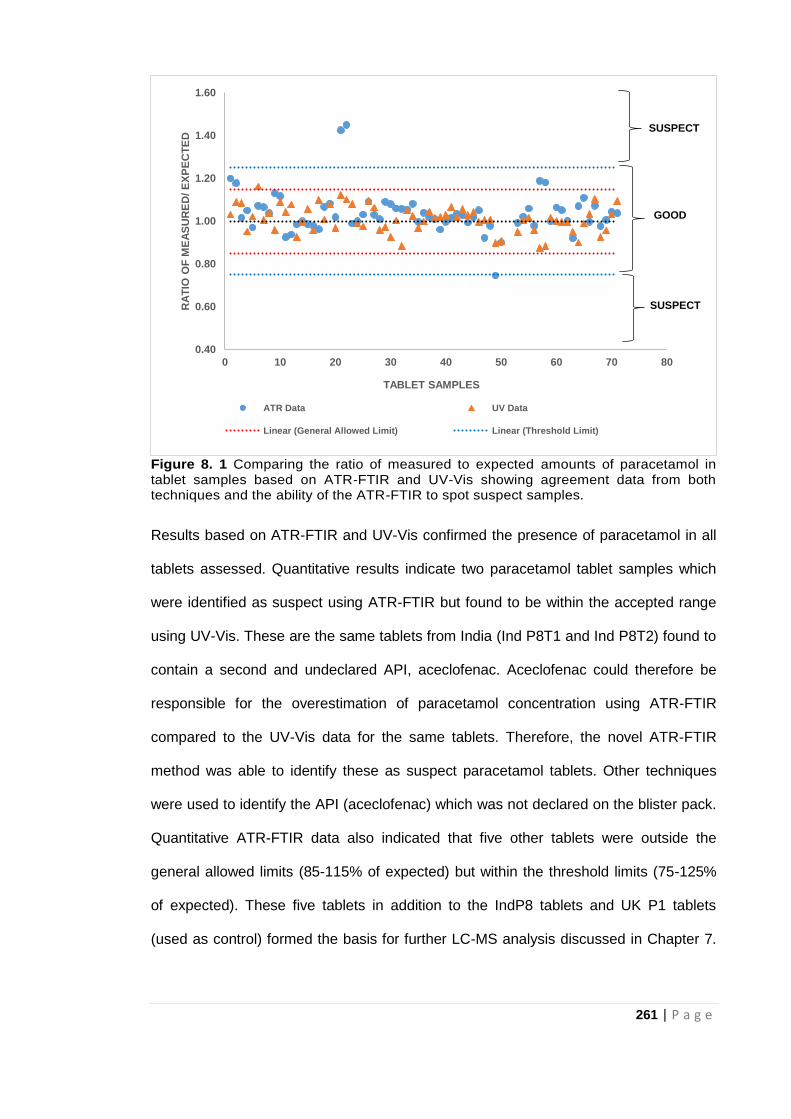
261 | P a g e
Figure 8. 1 Comparing the ratio of measured to expected amounts of paracetamol in tablet samples based on ATR-FTIR and UV-Vis showing agreement data from both techniques and the ability of the ATR-FTIR to spot suspect samples.
Results based on ATR-FTIR and UV-Vis confirmed the presence of paracetamol in all
tablets assessed. Quantitative results indicate two paracetamol tablet samples which
were identified as suspect using ATR-FTIR but found to be within the accepted range
using UV-Vis. These are the same tablets from India (Ind P8T1 and Ind P8T2) found to
contain a second and undeclared API, aceclofenac. Aceclofenac could therefore be
responsible for the overestimation of paracetamol concentration using ATR-FTIR
compared to the UV-Vis data for the same tablets. Therefore, the novel ATR-FTIR
method was able to identify these as suspect paracetamol tablets. Other techniques
were used to identify the API (aceclofenac) which was not declared on the blister pack.
Quantitative ATR-FTIR data also indicated that five other tablets were outside the
general allowed limits (85-115% of expected) but within the threshold limits (75-125%
of expected). These five tablets in addition to the IndP8 tablets and UK P1 tablets
(used as control) formed the basis for further LC-MS analysis discussed in Chapter 7.
0.40
0.60
0.80
1.00
1.20
1.40
1.60
0 10 20 30 40 50 60 70 80
RA
TIO
OF
ME
AS
UR
ED
/ E
XP
EC
TE
D
TABLET SAMPLES
ATR Data UV Data
Linear (General Allowed Limit) Linear (Threshold Limit)
SUSPECT
SUSPECT
GOOD
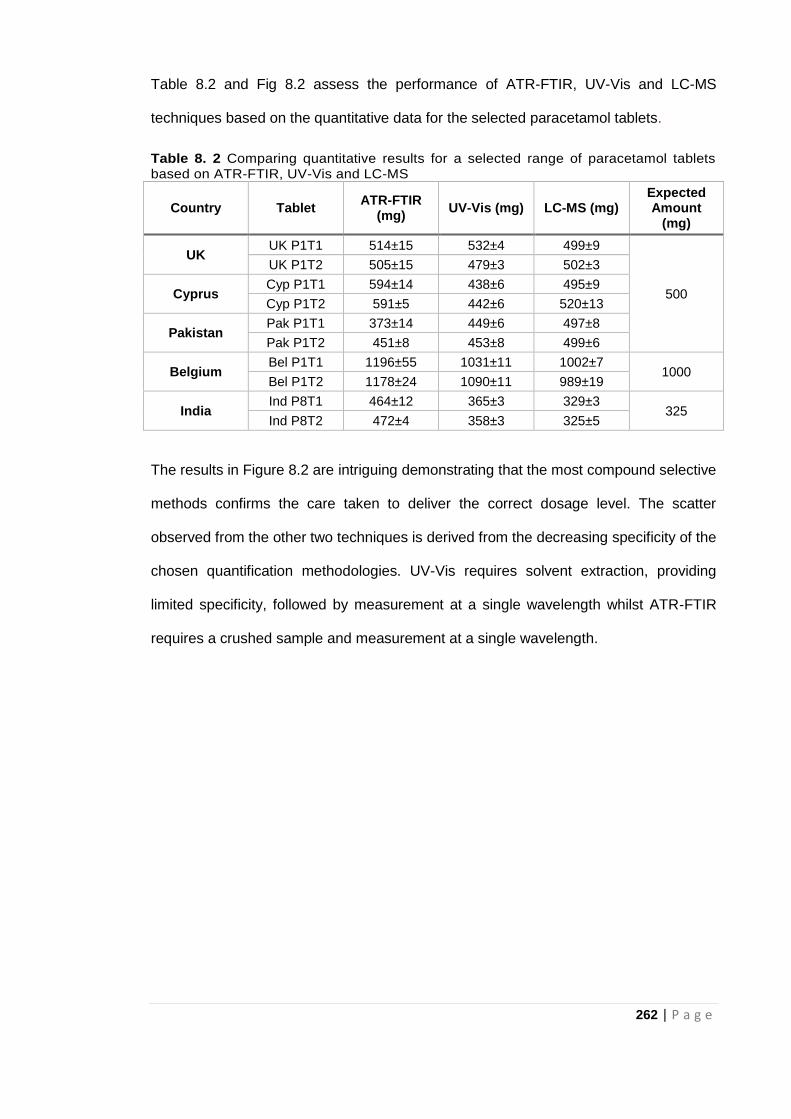
262 | P a g e
Table 8.2 and Fig 8.2 assess the performance of ATR-FTIR, UV-Vis and LC-MS
techniques based on the quantitative data for the selected paracetamol tablets.
Table 8. 2 Comparing quantitative results for a selected range of paracetamol tablets based on ATR-FTIR, UV-Vis and LC-MS
Country Tablet ATR-FTIR
(mg) UV-Vis (mg) LC-MS (mg)
Expected Amount
(mg)
UK UK P1T1 514±15 532±4 499±9
500
UK P1T2 505±15 479±3 502±3
Cyprus Cyp P1T1 594±14 438±6 495±9
Cyp P1T2 591±5 442±6 520±13
Pakistan Pak P1T1 373±14 449±6 497±8
Pak P1T2 451±8 453±8 499±6
Belgium Bel P1T1 1196±55 1031±11 1002±7
1000 Bel P1T2 1178±24 1090±11 989±19
India Ind P8T1 464±12 365±3 329±3
325 Ind P8T2 472±4 358±3 325±5
The results in Figure 8.2 are intriguing demonstrating that the most compound selective
methods confirms the care taken to deliver the correct dosage level. The scatter
observed from the other two techniques is derived from the decreasing specificity of the
chosen quantification methodologies. UV-Vis requires solvent extraction, providing
limited specificity, followed by measurement at a single wavelength whilst ATR-FTIR
requires a crushed sample and measurement at a single wavelength.
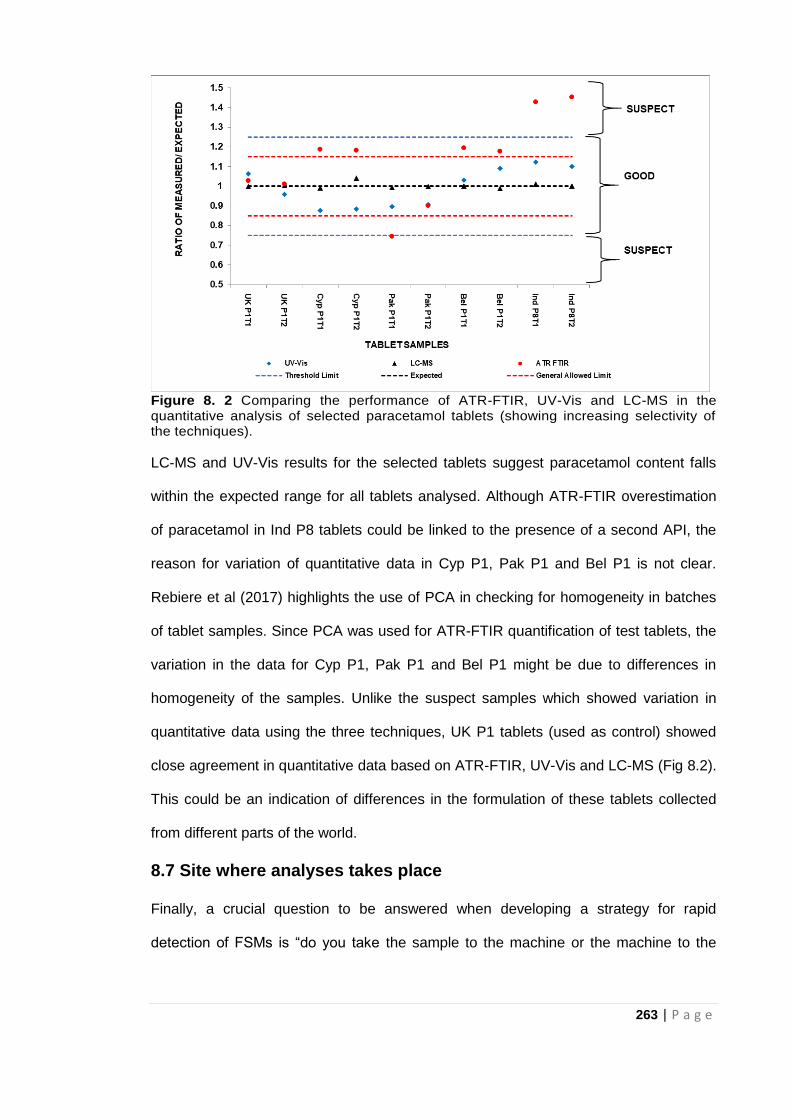
263 | P a g e
Figure 8. 2 Comparing the performance of ATR-FTIR, UV-Vis and LC-MS in the quantitative analysis of selected paracetamol tablets (showing increasing selectivity of the techniques).
LC-MS and UV-Vis results for the selected tablets suggest paracetamol content falls
within the expected range for all tablets analysed. Although ATR-FTIR overestimation
of paracetamol in Ind P8 tablets could be linked to the presence of a second API, the
reason for variation of quantitative data in Cyp P1, Pak P1 and Bel P1 is not clear.
Rebiere et al (2017) highlights the use of PCA in checking for homogeneity in batches
of tablet samples. Since PCA was used for ATR-FTIR quantification of test tablets, the
variation in the data for Cyp P1, Pak P1 and Bel P1 might be due to differences in
homogeneity of the samples. Unlike the suspect samples which showed variation in
quantitative data using the three techniques, UK P1 tablets (used as control) showed
close agreement in quantitative data based on ATR-FTIR, UV-Vis and LC-MS (Fig 8.2).
This could be an indication of differences in the formulation of these tablets collected
from different parts of the world.
8.7 Site where analyses takes place
Finally, a crucial question to be answered when developing a strategy for rapid
detection of FSMs is “do you take the sample to the machine or the machine to the
264 | P a g e
sample?” In other words, it is important to decide if in-field or laboratory analysis of
medicines would provide the required information. This will inform the technique of
choice for analysis (Dégardin et al, 2015; Fadlallah et al, 2016).
Spectroscopic techniques like ATR-FTIR and Raman can be manufactured as portable
devices that can easily be moved around making them good choices for in-field
analyses. The speed of analysis with the spectroscopic techniques implies that
valuable information about tablet samples can be obtained within a short time and in
the field. This will enhance the availability of data at every stage of the authentication
process rather than waiting for data obtained in batches after test tablet samples must
have been taken to laboratories for analysis. For instance, there are only ten WHO
prequalified quality control laboratories in Africa (WHO, 2018). This implies that these
ten quality control laboratories serve the 54 countries in the continent. If all samples for
authentication in these countries are sent to these quality control laboratories to obtain
primary data for the test samples, a backlog of samples would mean long waiting times
in order to obtain any valuable information about the samples.
There is also the question of whether bench-top or handheld devices should be used.
This is also dependent on the data required. Zheng et al (2014) in their comparative
study, assert that bench-top Raman spectrometers were found to be ten times more
sensitive than the handheld devices.
Techniques like probe MS, UV-Vis and LC-MS require a controlled environment to
work effectively and so are laboratory based. Therefore, samples to be assessed using
these techniques have to be taken to the laboratory for analyses since the devices are
not rugged enough to be used on the field. A constant smooth electricity supply is also
needed for these devices to operate whereas some of the portable spectroscopic
techniques can be battery powered.
265 | P a g e
In deciding whether to analyse tablet samples on field or take them to the laboratory,
some important factors need to be considered such as:
Likelihood of damaging samples while in transit
Storage conditions for samples
The kind of analysis required
Time frame during which results need to be delivered
An analytical strategy can then be chosen after reviewing the requirements for the test
tablet samples to be analysed. The analytical strategy outlines successive analytical
steps required to arrive at the conclusion that a test tablet sample could be falsified or
substandard. The analytical strategy could also be a standalone test that provides the
information needed at the time. For instance, in a situation where there is adverse
reaction due to FSMs and the patients’ life is at risk, conclusive results need to be
delivered within the shortest time possible. Consequently, the analytical strategy
suggested in this study is highlighted in Fig 8.3.

266 | P a g e
Figure 8. 3 Analytical Strategy for the detection of Falsified and Substandard Medicines (FSMs)
As mentioned earlier, simple and rapid analytical methods used for initial screening do
not negate the use of the laboratory based pharmacopoeia approved methods since
each method provides unique data. Analysis based on the rapid and pharmacopoeia
methods identified in the analytical strategy can proceed simultaneously. It is important
267 | P a g e
to note that the analytical strategy can be re-adjusted or modified at each step to
ensure valuable data is obtained. If a particular analysis does not provide enough
information needed to help characterise the test tablet samples in question, an
additional method may be employed to help validate initial results.
8.8 Conclusion
A good and efficient analytical strategy is required to effectively control FSMs. As such,
a proper assessment of the situation has to be made for this to be achieved since there
is difficulty in defining a general methodology for the rapid detection of FSMs (Rebiere
et al, 2017; Zou et al, 2017). Based on data obtained from previous experimental
Chapters (3-7), this chapter highlights scenarios in which the analytical techniques
employed are most feasible. As mentioned earlier, this study is targeted at LMICs
where facilities are not readily available. Rapid analytical methods developed in the
study hold great potential in the quick screening and identification of FSMs especially in
LMICs for a number of reasons:
They are cheaper than the solvent extraction LC-MS method which is the gold
standard for analysis of medicines since funds spent in purchasing solvents and
training technicians are saved.
They are quicker which implies that more tablet samples can be assessed
within a short period of time with suspect samples sent for further analysis.
Data produced by the ATR-FTIR and Raman spectroscopy might be complex
but these can be addressed by software programs for data analysis being part
of the equipment set up. This will allow operators with little or no experience to
run quick test on tablet samples with the equipment producing the data and the
analysis of the data in one go. They are therefore, simple and easy to use.
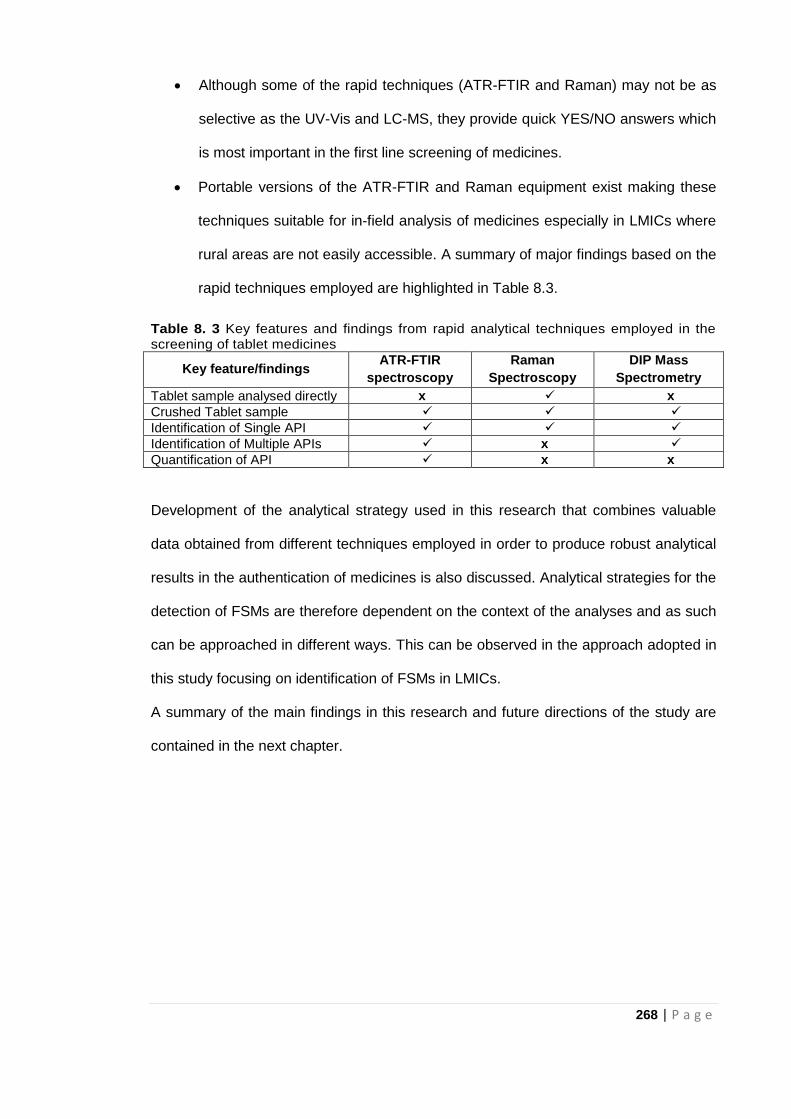
268 | P a g e
Although some of the rapid techniques (ATR-FTIR and Raman) may not be as
selective as the UV-Vis and LC-MS, they provide quick YES/NO answers which
is most important in the first line screening of medicines.
Portable versions of the ATR-FTIR and Raman equipment exist making these
techniques suitable for in-field analysis of medicines especially in LMICs where
rural areas are not easily accessible. A summary of major findings based on the
rapid techniques employed are highlighted in Table 8.3.
Table 8. 3 Key features and findings from rapid analytical techniques employed in the screening of tablet medicines
Key feature/findings ATR-FTIR
spectroscopy
Raman
Spectroscopy
DIP Mass
Spectrometry
Tablet sample analysed directly x x
Crushed Tablet sample
Identification of Single API
Identification of Multiple APIs x
Quantification of API x x
Development of the analytical strategy used in this research that combines valuable
data obtained from different techniques employed in order to produce robust analytical
results in the authentication of medicines is also discussed. Analytical strategies for the
detection of FSMs are therefore dependent on the context of the analyses and as such
can be approached in different ways. This can be observed in the approach adopted in
this study focusing on identification of FSMs in LMICs.
A summary of the main findings in this research and future directions of the study are
contained in the next chapter.
269 | P a g e
8.9 References
Davison, M. (2011) Pharmaceutical anti-counterfeiting: combating the real danger from
fake drugs. New Jersey: John Wiley & Sons.
Dégardin, K. Roggo Y. and Margot, P. (2014) Understanding and fighting the medicine
counterfeit market. Journal of Pharmaceutical and Biomedical Analysis, 87: 167-175.
Dégardin, K. Roggo, Y. and Margot, P. (2015) Forensic intelligence for medicine anti-
counterfeiting. Forensic Science International, 248: 15-32.
Fadlallah, R., El-Jardali, F., Annan, F., Azzam, H. and Akl, E.A. (2016) Strategies and
systems-level interventions to combat or prevent drug counterfeiting: a systematic
review of evidence beyond effectiveness. Pharmaceutical Medicine, 30(5): 263-276.
Fernandez, F.M., Hostetler, D., Powell, K., Kaur, H., Green, M.D., Mildenhall, D.C. and
Newton, P.N. (2011) Poor quality drugs: grand challenges in high throughput detection,
countrywide sampling, and forensics in developing countries. Analyst, 136(15): 3073-
3082.
Hamilton, W.L., Doyle, C., Halliwell-Ewen, M. and Lambert, G. (2016) Public health
interventions to protect against falsified medicines: a systematic review of international,
national and local policies. Health Policy and Planning, 31(10): 1448-1466.
Johansson, M., Fransson, D., Rundlöf, T., Huynh, N.H. and Arvidsson, T. (2014) A
general analytical platform and strategy in search for illegal drugs. Journal of
Pharmaceutical and Biomedical Analysis, 100: 215-229.
Kovacs, S., Hawes, S.E., Maley, S. N., Mosites, E., Wong L. and Stergachis, A. (2014)
Technologies for detecting falsified and substandard drugs in low and middle-income
countries. PloS One, 9: e90601.
Mackey, T.K., Liang, B.A., York, P. and Kubic, T. (2015) Counterfeit drug penetration
into global legitimate medicine supply chains: a global assessment. The American
Journal of Tropical Medicine and Hygiene, 92(6_Suppl): 59-67.
Martino, R., Malet-Martino, M., Gilard, V. and Balayssac, S. (2010) Counterfeit drugs:
analytical techniques for their identification. Analytical and Bioanalytical Chemistry,
398(1): 77-92.
270 | P a g e
Nuhu, A.A. (2011) Recent analytical approaches to counterfeit drug detection. Journal
of Applied Pharmaceutical Science, 1(05): 6-13.
Shore, D. (2015) Counterfeit medicines and the need for a global approach. European
Pharmaceutical Review, 20: 10-13.
World Health Organisation- WHO (2018) Newly prequalified Quality Control Laboratory
(QCL). Available at: https://extranet.who.int/prequal/news/newly-prequalified-quality-
control-laboratory-qcl-0 (accessed 19.09.18)
Zheng, J., Pang, S., Labuza, T.P. and He, L. (2014) Evaluation of surface-enhanced
Raman scattering detection using a handheld and a bench-top Raman spectrometer: A
comparative study. Talanta, 129: 79-85.
Zou, W.B., Yin, L.H. and Jin, S.H. (2017) Advances in rapid drug detection
technology. Journal of Pharmaceutical and Biomedical Analysis. 147: 81-88.
271 | P a g e
CHAPTER NINE
Conclusion and Future
Perspectives
272 | P a g e
9.1 Conclusion
Falsified and substandard medicines are a menace which if not curbed could lead to
devastating public health issues. It could occur at any point in the pharmaceutical
distribution chain; from the manufacturers of medicines until just before it gets to the
final consumer. Therefore, safeguarding of medicines is important in ensuring
medicines dispensed or sold to patients are what they say on the pack. Hence,
authentication of medicines is becoming an important area of research, especially with
the recent increase in reports of all kinds of FSMs across the globe.
Pharmacopoeia approved analytical methods like the HPLC have generally been used
for the assessment of medicines but these methods are expensive, involve lengthy
solvent extraction procedures and operate optimally in a controlled environment
(laboratory). Control of FSMs is dependent on their early detection and withdrawal from
the market. Thus, the speed of analyses and the availability of these analytical
techniques at every point in the pharmaceutical distribution chain are important for
effective screening of medicines. The high cost of these techniques implies that they
might not be feasible in LMICs.
For many years the ‘mini-lab’ which is a combination of simple liquid chromatography
and colorimetric analyses has been used in LMICs for the identification of FSMs. These
investigations did however require the use of solvent extraction prior to analysis.
The work reported here demonstrated the novel use of ATR-FTIR spectroscopy as a
simple, rapid and solvent free method for the determination of API content in
pharmaceutical tablet formulations. Previous research in this area considered the use
of conventional FTIR spectroscopy for the determination of API content. Conventional
analyses using FTIR involve a rigorous and lengthy sample preparation protocol
(Chapter 3) where KBr discs, containing the sample, are made for analysis. Maintaining
273 | P a g e
spectral reproducibility between disc samples is a huge challenge requiring a certain
skill level from the analyst. Most studies using IR spectroscopy have also required
manipulation of raw spectral data via baseline correction or normalisation.
The novel ATR-FTIR method in this study proposed a more simplified process; directly
using raw spectral data for analysis. The performance of this method was investigated
using paracetamol and chloroquine test tablets from around the world with a local
reference library created consisting a range of APIs and excipients for identification of
samples. Paracetamol identification and quantification was feasible with the method
identifying suspect samples needing further investigation. Based on the characteristic
peak identified, paracetamol could be detected in tablets down to 5% w/w. The whole
process from crushing each test tablet to spectral analysis was done within five
minutes. Paracetamol concentrations down to 10%w/w were quantified using a partial
least square (PLS) regression approach and were found to be dependent on the
excipient used in the preparation of standard paracetamol/excipient mixtures for
calibration. Chloroquine on the other hand could be identified but performed poorly
using the quantitative methods. Nevertheless, the ATR-FTIR method could still identify
suspect chloroquine tablet by spectral comparison. Difficulty in quantifying chloroquine
could be attributed to complexity in spectral fingerprint of the antimalarial API where
peaks were less intense and not as well-separated/defined as with paracetamol.
Raman spectroscopy is another rapid IR spectroscopic technique and one of the most
commonly used for analysis of FSMs. However, just as with FTIR, most Raman studies
have been based on manipulated spectra. Following the successful application of raw
ATR-FTIR spectra for analyses of test tablets, raw Raman spectra were also used for
the characterisation of paracetamol and chloroquine tablet samples. This work
demonstrates that Raman spectroscopy with PCA is able to discriminate between
different groups of tablet medicines without any manipulation of the raw spectra. This
274 | P a g e
novel Raman method could potentially be used in forensic/criminal investigations for
discriminating tablet samples from the same origin or source and acquisition of data
that is tenable in a law court.
Furthermore, as mentioned in Chapter 2 and 5, there are no known studies on the use
of probe MS for screening FSMs in the literature. This research highlights the use of
probe MS for the rapid analysis of tablet dosage forms. Due to its specificity probe MS
was used as a second-line rapid screening technique for further assessment of
paracetamol and antimalarial tablet samples. Probe MS techniques were applied to
tablets identified as suspect by the spectroscopic techniques and also to those with API
levels lower than the limit of the detection for the IR based methods. Probe MS was
able to confirm the presence of multiple APIs and also detect and identify a compound
(API-aceclofenac) not declared on the blister pack of some suspect tablets identified by
IR spectroscopy. However there was difficulty in the direct quantification of
paracetamol with probe MS since calibration was non-linear.
The use of UV-Vis spectroscopy and LC-MS for validation of ATR-FTIR quantitative
data in this research suggests individual analytical techniques provide unique data
which contributes towards detection of FSMs. However, the context of the analysis will
determine what technique(s) should be used. Furthermore, this research also
demonstrates that a combination of data acquired via different analytical techniques
allows the investigator to arrive at a more informed decision about the tablet sample in
question. Therefore the investigator is able to develop an efficient analytical strategy
using techniques which when combined provide more conclusive data about the tablet
sample being investigated within the shortest time possible.
Finally, the potential use of the simple, rapid and solvent free analytical methods
developed in this research, in addition to the pharmacopoeia approved methods, could
275 | P a g e
facilitate identification of FSMs on the field and even in the LMICs where sophisticated
analytical facilities are not readily available.
9.2 Recommendations and Future work
Based on the findings of this study, the following recommendations for further work on
the rapid identification of FSMs are suggested:
With respect to quantitative screening of APIs using ATR-FTIR spectroscopy,
the method applied was successful for simpler API tablets with well-defined
spectra such as paracetamol. However, there was difficulty in the direct
quantification of chloroquine using the method developed. Therefore it is
recommended the ATR-FTIR quantitative methods be modified to account for
more complex/multiple API tablets. Modification of the method can be done by
using more complex API/excipient mixtures for calibration. For example, the API
can be mixed with more than one excipient in order to prepare a mixture that is
even more representative of the pharmaceutical tablet formulation rather than
the binary API/ excipient mixtures used in the current method. In addition, the
potential of ATR-FTIR in the discrimination of chiral compounds via shifts in the
IR band could also be investigated. This will enable the detection of falsified
medicines where an enantiomer is used instead of the required API.
Raman spectroscopy in combination with PCA was successful in the
discrimination of tablet samples into groups without spectral manipulation. It will
therefore be interesting to consider the potential of Raman spectroscopy and
PCA in the quantitative analyses of tablets samples using their corresponding
raw spectra and not the manipulated spectra which is more common in the
literature.
276 | P a g e
Direct quantification of the API (paracetamol) was a challenge using both probe
MS analyses. This is because calibration was not linear for higher
concentrations of standard paracetamol/excipient mixtures. Non-linearity of
calibration data could be due to inconsistency in amount of tablet powder used
for analysis since minimal (µg) amounts were used for each run. Nevertheless,
some linearity was observed for paracetamol in excipient concentrations less
than or equal to 10% w/w. Paracetamol in excipient concentrations less than or
equal to 10% w/w does not cover the range in which this API generally occurs
in tablet medicines. This is, however, a common level for many APIs in tablet
formulations and a proper understanding of the linearity observed at lower
concentrations might provide a basis for improving the quantitative capabilities
of the probe MS to cover this concentration range. Another way forward might
be dispersing exact amounts of tablet powder in a matrix to eliminate slight
variations between each run.
In the grand scheme of things, efforts towards serialisation and traceability of
medicines will go a long way in addressing FSMs. A central database providing real
time monitoring of medicines from the manufacturer to the final consumer (including
results of screening tests conducted while in transit) will help provide more valuable
data about FSMs worldwide. The use of digital health in patient engagement could be
useful in the fight against FSMs. Miniaturisation of analytical methods for screening
medicines such that they can be incorporated in mobile phone applications, will allow
the patient a final check on the medicine at the point of purchase. This will in turn
improve the confidence of the patients on the medicine administered.
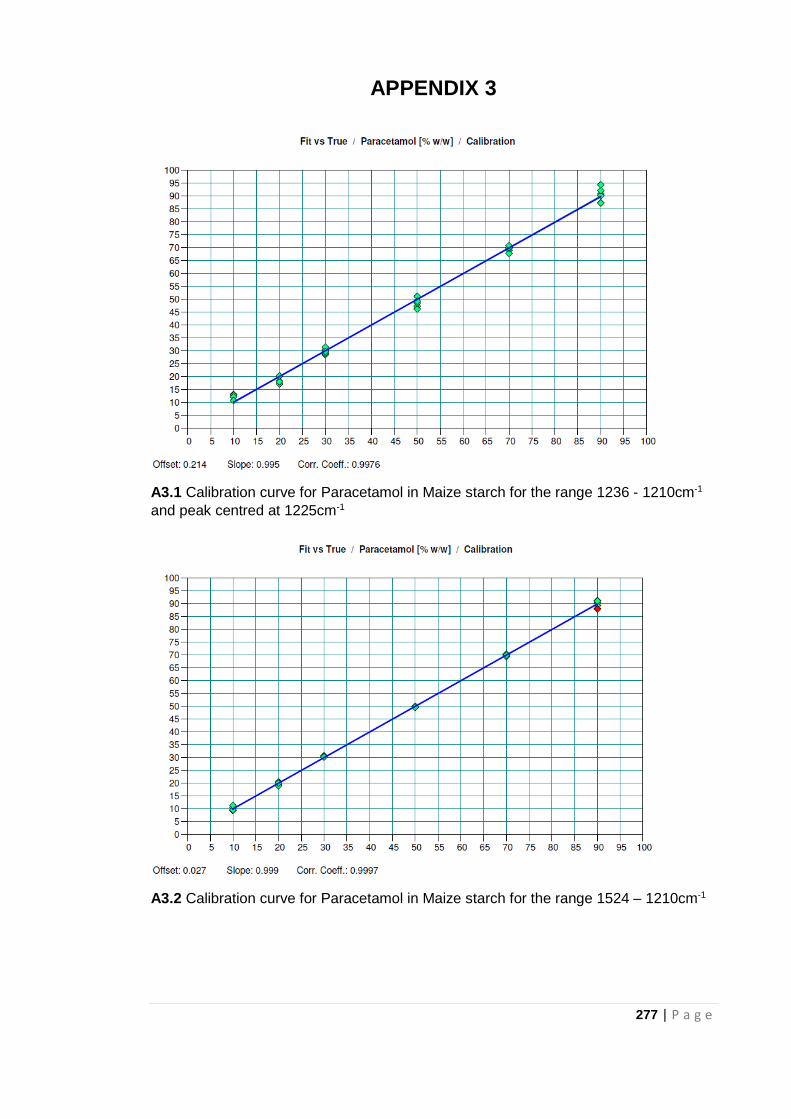
277 | P a g e
APPENDIX 3
A3.1 Calibration curve for Paracetamol in Maize starch for the range 1236 - 1210cm-1
and peak centred at 1225cm-1
A3.2 Calibration curve for Paracetamol in Maize starch for the range 1524 – 1210cm-1
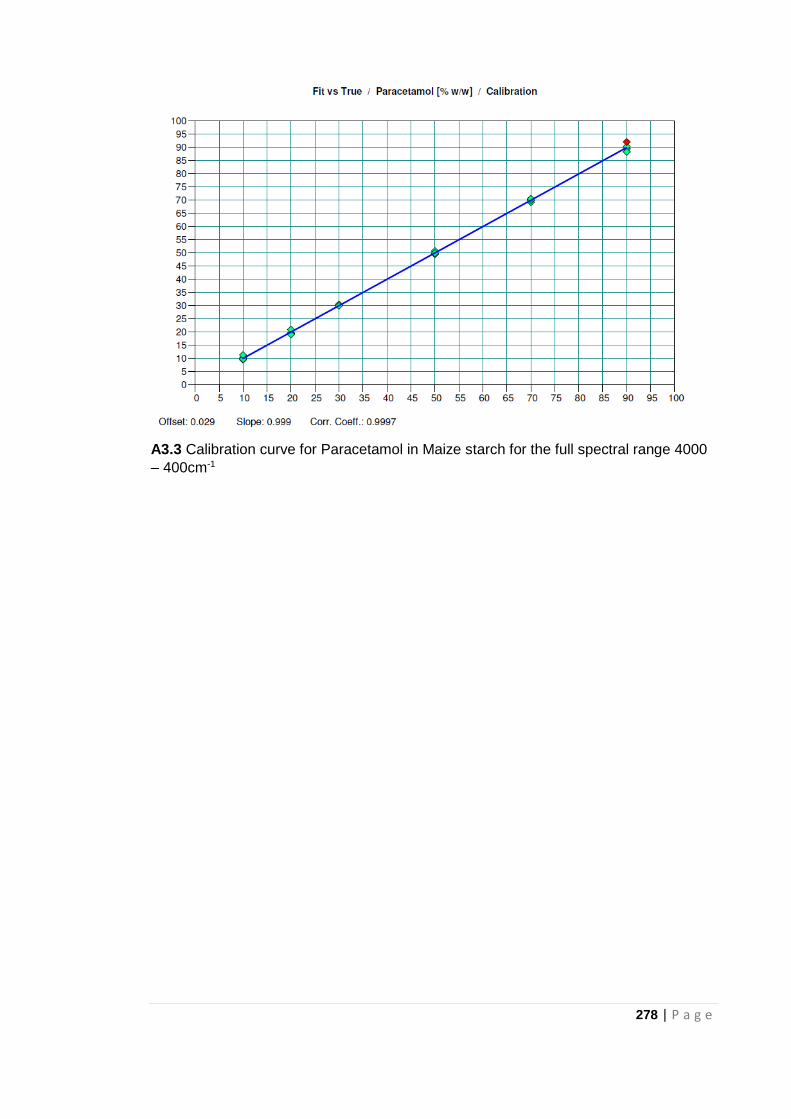
278 | P a g e
A3.3 Calibration curve for Paracetamol in Maize starch for the full spectral range 4000
– 400cm-1