forensics solves the case of the high achieving students
TRANSCRIPT

Forensics Solves the Case of the High
Achieving Students
Developed by:
Michael Weiss, TNLI Fellow
Riviera Middle School
Mail Code 6801
Phone: 305-226-4286
Fax: 305-226-1025
For information concerning IMPACT II opportunities,
Adapter and Disseminator grants, please contact:
The Education Fund
305-892-5099, Ext. 18
e-mail: [email protected]
web site: www.educationfund.org

I. Goals and Objectives
II. Overview
III. Disappearing Skittles
IV. The Guilty Peanut
V. The Fatal Bullet
VI. Frosty the Melting Ice Cube
VII. Eyewitness
VIII. How Long? How Tall?
IX. Human Variations
X. Resources
XI. Adapter Application

Forensics Solves the Case of the High Achieving Students
incorporates teaching strategies that:
Enhance student motivation
Strengthen problem-solving and critical thinking skills
Integrate benchmarks within the eight Science strands of the
Sunshine State Standards
Integrate science with other subject areas
Require students to collect, report, and analyze data and to
then draw conclusions
Apply scientific concepts to real life
Encourage collaboration and teamwork

Benchmarks covered by this unit include:
SC.A.1.3.1 Identifies various ways in which substances differ
(e.g., mass, volume, shape, density, texture, and reaction to
temperature and light).
SC.A.1.3.2 Understands the difference between weight and mass.
SC.A.1.3.3 Knows that temperature measures the average energy
of motion of the particles that make up the substance.
SC.A.1.3.4 Knows that atoms in solids are close together and do
not move around easily; in liquids, atoms tend to move farther
apart; in gas, atoms are quite far apart and move around freely.
SC.A.1.3.5 Knows the difference between a physical change in a
substance (i.e., altering the shape, form, volume, or density) and a
chemical change (i.e., producing new substances with different
characteristics)
SC.A.1.3.6 Knows that equal volumes of different substances may
have different masses.
SC.B.1.3.1 Identifies forms of energy and explains that they can be
measured and compared.
SC.B.1.3.5 Knows the processes by which thermal energy tends to
flow from a system of higher temperature to a system of lower
temperature.
SC.D.1.3.5 Understands concepts of time and size relating to the
interaction of Earth's processes (e.g., lightning striking in a split
second as opposed to the shifting of the Earth's plates altering the
landscape, distance between atoms measured in Angstrom units as
opposed to distance between stars measured in light-years).
SC.F.2.3.2 Knows that the variation in each species is due to the
exchange and interaction of genetic information as it is passed
from parent to offspring.
SC.F.2.3.4 Knows that the fossil record provides evidence that
changes in the kinds of plants and animals in the environment have
been occurring over time.

SC.H.1.3.1 Knows that scientific knowledge is subject to
modification as new information challenges prevailing theories and
as a new theory leads to looking at old observations in a new way.
SC.H.1.3.2 Knows that the study of the events that led scientists to
discoveries can provide information about the inquiry process and
its effects.
SC.H.1.3.4 Knows that accurate record keeping, openness, and
replication are essential to maintaining an investigator's credibility
with other scientists and society.
SC.H.1.3.5 Knows that a change in one or more variables may
alter the outcome of an investigation.
SC.H.1.3.7 Knows that when similar investigations give different
results, the scientific challenge is to verify whether the differences
are significant by further study.
SC.H.2.3.1 Recognizes that patterns exist within and across
systems.
SC.H.3.3.6 Knows that no matter who does science and
mathematics or invents things, or when or where they do it, the
knowledge and technology that result can eventually become
available to everyone.

Action research has shown that the incorporation of forensics
within the middle school science curriculum can greatly enhance
student motivation and acquisition of science concepts. It also
strengthens problem solving and critical thinking skills. Forensics
incorporates key principles of Biology, Chemistry, Earth Science,
and Physics. In order to “solve crimes,” students must be aware of
the scientific principles involved. The ability to be the first to
solve a mystery or to outsmart classmates provides the
reinforcement needed to motivate students toward success. The
continuous application of the scientific method to real-life crime
situations requires students to collect, report, and analyze data and
to then draw conclusions. The problem solving strategies utilized
in this process require students to think logically and critically.
Therefore, as a result, students gain a greater understanding of the
entire scientific process in addition to the myriad of concepts and
principles involved.
The series of lessons described here provides the means of
mastering many prominent middle school science benchmarks
through an inquiry-based investigative approach. When used in
conjunction with activities from other disciplines, such as writing
and reading activities, students are given the opportunity to
integrate real-world applications across the curriculum.

Disappearing Skittles Lab
Benchmarks:
SC.D.1.3.5 Understands concepts of time and size relating to the interaction of Earth's
processes (e.g., lightning striking in a split second as opposed to the shifting of the
Earth's plates altering the landscape, distance between atoms measured in Angstrom units
as opposed to distance between stars measured in light-years).
SC.F.2.3.4 Knows that the fossil record provides evidence that changes in the kinds of
plants and animals in the environment have been occurring over time
SC.H.1.3.2 Knows that the study of the events that led scientists to discoveries can
provide information about the inquiry process and its effects.
SC.H.1.3.4 Knows that accurate record keeping, openness, and replication are essential
to maintaining an investigator's credibility with other scientists and society.
SC.H.2.3.1 Recognizes that patterns exist within and across systems.
SC.H.3.3.6 Knows that no matter who does science and mathematics or invents things, or
when or where they do it, the knowledge and technology that result can eventually
become available to everyone.
Background:
Isotopes of a given element contain the same number of protons and electrons but a
different number of neutrons. Many isotopes are stable but others are not. Those that are
unstable release nuclear particles and energy through a process known as radioactive
decay. Each radioactive isotope decays at a specific rate known as its half-life. One half-
life is defined as the amount of time it takes for one-half of a radioactive isotope to decay.
Half-lives of different radioactive isotopes range from fractions of a second to thousands
of years. For example, the half-life of Carbon-14, a radioactive isotope commonly used
to date fossils, is 5730 years. If an organism contains 12 grams of Carbon-14 when it
dies, 6 grams will remain after 5730 years (one half-life), 3 grams will remain after
11460 years (two half-lives), 1.5 grams will remain after 17190 years (three half-lives)
and so on. By determining what percentage of the original Carbon-14 still remains,
scientists are able to approximate the age of many fossils.
Forensics Scenerio:
While digging, a construction crew unearthed some remains of a human skeleton.
Scientists were able to determine that only 20% of a certain radioactive isotope with a
half-life of ten years was still present. In order to try to determine who the remains
belong to, it is necessary to determine an approximate time of death. Through this
activity, students will determine approximately how many years it would take for 80% of
this isotope to decay and thus provide valuable information as to approximately what
year the death occurred.

Materials:
Skittles (M & Ms may be substituted)
Paper Cups
Napkins
Graph paper
Procedure:
1. Distribute cups filled with skittles and paper towels to each lab group.
2. Have students count the number of skittles they were give and record this value in
their data tables under 0 half-lives.
3. Have students return all skittles to their cups and then pour them out onto a paper
towel.
4. Instruct students to count only those skittles that have an “s” facing up (these
represent skittles that have not decayed) and record this number in their data tables
under 1 half-life.
5. Have students “dispose” of all skittles in which the “s” was facing down (these
represent skittles that have decayed).
6. Repeat steps 3-5 for 2, 3, 4, and 5 half-lives.
Data Table:
# of half-lives # of remaining Skittles
0
1
2
3
4
5
Graph:
Using the data they have collected, students should produce a graph which contains the #
of half-lives on the x-axis and the # of remaining skittles on the y-axis.
Calculation:
Based on each half-life representing 10 years, students should use their graphs to
determine approximately how old a hypothetical fossil that has undergone 80% decay
would be.
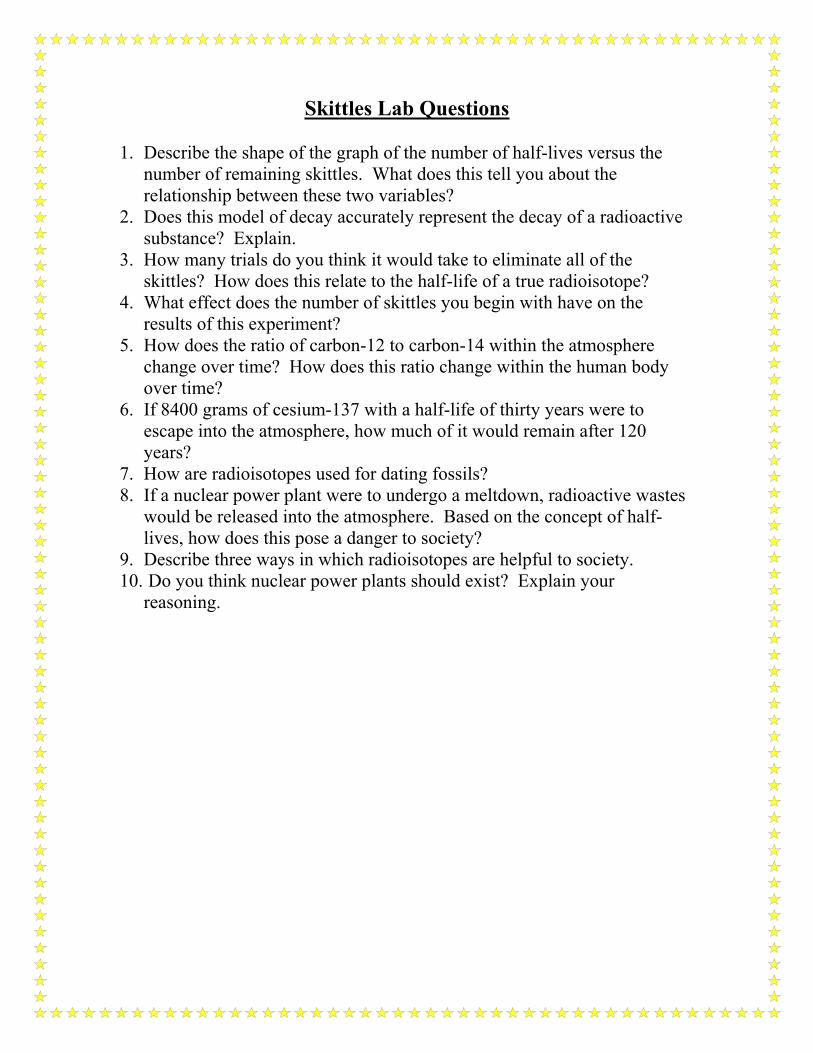
Skittles Lab Questions
1. Describe the shape of the graph of the number of half-lives versus the
number of remaining skittles. What does this tell you about the
relationship between these two variables?
2. Does this model of decay accurately represent the decay of a radioactive
substance? Explain.
3. How many trials do you think it would take to eliminate all of the
skittles? How does this relate to the half-life of a true radioisotope?
4. What effect does the number of skittles you begin with have on the
results of this experiment?
5. How does the ratio of carbon-12 to carbon-14 within the atmosphere
change over time? How does this ratio change within the human body
over time?
6. If 8400 grams of cesium-137 with a half-life of thirty years were to
escape into the atmosphere, how much of it would remain after 120
years?
7. How are radioisotopes used for dating fossils?
8. If a nuclear power plant were to undergo a meltdown, radioactive wastes
would be released into the atmosphere. Based on the concept of half-
lives, how does this pose a danger to society?
9. Describe three ways in which radioisotopes are helpful to society.
10. Do you think nuclear power plants should exist? Explain your
reasoning.

The Guilty Peanut
Benchmarks:
SC.A.1.3.1 Identifies various ways in which substances differ (e.g., mass, volume, shape,
density, texture, and reaction to temperature and light).
SC.A.1.3.2 Understands the difference between weight and mass.
SC.A.1.3.6 Knows that equal volumes of different substances may have different masses.
SC.H.1.3.1 Knows that scientific knowledge is subject to modification as new
information challenges prevailing theories and as a new theory leads to looking at old
observations in a new way.
SC.H.1.3.2 Knows that the study of the events that led scientists to discoveries can
provide information about the inquiry process and its effects.
SC.H.1.3.4 Knows that accurate record keeping, openness, and replication are essential
to maintaining an investigator's credibility with other scientists and society.
Background:
When performing experiments, scientists make both qualitative and quantitative
observations. Qualitative observations describe characteristics or properties of
substances without using numbers. Quantitative observations use measurements to
provide numerical data. To completely describe a substance, a combination of both
qualitative and quantitative observations should be used.
Forensics Connection:
Accuracy of descriptions is instrumental to forensics investigations. A series of many
observations and measurements is often necessary to identify a specific substance beyond
reproach. In this exercise, students will be exposed to a variety of ways of describing and
isolating a specific peanut from an assortment of peanuts.
Materials:
Peanuts
Bowls
Balance
Ruler
Hand lens
String

Procedure:
1. Form lab groups.
2. Pick up a bowl of peanuts and any other materials your group feels are necessary for
describing a peanut in as much detail as possible.
3. Decide on a single peanut to describe.
4. Construct a data table that includes sections for qualitative and quantitative
observations.
5. Provide as many qualitative and quantitative observations as you can for the peanut
your group has chosen on the data table.
6. Place your group’s peanut back in the bowl and mix up the peanuts.
7. Find the peanut using the descriptions your group has listed. If your group has any
difficulty finding the peanut, try to provide some additional clues.
8. Repeat step 7 until your group can identify its peanut without difficulty.
9. Exchange your group’s peanuts and clues with other groups.
10. Try to identify each group’s peanut with the fewest possible number of guesses and
have each other group do the same with your group’s peanuts.
11. Record the number of guesses needed for your group to identify each other group’s
peanut and for each other group to identify your group’s peanut.

The Guilty Peanut Lab Questions
1. Distinguish between qualitative and quantitative observations. Provide two
examples of each.
2. Using a Venn diagram, compare and contrast the clues your group provided with
the clues your group was provided with? Which set was better? Why?
3. How many guesses did the group(s) you gave your bowl of peanuts to make
before selecting the correct peanut? How many guesses did your group make?
What made your task as simple or as difficult as it was?
4. What was the best clue your group either provided or received? Explain.
5. What was the worst clue your group either provided or received? Explain.
6. In general, did you find the qualitative or quantitative observations to be more
useful? Explain.
7. If you were asked to repeat this experiment, what would you do differently? How
do you think these changes will influence your results?
8. In order to determine the density of an object, you need to divide its mass by its
volume? How might you determine the volume of an irregularly-shaped object
such as a peanut?
9. Describe the process your group used to locate the peanut you were asked to find.
10. Explain why accurate measuring and record keeping are so important to the
scientific process. Provide an example from this investigation.
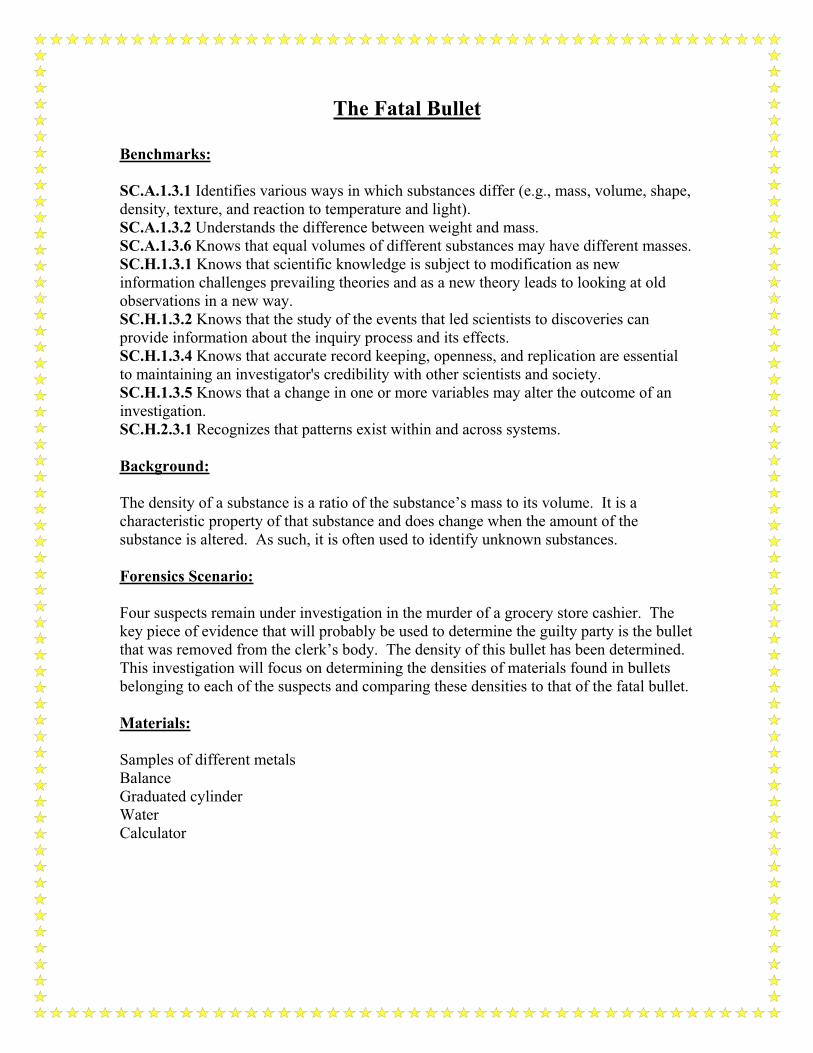
The Fatal Bullet
Benchmarks:
SC.A.1.3.1 Identifies various ways in which substances differ (e.g., mass, volume, shape,
density, texture, and reaction to temperature and light).
SC.A.1.3.2 Understands the difference between weight and mass.
SC.A.1.3.6 Knows that equal volumes of different substances may have different masses.
SC.H.1.3.1 Knows that scientific knowledge is subject to modification as new
information challenges prevailing theories and as a new theory leads to looking at old
observations in a new way.
SC.H.1.3.2 Knows that the study of the events that led scientists to discoveries can
provide information about the inquiry process and its effects.
SC.H.1.3.4 Knows that accurate record keeping, openness, and replication are essential
to maintaining an investigator's credibility with other scientists and society.
SC.H.1.3.5 Knows that a change in one or more variables may alter the outcome of an
investigation.
SC.H.2.3.1 Recognizes that patterns exist within and across systems.
Background:
The density of a substance is a ratio of the substance’s mass to its volume. It is a
characteristic property of that substance and does change when the amount of the
substance is altered. As such, it is often used to identify unknown substances.
Forensics Scenario:
Four suspects remain under investigation in the murder of a grocery store cashier. The
key piece of evidence that will probably be used to determine the guilty party is the bullet
that was removed from the clerk’s body. The density of this bullet has been determined.
This investigation will focus on determining the densities of materials found in bullets
belonging to each of the suspects and comparing these densities to that of the fatal bullet.
Materials:
Samples of different metals
Balance
Graduated cylinder
Water
Calculator

Procedure:
If students have been instructed in determining the mass of a substance with a balance
and determining the volume of a solid by water displacement, this may be used as an
inquiry-based lab in which students will determine the procedure to be used to determine
the density of each sample. If not, the students should be told to first measure the mass of
each sample. Next, they should fill a graduated cylinder with a specific amount of water,
add each sample to the water one-by-one, and measure the increase in volume caused by
each sample. Finally, they should divide the mass of each sample by its volume to
determine its density.
Conclusion:
The teacher should provide the density of one of the metals sampled by the students,
claiming it was the material found within the fatal bullet. After obtaining this
information, students should analyze their data to draw conclusions as to which metal is
found within the fatal bullet.

Fatal Bullet Lab Questions
1. Is density a physical or chemical property? Explain.
2. Does the density of a sample depend on the amount of the sample that is present?
Explain.
3. If three liquids with different densities are mixed together, what will happen?
Why?
4. How can the density of an irregularly-shaped solid be determined? What
materials would you need in order to do so?
5. What determines whether an object will sink or float when dropped into a liquid?
6. Suppose an 8.0 g object occupies a volume of 10.0 ml. What is its density? Will
it float or sink when placed in a beaker of water?
7. An object has a density of 2.5 g/ml and occupies a volume of 15 ml. What is its
mass?
8. An object has a density of 4.0 g/ml and a mass of 14 g. What volume does it
occupy?
9. Explain how the density of an unknown substance can be useful in identifying it?
10. How does the density of a soccer ball compare to the density of a bowling ball?
Explain.

The Case of Frosty the Melting Ice Cube
Benchmarks:
SC.A.1.3.1 Identifies various ways in which substances differ (e.g., mass, volume, shape,
density, texture, and reaction to temperature and light).
SC.A.1.3.3 Knows that temperature measures the average energy of motion of the
particles that make up the substance.
SC.A.1.3.4 Knows that atoms in solids are close together and do not move around easily;
in liquids, atoms tend to move farther apart; in gas, atoms are quite far apart and move
around freely.
SC.A.1.3.5 Knows the difference between a physical change in a substance (i.e., altering
the shape, form, volume, or density) and a chemical change (i.e., producing new
substances with different characteristics)
SC.B.1.3.1 Identifies forms of energy and explains that they can be measured and
compared.
SC.B.1.3.5 Knows the processes by which thermal energy tends to flow from a system of
higher temperature to a system of lower temperature.
SC.H.1.3.4 Knows that accurate record keeping, openness, and replication are essential
to maintaining an investigator's credibility with other scientists and society.
SC.H.1.3.5 Knows that a change in one or more variables may alter the outcome of an
investigation.
SC.H.2.3.1 Recognizes that patterns exist within and across systems.
Background:
In forensics, rates at which various processes occur are often utilized to pinpoint the time
of a specific occurrence. For instance, the rate of decay of Carbon-14 is often used to
date fossils. In this inquiry-based activity, students will be provided with the challenge of
determining the rate at which ice melts under certain conditions and extrapolating their
data to determine the actual time when the melting process began. During their
investigations, they will become aware of how the introduction of more than one variable
can affect their results.
Forensics scenario:
Frosty the Ice Cube lies melting in the beaker at your lab station. There were no
eyewitnesses as to who removed Frosty from the freezer, but there are several suspects.
All of the suspects have alibis but each alibi is for a different time. In order to figure out
which suspect left Frosty to melt, the time at which Frosty was first placed into the
beaker must be determined. The only tools you have at your disposal are a beaker, a
funnel, a graduated cylinder, and a stopwatch. It is up to you to solve “The Case of
Frosty the Melting Ice Cube” and put the culprit to justice.

Materials:
Beakers
Funnel
Graduated cylinder
Stopwatch
Ice
Teacher Preparation:
In order to prepare for this activity, the teacher should remove ice cubes from a freezer or
cooler and place them in beakers at a time when the students are not able to witness it.
These beakers of ice should then be stored in a setting as similar to the classroom setting
in which the experiment will take place as possible until needed
.
Procedure:
As a true inquiry-based lab activity, students will devise their own method of determining
when the ice provided by the teacher began melting.
If clues are needed, the teacher may suggest a way to measure the rate at which the ice is
melting and inform students how to use this information to determine when the melting
process actually began.
Data:
Students will construct their own data tables to display the data they collect.
Adapted from: www.sciencenetlinks.com

Frosty the Melting Ice Cube Lab Questions
1. The rate at which ice melts can be determined by measuring the volume of water
formed over time. According to your lab group, at what rate did the ice melt? (Be
sure to include the proper units with your answer.)
2. Identify the independent and dependent variables in this experiment. Which one is
graphed on the x-axis? Which one is graphed on the y-axis? What will the slope of
such a graph indicate?
3. Identify three constants from this experiment.
4. What volume should you start with at the origin of your graph? Why?
5. Graph your data. Be certain to label your axes.
6. What point on the graph identifies the time when the ice started to melt? Extrapolate
to determine when this occurred?
7. Describe the shape of your graph. What does this tell you about the relationship
between time and the volume of water?
8. What external factors may alter the rate at which ice melts? Were any of these
present while this experiment was being conducted?
9. Is the melting of ice a physical or chemical change? How do you know?
10. How does the volume of ice compare to the volume of water formed when it melts?
11. Carbon-14 is a radioactive isotope of carbon which is found in living things and
begins to decay when organisms die. How can the rate at which carbon-14 decays be
used to date fossils?

“Eyewitness”
Benchmarks:
SC.H.1.3.4 Knows that accurate record keeping, openness, and replication are essential
to maintaining an investigator's credibility with other scientists and society.
SC.H.1.3.7 Knows that when similar investigations give different results, the scientific
challenge is to verify whether the differences are significant by further study.
Background:
Observations are data are crucial to the experimentation process in science. When
performing an experiment, a scientist must be able to record accurate data and
observations that are capable of being replicated by other scientists. In this way,
conclusions can eventually become scientific theories and laws.
This activity is designed to expose students to the challenge making accurate
observations as they realize the importance of doing so.
Forensics Scenario:
The students are bystanders going about their daily routines when a crime is committed in
front of their eyes. They must do what it takes to accurately recollect the facts of the
crimes which have been committed before them for there to be any chance of prosecuting
the offenders.
Materials:
Costumes
Props
Crime descriptions
Notepads
Pencils
Teacher Preparation:
The teacher should prepare several crime scenarios in writing and assemble various props
and costumes. He/she should randomly distribute these scenarios to groups of students
allow them some time to brainstorm and assemble props and costumes before acting out
the scenarios.
Conversely, if the teacher prefers, students can write and then act out their own scenarios
instead of scenarios constructed by the teacher.

Procedure:
Groups of students should take turns acting out the scenarios. While each scenario is
being acted out, all students who are not part of the skit should be asked to observe and
do what is necessary to remember as many details as possible. The following day, after
all groups have acted out their scenarios, each student should be independently quizzed
on what details he or she remembers. Following this, individual details should be
compared and analyzed.

“Eyewitness” Activity Questions
1. How accurate was your group’s data? How do you account for this?
2. How did your group’s data compare with other groups’ data? Account for any
differences.
3. Which observation was the most difficult to remember accurately? What made it
so difficult to remember?
4. Why is it so important for a scientist to record observations as they occur?
5. Why is it often difficult for witnesses of crimes to provide details of those crimes?

How Long? How Tall?
Florida Sunshine State Standard Benchmark: SC.H.1.4.1 - Knows that
investigations are conducted to explore new phenomena, to check on previous
results, to test how well a theory predicts, and to compare different theories.
Overview:
The locations and sizes of adult human body parts are based upon
certain measurements and relationships. Various body parts, such as
arms, legs, and ears, are not only symmetrical to one another but are equal
in size as well. Other body measurements are approximately equal in size
as well,
such as the distances between one’s wrist and elbow, one’s elbow and shoulder,
one’s heel and big toe, and the distance around one’s closed fist. One’s wing span
(the straight-line distance from longest fingertip to longest fingertip of one’s
horizontally outstretched arms) is also a good estimate of his or her height. Other
body measurements, while not being equal in size, are directly proportional to one
another. This includes a relationship between head length and height.
The purpose of this investigation is to:
measure wing span and various bone lengths.
make inferences concerning correlations between
those measurements and height.
design experiments to test those inferences.
perform these experiments.
compare results to those of other investigators,
to draw and express scientific conclusions based upon experimental results.
Time Frame: 1 hour
Materials:
Measuring tapes
Pens or pencils
Calculators
Data tables

Procedure:
TEACHER PREPARATION:Gather materials.
Appoint lab groups.
Assign roles to lab group members.
Student Procedures:
1. Working in groups of four or five, collect the following
information from each member of the lab group and record
measurements in the following data table.
Data Table
Name
Height
(cm)
Wing Span
(cm)
Length of
Humerus
(cm)
Length of
Radius
(cm)
Length of
Femur
(cm)
Length of
Tibia
(cm)
2. Share your data with another group. Record their findings on the data table
above.

DATA ANALYSIS
Using the information your lab group has collected, answer the following
questions by making inferences based upon your data. An inference will provide
for the development of statements that may guide further study.
Questions:
Often, when various people are asked to determine a person’s height, there
is some variation in the measurements they attain. What are some potential
reasons for this variation?
Is there a relationship between bone length and height?
Does age affect any potential relationship between bone length and height?
Does gender affect any potential relationship between bone length and
height?
Does any particular bone measurement provide greater insight into a
person’s actual height? If so, which one?
Do you think the length of a certain body part or bone other than the ones
studied here might provide greater insight into a person’s actual height? If
so, which body part(s)?
Can an activity such as this be utilized within the field of forensic medicine?
If so, how?
Assessment:
1. Assess the answers to the previous questions using a rubric such as one of the
samples found in the appendix.
2. Use the questions to stimulate further discussion on possible relationships
among body parts.
3. Design and conduct an experiment in order to explore possible body
relationships as a means of testing one or more of your group’s inferences.
4. Draw conclusions.
5. Evaluate the lab reports using a rubric such as one of the samples found in the
appendix.
Home Learning:
Students will produce a lab report for assessment.
Extensions:
1. Make additional inferences and test them.

2. Construct a class data table and compare and contrast class data with
individual group data. Explain any differences.
3. Use group and/or class data to determine any mathematical relationships
between height and wing span/bone length.
4. Use a graphing calculator to graph group and/or class data relating height
to bone length. Determine best-fit equations, and compare these
equations to the following:
Male Height (cm) Female Height (cm)
3.2 (length of humerus) + 67
3.6 (length of radius) + 81
2.3 (length of femur) + 64
2.4 (length of tibia) + 83
3.3 (length of humerus) + 60
4.2 (length of radius) + 62
2.4 (length of femur) + 64
2.7 (length of tibia) + 67
Developed by the Division of Mathematics and Science Education


HUMAN VARIATIONS
Florida Sunshine State Standards Benchmark: SC.F.2.3.2 – The student knows
that the variation in each species is due to the exchange and interaction of genetic
information as it is passed from parent to offspring.
Background Information:
Have you ever wondered why everybody looks different from everyone else? Even
brothers and sisters can look different. This is because a large variety of traits
exist in the human population. Perhaps this still doesn't explain why brothers and
sisters might look very different on the contrary, or, very much alike. This lab
exercise will help your students understand the many possible combinations
available to offspring as they are being produced. Each student will pair off with a
peer to become parents and produce a baby. What the baby will look like will
depend on the laws of genetics. In this activity students will determine the
appearance of their child's face by flipping coins to determine the pairing of the
alleles for each of the major characteristics.
Time Frame: 90-120 minutes
Materials:
Curling Ribbon (black, brown, yellow) for hair
Paper plates
Scissors
Student Procedures:
1. Choose a partner for this experiment.
2. Determine with your partner who will be the father and the mother.
3. Each of you received a coin. The head side is the dominant side; and the tail
side is the recessive side.
4. The father will flip the coin to determine the sex of the child. Heads
indicates the child will be a boy; tails, a girl.
2 coins
2 students
Construction paper for face features
Colored pencils or markers
Crayons (skin color set)

5. You and your partner will flip your coin at the same time, to determine which
of the traits below pertain to your baby. Two heads indicate a homozygous
dominant trait. A head and a tail equal a heterozygous dominant trait. Two
tails represents a recessive trait.
6. Record the results for the two babies on the table provided.
7. Once the chart is completed, create a 3-dimensional representing the
collected characteristics of the offspring using a paper plate and
other materials provided by your teacher. Note: Be sure to cut the
paper plate into the actual shape of the face and chin.


www3.open.uoguelph.ca/.../cwork/ unit4/genes_do_6.html

Child #
1
Child #
2
Tra
itPo
ssib
le
Gen
otyp
es
Fat
her
's
Gen
es
Mot
her
's
Gen
es
Child's
Gen
otyp
e--
Child’s
Phen
otyp
e
Fat
her
's
Gen
es
Mot
her
's
Gen
es
Child's
Gen
otyp
e
Child’s
Phen
otyp
e
Sex
----
----
---
--
----
----
--
--
----
----
-
---
----
----
---
-
face
shap
e A
A,A
a,aa
----
----
---
-
----
----
--
--
----
----
-
---
----
----
---
-
chin
siz
e B
B,B
b.b
b--
----
----
-
-
----
----
--
--
----
----
-
---
----
----
---
-
hai
r co
lor
CHC
H
CH
CT
CT
CT
----
----
---
-
----
----
--
--
----
----
-
---
----
----
---
-
hai
r ty
pe
DHD
H
DH
DT
DT
DT
----
----
---
-
----
----
--
--
----
----
-
---
----
----
---
-
wid
ow's
peak
EE
,Ee,
ee--
----
----
-
-
----
----
--
--
----
----
-
---
----
----
---
-
eye
colo
r F
F,F
f,ff
----
----
---
-
----
----
--
--
----
----
-
---
----
----
---
-
eye
dis
tanc
e
GHG
H
GH
GT
GT
GT
----
----
---
-
----
----
--
--
----
----
-
---
----
----
---
-

Tra
itPo
ssib
le
Gen
otyp
es
Fat
her
's
Gen
es
Mot
her
's
Gen
es
Child's
Gen
otyp
e-
-
Child’s
Phen
otyp
e
Fat
her
's
Gen
es
Mot
her
's
Gen
es
Child's
Gen
otyp
e
Child’s
Phen
otyp
e
eye
size
HHH
H
HH
HT
HT
HT
eye
shap
e II
,Ii,ii
----
----
---
-
----
----
---
-
----
----
---
---
----
----
--
eye
slan
ted-
ness
JJ
,Jj,
jj--
----
----
-
-
----
----
---
-
----
----
---
---
----
----
--
eyel
ashes
KK
,Kk,
kk--
----
----
-
-
----
----
---
-
----
----
---
---
----
----
--
eyeb
row
colo
r
L HL H
L HL T
L TL T
----
----
---
-
----
----
---
-
----
----
---
---
----
----
--
eyeb
row
thic
knes
sM
M,M
m,m
m--
----
----
-
-
----
----
---
-
----
----
---
---
----
----
--
eyeb
row
leng
thN
N,N
n,nn
--
----
----
-
-
----
----
---
-
----
----
---
---
----
----
--
mou
th s
ize
OHO
H
OH
OT
OT
OT
----
----
---
-
----
----
---
-
----
----
---
---
----
----
--
Tra
itG
ene
Fat
her
's
Gen
es
Mot
her
's
Gen
es
Child’s
Gen
otyp
e
Child’s
Phen
otyp
e
Fat
her
's
Gen
es
Mot
her
's
Gen
esC
hild’s
Gen
otyp
e
Child’s
Phen
otyp
e
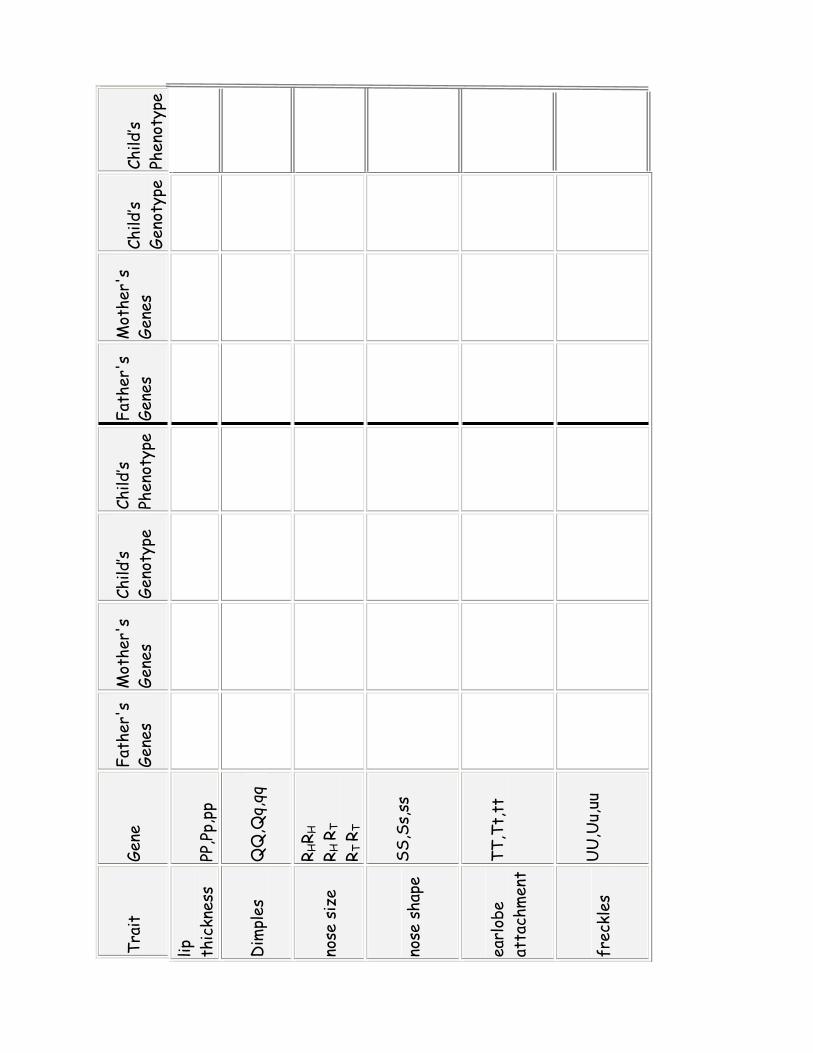
lip
thic
knes
sPP
,Pp,
pp
Dim
ples
,Qq,
nose
siz
e
RHR
H
RH
RT
RT
RT
----
----
---
---
----
----
----
----
----
-
---
----
----
--
nose
shap
e S
S,S
s,ss
----
----
---
---
----
----
----
----
----
-
---
----
----
--
earl
obe
atta
chm
ent
TT
,Tt,
tt--
----
--
----
----
----
----
----
----
---
-
----
----
----
----
----
----
frec
kles
U
U,U
u,uu
--
----
----
-
---
----
----
----
----
----
-
---
----
----
--
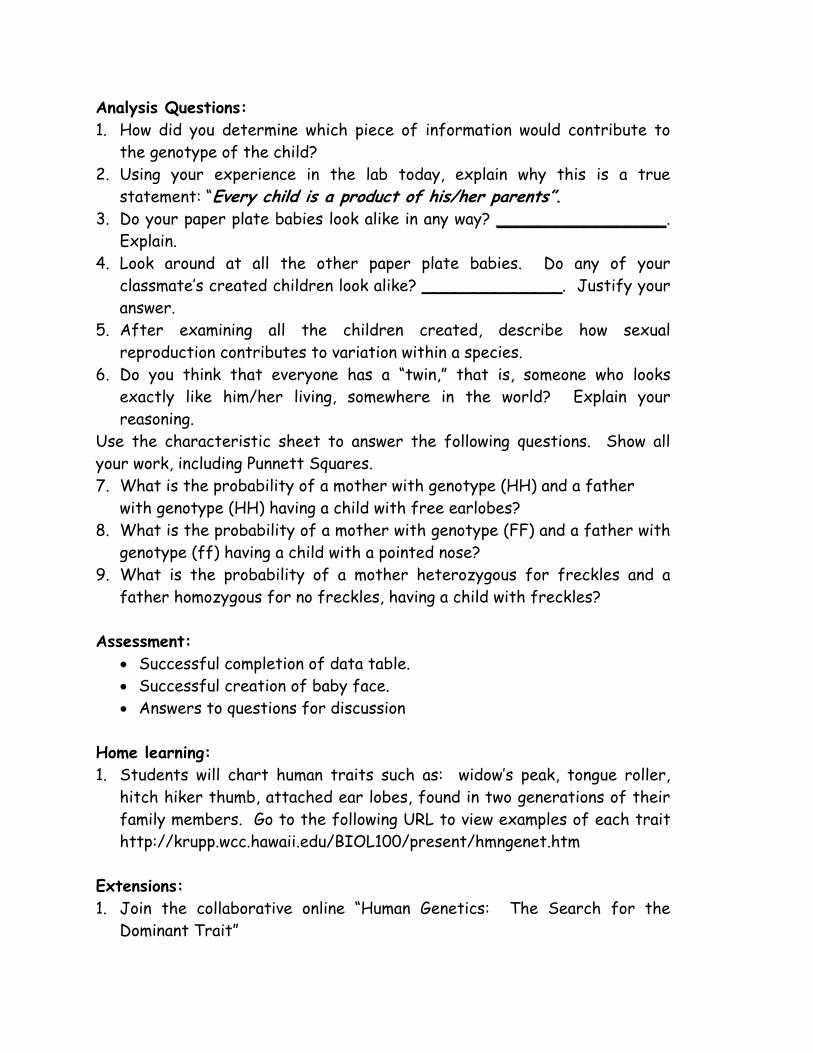
Analysis Questions:
1. How did you determine which piece of information would contribute to
the genotype of the child?
2. Using your experience in the lab today, explain why this is a true
statement: “Every child is a product of his/her parents”.3. Do your paper plate babies look alike in any way? _________________.
Explain.
4. Look around at all the other paper plate babies. Do any of your
classmate’s created children look alike? ______________. Justify your
answer.
5. After examining all the children created, describe how sexual
reproduction contributes to variation within a species.
6. Do you think that everyone has a “twin,” that is, someone who looks
exactly like him/her living, somewhere in the world? Explain your
reasoning.
Use the characteristic sheet to answer the following questions. Show all
your work, including Punnett Squares.
7. What is the probability of a mother with genotype (HH) and a father
with genotype (HH) having a child with free earlobes?
8. What is the probability of a mother with genotype (FF) and a father with
genotype (ff) having a child with a pointed nose?
9. What is the probability of a mother heterozygous for freckles and a
father homozygous for no freckles, having a child with freckles?
Assessment:
Successful completion of data table.
Successful creation of baby face.
Answers to questions for discussion
Home learning:
1. Students will chart human traits such as: widow’s peak, tongue roller,
hitch hiker thumb, attached ear lobes, found in two generations of their
family members. Go to the following URL to view examples of each trait
http://krupp.wcc.hawaii.edu/BIOL100/present/hmngenet.htm
Extensions:
1. Join the collaborative online “Human Genetics: The Search for the
Dominant Trait”

http://k12science.ati.stevens-
tech.edu/curriculum/genproj/teacher_guide.html
2. Research genetic diseases such as Tay Sachs, Sickle-cell anemia, or
Cystic Fibrosis.
3. Create a pedigree chart for your family of one characteristic such as
attached/unattached ear lobes, tongue roller/tongue non-roller, hair/no
hair on knuckles.
Developed by the Division of Mathematics and Science Education

Resources
Recommended Book
Walker, P., & Wood, E. (1998). Crime Scene Investigations: Real-life
Science Labs for Grades 6-12. San Francisco, CA: John Wiley & Sons, Inc.
Some Websites with Forensics Activities
http://www.courttv.com/forensics_curriculum/
http://school.discovery.com/lessonplans/forensics.html
http://www.geocities.com/Athens/Atrium/5924/forensicscienceactivites.htm
http://www97.intel.com/en/ProjectDesign/UnitPlanIndex/Forensics/SR_Unit
Plans4.htm
http://www.teachersfirst.com/lessons/forensics/finger-lesn.html
http://library.thinkquest.org/04oct/00206/lesson.htm
http://www.pbs.org/wnet/secrets/lessons/lp_gangland.html
http://www.sciencefriday.com/kids/sfkc20030411-1.html
http://www.kumc.edu/gec/
http://www.edheads.org/activities/crash%5Fscene/
Supplementary Materials
A wide variety of supplementary materials, including kits, books,
audiovisual materials, and computer software are readily available from
numerous science supply companies.