foresee results acsi automotive index
TRANSCRIPT
Online Customer Satisfaction: Driving Loyalty and Sales in the Automotive Industry
by Larry FreedPresident and CEO, ForeSee Results
© 2008 ForeSee Results
ForeSee Results 2008 Automotive Website Satisfaction Index
www.ForeSeeResults.com 2
Introducing the ForeSee Results Automotive Website Satisfaction Index
Automotive manufacturers continue to struggle with the role of the website in their organizations. Even as retailers, banks, investment firms, utilities and a host of other types of businesses have moved operations online, it’s clear that most consumers still need to go to a dealership in person and test drive a car before making a purchase decision.
However, consumers are doing more and more research online, and the website remains a critical marketing channel for any auto manufacturer hoping to attract new customers and engage and re-tain current customers. Auto manufacturers are looking for any advantage in the current declining economy, and a strategic, customer-centric website is a major competitive differentiator.
But how can we tell which automotive websites are doing the best job encouraging customers to buy their vehicles? Customer satisfaction, when measured using the proven and scientific methodology of the University of Michigan’s American Customer Satisfaction Index (ACSI), provides a performance metric of how well automotive websites perform today, and how effectively they influence consum-ers’ purchase behavior and brand loyalty tomorrow.
Therefore, ForeSee Results is launching the Automotive Website Satisfaction Index, a study of cus-tomer satisfaction with the leading automotive websites. By applying the ACSI methodology to auto websites, we can determine:
• Customer satisfaction with each company’s website • Customer satisfaction with aspects of the online experience, including vehicle descriptions, im-
ages and navigation, that drive overall website satisfaction • The effectiveness of the web in encouraging consumers to visit a dealer and purchase, among
other desired future behaviors Customer satisfaction with six major auto websites was measured: Chevrolet, Chrysler, Ford, Honda, Nissan and Toyota.
Key Findings
• Honda has the highest web satisfaction of all measured automotive companies, resulting in the highest likelihood that customers will buy a vehicle
• Nissan provides the least satisfying web experience for online shoppers • In aggregate, automotive websites add value to a company’s marketing initiatives by increasing
consumers’ likelihood to purchase
ForeSee Results 2008 Automotive Website Satisfaction Index
www.ForeSeeResults.com 3
Honda Tops Web Satisfaction Rankings
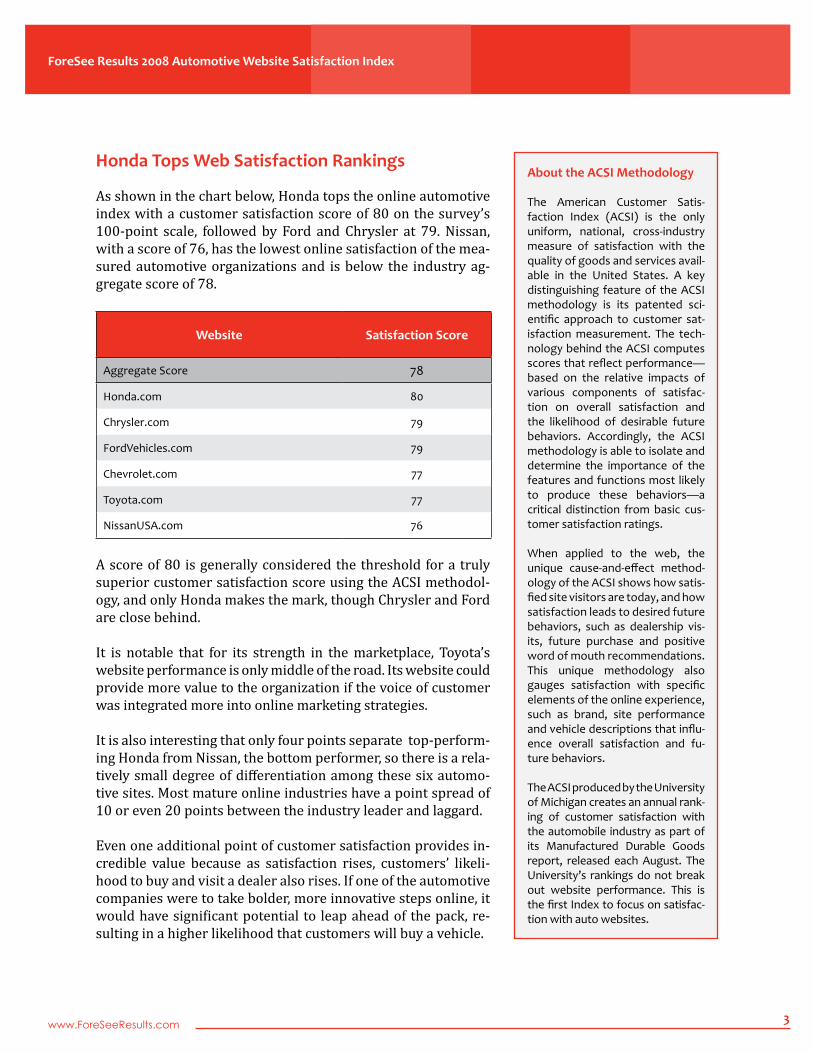
As shown in the chart below, Honda tops the online automotive index with a customer satisfaction score of 80 on the survey’s 100-point scale, followed by Ford and Chrysler at 79. Nissan, with a score of 76, has the lowest online satisfaction of the mea-sured automotive organizations and is below the industry ag-gregate score of 78.
Website Satisfaction Score
Aggregate Score 78
Honda.com 80
Chrysler.com 79
FordVehicles.com 79
Chevrolet.com 77
Toyota.com 77
NissanUSA.com 76
A score of 80 is generally considered the threshold for a truly superior customer satisfaction score using the ACSI methodol-ogy, and only Honda makes the mark, though Chrysler and Ford are close behind.
It is notable that for its strength in the marketplace, Toyota’s website performance is only middle of the road. Its website could provide more value to the organization if the voice of customer was integrated more into online marketing strategies.
It is also interesting that only four points separate top-perform-ing Honda from Nissan, the bottom performer, so there is a rela-tively small degree of differentiation among these six automo-tive sites. Most mature online industries have a point spread of 10 or even 20 points between the industry leader and laggard.
Even one additional point of customer satisfaction provides in-credible value because as satisfaction rises, customers’ likeli-hood to buy and visit a dealer also rises. If one of the automotive companies were to take bolder, more innovative steps online, it would have significant potential to leap ahead of the pack, re-sulting in a higher likelihood that customers will buy a vehicle.
About the ACSI Methodology
The American Customer Satis-faction Index (ACSI) is the only uniform, national, cross-industry measure of satisfaction with the quality of goods and services avail-able in the United States. A key distinguishing feature of the ACSI methodology is its patented sci-entific approach to customer sat-isfaction measurement. The tech-nology behind the ACSI computes scores that reflect performance—based on the relative impacts of various components of satisfac-tion on overall satisfaction and the likelihood of desirable future behaviors. Accordingly, the ACSI methodology is able to isolate and determine the importance of the features and functions most likely to produce these behaviors—a critical distinction from basic cus-tomer satisfaction ratings.
When applied to the web, the unique cause-and-effect method-ology of the ACSI shows how satis-fied site visitors are today, and how satisfaction leads to desired future behaviors, such as dealership vis-its, future purchase and positive word of mouth recommendations. This unique methodology also gauges satisfaction with specific elements of the online experience, such as brand, site performance and vehicle descriptions that influ-ence overall satisfaction and fu-ture behaviors.
The ACSI produced by the University of Michigan creates an annual rank-ing of customer satisfaction with the automobile industry as part of its Manufactured Durable Goods report, released each August. The University’s rankings do not break out website performance. This is the first Index to focus on satisfac-tion with auto websites.
ForeSee Results 2008 Automotive Website Satisfaction Index
www.ForeSeeResults.com 4
How Satisfaction Influences Purchase Intent
What good is high satisfaction unless it has a proven impact on customers’ likelihood to buy a vehicle, recommend a certain website or visit a dealership? And why should a company put resources into increasing satisfaction unless there is a demonstrable payoff? The ACSI methodology used to conduct this study recognizes that satisfaction itself is not the desired end result.
The numbers produced by the ACSI methodology are more than just satisfaction scores for each of these companies. They can actually be used to predict, and even alter, specific future behaviors of customers. For this reason, the ACSI methodology is the one we chose to conduct this study. When au-tomotive companies can measure the impact of their website on offline behaviors, it becomes much easier to determine return on investment and to allocate resources effectively.
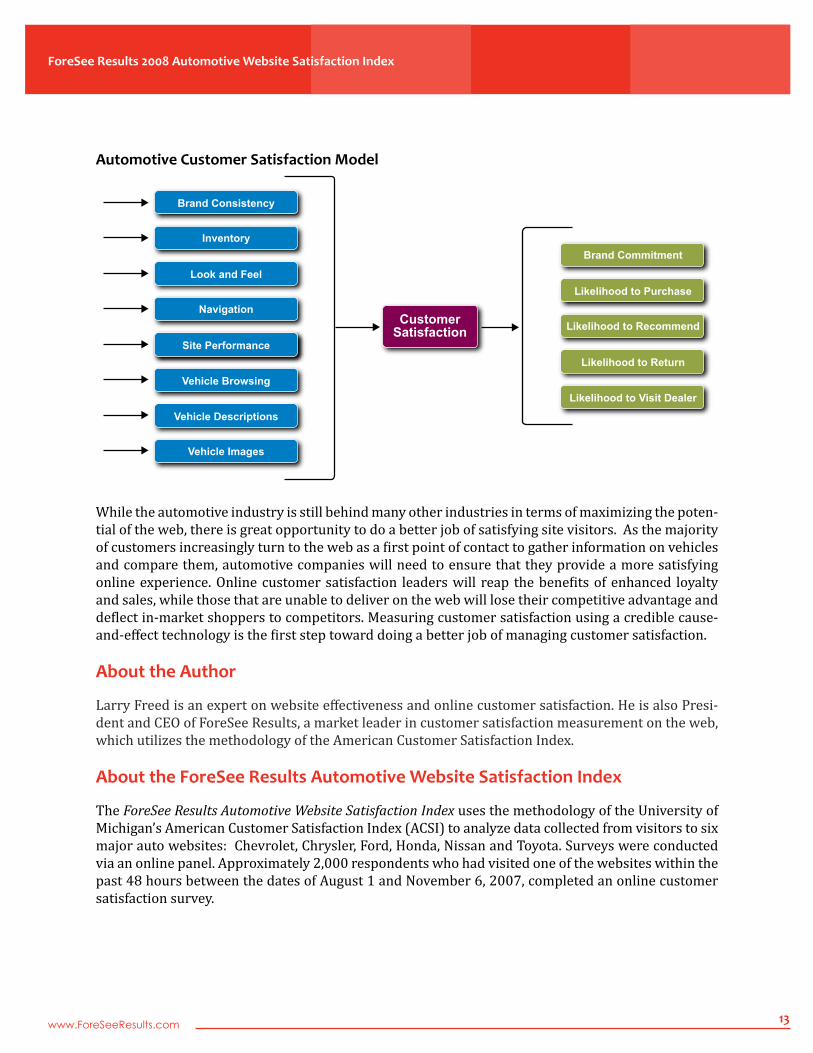
Satisfaction is a means to an end, as satisfied customers are scientifically proven to be more likely to engage in each of the following future behaviors and attitudes:
•BrandCommitment: Gauges the impact of web satisfaction on share of mind and brand perceptions •LikelihoodtoPurchase: Measures how satisfaction with the website influences purchase through
a dealer •LikelihoodtoRecommend: Shows how satisfaction can create positive word of mouth recommen-
dation •LikelihoodtoReturn: Indicates propensity to return to the site, which provides an opportunity for
the automakers to further engage online customers •VisitaDealer: Measures the impact of the web channel on consumers’ likelihood to visit a dealer
to take a test drive, make a purchase, etc.
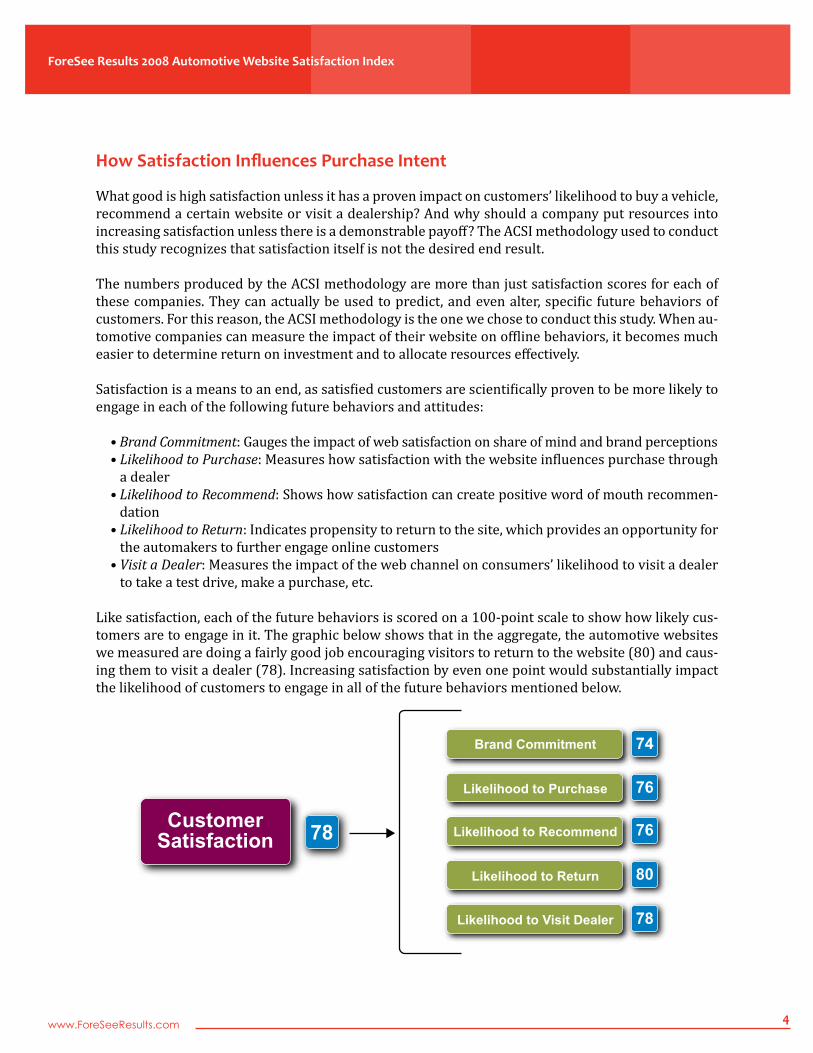
Like satisfaction, each of the future behaviors is scored on a 100-point scale to show how likely cus-tomers are to engage in it. The graphic below shows that in the aggregate, the automotive websites we measured are doing a fairly good job encouraging visitors to return to the website (80) and caus-ing them to visit a dealer (78). Increasing satisfaction by even one point would substantially impact the likelihood of customers to engage in all of the future behaviors mentioned below.
CustomerSatisfaction
Brand Commitment
Likelihood to Purchase
Likelihood to Recommend
Likelihood to Return
Likelihood to Visit Dealer
78
74
76
76
80
78
ForeSee Results 2008 Automotive Website Satisfaction Index
www.ForeSeeResults.com 5
Scores in the 70s indicate that most auto websites are not allowing the online channel to fulfill its potential as a key influencer of customer behavior. If automotive websites can get their scores up well into the 80s for all these desirable future customer behaviors, they will be truly taking maximum advantage of the online channel as an influencer of purchase decisions, dealer visits, loyalty and posi-tive word of mouth.
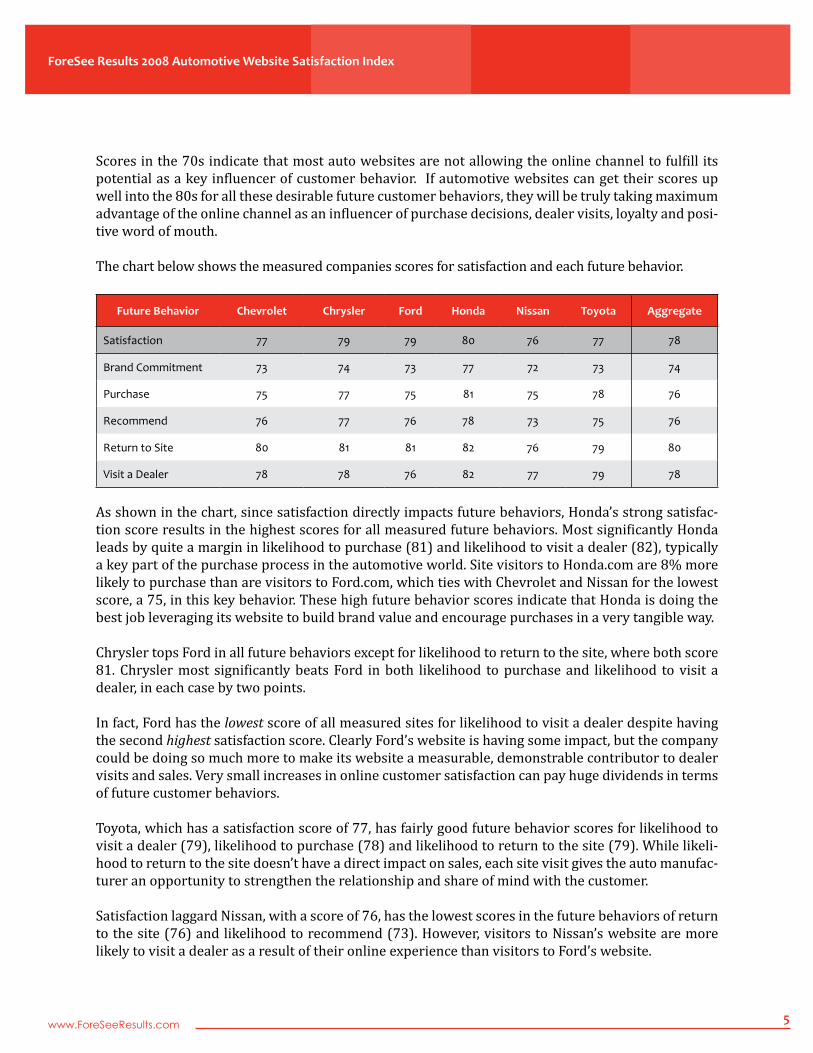
The chart below shows the measured companies scores for satisfaction and each future behavior.
Future Behavior Chevrolet Chrysler Ford Honda Nissan Toyota Aggregate
Satisfaction 77 79 79 80 76 77 78
Brand Commitment 73 74 73 77 72 73 74
Purchase 75 77 75 81 75 78 76
Recommend 76 77 76 78 73 75 76
Return to Site 80 81 81 82 76 79 80
Visit a Dealer 78 78 76 82 77 79 78
As shown in the chart, since satisfaction directly impacts future behaviors, Honda’s strong satisfac-tion score results in the highest scores for all measured future behaviors. Most significantly Honda leads by quite a margin in likelihood to purchase (81) and likelihood to visit a dealer (82), typically a key part of the purchase process in the automotive world. Site visitors to Honda.com are 8% more likely to purchase than are visitors to Ford.com, which ties with Chevrolet and Nissan for the lowest score, a 75, in this key behavior. These high future behavior scores indicate that Honda is doing the best job leveraging its website to build brand value and encourage purchases in a very tangible way.
Chrysler tops Ford in all future behaviors except for likelihood to return to the site, where both score 81. Chrysler most significantly beats Ford in both likelihood to purchase and likelihood to visit a dealer, in each case by two points.
In fact, Ford has the lowest score of all measured sites for likelihood to visit a dealer despite having the second highest satisfaction score. Clearly Ford’s website is having some impact, but the company could be doing so much more to make its website a measurable, demonstrable contributor to dealer visits and sales. Very small increases in online customer satisfaction can pay huge dividends in terms of future customer behaviors.
Toyota, which has a satisfaction score of 77, has fairly good future behavior scores for likelihood to visit a dealer (79), likelihood to purchase (78) and likelihood to return to the site (79). While likeli-hood to return to the site doesn’t have a direct impact on sales, each site visit gives the auto manufac-turer an opportunity to strengthen the relationship and share of mind with the customer.
Satisfaction laggard Nissan, with a score of 76, has the lowest scores in the future behaviors of return to the site (76) and likelihood to recommend (73). However, visitors to Nissan’s website are more likely to visit a dealer as a result of their online experience than visitors to Ford’s website.
ForeSee Results 2008 Automotive Website Satisfaction Index
www.ForeSeeResults.com 6
How Can Auto Websites Make Visitors More Satisfied, and Therefore More Likely to Purchase and Visit a Dealer?
There is extensive published peer-reviewed academic research showing that customer satisfaction as measured by the American Customer Satisfaction Index (ACSI) methodology can predict and influ-ence loyalty, purchase behavior, positive word of mouth, and even future financial results. There has even been research showing that the ACSI predicts stock prices (JournalofMarketing,January2006).
So, knowing how important customer satisfaction is, what can companies do to improve it?
The ACSI methodology measures several key drivers, or elements, of online satisfaction. Improving these elements generally leads to increased satisfaction. The elements that will have the most impact on overall satisfaction (and therefore on future behaviors) differs for each company.
For the automotive industry, our analysis measured customer satisfaction with the following elements: •BrandConsistency: How well the site communicates the company’s qualities, creates positive im-
ages about the company and is consistent with the consumer’s image of the brand across channels •Inventory: Variety, availability and appeal of vehicles •Look&Feel: Visual appeal of site, ease of reading, appropriateness of graphics and text •Navigation: Site organization, number of clicks to get to desired information, site layout, naviga-
tion options •SitePerformance: Speed, consistency of page loading • VehicleBrowsing: Ability to sort vehicles, find desired vehicles, effectiveness of site features •VehicleDescriptions: Thoroughness and effectiveness of vehicle descriptions •VehicleImages: Effectiveness, realism of vehicle images
The sophisticated methodology of the ACSI is able to assign priorities for improvement based on which elements have the biggest impact on overall satisfaction and future behaviors. For example, one auto website may find that although the element of vehicle descriptions is high-scoring, it also has the biggest impact on overall satisfaction (and therefore likelihood to purchase, visit a dealer, etc.), so it should be the first focus of improvement efforts. Another website may find that navigation is low-scoring and has the highest impact on satisfaction, so it should be considered the top prior-ity for improvement. Through this system of discovering which elements have the greatest impact on satisfaction, automotive websites are able to determine where valuable development resources should be allocated.
ForeSee Results 2008 Automotive Website Satisfaction Index
www.ForeSeeResults.com 7
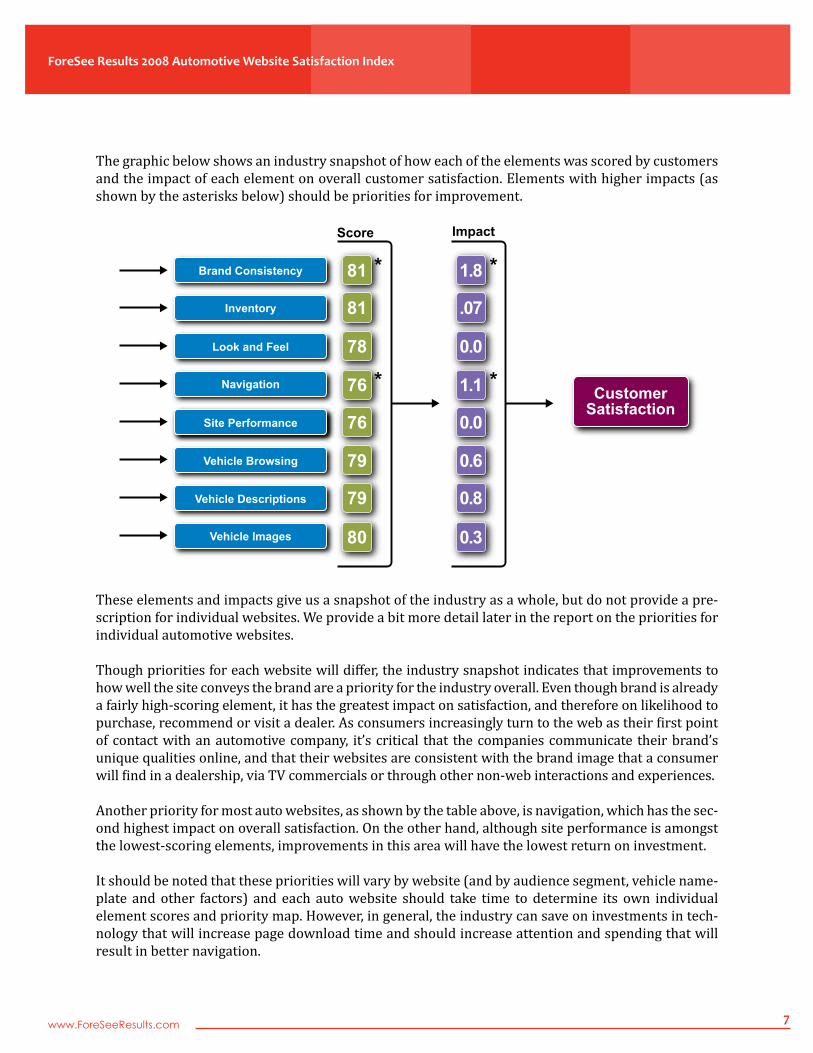
The graphic below shows an industry snapshot of how each of the elements was scored by customers and the impact of each element on overall customer satisfaction. Elements with higher impacts (as shown by the asterisks below) should be priorities for improvement.
These elements and impacts give us a snapshot of the industry as a whole, but do not provide a pre-scription for individual websites. We provide a bit more detail later in the report on the priorities for individual automotive websites.
Though priorities for each website will differ, the industry snapshot indicates that improvements to how well the site conveys the brand are a priority for the industry overall. Even though brand is already a fairly high-scoring element, it has the greatest impact on satisfaction, and therefore on likelihood to purchase, recommend or visit a dealer. As consumers increasingly turn to the web as their first point of contact with an automotive company, it’s critical that the companies communicate their brand’s unique qualities online, and that their websites are consistent with the brand image that a consumer will find in a dealership, via TV commercials or through other non-web interactions and experiences.
Another priority for most auto websites, as shown by the table above, is navigation, which has the sec-ond highest impact on overall satisfaction. On the other hand, although site performance is amongst the lowest-scoring elements, improvements in this area will have the lowest return on investment.
It should be noted that these priorities will vary by website (and by audience segment, vehicle name-plate and other factors) and each auto website should take time to determine its own individual element scores and priority map. However, in general, the industry can save on investments in tech-nology that will increase page download time and should increase attention and spending that will result in better navigation.
Brand Consistency
Inventory
Look and Feel
Navigation CustomerSatisfaction
Site Performance
Vehicle Browsing
Vehicle Descriptions
Vehicle Images
81
81
78
76
76
79
79
80
Score
1.8
.07
0.0
1.1
0.0
0.6
0.8
0.3
Impact
ForeSee Results 2008 Automotive Website Satisfaction Index
www.ForeSeeResults.com 8
In addition to providing industry-level suggestions, we have identified some top priorities for each of the individual measured sites. It should be noted that these are general, site-level observations. Auto-makers would be well served to segment by audience, nameplate, time to purchase, etc. For example, someone going online to research a lease on a Prius in six months may have different needs and pri-orities than someone looking to buy a Ford SUV next week. Our analysis and suggestions below are based on all visitors to the site.
In a few cases with the most dramatic findings, we’ve provided analysis suggested by our usability ex-perts based on website usability best practices. Usability analysis begins with satisfaction data, which provides laser focus. A typical site-wide usability audit could identify as many as 1000 or more us-ability infractions, and automakers would have no way to know which improvements would have the biggest impact on overall satisfaction and future behaviors. The ACSI methodology identifies which elements are priorities, then the usability analysis discovers and prioritizes specific improvement opportunities to those elements that will have the greatest return on investment.
Note:Usabilityreviewsofcertainkeyelementsof theFord,Toyota,Chevy,andNissanwebsiteswereconducted inMarch,2008. TheForeSeeResultsAutomotiveWebsiteSatisfactionIndexresearchwasconductedbetweenAugustandNovemberof2007.
HondaTop-scoring Honda excels at brand consistency, where it garners a strong score of 82. This means that Honda has done a good job communicating the unique qualities of its brand online while also maintaining a consistent brand image across channels, including dealerships, advertising, media coverage and other channels. Honda’s biggest opportunity to improve online satisfaction and de-sired future behaviors is through improvements to navigation, its lowest-scoring element (77).
Chrysler
For Chrysler, tied for second place in overall satisfaction with Ford, inventory is also an area of oppor-tunity, even though the element is fairly high-scoring (80). Additionally, improvements to the online brand would also yield positive results. Brand consistency can be one of the hardest elements to pro-actively change, but taking a look at whether the brand communicated by the website is consistent with the brand communicated by advertisements and dealerships is the first step.
ForeSee Results 2008 Automotive Website Satisfaction Index
www.ForeSeeResults.com 9
Ford
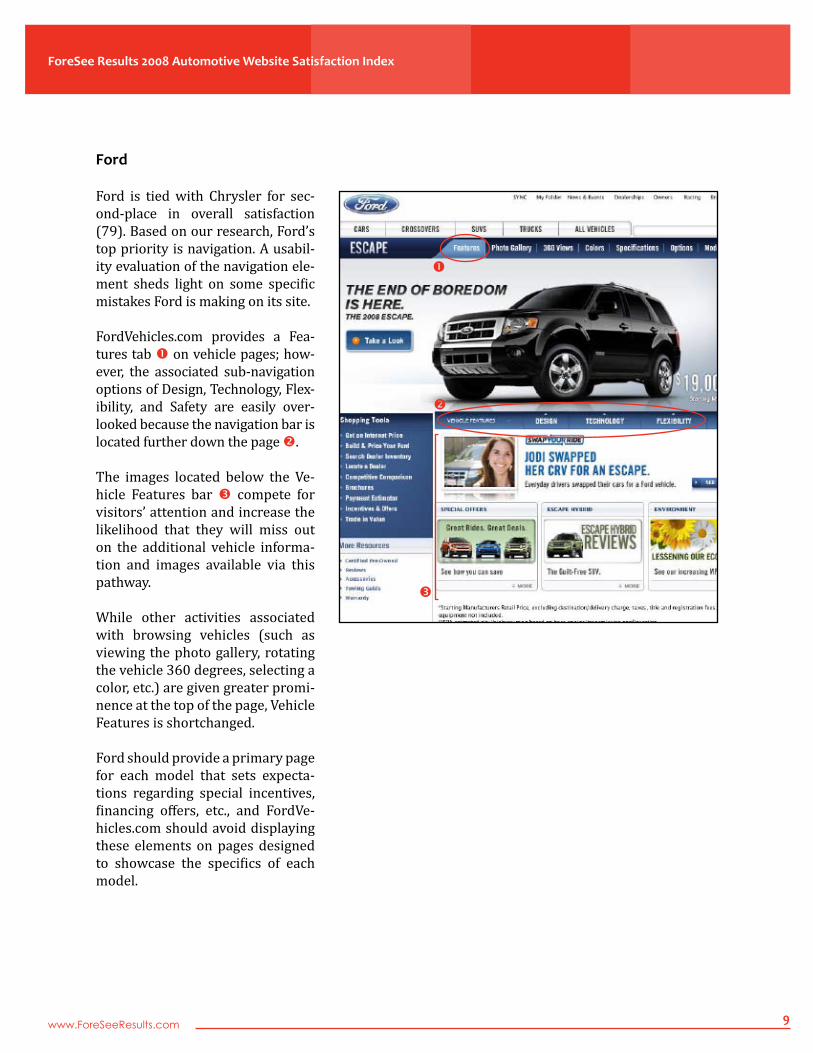
Ford is tied with Chrysler for sec-ond-place in overall satisfaction (79). Based on our research, Ford’s top priority is navigation. A usabil-ity evaluation of the navigation ele-ment sheds light on some specific mistakes Ford is making on its site.
FordVehicles.com provides a Fea-tures tab on vehicle pages; how-ever, the associated sub-navigation options of Design, Technology, Flex-ibility, and Safety are easily over-looked because the navigation bar is located further down the page . The images located below the Ve-hicle Features bar compete for visitors’ attention and increase the likelihood that they will miss out on the additional vehicle informa-tion and images available via this pathway.
While other activities associated with browsing vehicles (such as viewing the photo gallery, rotating the vehicle 360 degrees, selecting a color, etc.) are given greater promi-nence at the top of the page, Vehicle Features is shortchanged.
Ford should provide a primary page for each model that sets expecta-tions regarding special incentives, financing offers, etc., and FordVe-hicles.com should avoid displaying these elements on pages designed to showcase the specifics of each model.
ForeSee Results 2008 Automotive Website Satisfaction Index
www.ForeSeeResults.com 10
Toyota
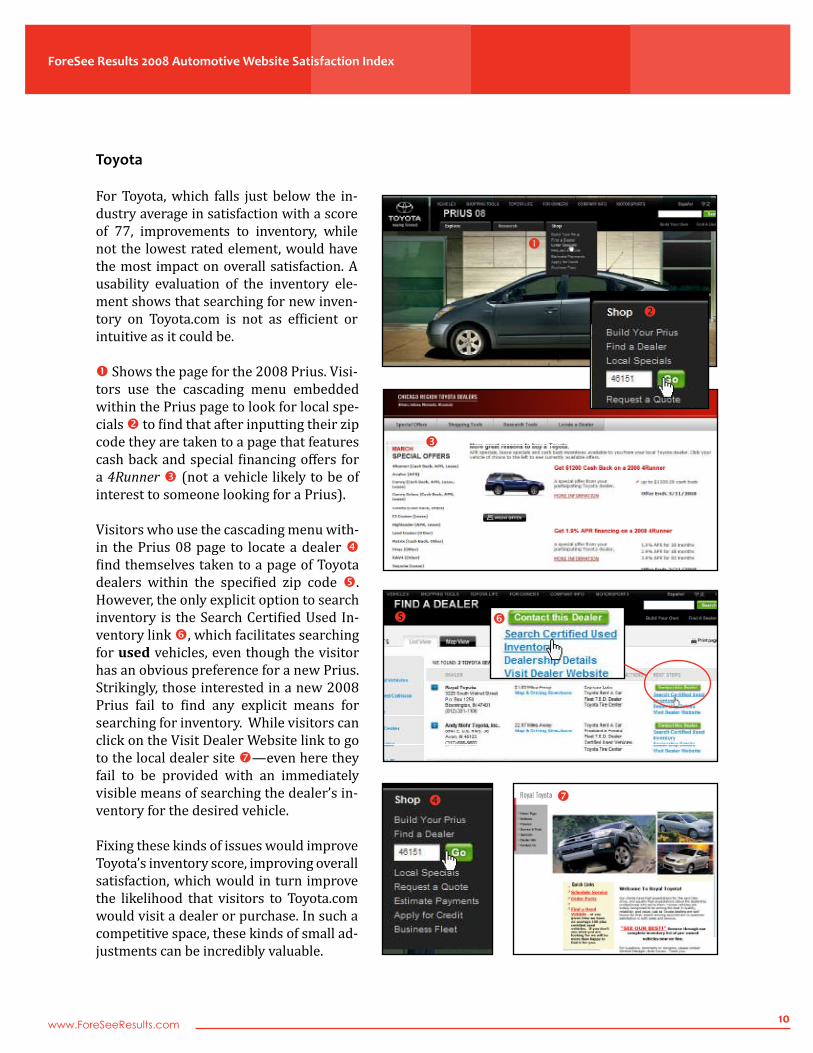
For Toyota, which falls just below the in-dustry average in satisfaction with a score of 77, improvements to inventory, while not the lowest rated element, would have the most impact on overall satisfaction. A usability evaluation of the inventory ele-ment shows that searching for new inven-tory on Toyota.com is not as efficient or intuitive as it could be.
Shows the page for the 2008 Prius. Visi-tors use the cascading menu embedded within the Prius page to look for local spe-cials to find that after inputting their zip code they are taken to a page that features cash back and special financing offers for a 4Runner (not a vehicle likely to be of interest to someone looking for a Prius). Visitors who use the cascading menu with-in the Prius 08 page to locate a dealer find themselves taken to a page of Toyota dealers within the specified zip code . However, the only explicit option to search inventory is the Search Certified Used In-ventory link , which facilitates searching for used vehicles, even though the visitor has an obvious preference for a new Prius. Strikingly, those interested in a new 2008 Prius fail to find any explicit means for searching for inventory. While visitors can click on the Visit Dealer Website link to go to the local dealer site —even here they fail to be provided with an immediately visible means of searching the dealer’s in-ventory for the desired vehicle.
Fixing these kinds of issues would improve Toyota’s inventory score, improving overall satisfaction, which would in turn improve the likelihood that visitors to Toyota.com would visit a dealer or purchase. In such a competitive space, these kinds of small ad-justments can be incredibly valuable.
ForeSee Results 2008 Automotive Website Satisfaction Index
www.ForeSeeResults.com 11
Chevrolet
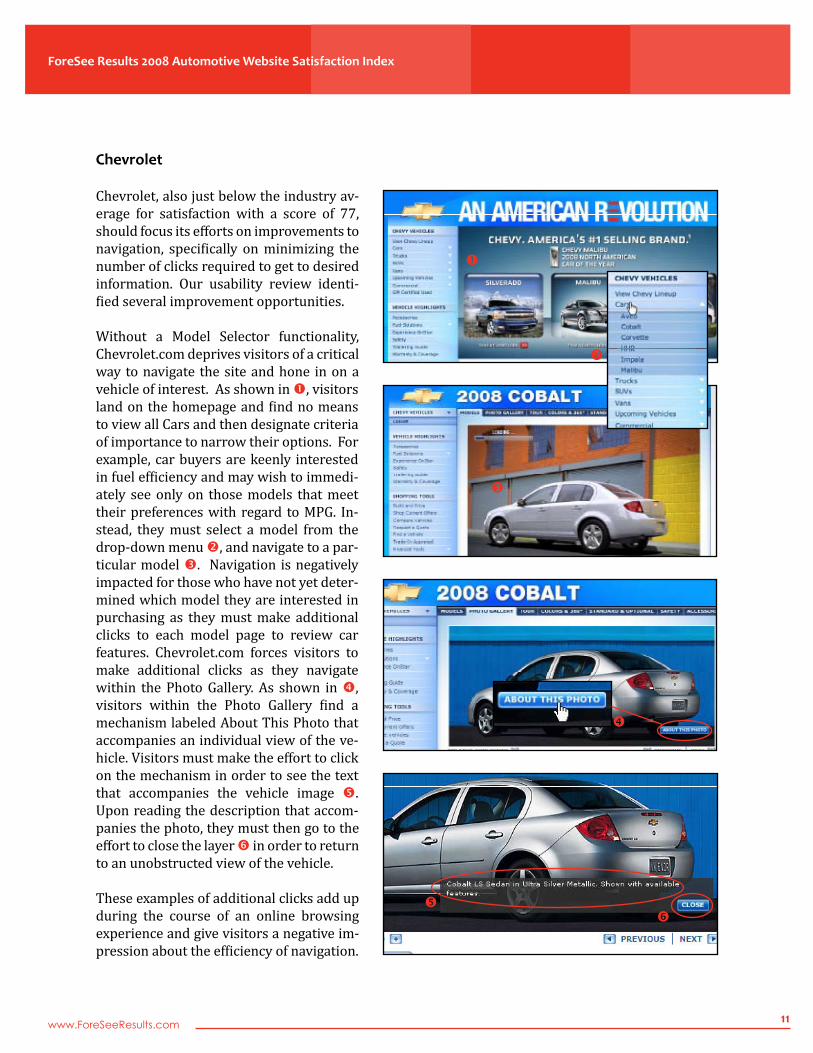
Chevrolet, also just below the industry av-erage for satisfaction with a score of 77, should focus its efforts on improvements to navigation, specifically on minimizing the number of clicks required to get to desired information. Our usability review identi-fied several improvement opportunities.
Without a Model Selector functionality, Chevrolet.com deprives visitors of a critical way to navigate the site and hone in on a vehicle of interest. As shown in , visitors land on the homepage and find no means to view all Cars and then designate criteria of importance to narrow their options. For example, car buyers are keenly interested in fuel efficiency and may wish to immedi-ately see only on those models that meet their preferences with regard to MPG. In-stead, they must select a model from the drop-down menu , and navigate to a par-ticular model . Navigation is negatively impacted for those who have not yet deter-mined which model they are interested in purchasing as they must make additional clicks to each model page to review car features. Chevrolet.com forces visitors to make additional clicks as they navigate within the Photo Gallery. As shown in , visitors within the Photo Gallery find a mechanism labeled About This Photo that accompanies an individual view of the ve-hicle. Visitors must make the effort to click on the mechanism in order to see the text that accompanies the vehicle image . Upon reading the description that accom-panies the photo, they must then go to the effort to close the layer in order to return to an unobstructed view of the vehicle.
These examples of additional clicks add up during the course of an online browsing experience and give visitors a negative im-pression about the efficiency of navigation.
ForeSee Results 2008 Automotive Website Satisfaction Index
www.ForeSeeResults.com 12
Nissan
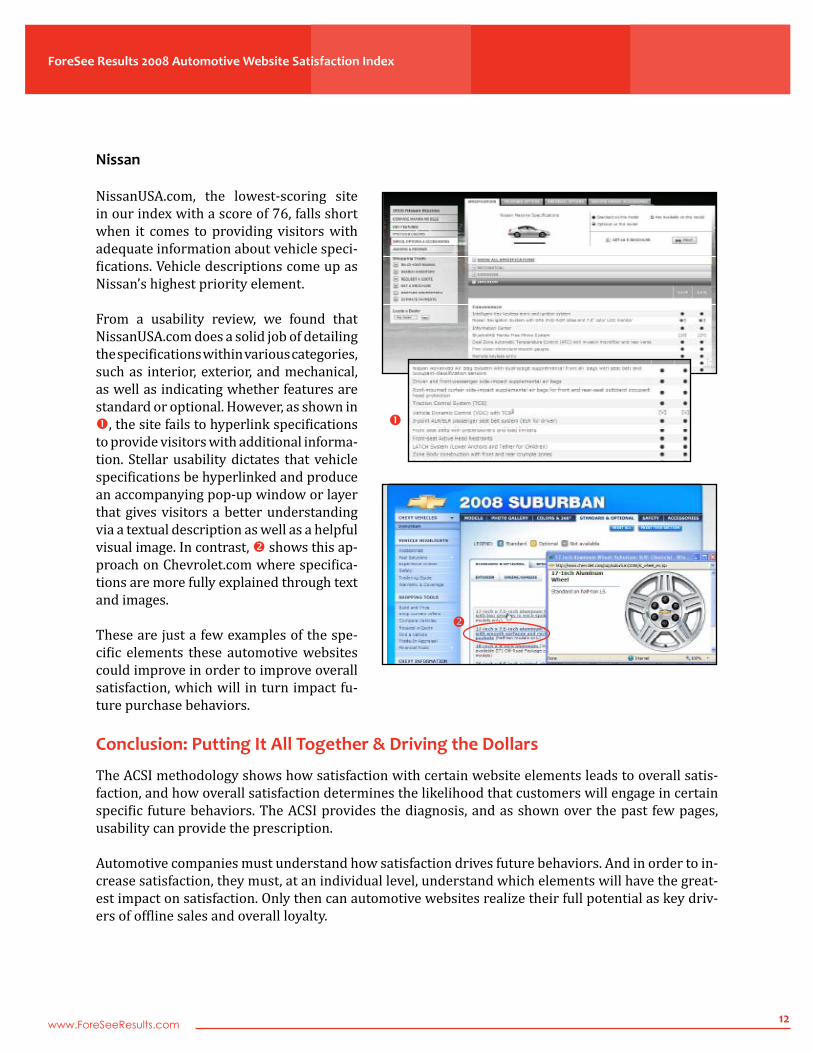
NissanUSA.com, the lowest-scoring site in our index with a score of 76, falls short when it comes to providing visitors with adequate information about vehicle speci-fications. Vehicle descriptions come up as Nissan’s highest priority element.
From a usability review, we found that NissanUSA.com does a solid job of detailing the specifications within various categories, such as interior, exterior, and mechanical, as well as indicating whether features are standard or optional. However, as shown in , the site fails to hyperlink specifications to provide visitors with additional informa-tion. Stellar usability dictates that vehicle specifications be hyperlinked and produce an accompanying pop-up window or layer that gives visitors a better understanding via a textual description as well as a helpful visual image. In contrast, shows this ap-proach on Chevrolet.com where specifica-tions are more fully explained through text and images.
These are just a few examples of the spe-cific elements these automotive websites could improve in order to improve overall satisfaction, which will in turn impact fu-ture purchase behaviors.
Conclusion: Putting It All Together & Driving the Dollars
The ACSI methodology shows how satisfaction with certain website elements leads to overall satis-faction, and how overall satisfaction determines the likelihood that customers will engage in certain specific future behaviors. The ACSI provides the diagnosis, and as shown over the past few pages, usability can provide the prescription.
Automotive companies must understand how satisfaction drives future behaviors. And in order to in-crease satisfaction, they must, at an individual level, understand which elements will have the great-est impact on satisfaction. Only then can automotive websites realize their full potential as key driv-ers of offline sales and overall loyalty.
ForeSee Results 2008 Automotive Website Satisfaction Index
www.ForeSeeResults.com 13
While the automotive industry is still behind many other industries in terms of maximizing the poten-tial of the web, there is great opportunity to do a better job of satisfying site visitors. As the majority of customers increasingly turn to the web as a first point of contact to gather information on vehicles and compare them, automotive companies will need to ensure that they provide a more satisfying online experience. Online customer satisfaction leaders will reap the benefits of enhanced loyalty and sales, while those that are unable to deliver on the web will lose their competitive advantage and deflect in-market shoppers to competitors. Measuring customer satisfaction using a credible cause-and-effect technology is the first step toward doing a better job of managing customer satisfaction.
About the Author
Larry Freed is an expert on website effectiveness and online customer satisfaction. He is also Presi-dent and CEO of ForeSee Results, a market leader in customer satisfaction measurement on the web, which utilizes the methodology of the American Customer Satisfaction Index.
About the ForeSee Results Automotive Website Satisfaction Index
The ForeSeeResultsAutomotiveWebsiteSatisfactionIndex uses the methodology of the University of Michigan’s American Customer Satisfaction Index (ACSI) to analyze data collected from visitors to six major auto websites: Chevrolet, Chrysler, Ford, Honda, Nissan and Toyota. Surveys were conducted via an online panel. Approximately 2,000 respondents who had visited one of the websites within the past 48 hours between the dates of August 1 and November 6, 2007, completed an online customer satisfaction survey.
Brand Consistency
Inventory
Look and Feel
NavigationCustomer
SatisfactionSite Performance
Vehicle Browsing
Vehicle Descriptions
Vehicle Images
Brand Commitment
Likelihood to Purchase
Likelihood to Recommend
Likelihood to Return
Likelihood to Visit Dealer
Automotive Customer Satisfaction Model
ForeSee Results 2008 Automotive Website Satisfaction Index
www.ForeSeeResults.com 14
About ForeSee Results
As the leader in online customer satisfaction measurement, ForeSee Results uses online voice of customer data to help organizations around the globe increase sales, loyalty, recommendations and website value. Using a proven, patented technology, ForeSee Results identifies the improvements to websites and other online initiatives with the greatest ROI. With over 28 million survey responses collected to date and benchmarks across dozens of industries, ForeSee Results offers our clients un-paralleled expertise in customer satisfaction measurement and management. ForeSee Results works with clients across industries, including: retail, financial services, healthcare, manufacturing, tele-communications and government, including Ace Hardware, Automotive News, Best Buy, Forbes Auto and Harley-Davidson, to name a few.
ForeSee Results, a privately held company, is headquartered in Michigan and can be found on the web at www.ForeSeeResults.com.