forest cover change detection using remote sensing and gis – a study of jorhat and golaghat...
DESCRIPTION
Assam is known for its extensive forest areas and availability of rich floras and faunas besides other valuable forest products. As per information available from the State Forest Department, the total area under forests in Assam was 26,781.91 Sq. km. at the end of March 2003, out of which 15,492.329 sq. km. was under Reserved Forests and 2,860.942 Sq. Km. under Protected Forest Area. Thus, the Forests area constitutes about 34.14 percent of the total geographical area of Assam. The forests products of the State mainly comprised of industrial wood, fuel wood, bamboo, stone, thatch, cane, sand etc. The State Government from its various Forest products earns a good amount of revenue.The importance of Forestry lies not only with its productivity but also in its capacity to prevent soil erosion. The State Government has therefore continued to impose ban on indiscriminate felling of trees in the State. The comparative study from Survey of India Topographical Map, 1974 and LISS-III 1D, 2005 of two districts of Assam namely Jorhat and Golaghat, it is very clear that there is substantial decrease in the Reserve Forest Area. Dayang Reserve forest is totally vanished by encroachment, same is the condition of Nambar, Holongapar and Disai Valley Reserve Forest where the crown coverage now is less than 40 percent of the total Reserve Forest Area. The total reserve forest area of Jorhat and Golaghat district during 1974 and 2005 is 458.8 sq km and 176.68 sq km respectively.TRANSCRIPT

International Journal of Environment and Resource Vol. 1 Iss. 2, November 2012
45
Forest Cover Change Detection Using Remote Sensing and GIS – A Study of Jorhat and Golaghat District, Assam* Shukla Acharjee, Mayuri Changmai, Smita Bhattacharjee and Junmoni Mahanta
Centre for Studies in Geography, Dibrugarh University, Dibrugarh, India
Email: [email protected]
Abstract
Assam is known for its extensive forest areas and availability of rich floras and faunas besides other valuable forest products. As per information available from the State Forest Department, the total area under forests in Assam was 26,781.91 Sq. km. at the end of March 2003, out of which 15,492.329 sq. km. was under Reserved Forests and 2,860.942 Sq. Km. under Protected Forest Area. Thus, the Forests area constitutes about 34.14 percent of the total geographical area of Assam. The forests products of the State mainly comprised of industrial wood, fuel wood, bamboo, stone, thatch, cane, sand etc. The State Government from its various Forest products earns a good amount of revenue.
The importance of Forestry lies not only with its productivity but also in its capacity to prevent soil erosion. The State Government has therefore continued to impose ban on indiscriminate felling of trees in the State. The comparative study from Survey of India Topographical Map, 1974 and LISS-III 1D, 2005 of two districts of Assam namely Jorhat and Golaghat, it is very clear that there is substantial decrease in the Reserve Forest Area. Dayang Reserve forest is totally vanished by encroachment, same is the condition of Nambar, Holongapar and Disai Valley Reserve Forest where the crown coverage now is less than 40 percent of the total Reserve Forest Area. The total reserve forest area of Jorhat and Golaghat district during 1974 and 2005 is 458.8 sq km and 176.68 sq km respectively.
Keywords
Reserve Forest; Protected Forest; LISS III; Encroachment
Introduction
Geographical information systems (GIS) and remote sensing are well-established information Technologies, whose applications in land and natural resources management are widely recognized. Current technologies such as geographical information systems (GIS) and remote sensing provide a cost effective and accurate alternative to understanding landscape
dynamics. Digital change detection techniques based on multi-temporal and multi- spectral remotely sensed data have demonstrated a great potential as a means to understanding landscape dynamics to detect, identify, map, and monitor differences in land use and land cover patterns over time, irrespective of the causal factors. Recent improvements in satellite image quality and availability have made it possible to perform image analysis at much larger scale than in the past.
Land use and Land cover (LULC) change studies have become a central component in current strategies for managing natural resources and monitoring environmental changes. Thus, providing an accurate evaluation of the spread and health of the world’s forest, grassland, water, and agricultural and land resources has become an important priority (Mengistu and Salami, 2007). LULC change is therefore, central to environmental processes, environmental change and environmental management through its influence on biodiversity, water budget, radiation budget, trace gas emissions, carbon cycling, livelihood (Verburg et al., 2000; Verburg et al., 2004), urban expansion and loss of vegetal cover (Ifatimehin and Ufuah, 2006, Ujoh et al., 2011). Studies on settlement expansion have now become a central component in current strategies for managing land as a resource and in monitoring environmental changes. Settlements represent the most profound human alteration of the natural environment through a spectrum of urban land use activities (Ifatimehin and Ufuah, 2006) which include, but are not restricted to, transportation, commercial, industrial, residential, institutional, and recreational land uses. The expansion that ensues as a result of increase in the demand for these land uses explains the underlying and fundamental cause of urban expansion which is population increase.
International Journal of Environment and Resource Vol. 1 Iss. 2, November 2012
46
In pressured environmentally sensitive and ecologically important regions, there is a continuing need for up-to-date and accurate land cover information that can be utilised in the production of sustainable land use policies. The importance of vegetation in the environment is underscored by the role it plays as a major carbon sink. Therefore, this study would attempt to map the status of LULC of Jorhat and Golaghat district, Assam over a 31-year period (1974-2005) with a view in estimating the rate of vegetal cover that has been lost due to urban expansion.
Study Area
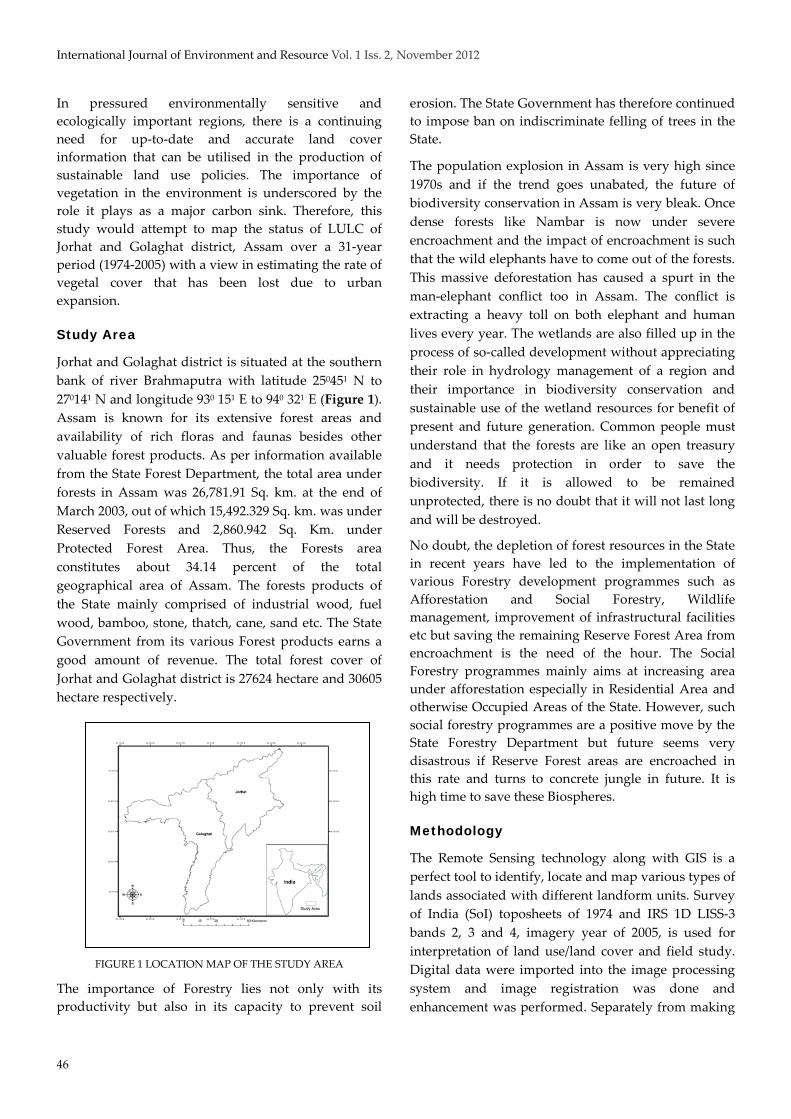
Jorhat and Golaghat district is situated at the southern bank of river Brahmaputra with latitude 250451 N to 270141 N and longitude 930 151 E to 940 321
E (Figure 1). Assam is known for its extensive forest areas and availability of rich floras and faunas besides other valuable forest products. As per information available from the State Forest Department, the total area under forests in Assam was 26,781.91 Sq. km. at the end of March 2003, out of which 15,492.329 Sq. km. was under Reserved Forests and 2,860.942 Sq. Km. under Protected Forest Area. Thus, the Forests area constitutes about 34.14 percent of the total geographical area of Assam. The forests products of the State mainly comprised of industrial wood, fuel wood, bamboo, stone, thatch, cane, sand etc. The State Government from its various Forest products earns a good amount of revenue. The total forest cover of Jorhat and Golaghat district is 27624 hectare and 30605 hectare respectively.
FIGURE 1 LOCATION MAP OF THE STUDY AREA
The importance of Forestry lies not only with its productivity but also in its capacity to prevent soil
erosion. The State Government has therefore continued to impose ban on indiscriminate felling of trees in the State.
The population explosion in Assam is very high since 1970s and if the trend goes unabated, the future of biodiversity conservation in Assam is very bleak. Once dense forests like Nambar is now under severe encroachment and the impact of encroachment is such that the wild elephants have to come out of the forests. This massive deforestation has caused a spurt in the man-elephant conflict too in Assam. The conflict is extracting a heavy toll on both elephant and human lives every year. The wetlands are also filled up in the process of so-called development without appreciating their role in hydrology management of a region and their importance in biodiversity conservation and sustainable use of the wetland resources for benefit of present and future generation. Common people must understand that the forests are like an open treasury and it needs protection in order to save the biodiversity. If it is allowed to be remained unprotected, there is no doubt that it will not last long and will be destroyed.
No doubt, the depletion of forest resources in the State in recent years have led to the implementation of various Forestry development programmes such as Afforestation and Social Forestry, Wildlife management, improvement of infrastructural facilities etc but saving the remaining Reserve Forest Area from encroachment is the need of the hour. The Social Forestry programmes mainly aims at increasing area under afforestation especially in Residential Area and otherwise Occupied Areas of the State. However, such social forestry programmes are a positive move by the State Forestry Department but future seems very disastrous if Reserve Forest areas are encroached in this rate and turns to concrete jungle in future. It is high time to save these Biospheres.
Methodology
The Remote Sensing technology along with GIS is a perfect tool to identify, locate and map various types of lands associated with different landform units. Survey of India (SoI) toposheets of 1974 and IRS 1D LISS-3 bands 2, 3 and 4, imagery year of 2005, is used for interpretation of land use/land cover and field study. Digital data were imported into the image processing system and image registration was done and enhancement was performed. Separately from making
International Journal of Environment and Resource Vol. 1 Iss. 2, November 2012
47
observation on the individual bands, FCC was generated using bands 2, 3 and 4 by transmission blue, green and red combination. The reserve forest areas were mapped from the satellite imagery using the visual interpretation techniques. The imagery was visually interpreted using six basic photo elements viz. tone, texture, shape, size, pattern and association together with numerous ground truth observations. With these assemblages of photo elements showed against each terrain unit, boundaries of distinct reserve forest were demarcated.
Result and Discussion
The area of the reserve forest were calculated and presented in Table 1. Forest is one of the main natural resources. From the results of the study exposed over a period of 31 years, maximum increase in built-up land has been found out. The total area under agricultural land was found to be diminishing compared to 1974. The collective GIS and remote sensing technology is found to be an excellent tool for monitoring, land use changes as well as settlements, agricultures and forest land changes.
Forested areas
It is an area within the notified forest boundary and outside having an association of trees and other vegetation types. This forest is dominated by trees that shed their leaves at a particular time, season or growth stage. The canopy cover greater than 40% is classified as dense forest. The canopy cover between 10% and 40% are classified as open forest. This is an area of degraded forest within the notified Reserved Forest (RF) boundary due to excessive biotic interference and natural causes. This canopy cover below 10% is classified as degraded forest. Scrub forest is an area having mostly with bushes and shrubs. The total reserve forest area of Jorhat and Golaghat district during 1974 and 2005 is 458.8 sq km and 176.68 sq km respectively. It has been found that Dayang Reserved forest under Golaghat district is severely encroached and presently the forest cover has completely vanished.
Reserved Forest area under Jorhat and Golaghat district is also calculated and the change in forest cover area has been detected using SoI toposheet of 1974 and LISS III, 1D imagery of 2005 and the statistics are presented in Table 1 and is shown in Figure 2 to 6.
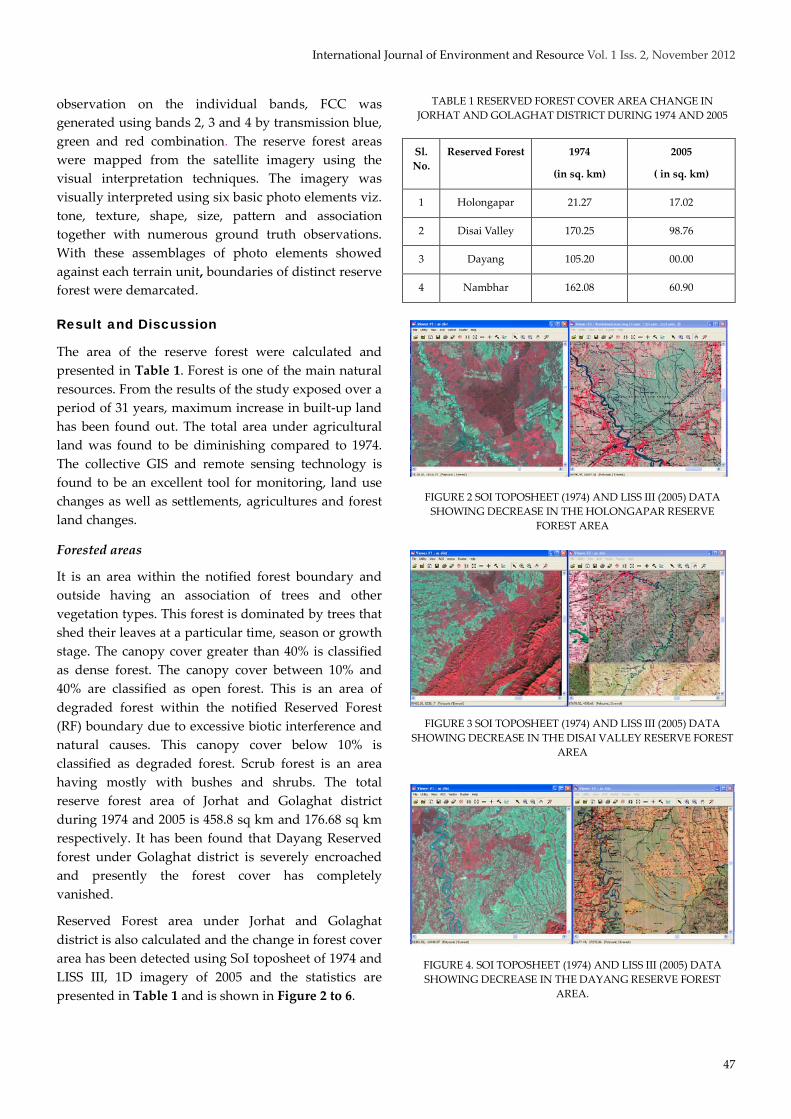
TABLE 1 RESERVED FOREST COVER AREA CHANGE IN JORHAT AND GOLAGHAT DISTRICT DURING 1974 AND 2005
Sl. No.
Reserved Forest 1974
(in sq. km)
2005
( in sq. km)
1 Holongapar 21.27 17.02
2 Disai Valley 170.25 98.76
3 Dayang 105.20 00.00
4 Nambhar 162.08 60.90
FIGURE 2 SOI TOPOSHEET (1974) AND LISS III (2005) DATA SHOWING DECREASE IN THE HOLONGAPAR RESERVE
FOREST AREA
FIGURE 3 SOI TOPOSHEET (1974) AND LISS III (2005) DATA SHOWING DECREASE IN THE DISAI VALLEY RESERVE FOREST
AREA
FIGURE 4. SOI TOPOSHEET (1974) AND LISS III (2005) DATA SHOWING DECREASE IN THE DAYANG RESERVE FOREST
AREA.
International Journal of Environment and Resource Vol. 1 Iss. 2, November 2012
48
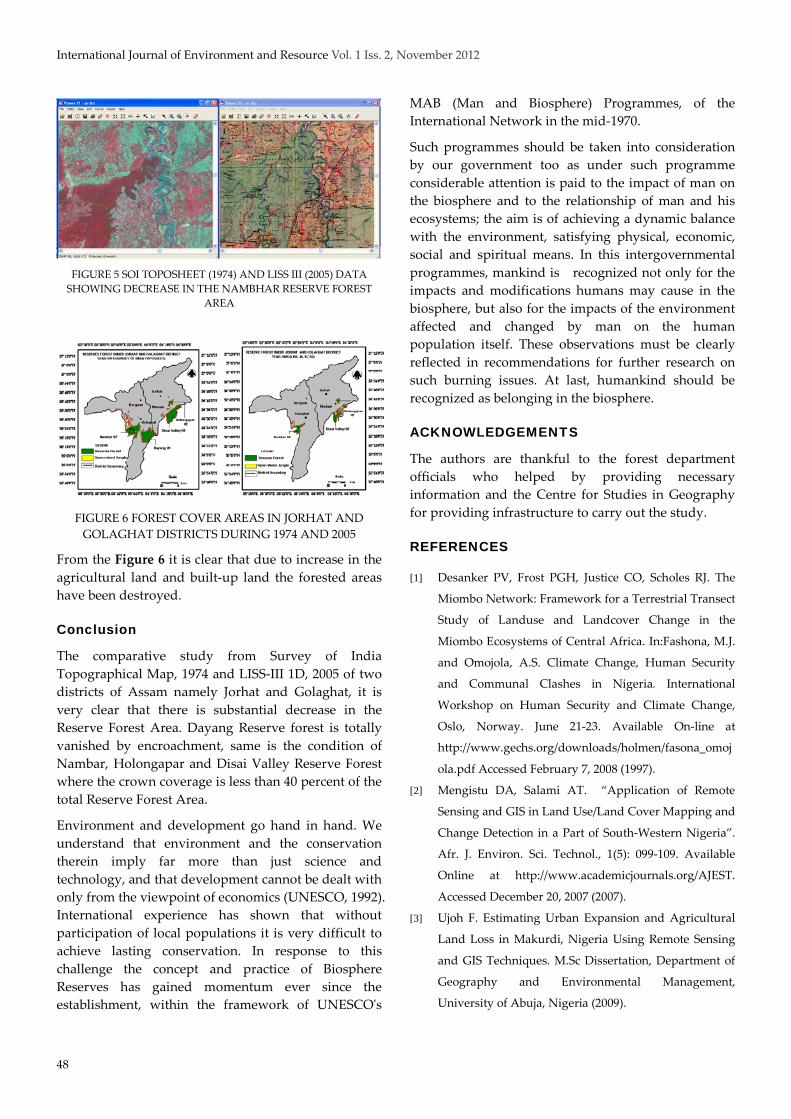
FIGURE 5 SOI TOPOSHEET (1974) AND LISS III (2005) DATA SHOWING DECREASE IN THE NAMBHAR RESERVE FOREST
AREA
FIGURE 6 FOREST COVER AREAS IN JORHAT AND
GOLAGHAT DISTRICTS DURING 1974 AND 2005
From the Figure 6 it is clear that due to increase in the agricultural land and built-up land the forested areas have been destroyed.
Conclusion
The comparative study from Survey of India Topographical Map, 1974 and LISS-III 1D, 2005 of two districts of Assam namely Jorhat and Golaghat, it is very clear that there is substantial decrease in the Reserve Forest Area. Dayang Reserve forest is totally vanished by encroachment, same is the condition of Nambar, Holongapar and Disai Valley Reserve Forest where the crown coverage is less than 40 percent of the total Reserve Forest Area.
Environment and development go hand in hand. We understand that environment and the conservation therein imply far more than just science and technology, and that development cannot be dealt with only from the viewpoint of economics (UNESCO, 1992). International experience has shown that without participation of local populations it is very difficult to achieve lasting conservation. In response to this challenge the concept and practice of Biosphere Reserves has gained momentum ever since the establishment, within the framework of UNESCO's
MAB (Man and Biosphere) Programmes, of the International Network in the mid-1970.
Such programmes should be taken into consideration by our government too as under such programme considerable attention is paid to the impact of man on the biosphere and to the relationship of man and his ecosystems; the aim is of achieving a dynamic balance with the environment, satisfying physical, economic, social and spiritual means. In this intergovernmental programmes, mankind is recognized not only for the impacts and modifications humans may cause in the biosphere, but also for the impacts of the environment affected and changed by man on the human population itself. These observations must be clearly reflected in recommendations for further research on such burning issues. At last, humankind should be recognized as belonging in the biosphere.
ACKNOWLEDGEMENTS
The authors are thankful to the forest department officials who helped by providing necessary information and the Centre for Studies in Geography for providing infrastructure to carry out the study.
REFERENCES
[1] Desanker PV, Frost PGH, Justice CO, Scholes RJ. The
Miombo Network: Framework for a Terrestrial Transect
Study of Landuse and Landcover Change in the
Miombo Ecosystems of Central Africa. In:Fashona, M.J.
and Omojola, A.S. Climate Change, Human Security
and Communal Clashes in Nigeria. International
Workshop on Human Security and Climate Change,
Oslo, Norway. June 21-23. Available On-line at
http://www.gechs.org/downloads/holmen/fasona_omoj
ola.pdf Accessed February 7, 2008 (1997).
[2] Mengistu DA, Salami AT. “Application of Remote
Sensing and GIS in Land Use/Land Cover Mapping and
Change Detection in a Part of South-Western Nigeria”.
Afr. J. Environ. Sci. Technol., 1(5): 099-109. Available
Online at http://www.academicjournals.org/AJEST.
Accessed December 20, 2007 (2007).
[3] Ujoh F. Estimating Urban Expansion and Agricultural
Land Loss in Makurdi, Nigeria Using Remote Sensing
and GIS Techniques. M.Sc Dissertation, Department of
Geography and Environmental Management,
University of Abuja, Nigeria (2009).

International Journal of Environment and Resource Vol. 1 Iss. 2, November 2012
49
[4] Ujoh F, Kwabe ID, Ifatimehin OO. “Urban expansion
and vegetal cover loss in and around Nigeria’s Federal
Capital City” J. Eco. and the Nat. Environ. Vol. 3(1),
pp. 1-10, January 2011, Available online at
http://www.academicjournals.org/jene (2011).
[5] Verburg PH, Chen Y, Soepboer W, Veldkamp TA.
“GIS-Based Modelling of Human-Environment
Interactions for Natural Resource Management
Applications in Asia”. Proceedings of the 4th
International Conference on Integrating GIS and
Environmental Modelling: Problems, Prospects and
Research Needs, Banff, Alberta, Canada (2000).
[6] Verburg PH, Schot P, Dijst M, Veldkamp A “Landuse
Change Modelling: Current Practices and Research
Priorities”. Geo. J., 51(4): 309-324. Available On-line at
http://www.aginternetwork.net/whalecommwww.scien
cedirect.com/wh alecom0/ Accessed April 13, 2008
(2004).