forest ecology and management - forest dynamics...
TRANSCRIPT
Forest Ecology and Management 266 (2012) 11–24
Contents lists available at SciVerse ScienceDirect
Forest Ecology and Management
journal homepage: www.elsevier .com/locate / foreco
Composition, structure, and dendroecology of an old-growth Quercus foreston the tablelands of the Cumberland Plateau, USA
Justin L. Hart a,⇑, Stacy L. Clark b, Scott J. Torreano c, Megan L. Buchanan a
a Department of Geography, University of Alabama, Box 870322, Tuscaloosa, AL 35487, USAb USDA Forest Service, Southern Research Station, University of Tennessee, 2431 Joe Johnson Dr., Knoxville, TN 37996, USAc Department of Forestry and Geology, University of the South, 735 University Ave., Sewanee, TN 37383, USA
a r t i c l e i n f o
Article history:Received 19 September 2011Received in revised form 31 October 2011Accepted 1 November 2011
Keywords:DendroecologyOld growthPinusQuercusSuccessionStand development
0378-1127/$ - see front matter � 2011 Elsevier B.V. Adoi:10.1016/j.foreco.2011.11.001
⇑ Corresponding author. Tel.: +1 205 348 4190; faxE-mail address: [email protected] (J.L. Hart).
a b s t r a c t
Forest reconstructions provide information on the processes that influence forest development and suc-cessional patterns. In this study, we quantified woody species composition, stand structure, and radialgrowth patterns of individual Quercus trees to document the processes that shaped a forest on the Cum-berland Plateau in Tennessee over the past three centuries. The oldest trees on the site established in thelate-1600s. The forest was dominated by Quercus alba, but Acer rubrum and Oxydendrum arboreum werethe most abundant species in small size and young age classes. Quercus recruitment was continuous overthe past three centuries whereas Pinus established in the late-1800s and early-1900s and Acer establishedin the 1940s. Most overstory Quercus recruited via gap-phase regeneration and ca. one-third establishedunder a closed canopy and were suppressed for up to 80 years prior to overstory release. Pinus recruit-ment corresponded to stand-wide canopy disturbance while Acer recruitment had no relationship tooverstory removal. Over the last three centuries, we contend Quercus has been the dominant genus withPinus restricted to patches that corresponded to canopy disturbances. The recent profusion of Acer in theunderstory will likely inhibit regeneration of Pinus and Quercus. Indeed, the composition of the overstoryand understory were dissimilar and under the current disturbance regime, the A. rubrum componentshould increase. Gap-scale disturbance frequency has remained relatively stable since the mid-1700s.However, the frequency of stand-wide canopy disturbance events has decreased since the mid-1800sand the last initiated in 1903.
� 2011 Elsevier B.V. All rights reserved.
1. Introduction
Forest reconstructions, coupled with forest inventory data, pro-vide insight into patterns of stand development and succession andstrengthen our understanding of the processes that influence forestcommunities (Henry and Swan, 1974; Lorimer, 1985; Lorimer andFrelich, 1989; Oliver and Stephens, 1977). In addition, the resultsof forest reconstructions can be used by land managers to establisha site’s historic range of variability and to implement silviculturaltreatments that mimic historical disturbance characteristics andecological processes (Coates and Burton, 1997; Swetnam et al.,1999; Webster and Lorimer, 2005). A majority of the Eastern Decid-uous Forest of North America consists of secondary stands at vari-ous stages of development. These forests provide information ondevelopment and succession only since the last stand initiatingdisturbance event, which in many systems was anthropogenicclearing in the late 19th or early 20th centuries (Parker, 1989;Whitney, 1994). Therefore, reconstructions in old-growth forests
ll rights reserved.
: +1 205 348 2278.
(defined here as forests with an abundance of relatively old treesfor the species and in the complex stage of development (Oliverand Larson, 1996)) are particularly valuable as long-term develop-mental processes and successional trends can be ascertained. Manystands in the Eastern Deciduous Forest are not returning to theirpre-European settlement conditions as vegetation–environmentrelationships have been modified by land-use practices (Cowell,1998; Foster et al., 1998; Motzkin et al., 1999) and exotic pestsand pathogens (Paillet, 2002). Thus, retrospective studies in old-growth stands provide insight on forest characteristics prior toalteration of these relationships (Foster et al., 1996; McCarthyand Bailey, 1996; Nowacki and Abrams, 1994; Ruffner and Abrams,1998).
The Cumberland Plateau supports forests that are among themost diverse in the temperate zone (Hinkle et al., 1993). TheCumberland Plateau is topographically complex and since forestcommunity composition and structure are largely functions oftopographic and edaphic conditions, these measures are highlyvariable across the region (Clatterbuck et al., 2006; Hinkle, 1989).This landscape heterogeneity has resulted in a wide variety ofmicroenvironmental conditions inhabited by different species
12 J.L. Hart et al. / Forest Ecology and Management 266 (2012) 11–24
assemblages and thus the region has high gamma diversity.Although the Cumberland Plateau is noted for its high biodiversity,the vegetation of the region can be broadly classed into two cate-gories: that of the flat to rolling plateau tablelands with minimaltopographic relief and that of the highly dissected plateau sectionsconsisting of coves and gorges (Hinkle, 1989). Although the vastmajority of the Cumberland Plateau is composed of the tablelandsurface, the overwhelming majority of scientific research and con-servation efforts in the region have been focused specifically oncove and gorge communities which comprise a relatively smallpercentage of the Cumberland Plateau landscape.
In general, the undissected Cumberland Plateau tableland sur-face has lower species diversity and is lower in quality for commer-cial hardwood timber production compared to the highly dissectedareas of the plateau (Braun, 1950; Smalley, 1982, 1986). The table-land surface of the Cumberland Plateau has a high potential andvalue for surface mining, conversion to intensively managed Pinusplantations, agricultural fields, and urban development (McGee,1982; Smalley, 1982, 1986). Additionally, the plateau tablelandsare most likely to support naturally occurring Pinus-dominated for-ests or Pinus–Quercus forests, forest types that are decreasing inspatial extent hypothesized to be attributed to a lack of forest man-agement and/or natural disturbances that maintained them(Oswalt and King, 2010; Schweitzer, 2000). The CumberlandPlateau tablelands are predominately owned by non-industrial pri-vate landowners (Oswalt and King, 2010; Schweitzer, 2000), andare generally unprotected from non-forest conversion or poor har-vesting practices. Plateau tablelands, therefore, represent at-riskcommunities because of the potential for forest conversion andthe lack of existing management recommendations that can re-store ecologically important processes.
Although tracts of old-growth forests have been identified inplateau gorges (e.g. Clark et al., 2007; Martin, 1975; Quartermanet al., 1972; Schmalzer et al., 1978), only one large expanse ofold-growth forest has been discovered on the tableland surfaceof the Cumberland Plateau (Haney and Lydic, 1999). This foresthas not been previously studied for forest history reconstructionor dendrochronological purposes and represents a unique opportu-nity to quantify long-term patterns of stand development, canopydisturbance, and forest succession.
The specific objectives of this study were to: (1) quantify spe-cies composition and stand structural attributes, (2) reconstructthe frequency, magnitude, and spatial extent of past canopy distur-bance events, and (3) elucidate forest growth and developmentpatterns over the last three centuries with particular emphasison strategies of Quercus recruitment and canopy ascension. Datareported here may be used as reference conditions for similarly sit-uated forests on the Cumberland Plateau that are being managedfor old-growth characteristics (i.e. complex age, diameter, and ver-tical structures). Forest communities of the tableland surface of theCumberland Plateau would have resembled the conditions of theold-growth stand quantified here in the absence of direct and in-tense Euro-American disturbances.
2. Study area and methods
2.1. Study site
This study was conducted on the Savage Gulf Natural Area(SGNA) located in southeastern Tennessee (Fig. 1). The reserve con-sists of 6309 ha and is managed as a Class II Natural Area by theTennessee Department of Environment and Conservation. TheSGNA is a component of the South Cumberland Recreation Areawhich contains 10 distinct state-managed reserves. The SGNA islisted as a National Natural Landmark by the US Department of
the Interior because of its biodiversity and unique geologic features(DeSelm and Clark, 1975). The nature reserve was formally estab-lished when the property was transferred to the State of Tennesseein 1973. Since that time use of the reserve has been restricted torecreation and research. Our study was specifically focused withina ca. 600 ha Quercus forest on the tablelands in the northeasternsection of the reserve. While most of the 600 ha study area ap-peared to be old-growth (e.g. abundance of old trees, complexdiameter and vertical structures), portions likely experienced somelevel of human disturbance that would include logging prior to cre-ation of the SGNA. Although road construction and coal extractionin Grundy County, Tennessee began in the 1850s, permanent set-tlement of the area did not begin until 1870 when Swiss colonists,primarily focused on dairy and agriculture crops, established com-munities. During the 1870s rail lines were constructed and thenumber of saw mills increased (Manning, 1993). Old railroad bedsexist within the SGNA, but records that would help determine theextent of logging in the study area do not exist. We excluded areasfrom our study with obvious signs of past Euro-American distur-bances (e.g. those near cut stumps or old logging roads).
The SGNA is located on the mid-Cumberland Plateau section ofthe Appalachian Plateaus physiographic province (Fenneman,1938; Smalley, 1982). The Cumberland Plateau is the westernmostphysiographic province of the Appalachian Highland realm. It isbordered by the Ridge and Valley to the east and the InteriorLow Plateau to the west. Our study plots were located on theweakly dissected plateau landtype association of the true plateausubregion as defined by Smalley (1982). The true plateau has anundulating surface submaturely dissected by young valleys(Fenneman, 1938; Smalley, 1982). These tablelands are extensivethrough the mid-Cumberland Plateau and have led some authorsto consider them a distinct unit called the Central Uplands (DeSelmand Clark, 1975). Several incised bedrock streams flow across thestudy site into Savage Creek and disrupt the tableland surface.The underlying geology consists largely of Pennsylvanian sand-stone, conglomerate, siltstone, shale, and coal of the Crab Orchardand Crooked Forked Groups (Miller, 1974; Smalley, 1982). Region-ally, soils are acidic, highly leached, and low in fertility (Francis andLoftus, 1977; Springer and Elder, 1980). The elevation of the studyplots ranged from ca. 500–575 m amsl.
The climate is classified as humid mesothermal (Thornthwaite,1948) with long, moderately hot summers and short, mild winters.Regionally, the complex topography is a strong control on fine-scale climate conditions. The average frost-free period is ca.200 days and the mean annual temperature is 14 �C. The July aver-age temperature is 24 �C and the January average temperature is3 �C (PRISM Climate Group, 2011). The area typically receives stea-dy precipitation during the year with no distinct dry season; how-ever, short periods of water surplus or deficit are common. Meanannual precipitation is 145 cm (PRISM Climate Group, 2011).Thunderstorms accompanied by intense rainfall and sometimeshail occur over 50 days annually and are most common in latespring and summer. Snowfall is minimal and generally melts with-in a few days (Smalley, 1982).
Braun (1950) classified the study area as part of the Cliff Sectionof the Mixed Mesophytic Forest Region. However, true mixedmesophytic communities occur only in riparian areas and coves.The most spatially comprehensive study on Cumberland Plateauforests was conducted by Hinkle (1978) and summarized in Hinkle(1989). Across the Cumberland Plateau, vegetation is intermediatebetween mixed mesophytic, mixed hardwood, and mixed Pinus–hardwood forest types (Hinkle, 1978, 1989; Smalley, 1982). Theflat to rolling plateau uplands supported 12 community types thatranged from stands dominated by Acer rubrum, Betula nigra L., andIlex opaca on floodplain terraces, stands dominated by A. rubrum,Quercus alba, and Nyssa sylvatica on poorly drained swales, and
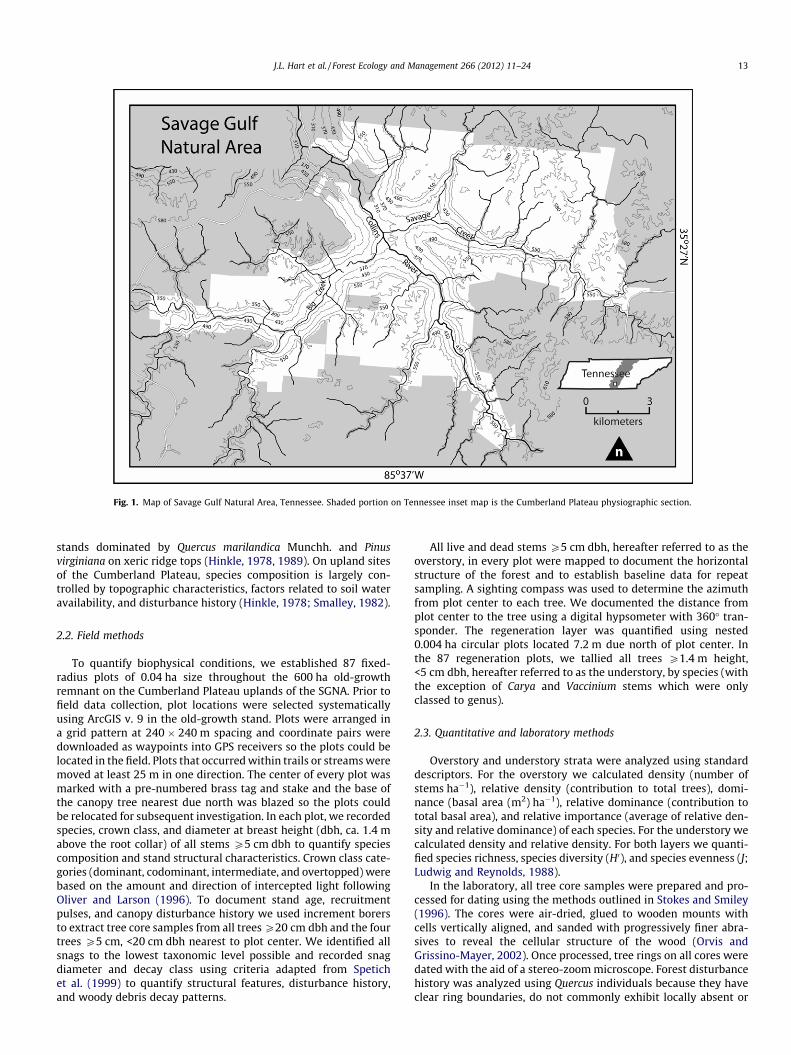
Fig. 1. Map of Savage Gulf Natural Area, Tennessee. Shaded portion on Tennessee inset map is the Cumberland Plateau physiographic section.
J.L. Hart et al. / Forest Ecology and Management 266 (2012) 11–24 13
stands dominated by Quercus marilandica Munchh. and Pinusvirginiana on xeric ridge tops (Hinkle, 1978, 1989). On upland sitesof the Cumberland Plateau, species composition is largely con-trolled by topographic characteristics, factors related to soil wateravailability, and disturbance history (Hinkle, 1978; Smalley, 1982).
2.2. Field methods
To quantify biophysical conditions, we established 87 fixed-radius plots of 0.04 ha size throughout the 600 ha old-growthremnant on the Cumberland Plateau uplands of the SGNA. Prior tofield data collection, plot locations were selected systematicallyusing ArcGIS v. 9 in the old-growth stand. Plots were arranged ina grid pattern at 240 � 240 m spacing and coordinate pairs weredownloaded as waypoints into GPS receivers so the plots could belocated in the field. Plots that occurred within trails or streams weremoved at least 25 m in one direction. The center of every plot wasmarked with a pre-numbered brass tag and stake and the base ofthe canopy tree nearest due north was blazed so the plots couldbe relocated for subsequent investigation. In each plot, we recordedspecies, crown class, and diameter at breast height (dbh, ca. 1.4 mabove the root collar) of all stems P5 cm dbh to quantify speciescomposition and stand structural characteristics. Crown class cate-gories (dominant, codominant, intermediate, and overtopped) werebased on the amount and direction of intercepted light followingOliver and Larson (1996). To document stand age, recruitmentpulses, and canopy disturbance history we used increment borersto extract tree core samples from all trees P20 cm dbh and the fourtrees P5 cm, <20 cm dbh nearest to plot center. We identified allsnags to the lowest taxonomic level possible and recorded snagdiameter and decay class using criteria adapted from Spetichet al. (1999) to quantify structural features, disturbance history,and woody debris decay patterns.
All live and dead stems P5 cm dbh, hereafter referred to as theoverstory, in every plot were mapped to document the horizontalstructure of the forest and to establish baseline data for repeatsampling. A sighting compass was used to determine the azimuthfrom plot center to each tree. We documented the distance fromplot center to the tree using a digital hypsometer with 360� tran-sponder. The regeneration layer was quantified using nested0.004 ha circular plots located 7.2 m due north of plot center. Inthe 87 regeneration plots, we tallied all trees P1.4 m height,<5 cm dbh, hereafter referred to as the understory, by species (withthe exception of Carya and Vaccinium stems which were onlyclassed to genus).
2.3. Quantitative and laboratory methods
Overstory and understory strata were analyzed using standarddescriptors. For the overstory we calculated density (number ofstems ha�1), relative density (contribution to total trees), domi-nance (basal area (m2) ha�1), relative dominance (contribution tototal basal area), and relative importance (average of relative den-sity and relative dominance) of each species. For the understory wecalculated density and relative density. For both layers we quanti-fied species richness, species diversity (H0), and species evenness (J;Ludwig and Reynolds, 1988).
In the laboratory, all tree core samples were prepared and pro-cessed for dating using the methods outlined in Stokes and Smiley(1996). The cores were air-dried, glued to wooden mounts withcells vertically aligned, and sanded with progressively finer abra-sives to reveal the cellular structure of the wood (Orvis andGrissino-Mayer, 2002). Once processed, tree rings on all cores weredated with the aid of a stereo-zoom microscope. Forest disturbancehistory was analyzed using Quercus individuals because they haveclear ring boundaries, do not commonly exhibit locally absent or
14 J.L. Hart et al. / Forest Ecology and Management 266 (2012) 11–24
false rings, were dominant canopy species, had high relativefrequency, and have been used successfully in other studies todocument disturbance history in the eastern US (Hart andGrissino-Mayer, 2008; McCarthy and Bailey, 1996; Nowacki andAbrams, 1997; Rubino and McCarthy, 2004). Once all rings werevisually dated, we measured raw-ring width to the nearest0.001 mm using a Velmex measuring stage interfaced withMeasure J2X software for all canopy Quercus series (n = 200). Themeasurement series were visually compared and statisticallyanalyzed to ensure each growth ring was assigned to the propercalendar year of formation using the computer program COFECHA(Grissino-Mayer, 2001a; Holmes, 1983). Segments that fell belowthe predetermined significance threshold (r = 0.32, P > 0.01) wereflagged by the program. All flagged segments were re-inspectedfor possible dating errors and dating was adjusted if necessary.
Once we were confident all canopy Quercus tree rings were da-ted to their exact calendar year of formation, we used dendroeco-logical techniques to quantify the magnitude, frequency, andspatial extent of canopy disturbance events. The identification ofrelease episodes in radial growth patterns of canopy trees is theprimary technique in dendroecology to reconstruct canopy distur-bance events (Abrams and Nowacki, 1992; Frelich, 2002; Fraverand White, 2005; Lorimer, 1980, 1985; Nowacki and Abrams,1997). Commonly, release events are defined as changes in radialgrowth relative to a predetermined criterion and are identifiedusing a percent growth change equation (Nowacki and Abrams,1997; Rentch et al., 2002; Rubino and McCarthy, 2004). We ana-lyzed changes in raw-ring widths with respect to the runningmean of the previous and subsequent 10 years. Release eventswere identified as periods in which raw-ring width was P25%(minor) or P50% (major) of the 10-year preceding and supersedingmean (Nowacki and Abrams, 1997), sustained for a minimum of3 years (Hart and Grissino-Mayer, 2008; Hart et al., 2008). Theduration criterion results in a relatively conservative estimate ofcanopy disturbance, but this technique has been widely used toquantify canopy disturbance history in the eastern US (e.g.Buchanan and Hart, 2011; Hart and Grissino-Mayer, 2008; Hartet al., 2008, 2010, 2011). This technique provides quantification ofcanopy disturbances that would be on the landscape for longer peri-ods and thus be theoretically larger in size. We considered stand-wide disturbances as release episodes where a minimum of 25% ofthe individuals at least 10 years of age at that time experienced acontemporary release (Hart and Grissino-Mayer, 2008; Nowackiand Abrams, 1997; Rubino and McCarthy, 2004). The programFHX2 was used to graphically display spatial and temporal patternsof release episodes (Grissino-Mayer, 1995, 2001b; Hart and Grissin-o-Mayer, 2008; Hart et al., 2008). The FHX2 software displays releaseevents at individual tree and forest levels, which allows for theinvestigation of disturbance events at multiple spatial scales.
To infer long-term canopy coverage patterns and to providequantitative information on Quercus recruitment strategies, allQuercus trees with radial growth records beginning prior to 1850were classified into two groups, gap or understory origin, accord-ing to early radial growth patterns (Rentch et al., 2003). Mean ra-dial growth of years 1 through 20 was compared to mean radialgrowth of years 21 through 40 (McCarthy and Bailey, 1996). Ifthe mean of the first 20 years exceeded the mean of the second20-year window the tree was classed as establishing in a forestcanopy gap. If mean growth of the first 20 years was below thatof the second 20-year period the tree was classified as being ofunderstory origin (Lorimer et al., 1988; McCarthy and Bailey,1996). To confirm these quantitative classifications, we graphicallyanalyzed the radial growth trends of each of these series. We thendetermined if and when the trees experienced growth releasesidentified by the 10-year running mean method. We combinedthe recruitment strategy classes with the detection of subsequent
release event(s) to assign all Quercus trees dating prior to 1850 toone of three establishment and accession strategy classes as estab-lished by Rentch et al. (2003): gap origin-no release, gap origin-gaprelease, or understory origin-gap release.
3. Results
3.1. Forest composition
The basal area of stems P5 cm dbh was 28.58 m2 ha�1 and totaldensity was 1168 trees ha�1 (Table 1). Species richness of the over-story layer was 30, diversity (H0) was 2.25, and evenness (J) was0.66. The most important species (based on relative importance)were A. rubrum, Oxydendrum arboreum, and Q. alba (Table 1). Thesethree species had similar relative importance values and repre-sented a clear break from all other species. A distinct second tierof species importance included Pinus echinata, Quercus coccinea,and Quercus velutina. At the genus level, Quercus was the mostimportant contributor to the tree community, with 67% relativeimportance.
The most dominant overstory layer species (based on basal area)was Q. alba with a basal area of 6.49 m2 ha�1. A. rubrum, P. echinata,O. arboreum, Q. coccinea, and Q. velutina were the next most domi-nant species with basal areas ranging from 4.48 m2 ha�1 for A.rubrum to 2.57 m2 ha�1 for Q. velutina. Over 75% of tree biomasswas represented in the five most dominant species alone. The meandbh of P. echinata was 23 cm, of Q. alba was 16 cm, of O. arboreumwas 12 cm, and of A. rubrum was 11 cm.
Acer rubrum and O. arboreum had the highest tree densities(>305 trees ha�1) and were nearly twice as abundant as any otherspecies. These species were followed by Q. alba (158 trees ha�1)and P. echinata (71 trees ha�1). Together these four species repre-sented greater than 72% of all overstory layer trees. These specieswere followed by N. sylvatica and Q. velutina with over 51 and 39individuals ha�1, respectively. No other species had 30 trees ha�1
or represented over 3% of total stem density.The understory layer contained 1514 stems ha�1 (Table 2). Spe-
cies richness was 21, nine lower than the overstory layer. Diversitywas 2.37, similar to the value for the overstory, and evenness was0.78, 0.12 higher than the overstory layer. The most abundant spe-cies in the understory stratum was A. rubrum, representing 33% ofall stems. Quercus alba had 147 understory layer stems ha�1 or 10%of this stratum. Quercus species as a group comprised 15% of theunderstory layer and Carya species comprised 7%. We did not findany Pinus in the understory. We documented only one arborealspecies in the regeneration layer that was absent from the over-story layer; Magnolia accuminata, representing less than threestems ha�1. No woody alien species were documented in our over-story or understory plots.
When the relative contribution of species were grouped and ana-lyzed by crown position a clear pattern emerged where Quercus andPinus species were most abundant in canopy positions and Acer and‘‘other’’ species were most abundant in subcanopy positions (Fig. 2).We documented 11 individuals ha�1 with canopy dominant posi-tions and 185 trees ha�1 with codominant positions in the canopy.Seven species were represented in canopy dominant positions withP. echinata being the most common (represented 26% of all canopydominants). At the genus-level, 54% of all canopy dominants wereQuercus. No canopy dominant individuals were recorded outsideof the genera Pinus, Quercus, and Acer. A total of 15 species occurredin canopy codominant positions. At the genus level, Quercus had thehighest relative density of codominant trees followed by Pinus. TheQuercus and Pinus genera combined represented 92% and 70% of allcanopy dominants and codominants, respectively. A total of103 trees ha�1 were classed as intermediate. The most common
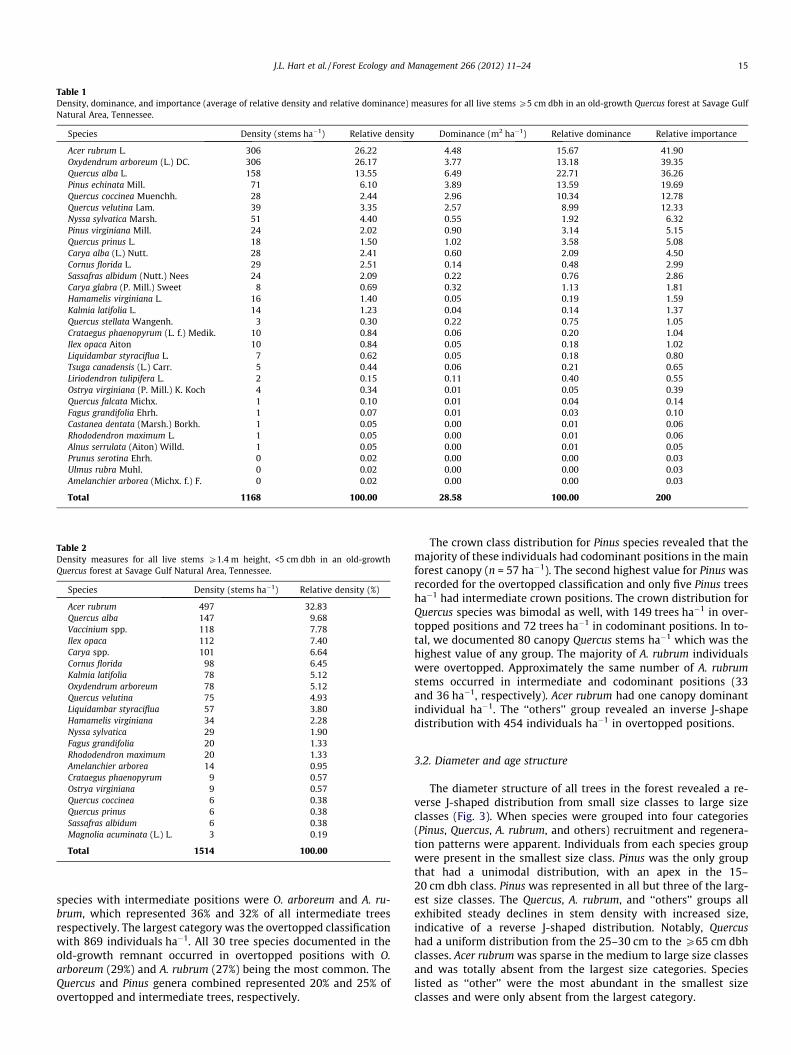
Table 1Density, dominance, and importance (average of relative density and relative dominance) measures for all live stems P5 cm dbh in an old-growth Quercus forest at Savage GulfNatural Area, Tennessee.
Species Density (stems ha�1) Relative density Dominance (m2 ha�1) Relative dominance Relative importance
Acer rubrum L. 306 26.22 4.48 15.67 41.90Oxydendrum arboreum (L.) DC. 306 26.17 3.77 13.18 39.35Quercus alba L. 158 13.55 6.49 22.71 36.26Pinus echinata Mill. 71 6.10 3.89 13.59 19.69Quercus coccinea Muenchh. 28 2.44 2.96 10.34 12.78Quercus velutina Lam. 39 3.35 2.57 8.99 12.33Nyssa sylvatica Marsh. 51 4.40 0.55 1.92 6.32Pinus virginiana Mill. 24 2.02 0.90 3.14 5.15Quercus prinus L. 18 1.50 1.02 3.58 5.08Carya alba (L.) Nutt. 28 2.41 0.60 2.09 4.50Cornus florida L. 29 2.51 0.14 0.48 2.99Sassafras albidum (Nutt.) Nees 24 2.09 0.22 0.76 2.86Carya glabra (P. Mill.) Sweet 8 0.69 0.32 1.13 1.81Hamamelis virginiana L. 16 1.40 0.05 0.19 1.59Kalmia latifolia L. 14 1.23 0.04 0.14 1.37Quercus stellata Wangenh. 3 0.30 0.22 0.75 1.05Crataegus phaenopyrum (L. f.) Medik. 10 0.84 0.06 0.20 1.04Ilex opaca Aiton 10 0.84 0.05 0.18 1.02Liquidambar styraciflua L. 7 0.62 0.05 0.18 0.80Tsuga canadensis (L.) Carr. 5 0.44 0.06 0.21 0.65Liriodendron tulipifera L. 2 0.15 0.11 0.40 0.55Ostrya virginiana (P. Mill.) K. Koch 4 0.34 0.01 0.05 0.39Quercus falcata Michx. 1 0.10 0.01 0.04 0.14Fagus grandifolia Ehrh. 1 0.07 0.01 0.03 0.10Castanea dentata (Marsh.) Borkh. 1 0.05 0.00 0.01 0.06Rhododendron maximum L. 1 0.05 0.00 0.01 0.06Alnus serrulata (Aiton) Willd. 1 0.05 0.00 0.01 0.05Prunus serotina Ehrh. 0 0.02 0.00 0.00 0.03Ulmus rubra Muhl. 0 0.02 0.00 0.00 0.03Amelanchier arborea (Michx. f.) F. 0 0.02 0.00 0.00 0.03
Total 1168 100.00 28.58 100.00 200
Table 2Density measures for all live stems P1.4 m height, <5 cm dbh in an old-growthQuercus forest at Savage Gulf Natural Area, Tennessee.
Species Density (stems ha�1) Relative density (%)
Acer rubrum 497 32.83Quercus alba 147 9.68Vaccinium spp. 118 7.78Ilex opaca 112 7.40Carya spp. 101 6.64Cornus florida 98 6.45Kalmia latifolia 78 5.12Oxydendrum arboreum 78 5.12Quercus velutina 75 4.93Liquidambar styraciflua 57 3.80Hamamelis virginiana 34 2.28Nyssa sylvatica 29 1.90Fagus grandifolia 20 1.33Rhododendron maximum 20 1.33Amelanchier arborea 14 0.95Crataegus phaenopyrum 9 0.57Ostrya virginiana 9 0.57Quercus coccinea 6 0.38Quercus prinus 6 0.38Sassafras albidum 6 0.38Magnolia acuminata (L.) L. 3 0.19
Total 1514 100.00
J.L. Hart et al. / Forest Ecology and Management 266 (2012) 11–24 15
species with intermediate positions were O. arboreum and A. ru-brum, which represented 36% and 32% of all intermediate treesrespectively. The largest category was the overtopped classificationwith 869 individuals ha�1. All 30 tree species documented in theold-growth remnant occurred in overtopped positions with O.arboreum (29%) and A. rubrum (27%) being the most common. TheQuercus and Pinus genera combined represented 20% and 25% ofovertopped and intermediate trees, respectively.
The crown class distribution for Pinus species revealed that themajority of these individuals had codominant positions in the mainforest canopy (n = 57 ha�1). The second highest value for Pinus wasrecorded for the overtopped classification and only five Pinus treesha�1 had intermediate crown positions. The crown distribution forQuercus species was bimodal as well, with 149 trees ha�1 in over-topped positions and 72 trees ha�1 in codominant positions. In to-tal, we documented 80 canopy Quercus stems ha�1 which was thehighest value of any group. The majority of A. rubrum individualswere overtopped. Approximately the same number of A. rubrumstems occurred in intermediate and codominant positions (33and 36 ha�1, respectively). Acer rubrum had one canopy dominantindividual ha�1. The ‘‘others’’ group revealed an inverse J-shapedistribution with 454 individuals ha�1 in overtopped positions.
3.2. Diameter and age structure
The diameter structure of all trees in the forest revealed a re-verse J-shaped distribution from small size classes to large sizeclasses (Fig. 3). When species were grouped into four categories(Pinus, Quercus, A. rubrum, and others) recruitment and regenera-tion patterns were apparent. Individuals from each species groupwere present in the smallest size class. Pinus was the only groupthat had a unimodal distribution, with an apex in the 15–20 cm dbh class. Pinus was represented in all but three of the larg-est size classes. The Quercus, A. rubrum, and ‘‘others’’ groups allexhibited steady declines in stem density with increased size,indicative of a reverse J-shaped distribution. Notably, Quercushad a uniform distribution from the 25–30 cm to the P65 cm dbhclasses. Acer rubrum was sparse in the medium to large size classesand was totally absent from the largest size categories. Specieslisted as ‘‘other’’ were the most abundant in the smallest sizeclasses and were only absent from the largest category.
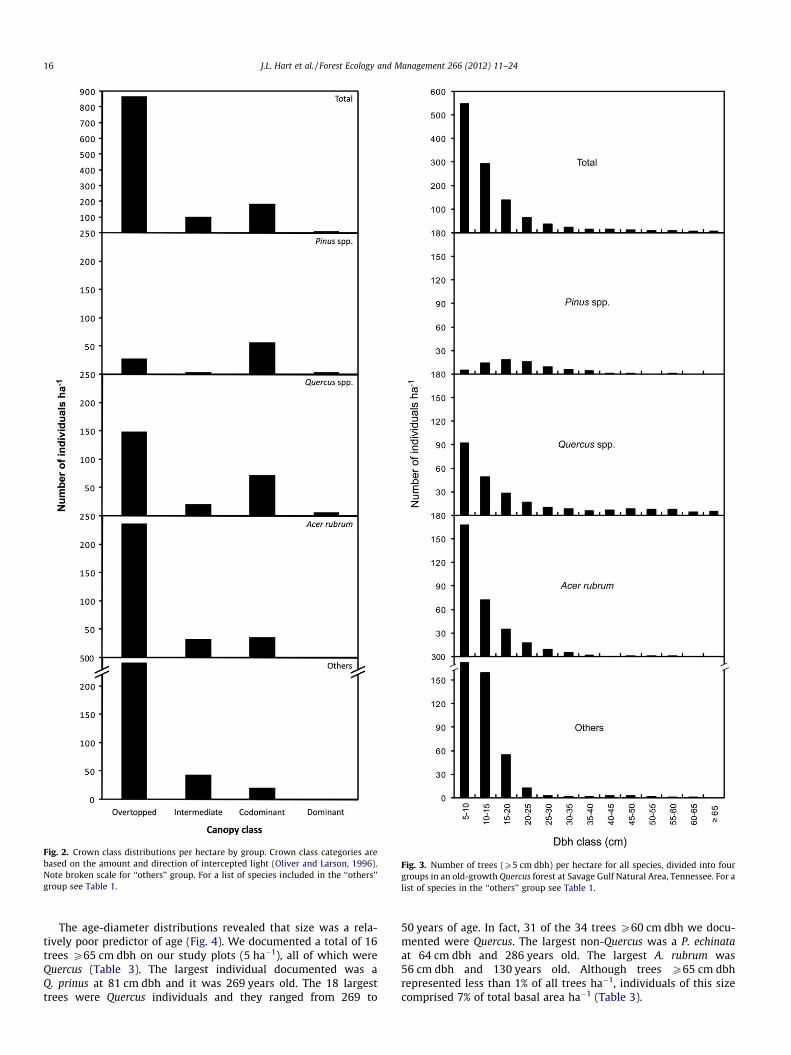
Fig. 2. Crown class distributions per hectare by group. Crown class categories arebased on the amount and direction of intercepted light (Oliver and Larson, 1996).Note broken scale for ‘‘others’’ group. For a list of species included in the ‘‘others’’group see Table 1.
Fig. 3. Number of trees (P5 cm dbh) per hectare for all species, divided into fourgroups in an old-growth Quercus forest at Savage Gulf Natural Area, Tennessee. For alist of species in the ‘‘others’’ group see Table 1.
16 J.L. Hart et al. / Forest Ecology and Management 266 (2012) 11–24
The age-diameter distributions revealed that size was a rela-tively poor predictor of age (Fig. 4). We documented a total of 16trees P65 cm dbh on our study plots (5 ha�1), all of which wereQuercus (Table 3). The largest individual documented was aQ. prinus at 81 cm dbh and it was 269 years old. The 18 largesttrees were Quercus individuals and they ranged from 269 to
50 years of age. In fact, 31 of the 34 trees P60 cm dbh we docu-mented were Quercus. The largest non-Quercus was a P. echinataat 64 cm dbh and 286 years old. The largest A. rubrum was56 cm dbh and 130 years old. Although trees P65 cm dbhrepresented less than 1% of all trees ha�1, individuals of this sizecomprised 7% of total basal area ha�1 (Table 3).
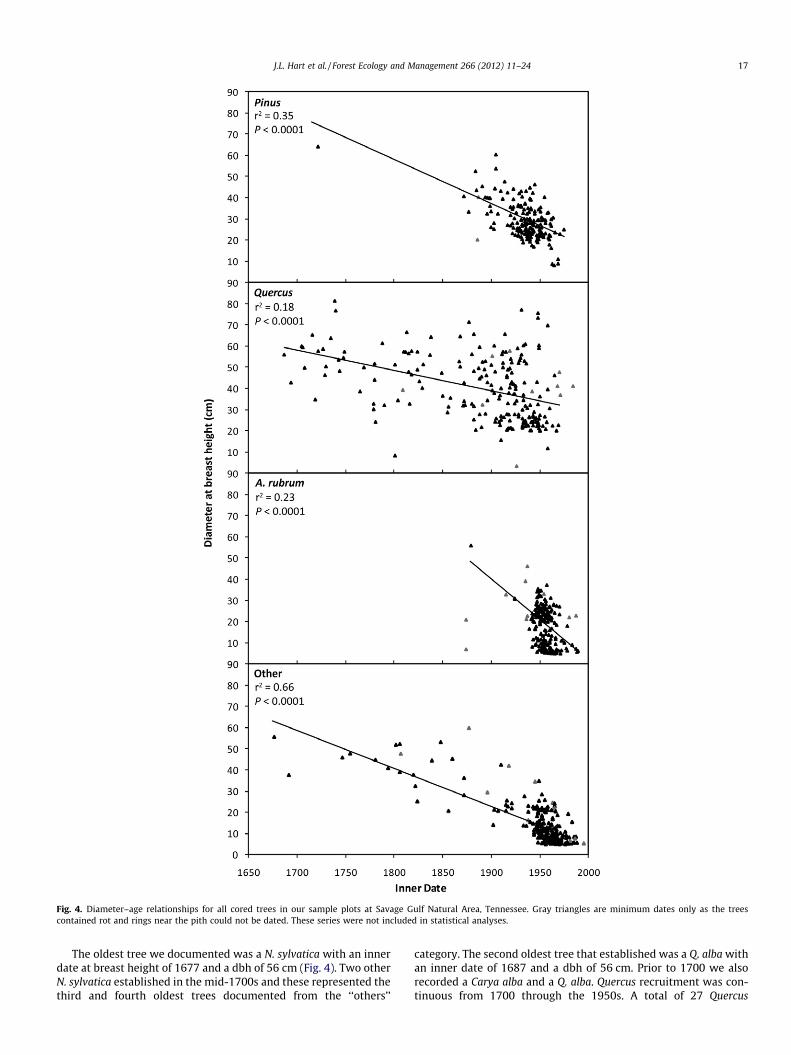
Fig. 4. Diameter–age relationships for all cored trees in our sample plots at Savage Gulf Natural Area, Tennessee. Gray triangles are minimum dates only as the treescontained rot and rings near the pith could not be dated. These series were not included in statistical analyses.
J.L. Hart et al. / Forest Ecology and Management 266 (2012) 11–24 17
The oldest tree we documented was a N. sylvatica with an innerdate at breast height of 1677 and a dbh of 56 cm (Fig. 4). Two otherN. sylvatica established in the mid-1700s and these represented thethird and fourth oldest trees documented from the ‘‘others’’
category. The second oldest tree that established was a Q. alba withan inner date of 1687 and a dbh of 56 cm. Prior to 1700 we alsorecorded a Carya alba and a Q. alba. Quercus recruitment was con-tinuous from 1700 through the 1950s. A total of 27 Quercus
Table 3Density (stems ha�1 and percent (%) of total stems ha�1) and basal area (m2 ha�1 andpercent (%) of total basal area ha�1) by diameter at breast height (cm) class in an old-growth Quercus forest at Savage Gulf Natural Area, Tennessee.
Density Basal area
DBH (cm) Stems ha�1 Percentof total
Basal areaha�1
Percentof total
P5 1168 100 28.6 100P10 620 53 26.0 91P20 189 16 19.4 68P65 5 <1 1.9 7
18 J.L. Hart et al. / Forest Ecology and Management 266 (2012) 11–24
established prior to 1800. Of these, 89% were Q. alba. A pulse ofQuercus recruitment occurred from 1910 to 1940. Composition ofthis younger Quercus age class was not dominated by a singleQuercus species. The oldest Pinus individual was a P. echinata with
Table 4Density (stems ha�1), relative density (%), basal area (m2 ha�1), and relative basal area(%) to the lowest taxonomic level identified for snags in an old-growth Quercus forestat Savage Gulf Natural Area, Tennessee.
Species Density(stems ha�1)
Relativedensity
Basal area(m2 ha�1)
Relativebasal area
Acer rubrum 10 7.74 0.08 3.23Carya unidentified 1 0.44 0.00 0.08Carya glabra 0 0.22 0.01 0.24Carya alba 0 0.22 0.00 0.03Cornus florida 10 7.52 0.05 1.92Crataegus phaenopyrum 1 0.66 0.00 0.13Hamamelis virginiana 0 0.22 0.00 0.09Liriodendron tulipifera 0 0.22 0.08 3.15Nyssa sylvatica 3 2.43 0.08 3.29Ostrya virginiana 0 0.22 0.00 0.03Oxydendrum arboreum 22 17.26 0.22 9.14Pinus unidentified 2 1.33 0.04 1.62Pinus echinata 16 11.95 0.41 16.74Pinus virginiana 5 3.54 0.07 2.76Quercus unidentified 9 6.64 0.55 22.63Quercus alba 26 19.91 0.33 13.47Quercus coccinea 5 3.98 0.24 9.67Quercus prinus 2 1.55 0.02 0.69Quercus velutina 4 3.10 0.17 6.79Sassafras albidum 1 0.88 0.00 0.12Tsuga canadensis 0 0.22 0.00 0.06Unidentified 13 9.73 0.10 4.12
Total 130 100.00 2.44 100.00
Fig. 5. Number of snags (P5 cm dbh) per hectare by diameter class interval
an inner date at breast height of 1722. No Pinus individuals weredocumented with inner dates between 1722 and 1872. After thisperiod, moderate Pinus recruitment occurred from the 1870s untila major recruitment pulse began in the 1910s that lasted throughthe 1940s. The oldest A. rubrum had an inner date at breast heightof 1878 (with a dbh of 56 cm) and two other A. rubrum establishedprior to 1900 but decay prevented us from establishing a pith date.Acer rubrum exhibited a prominent recruitment pulse from the1940s until the 1960s. Within the ‘‘others’’ group, recruitmentfrom the late-1700s through the late-1800s was dominated byCarya species (92% of such trees). A recruitment pulse within thiscategory began in the 1940s and was largely comprised of O.arboreum. In fact, 88% of trees in the ‘‘other’’ class that establishedfrom 1940 to 1960 were O. arboreum.
3.3. Snag characteristics
We recorded 130 snags P5 cm dbh ha�1 across the study site.These snags represented 18 different species (Table 4). In total,we were able to identify 81% of all snags to the species level and90% to the genus level. The majority (73%) of snags only identifiedto the genus were Quercus. Q. alba, O. arboreum, and P. echinata hadthe highest relative snag densities (Table 4). Combined these spe-cies represented 49% of all snags. At the species level, P. echinataand Q. alba represented the most snag basal area, and Quercus com-prised over 46% of snag basal area. Mean snag dbh was 12 cm ±0.5 (SE) with a maximum of 74 cm for a Quercus individual. The ba-sal area of snags was 2.44 m2 ha�1. Snags were most abundant inthe smallest dbh class and frequency generally decreased with in-creased size, indicative of a reverse J-shaped distribution (Fig. 5).Decay class 4 had the highest density of snags and decay class 1had the lowest snag density (Fig. 6). A similar pattern was foundfor the basal area of snags across decay classes, with class 4 havingthe greatest value and class 1 having the lowest. The advanceddecay classes had a higher number of snags and more biomass rel-ative to the less decayed classes.
3.4. Dendroecology
From the 200 overstory Quercus individuals analyzed using the10-year running mean method, 146 (73%) exhibited at least one re-lease event. A total of 295 release events were detected from the146 individuals with 74 (51%) trees experiencing multiple releases(Fig. 7). Of the 295 detected release events, 237 (80%) were minorand 58 (20%) were major. The longest sustained release was
in an old-growth Quercus forest at Savage Gulf Natural Area, Tennessee.
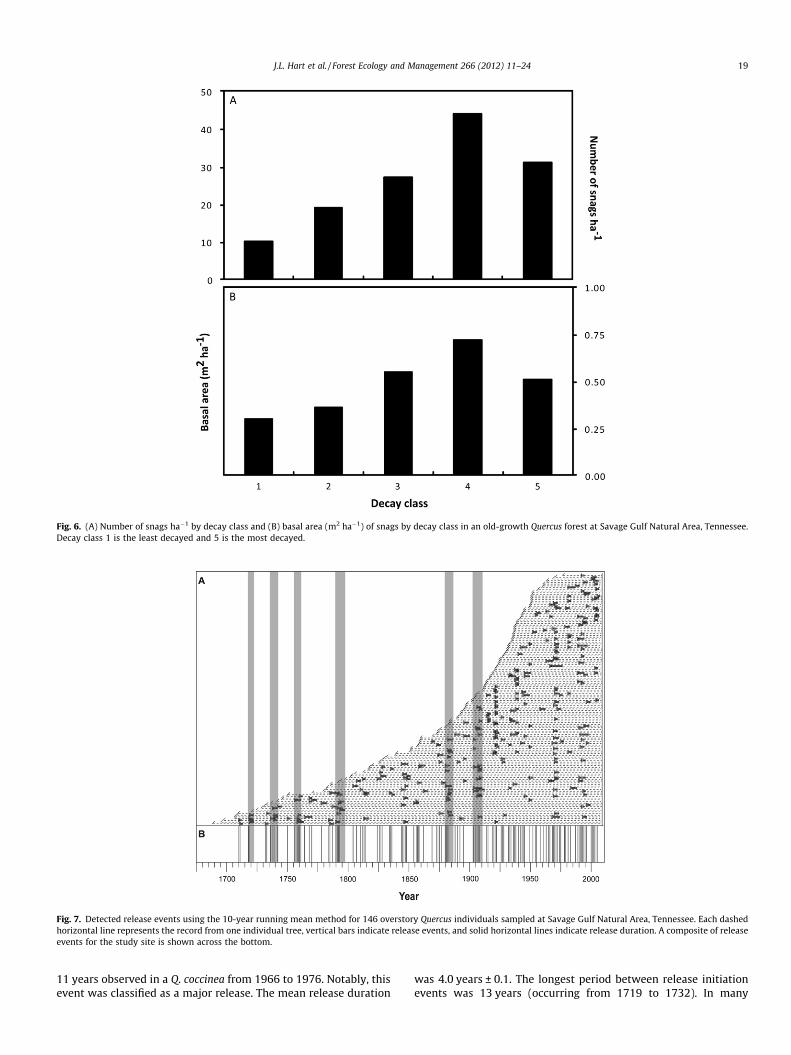
Fig. 6. (A) Number of snags ha�1 by decay class and (B) basal area (m2 ha�1) of snags by decay class in an old-growth Quercus forest at Savage Gulf Natural Area, Tennessee.Decay class 1 is the least decayed and 5 is the most decayed.
Fig. 7. Detected release events using the 10-year running mean method for 146 overstory Quercus individuals sampled at Savage Gulf Natural Area, Tennessee. Each dashedhorizontal line represents the record from one individual tree, vertical bars indicate release events, and solid horizontal lines indicate release duration. A composite of releaseevents for the study site is shown across the bottom.
J.L. Hart et al. / Forest Ecology and Management 266 (2012) 11–24 19
11 years observed in a Q. coccinea from 1966 to 1976. Notably, thisevent was classified as a major release. The mean release duration
was 4.0 years ± 0.1. The longest period between release initiationevents was 13 years (occurring from 1719 to 1732). In many
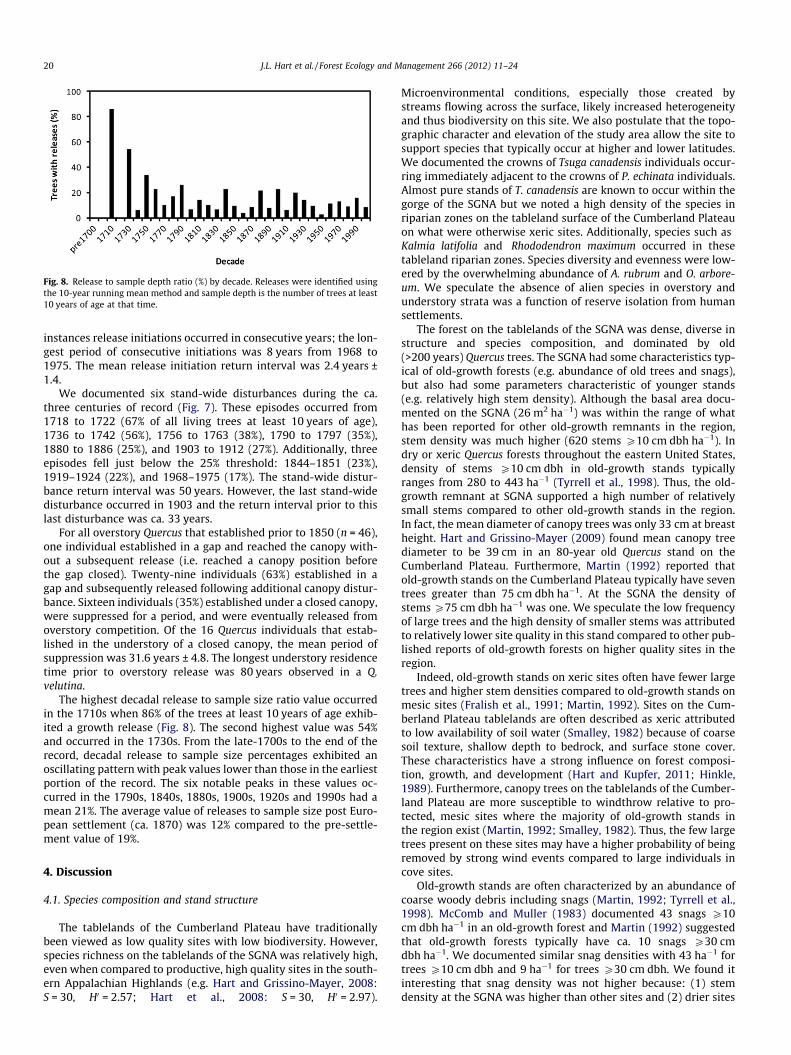
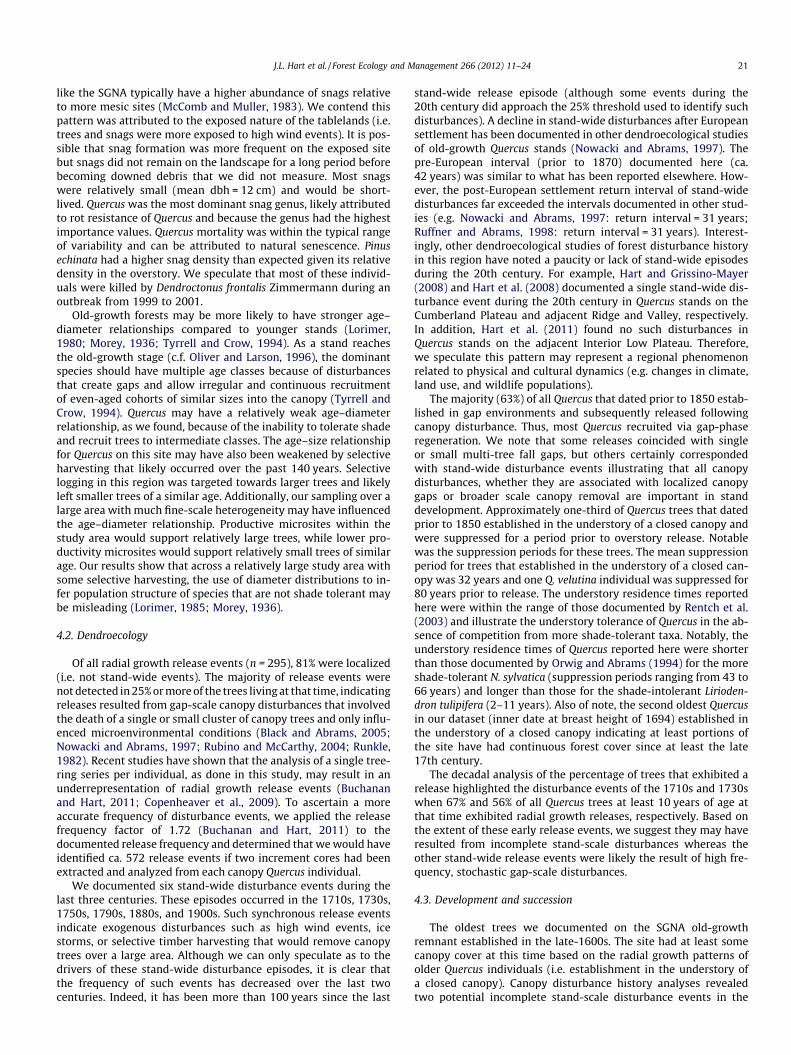
Fig. 8. Release to sample depth ratio (%) by decade. Releases were identified usingthe 10-year running mean method and sample depth is the number of trees at least10 years of age at that time.
20 J.L. Hart et al. / Forest Ecology and Management 266 (2012) 11–24
instances release initiations occurred in consecutive years; the lon-gest period of consecutive initiations was 8 years from 1968 to1975. The mean release initiation return interval was 2.4 years ±1.4.
We documented six stand-wide disturbances during the ca.three centuries of record (Fig. 7). These episodes occurred from1718 to 1722 (67% of all living trees at least 10 years of age),1736 to 1742 (56%), 1756 to 1763 (38%), 1790 to 1797 (35%),1880 to 1886 (25%), and 1903 to 1912 (27%). Additionally, threeepisodes fell just below the 25% threshold: 1844–1851 (23%),1919–1924 (22%), and 1968–1975 (17%). The stand-wide distur-bance return interval was 50 years. However, the last stand-widedisturbance occurred in 1903 and the return interval prior to thislast disturbance was ca. 33 years.
For all overstory Quercus that established prior to 1850 (n = 46),one individual established in a gap and reached the canopy with-out a subsequent release (i.e. reached a canopy position beforethe gap closed). Twenty-nine individuals (63%) established in agap and subsequently released following additional canopy distur-bance. Sixteen individuals (35%) established under a closed canopy,were suppressed for a period, and were eventually released fromoverstory competition. Of the 16 Quercus individuals that estab-lished in the understory of a closed canopy, the mean period ofsuppression was 31.6 years ± 4.8. The longest understory residencetime prior to overstory release was 80 years observed in a Q.velutina.
The highest decadal release to sample size ratio value occurredin the 1710s when 86% of the trees at least 10 years of age exhib-ited a growth release (Fig. 8). The second highest value was 54%and occurred in the 1730s. From the late-1700s to the end of therecord, decadal release to sample size percentages exhibited anoscillating pattern with peak values lower than those in the earliestportion of the record. The six notable peaks in these values oc-curred in the 1790s, 1840s, 1880s, 1900s, 1920s and 1990s had amean 21%. The average value of releases to sample size post Euro-pean settlement (ca. 1870) was 12% compared to the pre-settle-ment value of 19%.
4. Discussion
4.1. Species composition and stand structure
The tablelands of the Cumberland Plateau have traditionallybeen viewed as low quality sites with low biodiversity. However,species richness on the tablelands of the SGNA was relatively high,even when compared to productive, high quality sites in the south-ern Appalachian Highlands (e.g. Hart and Grissino-Mayer, 2008:S = 30, H0 = 2.57; Hart et al., 2008: S = 30, H0 = 2.97).
Microenvironmental conditions, especially those created bystreams flowing across the surface, likely increased heterogeneityand thus biodiversity on this site. We also postulate that the topo-graphic character and elevation of the study area allow the site tosupport species that typically occur at higher and lower latitudes.We documented the crowns of Tsuga canadensis individuals occur-ring immediately adjacent to the crowns of P. echinata individuals.Almost pure stands of T. canadensis are known to occur within thegorge of the SGNA but we noted a high density of the species inriparian zones on the tableland surface of the Cumberland Plateauon what were otherwise xeric sites. Additionally, species such asKalmia latifolia and Rhododendron maximum occurred in thesetableland riparian zones. Species diversity and evenness were low-ered by the overwhelming abundance of A. rubrum and O. arbore-um. We speculate the absence of alien species in overstory andunderstory strata was a function of reserve isolation from humansettlements.
The forest on the tablelands of the SGNA was dense, diverse instructure and species composition, and dominated by old(>200 years) Quercus trees. The SGNA had some characteristics typ-ical of old-growth forests (e.g. abundance of old trees and snags),but also had some parameters characteristic of younger stands(e.g. relatively high stem density). Although the basal area docu-mented on the SGNA (26 m2 ha�1) was within the range of whathas been reported for other old-growth remnants in the region,stem density was much higher (620 stems P10 cm dbh ha�1). Indry or xeric Quercus forests throughout the eastern United States,density of stems P10 cm dbh in old-growth stands typicallyranges from 280 to 443 ha�1 (Tyrrell et al., 1998). Thus, the old-growth remnant at SGNA supported a high number of relativelysmall stems compared to other old-growth stands in the region.In fact, the mean diameter of canopy trees was only 33 cm at breastheight. Hart and Grissino-Mayer (2009) found mean canopy treediameter to be 39 cm in an 80-year old Quercus stand on theCumberland Plateau. Furthermore, Martin (1992) reported thatold-growth stands on the Cumberland Plateau typically have seventrees greater than 75 cm dbh ha�1. At the SGNA the density ofstems P75 cm dbh ha�1 was one. We speculate the low frequencyof large trees and the high density of smaller stems was attributedto relatively lower site quality in this stand compared to other pub-lished reports of old-growth forests on higher quality sites in theregion.
Indeed, old-growth stands on xeric sites often have fewer largetrees and higher stem densities compared to old-growth stands onmesic sites (Fralish et al., 1991; Martin, 1992). Sites on the Cum-berland Plateau tablelands are often described as xeric attributedto low availability of soil water (Smalley, 1982) because of coarsesoil texture, shallow depth to bedrock, and surface stone cover.These characteristics have a strong influence on forest composi-tion, growth, and development (Hart and Kupfer, 2011; Hinkle,1989). Furthermore, canopy trees on the tablelands of the Cumber-land Plateau are more susceptible to windthrow relative to pro-tected, mesic sites where the majority of old-growth stands inthe region exist (Martin, 1992; Smalley, 1982). Thus, the few largetrees present on these sites may have a higher probability of beingremoved by strong wind events compared to large individuals incove sites.
Old-growth stands are often characterized by an abundance ofcoarse woody debris including snags (Martin, 1992; Tyrrell et al.,1998). McComb and Muller (1983) documented 43 snags P10cm dbh ha�1 in an old-growth forest and Martin (1992) suggestedthat old-growth forests typically have ca. 10 snags P30 cmdbh ha�1. We documented similar snag densities with 43 ha�1 fortrees P10 cm dbh and 9 ha�1 for trees P30 cm dbh. We found itinteresting that snag density was not higher because: (1) stemdensity at the SGNA was higher than other sites and (2) drier sites
J.L. Hart et al. / Forest Ecology and Management 266 (2012) 11–24 21
like the SGNA typically have a higher abundance of snags relativeto more mesic sites (McComb and Muller, 1983). We contend thispattern was attributed to the exposed nature of the tablelands (i.e.trees and snags were more exposed to high wind events). It is pos-sible that snag formation was more frequent on the exposed sitebut snags did not remain on the landscape for a long period beforebecoming downed debris that we did not measure. Most snagswere relatively small (mean dbh = 12 cm) and would be short-lived. Quercus was the most dominant snag genus, likely attributedto rot resistance of Quercus and because the genus had the highestimportance values. Quercus mortality was within the typical rangeof variability and can be attributed to natural senescence. Pinusechinata had a higher snag density than expected given its relativedensity in the overstory. We speculate that most of these individ-uals were killed by Dendroctonus frontalis Zimmermann during anoutbreak from 1999 to 2001.
Old-growth forests may be more likely to have stronger age–diameter relationships compared to younger stands (Lorimer,1980; Morey, 1936; Tyrrell and Crow, 1994). As a stand reachesthe old-growth stage (c.f. Oliver and Larson, 1996), the dominantspecies should have multiple age classes because of disturbancesthat create gaps and allow irregular and continuous recruitmentof even-aged cohorts of similar sizes into the canopy (Tyrrell andCrow, 1994). Quercus may have a relatively weak age–diameterrelationship, as we found, because of the inability to tolerate shadeand recruit trees to intermediate classes. The age–size relationshipfor Quercus on this site may have also been weakened by selectiveharvesting that likely occurred over the past 140 years. Selectivelogging in this region was targeted towards larger trees and likelyleft smaller trees of a similar age. Additionally, our sampling over alarge area with much fine-scale heterogeneity may have influencedthe age–diameter relationship. Productive microsites within thestudy area would support relatively large trees, while lower pro-ductivity microsites would support relatively small trees of similarage. Our results show that across a relatively large study area withsome selective harvesting, the use of diameter distributions to in-fer population structure of species that are not shade tolerant maybe misleading (Lorimer, 1985; Morey, 1936).
4.2. Dendroecology
Of all radial growth release events (n = 295), 81% were localized(i.e. not stand-wide events). The majority of release events werenot detected in 25% or more of the trees living at that time, indicatingreleases resulted from gap-scale canopy disturbances that involvedthe death of a single or small cluster of canopy trees and only influ-enced microenvironmental conditions (Black and Abrams, 2005;Nowacki and Abrams, 1997; Rubino and McCarthy, 2004; Runkle,1982). Recent studies have shown that the analysis of a single tree-ring series per individual, as done in this study, may result in anunderrepresentation of radial growth release events (Buchananand Hart, 2011; Copenheaver et al., 2009). To ascertain a moreaccurate frequency of disturbance events, we applied the releasefrequency factor of 1.72 (Buchanan and Hart, 2011) to thedocumented release frequency and determined that we would haveidentified ca. 572 release events if two increment cores had beenextracted and analyzed from each canopy Quercus individual.
We documented six stand-wide disturbance events during thelast three centuries. These episodes occurred in the 1710s, 1730s,1750s, 1790s, 1880s, and 1900s. Such synchronous release eventsindicate exogenous disturbances such as high wind events, icestorms, or selective timber harvesting that would remove canopytrees over a large area. Although we can only speculate as to thedrivers of these stand-wide disturbance episodes, it is clear thatthe frequency of such events has decreased over the last twocenturies. Indeed, it has been more than 100 years since the last
stand-wide release episode (although some events during the20th century did approach the 25% threshold used to identify suchdisturbances). A decline in stand-wide disturbances after Europeansettlement has been documented in other dendroecological studiesof old-growth Quercus stands (Nowacki and Abrams, 1997). Thepre-European interval (prior to 1870) documented here (ca.42 years) was similar to what has been reported elsewhere. How-ever, the post-European settlement return interval of stand-widedisturbances far exceeded the intervals documented in other stud-ies (e.g. Nowacki and Abrams, 1997: return interval = 31 years;Ruffner and Abrams, 1998: return interval = 31 years). Interest-ingly, other dendroecological studies of forest disturbance historyin this region have noted a paucity or lack of stand-wide episodesduring the 20th century. For example, Hart and Grissino-Mayer(2008) and Hart et al. (2008) documented a single stand-wide dis-turbance event during the 20th century in Quercus stands on theCumberland Plateau and adjacent Ridge and Valley, respectively.In addition, Hart et al. (2011) found no such disturbances inQuercus stands on the adjacent Interior Low Plateau. Therefore,we speculate this pattern may represent a regional phenomenonrelated to physical and cultural dynamics (e.g. changes in climate,land use, and wildlife populations).
The majority (63%) of all Quercus that dated prior to 1850 estab-lished in gap environments and subsequently released followingcanopy disturbance. Thus, most Quercus recruited via gap-phaseregeneration. We note that some releases coincided with singleor small multi-tree fall gaps, but others certainly correspondedwith stand-wide disturbance events illustrating that all canopydisturbances, whether they are associated with localized canopygaps or broader scale canopy removal are important in standdevelopment. Approximately one-third of Quercus trees that datedprior to 1850 established in the understory of a closed canopy andwere suppressed for a period prior to overstory release. Notablewas the suppression periods for these trees. The mean suppressionperiod for trees that established in the understory of a closed can-opy was 32 years and one Q. velutina individual was suppressed for80 years prior to release. The understory residence times reportedhere were within the range of those documented by Rentch et al.(2003) and illustrate the understory tolerance of Quercus in the ab-sence of competition from more shade-tolerant taxa. Notably, theunderstory residence times of Quercus reported here were shorterthan those documented by Orwig and Abrams (1994) for the moreshade-tolerant N. sylvatica (suppression periods ranging from 43 to66 years) and longer than those for the shade-intolerant Lirioden-dron tulipifera (2–11 years). Also of note, the second oldest Quercusin our dataset (inner date at breast height of 1694) established inthe understory of a closed canopy indicating at least portions ofthe site have had continuous forest cover since at least the late17th century.
The decadal analysis of the percentage of trees that exhibited arelease highlighted the disturbance events of the 1710s and 1730swhen 67% and 56% of all Quercus trees at least 10 years of age atthat time exhibited radial growth releases, respectively. Based onthe extent of these early release events, we suggest they may haveresulted from incomplete stand-scale disturbances whereas theother stand-wide release events were likely the result of high fre-quency, stochastic gap-scale disturbances.
4.3. Development and succession
The oldest trees we documented on the SGNA old-growthremnant established in the late-1600s. The site had at least somecanopy cover at this time based on the radial growth patterns ofolder Quercus individuals (i.e. establishment in the understory ofa closed canopy). Canopy disturbance history analyses revealedtwo potential incomplete stand-scale disturbance events in the
22 J.L. Hart et al. / Forest Ecology and Management 266 (2012) 11–24
early 1700s. Quercus recruitment was continuous on the site sincethe late-1600s. Most Quercus individuals that established prior to1850 recruited via gap-phase regeneration, but ca. one-third ofsuch trees established in the understory of a closed canopy andwere suppressed for a period prior to overstory release.
Only one Pinus individual on our study plots established prior to1850, in 1722 coincident with a stand-wide release. The increase ofPinus recruitment in the late-1800s that lasted through the 1940slargely coincided with stand-wide canopy disturbance events.Although few old Pinus trees were recorded on our study plots, P.echinata was capable of attaining more than 280 years of age onthe site. A narrow-gauge rail system was established through por-tions of the SGNA in the early 1900s for the main purpose of log-ging for large Pinus trees (B. Werner, personal communication).Selective logging at the turn of the century, particularly for railroadties, likely contributed to the demise of the older age classes of thisspecies except in remote areas of the SGNA.
The major onset of Acer establishment began in the 1940s. Onlythree Acer individuals established prior to 1900. Unlike the Pinusestablishment pulses, Acer establishment did not correspond tostand-wide disturbance events. Although some of these Acer treescertainly established in canopy gaps, many established under aclosed canopy. Acer is shade-tolerant and can withstand long peri-ods of suppression before overstory release (Canham, 1985).
We speculate that over the last three centuries the stand has beendominated by Quercus with patches of Pinus that established in can-opy gaps. Over the last 70 years Acer became abundant in the under-story. Age and diameter structure indicate a shift in speciescomposition away from Quercus and towards an A. rubrum domi-nated stand. This same species shift has been widely reportedthroughout the Central Hardwood Forest of North America (Abrams,1998; McEwan et al., 2011; Nowacki and Abrams, 2008). Canopytrees greater than 120 years of age were almost completely com-prised of Quercus and Pinus species whereas younger trees and theregeneration layer received small contributions from these generaand large contributions from A. rubrum and the ‘‘other’’ class (e.g.O. arboreum, N. sylvatica, Cornus florida, Sassafras albidum). We con-tend the lack of older cohorts of A. rubrum and some of the speciesin the ‘‘other’’ class (e.g. N. sylvatica) is not attributed to short longev-ity of these species. In fact, N. sylvatica is capable of attaining old ages(300–600 years) as seen in this study and others (Abrams, 2007;Abrams and Orwig, 1996). Although the maximum age of A. rubrumhas typically been reported to by less than 150 years in eastern old-growth stands (Abrams and Downs, 1990; Abrams and Orwig, 1996;Lorimer, 1980), the species has been shown to reach 300 years of age(Pederson et al., 2007).
A major question in the development of this stand is what factoror factors changed over the last century that allowed for the profu-sion of A. rubrum. The most often cited explanation for the Quercusto Acer transition has been changes in fire regimes, specifically ac-tive fire suppression that began in the early 20th century. Quercusare considered tolerant of fire as they typically have thick bark, theability to stump sprout, and resist rot after scarring (Abrams, 1992;Smith and Sutherland, 1999). In contrast, Acer are thin barked andshallow rooted and thus sensitive to fire. It is widely hypothesizedthat historic surface fire maintained Quercus dominance on manysites throughout the Central Hardwood Forest by removingshade-tolerant and fire-sensitive competition from the understory(Abrams, 1992; Lorimer, 2001; Nowacki and Abrams, 2008). In theabsence of intense competition, Quercus can withstand prolongedperiods of understory suppression as documented in this studyand others (e.g. Rentch et al., 2003). In the absence of frequent fire,A. rubrum can become dense in the understory and inhibit Quercusrecruitment thereby altering stand development and forest succes-sion (i.e. mesophication; Lorimer et al., 1994; Nowacki andAbrams, 2008). Although alternative hypotheses have been
proposed to explain the Quercus to Acer phenomenon (e.g. growingseason climate change, alterations in land use, facilitative pro-cesses, extirpation of species such as Castanea dentata (Marsh.)Borkh., and changes in wildlife population densities (Lorimer,1993; Hart et al., 2008; McEwan et al., 2011)), the fire hypothesisis unquestionably the dominant paradigm. Although we do notknow the history of fire on the site, we know the frequency ofstand-wide canopy disturbance events across the old-growth rem-nant has changed in the past three centuries. Stand-wide canopydisturbances preceded and succeeded European settlement, butnone have occurred since 1903. Although we do not understandthe process or processes responsible for this pattern, we speculatethat the disturbance agents that created stand-scale release eventshave been absent for over 100 years. Alteration of the disturbanceregime has likely influenced forest structure and function and maybe related to the documented shift in species composition.
5. Management implications
If the documented successional pattern is not driven by anthro-pogenic means, then managers of the natural area need not be con-cerned about the future trajectory of this old-growth stand.However, if the Quercus to Acer pattern is anthropogenic as manyauthors have proposed (e.g. Abrams and Nowacki, 2008; Fei andSteiner, 2009; McEwan et al., 2011; Nowacki and Abrams, 2008),resource managers should actively manage the stand to returnthe site composition and structure to within its historic range ofvariability. Silvicultural treatments through timber harvesting arenot allowed in a Tennessee State Natural Area. Without forestmanagement, this designated natural area (along with many othersin the Central Hardwood Forest) may become less ‘‘natural’’ withthe continued invasion of Acer and inhibition of Quercus and Pinus.
To maintain the Quercus and Pinus components in this system,resource managers would likely need to: (1) create canopy gapsand (2) remove shade-tolerant competition from the understory.Because harvesting is not a management option, prescribed firein conjunction with the timing of natural disturbances that createcanopy gaps may be a viable means to restore forest conditions tothose prior to the onset of the Acer invasion in the mid-1900s(Abrams, 2005). Low intensity, surface fires may not have beenthe mechanisms that historically prevented Acer establishmenton the site (McEwan et al., 2011); however, given the constraintsof management guidelines and the drastic changes in other poten-tial drivers, this management option may now be the most viable.
Acknowledgments
Funding was provided by the USDA Forest Service (USFS),Southern Research Station, the University of Alabama (UA), andthe University of the South (US). We thank C. Schweitzer (USFS)for assistance in securing resources for this project. We thank N.Brown (USFS), C. Bryars (USFS), L. Lentile (US), N. McLarty (USFS),J. Richards (UA), R. Sisk (USFS), T. Petty (USFS), and P. Vestal (US)for field assistance; G. Parker (UA), P. Vestal, and B. Zimmerman(UA) for assistance in the lab; the Tennessee Department of Envi-ronment and Conservation for sampling permission; Sequatchie,LLC for access to the reserve; and two anonymous reviewers forvaluable comments.
References
Abrams, M.D., 1992. Fire and the development of oak forests. BioScience 42, 346–353.
Abrams, M.D., 1998. The red maple paradox. BioScience 48, 355–364.Abrams, M.D., 2005. Prescribing fire in eastern oak forests: is time running out? N. J.
Appl. For. 22, 190–196.
J.L. Hart et al. / Forest Ecology and Management 266 (2012) 11–24 23
Abrams, M.D., 2007. Tales from the blackgum: a consummate subordinate tree.BioScience 54, 347–359.
Abrams, M.D., Downs, J.A., 1990. Successional replacement of old-growth white oakby mixed-mesophytic hardwood species in southwestern Pennsylvania. Can. J.For. Res. 20, 1864–1870.
Abrams, M.D., Nowacki, G.J., 1992. Historical variation in fire, oak recruitment, andpost-logging accelerates succession in central Pennsylvania. J. Torrey Bot. Soc.119, 19–28.
Abrams, M.D., Nowacki, G.J., 2008. Native Americans as active and passivepromoters of mast and fruit trees in the eastern USA. Holocene 18, 1123–1137.
Abrams, M.D., Orwig, D.A., 1996. A 300-year history of disturbance and canopyrecruitment for co-occurring white pine and hemlock on the Allegheny Plateau,USA. J. Ecol. 84, 353–363.
Black, B.A., Abrams, M.D., 2005. Disturbance history and climate response in an old-growth hemlock-white pine forest, central Pennsylvania. J. Torrey Bot. Soc. 132,103–114.
Braun, E.L., 1950. Eastern Deciduous Forests of North America. Blakiston,Philadelphia, Pennsylvania.
Buchanan, M.B., Hart, J.L., 2011. A methodological analysis of canopy disturbancereconstructions using Quercus alba. Can. J. For. Res. 41, 1359–1367.
Canham, C.D., 1985. Suppression and release during canopy recruitment in Acersaccharum. Bull. Torrey Bot. Club 112, 134–145.
Clark, S.L., Torreano, S.J., Loftis, D.L., Dimov, L.D., 2007. Twenty-two year changes inregeneration potential in an old-growth Quercus forest on the mid-CumberlandPlateau, Tennessee. In: Buckley, D.S., Clatterbuck, W.K. (Eds.), Proceedings 15thCentral Hardwood Forest Conference. Knoxville, TN, pp. 527–535 (e-GTR-SRS-101).
Clatterbuck, W.K., Smalley, G.W., Turner, J.A., Travis, A., 2006. Natural History andLand Use history of Cumberland Plateau Forests in Tennessee. National Councilfor Air and Stream Improvement, Inc. (Special Report No. 06–01, pp. 37).
Coates, D.K., Burton, P.J., 1997. A gap-based approach for development ofsilvicultural systems to address ecosystem management objectives. For. Ecol.Manage. 99, 339–356.
Copenheaver, C.A., Black, B.A., Stine, M.B., McManamay, R.H., Bartens, J., 2009.Identifying dendroecological growth releases in American beech, jack pine, andwhite oak: within-tree sampling strategy. For. Ecol. Manage. 257, 2235–2240.
Cowell, C.M., 1998. Historical change in vegetation and disturbance on the GeorgiaPiedmont. Am. Midl. Nat. 140, 78–89.
DeSelm, H.R., Clark, G.M., 1975. Potential national natural landmarks of theAppalachian Plateaus province of Alabama, Georgia, southern Kentucky, andTennessee, Final Report. Prepared for the Appalachian Potential NationalNatural Landmark Program of West Virginia University, Morgantown.
Fei, S., Steiner, K.C., 2009. Rapid capture of growing space by red maple. Can. J. For.Res. 39, 1444–1452.
Fenneman, N.M., 1938. Physiography of Eastern United States. McGraw-Hill BookCompany, New York.
Foster, D.R., Orwig, D.A., McLachlan, J.S., 1996. Ecological and conservation insightsfrom reconstructive studies of temperate old-growth forests. Trends Ecol. Evol.11, 419–424.
Foster, D.R., Motzkin, G., Slater, B., 1998. Land-use history as long-term broad-scaledisturbance. regional forest dynamics in central New England. Ecosystems 1,96–119.
Fralish, J.S., Crooks, F.B., Chambers, J.L., Harty, F.M., 1991. Comparison ofpresettlement, second-growth and old-growth forests on six site types in theIllinois Shawnee Hills. Am. Midl. Nat. 125, 294–309.
Francis, J.K., Loftus, J.S., 1977. Chemical and physical properties of the CumberlandPlateau and Highland Rim forest soils. USDA, Forest Service (Research Paper SO-138).
Fraver, S., White, A.S., 2005. Identifying growth releases in dendrochronologicalstudies of forest disturbance. Can. J. For. Res. 35, 1648–1656.
Frelich, L.E., 2002. Forest Dynamics and Disturbance Regimes: Studies fromTemperate Evergreen–Deciduous Forests. Cambridge University Press,Cambridge, UK.
Grissino-Mayer, H.D., 1995. Tree-ring reconstructions of climate and fire history atEl Malpais National Monument, New Mexico. Ph.D. Dissertation, University ofArizona, Tucson.
Grissino-Mayer, H.D., 2001a. Evaluating crossdating accuracy: a manual andtutorial for the computer program COFECHA. Tree-Ring Res. 57, 205–221.
Grissino-Mayer, H.D., 2001b. FHX2 – Software for analyzing temporal and spatialpatterns of fire regimes from tree rings. Tree-Ring Res. 57, 115–124.
Haney, J.C., Lydic, J., 1999. Avifauna and vegetation structure in an old-growth oak-pine forest on the Cumberland Plateau, Tennessee (USA). Nat. Areas J. 19, 199–210.
Hart, J.L., Grissino-Mayer, H.D., 2008. Vegetation patterns and dendroecology of amixed hardwood forest on the Cumberland Plateau: implications for standdevelopment. For. Ecol. Manage. 255, 1960–1975.
Hart, J.L., Grissino-Mayer, H.D., 2009. Gap-scale disturbance processes in secondarystands on the Cumberland Plateau, Tennessee, USA. Plant Ecol. 201, 131–146.
Hart, J.L., Kupfer, J.A., 2011. Sapling richness and composition in canopy gaps of asouthern Appalachian mixed Quercus forest. J. Torrey. Bot. Soc. 138, 207–219.
Hart, J.L., van de Gevel, S.L., Grissino-Mayer, H.D., 2008. Forest dynamics in a naturalarea of the southern Ridge and Valley, Tennessee. Nat. Areas J. 28, 275–289.
Hart, J.L., van de Gevel, S.L., Sakulich, J., Grissino-Mayer, H.D., 2010. Influence ofclimate and disturbance on the growth of Tsuga canadensis at its southern limitin eastern North America. Trees 24, 621–633.
Hart, J.L., Bhuta, A.A.R., Schneider, R.M., 2011. Canopy disturbance patterns insecondary hardwood stands on the Highland Rim of Alabama. Castanea 76, 55–63.
Henry, J.D., Swan, J.M.A., 1974. Reconstructing forest history from live and deadplant material—an approach to the study of forest succession in southwest NewHampshire. Ecology 55, 772–783.
Hinkle, C.R., 1978. The relationship of forest communities and selected species toedaphic and topographic factors on the Cumberland Plateau of Tennessee. Ph.D.Dissertation, University of Tennessee, Knoxville.
Hinkle, C.R., 1989. Forest communities of the Cumberland Plateau of Tennessee. J.Tenn. Acad. Sci. 64, 123–129.
Hinkle, C.R., McComb, W.C., Safely Jr., J.M., Schmalzer, P.A., 1993. Mixed MesophyticForests. In: Martin, W.H., Boyce, S.G., Echternacht, A.C. (Eds.), Biodiversity of theSoutheastern United States: Upland Terrestrial Communities. John Wiley andSons, New York, pp. 203–253.
Holmes, R.L., 1983. Computer assisted quality control in tree-ring dating andmeasurement. Tree-Ring Bull. 43, 69–78.
Lorimer, C.G., 1980. Age structure and disturbance history of a southernAppalachian virgin forest. Ecology 61, 1169–1184.
Lorimer, C.G., 1985. Methodological considerations in the analysis of forestdisturbance history. Can. J. For. Res. 15, 200–213.
Lorimer, C.G., 1993. Causes of the oak regeneration problem. In: Loftis, D., McGee, C.(Eds.), Oak regeneration: Serious problems, practical recommendations,Symposium Proceedings, 8–10 September 1992, Knoxville, Tennessee. UnitedStates Department of Agriculture Forest Service, Southern Forest ExperimentStation, Asheville, North Carolina, pp. 14–39 (Gen. Tech. Rep. SE-84).
Lorimer, C.G., 2001. Historical and ecological roles of disturbance in eastern NorthAmerican forests: 9000 years of change. Wildl. Soc. Bull. 29, 425–439.
Lorimer, C.G., Frelich, L.E., 1989. A methodology for estimating canopy disturbancefrequency and intensity in dense temperate forests. Can. J. For. Res. 19, 651–663.
Lorimer, C.G., Frelich, L.E., Nordheim, E.V., 1988. Estimating gap origin probabilitiesfor canopy trees. Ecology 69, 778–785.
Lorimer, C.G., Chapman, J.W., Lambert, W.D., 1994. Tall understorey vegetation as afactor in the poor development of oak seedlings beneath mature stands. J. Ecol.82, 227–237.
Ludwig, J.A., Reynolds, J.F., 1988. Statistical Ecology. John Wiley and Sons, New York.Manning, R., 1993. The Historic Cumberland Plateau: An Explorer’s Guide.
University of Tennessee Press, Knoxville, Tennessee.Martin, W.H., 1975. The Lilley Cornett Woods: a stable mixed mesophytic forest in
Kentucky. Bot. Gazz. 136, 171–183.Martin, W.H., 1992. Characteristics of old-growth mixed mesophytic forests. Nat.
Areas J. 12, 127–135.McCarthy, B.C., Bailey, D.R., 1996. Composition, structure, and disturbance history
of Crabtree Woods: an old-growth forest of western Maryland. Bull. Torrey Bot.Club 123, 350–365.
McComb, W.C., Muller, R.N., 1983. Snag densities in old-growth and second-growthAppalachian forests. J. Wildl. Manage. 47, 376–382.
McEwan, R.W., Dyer, J.M., Pederson, N., 2011. Multiple interacting ecosystemdrivers: toward an encompassing hypothesis of oak forest dynamics acrosseastern North America. Ecography 34, 234–256.
McGee, C.E., 1982. Low-quality hardwood stands: Opportunities for management inthe Interior Uplands. United States Department of Agriculture, Forest Service,Southern Forest Experiment Station, New Orleans, Louisiana (Gen. Tech. Rep.SO-40).
Miller, R.A., 1974. The geologic history of Tennessee. Tenn. Div. Geol. Bull. 74.Morey, H.F., 1936. A comparison of two virgin forests in northwestern Pennsylvania.
Ecology 17, 43–55.Motzkin, G., Wilson, P., Foster, D.R., Allen, A., 1999. Vegetation patterns in
heterogeneous landscapes: the importance of history and environment. J. Veg.Sci. 10, 903–920.
Nowacki, G.J., Abrams, M.D., 1994. Forest composition, structure, and disturbancehistory of the Alan Seeger Natual Area, Huntington County, Pennsylvania. Bull.Torrey Bot. Club 121, 277–291.
Nowacki, G.J., Abrams, M.D., 1997. Radial-growth averaging criteria forreconstructing disturbance histories from presettlement-origin oaks. Ecol.Monogr. 67, 225–249.
Nowacki, G.J., Abrams, M.D., 2008. The demise of fire and ‘‘mesophication’’ of forestsin the eastern United States. BioScience 58, 123–138.
Oliver, C.D., Larson, B.C., 1996. Forest Stand Dynamics, update ed. John Wiley andSons, New York.
Oliver, C.D., Stephens, E.P., 1977. Reconstruction of a mixed species forest in centralNew England. Ecology 58, 562–572.
Orvis, K.H., Grissino-Mayer, H.D., 2002. Standardizing the reporting of abrasivepapers used to surface tree-ring samples. Tree-Ring Res. 58, 47–50.
Orwig, D.A., Abrams, M.D., 1994. Contrasting radial growth and canopy recruitmentpatterns in Liriodendron tulipifera and Nyssa sylvatica: gap-obligate versus gap-facultative tree species. Can. J. For. Res. 24, 2141–2149.
Oswalt, C.M., King, C.R., 2010. Tennessee, 2008 forest inventory and analysisfactsheet. USDA Forest Service, Southern Research Station, Asheville, NC (e-Science Update SRS-032).
Paillet, F.L., 2002. Chestnut: history and ecology of a transformed species. J.Biogeogr. 29, 1517–1530.
Parker, G.R., 1989. Old-growth forests of the Central Hardwood Region. Nat. Areas J.9, 5–11.
24 J.L. Hart et al. / Forest Ecology and Management 266 (2012) 11–24
Pederson, N., D’Amato, A.W., Orwig, D.A., 2007. Central hardwood natural historyfrom dendrochronology: maximum ages of rarely studied species. Proceedingsof the 15th Central Hardwood Conference. University of Tennessee. Knoxville,TN. 27 February-1 March 2006. USDA Forest Service, Southern Research Station(e-General Technical Report SRS-101).
PRISM Climate Group, 2011. <http://www.prism.oregonstate.edu/> (accessed01.06.11.).
Quarterman, E., Turner, B.H., Hemmerly, T.E., 1972. Analysis of virgin mixedmesophytic forests in Savage Gulf, Tennessee. Bull. Torrey Bot. Club 99, 228–232.
Rentch, J.S., Desta, F., Miller, G.W., 2002. Climate, canopy disturbance, and radialgrowth averaging in a second-growth mixed-oak forest in West Virginia, USA.Can. J. For. Res. 32, 915–927.
Rentch, J.S., Fajvan, M.A., Hicks Jr., R.R., 2003. Oak establishment and canopyaccession strategies in five old-growth stands in the central hardwood forestregion. For. Ecol. Manage. 184, 285–297.
Rubino, D.L., McCarthy, B.C., 2004. Comparative analysis of dendroecologicalmethods used to assess disturbance events. Dendrochronologia 21, 97–115.
Ruffner, C.M., Abrams, M.D., 1998. Relating land-use history and climate to thedendroecology of a 326-year-old Quercus prinus talus slope forest. Can. J. For.Res. 28, 347–358.
Runkle, J.R., 1982. Patterns of disturbance in some old-growth mesic forests of theeastern United States. Ecology 63, 1533–1546.
Schmalzer, P.A., Hinkle, C.R., DeSelm, H.R., 1978. Discriminant analysis of coveforests of the Cumberland Plateau of Tennessee. In: Pope, P.E. (Ed.), Proceedingsof the 2nd Central Hardwoods Forest Conference. West Lafayette, Indiana, pp.62–86.
Schweitzer, C.J., 2000. Forest statistics for Tennessee’s plateau counties. SouthernResearch Station, USDA Forest Service, Resource Bulletin SRS-49.
Smalley, G.W., 1982. Classification and evaluation of forest sites on the mid-Cumberland Plateau. USDA Forest Service, Southern Research ExperimentStation (General Technical Report SO-38).
Smalley, G.W., 1986. Classification and evaluation of forest sites on the northernCumberland Plateau. USDA, Forest Service, Southern Research ExperimentStation (General Technical Report SO-60).
Smith, K.T., Sutherland, E.K., 1999. Fire scar formation and compartmentalization inoak. Can. J. For. Res. 29, 166–171.
Spetich, M.A., Shifley, S.R., Parker, G.R., 1999. Regional distribution and dynamics ofcoarse woody debris in Midwestern old-growth forests. For. Sci. 45, 302–313.
Springer, M.E., Elder, J.A., 1980. Soils of Tennessee. Tennessee AgriculturalExperiment Station. Bulletin 596, pp. 66.
Stokes, M.A., Smiley, T.L., 1996. An Introduction to Tree-ring Dating. University ofArizona Press, Tucson.
Swetnam, T.W., Allen, C.D., Betancourt, J.L., 1999. Applied historical ecology: usingthe past to manage for the future. Ecol. Appl. 9, 1189–1206.
Thornthwaite, C.W., 1948. An approach toward rational classification of climate.Geogr. Rev. 38, 55–94.
Tyrrell, L.E., Crow, T.R., 1994. Structural characteristics of old-growth hemlock-hardwood forests in relation to age. Ecology 75, 370–386.
Tyrrell, L.E., Nowacki, G.J., Crow, T.R., Buckley, D.S., Nauertz, E.A., Niese, J.N.,Rollinger, J.L., Zasada, J.C., 1998. Information about old growth for selectedforest type groups in the eastern United States. USDA Forest Service, NorthCentral Forest Experiment Station (General Technical Report NC-197).
Webster, C.R., Lorimer, C.G., 2005. Minimum opening sizes for canopy recruitment ofmidtolerant tree species: a retrospective approach. Ecol. Appl. 15, 1245–1262.
Whitney, G.G., 1994. From Coastal Wilderness to Fruited Plain: a History ofEnvironmental Change in Temperate North America from 1500 to the Present.Cambridge University Press, Cambridge, UK.