forest ecology and management - fs.fed.us · forest ecology and management 406 (2017) ... malcolm...
TRANSCRIPT
MARK
Forest Ecology and Management 406 (2017) 28–36
Contents lists available at ScienceDirect
Forest Ecology and Management
journal homepage: www.elsevier.com/locate/foreco
Changing spatial patterns of stand-replacing fire in California conifer forests☆
Jens T. Stevensa,⁎, Brandon M. Collinsb, Jay D. Millerc, Malcolm P. Northd,e, Scott L. Stephensa
a Department of Environmental Science, Policy and Management, University of California, Berkeley, CA 94720, United States b Center for Fire Research and Outreach, University of California, Berkeley, CA 94720, United States c USDA Forest Service, Pacific Southwest Region, Fire and Aviation Management, McClellan, CA 95652, United States d Department of Plant Sciences, University of California, Davis, CA 95616, United States e USDA Forest Service, Pacific Southwest Research Station, Davis, CA 95618, United States
A R T I C L E I N F O A B S T R A C T
Keywords: California High-severity Mixed-conifer forests Patch dynamics Stand-replacing Wildland fire
Stand-replacing fire has profound ecological impacts in conifer forests, yet there is continued uncertainty over how best to describe the scale of stand-replacing effects within individual fires, and how these effects are changing over time. In forests where regeneration following stand-replacing fire depends on seed dispersal from surviving trees, the size and shape of stand-replacing patches are critical metrics that are difficult to describe and often overlooked. We used a novel, recently-developed metric that describes the amount of stand-replacing area within a given distance of a live-tree patch edge, in order to compare fires that may be otherwise similar in fire size or the percentage of stand-replacing effects. Specifically, we analyzed 477 fires in California pine, fir, and mixed-conifer forests between 1984 and 2015 and asked whether this metric, the stand-replacing decay coef-ficient (SDC), has changed over time, whether it is affected by fire management, and how it responds to extreme weather conditions at the time of the fire. Mean annual SDC became smaller over time (significantly so in the Sierra Nevada region), indicating that stand-replacing patches became larger and more regularly shaped. The decrease in SDC was particularly pronounced in the years since 2011. While SDC is correlated with percent high-severity, it is able to distinguish fires of comparable percent high-severity but different spatial pattern, with fires managed for suppression having smaller SDC than fires managed for resource benefit. Similarly, fires managed by the US Forest Service had smaller SDC than fires managed by the National Park Service. Fire weather also played an important role, with higher maximum temperatures generally associated with smaller SDC values. SDC is useful for comparing fires because it is associated with more conventional metrics such as percent high-severity, but also incorporates a measure of regeneration potential – distance to surviving trees at stand-re-placement patch edges – which is a biological legacy that directly affects the resilience of forests to increasingly frequent and severe fire disturbances. We estimate that from 1984 to 2015, over 80,000 ha of forestland burned with stand-replacing effects greater than 120 m in from patch edges, denoting areas vulnerable to extended conifer forest loss due to dispersal limitation. Managing unplanned ignitions under less extreme weather con-ditions can achieve beneficial “fine-grained” effects of stand-replacing fire where regeneration limitation is less of a concern. Because SDC is a useful single metric to compare fires, we introduce a web application (ste-vensjt.shinyapps.io/sdc_app) to calculate SDC for any high-severity spatial layer that may be of interest.
1. Introduction conditions that lead to the mortality of one tree also increase the likelihood of mortality for neighboring trees (Collins et al., 2007;
In forests, overstory tree mortality from fire is an important ecolo- Thompson and Spies, 2010). When a patch of adjacent trees are all top-gical process that catalyzes change in forest structure, fuel loads, ve- killed by fire, this is termed “stand-replacing fire”. This term is scale-getation diversity and wildlife habitat suitability (Swanson et al., independent – stand-replacing fire can refer to sub-ha stands of ≤100 2011). Tree mortality from fire is a binary process (a tree is top-killed or trees, or to many-ha stands of > 10,000 trees – but the implications of not), but it is spatially correlated: weather, fuel or topographic the spatial scale of stand-replacing fire are profound.
☆ Data and code for this paper are available at: http://dx.doi.org/10.5281/zenodo.1002242. ⁎ Corresponding author. E-mail address: [email protected] (J.T. Stevens).
http://dx.doi.org/10.1016/j.foreco.2017.08.051 Received 23 June 2017; Received in revised form 28 August 2017; Accepted 31 August 2017 0378-1127/ © 2017 Elsevier B.V. All rights reserved.
J.T. Stevens et al. Forest Ecology and Management 406 (2017) 28–36
Forest resilience, defined as long-term ecosystem persistence and capacity to recover following perturbation (e.g. stand-replacing fire), depends on ecological memory in the form of tree propagules (Holling, 1973; Johnstone et al., 2016). In forests where the dominant tree spe-cies have evolved to propagate after being top-killed by fire, (e.g. via basal re-sprouting in oaks (Quercus spp.) or serotinous cones in Rocky Mountain lodgepole pine (Pinus contorta var. latifolia)), resilience is maintained even in large stand-replacing patches. In forests where the dominant tree species lack these adaptations (e.g. many western mixed-conifer forest types), tree propagules generally must arrive via sur-viving trees on the edges of stand-replacing patches, and the size and shape of these patches becomes critical. Forest resilience is reduced when contiguous stand-replacing patches become larger because tree regeneration towards patch interior is slowed by dispersal limitation, and the likelihood of future stand-replacing fire within these patches increases (Stevens et al., 2014; Chambers et al., 2016; Coppoletta et al., 2016; Johnstone et al., 2016; Welch et al., 2016).
What drives much of the concern over stand-replacing fire in mixed-conifer forests is not an intrinsically negative effect of stand-replacing fire, but the potential for large-scale tree regeneration failure and per-sistent type-conversion (Millar and Stephenson, 2015). As such, there have been numerous attempts to quantify trends in the extent of stand-replacing fire in contemporary wildfires and infer how climate and forest management practices (e.g. historical fire suppression and fire-fighting tactics) might influence these trends (Miller et al., 2009b, 2012b; Miller and Safford, 2012; Cansler and McKenzie, 2014; Harvey et al., 2016b; Picotte et al., 2016).
Most efforts to quantify trends in stand-replacing fire rely on in-terpretation of satellite-based vegetation change indices, particularly the differenced Normalized Burn Ratio (dNBR) (Key and Benson, 2006) and a version of that ratio relativized to pre-fire vegetation cover (RdNBR) (Miller and Thode, 2007). Burn severity (the amount of dominant vegetation killed or consumed by fire within a given area) can be estimated by calibrating this ratio to field-derived data on ca-nopy cover loss from fire, basal area loss from fire, or other composite field indices of burn intensity (Miller et al., 2009a). Modern burn se-verity classifications transform a continuous variable (e.g. RdNBR) into a discrete variable, generally at a 30-m LANDSAT pixel resolution (e.g. “low”, “moderate” or “high” severity), based on threshold values as-sociated with particular field conditions (e.g. ≤20%, 20–70%, or > 70% basal area mortality). Field validations of post-fire conifer stands mapped as “high-severity”, whether using a 70% or a 90% basal area mortality threshold, indicate these areas generally have > 95% basal area mortality, with 100% basal area mortality being by far the most common condition greater than 30 m from the edge of a patch mapped as “high-severity” (Miller and Quayle, 2015; Lydersen et al., 2016). Thus, areas of “high-severity fire” mapped in this way are rea-sonable approximations of “stand-replacing fire”.
More recently, the term “mixed-severity” has become popular to describe individual fires, or characteristic effects of multiple fires (i.e. fire regimes), wherein some fraction of burned area experiences stand-replacing effects delineated in distinct patches (Hessburg et al., 2016). While portions of a fire’s area that are mapped as low or moderate severity still have some tree mortality, individual “mixed-severity fires” are commonly described as those with 20–70% of the fire area mapped as high-severity (Perry et al., 2011). This approach relies upon the concept that patches of stand-replacing fire of ecologically meaningful size are those mapped as “high-severity” at 30-m resolution (Collins et al., 2017). Mixed-severity fires are therefore comprised of discrete patches of stand-replacing fire, eventually filled in by grass, shrubs, or tree regeneration, surrounded by surviving forest that burned at low- to moderate-severity. While the “patchy” nature of mixed-severity fires leads to a wide range of potential stand-replacing patch sizes and shapes, the conventional definition of a mixed-severity fire says nothing about these attributes. Percent high-severity is a useful way to measure fire effects and compare among multiple fires, as it is easily derived and
interpreted (Miller et al., 2009b). However, fires where the stand-re-placing effects are concentrated in a few large patches are much more susceptible to dispersal limitation of regenerating conifers, and there-fore prolonged type conversion to non-forest vegetation, compared to fires with a similar percent high severity but more smaller patches (Crotteau et al., 2013; Kemp et al., 2016; Welch et al., 2016). For in-stance, the 2013 Rim Fire in California’s Sierra Nevada had a relatively modest proportion of burned area mapped as high severity (∼35%) but contained some of the largest contiguous patches of stand-replacing fire found anywhere in the modern record (Lydersen et al., 2017). Thus, there is a need to update previous research on trends in the modern burn severity record by accounting explicitly for the size and shape of stand-replacing patches (Collins et al., 2017).
Our objective was to document trends in stand-replacing patch configuration in California’s mixed-conifer forest ecoregion over the past 33 years, using a novel metric developed to describe how much stand-replacing patch area remains with increasing distance inward from patch edges (Collins et al., 2017). The stand-replacing decay coefficient (SDC) is related to fire size, high-severity area, and pro-portion high-severity, as well as conventional landscape metrics such as patch edge:area ratio (Collins et al., 2017). However, this metric is more biologically relevant than traditional metrics because it explicitly accounts for distance to seed source within stand-replacing patches, and as a single metric it distinguishes among fires that may be similar in terms of fire size or proportion high-severity but differ strongly in ag-gregate distance to seed source, without needing to specify an arbitrary dispersal limitation distance (Collins et al., 2017). Thus SDC can more directly identify fires that are vulnerable to long-term conifer forest loss and potential type-conversion.
In this paper, we present analyses that build on previous work in-vestigating trends in burn severity and differences among land man-agement agencies in California (Miller and Safford, 2012; Miller et al., 2012b). More specifically, we include all mapped forest fires > 80 ha that occurred in northwestern California and the Sierra Nevada from 1984 through 2015, which spans two historic multi-year droughts (1987–1992, 2011–2015), to investigate (1) whether fires with dif-ferent managing agencies and management objectives differed in SDC independently of fire size and proportion high-severity, (2) how average SDC for these fires changed over time, and (3) the role of weather conditions in determining SDC. These results illustrate how a process-based quantification of fire effects can be used to describe changing fire regimes, and this could assist forest managers in devel-oping desired conditions in western US forests that once burned with frequent, low-moderate severity fire regimes.
2. Methods
Fire behavior and effects are influenced by a multitude of factors, including, but not limited to, past forest management actions, topo-graphy, weather and climate. Fires within California are managed pri-marily by three different agencies; the National Park Service (NPS), US Forest Service (USFS) and the California Department of Forestry and Fire Protection (CAL FIRE). These agencies support very different land management objectives and as such, have different fire management directives. For example, Yosemite, and Sequoia and Kings Canyon National Parks have allowed many lightning-ignited fires to burn under specified conditions to meet resource-management objectives since the early 1970s (van Wagtendonk, 2007). Although some National Forests allow some ‘resource benefit’ fires in more remote, higher-elevation areas, most fires are still suppressed (Stephens and Ruth, 2005). Fires managed by CAL FIRE generally occur at lower elevations in the wildland urban interface (WUI), and therefore are always aggressively suppressed. Beyond potential differences in fire management ap-proaches, the lands these agencies manage have quite different forest management histories. The combined effect of these differences would be expected to result in different fire patterns among these agencies.
29
J.T. Stevens et al.
Because the complex topography of northwestern California can lead to complex patterns of stand-replacing fire (Miller et al., 2012b; Estes et al., 2017), we also considered effects of region (see below).
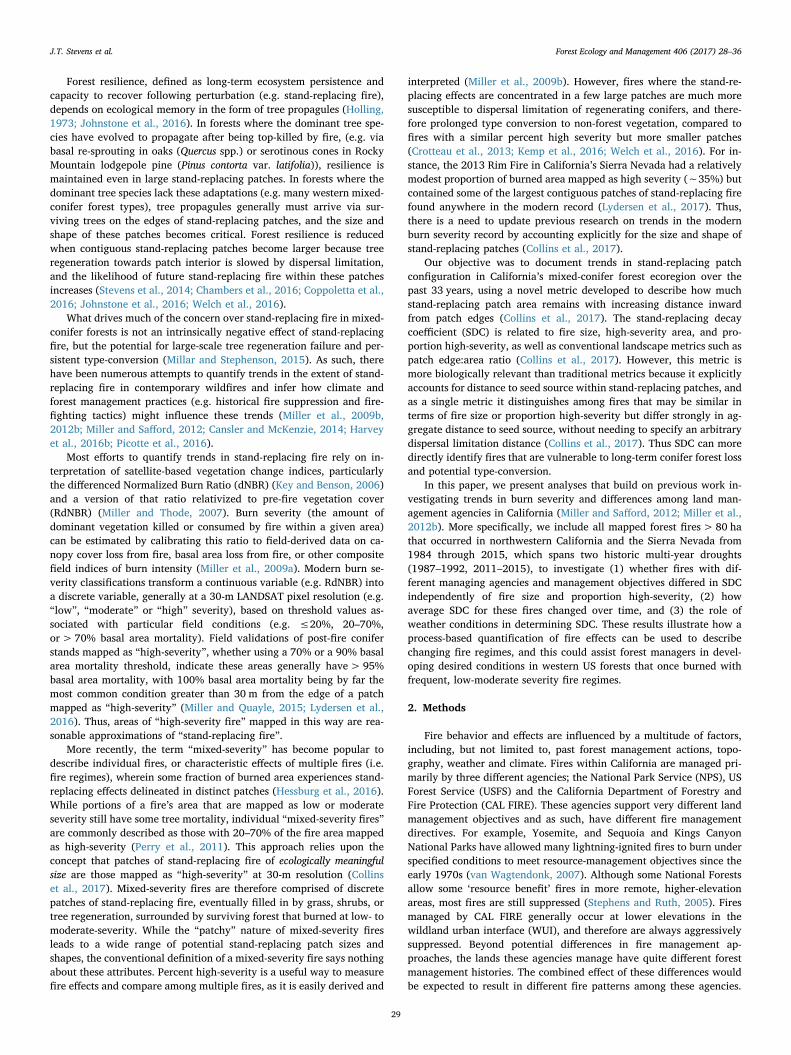
For our analysis, we selected all wildfires in California that burned between 1984 and 2015 where the following criteria were met: (1) at least 80 ha in size; (2) predominantly (> 50%) in yellow pine (Pinus ponderosa or P. Jeffreyi), fir (Abies concolor or A. magnifica) or mixed-conifer forest according to the CALVEG classification scheme (Keeler-Wolf, 2007); (3) occurring in the regions of northwestern California, the southern Cascades, or the Sierra Nevada (see below); (4) predominantly (> 50%) on land managed by either the US Forest Service or the US National Park Service; and (5) having a mapped burn-severity classifi-cation layer available. These criteria led us to a sample size of 477 fires (Fig. 1). For each fire we defined the location of stand-replacing patches as adjacent pixels where the RdNBR exceeded the threshold associated with 90% basal area mortality (652 for extended assessments and 746 for initial assessments: Miller et al., 2009a; Miller and Quayle, 2015). These patches were converted to polygon shapefiles by Region 5 of the US Forest Service and made available (https://www.fs.usda.gov/detail/ r5/landmanagement/gis/?cid=stelprd3804878).
We calculated the stand-replacing decay coefficient (SDC) for each fire following the methods of Collins et al. (2017). SDC is defined as:
1P = ∗10SDC D (1)
where P is the proportion of the original stand-replacing area in the fire
Fig. 1. Locations of the 477 fires in this study (red points). All fires burned within
California (gray shading) with at least 50% of the fire perimeter burned in conifer forest on land managed by either the US Forest Service (USFS; green shading) or the US National Park Service (NPS; blue shading), including fires managed by USFS, NPS, and CAL FIRE. (For interpretation of the references to color in this figure legend, the reader is referred to
the web version of this article.)
Forest Ecology and Management 406 (2017) 28–36
that exceeds a given buffer distance inward from the patch edge (D), and SDC is a free parameter fit by nonlinear least squares estimation that simultaneously describes the size and complexity of stand-repla-cing area. Smaller SDC values represent larger and/or less complex patches (Fig. A1; Collins et al., 2017). We reasoned that not all edges are biologically equivalent, as outer edges of stand-replacing patches would be more likely to contribute conifer seed into the patch than edges of very small internal “islands” of surviving trees within stand-replacing patches that were mapped as ≤90% basal area mortality but most often were mapped as having > 75% basal area mortality. Therefore we filled in any “islands” of 9 contiguous 30 m pixels (0.81 ha) or smaller, and considered these part of the stand-replacing patch when calculating SDC. The distribution of SDC for our 477 fires was left-skewed so we conducted a natural log (ln) transformation, which improved normality of the data (Collins et al., 2017).
For each fire we approximated the weather at the time of the fire using the GridMet database (Abatzoglou, 2013). We identified the start and end dates for each of our 477 fires. In rare cases where the end date was not known (N = 35), we set the end date to seven days after the start date. We excluded cases where the start date was not known (N = 4). We then calculated the centroid latitude and longitude co-ordinate of the high-severity area within a given fire, and downloaded the daily weather estimates from GridMet for the grid cell (4 km) overlapping that centroid during the burn period. Daily estimates were obtained for daily high temperature, low temperature, high relative humidity, and burn index under the assumption that daily extremes are more likely to influence fire behavior than daily averages (Collins et al., 2007). For each fire we then identified the most extreme fire weather conditions for these four variables during the burn period (maximum high temperature [TMX], maximum low temperature [TMN], minimum high relative humidity [RH], and maximum daily burn index [BI]), and incorporated these variables into our database of fires. Rather than using the lowest relative humidity, we’ve focused on the minimum high relative humidity in order to capture the recovery (or lack thereof) in relative humidity for a given burn period. Little RH recovery has been associated with greater fire growth potential, and by extension, larger patches of stand-replacing fire (Rothermel, 1991).
To evaluate the influence of fire management class, fire manage-ment agency (collectively referred to as “management”), and fire weather on variation in ln(SDC), we compared a set of candidate
Table 1 Five best candidate models (model #1–5) of SDC, based on AIC comparison. Coefficients are relative to a model where: agency = CDF (CAL FIRE), class = SUP (suppression), and region = SCSN (Southern Cascades/Sierra Nevada), USFS = US Forest Service, NPS = US National Park Service, WFU = Wildland Fire Use, max_tmmx = maximum daily high temperature during burn window, max_tmmn = maximum daily low tem-perature during burn window, NW = northwestern region of California, max_bi = max-imum daily burn index during burn window, and min_rmax = minimum daily high hu-midity during burn window.
Model #
Model AIC/coefficients 1 2 3 4 5
AIC 901.721 902.151 902.154 902.724 902.818 (Intercept) 7.136 5.557 7.66 5.423 5.972 agencyNPS 0.478 0.506 0.475 0.472 0.504 agencyUSFS 0.196 0.214 0.174 0.189 0.194 classWFU 0.377 0.379 0.381 0.401 0.381 fire_year -0.006 -0.005 -0.006 -0.005 -0.005 max_tmmx -0.024 -0.012 -0.028 -0.023 -0.015 max_tmmn 0.019 0.019 0.019 regionNW 0.09 0.083 max_bi -0.002 min_rmax
30
J.T. Stevens et al. Forest Ecology and Management 406 (2017) 28–36
Table 2 Summary of fire statistics across agency and management class. Fires with agency = NA were other agencies not among the three principal fire management agencies and with too few fires to draw meaningful conclusions (e.g. Bureau of Indian Affairs). Agency codes: CDF = CAL FIRE, USFS = US Forest Service, NPS = US National Park Service. Class codes: SUP = suppression fires, WFU = Wildland Fire Use fires. Weather variables are the maximum or minimum daily value over the burn period for a given fire, averaged over all fires in the sample.
Agency Class N Min size (ha)
Median size (ha)
Max size (ha)
Median fire year
Mean maximum high temperature
Mean maximum burn index
Mean maximum low temperature
Mean minimum high humidity
CDF NPS NPS USFS USFS NA
SUP SUP WFU SUP WFU SUP
31 33 54 340 17 2
83 84 106 85 140 590
828.0 414.0 642.5 1381.5 928.0 905.0
39265 24123 4143 104038 2420 1220
2000 1996 1996 2003 2003 2010
32.7 27.8 25.9 32.5 24.9 28.5
70.9 67.7 74.3 69.1 79.3 76.7
14.5 12.7 11.7 15.4 10.4 16.2
40.0 36.4 29.1 37.5 28.2 36.5
models predicting SDC based on all possible combinations of seven variables, using automated model selection implemented in the R package glmulti (Calcagno and de Mazancourt, 2010). The candidate models were linear models conducted on the natural log of SDC – ln (SDC) – which was normally distributed among all fires (Collins et al., 2017). The variables examined were: fire year (1984–2015), fire man-agement class (“class”; fire managed for resource benefit, e.g., wildland fire use [WFU], or suppression [SUP]), management agency (National Park Service [NPS], US Forest Service [USFS], CAL FIRE [CDF]), region (northwestern CA [NW; Shasta Trinity National Forest and all National Forests west from there] and the Southern Cascades/Sierra Nevada [SCSN; all National Forests east of Shasta-Trinity and south to Sequoia and Inyo National Forests]), and the four weather variables (TMX, TMN, RH, BI). We selected the top 5 candidate models on the basis of AIC comparisons, and compared the parameter effect sizes across these models. With parameter effects consistent across the top five candidate
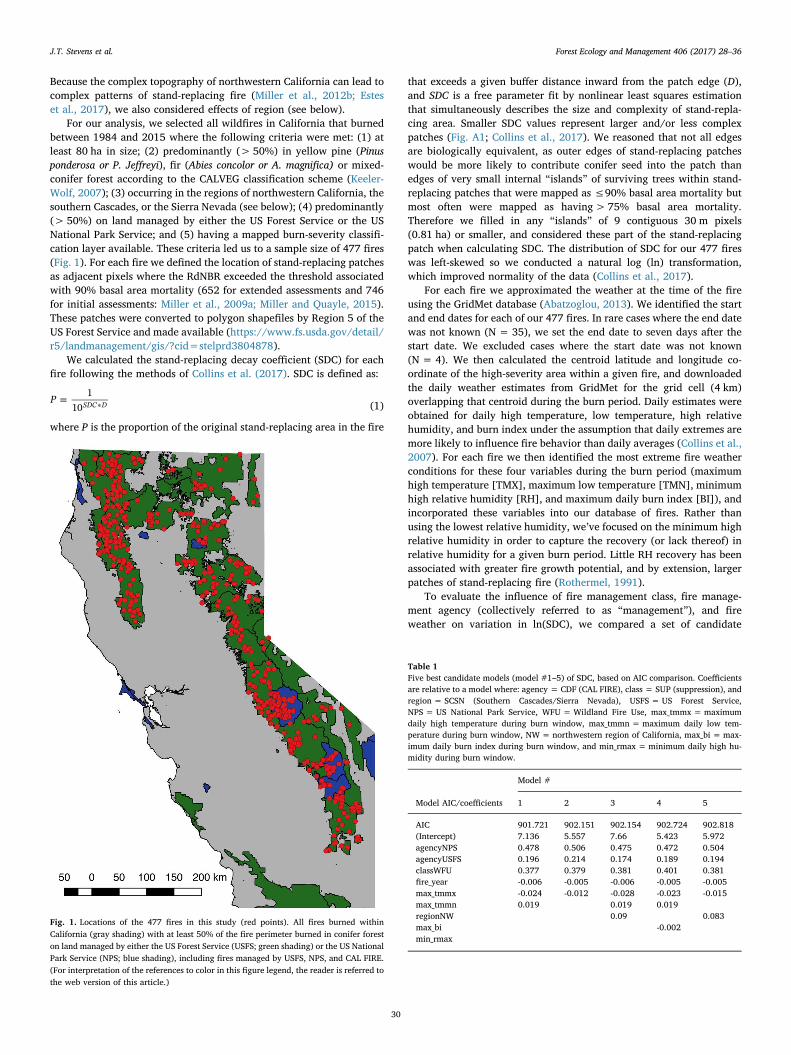
models (Table 1), we selected a simple model (model #2) for visuali-zation via regression tree analysis using recursive partitioning, im-plemented in the rpart package in R (Therneau et al., 2010). While the linear model comparison approach allowed us to evaluate the im-portant predictor variables of ln(SDC) and estimate their parameters, the regression tree analysis identified an importance hierarchy of the explanatory variables and provided simple visualization of the model structure while identifying important breakpoints within the predictor variables (Therneau et al., 2010).
We also analyzed temporal trends in ln(SDC) as well as the weather variables TMX and BI using linear regression. There was high inter-annual variability in all of these variables, and a Durbin-Watson test implemented in the R package car showed no temporal autocorrelation for any of these variables. Finally, we calculated the increase over time in cumulative stand-replacing area greater than a specific threshold distance (120 m; Collins et al., 2017) from the patch edge, for each
Fig. 2. Regression tree based on model 2 (Table 1). Values in ovals are ln-transformed SDC values, indicating mean ln
(SDC) values for fires in a given cluster, with sample size
indicated. Variables are fire management class (suppression, Wildland Fire-Use), maximum daily high temperature
during the burn window (max_high_temp) in degrees C, fire
year (1984 through 2015), and fire management agency
(National Park Service NPS, US Forest Service USFS, or CAL FIRE CDF). Inset figure displays the distribution of ln(SDC) across all 477 fires analyzed in this study, with dashed lines indicating the range of ln(SDC) values in the ovals. Colors of the ovals correspond to the histogram bins in the inset figure. (For interpretation of the references to color in this figure legend, the reader is referred to the web version of this article.)
31
J.T. Stevens et al. Forest Ecology and Management 406 (2017) 28–36
managing agency.
3. Results
The best model to explain variation in SDC always included fire management class, fire management agency, fire year, and maximum daily high temperature during the burn window, while it never in-cluded the minimum daily high humidity (Table 1). Effects of these predictors were consistent: SDC decreased (patches became larger and/ or more regular) from NPS to USFS to CDF-managed fires, decreased from WFU fires to SUP fires, decreased over time, and decreased with increasing maximum high temperatures. Region, maximum low tem-perature, and maximum burn index were marginal additional pre-dictors in some models (Table 1). The majority of the fires in our study were USFS fires that were actively suppressed; these fires were gen-erally larger and burned under hotter conditions compared to NPS-managed fires or WFU fires (Table 2).
The regression tree analysis indicated that the fire management class was the most important predictor of SDC values, with larger SDC values – associated with smaller and/or more complex patches – for WFU fires (Fig. 2). SUP fires generally had smaller SDC values that are associated with larger and/or simpler patches. Fire weather and managing agency were important among SUP fires, with fires burning
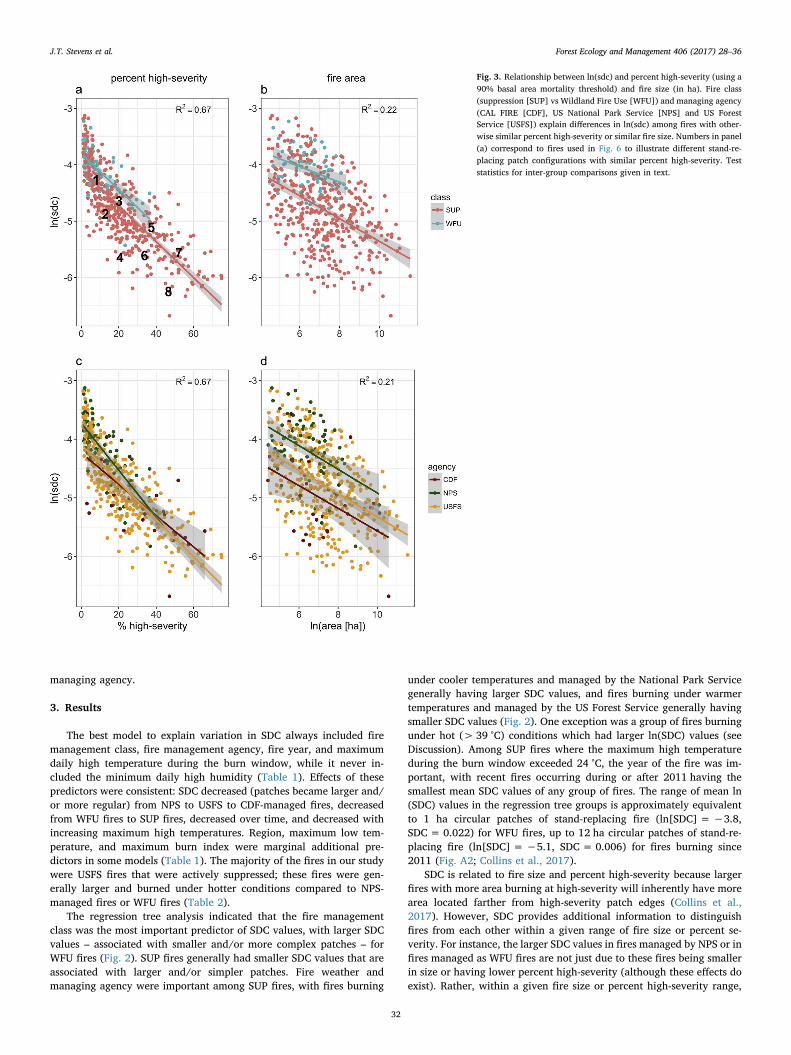
Fig. 3. Relationship between ln(sdc) and percent high-severity (using a
90% basal area mortality threshold) and fire size (in ha). Fire class (suppression [SUP] vs Wildland Fire Use [WFU]) and managing agency
(CAL FIRE [CDF], US National Park Service [NPS] and US Forest Service [USFS]) explain differences in ln(sdc) among fires with other-wise similar percent high-severity or similar fire size. Numbers in panel (a) correspond to fires used in Fig. 6 to illustrate different stand-re-placing patch configurations with similar percent high-severity. Test statistics for inter-group comparisons given in text.
under cooler temperatures and managed by the National Park Service generally having larger SDC values, and fires burning under warmer temperatures and managed by the US Forest Service generally having smaller SDC values (Fig. 2). One exception was a group of fires burning under hot (> 39 °C) conditions which had larger ln(SDC) values (see Discussion). Among SUP fires where the maximum high temperature during the burn window exceeded 24 °C, the year of the fire was im-portant, with recent fires occurring during or after 2011 having the smallest mean SDC values of any group of fires. The range of mean ln (SDC) values in the regression tree groups is approximately equivalent to 1 ha circular patches of stand-replacing fire (ln[SDC] = −3.8, SDC = 0.022) for WFU fires, up to 12 ha circular patches of stand-re-placing fire (ln[SDC] = −5.1, SDC = 0.006) for fires burning since 2011 (Fig. A2; Collins et al., 2017).
SDC is related to fire size and percent high-severity because larger fires with more area burning at high-severity will inherently have more area located farther from high-severity patch edges (Collins et al., 2017). However, SDC provides additional information to distinguish fires from each other within a given range of fire size or percent se-verity. For instance, the larger SDC values in fires managed by NPS or in fires managed as WFU fires are not just due to these fires being smaller in size or having lower percent high-severity (although these effects do exist). Rather, within a given fire size or percent high-severity range,
32
J.T. Stevens et al.
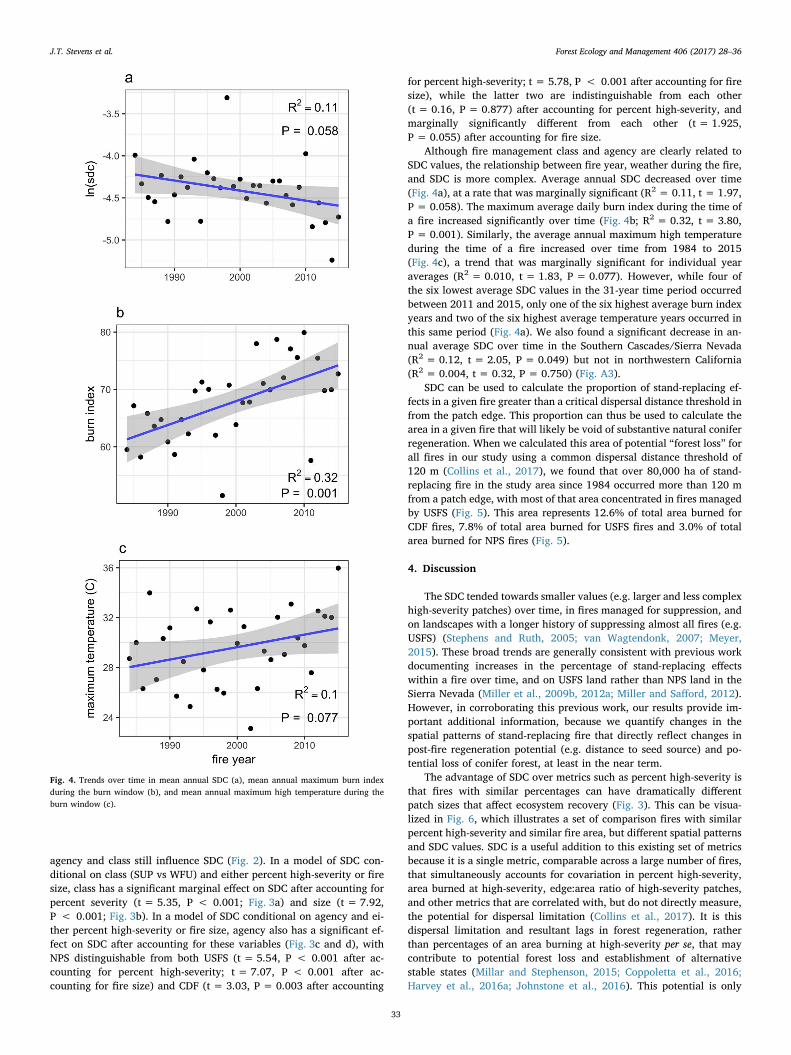
Fig. 4. Trends over time in mean annual SDC (a), mean annual maximum burn index
during the burn window (b), and mean annual maximum high temperature during the
burn window (c).
agency and class still influence SDC (Fig. 2). In a model of SDC con-ditional on class (SUP vs WFU) and either percent high-severity or fire size, class has a significant marginal effect on SDC after accounting for percent severity (t = 5.35, P < 0.001; Fig. 3a) and size (t = 7.92, P < 0.001; Fig. 3b). In a model of SDC conditional on agency and ei-ther percent high-severity or fire size, agency also has a significant ef-fect on SDC after accounting for these variables (Fig. 3c and d), with NPS distinguishable from both USFS (t = 5.54, P < 0.001 after ac-counting for percent high-severity; t = 7.07, P < 0.001 after ac-counting for fire size) and CDF (t = 3.03, P = 0.003 after accounting
Forest Ecology and Management 406 (2017) 28–36
for percent high-severity; t = 5.78, P < 0.001 after accounting for fire size), while the latter two are indistinguishable from each other (t = 0.16, P = 0.877) after accounting for percent high-severity, and marginally significantly different from each other (t = 1.925, P = 0.055) after accounting for fire size.
Although fire management class and agency are clearly related to SDC values, the relationship between fire year, weather during the fire, and SDC is more complex. Average annual SDC decreased over time (Fig. 4a), at a rate that was marginally significant (R2 = 0.11, t = 1.97, P = 0.058). The maximum average daily burn index during the time of a fire increased significantly over time (Fig. 4b; R2 = 0.32, t = 3.80, P = 0.001). Similarly, the average annual maximum high temperature during the time of a fire increased over time from 1984 to 2015 (Fig. 4c), a trend that was marginally significant for individual year averages (R2 = 0.010, t = 1.83, P = 0.077). However, while four of the six lowest average SDC values in the 31-year time period occurred between 2011 and 2015, only one of the six highest average burn index years and two of the six highest average temperature years occurred in this same period (Fig. 4a). We also found a significant decrease in an-nual average SDC over time in the Southern Cascades/Sierra Nevada (R2 = 0.12, t = 2.05, P = 0.049) but not in northwestern California (R2 = 0.004, t = 0.32, P = 0.750) (Fig. A3).
SDC can be used to calculate the proportion of stand-replacing ef-fects in a given fire greater than a critical dispersal distance threshold in from the patch edge. This proportion can thus be used to calculate the area in a given fire that will likely be void of substantive natural conifer regeneration. When we calculated this area of potential “forest loss” for all fires in our study using a common dispersal distance threshold of 120 m (Collins et al., 2017), we found that over 80,000 ha of stand-replacing fire in the study area since 1984 occurred more than 120 m from a patch edge, with most of that area concentrated in fires managed by USFS (Fig. 5). This area represents 12.6% of total area burned for CDF fires, 7.8% of total area burned for USFS fires and 3.0% of total area burned for NPS fires (Fig. 5).
4. Discussion
The SDC tended towards smaller values (e.g. larger and less complex high-severity patches) over time, in fires managed for suppression, and on landscapes with a longer history of suppressing almost all fires (e.g. USFS) (Stephens and Ruth, 2005; van Wagtendonk, 2007; Meyer, 2015). These broad trends are generally consistent with previous work documenting increases in the percentage of stand-replacing effects within a fire over time, and on USFS land rather than NPS land in the Sierra Nevada (Miller et al., 2009b, 2012a; Miller and Safford, 2012). However, in corroborating this previous work, our results provide im-portant additional information, because we quantify changes in the spatial patterns of stand-replacing fire that directly reflect changes in post-fire regeneration potential (e.g. distance to seed source) and po-tential loss of conifer forest, at least in the near term.
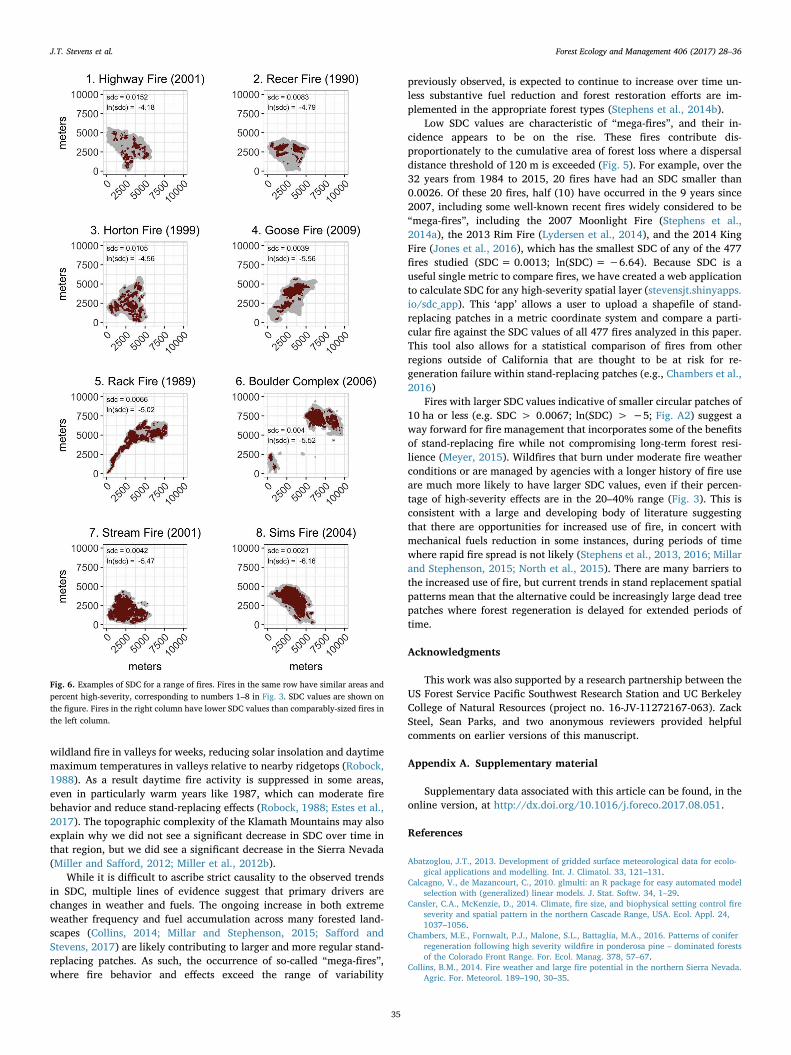
The advantage of SDC over metrics such as percent high-severity is that fires with similar percentages can have dramatically different patch sizes that affect ecosystem recovery (Fig. 3). This can be visua-lized in Fig. 6, which illustrates a set of comparison fires with similar percent high-severity and similar fire area, but different spatial patterns and SDC values. SDC is a useful addition to this existing set of metrics because it is a single metric, comparable across a large number of fires, that simultaneously accounts for covariation in percent high-severity, area burned at high-severity, edge:area ratio of high-severity patches, and other metrics that are correlated with, but do not directly measure, the potential for dispersal limitation (Collins et al., 2017). It is this dispersal limitation and resultant lags in forest regeneration, rather than percentages of an area burning at high-severity per se, that may contribute to potential forest loss and establishment of alternative stable states (Millar and Stephenson, 2015; Coppoletta et al., 2016; Harvey et al., 2016a; Johnstone et al., 2016). This potential is only
33

J.T. Stevens et al. Forest Ecology and Management 406 (2017) 28–36
Fig. 5. Increase in cumulative stand-replacing area greater than 120 m from edge since 1984, by agency (CAL FIRE [CDF], US National Park Service [NPS] and US Forest Service [USFS]). “0” represents the value in 1984, as no mapped fires were available before then. In 2015, the cumulative area was 19,760 ha for CDF (12.6% of total burned area for CDF), 3,499 ha for NPS (3.0% of total burned area for NPS), and 1,669,378 ha for USFS (7.8% of the total burned area for USFS).
exacerbated by anticipated changes in regional climate, fire frequency and area burned (Littell et al., 2009; Westerling et al., 2011; Parks et al., 2017), which further increases the likelihood of high-severity fires re-burning in short succession.
Weather and fuels can strongly influence fire severity and area burned (Safford et al., 2012; Collins, 2014; Lydersen et al., 2014; Parks et al., 2015), and our results suggest that this is the case for spatial patterns of stand-replacing fire as well (e.g., Cansler and McKenzie, 2014). Under more moderate weather conditions, fire effects tended to be within the range of historical variability for California conifer forests – smaller, more irregular patches of stand-replacing fire generally < 2 ha (Safford and Stevens, 2017). Maximum daily high temperature during the burn period was an important factor and fires burning under cooler conditions generally had SDC values around 4.1, associated with an average patch size of around 2 ha (Figs. 2 and A1). We were sur-prised that burn index was not identified as an important predictor of SDC. This could be due to inaccuracies related to downscaling burn index in the climate data, or because the maximum burn index during a burn window may be less relevant to stand-replacing fire than the duration of periods with high burn index. Further work is needed that could examine more sophisticated representations of weather tied specifically to the period and location of stand-replacing patches with small SDC values.
Although management class emerged as the most important control over SDC (Fig. 2), this also reflects the influence of weather to some degree because decisions on whether to manage fires are based partly on weather conditions (North et al., 2012; Meyer, 2015). Our dataset supports this, as “wildland fire use” fires tended to burn under cooler maximum high temperatures than fires managed for suppression, re-gardless of agency (Table 2). Fires managed for suppression in the NPS tend to have cooler maximum high temperatures than fires on USFS land (Table 2), which might reflect the higher elevation of the three National Parks in the Sierra Nevada relative to the majority of National Forest land (Fig. 1). These results suggest there may be opportunities for increased fire use on Forest Service land during the spring and fall, when temperatures are lower, that would more closely mimic the fine-grained stand-replacement patterns evident on National Parks land (Fig. 1).
Although the influence of “fuels” on SDC is indirectly represented by our management class variable and its connection with forest man-agement history, relevant fuel characterizations are largely lacking the spatial and temporal resolution that are available for weather variables. Despite this limitation, several lines of evidence suggest that increased fuel loads are associated with smaller SDC values. The trend towards smaller SDC values over time may reflect the effect of fire suppression and associated fuel accumulation. However, California also experienced a severe four-year drought from the winter 2011–2012 through the winter 2014–2015 (Young et al., 2017), which likely had an effect on this trend. The years from 2011 to 2015 had four of the six lowest mean SDC values of any year since 1984, and while maximum temperature and burn index increased over this time period, only two of those years (2012 and 2015) were among the six highest maximum temperature years based on burn-period temperatures, and only one (2012) was among the six highest burn index years (Fig. 4). Our regression tree analysis identifies 2011 as a threshold year, with fires occurring on or after that year having the smallest mean SDC value of any cluster in the tree, after controlling for the effect of temperature (Fig. 3). Smaller SDC values for fires managed by the USFS compared to the NPS after con-trolling for weather (Table 1), may indicate a longer history of fire suppression on USFS lands (Miller et al., 2012a), which have a broader array of constraints when considering how to manage ignitions (van Wagtendonk, 2007).
Topography is also an important control over fire effects (Taylor and Skinner, 2003; Lydersen et al., 2014; Harris and Taylor, 2015; Estes et al., 2017). In areas with high topographic complexity, patterns of stand-replacing fire may be less responsive to variation in fuels or weather (Miller et al., 2012b). We found a seemingly counterintuitive result in our regression tree analysis where fires with a maximum high temperature greater than or equal to 39 °C had larger SDC values (N = 18, Fig. 2). Every one of these fires, however, occurred in the northwestern part of California centered around the Klamath Moun-tains, with a majority (N = 10) occurring in 1987, a particularly warm year (Fig. 4) with widespread lightning fire activity in this region. Temperature inversions within the topographically complex Klamath region are common when summer high-pressure systems setup over the region. The inversions have been documented to trap smoke from
34
J.T. Stevens et al.
Fig. 6. Examples of SDC for a range of fires. Fires in the same row have similar areas and
percent high-severity, corresponding to numbers 1–8 in Fig. 3. SDC values are shown on
the figure. Fires in the right column have lower SDC values than comparably-sized fires in
the left column.
wildland fire in valleys for weeks, reducing solar insolation and daytime maximum temperatures in valleys relative to nearby ridgetops (Robock, 1988). As a result daytime fire activity is suppressed in some areas, even in particularly warm years like 1987, which can moderate fire behavior and reduce stand-replacing effects (Robock, 1988; Estes et al., 2017). The topographic complexity of the Klamath Mountains may also explain why we did not see a significant decrease in SDC over time in that region, but we did see a significant decrease in the Sierra Nevada (Miller and Safford, 2012; Miller et al., 2012b).
While it is difficult to ascribe strict causality to the observed trends in SDC, multiple lines of evidence suggest that primary drivers are changes in weather and fuels. The ongoing increase in both extreme weather frequency and fuel accumulation across many forested land-scapes (Collins, 2014; Millar and Stephenson, 2015; Safford and Stevens, 2017) are likely contributing to larger and more regular stand-replacing patches. As such, the occurrence of so-called “mega-fires”, where fire behavior and effects exceed the range of variability
Forest Ecology and Management 406 (2017) 28–36
previously observed, is expected to continue to increase over time un-less substantive fuel reduction and forest restoration efforts are im-plemented in the appropriate forest types (Stephens et al., 2014b).
Low SDC values are characteristic of “mega-fires”, and their in-cidence appears to be on the rise. These fires contribute dis-proportionately to the cumulative area of forest loss where a dispersal distance threshold of 120 m is exceeded (Fig. 5). For example, over the 32 years from 1984 to 2015, 20 fires have had an SDC smaller than 0.0026. Of these 20 fires, half (10) have occurred in the 9 years since 2007, including some well-known recent fires widely considered to be “mega-fires”, including the 2007 Moonlight Fire (Stephens et al., 2014a), the 2013 Rim Fire (Lydersen et al., 2014), and the 2014 King Fire (Jones et al., 2016), which has the smallest SDC of any of the 477 fires studied (SDC = 0.0013; ln(SDC) = −6.64). Because SDC is a useful single metric to compare fires, we have created a web application to calculate SDC for any high-severity spatial layer (stevensjt.shinyapps. io/sdc_app). This ‘app’ allows a user to upload a shapefile of stand-replacing patches in a metric coordinate system and compare a parti-cular fire against the SDC values of all 477 fires analyzed in this paper. This tool also allows for a statistical comparison of fires from other regions outside of California that are thought to be at risk for re-generation failure within stand-replacing patches (e.g., Chambers et al., 2016)
Fires with larger SDC values indicative of smaller circular patches of 10 ha or less (e.g. SDC > 0.0067; ln(SDC) > −5; Fig. A2) suggest a way forward for fire management that incorporates some of the benefits of stand-replacing fire while not compromising long-term forest resi-lience (Meyer, 2015). Wildfires that burn under moderate fire weather conditions or are managed by agencies with a longer history of fire use are much more likely to have larger SDC values, even if their percen-tage of high-severity effects are in the 20–40% range (Fig. 3). This is consistent with a large and developing body of literature suggesting that there are opportunities for increased use of fire, in concert with mechanical fuels reduction in some instances, during periods of time where rapid fire spread is not likely (Stephens et al., 2013, 2016; Millar and Stephenson, 2015; North et al., 2015). There are many barriers to the increased use of fire, but current trends in stand replacement spatial patterns mean that the alternative could be increasingly large dead tree patches where forest regeneration is delayed for extended periods of time.
Acknowledgments
This work was also supported by a research partnership between the US Forest Service Pacific Southwest Research Station and UC Berkeley College of Natural Resources (project no. 16-JV-11272167-063). Zack Steel, Sean Parks, and two anonymous reviewers provided helpful comments on earlier versions of this manuscript.
Appendix A. Supplementary material
Supplementary data associated with this article can be found, in the online version, at http://dx.doi.org/10.1016/j.foreco.2017.08.051.
References
Abatzoglou, J.T., 2013. Development of gridded surface meteorological data for ecolo-gical applications and modelling. Int. J. Climatol. 33, 121–131.
Calcagno, V., de Mazancourt, C., 2010. glmulti: an R package for easy automated model selection with (generalized) linear models. J. Stat. Softw. 34, 1–29.
Cansler, C.A., McKenzie, D., 2014. Climate, fire size, and biophysical setting control fire severity and spatial pattern in the northern Cascade Range, USA. Ecol. Appl. 24, 1037–1056.
Chambers, M.E., Fornwalt, P.J., Malone, S.L., Battaglia, M.A., 2016. Patterns of conifer regeneration following high severity wildfire in ponderosa pine – dominated forests of the Colorado Front Range. For. Ecol. Manag. 378, 57–67.
Collins, B.M., 2014. Fire weather and large fire potential in the northern Sierra Nevada. Agric. For. Meteorol. 189–190, 30–35.
35
J.T. Stevens et al. Forest Ecology and Management 406 (2017) 28–36
Collins, B.M., Kelly, M., van Wagtendonk, J.W., Stephens, S.L., 2007. Spatial patterns of large natural fires in Sierra Nevada wilderness areas. Landsc. Ecol. 22, 545–557.
Collins, B.M., Stevens, J.T., Miller, J.D., Stephens, S.L., Brown, P.M., North, M.P., 2017. Alternative characterization of forest fire regimes: incorporating spatial patterns. Landsc. Ecol. 32, 1543–1552.
Coppoletta, M., Merriam, K.E., Collins, B.M., 2016. Post-fire vegetation and fuel devel-opment influences fire severity patterns in reburns. Ecol. Appl. 26, 686–699.
Crotteau, J.S., Morgan Varner Iii, J., Ritchie, M.W., 2013. Post-fire regeneration across a fire severity gradient in the southern Cascades. For. Ecol. Manag. 287, 103–112.
Estes, B.L., Knapp, E.E., Skinner, C.N., Miller, J.D., Preisler, H.K., 2017. Factors influen-cing fire severity under moderate burning conditions in the Klamath Mountains, northern California, USA. Ecosphere 8, e01794-n/a.
Harris, L., Taylor, A.H., 2015. Topography, fuels and fire exclusion drive fire severity of the Rim Fire in an old-growth mixed- conifer forest, Yosemite National Park, USA. Ecosystems 18, 1192–1208.
Harvey, B.J., Donato, D.C., Turner, M.G., 2016a. Burn me twice, shame on who? Interactions between successive forest fires across a temperate mountain region. Ecology 97, 2272–2282.
Harvey, B.J., Donato, D.C., Turner, M.G., 2016b. Drivers and trends in landscape patterns of stand-replacing fire in forests of the US Northern Rocky Mountains (1984–2010). Landsc. Ecol. 31, 2367–2383.
Hessburg, P.F., Spies, T.A., Perry, D.A., Skinner, C.N., Taylor, A.H., Brown, P.M., Stephens, S.L., Larson, A.J., Churchill, D.J., Povak, N.A., Singleton, P.H., McComb, B., Zielinski, W.J., Collins, B.M., Salter, R.B., Keane, J.J., Franklin, J.F., Riegel, G., 2016. Tamm review: management of mixed-severity fire regime forests in Oregon, Washington, and Northern California. For. Ecol. Manag. 366, 221–250.
Holling, C.S., 1973. Resilience and stability of ecological systems. Annu. Rev. Ecol. Syst. 4, 1–23.
Johnstone, J.F., Allen, C.D., Franklin, J.F., Frelich, L.E., Harvey, B.J., Higuera, P.E., Mack, M.C., Meentemeyer, R.K., Metz, M.R., Perry, G.L.W., Schoennagel, T., Turner, M.G., 2016. Changing disturbance regimes, ecological memory, and forest resilience. Front. Ecol. Environ. 14, 369–378.
Jones, G.M., Gutiérrez, R.J., Tempel, D.J., Whitmore, S.A., Berigan, W.J., Peery, M.Z., 2016. Megafires: an emerging threat to old-forest species. Front. Ecol. Environ. 14, 300–306.
Keeler-Wolf, T., 2007. The history of vegetation classification and mapping in California. In: Barbour, M.G., Keeler-Wolf, T., Schoenherr, A.A. (Eds.), Terrestrial vegetation of California. University of California Press, Berkeley, CA, pp. 1–42.
Kemp, K.B., Higuera, P.E., Morgan, P., 2016. Fire legacies impact conifer regeneration across environmental gradients in the U.S. northern Rockies. Landsc. Ecol. 31, 619–636.
Key, C.H., Benson, N.C., 2006. Landscape assessment: remote sensing of severity, the Normalized Burn Ratio. In: Lutes, D.C. (Ed.), FIREMON: Fire Effects Monitoring and Inventory System. Ogden, Utah: USDA Forest Service, Rocky Mountain Res. Station, Fort Collins, Colorado, USA, pp. LA25–LA41.
Littell, J.S., McKenzie, D., Peterson, D.L., Westerling, A.L., 2009. Climate and wildfire area burned in western U.S. ecoprovinces, 1916–2003. Ecol. Appl. 19, 1003–1021.
Lydersen, J.M., Collins, B.M., Brooks, M.L., Matchett, J.R., Shive, K.L., Povak, N.A., Smith, D.F., 2017. Evidence of fuels management and fire weather influencing fire severity in an extreme fire event. Ecol. Appl (in press).
Lydersen, J.M., Collins, B.M., Miller, J.D., Fry, D.L., Stephens, S.L., 2016. Relating fire-caused change in forest structure to remotely sensed estimates of fire severity. Fire Ecol. 12, 99–116.
Lydersen, J.M., North, M.P., Collins, B.M., 2014. Severity of an uncharacteristically large wildfire, the Rim Fire, in forests with relatively restored frequent fire regimes. For. Ecol. Manag. 328, 326–334.
Meyer, M.D., 2015. Forest fire severity patterns of resource objective wildfires in the southern Sierra Nevada. J. For. 113, 49–56.
Millar, C.I., Stephenson, N.L., 2015. Temperate forest health in an era of emerging megadisturbance. Science 349, 823–826.
Miller, J.D., Collins, B.M., Lutz, J.A., Stephens, S.L., van Wagtendonk, J.W., Yasuda, D.A., 2012a. Differences in wildfires among ecoregions and land management agencies in the Sierra Nevada region, California, USA. Ecosphere 3, art80.
Miller, J.D., Knapp, E.E., Key, C.H., Skinner, C.N., Isbell, C.J., Creasy, R.M., Sherlock, J.W., 2009a. Calibration and validation of the relative differenced Normalized Burn Ratio (RdNBR) to three measures of fire severity in the Sierra Nevada and Klamath Mountains, California, USA. Remote Sens. Environ. 113, 645–656.
Miller, J.D., Quayle, B., 2015. Calibration and validation of immediate post-fire satellite derived data to three severity metrics. Fire Ecol. 11, 12–30.
Miller, J.D., Safford, H., 2012. Trends in wildfire severity 1984–2010 in the Sierra Nevada, Modoc Plateau and southern Cascades, California, USA. Fire Ecol. 8, 41–57.
Miller, J.D., Safford, H.D., Crimmins, M., Thode, A.E., 2009b. Quantitative evidence for
increasing forest fire severity in the Sierra Nevada and southern Cascade Mountains, California and Nevada, USA. Ecosystems 12, 16–32.
Miller, J.D., Skinner, C.N., Safford, H.D., Knapp, E.E., Ramirez, C.M., 2012b. Trends and causes of severity, size, and number of fires in northwestern California, USA. Ecol. Appl. 22, 184–203.
Miller, J.D., Thode, A.E., 2007. Quantifying burn severity in a heterogeneous landscape with a relative version of the delta Normalized Burn Ratio (dNBR). Remote Sens. Environ. 109, 66–80.
North, M., Collins, B.M., Stephens, S., 2012. Using fire to increase the scale, benefits, and future maintenance of fuels treatments. J. For. 110, 392–401.
North, M.P., Stephens, S.L., Collins, B.M., Agee, J.K., Aplet, G., Franklin, J.F., Fulé, P.Z., 2015. Reform forest fire management. Science 349, 1280–1281.
Parks, S.A., Holsinger, L.M., Miller, C., Nelson, C.R., 2015. Wildland fire as a self-reg-ulating mechanism: the role of previous burns and weather in limiting fire progres-sion. Ecol. Appl. 25, 1478–1492.
Parks, S.A., Holsinger, L.M., Miller, C., Parisien, M.-A., 2017. Analog-based fire regime and vegetation shifts in mountainous regions of the western US. Ecography (in press).
Perry, D.A., Hessburg, P.F., Skinner, C.N., Spies, T.A., Stephens, S.L., Taylor, A.H., Franklin, J.F., McComb, B., Riegel, G., 2011. The ecology of mixed severity fire re-gimes in Washington, Oregon, and northern California. For. Ecol. Manag. 262, 703–717.
Picotte, J.J., Peterson, B., Meier, G., Howard, S.M., 2016. 1984–2010 trends in fire burn severity and area for the conterminous US. Int. J. Wildland Fire 25, 413–420.
Robock, A., 1988. Enhancement of surface cooling due to forest fire smoke. Science 242, 911–913.
Rothermel, R.C., 1991. Predicting behavior and size of crown fires in the Northern Rocky Mountains. USDA Forest Service, Intermountain Research Station.
Safford, H.D., Stevens, J.T., 2017. Natural Range of Variation (NRV) for yellow pine and mixed conifer forests in the Sierra Nevada, southern Cascades, and Modoc and Inyo National Forests, California, USA. USDA Forest Service, Pacific Southwest Research Station. General Technical Report PSW-GTR-256, Albany, CA.
Safford, H.D., Stevens, J.T., Merriam, K., Meyer, M.D., Latimer, A.M., 2012. Fuel treat-ment effectiveness in California yellow pine and mixed conifer forests. For. Ecol. Manag. 274, 17–28.
Stephens, S.L., Agee, J.K., Fulé, P.Z., North, M.P., Romme, W.H., Swetnam, T.W., Turner, M.G., 2013. Managing forests and fire in changing climates. Science 342, 41–42.
Stephens, S.L., Bigelow, S.W., Burnett, R.D., Collins, B.M., Gallagher, C.V., Keane, J., Kelt, D.A., North, M.P., Roberts, L.J., Stine, P.A., Van Vuren, D.H., 2014a. California spotted owl, songbird, and small mammal responses to landscape fuel treatments. Bioscience.
Stephens, S.L., Burrows, N., Buyantuyev, A., Gray, R.W., Keane, R.E., Kubian, R., Liu, S., Seijo, F., Shu, L., Tolhurst, K.G., van Wagtendonk, J.W., 2014b. Temperate and boreal forest mega-fires: characteristics and challenges. Front. Ecol. Environ. 12, 115–122.
Stephens, S.L., Collins, B.M., Biber, E., Fulé, P.Z., 2016. U.S. federal fire and forest policy: emphasizing resilience in dry forests. Ecosphere 7 e01584-n/a.
Stephens, S.L., Ruth, L.W., 2005. Federal forest-fire policy in the United States. Ecol. Appl. 15, 532–542.
Stevens, J.T., Safford, H.D., Latimer, A.M., 2014. Wildfire-contingent effects of fuel treatments can promote ecological resilience in seasonally dry conifer forests. Can. J. For. Res. 44, 843–854.
Swanson, M.E., Franklin, J.F., Beschta, R.L., Crisafulli, C.M., DellaSala, D.A., Hutto, R.L., Lindenmayer, D.B., Swanson, F.J., 2011. The forgotten stage of forest succession: early-successional ecosystems on forest sites. Front. Ecol. Environ. 9, 117–125.
Taylor, A.H., Skinner, C.N., 2003. Spatial patterns and controls on historical fire regimes and forest structure in the Klamath Mountains. Ecol. Appl. 13, 704–719.
Therneau, T.M., Atkinson, B., Ripley, B., 2010. rpart: Recursive partitioning. R package version 3, 1–46.
Thompson, J., Spies, T., 2010. Factors associated with crown damage following recurring mixed-severity wildfires and post-fire management in southwestern Oregon. Landsc. Ecol. 25, 775–789.
van Wagtendonk, J.W., 2007. The history and evolution of wildland fire use. Fire Ecology 3, 3–17.
Welch, K.R., Safford, H.D., Young, T.P., 2016. Predicting conifer establishment post wildfire in mixed conifer forests of the North American Mediterranean-climate zone. Ecosphere 7 e01609-n/a.
Westerling, A.L., Bryant, B.P., Preisler, H.K., Holmes, T.P., Hidalgo, H.G., Das, T., Shrestha, S.R., 2011. Climate change and growth scenarios for California wildfire. Clim. Change 109, S445–S463.
Young, D.J.N., Stevens, J.T., Earles, J.M., Moore, J., Ellis, A., Jirka, A.L., Latimer, A.M., 2017. Long-term climate and competition explain forest mortality patterns under extreme drought. Ecol. Lett. 20, 78–86.
36