forest ecology and management
TRANSCRIPT
Drought induced decline could portend widespread pine mortalityat the xeric ecotone in managed mediterranean pine-oak woodlands
Guillermo Gea-Izquierdo a,b,⇑, Bárbara Viguera a, Miguel Cabrera c, Isabel Cañellas a
a INIA-CIFOR, Crta. La Coruña km 7.5, 28040 Madrid, Spainb CEREGE UMR 7330, CNRS/Aix-Marseille Université, Europole de l’Arbois, BP 8013545, Aix-en-Provence cedex 4, Francec Aranzada Gestión Forestal S.L.P., C/Alonso Heredia, 31, 28028 Madrid, Spain
a r t i c l e i n f o
Article history:Received 24 October 2013Received in revised form 12 February 2014Accepted 19 February 2014
Keywords:Quercus pyrenaicaPinus sylvestrisGlobal changeDendroecologyVulnerability to water stress
a b s t r a c t
There is a need to better understand how different biotic and abiotic factors interact to determine climatechange enhanced tree mortality. Here, we investigated whether rising water stress determined enhancedPinus sylvestris L. mortality at the species low-elevation limit in Central Spain. We analyzed the factorsdetermining the health status of pines and compared with co-occurring and more drought-tolerant Quer-cus pyrenaica Willd along one transect following an elevation gradient. We used ordinal logistic regres-sion to model the susceptibility of a tree to decline in relation to variability in stand competition andindividual growth-patterns. The mortality pattern differed with local site conditions. Pine growth wasfaster but life-span shorter at drier and warmer low-elevations than at high-elevations. However, withinstands, healthy trees exhibited less abrupt growth reductions and higher growth-rates but not as a con-sequence of lower competition, which under present stand conditions did not seem to increase adultmortality risk. Low moisture availability reduced tree-growth and, although P. sylvestris is less tolerantto drought, Q. pyrenaica was more sensitive to year-to-year moisture variability. Previous growth of deadtrees from both species declined with rising water stress after the 1970s at low-elevations, which sug-gests that water stress intensity limited particularly tree-growth of dead trees in the long-term. For pines,widespread symptoms of crown decline (expressed by mistletoe infestation and defoliation) were onlyobserved at low-elevation stands where, in opposition to oaks, weakened and healthy pines also exhib-ited recent negative growth-trends parallel to those of dead trees. The pervasive growth decline withenhanced water stress in pines from all health status at the species sampled xeric ecotone combined withthe abundant crown decline symptoms observed, suggest pine vulnerability and could portend wide-spread mortality at its current low-elevation limit.
! 2014 Elsevier B.V. All rights reserved.
1. Introduction
Climate change related increases in drought frequency andseverity have a negative impact on forest ecosystem productivityand tree performance (Boisvenue and Running, 2006; Lenoiret al., 2008; Choat et al., 2012). Therefore it is crucial to better de-scribe the underlying processes governing forest acclimation towater stress (Bréda et al., 2006; Niinemets, 2010; McDowellet al., 2011) particularly at those ecosystems where sustainabilityis threatened by enhanced mortality caused by recent climaticchanges (Adams et al., 2009; Van Mantgem et al., 2009; Allenet al., 2010). Accurate prediction of tree vulnerability to increasing
water stress is challenging because many biotic and abiotic factorsinteract at different time scales and trees with symptoms of lowvitality can recover from stress provided they do not fall belowthresholds where irreversible damage occurs (Suárez et al., 2004;Dobbertin, 2005; Breshears et al., 2009). In addition, it can be par-ticularly complex to isolate the long-term effect of climate at thosesites where land-use has shaped the current state of forests anddetermine forest dynamics (Gimmi et al., 2010; Van Bogaertet al., 2011; Wischnewski et al., 2011).
The interdependent factors that determine species-specific sus-ceptibility to drought induced decline and mortality must be inves-tigated at different temporal scales in order to understand forestvulnerability. Growth can be used as a direct proxy to the treenet carbon pool. Using dendrochronological methods it is possibleto analyze long-term environmental stressors (like water stress)predisposing trees to decline and short-term agents or eventsinciting posterior death of individuals (Suárez et al., 2004;
http://dx.doi.org/10.1016/j.foreco.2014.02.0250378-1127/! 2014 Elsevier B.V. All rights reserved.
⇑ Corresponding author at: CEREGE UMR 7330, CNRS/Aix-Marseille Université,Europole de l’Arbois, BP 8013545, Aix-en-Provence cedex 4, France. Tel.: +33 (0)442971532.
E-mail addresses: [email protected], [email protected] (G. Gea-Izquierdo).
Forest Ecology and Management 320 (2014) 70–82
Contents lists available at ScienceDirect
Forest Ecology and Management
journal homepage: www.elsevier .com/ locate/ foreco
McDowell et al., 2010; Linares and Camarero, 2012). The size-dependent mortality risk of trees increases under more resourcestressful conditions when stand competition is intense (Zahneret al., 1989; Voelker et al., 2008; Luo and Chen, 2011) and withinstands the trees with a higher likelihood to die are generally thosewith slow growth and negative growth-trends (Bigler and Bug-mann, 2004; Suárez et al., 2004; Bigler et al., 2006).
Plants co-regulate different functional traits to cope with waterstress (Bréda et al., 2006; Niinemets, 2010; McDowell et al., 2011)and complementary functionalities between species can help themto optimize environmental resources in mixed stands (Cavardet al., 2011; Luo and Chen, 2011). A widespread example in theNorthern Hemisphere is that of oak-pine forests (Brose and Wal-drop, 2010; Wischnewski et al., 2011; Sheffer, 2012). There is var-iability in drought tolerance among oak and pine species. Oftenpines behave as isohydric species (i.e. plant maintain relativelyconstant leaf water potential through stomatal control and re-duced conductance despite declining soil and root water poten-tials) whereas oaks as anisohydric, which means they developeddifferent strategies to cope with water stress (Abrams, 1990; Eil-mann et al., 2009). Submediterranean oak species are expected toendure water stress further than less drought tolerant boreal coni-fers such as P. sylvestris and there could exist already an ongoingshift in species composition in mountain oak-pine forests, e.g. inthe Alps (Bigler et al., 2006; Gimmi et al., 2010; Rigling et al.,2013) and the Pyrenees (Galiano et al., 2010; Heres et al., 2012;Vilá-Cabrera et al., 2013).
In this study we analyzed how climate and stand related fac-tors determined the health status of two functionally differentco-occurring species (Q. pyrenaica, a deciduous submediterraneanoak, and P. sylvestris, an evergreen boreal pine) along an altitudi-nal gradient in Central Spain where pine stands at low-elevationsseem to express symptoms of decline and enhanced mortality.The response to climate and the long-term growth-trends ofdead, weakened and healthy trees were compared in relation torecent enhancement in water stress. The likelihood for a tree ofbeing within a given health status was modeled to describe var-iability in the mortality pattern along the altitudinal gradient. Bycomparing the growth trends of trees with different health statuswe specifically analyzed whether the growth pattern of live treesresembled that of dead trees to analyze stand vulnerability to cli-mate change. We hypothesize that the two species will exhibitdifferent growth-trends in relation to recent water stress in-crease, particularly: (1) within stands, dead trees of both specieswill exhibit slower growth with recent negative trends; (2) weak-ened trees will show similar growth-trends to those of deadtrees, which will portend near mortality; (3) the growth-trendsof non-healthy trees at low elevations will match the recent re-gional increase in water stress, suggesting that long-term droughtseverity enhancement predisposed trees to decline only at xericsites; (4) recent growth-trends of healthy trees resembling thoseof dead trees will express species-specific vulnerability to climatechange.
2. Material and methods
2.1. Study site and data
Trees were sampled at four locations in Central Spain along onetransect following an altitudinal gradient of increasing rainfall anddecreasing temperature with increasing altitude (Table 1). Low-ele-vation stands (i.e. Sites #0 and #1) were an open oak woodland withsome clusters of adult pines at an altitude around 1075 m subjectedto typical silvopastoral management in Mediterranean oak wood-lands, i.e. thinning to convert open woodland, grazing livestockand copiccing for firewood. Clusters of adult trees were monospe-cific within stands: Site #0 corresponds to stands with adult pineoverstory whereas Site #1 to stands with oak overstory. Low-eleva-tion Site #2 (altitude around 1180 m) was dominated by pine withan irregularly mixed oak saplings understory. High-elevation Site#3 (altitude above 1400 m) was monospecific P. sylvestris forest.Sites #2 and #3 presented higher stand density but generally not fullcanopy cover. Sites #1 and #2 are within the current local low-ele-vation xeric ecotone for pine (Table 1), but the distribution of thetwo species has been likely modified by management in history(López-Sáez et al., 2014). Low elevation stands (Sites #0, #1 and#2) presented low pine regeneration (likely partly as a result ofhigher grazing pressure and differences in management betweenstands (Donés and Cabrera, 2009)), widespread symptoms of crowndieback, defoliation and abundant mistletoe infestation, which hasbeen shown to be one of the several agents (with drought) involvedin P. sylvestris decline (Dobbertin and Rigling, 2006; Sangüesa-Barreda et al., 2013; Zweifel et al., 2012).
To analyze the relationship between climate and tree health andcharacterize the mortality pattern under different ecological condi-tions we sampled trees within three health status classes at the fourdifferent elevations: (1) ‘dead’ when trees presented 100% crowndieback; (2) ‘weakened or declining’ were considered those oaks withstem basal rot and partial canopy dieback, and those pines with acertain level of crown defoliation (over 20% compared to neighbor-ing healthy trees) and infested by the semiparasite plant Viscumalbum L. (mistletoe) in at least one third of the canopy (Sangüesa-Barreda et al., 2012, 2013); (3) ‘healthy’ were those trees withoutthe symptoms described in the previous two categories. It must benoted that trees with canopy decline presented both defoliationand mistletoe infestation. We sampled dominant adult trees(dbh > 25 cm) to analyze the growth trends in the longest possibleinterval and avoid oak resprouts of 40–70 years old likely estab-lished after last logging for firewood in the mid 1900s. We sampledneighboring trees of different health classes subject to similar standcompetition conditions. However, this was not possible in all cases,the reason why we report a different number of plots for the differ-ent sites and health status (see below for definition of sampled plot).
2.2. Dendrochronological methods
At each site we searched for target individuals of the two spe-cies with different health status. Trees were bored twice at
Table 1Mean site characteristics. Ps = P. sylvestris; Qp = Q. pyrenaica. dbh = diameter at 1.30 m; BA = basal area; Dd = stand density. DBH, BA and Dd are plot values calculated from thecharacteristics of the neighbor trees (either the closest 10 of dbh over 7.5 cm if they are closer than 10 m or those included within a radius of 10 m) of those cored. Different letterscorrespond to significant differences using the LSD test on a one-way ANOVA comparing the four sites. Standard deviations are between parentheses.
Site Name Sp. # Plots Altitude (m) Coordinates Slope Climate Competition
(") Ppt (mm) Tmean ("C) Tmin ("C) dbh (cm) BA (m2/ha) Dd (n/ha)
0 QUPY0 Qp 28 1056 (57) 40.86"N 4.02"W 0–15 660.3 10.3 5.35 29.1 (15.4)a 12.0 (11.0)b 213.5 (281.4)a
1 PISY1-low Ps 17 1077 (17) 40.86"N 4.01"W 15–25 660.3 10.3 5.35 14.6 (9.1)b 5.5 (8.5)c 155.9 (222.1)a
2 PISY2-medium Ps 20 1179 (92) 40.90"N 4.02"W 0–15 731.4 9.9 5.15 36.2 (15.6)a 22.4 (13.2)a 197.8 (80.9)a
3 PISY3-high Ps 17 1596 (105) 40.84"N 4.06"W 0–45 944.4 7.9 2.95 35.9 (18.7)a 22.0 (11.7)a 263.2 (286.4)a
G. Gea-Izquierdo et al. / Forest Ecology and Management 320 (2014) 70–82 71
1.30 m, with an angle of 180" and perpendicular to the dominantslope to avoid reaction wood. Plots were then laid out around eachbored target tree to asses stand competition by measuring dis-tances to the target tree and two times the dbh of the 10 nearestneighbors of trees with dbh > 7.5 cm up to a maximum distanceof 10 m away. We did not separate the influence of competitionby species because it was homogeneous within altitudes: almostpure oak competition in #0 and #1, 50% of trees from each speciesin #2 (with pine dominating the canopy and oaks with dbh < 20 cmin the subcanopy) and pure pine competition in #3. Cores weresanded and growth increments visually crossdated, measuredand verified with COFECHA (Holmes, 1983).
The growth trends in relation to climate were analyzed at dif-ferent time scales. Firstly, the long-term response was analyzedusing basal area increments (BAI) calculated from measured dbhand tree-ring widths. Secondly, to study the response of growthto the inter-annual variability of climate (short-term response)we used prewithened residual chronologies (GIres) calculated frombiweight means of ratios between raw growth measurements andindividual cubic splines with a 50% frequency cutoff at 30 years(Fritts, 1976). In addition to the dendroecological analysis of thetree overstory, we collected 12 crossections of Cistus laurifolius L.from Sites #0 and #1 (this species was only abundant on theunderstory of those two sites). This was done to analyze the agedistribution of the understory in low-elevation open stands tostudy management events of shrub removal or changes in grazingintensity.
2.3. Climatic covariates
Gridded CRU TS 3.10 data (Mitchell and Jones, 2005) includingmonthly precipitation and mean, minimum and maximum tem-perature were obtained from the KNMI explorer (http://cli-mexp.knmi.nl/get_index.cgi) for the period 1901–2004. Griddeddata were corrected linearly using data from local stations fromAEMET (http://www.aemet.es/es/portada). In addition we calcu-lated the Standardized Precipitation-Evapotranspiration Index(SPEI) using the SPEI package in R (http://sac.csic.es/spei/) with ascale of 6 months. This drought index is calculated using water bal-ances from precipitation and potential evapotranspiration (PET),which we estimated following Thornthwaite (Vicente-Serranoet al., 2010). Water stress increases inversely to SPEI.
2.4. Analysis of the climate-growth response of trees with differenthealth status
To analyze the growth response to the year-to-year variabilityin climate we calculated bootstrap correlations (period 1901–2010) between growth and climatic periods of maximum growthresponse for the species studied as selected from a preliminaryanalysis (Appendix A) and the literature (e.g. Tessier et al., 1994;Eilmann et al., 2009). To analyze the species drought toleranceand see whether very dry years triggered abrupt reductions inmean growth we used superposed epoch analysis (SEA, Pragerand Hoenig, 1989) on 7 drought events within the period 1901–2010 defined as those where precipitation of the hydrological yearwas below 500 mm (1950, 1957, 1965, 1986, 1992, 1995 and2005), which were also those of minimum SPEI (Appendix B). Fi-nally we compared smoothed climatic data and BAI chronologiesto investigate the growth-response to the long-term variability indrought intensity.
2.5. Effect of stand and individual features on the tree health status
We used ordinal logistic regression using the ‘parallel slopes’model to analyze the influence of individual and stand features
on the probability for a tree to be within a health class (Benderand Grouven, 1997; Canham et al., 2010). To ultimately calculatethe probability p of a tree falling into health class k + 1, ordinal lo-gistic regression uses cumulative probabilities as defined by:
logitðPiksÞ ¼ logðPiks=ð1$ PiksÞÞ ¼ aks þ b1s & x1i þ & & & þ bns & xni ð1Þ
The cumulative probability of being ‘dead’ is P3s = 1. Piks is thecumulative probability of an individual i of species s falling intothe health class k (healthy or weakened, i.e. ordinal logistic regres-sions for each species includes two model equations for the cumu-lative probability differing in the intercept ak). The naturallogarithm of the odds ratio (logit) of the cumulative probability ismodeled as a linear function of different stand and tree individualcovariates (xni) where bns are regression parameters associated tothe different covariates xni. P(i 6 Yk|X) is the probability that anobservation Y will be less than or equal to ordinal level Yk
(k = 1,2; i.e. health class healthy or weakened) given a vector ofexplanatory variables X. The probability p that an individual i fallsinto health class k + 1 is: pk M k + 1 = P(i 6 Yk + 1|X) $ P(i 6 Yk|X),where X is a vector of explanatory variables. Since the probabilitiescalculated from the logistic model (P) are cumulative, the probabil-ity p for an individual to be dead would be p2 M 3 = 1–P(i 6 Y2|X).
A different ordinal logistic model was fitted for each species. Wetested the following hypotheses expressed by covariates (i.e. bns&xni
in Eq. (1)) related to stand and tree individual features:
(1) Dead trees will exhibit a distinctive negative trend in the lastdecades previous to the tree death (Bigler and Bugmann,2004). We used the slope of the regression of growth on yearsince 1970 (s1970) to test whether the growth reduction pre-vious to death was concurrent to the increase in droughtsince the early 1970s (Appendix B).
(2) Healthy trees will have a lower number of abrupt growthsuppressions calculated as the number of years where thenegative growth change (NGC) was below $25% (Das et al.,2007). Similarly, different health classes could exhibit a dif-ferent number of years with positive growth changes (PGC).A greater number of PGCs could reflect that trees were moresensitive to increased available resources after stand distur-bances or humid periods (see Appendix C for calculationsand references).
(3) The relative growth rate of individual trees (relBAIi = BAIi/BA,for tree i) will differ for the different health classes (Biglerand Bugmann, 2004; McDowell et al., 2010).
(4) Trees of different health status will exhibit different averagegrowth (Gmean) or juvenile growth (here calculated for thefirst 40 years, G40) (Bigler and Bugmann, 2004; Bigler andVeblen, 2009).
(5) Dead trees will exhibit higher mean sensitivity (msx, a mea-surement of the year-to-year variation in growth; as in Fritts,1976) to climate (Suárez et al., 2004; McDowell et al., 2010).
(6) We analyzed whether higher levels of competition deter-mined individual adult mortality by comparing three differ-ent competition indices: two distance independent indices(density in trees&ha$1 and basal area [BA] in m2 ha$1 of com-petitors around each target tree) and a distance dependentindex analyzed within a 5 m and 10 m radius
HI ¼Pn
j¼1ðdbhj=dbhiÞ & ½1=ðdistij þ 1Þ(! "
.
Nested models including the previous covariates were com-pared based on the Akaike Information Criterion corrected forsmall sample size (AICc) reported as the index Di = AICci–AICcmin,where AICcmin is the minimum AICc of all formulations compared.The model with Di = 0.0 is the best (Burnham and Anderson,2004). The maximum likelihood parameters and two-unit supportintervals for each parameter were estimated in the probabilistic
72 G. Gea-Izquierdo et al. / Forest Ecology and Management 320 (2014) 70–82
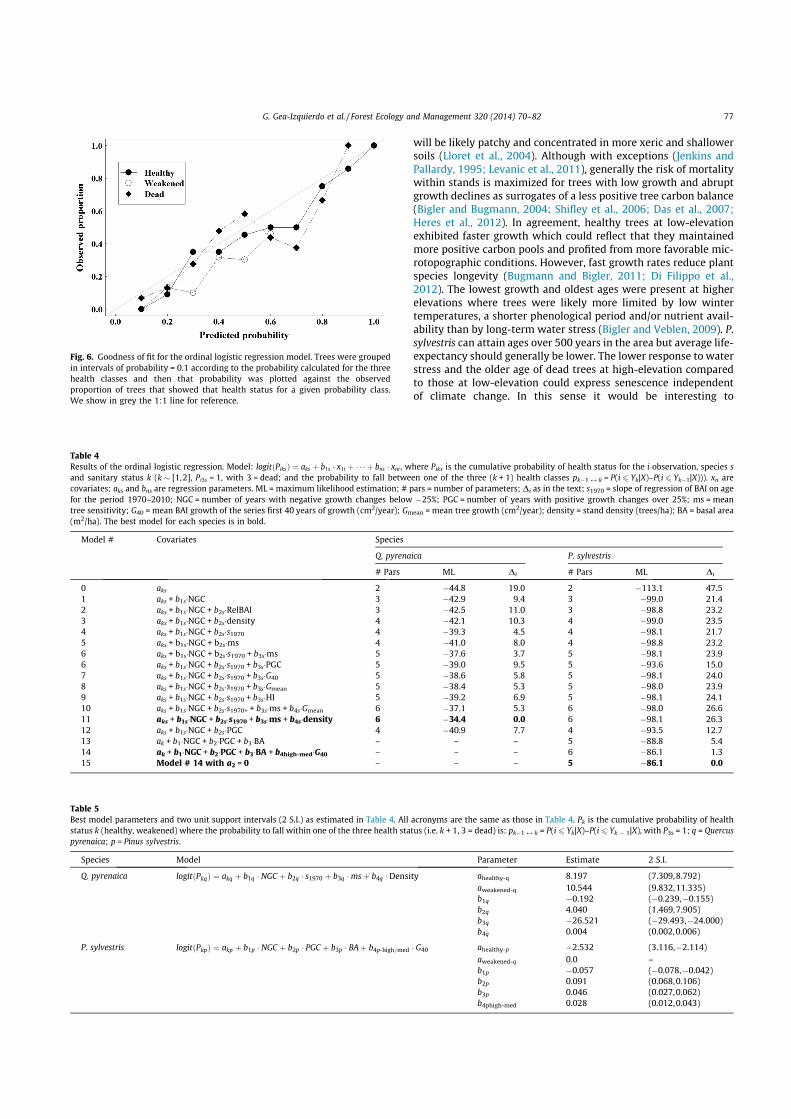
model using simulated annealing and R likelihood package (http://www.sortie-nd.org/lme/lme_R_code_tutorials.html). Two-unitsupport intervals for specific parameters are analogous to 95% con-fidence intervals but calculated as those reducing two units themaximum likelihood function maximized for the other parameters(Bolker, 2008). To assess the goodness of fit in the final ordinal lo-gistic model we followed Canham et al. (2010). First using the fit-ted parameters in the best model we calculated the predictedprobability for each tree to fall within each of the three health clas-ses. Then we divided the predicted probability of each class into10% intervals and compared the proportion of predicted trees with-in each class with the proportion of observed trees that actually fellwithin a given health class.
3. Results
Average tree and stand characteristics were similar amonghealth classes within site except for growth and dbh for both spe-cies, and height for oaks (Table 2; Fig. 1). The trees were older andgrowth was slower at high elevation than at low elevations (Figs. 1and 2; Tables 2 and 3). We did not observe symptoms of canopydecline at high-elevation stands, therefore at that site we onlysampled ‘healthy’ and ‘dead’ trees. Conversely, more than 30% ofpines presented symptoms of canopy decline at the pine forest eco-tone (Site #2) whereas at the lowest elevation site (Site #1) all pinetrees were ‘weakened’ or ‘dead’. Although we report results from148 trees (Table 3) we sampled a higher number of dead trees be-cause often wood decay made rings indistinguishable. This was thereason why the ‘dead’ pine chronology at the lowest site was lessreplicated and why most of the dead trees analyzed had died inthe last 3 years. Since at Site #1 the growth trends of ‘dead’ treeswere similar to those of the ‘weakened’ trees (Fig. 1) we built a sin-gle chronology (PS1 in Table 3) for the climate response analysis. Atlow-elevation all stands exhibited a major establishment datelikely related to some management event (Table 2, Fig. 2), whichwas in the mid 19th century for pines and oaks at the lowest ele-vation, and in the early 1900s at the pine forest ecotone. A bimodalage distribution of C. laurifolius (peaks around 1955 and 1985,Appendix D) suggests periodic shrub removal (i.e. silvopastoralmanagement) at Sites #0 and #1.
3.1. Drought increase determines long-term growth of different healthclasses
The response of the three health classes to year-to-year climaticvariability (i.e. short-term) was similar and differences in thisresponse were mostly explained by differences in species and
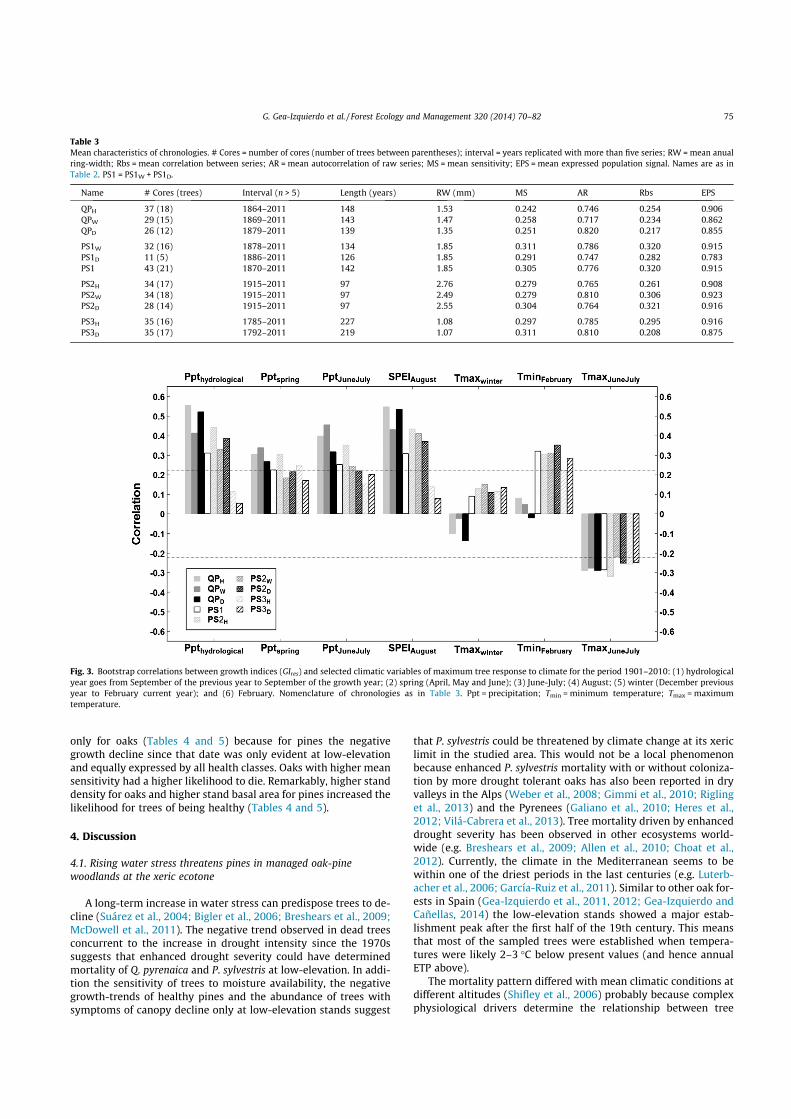
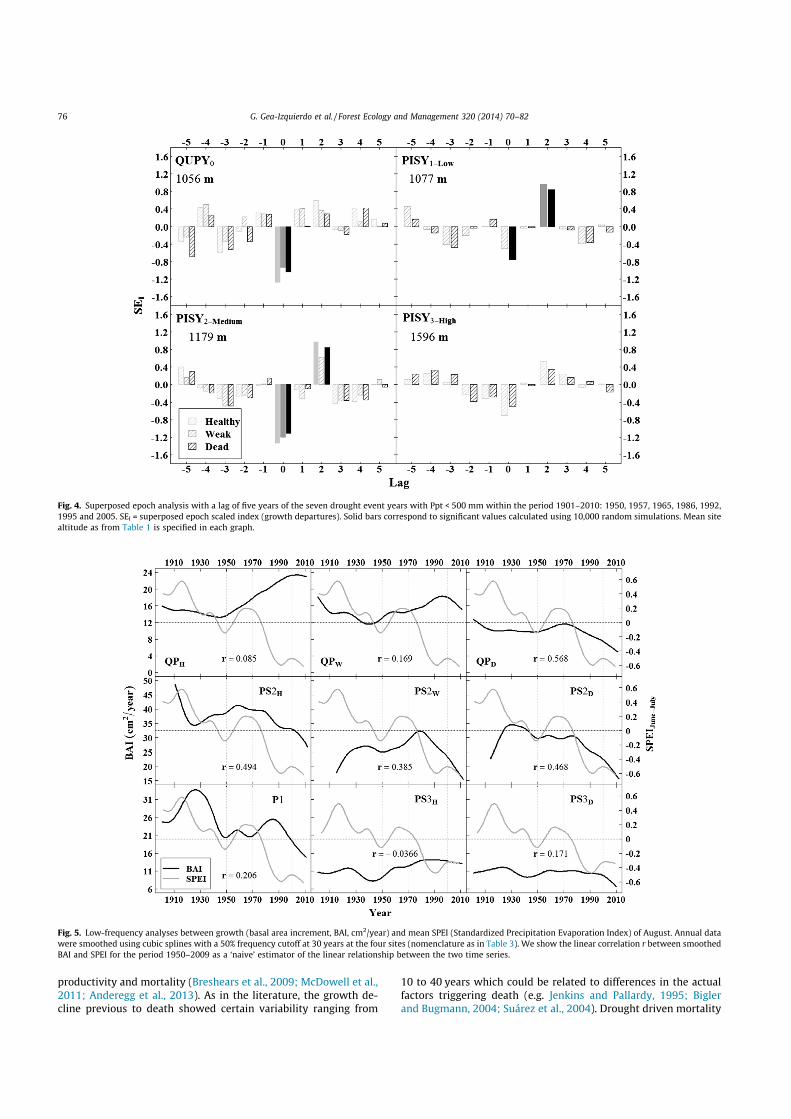
altitude (Fig. 3; Appendix A). Oak growth was more sensitive toyear-to-year moisture availability than pines, which lowestsensitivity to moisture was expressed at high-elevation (Fig. 3).PET was calculated using Thornthwaite and correlations betweengrowth and calculated PET were very similar to those with temper-ature (not shown). The pines were positively affected by warmconditions in February, while oak growth did not seem to be af-fected by winter temperature (Fig. 3). June and July were themonths where the growth response to climate was maximizedfor both species, which expressed a negative impact of high earlysummer temperatures (Appendix A). Drought events triggeredminimum growth for all trees but this was not significant at highelevation (Fig. 4). Oak growth recovered faster than that of pinesthe year after drought. It took two years for pines to recover fromdrought events but then growth was higher than the average,which suggests that pines were more affected than oaks bydrought.
The response of trees to climate in the long-term presentedsome differences to that in the short-term. The three health classesexpressed a different long-term response to climate. The mortalitypattern was not homogeneous among chronologies as shown bythe different long-term growth trends between the three healthclasses and the different mean age of dead trees observed at differ-ent altitudes (Fig. 1). Healthy oaks and high-elevation healthypines were the only chronologies which did not exhibit a recentnegative growth trend. Dead trees generally exhibited minimumabsolute growth during recent years. Growth of weakened oaks di-verged from that of healthy oaks since the 1960s. Dead oaks con-sistently exhibited lower growth rates during the last century,and their recent growth decline matched the increase in droughtintensity since the 1970s (Fig. 5). Growth of weakened oaks anddead pines at high-elevation declined concurrently to increaseddrought severity since approximately year 2000. All pine trees atlow-elevation exhibited a marked recent growth decline. At Site#2 weakened and dead pines showed similar abrupt negativetrends starting in the late 1970s, whereas growth of healthy pineswas above that of non-healthy pines but also exhibited a parallelgrowth decline (Figs. 1 and 5). At Site #1 a negative trend alongthe life span of pines (Fig. 5) was mixed with mid-term distur-bances likely related to more intense silvopastoral managementat the lowest elevation (e.g. peaks around 1950, Appendix D).
3.2. Tree and stand factors influence health status and vulnerability todrought increase
The fit of the logistic model was good but only some of thetested covariates were significant (Fig. 6). The most significant
Table 2Mean characteristics of trees included in the chronologies. Standard deviations are shown between parentheses. Site is as in Table 1. Age corresponds to estimated age at 1.30 cm.Different letters mean significant differences between health categories within each site according to a LSD test of mean differences in a one-way ANOVA between the 10chronologies. DBH, tree height (H) and age correspond to the cored trees; BA, density, and HI corresponds to plot values calculated for each cored tree in relation to the neighbortrees within plot. Ps = P. sylvestris; Qp = Q. pyrenaica. HI10 and HI5 are the distance dependence indices (HI) calculated for a radius of 10 and 5 m respectively.
Site Name Sp. Sanitary status Sampled trees Competition
DBH (cm) H (m) Age (years) BA (m2/ha) Density (trees/ha) HI10 HI5
0 QPH Qp Healthy 56.0 (15.5)cd 15.4 (3.0)d 159 (15)b 13.6 (10.3)bcde 221.0 (306.8)ab 0.41 (0.31)bc 0.24 (0.27)bc
QPW Qp Weakened 48.6 (16.4)de 14.2 (3.6)d 140 (36)bc 9.4 (10.2)def 181.0 (222.2)ab 0.50 (0.50)ab 0.36 (0.42)ab
QPD Qp Dead 43.4 (6.8)e 11.1 (2.8)e 137 (23)c 13.4 (12.4)cde 226.7 (306.0)ab 0.51 (0.50)ab 0.35 (0.53)abc
1 PS1W Ps Weakened 66.2 (18.0)abc 16.0 (2.6)cd 147 (21)bc 6.5 (9.6)ef 181.2 (247.6)ab 0.19 (0.19)c 0.09 (0.12)c
PS1D Ps Dead 71.8 (27.9)a 16.0 (4.4)cd 147 (12)bc 2.3 (2.1)f 75.1 (78.0)b 0.14 (0.19)c 0.09 (0.17)bc
2 PS2H Ps Healthy 69.6 (21.0)ab 20.1 (2.5)ab 106 (17)d 22.5 (16.3)ab 147.8 (64.5)ab 0.51 (0.43)ab 0.31 (0.42)abc
PS2W Ps Weakened 57.1 (12.9)cd 20.9 (2.8)ab 102 (7)d 23.1 (9.6)a 232.1 (75.9)ab 0.77 (0.37)a 0.54 (0.54)a
PS2D Ps Dead 58.8 (16.7)bcd 18.5 (4.4)bc 95 (23)d 18.4 (12.1)abcd 175.3 (75.5)ab 0.61 (0.47)ab 0.34 (0.48)abc
3 PS3H Ps Healthy 54.2 (10.3)cde 22.0 (4.1)a 207 (39)a 21.1 (12.5)abc 247.8 (279.6)a 0.58 (0.39)ab 0.21 (0.24)bc
PS3D Ps Dead 50.7 (12.8)de 21.4 (3.1)a 202 (40)a 21.1 (12.1)abc 245.1 (271.0)ab 0.63 (0.42)ab 0.22 (0.26)bc
G. Gea-Izquierdo et al. / Forest Ecology and Management 320 (2014) 70–82 73

covariate selected for both species was NGC, i.e. the number ofyears when trees exhibited abrupt growth reductions. Selectionof NGC in the model expressed that trees suffering a higher num-ber of growth suppressions (i.e. more decreasing growth) along
their life had a lower likelihood of being healthy. Conversely, ahigher number of positive growth episodes and higher initialgrowth increased the likelihood of being healthy for pines. The de-cline in growth since 1970 separated the different health classes
Fig. 1. BAI trends of the different mean chronologies according to health status at the four sites. Low, medium and high refer to Sites #1, #2 and #3, respectively. QUPY = Q.pyrenaica; PISY = Pinus sylvestris. Dashed vertical lines highlight years 1950 and 1970. Mean site altitude as from Table 1 is specified in each graph.
Fig. 2. Distribution of estimated dates of establishment (at 1.30 m) of sampled trees at the four sites. Low, medium and high refer to Sites #1, #2 and #3 respectively. Meansite altitude as from Table 1 is specified in each graph.
74 G. Gea-Izquierdo et al. / Forest Ecology and Management 320 (2014) 70–82
only for oaks (Tables 4 and 5) because for pines the negativegrowth decline since that date was only evident at low-elevationand equally expressed by all health classes. Oaks with higher meansensitivity had a higher likelihood to die. Remarkably, higher standdensity for oaks and higher stand basal area for pines increased thelikelihood for trees of being healthy (Tables 4 and 5).
4. Discussion
4.1. Rising water stress threatens pines in managed oak-pinewoodlands at the xeric ecotone
A long-term increase in water stress can predispose trees to de-cline (Suárez et al., 2004; Bigler et al., 2006; Breshears et al., 2009;McDowell et al., 2011). The negative trend observed in dead treesconcurrent to the increase in drought intensity since the 1970ssuggests that enhanced drought severity could have determinedmortality of Q. pyrenaica and P. sylvestris at low-elevation. In addi-tion the sensitivity of trees to moisture availability, the negativegrowth-trends of healthy pines and the abundance of trees withsymptoms of canopy decline only at low-elevation stands suggest
that P. sylvestris could be threatened by climate change at its xericlimit in the studied area. This would not be a local phenomenonbecause enhanced P. sylvestris mortality with or without coloniza-tion by more drought tolerant oaks has also been reported in dryvalleys in the Alps (Weber et al., 2008; Gimmi et al., 2010; Riglinget al., 2013) and the Pyrenees (Galiano et al., 2010; Heres et al.,2012; Vilá-Cabrera et al., 2013). Tree mortality driven by enhanceddrought severity has been observed in other ecosystems world-wide (e.g. Breshears et al., 2009; Allen et al., 2010; Choat et al.,2012). Currently, the climate in the Mediterranean seems to bewithin one of the driest periods in the last centuries (e.g. Luterb-acher et al., 2006; García-Ruiz et al., 2011). Similar to other oak for-ests in Spain (Gea-Izquierdo et al., 2011, 2012; Gea-Izquierdo andCañellas, 2014) the low-elevation stands showed a major estab-lishment peak after the first half of the 19th century. This meansthat most of the sampled trees were established when tempera-tures were likely 2–3 "C below present values (and hence annualETP above).
The mortality pattern differed with mean climatic conditions atdifferent altitudes (Shifley et al., 2006) probably because complexphysiological drivers determine the relationship between tree
Fig. 3. Bootstrap correlations between growth indices (GIres) and selected climatic variables of maximum tree response to climate for the period 1901–2010: (1) hydrologicalyear goes from September of the previous year to September of the growth year; (2) spring (April, May and June); (3) June-July; (4) August; (5) winter (December previousyear to February current year); and (6) February. Nomenclature of chronologies as in Table 3. Ppt = precipitation; Tmin = minimum temperature; Tmax = maximumtemperature.
Table 3Mean characteristics of chronologies. # Cores = number of cores (number of trees between parentheses); interval = years replicated with more than five series; RW = mean anualring-width; Rbs = mean correlation between series; AR = mean autocorrelation of raw series; MS = mean sensitivity; EPS = mean expressed population signal. Names are as inTable 2. PS1 = PS1W + PS1D.
Name # Cores (trees) Interval (n > 5) Length (years) RW (mm) MS AR Rbs EPS
QPH 37 (18) 1864–2011 148 1.53 0.242 0.746 0.254 0.906QPW 29 (15) 1869–2011 143 1.47 0.258 0.717 0.234 0.862QPD 26 (12) 1879–2011 139 1.35 0.251 0.820 0.217 0.855
PS1W 32 (16) 1878–2011 134 1.85 0.311 0.786 0.320 0.915PS1D 11 (5) 1886–2011 126 1.85 0.291 0.747 0.282 0.783PS1 43 (21) 1870–2011 142 1.85 0.305 0.776 0.320 0.915
PS2H 34 (17) 1915–2011 97 2.76 0.279 0.765 0.261 0.908PS2W 34 (18) 1915–2011 97 2.49 0.279 0.810 0.306 0.923PS2D 28 (14) 1915–2011 97 2.55 0.304 0.764 0.321 0.916
PS3H 35 (16) 1785–2011 227 1.08 0.297 0.785 0.295 0.916PS3D 35 (17) 1792–2011 219 1.07 0.311 0.810 0.208 0.875
G. Gea-Izquierdo et al. / Forest Ecology and Management 320 (2014) 70–82 75
productivity and mortality (Breshears et al., 2009; McDowell et al.,2011; Anderegg et al., 2013). As in the literature, the growth de-cline previous to death showed certain variability ranging from
10 to 40 years which could be related to differences in the actualfactors triggering death (e.g. Jenkins and Pallardy, 1995; Biglerand Bugmann, 2004; Suárez et al., 2004). Drought driven mortality
Fig. 4. Superposed epoch analysis with a lag of five years of the seven drought event years with Ppt < 500 mm within the period 1901–2010: 1950, 1957, 1965, 1986, 1992,1995 and 2005. SEI = superposed epoch scaled index (growth departures). Solid bars correspond to significant values calculated using 10,000 random simulations. Mean sitealtitude as from Table 1 is specified in each graph.
Fig. 5. Low-frequency analyses between growth (basal area increment, BAI, cm2/year) and mean SPEI (Standardized Precipitation Evaporation Index) of August. Annual datawere smoothed using cubic splines with a 50% frequency cutoff at 30 years at the four sites (nomenclature as in Table 3). We show the linear correlation r between smoothedBAI and SPEI for the period 1950–2009 as a ‘naive’ estimator of the linear relationship between the two time series.
76 G. Gea-Izquierdo et al. / Forest Ecology and Management 320 (2014) 70–82
will be likely patchy and concentrated in more xeric and shallowersoils (Lloret et al., 2004). Although with exceptions (Jenkins andPallardy, 1995; Levanic et al., 2011), generally the risk of mortalitywithin stands is maximized for trees with low growth and abruptgrowth declines as surrogates of a less positive tree carbon balance(Bigler and Bugmann, 2004; Shifley et al., 2006; Das et al., 2007;Heres et al., 2012). In agreement, healthy trees at low-elevationexhibited faster growth which could reflect that they maintainedmore positive carbon pools and profited from more favorable mic-rotopographic conditions. However, fast growth rates reduce plantspecies longevity (Bugmann and Bigler, 2011; Di Filippo et al.,2012). The lowest growth and oldest ages were present at higherelevations where trees were likely more limited by low wintertemperatures, a shorter phenological period and/or nutrient avail-ability than by long-term water stress (Bigler and Veblen, 2009). P.sylvestris can attain ages over 500 years in the area but average life-expectancy should generally be lower. The lower response to waterstress and the older age of dead trees at high-elevation comparedto those at low-elevation could express senescence independentof climate change. In this sense it would be interesting to
Table 4Results of the ordinal logistic regression. Model: logitðPiksÞ ¼ aks þ b1s & x1i þ & & & þ bns & xni , where Piks is the cumulative probability of health status for the i observation, species sand sanitary status k (k ) [1,2], Pi3s = 1, with 3 = dead; and the probability to fall between one of the three (k + 1) health classes pk$1 M k = P(i 6 Yk|X)–P(i 6 Yk$1|X))). xn arecovariates; aks and bns are regression parameters. ML = maximum likelihood estimation; # pars = number of parameters; Di as in the text; s1970 = slope of regression of BAI on agefor the period 1970–2010; NGC = number of years with negative growth changes below $25%; PGC = number of years with positive growth changes over 25%; ms = meantree sensitivity; G40 = mean BAI growth of the series first 40 years of growth (cm2/year); Gmean = mean tree growth (cm2/year); density = stand density (trees/ha); BA = basal area(m2/ha). The best model for each species is in bold.
Model # Covariates Species
Q. pyrenaica P. sylvestris
# Pars ML Di # Pars ML Di
0 aks 2 $44.8 19.0 2 $113.1 47.51 aks + b1s&NGC 3 $42.9 9.4 3 $99.0 21.42 aks + b1s&NGC + b2s&RelBAI 3 $42.5 11.0 3 $98.8 23.23 aks + b1s&NGC + b2s&density 4 $42.1 10.3 4 $99.0 23.54 aks + b1s&NGC + b2s&s1970 4 $39.3 4.5 4 $98.1 21.75 aks + b1s&NGC + b2s&ms 4 $41.0 8.0 4 $98.8 23.26 aks + b1s&NGC + b2s&s1970 + b3s&ms 5 $37.6 3.7 5 $98.1 23.96 aks + b1s&NGC + b2s&s1970 + b3s&PGC 5 $39.0 9.5 5 $93.6 15.07 aks + b1s&NGC + b2s&s1970 + b3s&G40 5 $38.6 5.8 5 $98.1 24.08 aks + b1s&NGC + b2s&s1970 + b3s&Gmean 5 $38.4 5.3 5 $98.0 23.99 aks + b1s&NGC + b2s&s1970 + b3s&HI 5 $39.2 6.9 5 $98.1 24.110 aks + b1s&NGC + b2s&s1970+ + b3s&ms + b4s&Gmean 6 $37.1 5.3 6 $98.0 26.611 aks + b1s&NGC + b2s&s1970 + b3s&ms + b4s&density 6 $34.4 0.0 6 $98.1 26.312 aks + b1s&NGC + b2s&PGC 4 $40.9 7.7 4 $93.5 12.713 ak + b1&NGC + b2&PGC + b3&BA – – – 5 $88.8 5.414 ak + b1&NGC + b2&PGC + b3&BA + b4high-med&G40 – – – 6 $86.1 1.315 Model # 14 with a2 = 0 – – – 5 $86.1 0.0
Table 5Best model parameters and two unit support intervals (2 S.I.) as estimated in Table 4. All acronyms are the same as those in Table 4. Pk is the cumulative probability of healthstatus k (healthy, weakened) where the probability to fall within one of the three health status (i.e. k + 1, 3 = dead) is: pk$1 M k = P(i 6 Yk|X)–P(i 6 Yk $ 1|X), with P3s = 1; q = Quercuspyrenaica; p = Pinus sylvestris.
Species Model Parameter Estimate 2 S.I.
Q. pyrenaica logitðPkqÞ ¼ akq þ b1q & NGC þ b2q & s1970 þ b3q &msþ b4q & Density ahealthy-q 8.197 (7.309,8.792)aweakened-q 10.544 (9.832,11.335)b1q $0.192 ($0.239,$0.155)b2q 4.040 (1.469,7.905)b3q $26.521 ($29.493,$24.000)b4q 0.004 (0.002,0.006)
P. sylvestris logitðPkpÞ ¼ akp þ b1p & NGC þ b2p & PGC þ b3p & BAþ b4p-high=med & G40 ahealthy-p $2.532 (3.116,$2.114)aweakened-q 0.0 –b1p $0.057 ($0.078,$0.042)b2p 0.091 (0.068,0.106)b3p 0.046 (0.027,0.062)b4phigh-med 0.028 (0.012,0.043)
Fig. 6. Goodness of fit for the ordinal logistic regression model. Trees were groupedin intervals of probability = 0.1 according to the probability calculated for the threehealth classes and then that probability was plotted against the observedproportion of trees that showed that health status for a given probability class.We show in grey the 1:1 line for reference.
G. Gea-Izquierdo et al. / Forest Ecology and Management 320 (2014) 70–82 77
determine average life expectancy at different environmental con-ditions in the absence of a long-term climatic stressor.
Size dependent competition reduces the annual variability ofgrowth in dense forests but increases the sensitivity to long-termwater stress and the risk of mortality (Voelker et al., 2008; Cavardet al., 2011; Dietze and Moorcroft, 2011). The studied oak-pinewoodland was simple in structure and within stands the dominantcanopy was generally monospecific. In this sense, positive interac-tions among species are likely underrepresented (Cavard et al.,2011; Luo and Chen, 2011) but competition did not seem to beresponsible for the mortality observed. This situation is very differ-ent to that in abundant Mediterranean coetaneous dense standsestablished after land-use abandonment (Di Filippo et al., 2010;Gea-Izquierdo and Cañellas, 2014; Vilá-Cabrera et al., 2013). Theobserved negative effect of low competition levels for the treehealth may reflect indirectly a negative impact of more intensivemanagement at low-elevation stands predisposing trees to otherinciting agents of mortality (Oliva and Colinas, 2007; Camareroet al., 2011; Vilá-Cabrera et al., 2013). During the main establish-ment period of the sampled stands in the nineteenth century thestudied forest experienced great socio-economical changes, theestablishment of forest management and the foundation of one lo-cal sawmill (Breñosa and Castellarnau, 1884; Franco Mugica et al.,1998). As for other oak-pine ecosystems, the dynamics of the stud-ied stands are not in long-term equilibrium and depend on theinteraction between management and climate (Wischnewskiet al., 2011; Weber et al., 2008; Gimmi et al., 2010; Sheffer,2012). Although we did not study oak at its dry limit (it was usedas an offset to compare with co-occurring declining pine), otherstudies suggest that it will be substituted by more drought tolerantspecies such as Q. ilex L. with climate change (Ruiz-Labourdetteet al., 2013).
4.2. Species-specific growth responses to climate and vulnerability todrought increase
The relationship between tree performance and climate can de-pend on the time scale analyzed. In the long-term, trees with dif-ferent health status exhibited a different response to droughtintensity, and this response was less intense for healthy oaks andfor pines at high elevation. In the short-term, differences in the treeresponse to climate were mostly explained by phenological differ-ences imposed by elevation along climatic gradients (Tessier et al.,1994; Gea-Izquierdo et al., 2011, 2012; Gea-Izquierdo and Cañel-las, 2014; Lloyd et al., 2011). The maximum growth response to cli-mate for deciduous Mediterranean Quercus sp. is generallybetween May and June (Tessier et al., 1994; Gea-Izquierdo et al.,2012; Gea-Izquierdo and Cañellas, 2014). In the cold and continen-tal (in relative terms) Mediterranean forest studied, the key periodfor xylogenesis seemed to be June–July for both species (Eilmannet al., 2009; Michelot et al., 2012). Growth was enhanced underfavorable humid conditions. Evergreen pines were benefited bywarmer temperatures in winter but not the deciduous oak ana-lyzed (Rozas et al., 2009; Gea-Izquierdo and Cañellas, 2014). Oakswere more sensitive than pines to the year-to-year variability inmoisture availability contrary to results in Eilmann et al. (2009).Healthy trees were more sensitive to drought events, in oppositionto results from Sangüesa-Barreda et al. (2012) who reported thattrees infested by mistletoe suffered more after drought thanhealthy trees. Similar to results for P. nigra J.F. Arnold (Martín-Benito et al., 2008), P. sylvestris required two years to restore posi-tive growth anomalies after drought events whereas oaks neededonly one year. Ring-porous oaks need to rebuild their conductiveapparatus every year (Abrams, 1990) but not pines. Different spe-cies-specific hydraulic regulation implies different strategies tocope with susceptibility to drought induced dysfunctions in the
hydraulic system (Eilmann et al., 2009; McDowell et al., 2011;Anderegg et al., 2013).
4.3. Can we forecast future mortality in pine woodlands using simplecrown observations?
Describing simple observations which can be used to forecastfuture tree death is important for forest management under globalchange (Dobbertin, 2005). Drought can induce forest declinethrough interdependent physiological processes related to carbonand hydraulic constraints (Breshears et al., 2009; McDowell et al.,2010, 2011; Anderegg et al., 2013), predisposing trees to other bio-tic and abiotic agents affecting at different temporal scales (Bigleret al., 2006; Galiano et al., 2010; Gaylord et al., 2013). In this studywe analyzed the influence of climate (an abiotic factor) on thehealth status of trees. Although we do not have data to analyzein detail the interaction of climate with other biotic factors, toour knowledge there has not been any recent important insect out-break in the area. Other biotic agents such as semi-parasitic plantswere abundant and used to classify weakened pine trees. Mistle-toes preferentially infest weak trees already affected by long-termpredisposing factors to decline like water stress (Dobbertin and Ri-gling, 2006; Cailleret et al., 2013). They drive host trees to carbonstarvation in the long-term as a consequence of excessive stomatalcontrol to prevent xylem cavitation produced by high mistletoetranspiration (Zweifel et al., 2012). Therefore mistletoe infestationis negative for the host carbon balance (i.e. reduces growth). Mis-tletoes could preferentially infest those trees with previous poorercarbon balances as expressed by a lower past-growth like inSangüesa-Barreda et al. (2012) and our results. However otherauthors reported higher levels of infestation in trees with high-pastgrowth levels, showing that the relationship between tree decline,crown defoliation and mistletoe infestation is modulated by yetnot totally understood additional environmental factors (Cailleretet al., 2013; Sangüesa-Barreda et al., 2013). We did not investigatein depth this relationship but used a classification of tree healthstatus based on simple crown observations similar to other studies(e.g. Dobbertin, 2005). We observed identical recent growth-trendsof weakened and dead pines at low elevation, which suggests thatabundant mistletoe infestation and defoliation reflect pine vulner-ability. Mistletoe presence is considered to be a major indicator ofdecline in P. sylvestris (Galiano et al., 2010; Zweifel et al., 2012;Sangüesa-Barreda et al., 2012, 2013) and other conifers such asAbies alba Mill. (Oliva and Colinas, 2007; Cailleret et al., 2013). Mis-tletoe also infests other Mediterranean pines such as P. pinaster Ait.and P. nigra and the relationship between tree decline and mistle-toe ecology needs to be investigated in more detail (Sangüesa-Bar-reda et al., 2013; Cailleret et al., 2013). Nevertheless, independentof the agent eventually causing mortality, widespread mistletoeinfestation seems to be a symptom anticipating enhanced pinemortality in our study area. Thus it could be used as a simple indi-cator of the tree vitality to assess sustainability of pine stands(Dobbertin, 2005).
5. Conclusions
The mortality pattern varied along the elevation gradient ana-lyzed with average site conditions but enhanced drought severitysince the 1970s seemed to predispose certain trees of both spe-cies to mortality at low elevation. Pine trees with symptoms ofcanopy decline were abundant at more xeric low elevation standswhere life span of adult trees was much shorter. At low-eleva-tion, regardless of their health status, the trees exhibited a recentdecline in growth concurrently with an enhancement of long-term drought intensity, which suggest vulnerability to water
78 G. Gea-Izquierdo et al. / Forest Ecology and Management 320 (2014) 70–82
stress increase of P. sylvestris growing at its local low-elevationxeric limit. Within stands, the trees of both species analyzedgrowing under better conditions (as expressed by highergrowth-rates and a lower number of negative growth depres-sions, i.e. likely with more positive tree carbon pools) reducedtheir susceptibility to decline and mortality. In agreement withother studies, our results suggest that the canopy symptoms usedto classify pine health status can be used to characterize vulner-ability of stands in forest inventories. We do not know whetherthe present distribution of the studied species expresses the localpotential niche but the present realized low-elevation limit of P.sylvestris in the Central Mountains of Spain seems to be threa-tened by climate change. In agreement to results from other sim-ilar mountain oak-pine woodlands, these results could deriveimportant ecological implications and negative economical con-sequences for local populations.
Acknowledgments
We thank Javier Donés for permissions and support to do re-search in the studied area. This research was supported by projectAGL2010-21153-01 funded by MICINN. It is also a contribution tothe Labex OT-Med (no ANR-11-LABX-0061) funded by the «Inves-tissements d’Avenir» program of the French National ResearchAgency through the A*MIDEX project (no ANR-11-IDEX-0001-02).
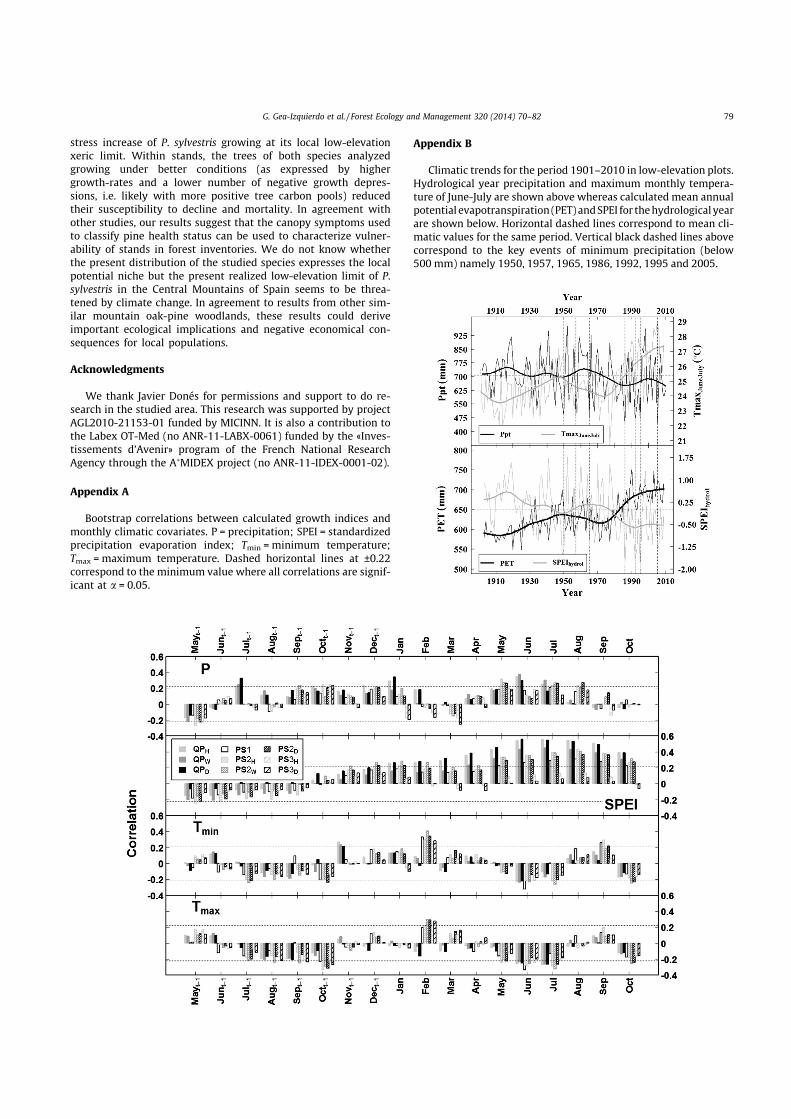
Appendix A
Bootstrap correlations between calculated growth indices andmonthly climatic covariates. P = precipitation; SPEI = standardizedprecipitation evaporation index; Tmin = minimum temperature;Tmax = maximum temperature. Dashed horizontal lines at ±0.22correspond to the minimum value where all correlations are signif-icant at a = 0.05.
Appendix B
Climatic trends for the period 1901–2010 in low-elevation plots.Hydrological year precipitation and maximum monthly tempera-ture of June-July are shown above whereas calculated mean annualpotential evapotranspiration (PET) and SPEI for the hydrological yearare shown below. Horizontal dashed lines correspond to mean cli-matic values for the same period. Vertical black dashed lines abovecorrespond to the key events of minimum precipitation (below500 mm) namely 1950, 1957, 1965, 1986, 1992, 1995 and 2005.
G. Gea-Izquierdo et al. / Forest Ecology and Management 320 (2014) 70–82 79
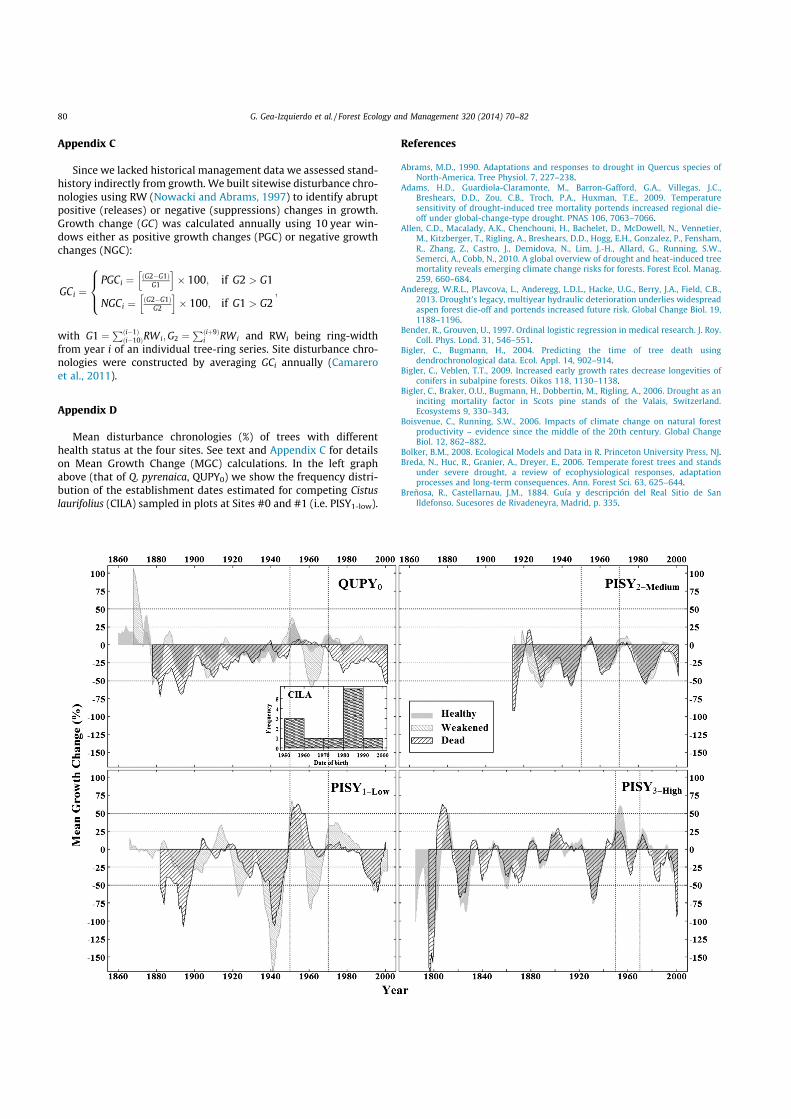
Appendix C
Since we lacked historical management data we assessed stand-history indirectly from growth. We built sitewise disturbance chro-nologies using RW (Nowacki and Abrams, 1997) to identify abruptpositive (releases) or negative (suppressions) changes in growth.Growth change (GC) was calculated annually using 10 year win-dows either as positive growth changes (PGC) or negative growthchanges (NGC):
GCi ¼PGCi ¼ ðG2$G1Þ
G1
h i+ 100; if G2 > G1
NGCi ¼ ðG2$G1ÞG2
h i+ 100; if G1 > G2
8><
>:;
with G1 ¼Pði$1Þði$10ÞRWi;G2 ¼
Pðiþ9Þi RWi and RWi being ring-width
from year i of an individual tree-ring series. Site disturbance chro-nologies were constructed by averaging GCi annually (Camareroet al., 2011).
Appendix D
Mean disturbance chronologies (%) of trees with differenthealth status at the four sites. See text and Appendix C for detailson Mean Growth Change (MGC) calculations. In the left graphabove (that of Q. pyrenaica, QUPY0) we show the frequency distri-bution of the establishment dates estimated for competing Cistuslaurifolius (CILA) sampled in plots at Sites #0 and #1 (i.e. PISY1-low).
References
Abrams, M.D., 1990. Adaptations and responses to drought in Quercus species ofNorth-America. Tree Physiol. 7, 227–238.
Adams, H.D., Guardiola-Claramonte, M., Barron-Gafford, G.A., Villegas, J.C.,Breshears, D.D., Zou, C.B., Troch, P.A., Huxman, T.E., 2009. Temperaturesensitivity of drought-induced tree mortality portends increased regional die-off under global-change-type drought. PNAS 106, 7063–7066.
Allen, C.D., Macalady, A.K., Chenchouni, H., Bachelet, D., McDowell, N., Vennetier,M., Kitzberger, T., Rigling, A., Breshears, D.D., Hogg, E.H., Gonzalez, P., Fensham,R., Zhang, Z., Castro, J., Demidova, N., Lim, J.-H., Allard, G., Running, S.W.,Semerci, A., Cobb, N., 2010. A global overview of drought and heat-induced treemortality reveals emerging climate change risks for forests. Forest Ecol. Manag.259, 660–684.
Anderegg, W.R.L., Plavcova, L., Anderegg, L.D.L., Hacke, U.G., Berry, J.A., Field, C.B.,2013. Drought’s legacy, multiyear hydraulic deterioration underlies widespreadaspen forest die-off and portends increased future risk. Global Change Biol. 19,1188–1196.
Bender, R., Grouven, U., 1997. Ordinal logistic regression in medical research. J. Roy.Coll. Phys. Lond. 31, 546–551.
Bigler, C., Bugmann, H., 2004. Predicting the time of tree death usingdendrochronological data. Ecol. Appl. 14, 902–914.
Bigler, C., Veblen, T.T., 2009. Increased early growth rates decrease longevities ofconifers in subalpine forests. Oikos 118, 1130–1138.
Bigler, C., Braker, O.U., Bugmann, H., Dobbertin, M., Rigling, A., 2006. Drought as aninciting mortality factor in Scots pine stands of the Valais, Switzerland.Ecosystems 9, 330–343.
Boisvenue, C., Running, S.W., 2006. Impacts of climate change on natural forestproductivity – evidence since the middle of the 20th century. Global ChangeBiol. 12, 862–882.
Bolker, B.M., 2008. Ecological Models and Data in R. Princeton University Press, NJ.Breda, N., Huc, R., Granier, A., Dreyer, E., 2006. Temperate forest trees and stands
under severe drought, a review of ecophysiological responses, adaptationprocesses and long-term consequences. Ann. Forest Sci. 63, 625–644.
Breñosa, R., Castellarnau, J.M., 1884. Guía y descripción del Real Sitio de SanIldefonso. Sucesores de Rivadeneyra, Madrid, p. 335.
80 G. Gea-Izquierdo et al. / Forest Ecology and Management 320 (2014) 70–82
Breshears, D.D., Myers, O.B., Meyer, C.W., Barnes, F.J., Zou, C.B., Allen, C.D.,McDowell, N.G., Pockman, W.T., 2009. Tree die-off in response to globalchange-type drought, mortality insights from a decade of plant water potentialmeasurements. Front Ecol. Environ. 7, 185–189.
Brose, P.H., Waldrop, T.A., 2010. A dendrochronological analysis of a disturbance-succession model for oak–pine forests of the Appalachian Mountains, USA. Can.J. Forest Res. 40, 1373–1385.
Bugmann, H., Bigler, C., 2011. Will the CO2 fertilization effect in forests be offset byreduced tree longevity? Oecologia 165, 533–544.
Burnham, K.P., Anderson, D.R., 2004. Multimodel inference – understanding AIC andBIC in model selection. Sociol. Methods Res. 33, 261–304.
Cailleret, M., Nourtier, M., Amm, A., Durand-Gillmann, M., Davi, H., 2013. Drought-induced decline and mortality of silver fir differ among three sites in SouthernFrance. Ann. Forest Sci., doi:10.1007/s13595-013-0265-0.
Camarero, J.J., Bigler, C., Linares, J.C., Gil-Pelegrin, E., 2011. Synergistic effects of pasthistorical logging and drought on the decline of Pyrenean silver fir forests.Forest Ecol. Manag. 262, 759–769.
Canham, C.D., Thompson, J., Zimmerman, J.K., Uriarte, M., 2010. Variation insusceptibility to hurricane damage as a function of storm intensity in puertorican tree species. Biotropica 42, 87–94.
Cavard, X., Bergeron, Y., Chen, H.Y.H., Pare, D., Laganiere, J., Brassard, B., 2011.Competition and facilitation between tree species change with standdevelopment. Oikos 120, 1683–1695.
Choat, B., Jansen, S., Brodribb, T.J., Cochard, H., Delzon, S., Bhaskar, R., Bucci, S.J.,Feild, T.S., Gleason, S.M., Hacke, U.G., Jacobsen, A.L., Lens, F., Maherali, H.,Martinez-Vilalta, J., Mayr, S., Mencuccini, M., Mitchell, P.J., Nardini, A.,Pittermann, J., Pratt, R.B., Sperry, J.S., Westoby, M., Wright, I.J., Zanne, A.E.,2012. Global convergence in the vulnerability of forests to drought. Nature 491,752–755.
Das, A.J., Battles, J.J., Stephenson, N.L., van Mantgem, P.J., 2007. The relationshipbetween tree growth patterns and likelihood of mortality, a study of two treespecies in the Sierra Nevada. Can. J. Forest Res. 37, 580–597.
Di Filippo, A., Alessandrini, A., Biondi, F., Blasi, S., Portoghesi, L., Piovesan, G., 2010.Climate change and oak growth decline, Dendroecology and stand productivityof a Turkey oak (Quercus cerris L.) old stored coppice in Central Italy. Ann. ForestSci. 67, 706.
Di Filippo, A., Biondi, F., Maugeri, M., Schirone, B., Piovesan, G., 2012. Bioclimate andgrowth history affect beech lifespan in the Italian Alps and Apennines. GlobalChange Biol. 18, 960–972.
Dietze, M.C., Moorcroft, P.R., 2011. Tree mortality in the eastern and central UnitedStates, patterns and drivers. Global Change Biol. 17, 3312–3326.
Dobbertin, M., 2005. Tree growth as indicator of tree vitality and of tree reaction toenvironmental stress, a review. Eur. J. Forest Res. 124, 319–333.
Dobbertin, M., Rigling, A., 2006. Pine mistletoe (Viscum album ssp austriacum)contributes to Scots pine (Pinus sylvestris) mortality in the Rhone valley ofSwitzerland. Forest Pathol. 36, 309–322.
Donés, J., Cabrera, M., 2009. Proyecto de 7ª Revisión de la Ordenación del montenúmero 2 del Catálogo de los de Utilidad Pública de la Provincia de Segovia‘‘Pinar’’ de Valsaín. Unpublished management plan, Segovia.
Eilmann, B., Zweifel, R., Buchmann, N., Fonti, P., Rigling, A., 2009. Drought-inducedadaptation of the xylem in Scots pine and pubescent oak. Tree Physiol. 29,1011–1020.
Franco Mugica, F., Anton, M.G., Ollero, H.S., 1998. Vegetation dynamics and humanimpact in the Sierra de Guadarrama, Central System, Spain. Holocene 8, 69–82.
Fritts, H.C., 1976. Tree Rings and Climate. Blackburn Press, p. 567.Galiano, L., Martinez-Vilalta, J., Lloret, F., 2010. Drought-induced multifactor decline
of scots pine in the pyrenees and potential vegetation change by the expansionof co-occurring oak species. Ecosystems 13, 978–991.
Garcia-Ruiz, J.M., Lopez-Moreno, J.I., Vicente-Serrano, S.M., Lasanta-Martinez, T.,Begueria, S., 2011. Mediterranean water resources in a global change scenario.Earth – Sci. Rev. 105, 121–139.
Gaylord, M.L., Kolb, T.E., Pockman, W.T., Plaut, J.A., Yepez, E.A., Macalady, A.K.,Pangle, R.E., McDowell, N.G., 2013. Drought predisposes pinon-juniperwoodlands to insect attacks and mortality. New Phytol. 198, 567–578.
Gea-Izquierdo, G., Cañellas, I., 2014. Local climate forces instability in long-termproductivity of a Mediterranean oak along climatic gradients. Ecosystems 17,228–241.
Gea-Izquierdo, G., Cherubini, P., Cañellas, I., 2011. Tree-rings reflect the impact ofclimate change along a temperature gradient in Spain over the last 100 years.Forest Ecol. Manag. 262, 1807–1816.
Gea-Izquierdo, G., Fonti, P., Cherubini, P., Martín-Benito, D., Chaar, H., Cañellas, I.,2012. Xylem hydraulic adjustment and growth response of Quercus canariensisWilld. To climatic variability. Tree Physiol. 32, 401–413.
Gimmi, U., Wohlgemuth, T., Rigling, A., Hoffmann, C.W., Buergi, M., 2010. Land-useand climate change effects in forest compositional trajectories in a dry Central-Alpine valley. Ann. Forest Sci. 67 (7), 701.
Heres, A.-M., Martinez-Vilalta, J., Claramunt Lopez, B., 2012. Growth patterns inrelation to drought-induced mortality at two Scots pine (Pinus sylvestris L.) sitesin NE Iberian Peninsula. Trees Struct. Func. 26, 621–630.
Holmes, R.L., 1983. Computer-assisted quality control in tree-ring dating andmeasurement. Tree – Ring Bull. 43, 69–78.
Jenkins, M.A., Pallardy, S.G., 1995. The influence of drought on red oak group speciesgrowth and mortality in the Missouri Ozarks. Can. J. Forest Res. 25, 1119–1127.
Lenoir, J., Gegout, J.C., Marquet, P.A., de Ruffray, P., Brisse, H., 2008. A significantupward shift in plant species optimum elevation during the 20th century.Science 320, 1768–1771.
Levanic, T., Cater, M., McDowell, N.G., 2011. Associations between growth, woodanatomy, carbon isotope discrimination and mortality in a Quercus robur forest.Tree Physiol. 31, 298–308.
Linares, J.C., Camarero, J.J., 2012. From pattern to process, linking intrinsic water-use efficiency to drought-induced forest decline. Global Change Biol. 18, 1000–1015.
Lloret, F., Siscart, D., Dalmases, C., 2004. Canopy recovery after drought dieback inholm-oak Mediterranean forests of Catalonia (NE Spain). Global Change Biol. 10,2092–2099.
Lloyd, A.H., Bunn, A.G., Berner, L., 2011. A latitudinal gradient in tree growthresponse to climate warming in the Siberian taiga. Global Change Biol. 17,1935–1945.
López-Sáez, J.A., Abel-Schaad, D., Pérez-Díaz, S., Blanco-González, A., Alba-Sánchez,F., Dorado, M., Ruiz-Zapata, B., Gil-García, M.J., Gómez-González, C., Franco-Múgica, F., 2014. Vegetation history, climate and human impact in the SpanishCentral System over the last 9000 years. Quatern. Int.. http://dx.doi.org/10.1016/j.quaint.2013.06.034.
Luo, Y., Chen, H.Y.H., 2011. Competition, species interaction and ageing control treemortality in boreal forests. J. Ecol. 99, 1470–1480.
Luterbacher, J., Xoplaki, E., Casty, C., et al., 2006. Mediterranean climate variabilityover the last centuries, a review. In: Lionello, P., Malanotte-Rizzoli, P., Boscolo,R. (Eds.), The Mediterranean Climate, An Overview of the Main Characteristicsand Issues. Elsevier, Amsterdam, pp. 27–148.
Martín-Benito, D., Cherubini, P., del Rio, M., Canellas, I., 2008. Growth response toclimate and drought in Pinus nigra Arn. trees of different crown classes. TreesStruct. Funct. 22, 363–373.
McDowell, N.G., Allen, C.D., Marshall, L., 2010. Growth, carbon-isotopediscrimination, and drought-associated mortality across a Pinus ponderosaelevational transect. Global Change Biol. 16, 399–415.
McDowell, N.G., Beerling, D.J., Breshears, D.D., Fisher, R.A., Raffa, K.F., Stitt, M., 2011.The interdependence of mechanisms underlying climate-driven vegetationmortality. Trends Ecol. Evol. 26, 523–532.
Michelot, A., Simard, S., Rathgeber, C., Dufrene, E., Damesin, C., 2012. Comparing theintra-annual wood formation of three European species (Fagus sylvatica,Quercus petraea and Pinus sylvestris) as related to leaf phenology and non-structural carbohydrate dynamics. Tree Physiol. 32, 1033–1045.
Mitchell, T.D., Jones, P.D., 2005. An improved method of constructing a database ofmonthly climate observations and associated high-resolution grids. Int. J. Clim.25, 693–712.
Niinemets, U., 2010. Responses of forest trees to single and multiple environmentalstresses from seedlings to mature plants, Past stress history, stress interactions,tolerance and acclimation. Forest Ecol. Manag. 260, 1623–1639.
Nowacki, G.J., Abrams, M.D., 1997. Radial-growth averaging criteria forreconstructing disturbance histories from presettlement-origin oaks. Ecol.Monogr. 67, 225–324.
Oliva, J., Colinas, C., 2007. Decline of silver fir (Abies alba Mill.) stands in the SpanishPyrenees, Role of management, historic dynamics and pathogens. Forest Ecol.Manag. 252, 84–97.
Prager, M.H., Hoenig, J.M., 1989. Superposed epoch analysis – a randomization testof environmental effects on recruitment with application to chub mackerel. T.Am. Fish. Soc. 118, 608–618.
Rigling, A., Bigler, C., Eilmann, B., Feldmeyer-Christe, E., Gimmi, U., Ginzler, C., Graf,U., Mayer, P., Vacchiano, G., Weber, P., Wohlgemuth, T., Zweifel, R., Dobbertin,M., 2013. Driving factors of a vegetation shift from Scots pine to pubescent oakin dry Alpine forests. Global Change Biol. 19, 229–240.
Rozas, V., Lamas, S., Garcia-Gonzalez, I., 2009. Differential tree-growth responses tolocal and large-scale climatic variation in two Pinus and two Quercus species innorthwest Spain. Ecoscience 16, 299–310.
Ruiz-Labourdette, D., Schmitz, M.F., Pineda, F.D., 2013. Changes in tree speciescomposition in Mediterranean mountains under climate change, indicators forconservation planning. Ecol. Indic. 24, 310–323.
Sangüesa-Barreda, G., Carlos Linares, J., Camarero, J.J., 2012. Mistletoe effects onScots pine decline following drought events, insights from within-tree spatialpatterns, growth and carbohydrates. Tree Physiol. 32, 585–598.
Sangüesa-Barreda, G., Linares, J.C., Camarero, J.J., 2013. Drought and mistletoereduce growth and water-use efficiency of Scots pine. Forest Ecol. Manag.,doi:10.1016/j.foreco.2013.01.028.
Sheffer, E., 2012. A review of the development of Mediterranean pine–oakecosystems after land abandonment and afforestation, are they novelecosystems? Ann. Forest Sci. 69, 429–443.
Shifley, S.R., Fan, Z.F., Kabrick, J.M., Jensen, R.G., 2006. Oak mortality risk factors andmortality estimation. Forest Ecol. Manag. 229, 16–26.
Suarez, M.L., Ghermandi, L., Kitzberger, T., 2004. Factors predisposing episodicdrought-induced tree mortality in Nothofagus – site, climatic sensitivity andgrowth trends. J. Ecol. 92, 954–966.
Tessier, L., Nola, P., Serrebachet, F., 1994. Deciduous Quercus in themediterranean region – tree-ring/climate relationships. New Phytol. 126,355–367.
Van Bogaert, R., Haneca, K., Hoogesteger, J., Jonasson, C., De Dapper, M., Callaghan,T.V., 2011. A century of tree line changes in sub-Arctic Sweden shows local andregional variability and only a minor influence of 20th century climatewarming. J. Biogeog. 38, 907–921.
Van Mantgem, P.J., Stephenson, N.L., Byrne, J.C., Daniels, L.D., Franklin, J.F., Fule, P.Z.,Harmon, M.E., Larson, A.J., Smith, J.M., Taylor, A.H., Veblen, T.T., 2009.Widespread increase of tree mortality rates in the Western United States.Science 323, 521–524.
G. Gea-Izquierdo et al. / Forest Ecology and Management 320 (2014) 70–82 81

Vicente-Serrano, S.M., Begueria, S., Lopez-Moreno, J.I., 2010. A multiscalar droughtindex sensitive to global warming, the standardized precipitationevapotranspiration index. J. Clim. 23, 1696–1718.
Vila-Cabrera, A., Martinez-Vilalta, J., Galiano, L., Retana, J., 2013. Patterns of forestdecline and regeneration across scots pine populations. Ecosystems 16, 323–335.
Voelker, S.L., Muzika, R.M., Guyette, R.P., 2008. Individual tree and stand levelinfluences on the growth, vigor, and decline of red oaks in the Ozarks. Forest Sci.54, 8–20.
Weber, P., Rigling, A., Bugmann, H., 2008. Sensitivity of stand dynamics to grazing inmixed Pinus sylvestris and Quercus pubescens forests, a modelling study. Ecol.Model. 210, 301–311.
Wischnewski, J., Kramer, A., Kong, Z., Mackay, A.W., Simpson, G.L., Mischke, S.,Herzschuh, U., 2011. Terrestrial and aquatic responses to climate change andhuman impact on the southeastern Tibetan Plateau during the past twocenturies. Global Change Biol. 17, 3376–3391.
Zahner, R., Saucier, J.R., Myers, R.K., 1989. Tree-ring model interprets growth declinein natural stands of loblolly-pine in the Southern United States. Can. J. ForestRes. 19, 612–621.
Zweifel, R., Bangerter, S., Rigling, A., Sterck, F.J., 2012. Pine and mistletoes, howto live with a leak in the water flow and storage system? J. Exp. Bot. 63, 2565–2578.
82 G. Gea-Izquierdo et al. / Forest Ecology and Management 320 (2014) 70–82