forest health highlights in washington—2015
TRANSCRIPT
Forest Health Highlights in Washington—2015
Washington State Department of Natural Resources Forest Health Program February 2016
for the greatest good
Pacific Northwest Region Forest Health Protection
Forest Health Highlights in Washington—2015
Joint publication contributors:
Aleksandar Dozic¹ Melissa Fischer¹ Chuck Hersey¹
Glenn Kohler¹ Daniel Omdal¹ Amy Ramsey¹ Karen Ripley¹
Zachary Heath2 Alison Nelson2 Ben Smith2
¹Washington Department of Natural Resources (WDNR) 2U.S. Department of Agriculture, Forest Service (USFS)
The U.S. Department of Agriculture (USDA) prohibits discrimination in all its programs and activities on the
basis of race, color, national origin, age, disability, and where applicable, sex, marital status, familial status,
parental status, religion, sexual orientation, genetic information, political beliefs, reprisal, or because all or
part of an individual’s income is derived from any public assistance program. (Not all prohibited bases apply
to all programs.) Persons with disabilities who require alternative means for communication of program
information (Braille, large print, audiotape, etc.) should contact USDA’s TARGET Center at (202) 720-2600
(voice and TDD). To file a complaint of discrimination, write USDA, Director, Office of Civil Rights, 1400
Independence Avenue, S.W., Washington, D.C. 20250-9410 or call (800) 795-3272 (voice) or (202) 720-6382
(TDD). USDA is an equal opportunity provider and employer.
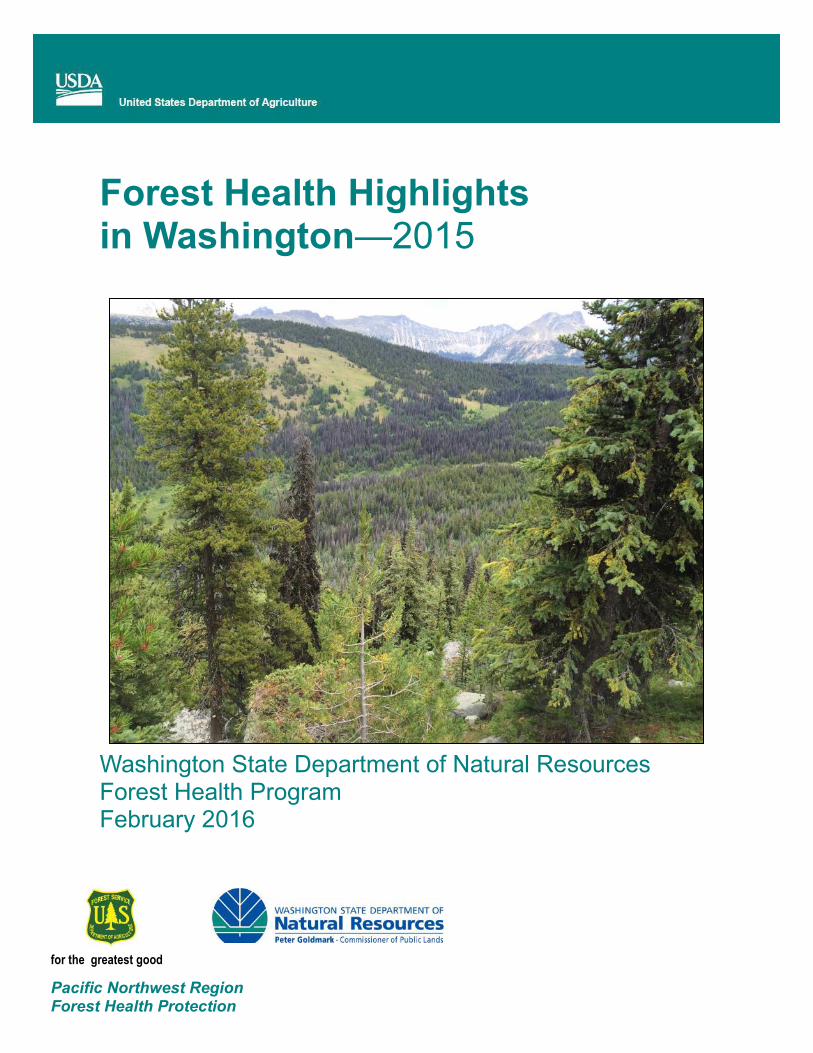
Front cover: Engelmann spruce mortality from spruce beetle in the Pasayten Wilderness. Photo by: Connie Mehmel, USDA Forest Service.
Table of Contents Summary ....................................................................................................................................................... 2 Weather and Forest Health ........................................................................................................................... 3
Drought ................................................................................................................................................... 4 Drought Damage ..................................................................................................................................... 5 Weather Related Damage ....................................................................................................................... 6
Fire ................................................................................................................................................................. 8 Aerial Detection Survey ................................................................................................................................. 9
Methods .................................................................................................................................................. 9 2015 Aerial Survey Conditions .............................................................................................................. 10 Aerial Survey Summary Maps ............................................................................................................... 14
Insects .......................................................................................................................................................... 16
Bark Beetles .......................................................................................................................................... 16 Fir Engraver ................................................................................................................................. 16 Western Balsam Bark Beetle ....................................................................................................... 16 Douglas-fir Beetle ........................................................................................................................ 17 Spruce Beetle .............................................................................................................................. 18 Pine Bark Beetles ........................................................................................................................ 19 California Fivespined Ips ............................................................................................................. 20 Defoliators ............................................................................................................................................ 21 Western Spruce Budworm .......................................................................................................... 21 Douglas-fir Tussock Moth ........................................................................................................... 24 Gypsy Moth ................................................................................................................................. 24 Douglas-fir Needle Midge ........................................................................................................... 25 Larch Casebearer......................................................................................................................... 25 Western Tent Caterpillar ............................................................................................................. 25 Branch and Terminal Insects ................................................................................................................. 26
Balsam Woolly Adelgid................................................................................................................ 26
Animals…. .................................................................................................................................................... 27 Bear Damage/Root Disease .................................................................................................................. 27 Diseases ....................................................................................................................................................... 28
Foliar and Branch Diseases ................................................................................................................... 28 Conifer Needle Casts ................................................................................................................... 28 Swiss Needle Cast on Douglas-fir ................................................................................................ 29 Sphaeropsis Tip Blight ................................................................................................................. 31
White Pine Blister Rust ......................................................................................................................... 32 Bigleaf Maple Dieback and Decline ...................................................................................................... 33 Sudden Oak Death ................................................................................................................................ 34 Black Stain Root Disease ....................................................................................................................... 35
Data and Services ........................................................................................................................................ 36 Electronic PDF Maps Available for Download ...................................................................................... 36 Interactive Map Tool and GIS Data Available for Download ................................................................ 37 Forest Health Websites......................................................................................................................... 37 Field Guides .......................................................................................................................................... 37
Contacts and Additional Information ............................................................................................ Back Cover
Table of Contents
2
Summary
Washington has 22.4 million acres of forestland. In the 2015 annual aerial detection survey, some level of tree mortality, tree defoliation, or foliar diseases was recorded on approximately 338,000 acres of this forestland. This is well below the 543,000 acres reported in 2014. Part of this decrease was due to approximately 1.5 million forested acres in eastern Washington that were not flown this year because of one-year old or current year wildfires. Fire-related mortality cannot be distinguished from insect or disease damage so recent fires are not surveyed. Some of these non-flown areas may have high levels of damage in an average year (see map on page 10). However, downward trends in insect and disease damage were also evident in areas of eastern Washington unaffected by wildfires (see map on page 12). Tree mortality was recorded by aerial survey on approximately 241,000 acres, of this 115,000 acres were attributed to bark beetles and 108,000 acres to bear damage or root disease. Relative to 2014, tree mortality decreased for all major bark beetle species. The area with conifer defoliation recorded by aerial survey decreased to approximately 99,000 acres, down from 159,000 acres reported in 2014. Almost all defoliation recorded was caused by western spruce budworm and balsam woolly adelgid. Approximately 10,000 acres recorded by aerial survey had some level of disease damage, primarily bigleaf maple decline and needle casts in pines and western larch. Previous annual totals for all damage agents were:
2013: 593,000 acres 2012: 1,080,000 acres 2011: 950,000 acres
Drought conditions and warm, dry spring weather tend to increase tree stress and insect success, driving acres of damage up in both the current and following year. Wet spring weather tends to increase acres affected by foliage diseases and bear damage in both the current and following year. Precipitation in Washington was below normal during spring and summer 2015. Monthly average temperatures were well above normal for most of the year. According to the US Drought Monitor, 2015 was the worst drought year of the last 16 years in Washington State.
Approximately 1.2 million trees were recorded as recently killed.
Pine bark beetle activity decreased in 2015 to approximately 65,200 acres compared to the 143,000 acres in 2014. Mountain pine beetle damage decreased to the lowest level observed in the last decade.
Mortality of ponderosa pines due to western pine beetle (WPB) decreased to approximately 5,900 acres in 2015, below the 8,800 acres mapped in 2014. However, there was a local increase in WPB-caused mortality in Klickitat County and southern Yakima County.
Mortality due to Douglas-fir beetle decreased relative to 2014, to approximately 18,500 acres. Concentrated areas of DFB-caused mortality were detected in Klickitat and Kittitas counties.
Acres with western spruce budworm defoliation in eastern Washington decreased to approximately 79,000 acres, the lowest level since 2002, but similar to the 93,000 acres mapped in 2014. Some defoliation may not have been detected due to late season aerial survey flights and large wildfires in 2015.
Defoliation from conifer needle cast diseases were recorded on 6,100 acres, of which 2,900 acres were on western larch and 3,200 acres were on ponderosa pine and lodgepole pine. This is likely an under estimation because many affected needles fell off in some areas before the annual survey occurred.
A special Swiss needle cast (SNC) survey was conducted in coastal, western Washington in the late spring of 2015. Within the 2.5 million acre area surveyed, 350,000 acres of forest land were observed with SNC symptoms.
3
Weather and Forest Health
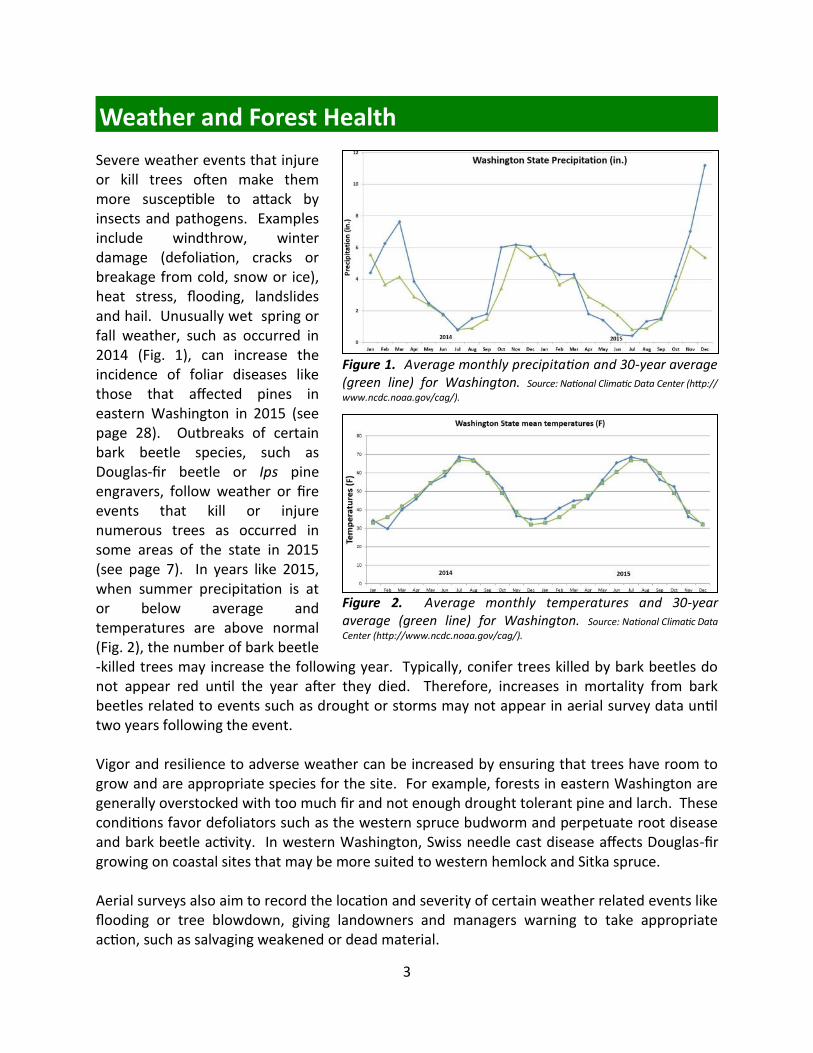
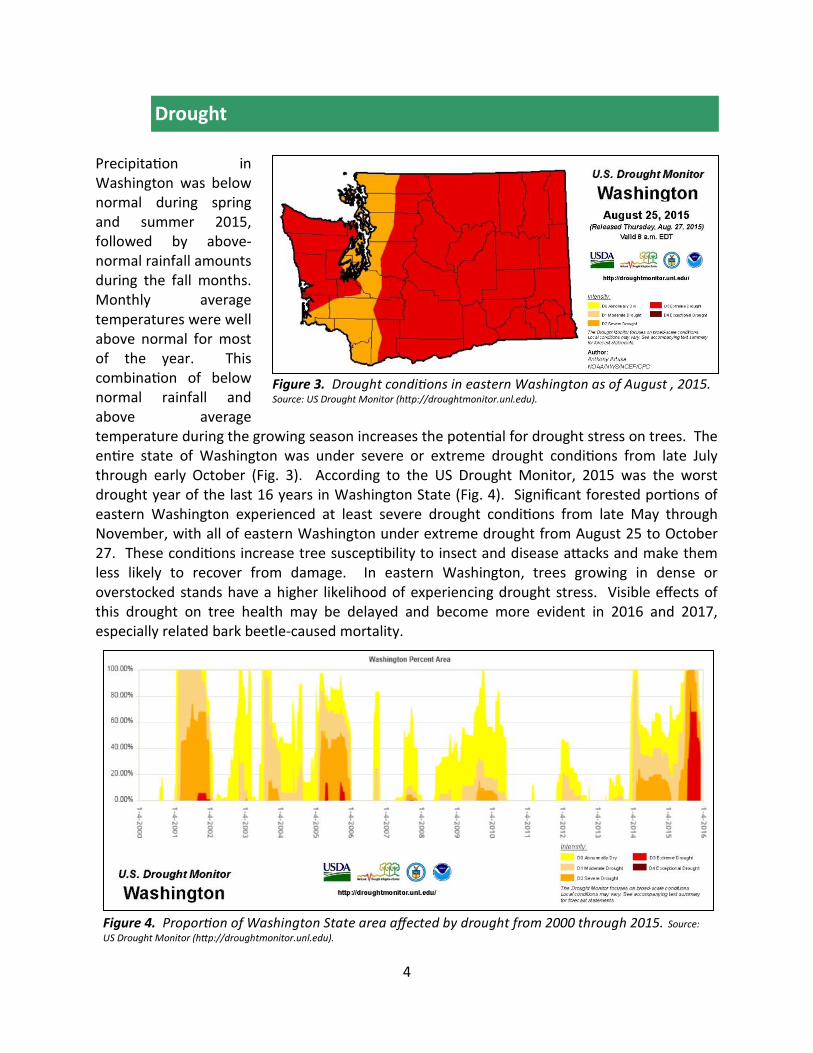
Severe weather events that injure or kill trees often make them more susceptible to attack by insects and pathogens. Examples include windthrow, winter damage (defoliation, cracks or breakage from cold, snow or ice), heat stress, flooding, landslides and hail. Unusually wet spring or fall weather, such as occurred in 2014 (Fig. 1), can increase the incidence of foliar diseases like those that affected pines in eastern Washington in 2015 (see page 28). Outbreaks of certain bark beetle species, such as Douglas-fir beetle or Ips pine engravers, follow weather or fire events that kill or injure numerous trees as occurred in some areas of the state in 2015 (see page 7). In years like 2015, when summer precipitation is at or below average and temperatures are above normal (Fig. 2), the number of bark beetle-killed trees may increase the following year. Typically, conifer trees killed by bark beetles do not appear red until the year after they died. Therefore, increases in mortality from bark beetles related to events such as drought or storms may not appear in aerial survey data until two years following the event. Vigor and resilience to adverse weather can be increased by ensuring that trees have room to grow and are appropriate species for the site. For example, forests in eastern Washington are generally overstocked with too much fir and not enough drought tolerant pine and larch. These conditions favor defoliators such as the western spruce budworm and perpetuate root disease and bark beetle activity. In western Washington, Swiss needle cast disease affects Douglas-fir growing on coastal sites that may be more suited to western hemlock and Sitka spruce. Aerial surveys also aim to record the location and severity of certain weather related events like flooding or tree blowdown, giving landowners and managers warning to take appropriate action, such as salvaging weakened or dead material.
Figure 1. Average monthly precipitation and 30-year average (green line) for Washington. Source: National Climatic Data Center (http://
www.ncdc.noaa.gov/cag/).
Figure 2. Average monthly temperatures and 30-year average (green line) for Washington. Source: National Climatic Data
Center (http://www.ncdc.noaa.gov/cag/).
4
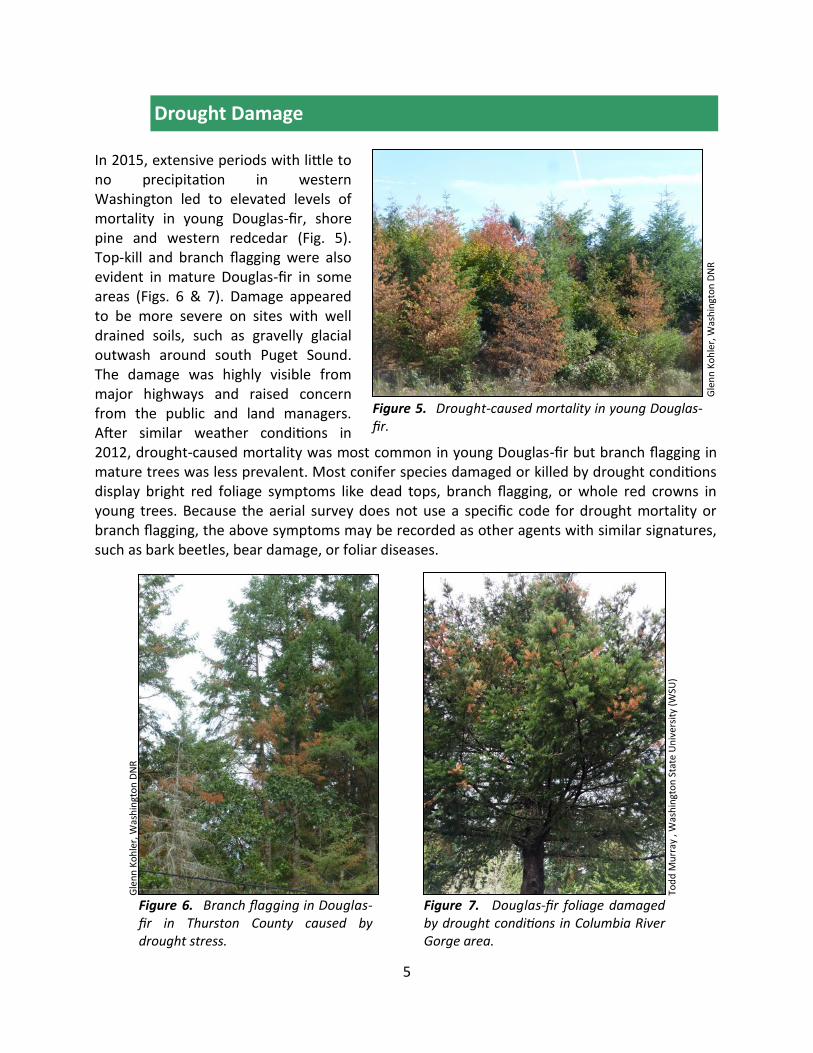
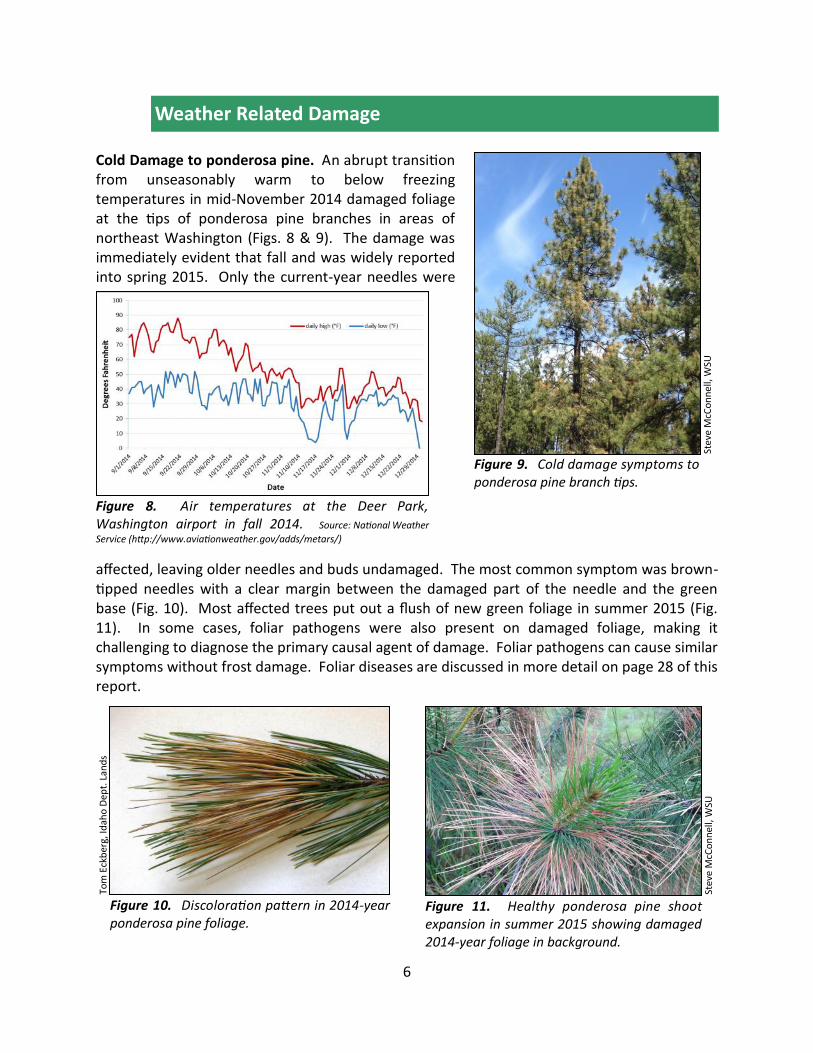
Precipitation in Washington was below normal during spring and summer 2015, followed by above-normal rainfall amounts during the fall months. Monthly average temperatures were well above normal for most of the year. This combination of below normal rainfall and above average temperature during the growing season increases the potential for drought stress on trees. The entire state of Washington was under severe or extreme drought conditions from late July through early October (Fig. 3). According to the US Drought Monitor, 2015 was the worst drought year of the last 16 years in Washington State (Fig. 4). Significant forested portions of eastern Washington experienced at least severe drought conditions from late May through November, with all of eastern Washington under extreme drought from August 25 to October 27. These conditions increase tree susceptibility to insect and disease attacks and make them less likely to recover from damage. In eastern Washington, trees growing in dense or overstocked stands have a higher likelihood of experiencing drought stress. Visible effects of this drought on tree health may be delayed and become more evident in 2016 and 2017, especially related bark beetle-caused mortality.
Drought
Figure 4. Proportion of Washington State area affected by drought from 2000 through 2015. Source:
US Drought Monitor (http://droughtmonitor.unl.edu).
Figure 3. Drought conditions in eastern Washington as of August , 2015. Source: US Drought Monitor (http://droughtmonitor.unl.edu).
5
Drought Damage
In 2015, extensive periods with little to no precipitation in western Washington led to elevated levels of mortality in young Douglas-fir, shore pine and western redcedar (Fig. 5). Top-kill and branch flagging were also evident in mature Douglas-fir in some areas (Figs. 6 & 7). Damage appeared to be more severe on sites with well drained soils, such as gravelly glacial outwash around south Puget Sound. The damage was highly visible from major highways and raised concern from the public and land managers. After similar weather conditions in 2012, drought-caused mortality was most common in young Douglas-fir but branch flagging in mature trees was less prevalent. Most conifer species damaged or killed by drought conditions display bright red foliage symptoms like dead tops, branch flagging, or whole red crowns in young trees. Because the aerial survey does not use a specific code for drought mortality or branch flagging, the above symptoms may be recorded as other agents with similar signatures, such as bark beetles, bear damage, or foliar diseases.
Gle
nn
Ko
hle
r, W
ash
ingt
on
DN
R
Gle
nn
Ko
hle
r, W
ash
ingt
on
DN
R
Figure 5. Drought-caused mortality in young Douglas-fir.
Figure 6. Branch flagging in Douglas-fir in Thurston County caused by drought stress.
Tod
d M
urr
ay ,
Was
hin
gto
n S
tate
Un
iver
sity
(W
SU)
Figure 7. Douglas-fir foliage damaged by drought conditions in Columbia River Gorge area.
6
Cold Damage to ponderosa pine. An abrupt transition from unseasonably warm to below freezing temperatures in mid-November 2014 damaged foliage at the tips of ponderosa pine branches in areas of northeast Washington (Figs. 8 & 9). The damage was immediately evident that fall and was widely reported into spring 2015. Only the current-year needles were
affected, leaving older needles and buds undamaged. The most common symptom was brown-tipped needles with a clear margin between the damaged part of the needle and the green base (Fig. 10). Most affected trees put out a flush of new green foliage in summer 2015 (Fig. 11). In some cases, foliar pathogens were also present on damaged foliage, making it challenging to diagnose the primary causal agent of damage. Foliar pathogens can cause similar symptoms without frost damage. Foliar diseases are discussed in more detail on page 28 of this report.
Stev
e M
cCo
nn
ell,
WSU
Tom
Eck
ber
g, Id
aho
Dep
t. L
and
s
Figure 10. Discoloration pattern in 2014-year ponderosa pine foliage.
Figure 9. Cold damage symptoms to ponderosa pine branch tips.
Weather Related Damage
Figure 11. Healthy ponderosa pine shoot expansion in summer 2015 showing damaged 2014-year foliage in background.
Stev
e M
cCo
nn
ell,
WSU
Figure 8. Air temperatures at the Deer Park, Washington airport in fall 2014. Source: National Weather
Service (http://www.aviationweather.gov/adds/metars/)
7
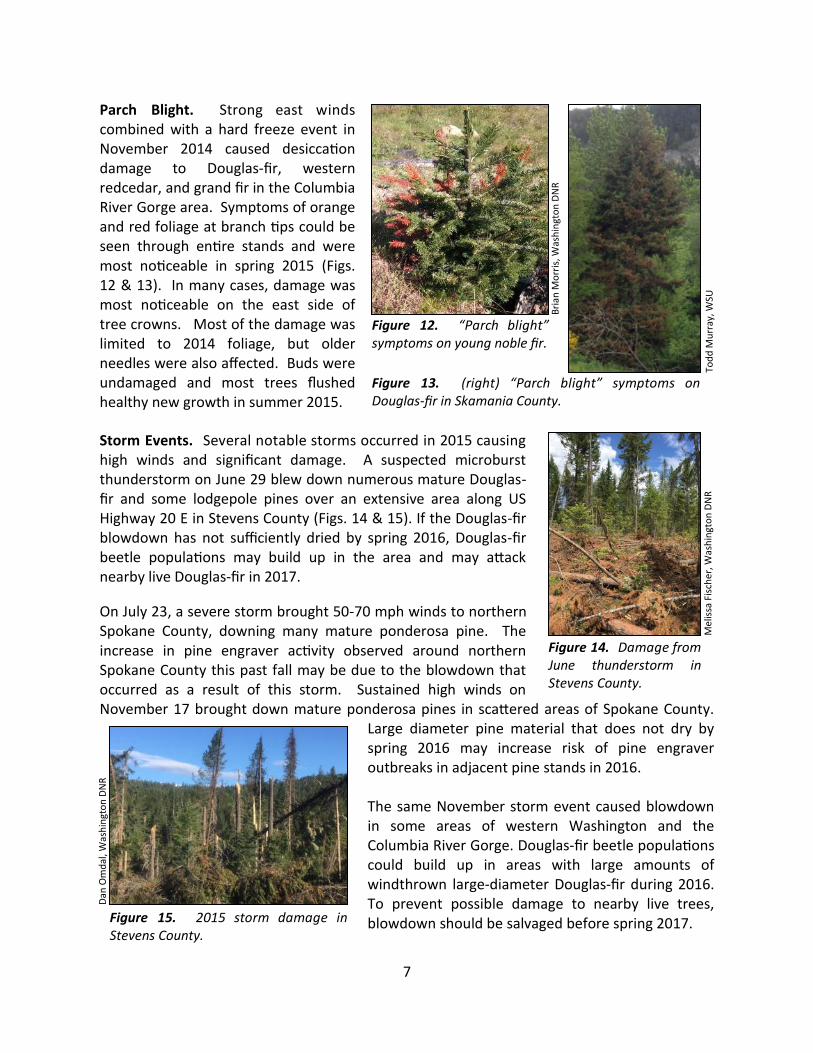
Storm Events. Several notable storms occurred in 2015 causing high winds and significant damage. A suspected microburst thunderstorm on June 29 blew down numerous mature Douglas-fir and some lodgepole pines over an extensive area along US Highway 20 E in Stevens County (Figs. 14 & 15). If the Douglas-fir blowdown has not sufficiently dried by spring 2016, Douglas-fir beetle populations may build up in the area and may attack nearby live Douglas-fir in 2017.
On July 23, a severe storm brought 50-70 mph winds to northern Spokane County, downing many mature ponderosa pine. The increase in pine engraver activity observed around northern Spokane County this past fall may be due to the blowdown that occurred as a result of this storm. Sustained high winds on November 17 brought down mature ponderosa pines in scattered areas of Spokane County.
Large diameter pine material that does not dry by spring 2016 may increase risk of pine engraver outbreaks in adjacent pine stands in 2016. The same November storm event caused blowdown in some areas of western Washington and the Columbia River Gorge. Douglas-fir beetle populations could build up in areas with large amounts of windthrown large-diameter Douglas-fir during 2016. To prevent possible damage to nearby live trees, blowdown should be salvaged before spring 2017.
Mel
issa
Fis
che
r, W
ash
ingt
on
DN
R
Figure 14. Damage from June thunderstorm in Stevens County.
Parch Blight. Strong east winds combined with a hard freeze event in November 2014 caused desiccation damage to Douglas-fir, western redcedar, and grand fir in the Columbia River Gorge area. Symptoms of orange and red foliage at branch tips could be seen through entire stands and were most noticeable in spring 2015 (Figs. 12 & 13). In many cases, damage was most noticeable on the east side of tree crowns. Most of the damage was limited to 2014 foliage, but older needles were also affected. Buds were undamaged and most trees flushed healthy new growth in summer 2015.
Figure 13. (right) “Parch blight” symptoms on Douglas-fir in Skamania County.
Tod
d M
urr
ay, W
SU
Bri
an M
orr
is, W
ash
ingt
on
DN
R
Figure 12. “Parch blight” symptoms on young noble fir.
Dan
Om
dal
, Was
hin
gto
n D
NR
Figure 15. 2015 storm damage in Stevens County.
8
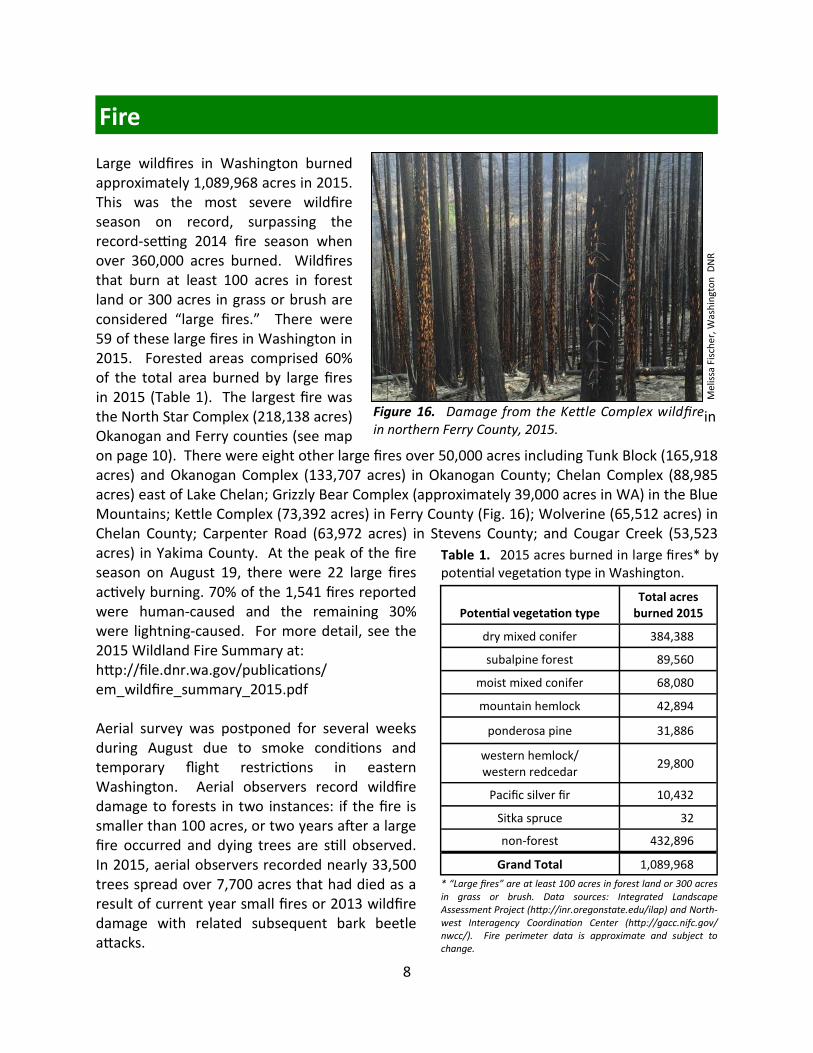
Large wildfires in Washington burned approximately 1,089,968 acres in 2015. This was the most severe wildfire season on record, surpassing the record-setting 2014 fire season when over 360,000 acres burned. Wildfires that burn at least 100 acres in forest land or 300 acres in grass or brush are considered “large fires.” There were 59 of these large fires in Washington in 2015. Forested areas comprised 60% of the total area burned by large fires in 2015 (Table 1). The largest fire was the North Star Complex (218,138 acres) in Okanogan and Ferry counties (see map on page 10). There were eight other large fires over 50,000 acres including Tunk Block (165,918 acres) and Okanogan Complex (133,707 acres) in Okanogan County; Chelan Complex (88,985 acres) east of Lake Chelan; Grizzly Bear Complex (approximately 39,000 acres in WA) in the Blue Mountains; Kettle Complex (73,392 acres) in Ferry County (Fig. 16); Wolverine (65,512 acres) in Chelan County; Carpenter Road (63,972 acres) in Stevens County; and Cougar Creek (53,523 acres) in Yakima County. At the peak of the fire season on August 19, there were 22 large fires actively burning. 70% of the 1,541 fires reported were human-caused and the remaining 30% were lightning-caused. For more detail, see the 2015 Wildland Fire Summary at: http://file.dnr.wa.gov/publications/em_wildfire_summary_2015.pdf Aerial survey was postponed for several weeks during August due to smoke conditions and temporary flight restrictions in eastern Washington. Aerial observers record wildfire damage to forests in two instances: if the fire is smaller than 100 acres, or two years after a large fire occurred and dying trees are still observed. In 2015, aerial observers recorded nearly 33,500 trees spread over 7,700 acres that had died as a result of current year small fires or 2013 wildfire damage with related subsequent bark beetle attacks.
Fire
Figure 16. Damage from the Kettle Complex wildfire in northern Ferry County, 2015.
Mel
issa
Fis
che
r, W
ash
ingt
on
DN
R
Table 1. 2015 acres burned in large fires* by potential vegetation type in Washington.
* “Large fires” are at least 100 acres in forest land or 300 acres in grass or brush. Data sources: Integrated Landscape Assessment Project (http://inr.oregonstate.edu/ilap) and North-west Interagency Coordination Center (http://gacc.nifc.gov/nwcc/). Fire perimeter data is approximate and subject to change.
Potential vegetation type Total acres
burned 2015
dry mixed conifer 384,388
subalpine forest 89,560
moist mixed conifer 68,080
mountain hemlock 42,894
ponderosa pine 31,886
western hemlock/ western redcedar
29,800
Pacific silver fir 10,432
Sitka spruce 32
non-forest 432,896
Grand Total 1,089,968
9
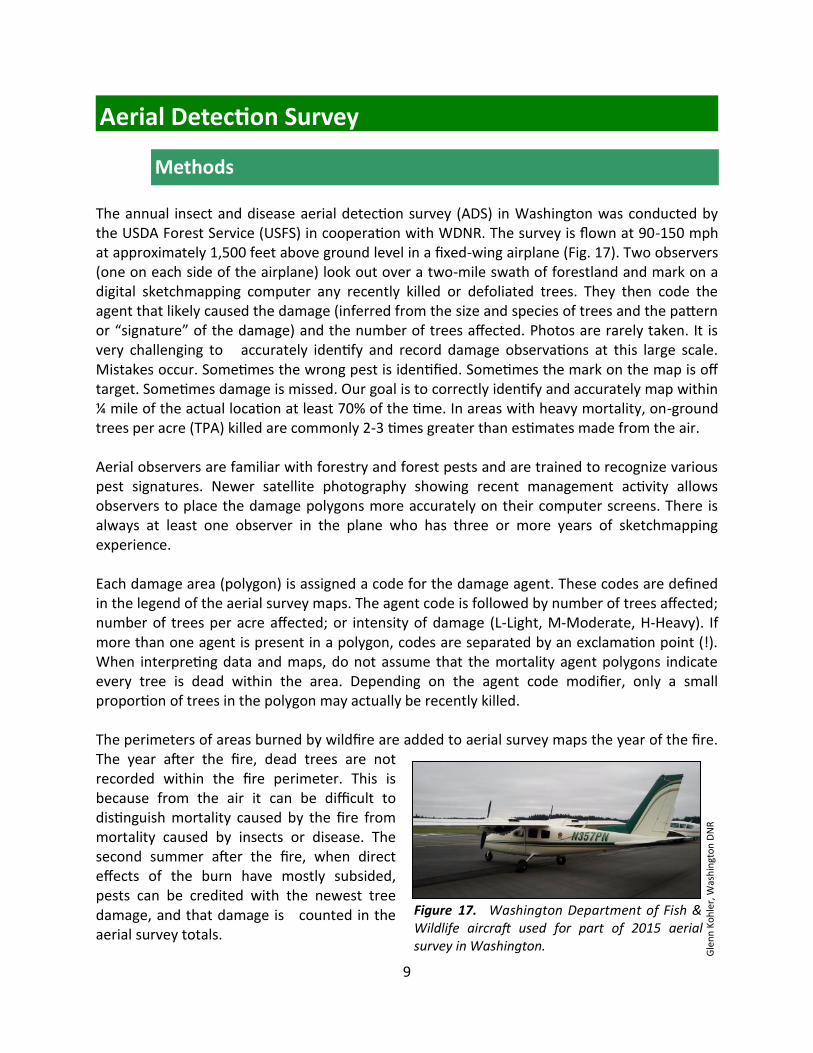
The annual insect and disease aerial detection survey (ADS) in Washington was conducted by the USDA Forest Service (USFS) in cooperation with WDNR. The survey is flown at 90-150 mph at approximately 1,500 feet above ground level in a fixed-wing airplane (Fig. 17). Two observers (one on each side of the airplane) look out over a two-mile swath of forestland and mark on a digital sketchmapping computer any recently killed or defoliated trees. They then code the agent that likely caused the damage (inferred from the size and species of trees and the pattern or “signature” of the damage) and the number of trees affected. Photos are rarely taken. It is very challenging to accurately identify and record damage observations at this large scale. Mistakes occur. Sometimes the wrong pest is identified. Sometimes the mark on the map is off target. Sometimes damage is missed. Our goal is to correctly identify and accurately map within ¼ mile of the actual location at least 70% of the time. In areas with heavy mortality, on-ground trees per acre (TPA) killed are commonly 2-3 times greater than estimates made from the air. Aerial observers are familiar with forestry and forest pests and are trained to recognize various pest signatures. Newer satellite photography showing recent management activity allows observers to place the damage polygons more accurately on their computer screens. There is always at least one observer in the plane who has three or more years of sketchmapping experience. Each damage area (polygon) is assigned a code for the damage agent. These codes are defined in the legend of the aerial survey maps. The agent code is followed by number of trees affected; number of trees per acre affected; or intensity of damage (L-Light, M-Moderate, H-Heavy). If more than one agent is present in a polygon, codes are separated by an exclamation point (!). When interpreting data and maps, do not assume that the mortality agent polygons indicate every tree is dead within the area. Depending on the agent code modifier, only a small proportion of trees in the polygon may actually be recently killed. The perimeters of areas burned by wildfire are added to aerial survey maps the year of the fire. The year after the fire, dead trees are not recorded within the fire perimeter. This is because from the air it can be difficult to distinguish mortality caused by the fire from mortality caused by insects or disease. The second summer after the fire, when direct effects of the burn have mostly subsided, pests can be credited with the newest tree damage, and that damage is counted in the aerial survey totals.
Aerial Detection Survey
Figure 17. Washington Department of Fish & Wildlife aircraft used for part of 2015 aerial survey in Washington.
Gle
nn
Ko
hle
r, W
ash
ingt
on
DN
R
Methods
10
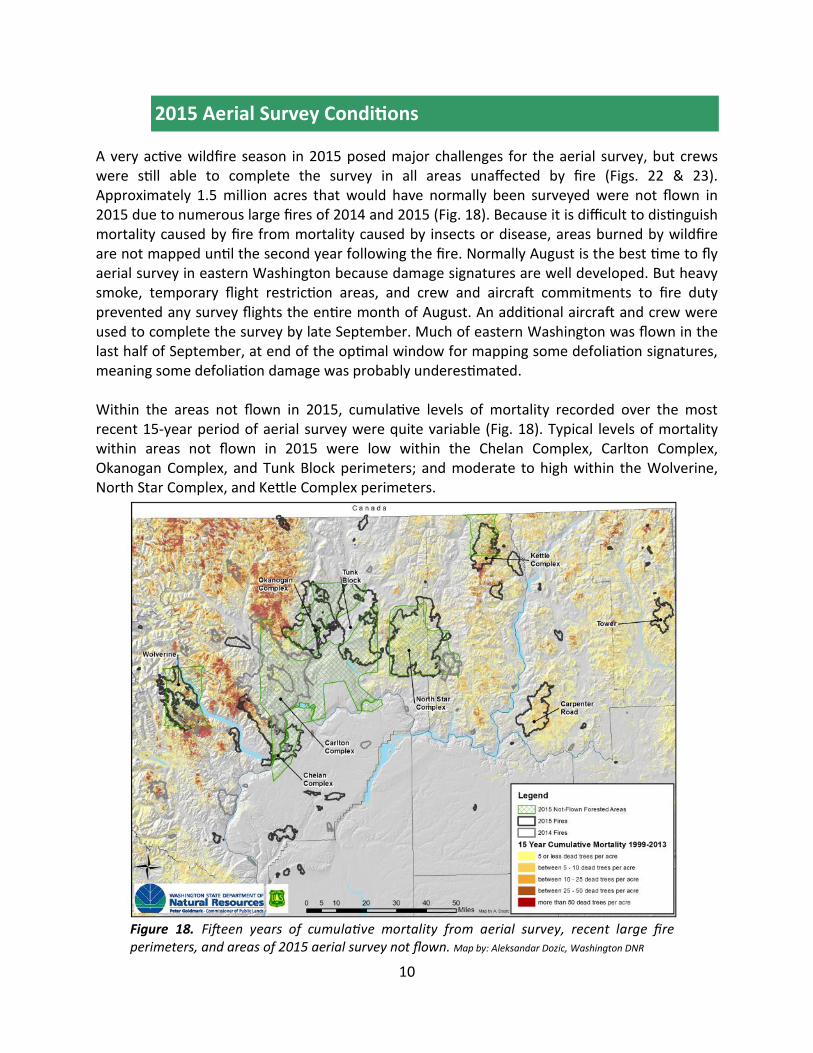
A very active wildfire season in 2015 posed major challenges for the aerial survey, but crews were still able to complete the survey in all areas unaffected by fire (Figs. 22 & 23). Approximately 1.5 million acres that would have normally been surveyed were not flown in 2015 due to numerous large fires of 2014 and 2015 (Fig. 18). Because it is difficult to distinguish mortality caused by fire from mortality caused by insects or disease, areas burned by wildfire are not mapped until the second year following the fire. Normally August is the best time to fly aerial survey in eastern Washington because damage signatures are well developed. But heavy smoke, temporary flight restriction areas, and crew and aircraft commitments to fire duty prevented any survey flights the entire month of August. An additional aircraft and crew were used to complete the survey by late September. Much of eastern Washington was flown in the last half of September, at end of the optimal window for mapping some defoliation signatures, meaning some defoliation damage was probably underestimated. Within the areas not flown in 2015, cumulative levels of mortality recorded over the most recent 15-year period of aerial survey were quite variable (Fig. 18). Typical levels of mortality within areas not flown in 2015 were low within the Chelan Complex, Carlton Complex, Okanogan Complex, and Tunk Block perimeters; and moderate to high within the Wolverine, North Star Complex, and Kettle Complex perimeters.
2015 Aerial Survey Conditions
Figure 18. Fifteen years of cumulative mortality from aerial survey, recent large fire perimeters, and areas of 2015 aerial survey not flown. Map by: Aleksandar Dozic, Washington DNR
11
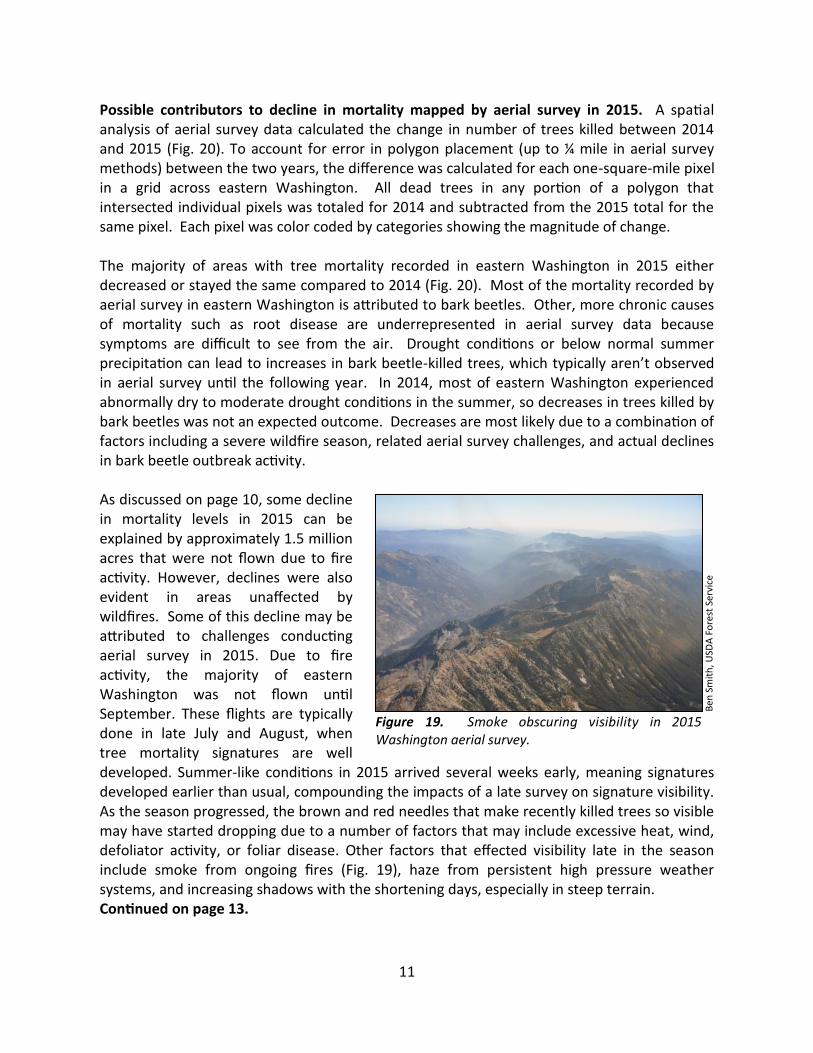
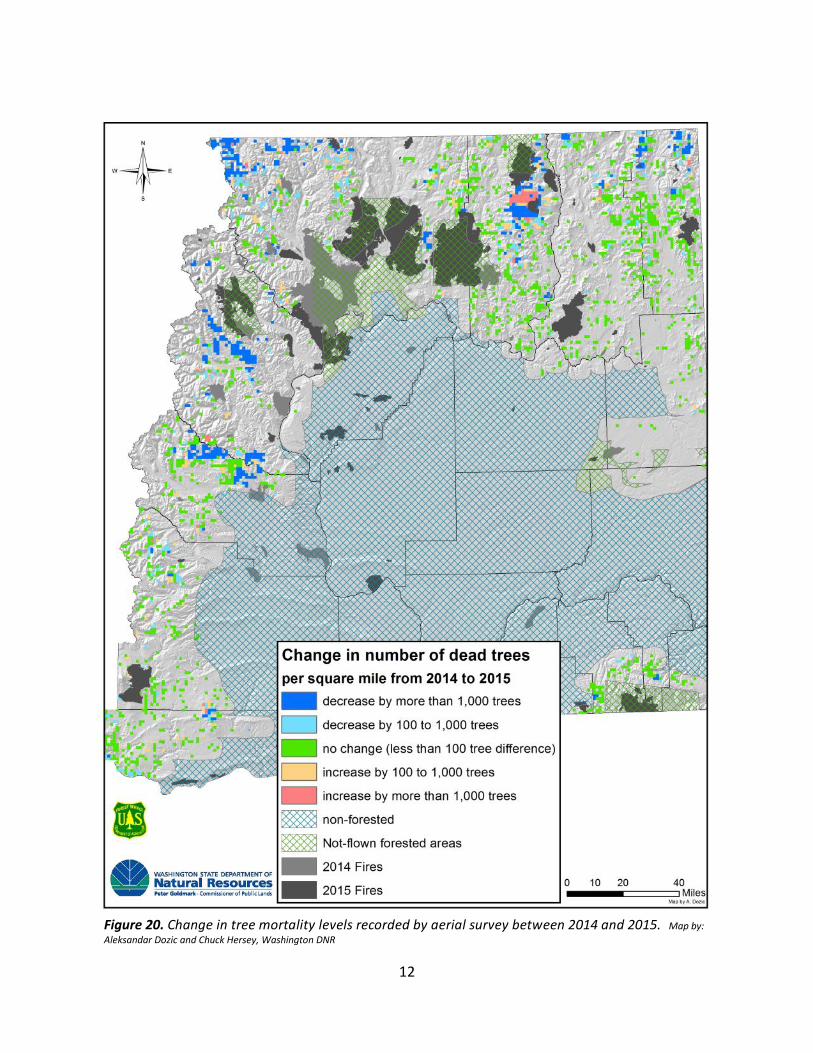
Possible contributors to decline in mortality mapped by aerial survey in 2015. A spatial analysis of aerial survey data calculated the change in number of trees killed between 2014 and 2015 (Fig. 20). To account for error in polygon placement (up to ¼ mile in aerial survey methods) between the two years, the difference was calculated for each one-square-mile pixel in a grid across eastern Washington. All dead trees in any portion of a polygon that intersected individual pixels was totaled for 2014 and subtracted from the 2015 total for the same pixel. Each pixel was color coded by categories showing the magnitude of change. The majority of areas with tree mortality recorded in eastern Washington in 2015 either decreased or stayed the same compared to 2014 (Fig. 20). Most of the mortality recorded by aerial survey in eastern Washington is attributed to bark beetles. Other, more chronic causes of mortality such as root disease are underrepresented in aerial survey data because symptoms are difficult to see from the air. Drought conditions or below normal summer precipitation can lead to increases in bark beetle-killed trees, which typically aren’t observed in aerial survey until the following year. In 2014, most of eastern Washington experienced abnormally dry to moderate drought conditions in the summer, so decreases in trees killed by bark beetles was not an expected outcome. Decreases are most likely due to a combination of factors including a severe wildfire season, related aerial survey challenges, and actual declines in bark beetle outbreak activity. As discussed on page 10, some decline in mortality levels in 2015 can be explained by approximately 1.5 million acres that were not flown due to fire activity. However, declines were also evident in areas unaffected by wildfires. Some of this decline may be attributed to challenges conducting aerial survey in 2015. Due to fire activity, the majority of eastern Washington was not flown until September. These flights are typically done in late July and August, when tree mortality signatures are well developed. Summer-like conditions in 2015 arrived several weeks early, meaning signatures developed earlier than usual, compounding the impacts of a late survey on signature visibility. As the season progressed, the brown and red needles that make recently killed trees so visible may have started dropping due to a number of factors that may include excessive heat, wind, defoliator activity, or foliar disease. Other factors that effected visibility late in the season include smoke from ongoing fires (Fig. 19), haze from persistent high pressure weather systems, and increasing shadows with the shortening days, especially in steep terrain. Continued on page 13.
Ben
Sm
ith
, USD
A F
ore
st S
ervi
ce
Figure 19. Smoke obscuring visibility in 2015 Washington aerial survey.
12
Figure 20. Change in tree mortality levels recorded by aerial survey between 2014 and 2015. Map by:
Aleksandar Dozic and Chuck Hersey, Washington DNR

13
Contributors to mortality decline (continued from page 11). Challenges aside, aerial observ-ers were able to detect some areas with increased mortality, for example mountain pine bee-tle (MPB) outbreaks around Sherman Pass in central Ferry County (Fig. 20). Much of the dam-age from that outbreak mapped in 2014 was within the 2015 Kettle Complex fire to the north which may have contributed to a reduction in mortality mapped in 2015. However, there was also a decrease in the number of dead trees mapped on the south side of the outbreak which may represent an actual decrease in MPB activity in that area. Older, high elevation lodgepole pines are the primary host for MPB outbreaks, which eventually decline as most suitable-sized hosts are killed. In recent years, MPB has made up the majority of acres with mortality in Washington (Fig. 21). The number of acres affected by MPB has been generally declining from a recent peak of over 400,000 acres in 2009 to a low of approximately 59,000 acres in 2015. Similar declines were reported in Oregon, Idaho, British Columbia, and Montana.
Concentrated areas with large decreases in mortality in 2015 in north Kittitas County, central Chelan County, northwest Okanogan County, and northern Stevens and Pend Oreille counties are all areas with recent MPB outbreaks that may be in decline. The areas along the north border of Kittitas County also included decreases in Douglas-fir beetle from elevated levels in 2014 related to western spruce budworm defoliation and 2012 fire activity. The extreme drought in 2015 (Fig. 3) is expected to increase bark beetle damage mapped in 2016; however, areas of 2015 fires will not be mapped in the 2016 aerial survey. Hopefully better aerial survey conditions and fewer fires in 2016 will reveal actual trends in bark beetle activity more clearly.
Figure 21. Ten-year trend of tree mortality attributed to bark beetles by annual
aerial survey in Washington, 2006-2015.
14
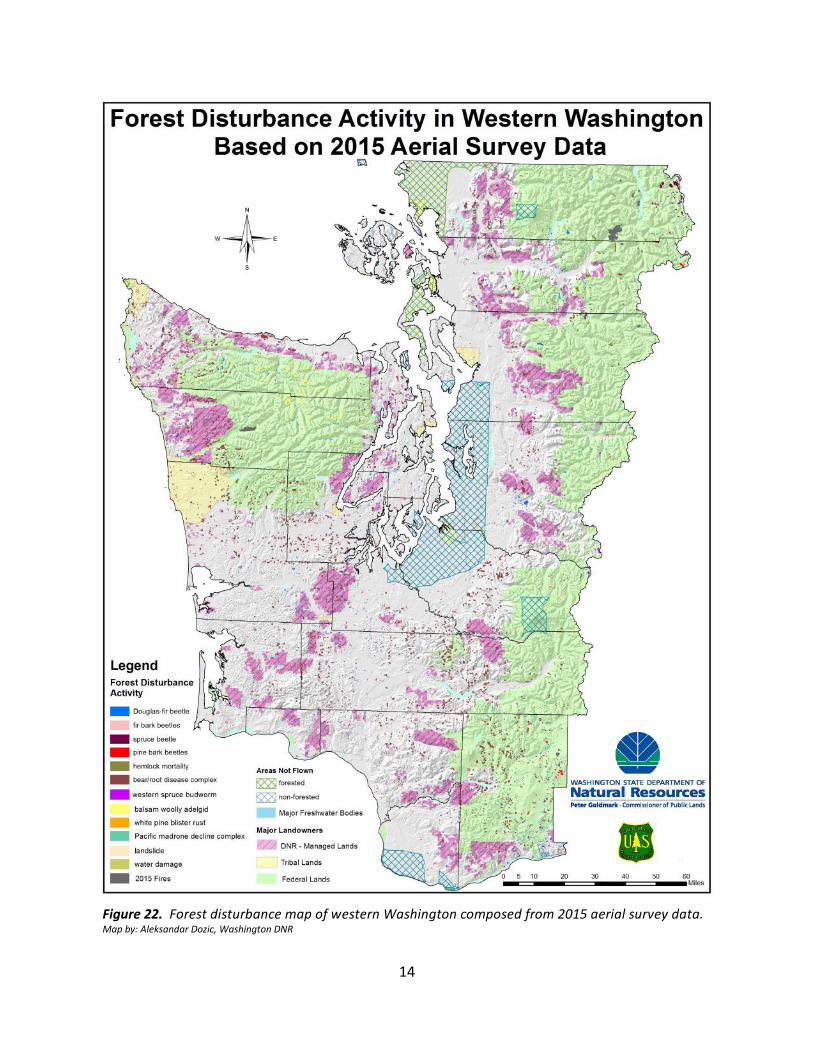
Figure 22. Forest disturbance map of western Washington composed from 2015 aerial survey data. Map by: Aleksandar Dozic, Washington DNR
15
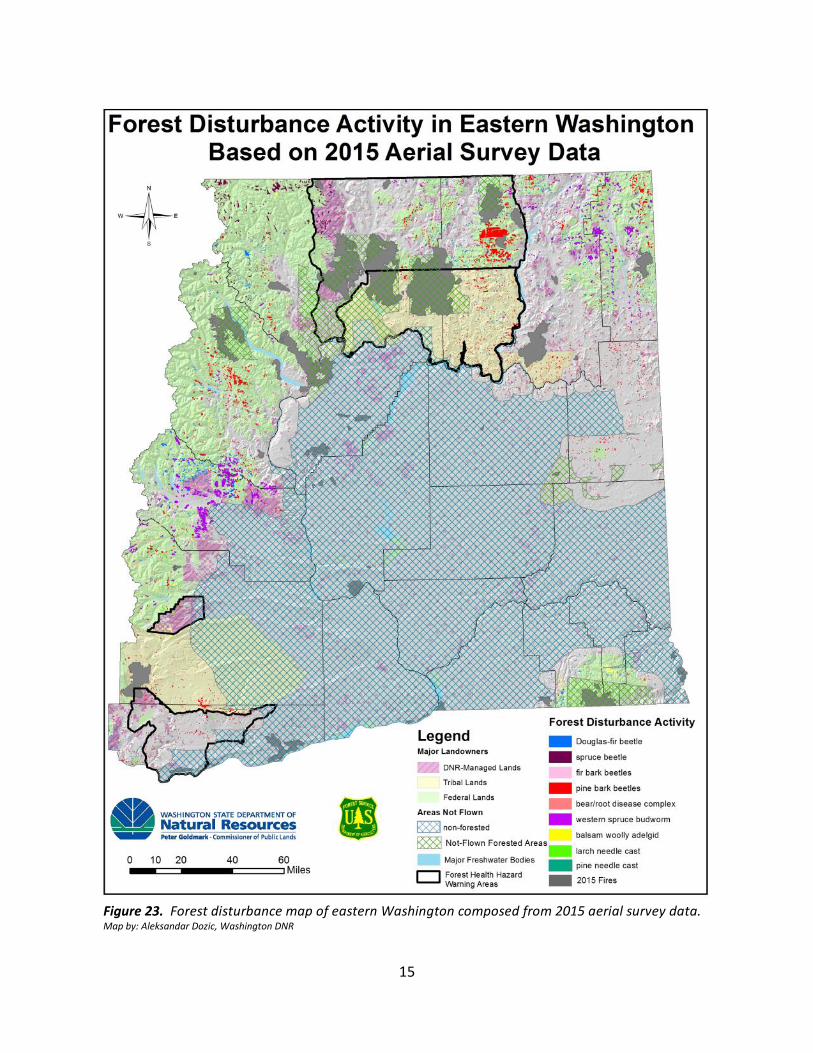
Figure 23. Forest disturbance map of eastern Washington composed from 2015 aerial survey data. Map by: Aleksandar Dozic, Washington DNR
16
Insects
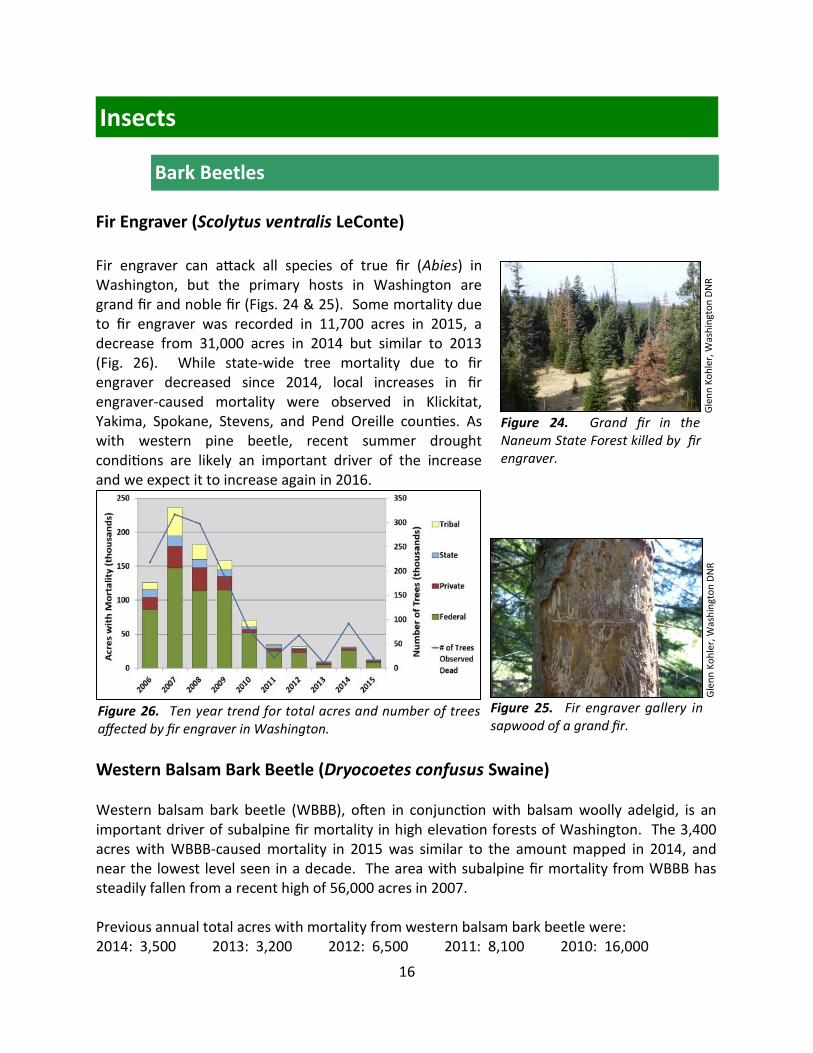
Fir Engraver (Scolytus ventralis LeConte) Fir engraver can attack all species of true fir (Abies) in Washington, but the primary hosts in Washington are grand fir and noble fir (Figs. 24 & 25). Some mortality due to fir engraver was recorded in 11,700 acres in 2015, a decrease from 31,000 acres in 2014 but similar to 2013 (Fig. 26). While state-wide tree mortality due to fir engraver decreased since 2014, local increases in fir engraver-caused mortality were observed in Klickitat, Yakima, Spokane, Stevens, and Pend Oreille counties. As with western pine beetle, recent summer drought conditions are likely an important driver of the increase and we expect it to increase again in 2016.
Figure 26. Ten year trend for total acres and number of trees affected by fir engraver in Washington.
Bark Beetles
Western Balsam Bark Beetle (Dryocoetes confusus Swaine)
Western balsam bark beetle (WBBB), often in conjunction with balsam woolly adelgid, is an important driver of subalpine fir mortality in high elevation forests of Washington. The 3,400 acres with WBBB-caused mortality in 2015 was similar to the amount mapped in 2014, and near the lowest level seen in a decade. The area with subalpine fir mortality from WBBB has steadily fallen from a recent high of 56,000 acres in 2007. Previous annual total acres with mortality from western balsam bark beetle were: 2014: 3,500 2013: 3,200 2012: 6,500 2011: 8,100 2010: 16,000
Figure 24. Grand fir in the Naneum State Forest killed by fir engraver.
Gle
nn
Ko
hle
r, W
ash
ingt
on
DN
R
Figure 25. Fir engraver gallery in sapwood of a grand fir.
Gle
nn
Ko
hle
r, W
ash
ingt
on
DN
R
17
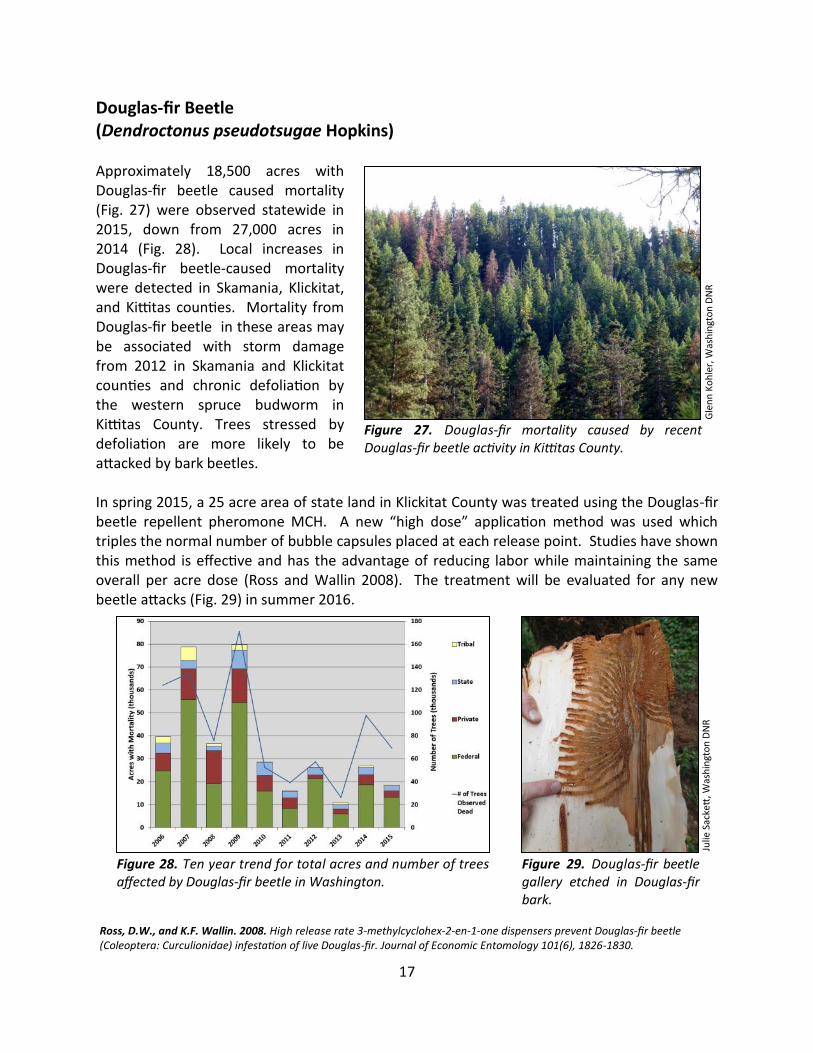
Douglas-fir Beetle (Dendroctonus pseudotsugae Hopkins) Approximately 18,500 acres with Douglas-fir beetle caused mortality (Fig. 27) were observed statewide in 2015, down from 27,000 acres in 2014 (Fig. 28). Local increases in Douglas-fir beetle-caused mortality were detected in Skamania, Klickitat, and Kittitas counties. Mortality from Douglas-fir beetle in these areas may be associated with storm damage from 2012 in Skamania and Klickitat counties and chronic defoliation by the western spruce budworm in Kittitas County. Trees stressed by defoliation are more likely to be attacked by bark beetles. In spring 2015, a 25 acre area of state land in Klickitat County was treated using the Douglas-fir beetle repellent pheromone MCH. A new “high dose” application method was used which triples the normal number of bubble capsules placed at each release point. Studies have shown this method is effective and has the advantage of reducing labor while maintaining the same overall per acre dose (Ross and Wallin 2008). The treatment will be evaluated for any new beetle attacks (Fig. 29) in summer 2016.
Figure 29. Douglas-fir beetle gallery etched in Douglas-fir bark.
Julie
Sac
kett
, Was
hin
gto
n D
NR
Figure 27. Douglas-fir mortality caused by recent Douglas-fir beetle activity in Kittitas County.
Gle
nn
Ko
hle
r, W
ash
ingt
on
DN
R
Figure 28. Ten year trend for total acres and number of trees affected by Douglas-fir beetle in Washington.
Ross, D.W., and K.F. Wallin. 2008. High release rate 3-methylcyclohex-2-en-1-one dispensers prevent Douglas-fir beetle (Coleoptera: Curculionidae) infestation of live Douglas-fir. Journal of Economic Entomology 101(6), 1826-1830.
18
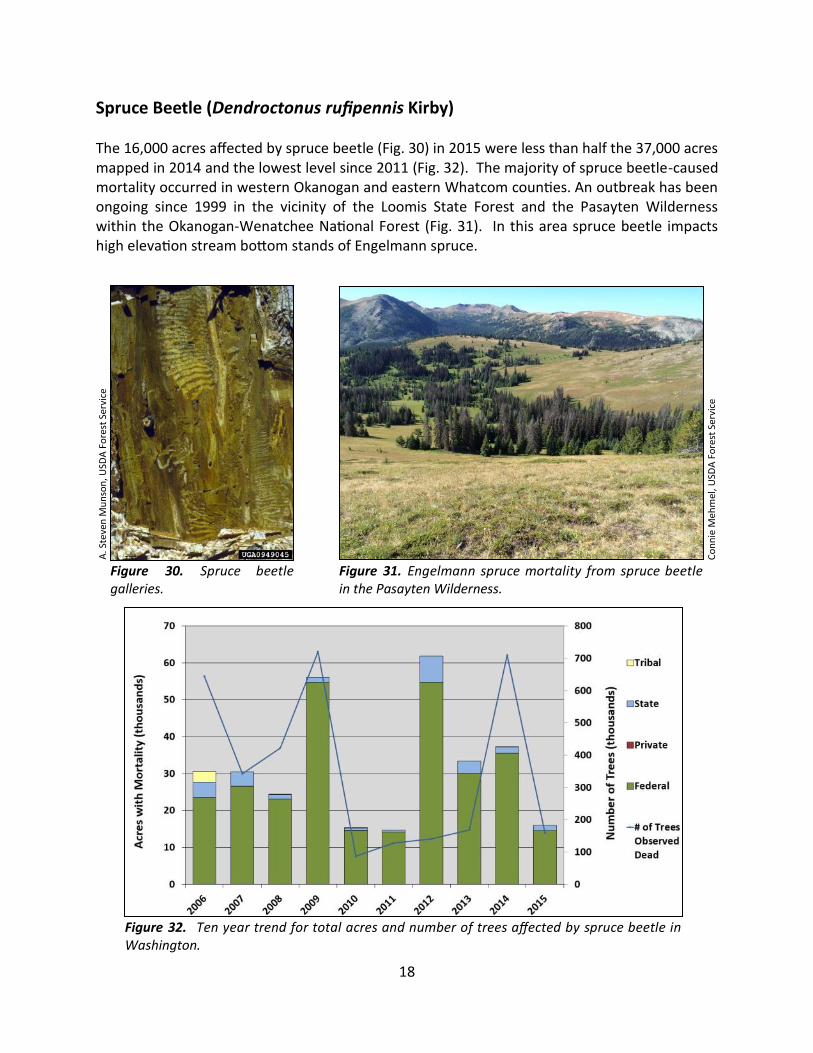
Spruce Beetle (Dendroctonus rufipennis Kirby) The 16,000 acres affected by spruce beetle (Fig. 30) in 2015 were less than half the 37,000 acres mapped in 2014 and the lowest level since 2011 (Fig. 32). The majority of spruce beetle-caused mortality occurred in western Okanogan and eastern Whatcom counties. An outbreak has been ongoing since 1999 in the vicinity of the Loomis State Forest and the Pasayten Wilderness within the Okanogan-Wenatchee National Forest (Fig. 31). In this area spruce beetle impacts high elevation stream bottom stands of Engelmann spruce.
Figure 32. Ten year trend for total acres and number of trees affected by spruce beetle in Washington.
Figure 31. Engelmann spruce mortality from spruce beetle in the Pasayten Wilderness.
Co
nn
ie M
ehm
el, U
SDA
Fo
rest
Ser
vice
A. S
teve
n M
un
son
, USD
A F
ore
st S
ervi
ce
Figure 30. Spruce beetle galleries.
19
Pine Bark Beetles (Dendroctonus ponderosae Hopkins, Dendroctonus brevicomis LeConte & Ips spp.)
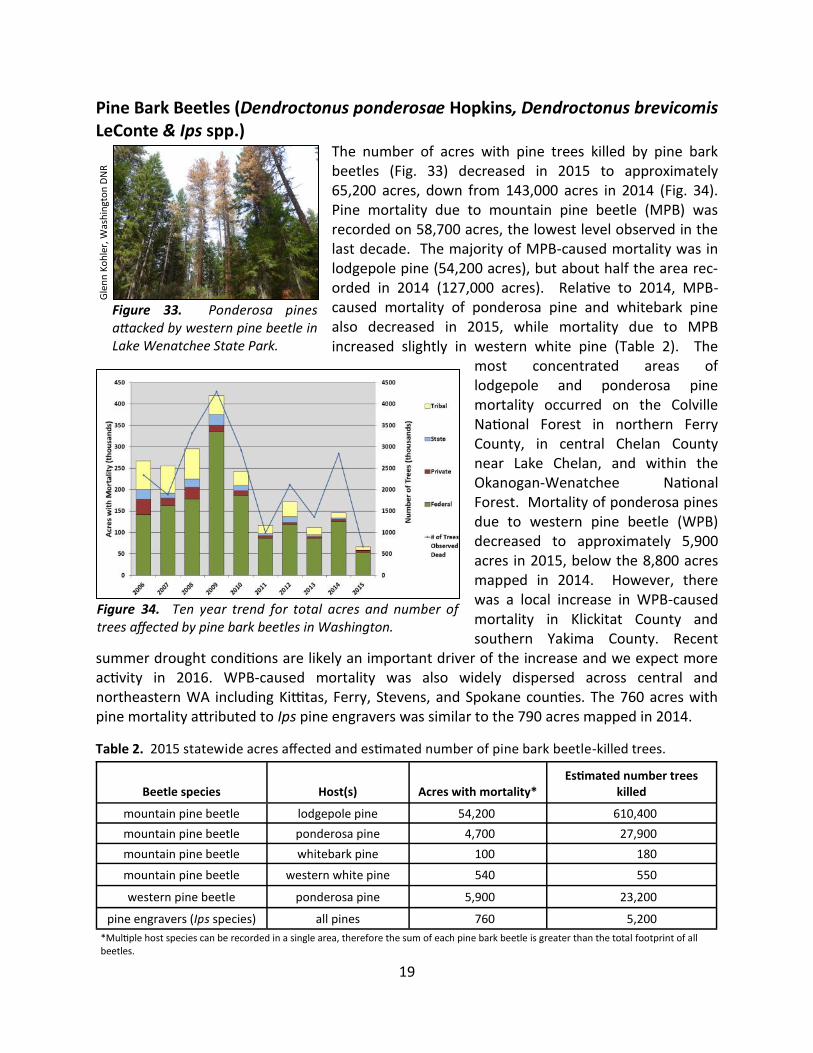
The number of acres with pine trees killed by pine bark beetles (Fig. 33) decreased in 2015 to approximately 65,200 acres, down from 143,000 acres in 2014 (Fig. 34). Pine mortality due to mountain pine beetle (MPB) was recorded on 58,700 acres, the lowest level observed in the last decade. The majority of MPB-caused mortality was in lodgepole pine (54,200 acres), but about half the area rec-orded in 2014 (127,000 acres). Relative to 2014, MPB-caused mortality of ponderosa pine and whitebark pine also decreased in 2015, while mortality due to MPB increased slightly in western white pine (Table 2). The
most concentrated areas of lodgepole and ponderosa pine mortality occurred on the Colville National Forest in northern Ferry County, in central Chelan County near Lake Chelan, and within the Okanogan-Wenatchee National Forest. Mortality of ponderosa pines due to western pine beetle (WPB) decreased to approximately 5,900 acres in 2015, below the 8,800 acres mapped in 2014. However, there was a local increase in WPB-caused mortality in Klickitat County and southern Yakima County. Recent
summer drought conditions are likely an important driver of the increase and we expect more activity in 2016. WPB-caused mortality was also widely dispersed across central and northeastern WA including Kittitas, Ferry, Stevens, and Spokane counties. The 760 acres with pine mortality attributed to Ips pine engravers was similar to the 790 acres mapped in 2014.
Figure 34. Ten year trend for total acres and number of trees affected by pine bark beetles in Washington.
Beetle species Host(s) Acres with mortality* Estimated number trees
killed
mountain pine beetle lodgepole pine 54,200 610,400
mountain pine beetle ponderosa pine 4,700 27,900
mountain pine beetle whitebark pine 100 180
mountain pine beetle western white pine 540 550
western pine beetle ponderosa pine 5,900 23,200
pine engravers (Ips species) all pines 760 5,200
Table 2. 2015 statewide acres affected and estimated number of pine bark beetle-killed trees.
Figure 33. Ponderosa pines attacked by western pine beetle in Lake Wenatchee State Park.
Gle
nn
Ko
hle
r, W
ash
ingt
on
DN
R
*Multiple host species can be recorded in a single area, therefore the sum of each pine bark beetle is greater than the total footprint of all beetles.
20
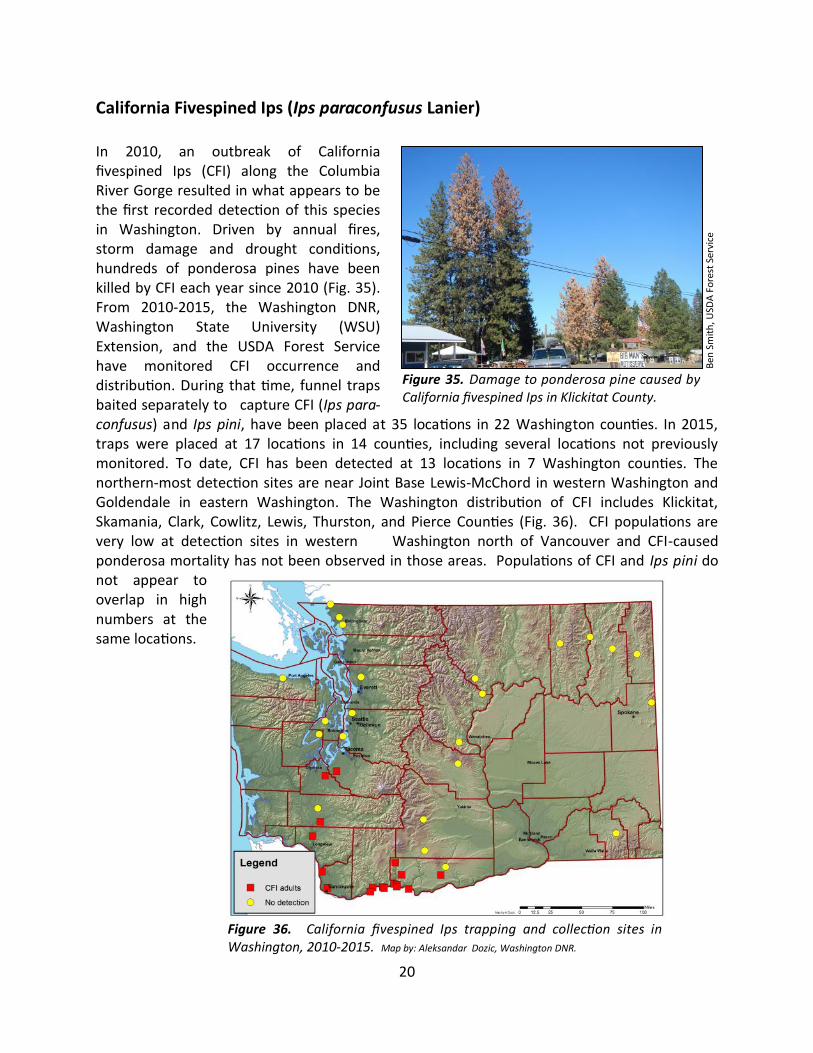
California Fivespined Ips (Ips paraconfusus Lanier) In 2010, an outbreak of California fivespined Ips (CFI) along the Columbia River Gorge resulted in what appears to be the first recorded detection of this species in Washington. Driven by annual fires, storm damage and drought conditions, hundreds of ponderosa pines have been killed by CFI each year since 2010 (Fig. 35). From 2010-2015, the Washington DNR, Washington State University (WSU) Extension, and the USDA Forest Service have monitored CFI occurrence and distribution. During that time, funnel traps baited separately to capture CFI (Ips para-confusus) and Ips pini, have been placed at 35 locations in 22 Washington counties. In 2015, traps were placed at 17 locations in 14 counties, including several locations not previously monitored. To date, CFI has been detected at 13 locations in 7 Washington counties. The northern-most detection sites are near Joint Base Lewis-McChord in western Washington and Goldendale in eastern Washington. The Washington distribution of CFI includes Klickitat, Skamania, Clark, Cowlitz, Lewis, Thurston, and Pierce Counties (Fig. 36). CFI populations are very low at detection sites in western Washington north of Vancouver and CFI-caused ponderosa mortality has not been observed in those areas. Populations of CFI and Ips pini do not appear to overlap in high numbers at the same locations.
Figure 35. Damage to ponderosa pine caused by California fivespined Ips in Klickitat County.
Ben
Sm
ith
, USD
A F
ore
st S
ervi
ce
Figure 36. California fivespined Ips trapping and collection sites in Washington, 2010-2015. Map by: Aleksandar Dozic, Washington DNR.
21
Defoliators
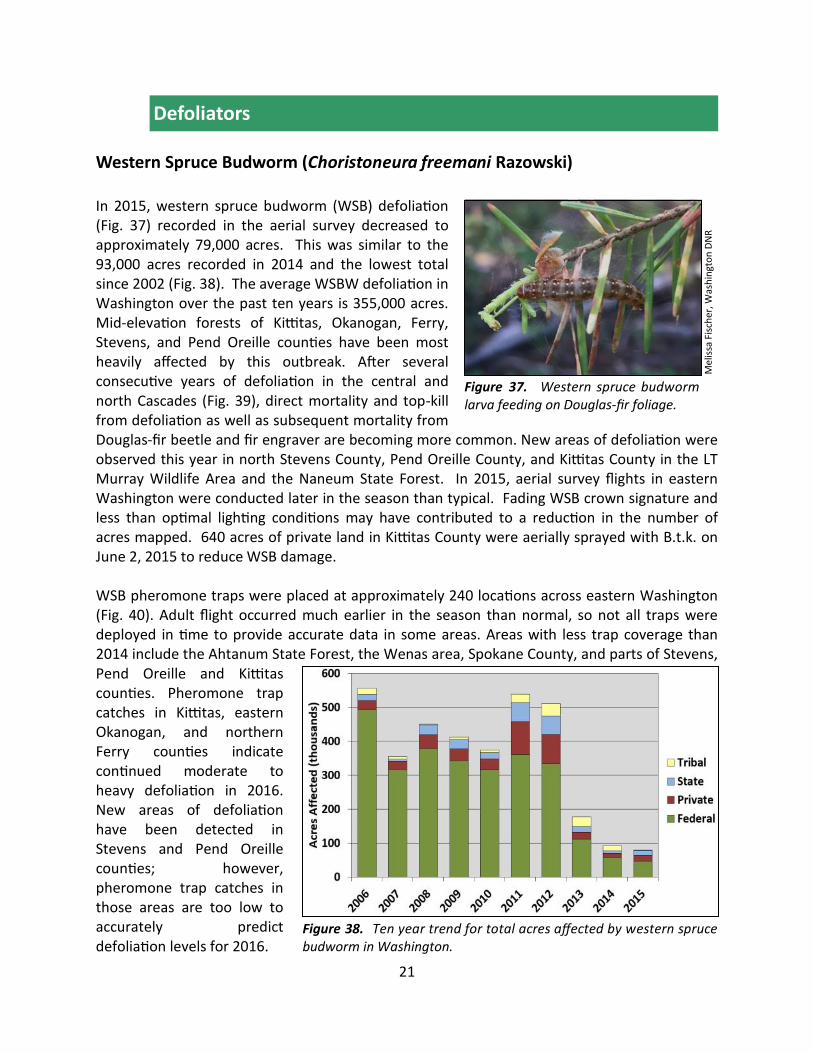
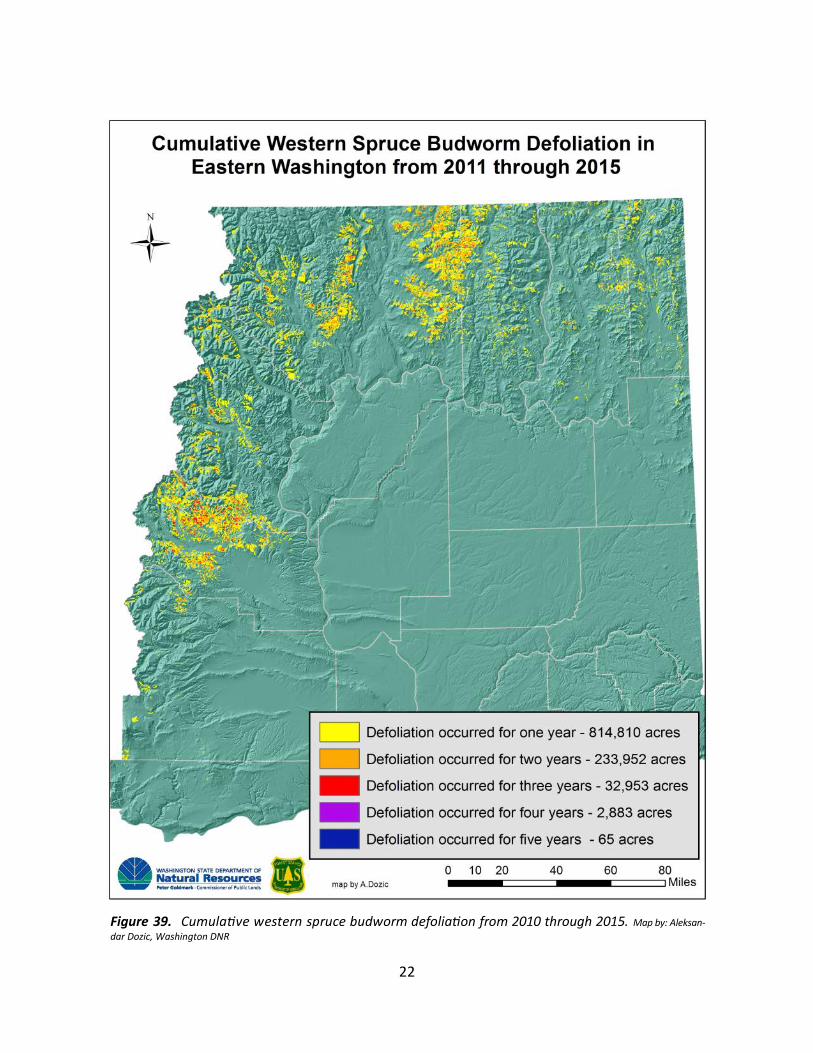
Western Spruce Budworm (Choristoneura freemani Razowski) In 2015, western spruce budworm (WSB) defoliation (Fig. 37) recorded in the aerial survey decreased to approximately 79,000 acres. This was similar to the 93,000 acres recorded in 2014 and the lowest total since 2002 (Fig. 38). The average WSBW defoliation in Washington over the past ten years is 355,000 acres. Mid-elevation forests of Kittitas, Okanogan, Ferry, Stevens, and Pend Oreille counties have been most heavily affected by this outbreak. After several consecutive years of defoliation in the central and north Cascades (Fig. 39), direct mortality and top-kill from defoliation as well as subsequent mortality from Douglas-fir beetle and fir engraver are becoming more common. New areas of defoliation were observed this year in north Stevens County, Pend Oreille County, and Kittitas County in the LT Murray Wildlife Area and the Naneum State Forest. In 2015, aerial survey flights in eastern Washington were conducted later in the season than typical. Fading WSB crown signature and less than optimal lighting conditions may have contributed to a reduction in the number of acres mapped. 640 acres of private land in Kittitas County were aerially sprayed with B.t.k. on June 2, 2015 to reduce WSB damage. WSB pheromone traps were placed at approximately 240 locations across eastern Washington (Fig. 40). Adult flight occurred much earlier in the season than normal, so not all traps were deployed in time to provide accurate data in some areas. Areas with less trap coverage than 2014 include the Ahtanum State Forest, the Wenas area, Spokane County, and parts of Stevens, Pend Oreille and Kittitas counties. Pheromone trap catches in Kittitas, eastern Okanogan, and northern Ferry counties indicate continued moderate to heavy defoliation in 2016. New areas of defoliation have been detected in Stevens and Pend Oreille counties; however, pheromone trap catches in those areas are too low to accurately predict defoliation levels for 2016.
Figure 37. Western spruce budworm larva feeding on Douglas-fir foliage.
Mel
issa
Fis
che
r, W
ash
ingt
on
DN
R
Figure 38. Ten year trend for total acres affected by western spruce budworm in Washington.
22
Figure 39. Cumulative western spruce budworm defoliation from 2010 through 2015. Map by: Aleksan-
dar Dozic, Washington DNR
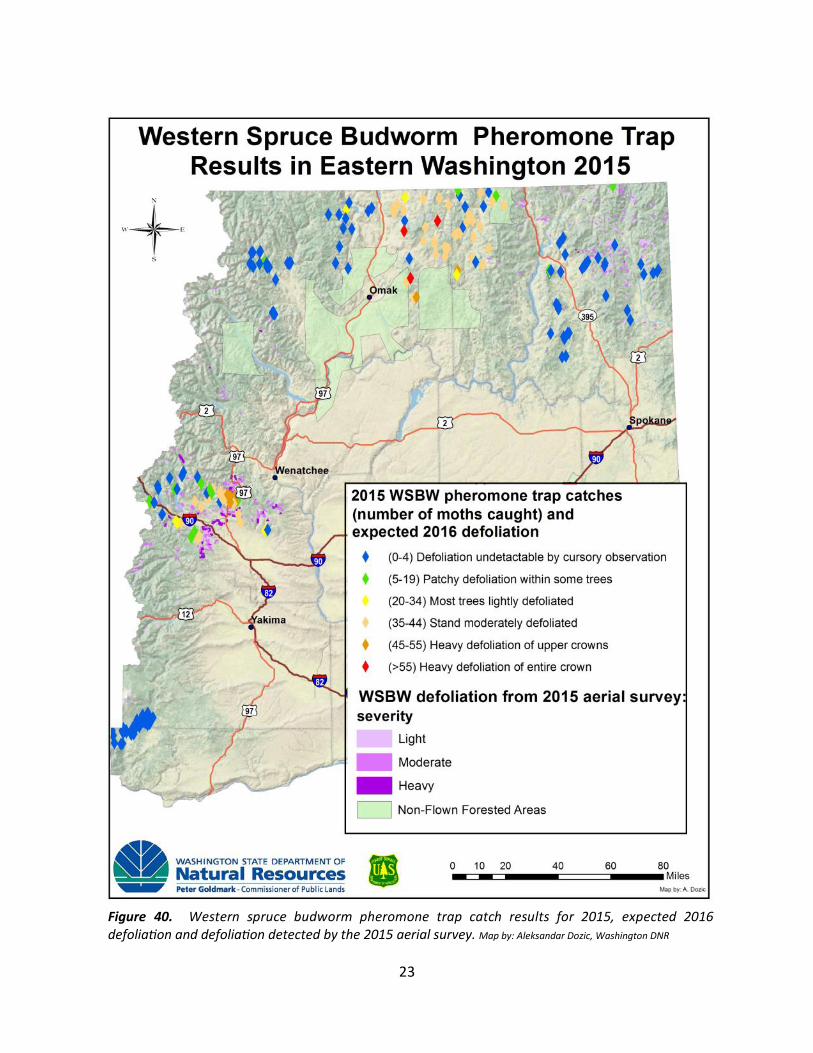
23
Figure 40. Western spruce budworm pheromone trap catch results for 2015, expected 2016 defoliation and defoliation detected by the 2015 aerial survey. Map by: Aleksandar Dozic, Washington DNR
24
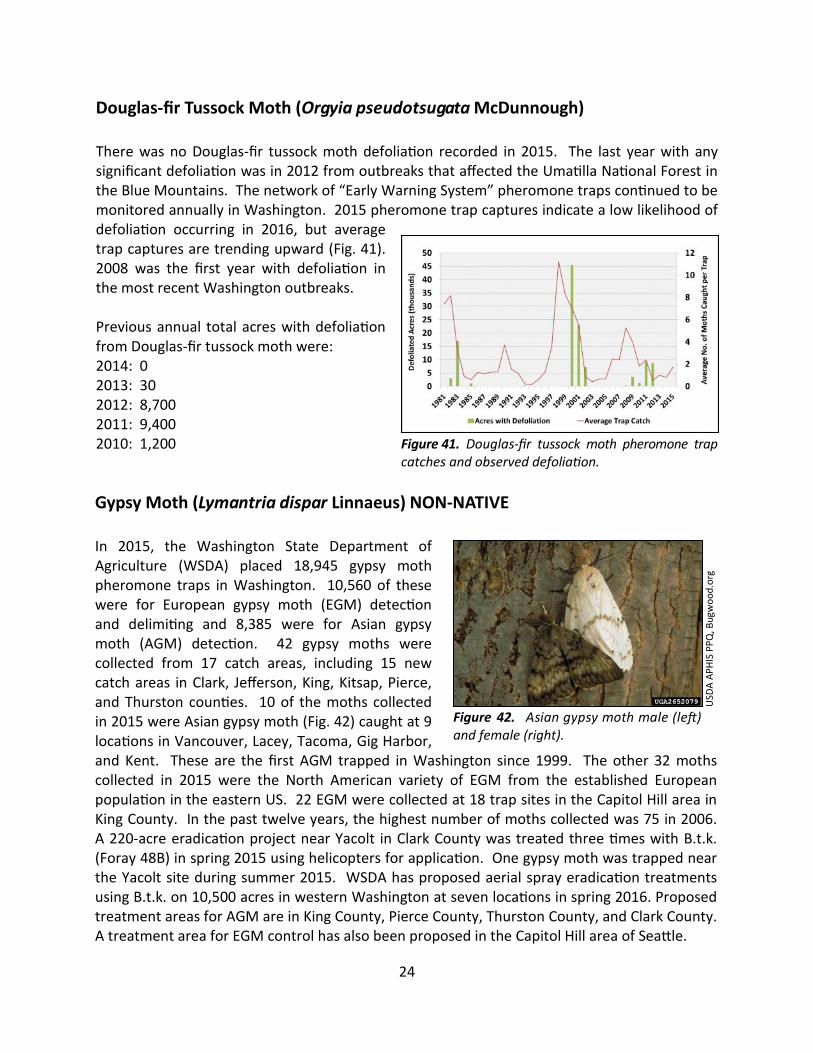
Douglas-fir Tussock Moth (Orgyia pseudotsugata McDunnough) There was no Douglas-fir tussock moth defoliation recorded in 2015. The last year with any significant defoliation was in 2012 from outbreaks that affected the Umatilla National Forest in the Blue Mountains. The network of “Early Warning System” pheromone traps continued to be monitored annually in Washington. 2015 pheromone trap captures indicate a low likelihood of defoliation occurring in 2016, but average trap captures are trending upward (Fig. 41). 2008 was the first year with defoliation in the most recent Washington outbreaks. Previous annual total acres with defoliation from Douglas-fir tussock moth were: 2014: 0 2013: 30 2012: 8,700 2011: 9,400 2010: 1,200 Figure 41. Douglas-fir tussock moth pheromone trap
catches and observed defoliation.
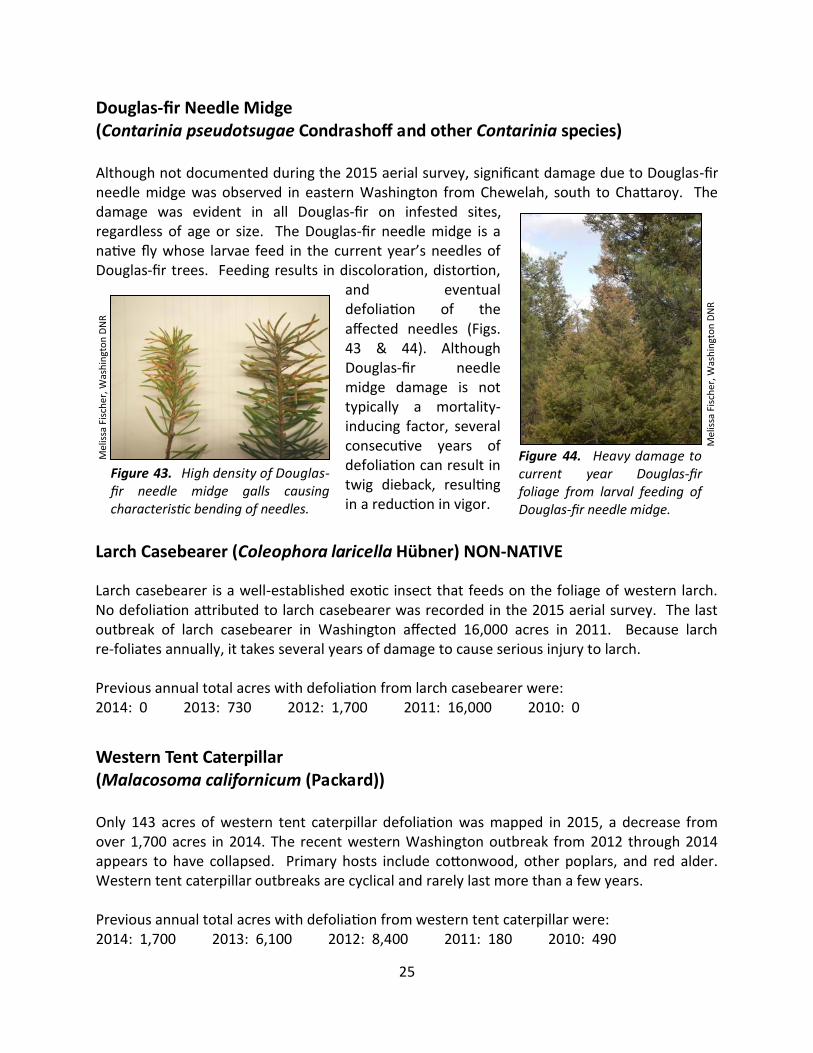
Gypsy Moth (Lymantria dispar Linnaeus) NON-NATIVE In 2015, the Washington State Department of Agriculture (WSDA) placed 18,945 gypsy moth pheromone traps in Washington. 10,560 of these were for European gypsy moth (EGM) detection and delimiting and 8,385 were for Asian gypsy moth (AGM) detection. 42 gypsy moths were collected from 17 catch areas, including 15 new catch areas in Clark, Jefferson, King, Kitsap, Pierce, and Thurston counties. 10 of the moths collected in 2015 were Asian gypsy moth (Fig. 42) caught at 9 locations in Vancouver, Lacey, Tacoma, Gig Harbor, and Kent. These are the first AGM trapped in Washington since 1999. The other 32 moths collected in 2015 were the North American variety of EGM from the established European population in the eastern US. 22 EGM were collected at 18 trap sites in the Capitol Hill area in King County. In the past twelve years, the highest number of moths collected was 75 in 2006. A 220-acre eradication project near Yacolt in Clark County was treated three times with B.t.k. (Foray 48B) in spring 2015 using helicopters for application. One gypsy moth was trapped near the Yacolt site during summer 2015. WSDA has proposed aerial spray eradication treatments using B.t.k. on 10,500 acres in western Washington at seven locations in spring 2016. Proposed treatment areas for AGM are in King County, Pierce County, Thurston County, and Clark County. A treatment area for EGM control has also been proposed in the Capitol Hill area of Seattle.
USD
A A
PH
IS P
PQ
, Bu
gwo
od
.org
Figure 42. Asian gypsy moth male (left) and female (right).
25
Larch Casebearer (Coleophora laricella Hübner) NON-NATIVE Larch casebearer is a well-established exotic insect that feeds on the foliage of western larch. No defoliation attributed to larch casebearer was recorded in the 2015 aerial survey. The last outbreak of larch casebearer in Washington affected 16,000 acres in 2011. Because larch re-foliates annually, it takes several years of damage to cause serious injury to larch. Previous annual total acres with defoliation from larch casebearer were: 2014: 0 2013: 730 2012: 1,700 2011: 16,000 2010: 0
Western Tent Caterpillar (Malacosoma californicum (Packard)) Only 143 acres of western tent caterpillar defoliation was mapped in 2015, a decrease from over 1,700 acres in 2014. The recent western Washington outbreak from 2012 through 2014 appears to have collapsed. Primary hosts include cottonwood, other poplars, and red alder. Western tent caterpillar outbreaks are cyclical and rarely last more than a few years. Previous annual total acres with defoliation from western tent caterpillar were: 2014: 1,700 2013: 6,100 2012: 8,400 2011: 180 2010: 490
Douglas-fir Needle Midge (Contarinia pseudotsugae Condrashoff and other Contarinia species) Although not documented during the 2015 aerial survey, significant damage due to Douglas-fir needle midge was observed in eastern Washington from Chewelah, south to Chattaroy. The damage was evident in all Douglas-fir on infested sites, regardless of age or size. The Douglas-fir needle midge is a native fly whose larvae feed in the current year’s needles of Douglas-fir trees. Feeding results in discoloration, distortion,
and eventual defoliation of the affected needles (Figs. 43 & 44). Although Douglas-fir needle midge damage is not typically a mortality-inducing factor, several consecutive years of defoliation can result in twig dieback, resulting in a reduction in vigor.
Figure 44. Heavy damage to current year Douglas-fir foliage from larval feeding of Douglas-fir needle midge.
Mel
issa
Fis
che
r, W
ash
ingt
on
DN
R
Figure 43. High density of Douglas-fir needle midge galls causing characteristic bending of needles.
Mel
issa
Fis
che
r, W
ash
ingt
on
DN
R
26
Balsam Woolly Adelgid (Adelges piceae Ratzeburg) NON-NATIVE
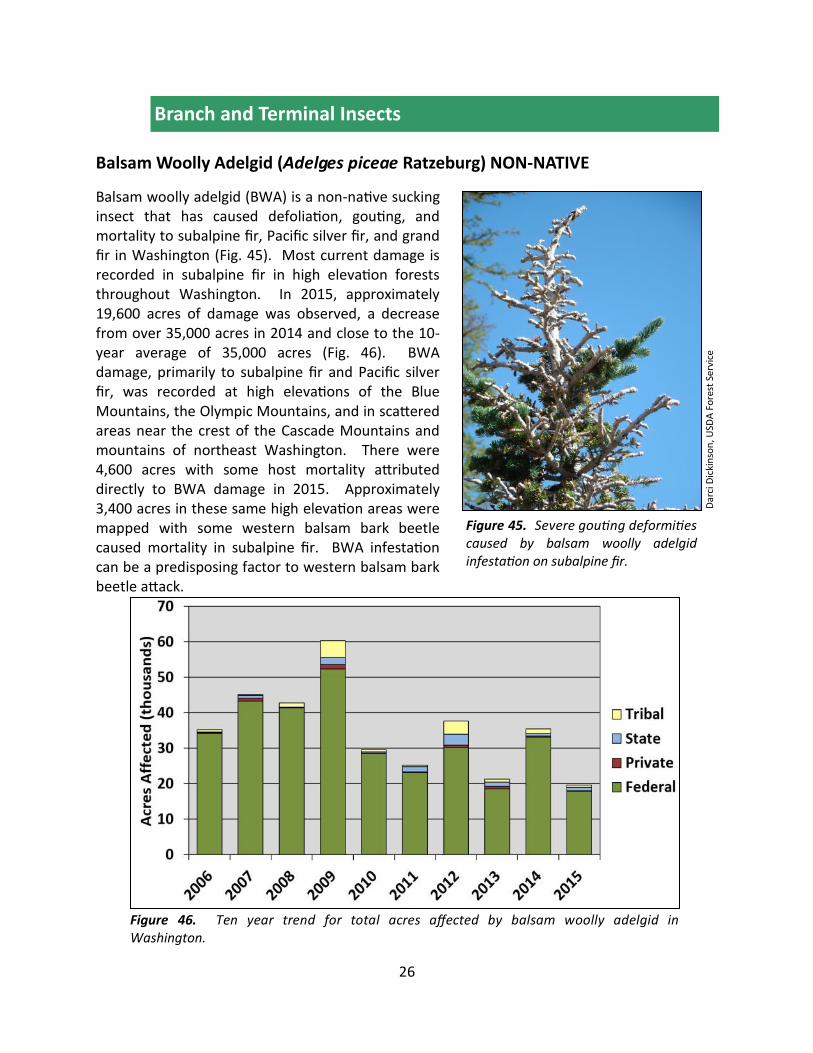
Balsam woolly adelgid (BWA) is a non-native sucking insect that has caused defoliation, gouting, and mortality to subalpine fir, Pacific silver fir, and grand fir in Washington (Fig. 45). Most current damage is recorded in subalpine fir in high elevation forests throughout Washington. In 2015, approximately 19,600 acres of damage was observed, a decrease from over 35,000 acres in 2014 and close to the 10-year average of 35,000 acres (Fig. 46). BWA damage, primarily to subalpine fir and Pacific silver fir, was recorded at high elevations of the Blue Mountains, the Olympic Mountains, and in scattered areas near the crest of the Cascade Mountains and mountains of northeast Washington. There were 4,600 acres with some host mortality attributed directly to BWA damage in 2015. Approximately 3,400 acres in these same high elevation areas were mapped with some western balsam bark beetle caused mortality in subalpine fir. BWA infestation can be a predisposing factor to western balsam bark beetle attack.
Branch and Terminal Insects
Dar
ci D
icki
nso
n, U
SDA
Fo
rest
Ser
vice
Figure 45. Severe gouting deformities caused by balsam woolly adelgid infestation on subalpine fir.
Figure 46. Ten year trend for total acres affected by balsam woolly adelgid in Washington.
27
Animals
Bear Damage / Root Disease
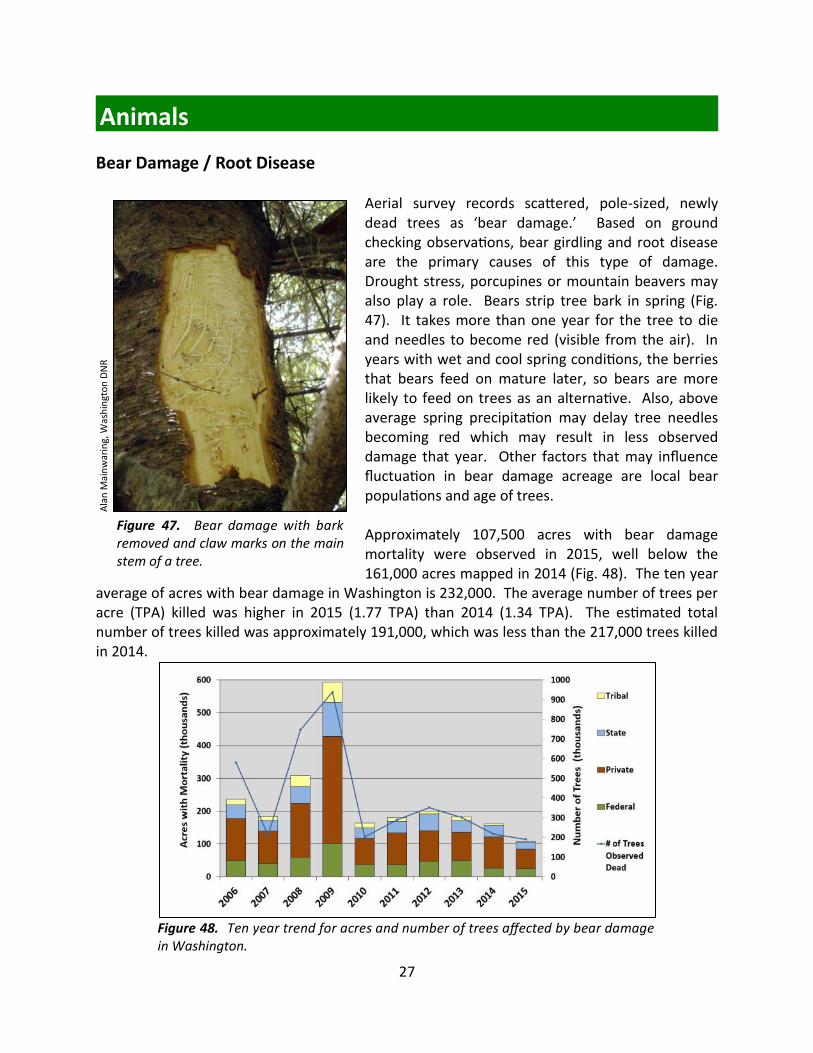
Aerial survey records scattered, pole-sized, newly dead trees as ‘bear damage.’ Based on ground checking observations, bear girdling and root disease are the primary causes of this type of damage. Drought stress, porcupines or mountain beavers may also play a role. Bears strip tree bark in spring (Fig. 47). It takes more than one year for the tree to die and needles to become red (visible from the air). In years with wet and cool spring conditions, the berries that bears feed on mature later, so bears are more likely to feed on trees as an alternative. Also, above average spring precipitation may delay tree needles becoming red which may result in less observed damage that year. Other factors that may influence fluctuation in bear damage acreage are local bear populations and age of trees. Approximately 107,500 acres with bear damage mortality were observed in 2015, well below the 161,000 acres mapped in 2014 (Fig. 48). The ten year
average of acres with bear damage in Washington is 232,000. The average number of trees per acre (TPA) killed was higher in 2015 (1.77 TPA) than 2014 (1.34 TPA). The estimated total number of trees killed was approximately 191,000, which was less than the 217,000 trees killed in 2014.
Figure 48. Ten year trend for acres and number of trees affected by bear damage in Washington.
Ala
n M
ain
war
ing,
Was
hin
gto
n D
NR
Figure 47. Bear damage with bark removed and claw marks on the main stem of a tree.
28
Diseases
Foliar and Branch Diseases
Conifer Needle Casts Pine Needle Casts (Dothistroma spp.,
Elytroderma spp., Lophodermella spp., Lophodermium spp., and others)
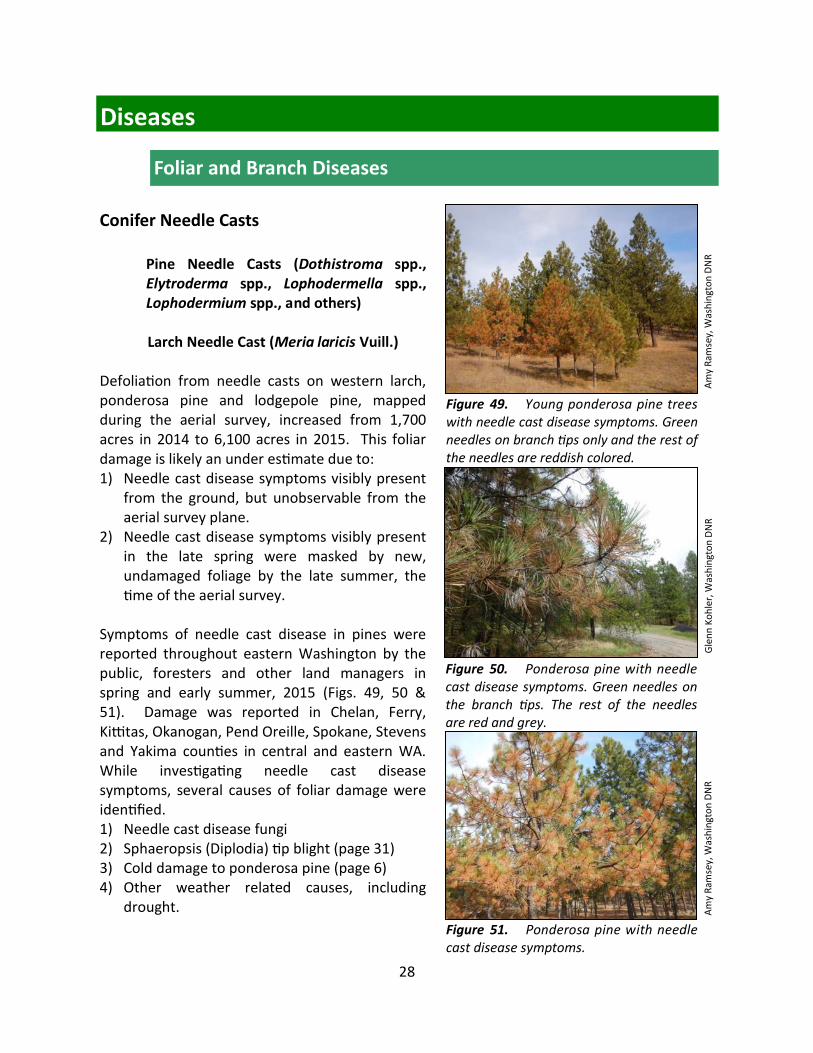
Larch Needle Cast (Meria laricis Vuill.) Defoliation from needle casts on western larch, ponderosa pine and lodgepole pine, mapped during the aerial survey, increased from 1,700 acres in 2014 to 6,100 acres in 2015. This foliar damage is likely an under estimate due to: 1) Needle cast disease symptoms visibly present
from the ground, but unobservable from the aerial survey plane.
2) Needle cast disease symptoms visibly present in the late spring were masked by new, undamaged foliage by the late summer, the time of the aerial survey.
Symptoms of needle cast disease in pines were reported throughout eastern Washington by the public, foresters and other land managers in spring and early summer, 2015 (Figs. 49, 50 & 51). Damage was reported in Chelan, Ferry, Kittitas, Okanogan, Pend Oreille, Spokane, Stevens and Yakima counties in central and eastern WA. While investigating needle cast disease symptoms, several causes of foliar damage were identified. 1) Needle cast disease fungi 2) Sphaeropsis (Diplodia) tip blight (page 31) 3) Cold damage to ponderosa pine (page 6) 4) Other weather related causes, including
drought.
Figure 49. Young ponderosa pine trees with needle cast disease symptoms. Green needles on branch tips only and the rest of the needles are reddish colored.
Am
y R
amse
y, W
ash
ingt
on
DN
R
Am
y R
amse
y, W
ash
ingt
on
DN
R
Gle
nn
Ko
hle
r, W
ash
ingt
on
DN
R
Figure 50. Ponderosa pine with needle cast disease symptoms. Green needles on the branch tips. The rest of the needles are red and grey.
Figure 51. Ponderosa pine with needle cast disease symptoms.
29
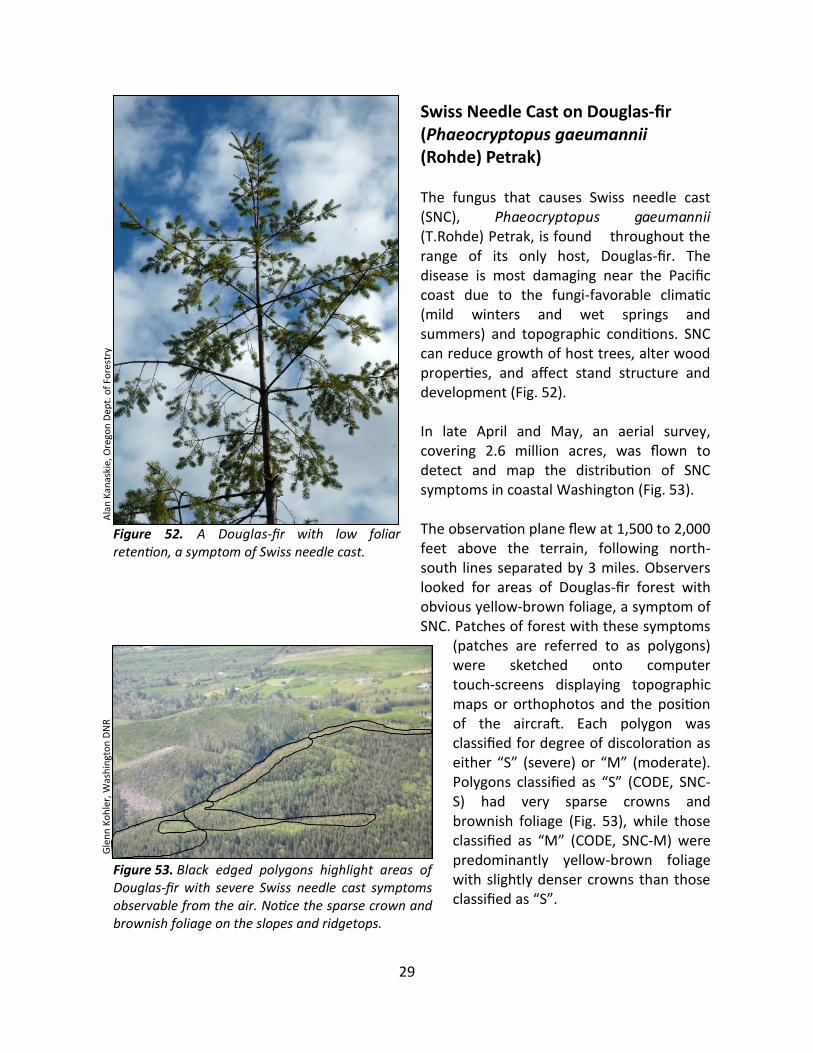
Swiss Needle Cast on Douglas-fir (Phaeocryptopus gaeumannii (Rohde) Petrak) The fungus that causes Swiss needle cast (SNC), Phaeocryptopus gaeumannii (T.Rohde) Petrak, is found throughout the range of its only host, Douglas-fir. The disease is most damaging near the Pacific coast due to the fungi-favorable climatic (mild winters and wet springs and summers) and topographic conditions. SNC can reduce growth of host trees, alter wood properties, and affect stand structure and development (Fig. 52). In late April and May, an aerial survey, covering 2.6 million acres, was flown to detect and map the distribution of SNC symptoms in coastal Washington (Fig. 53). The observation plane flew at 1,500 to 2,000 feet above the terrain, following north-south lines separated by 3 miles. Observers looked for areas of Douglas-fir forest with obvious yellow-brown foliage, a symptom of SNC. Patches of forest with these symptoms
(patches are referred to as polygons) were sketched onto computer touch-screens displaying topographic maps or orthophotos and the position of the aircraft. Each polygon was classified for degree of discoloration as either “S” (severe) or “M” (moderate). Polygons classified as “S” (CODE, SNC-S) had very sparse crowns and brownish foliage (Fig. 53), while those classified as “M” (CODE, SNC-M) were predominantly yellow-brown foliage with slightly denser crowns than those classified as “S”.
Gle
nn
Ko
hle
r, W
ash
ingt
on
DN
R
Ala
n K
anas
kie,
Ore
gon
Dep
t. o
f Fo
rest
ry
Figure 52. A Douglas-fir with low foliar retention, a symptom of Swiss needle cast.
Figure 53. Black edged polygons highlight areas of Douglas-fir with severe Swiss needle cast symptoms observable from the air. Notice the sparse crown and brownish foliage on the slopes and ridgetops.

30
Nearly 350,000 acres of symptomatic Douglas-fir were mapped, which is an increase from the 230,000 acres mapped in the 2012 aerial survey (Fig. 54). The survey boundaries were similar to those in the 2012 survey. Severely symptomatic stands were generally located near the coast and the Grays Harbor area. The cause of the dramatic increase in acreage mapped from 2012 to 2015 remains uncertain, in part due to our ground plot network not extending as far east as the mapped aerial survey polygons and the potentially confounding impacts of an unusually dry and warm winter and spring in 2015.
Forty-seven ground sites across the range of the aerial survey were surveyed for Douglas-fir foliar retention and SNC severity. An average of 2.3 years of foliage were on the trees across all sites. Healthy Douglas-fir carry three or more years of foliage. Previous growth impact studies conducted by Dr. Doug Maguire, and other researchers, at Oregon State University estimate that growth losses may be as high as 20-30% when foliar retention ranges from 2.1 to 2.5 years. Douglas-fir is the only host of this disease, therefore forest managers can grow non-host species such as red alder, western redcedar, western hemlock and Sitka spruce in efforts to reduce damage from SNC. However, it should be noted that if Douglas-fir have more than three years of foliage on the branches, then loss impacts are likely minimal to none. Acknowledgements: Funding for the SNC survey was provided by the Quinault Indian Nation. The survey was conducted by the Washington DNR and the Washington Department of Fish and Wildlife.
For information on the Swiss Needle Cast Cooperative, visit: http://sncc.forestry.oregonstate.edu/
Figure 54. Swiss needle cast aerial survey results , western Washington, 2012 (left) and 2015 (right). Yellow polygons are areas mapped with moderate SNC symptoms. Red polygons are areas mapped with severe SNC symptoms. Maps by: Amy Ramsey, Washington DNR
2015 SNC survey 18,500 - severe AC 331,000 - moderate AC
2012 SNC survey 6,500 - severe AC 222,000 - moderate AC
31
Sphaeropsis (Diplodia) Tip Blight Sphaeropsis sapinea (Fr.:Fr.) Dyko & Sutton
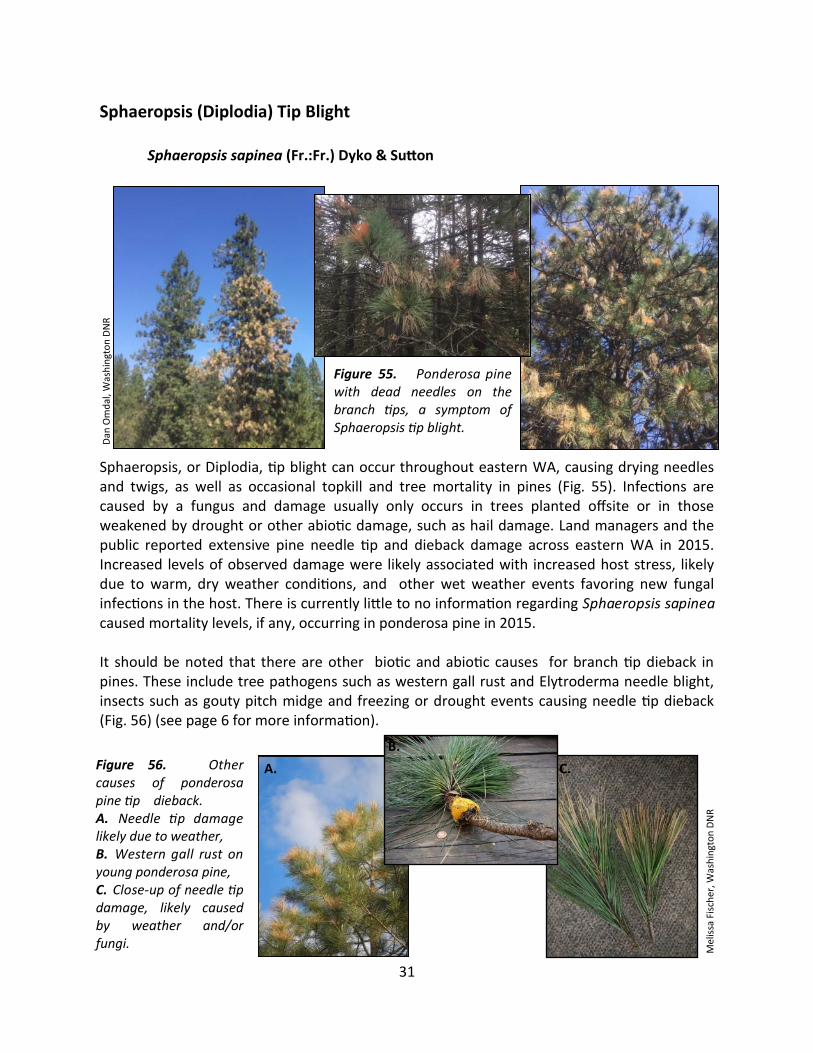
Sphaeropsis, or Diplodia, tip blight can occur throughout eastern WA, causing drying needles and twigs, as well as occasional topkill and tree mortality in pines (Fig. 55). Infections are caused by a fungus and damage usually only occurs in trees planted offsite or in those weakened by drought or other abiotic damage, such as hail damage. Land managers and the public reported extensive pine needle tip and dieback damage across eastern WA in 2015. Increased levels of observed damage were likely associated with increased host stress, likely due to warm, dry weather conditions, and other wet weather events favoring new fungal infections in the host. There is currently little to no information regarding Sphaeropsis sapinea caused mortality levels, if any, occurring in ponderosa pine in 2015. It should be noted that there are other biotic and abiotic causes for branch tip dieback in pines. These include tree pathogens such as western gall rust and Elytroderma needle blight, insects such as gouty pitch midge and freezing or drought events causing needle tip dieback (Fig. 56) (see page 6 for more information).
Dan
Om
dal
, Was
hin
gto
n D
NR
Figure 55. Ponderosa pine with dead needles on the branch tips, a symptom of Sphaeropsis tip blight.
Mel
issa
Fis
che
r, W
ash
ingt
on
DN
R
Figure 56. Other causes of ponderosa pine tip dieback. A. Needle tip damage likely due to weather, B. Western gall rust on young ponderosa pine, C. Close-up of needle tip damage, likely caused by weather and/or fungi.
A.
B.
C.
32
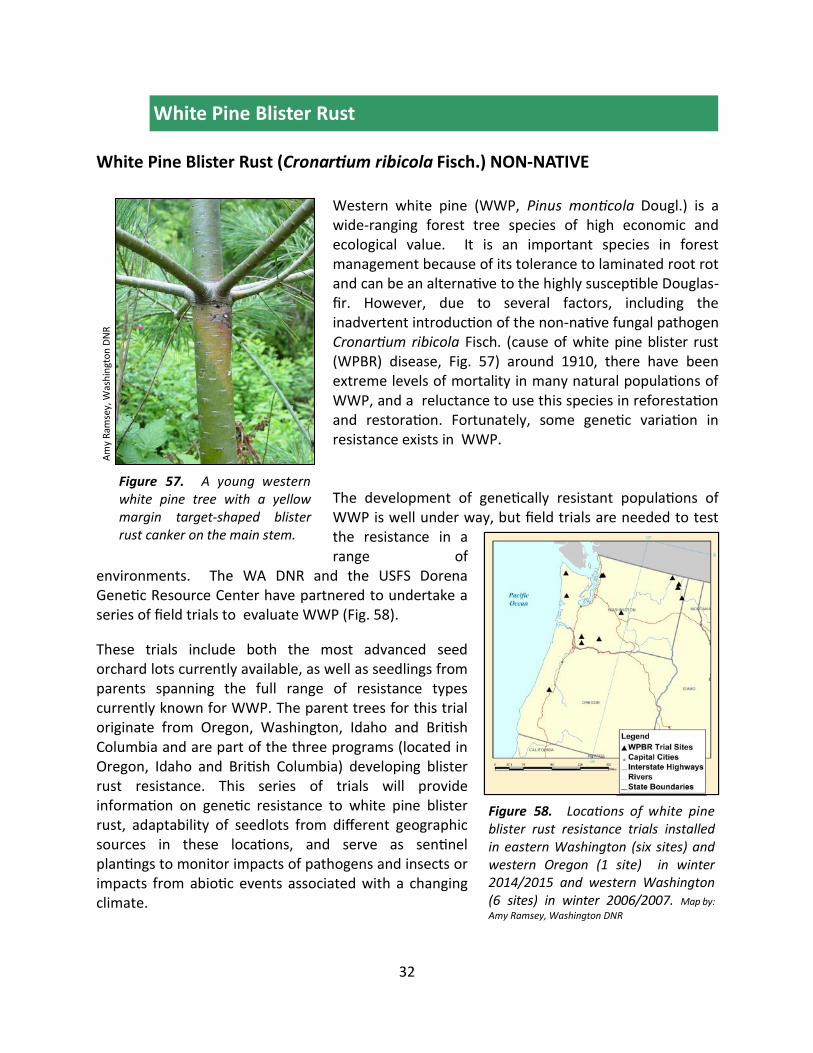
White Pine Blister Rust (Cronartium ribicola Fisch.) NON-NATIVE
Western white pine (WWP, Pinus monticola Dougl.) is a wide-ranging forest tree species of high economic and ecological value. It is an important species in forest management because of its tolerance to laminated root rot and can be an alternative to the highly susceptible Douglas-fir. However, due to several factors, including the inadvertent introduction of the non-native fungal pathogen Cronartium ribicola Fisch. (cause of white pine blister rust (WPBR) disease, Fig. 57) around 1910, there have been extreme levels of mortality in many natural populations of WWP, and a reluctance to use this species in reforestation and restoration. Fortunately, some genetic variation in resistance exists in WWP.
The development of genetically resistant populations of WWP is well under way, but field trials are needed to test the resistance in a range of
environments. The WA DNR and the USFS Dorena Genetic Resource Center have partnered to undertake a series of field trials to evaluate WWP (Fig. 58).
These trials include both the most advanced seed orchard lots currently available, as well as seedlings from parents spanning the full range of resistance types currently known for WWP. The parent trees for this trial originate from Oregon, Washington, Idaho and British Columbia and are part of the three programs (located in Oregon, Idaho and British Columbia) developing blister rust resistance. This series of trials will provide information on genetic resistance to white pine blister rust, adaptability of seedlots from different geographic sources in these locations, and serve as sentinel plantings to monitor impacts of pathogens and insects or impacts from abiotic events associated with a changing climate.
White Pine Blister Rust
Figure 58. Locations of white pine blister rust resistance trials installed in eastern Washington (six sites) and western Oregon (1 site) in winter 2014/2015 and western Washington (6 sites) in winter 2006/2007. Map by:
Amy Ramsey, Washington DNR
WPBR Trial Sites Capital Cities Interstate Highways Rivers State Boundaries
LEGEND
Am
y R
amse
y, W
ash
ingt
on
DN
R
Figure 57. A young western white pine tree with a yellow margin target-shaped blister rust canker on the main stem.
33
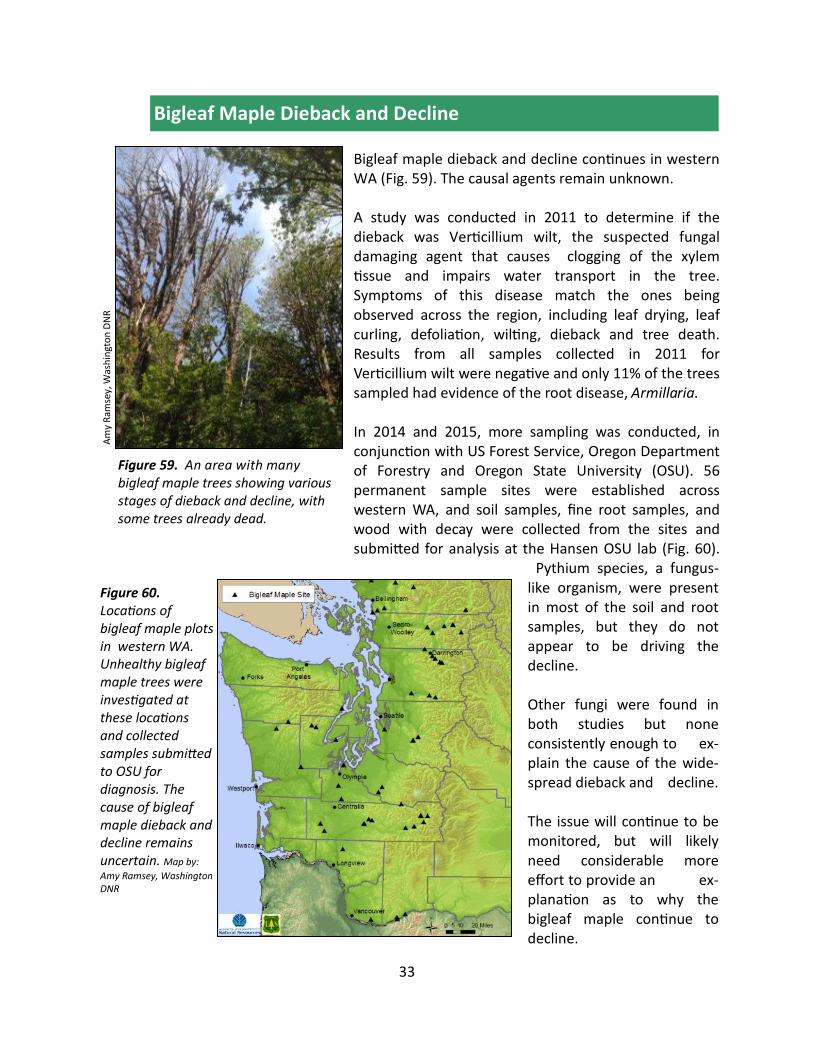
Bigleaf maple dieback and decline continues in western WA (Fig. 59). The causal agents remain unknown. A study was conducted in 2011 to determine if the dieback was Verticillium wilt, the suspected fungal damaging agent that causes clogging of the xylem tissue and impairs water transport in the tree. Symptoms of this disease match the ones being observed across the region, including leaf drying, leaf curling, defoliation, wilting, dieback and tree death. Results from all samples collected in 2011 for Verticillium wilt were negative and only 11% of the trees sampled had evidence of the root disease, Armillaria. In 2014 and 2015, more sampling was conducted, in conjunction with US Forest Service, Oregon Department of Forestry and Oregon State University (OSU). 56 permanent sample sites were established across western WA, and soil samples, fine root samples, and wood with decay were collected from the sites and submitted for analysis at the Hansen OSU lab (Fig. 60).
Pythium species, a fungus-like organism, were present in most of the soil and root samples, but they do not appear to be driving the decline. Other fungi were found in both studies but none consistently enough to ex-plain the cause of the wide-spread dieback and decline. The issue will continue to be monitored, but will likely need considerable more effort to provide an ex-planation as to why the bigleaf maple continue to decline.
Bigleaf Maple Dieback and Decline
Figure 60. Locations of bigleaf maple plots in western WA. Unhealthy bigleaf maple trees were investigated at these locations and collected samples submitted to OSU for diagnosis. The cause of bigleaf maple dieback and decline remains uncertain. Map by:
Amy Ramsey, Washington DNR
Am
y R
amse
y, W
ash
ingt
on
DN
R
Figure 59. An area with many bigleaf maple trees showing various stages of dieback and decline, with some trees already dead.
34
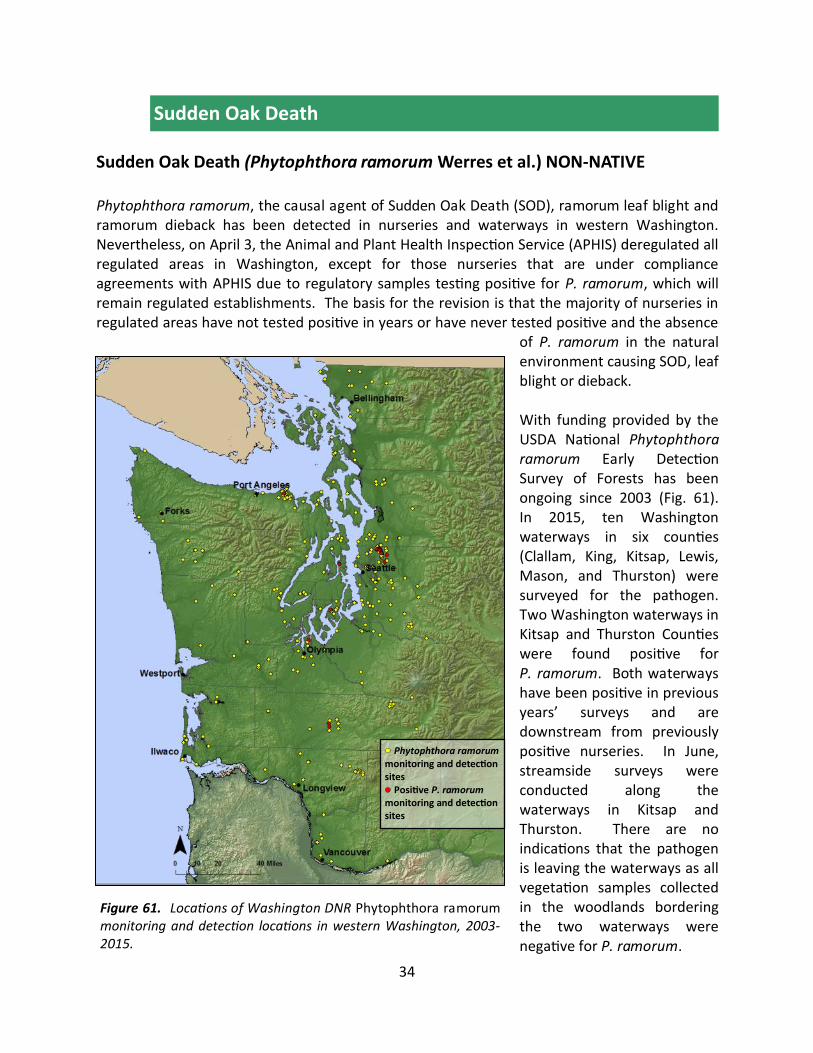
Sudden Oak Death (Phytophthora ramorum Werres et al.) NON-NATIVE Phytophthora ramorum, the causal agent of Sudden Oak Death (SOD), ramorum leaf blight and ramorum dieback has been detected in nurseries and waterways in western Washington. Nevertheless, on April 3, the Animal and Plant Health Inspection Service (APHIS) deregulated all regulated areas in Washington, except for those nurseries that are under compliance agreements with APHIS due to regulatory samples testing positive for P. ramorum, which will remain regulated establishments. The basis for the revision is that the majority of nurseries in regulated areas have not tested positive in years or have never tested positive and the absence
of P. ramorum in the natural environment causing SOD, leaf blight or dieback. With funding provided by the USDA National Phytophthora ramorum Early Detection Survey of Forests has been ongoing since 2003 (Fig. 61). In 2015, ten Washington waterways in six counties (Clallam, King, Kitsap, Lewis, Mason, and Thurston) were surveyed for the pathogen. Two Washington waterways in Kitsap and Thurston Counties were found positive for P. ramorum. Both waterways have been positive in previous years’ surveys and are downstream from previously positive nurseries. In June, streamside surveys were conducted along the waterways in Kitsap and Thurston. There are no indications that the pathogen is leaving the waterways as all vegetation samples collected in the woodlands bordering the two waterways were negative for P. ramorum.
Sudden Oak Death
Figure 61. Locations of Washington DNR Phytophthora ramorum monitoring and detection locations in western Washington, 2003-2015.
Towns and Cities Phytophthora ramorum monitoring and detection sites, 2003- 2015. Positive P. ramorum aquatic monitoring sites, 2003-2015.
Phytophthora ramorum monitoring and detection sites
Positive P. ramorum monitoring and detection sites
35
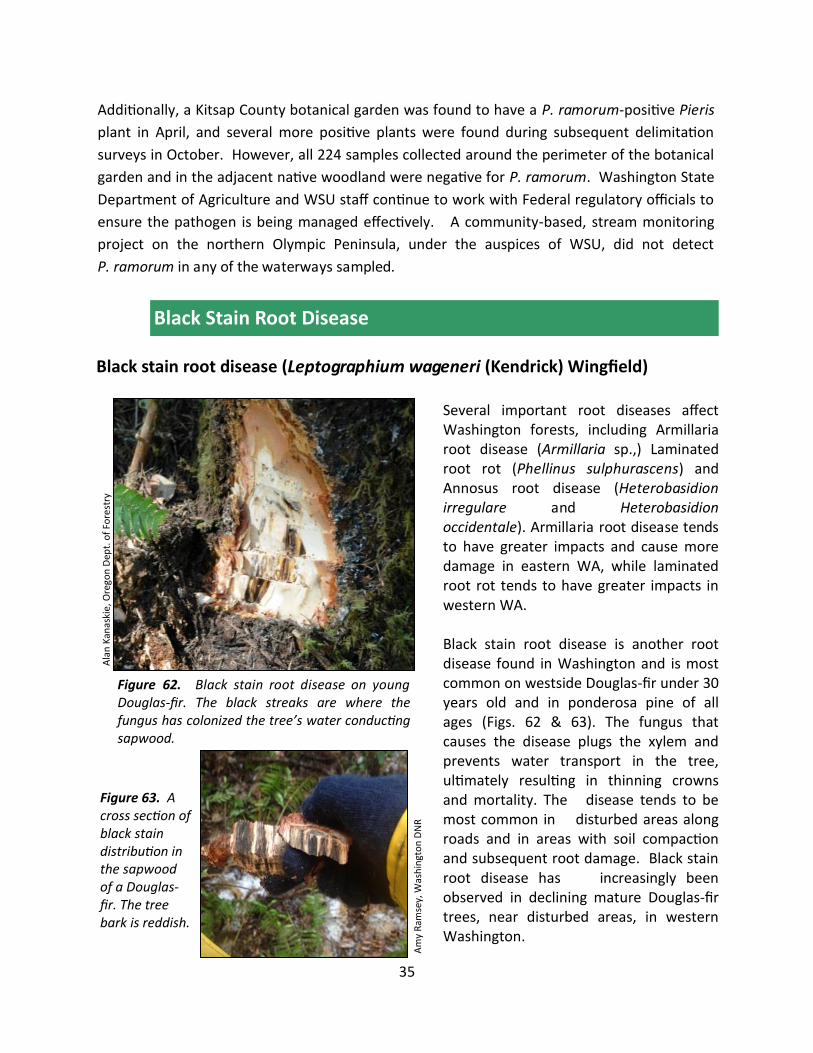
Black stain root disease (Leptographium wageneri (Kendrick) Wingfield)
Several important root diseases affect Washington forests, including Armillaria root disease (Armillaria sp.,) Laminated root rot (Phellinus sulphurascens) and Annosus root disease (Heterobasidion irregulare and Heterobasidion occidentale). Armillaria root disease tends to have greater impacts and cause more damage in eastern WA, while laminated root rot tends to have greater impacts in western WA. Black stain root disease is another root disease found in Washington and is most common on westside Douglas-fir under 30 years old and in ponderosa pine of all ages (Figs. 62 & 63). The fungus that causes the disease plugs the xylem and prevents water transport in the tree, ultimately resulting in thinning crowns and mortality. The disease tends to be most common in disturbed areas along roads and in areas with soil compaction and subsequent root damage. Black stain root disease has increasingly been observed in declining mature Douglas-fir trees, near disturbed areas, in western Washington.
Black Stain Root Disease
Figure 62. Black stain root disease on young Douglas-fir. The black streaks are where the fungus has colonized the tree’s water conducting sapwood.
Ala
n K
anas
kie,
Ore
gon
Dep
t. o
f Fo
rest
ry
Figure 63. A cross section of black stain distribution in the sapwood of a Douglas-fir. The tree bark is reddish.
Additionally, a Kitsap County botanical garden was found to have a P. ramorum-positive Pieris
plant in April, and several more positive plants were found during subsequent delimitation
surveys in October. However, all 224 samples collected around the perimeter of the botanical
garden and in the adjacent native woodland were negative for P. ramorum. Washington State
Department of Agriculture and WSU staff continue to work with Federal regulatory officials to
ensure the pathogen is being managed effectively. A community-based, stream monitoring
project on the northern Olympic Peninsula, under the auspices of WSU, did not detect
P. ramorum in any of the waterways sampled.
Am
y R
amse
y, W
ash
ingt
on
DN
R
36
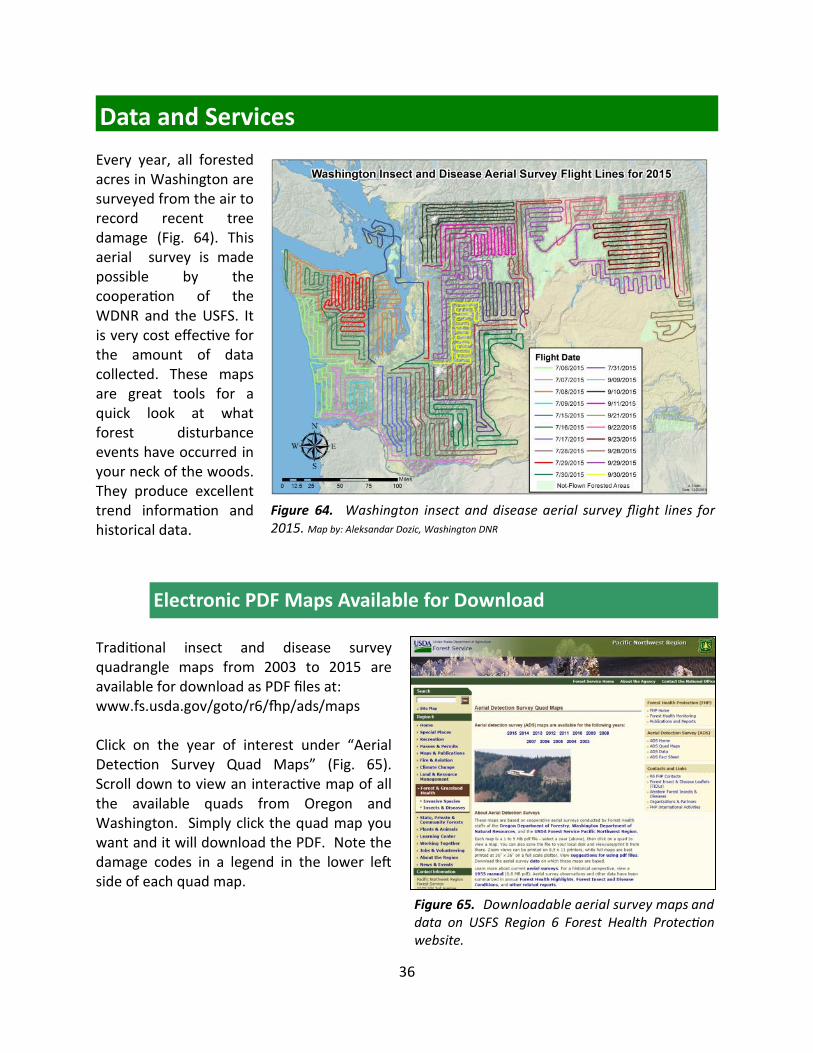
Data and Services
Traditional insect and disease survey quadrangle maps from 2003 to 2015 are available for download as PDF files at: www.fs.usda.gov/goto/r6/fhp/ads/maps Click on the year of interest under “Aerial Detection Survey Quad Maps” (Fig. 65). Scroll down to view an interactive map of all the available quads from Oregon and Washington. Simply click the quad map you want and it will download the PDF. Note the damage codes in a legend in the lower left side of each quad map.
Electronic PDF Maps Available for Download
Every year, all forested acres in Washington are surveyed from the air to record recent tree damage (Fig. 64). This aerial survey is made possible by the cooperation of the WDNR and the USFS. It is very cost effective for the amount of data collected. These maps are great tools for a quick look at what forest disturbance events have occurred in your neck of the woods. They produce excellent trend information and historical data.
Figure 64. Washington insect and disease aerial survey flight lines for 2015. Map by: Aleksandar Dozic, Washington DNR
Figure 65. Downloadable aerial survey maps and data on USFS Region 6 Forest Health Protection website.
37
Forest Health Websites
Washington Forest Health Highlights reports are published annually and include the latest information on exotic pest problems, insect and disease outbreaks and recent forest damage trends for Washington. Recent annual reports, WDNR research and other forest health information are available at: http://www.dnr.wa.gov/ForestHealth Historic annual highlights reports for Oregon and Washington are available at: www.fs.usda.gov/goto/r6/fhp/highlights Major insect and disease identification and management information, illustrations and graphical trend analysis of Pacific Northwest forest health issues are available at: www.fs.usda.gov/goto/r6/fhp
Field Guides
Interactive Map Tool and GIS Data Available for Download
2010 to 2015 annual aerial survey data and the 15-year cumulative mortality data product are available from in Washington DNR’s interactive, web-based mapping site: “Fire Prevention and Fuels Management Mapping” at: https://fortress.wa.gov/dnr/protectiongis/fmanfire/index.html . On the right side of the page, click on “Forest Health”, select “Annual Aerial Survey Data” and the year of interest, then check boxes for type of damage to be displayed. Click on polygons to display agent and intensity. Various basemaps and background layers can be added. Zoom to an area of interest and click the printer icon in the upper right to create a pdf or image file of your map. Washington DNR also maintains downloadable GIS datasets, including aerial survey data for Washington State from 1980 to 2015, known as “Bugs n Crud” at: http://www.dnr.wa.gov/GIS, under “Forest Disturbance.”
The Field Guide to Diseases and Insect Pests of Oregon and Washington Conifers by E. Goheen and B. Willhite, produced by the USDA Forest Service Pacific Northwest Region, is a great reference for anyone wanting to learn more about forest pests in the Pacific Northwest. “Common Tree Diseases of British Columbia” is a field guide that includes many forest diseases found in the Pacific Northwest. It has been available through Natural Resources Canada, Canadian Forest Service at: http://cfs.nrcan.gc.ca/publications?id=4633
Contacts and Additional Information
USDA Forest Service — Forest Health Protection and Monitoring Program 333 SW First Avenue, PO Box 3623, Portland, OR 97208
Aleksandar Dozic Aerial Observer (360) 902-1320 [email protected]
Melissa Fischer Forest Health Specialist (Eastern WA) (509) 684-7474 [email protected]
Chuck Hersey Forest Health Environmental Planner (360) 902-1045 [email protected]
Glenn Kohler Forest Entomologist (360) 902-1342 [email protected]
Dan Omdal Forest Pathologist (360) 902-1692 [email protected]
Amy Ramsey Forest Pathologist (360) 902-1309 [email protected]
Karen Ripley Forest Health Program Manager (360) 902-1691 [email protected]
USDA Forest Service — Wenatchee Service Center Forestry Sciences Laboratory, 1133 N. Western, Wenatchee, WA 98801
Darci Dickinson Forest Entomologist (509) 664-1724 [email protected]
Brennan Ferguson Forest Pathologist (509) 664-9215 [email protected]
Betsy Goodrich Forest Pathologist (509) 664-9223 [email protected]
Connie J. Mehmel Forest Entomologist (509) 664-9213 [email protected]
USDA Forest Service — Westside Service Center Mount Hood National Forest, 16400 Champion Way, Sandy, OR 97055
Kristen Chadwick Forest Pathologist (503) 668-1474 [email protected]
Justin Hof Aerial Observer (503) 668-1646 [email protected]
Holly Kearns Forest Pathologist (503) 668-1475 [email protected]
Ben Smith Aerial Survey Program Manager (503) 668-1761 [email protected]
Beth Willhite Forest Entomologist (503) 668-1477 [email protected]
Greg Filip Regional Forest Pathologist (503) 808-2997 [email protected]
Robbie Flowers Forest Entomologist (503) 808-2674 [email protected]
Zack Heath GIS Analyst (503) 668-1459 [email protected]
Alison Nelson Forest Health Monitoring Program (503) 808-2662 [email protected]
Iral Ragenovich Regional Forest Entomologist (503) 808-2915 [email protected]
Karl Dalla Rosa Director, Forest Health Protection (503) 808-2913 [email protected]
If you have questions about forest insect and disease activity in Washington, please contact one of these regional or field offices:
Washington Department of Natural Resources — Forest Health Program 1111 Washington St SE, PO Box 47037, Olympia, WA 98504-7037