forest of dean 2014 - wordpress.com · by the five business sectors. ... to recoup the full...
TRANSCRIPT
11
The Economic Impact of Gloucestershire’s Visitor Economy 2014
Forest of Dean district
Produced on behalf of the Wye Valley and Forest of Dean Tourism AssociationByThe South West Research Company Ltd
January 2016

22
Contents
Page
Introduction 3
Forest of Dean district data 4
Gloucestershire county data 18

33
Introduction
This report examines the volume and value of tourism and the impact of visitor expenditure on the local economy in Forest of Dean district and Gloucestershire county in 2014. Comparisons are also provided to other Gloucestershire districts although it should be noted that Gloucester did not participate in the project.
The figures were derived using the Cambridge Economic Impact Model undertaken by The South West Research Company (TSWRC). The model utilises information from national tourism surveys and regionally/locally based data. It distributes regional activity as measured in those surveys to local areas using ‘drivers’ such as the accommodation stock and occupancy which influence the distribution of tourism activity at local level.
For further information on the Cambridge Model and the terms used in this report please see Appendix 1 which accompanies this report.
For an overview of 2014, including key facts about the economy, weather and key events please see Appendix 2 of this report.
44
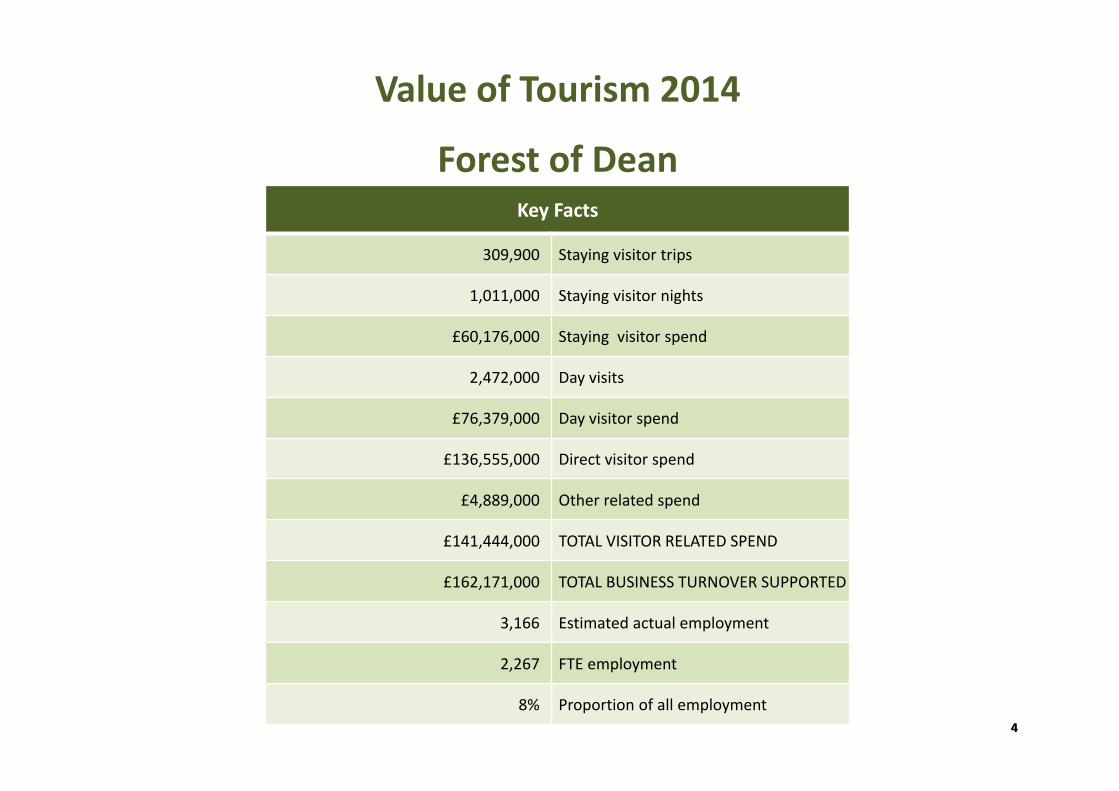
Value of Tourism 2014
Forest of DeanKey Facts
309,900 Staying visitor trips
1,011,000 Staying visitor nights
£60,176,000 Staying visitor spend
2,472,000 Day visits
£76,379,000 Day visitor spend
£136,555,000 Direct visitor spend
£4,889,000 Other related spend
£141,444,000 TOTAL VISITOR RELATED SPEND
£162,171,000 TOTAL BUSINESS TURNOVER SUPPORTED
3,166 Estimated actual employment
2,267 FTE employment
8% Proportion of all employment

55
Forest of Dean – Staying visits
6
Information on staying visits is derived from the Great Britain Tourism Survey (GBTS) for domestic visitors and from the International Passenger Survey (IPS) for Overseas visitors. The methodology of both surveys has been stable since 2006 allowing for direct comparison between years and the analysis of trend data. Data at a county level is derived from the national surveys for trips, nights and spend but adjusted to account for local data and modelled below this level.

66
Forest of Dean ‐ Staying visits in the county context
Area Domestic trips (000’s)
Overseas trips (000’s)
Domestic nights(000’s)
Overseas nights(000’s)
Domestic spend(millions)
Overseas spend(millions)
Cheltenham 297 51 682 334 £50 £21
Cotswold 477 65 1,258 414 £95 £30
Forest of Dean 269 41 712 299 £41 £19
Stroud 227 39 509 227 £33 £14
Tewkesbury 248 42 557 235 £40 £16
348
542
310266 290
0
100
200
300
400
500
600
Cheltenham Cotswold Forest ofDean
Stroud Tewkesbury
All staying trips
1,016
1,672
1,011
736 792
0
200
400
600
800
1,000
1,200
1,400
1,600
1,800
Cheltenham Cotswold Forest ofDean
Stroud Tewkesbury
All staying nights
£71
£125
£60£47
£55
£0
£20
£40
£60
£80
£100
£120
£140
Cheltenham Cotswold Forest ofDean
Stroud Tewkesbury
All staying spend

77
Forest of Dean ‐ Staying visits by accommodation type
Domestic tourists Trips Nights Spend
Serviced 34,400 64,000 £7,365,000
Self catering 55,800 191,000 £15,849,000
Touring caravans /tents 74,600 220,000 £9,195,000
Static vans/holiday centres 0 0 £0
Group/campus 12,700 38,000 £1,277,000
Paying guest in private homes 0 0 £0
Second homes 1,000 4,000 £162,000
Boat moorings 0 0 £0
Other 1,400 5,000 £408,000
Staying with friends and relatives 88,900 189,000 £6,923,000
Total 268,800 712,000 £41,178,000
Overseas tourists Trips Nights Spend
Serviced 31,900 86,000 £11,154,000Self catering 5,900 101,000 £7,015,000Touring caravans /tents 4,100 16,000 £917,000Static vans/holiday centres 0 2,000 £109,000Group/campus 2,600 29,000 £2,052,000Paying guest in private homes 1,000 31,000 £1,240,000Second homes 1,900 27,000 £1,502,000Boat moorings 0 0 £0Other 2,500 9,000 £608,000Staying with friends and relatives 14,800 114,000 £5,132,000Total 64,700 414,000 £29,730,000
88
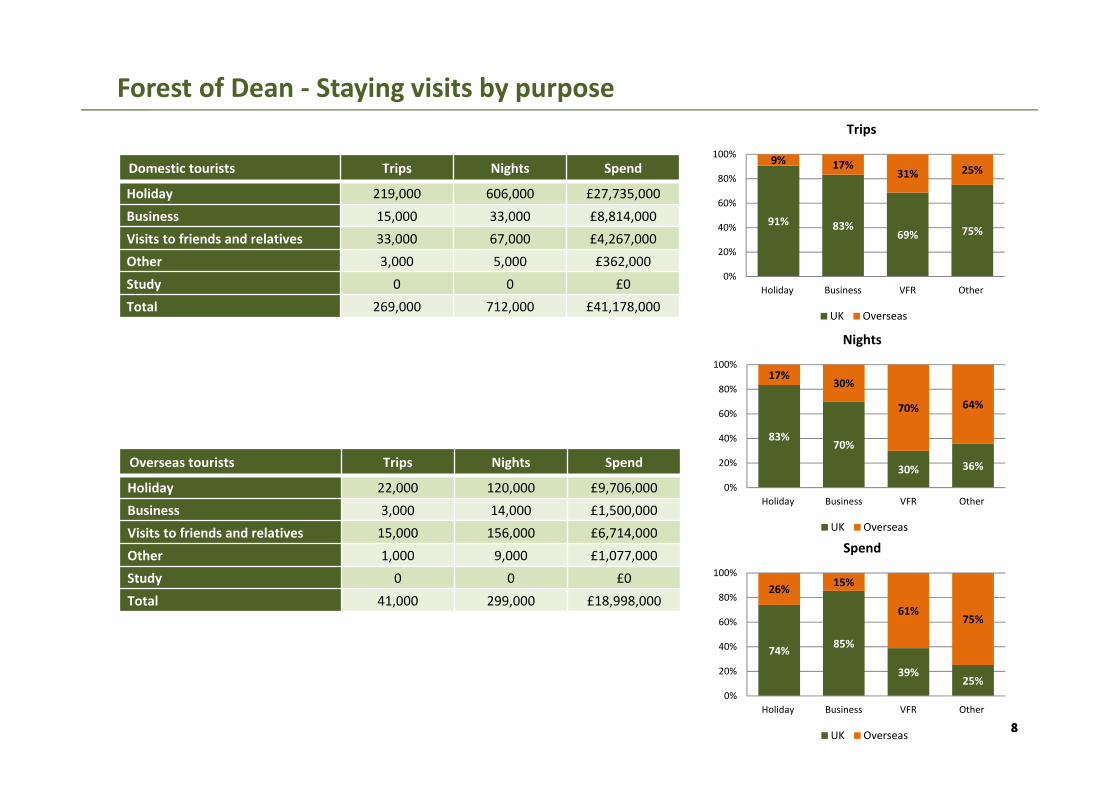
Forest of Dean ‐ Staying visits by purpose
6
Domestic tourists Trips Nights Spend
Holiday 219,000 606,000 £27,735,000Business 15,000 33,000 £8,814,000Visits to friends and relatives 33,000 67,000 £4,267,000Other 3,000 5,000 £362,000Study 0 0 £0Total 269,000 712,000 £41,178,000
Overseas tourists Trips Nights Spend
Holiday 22,000 120,000 £9,706,000Business 3,000 14,000 £1,500,000Visits to friends and relatives 15,000 156,000 £6,714,000Other 1,000 9,000 £1,077,000Study 0 0 £0Total 41,000 299,000 £18,998,000
91% 83%69% 75%
9% 17%31% 25%
0%
20%
40%
60%
80%
100%
Holiday Business VFR Other
Trips
UK Overseas
83%70%
30% 36%
17%30%
70% 64%
0%
20%
40%
60%
80%
100%
Holiday Business VFR Other
Nights
UK Overseas
74% 85%
39%25%
26% 15%
61%75%
0%
20%
40%
60%
80%
100%
Holiday Business VFR Other
Spend
UK Overseas

99
Forest of Dean – Day visits
6
Information on day visits within this report has been derived from the 2014 Great Britain Day Visit Survey (GBDVS). The survey, which was first undertaken in 2011, provides a much needed update on day visit activity in Great Britain and generally speaking estimated greater frequencies of trip taking than the previous day visit survey (England Leisure Visits Survey 2005). As a result of the new methodology in 2011 comparisons with previous day visit estimates are not possible.
The GBDVS distinguishes between day visits to a town or city; to the seaside and coast; and to the countryside. Different drivers are used within the model to distribute these trips. Local ‘drivers’ such as attraction footfall, quality and size of countryside and coastline are factored into the model for this purpose.

1010
Forest of Dean ‐ Day visits in the county context
Area Day visits Day visit spend
Cheltenham 1.9 £69.3
Cotswold 6.8 £203.6
Forest of Dean 2.5 £76.4
Stroud 2.8 £90.8
Tewkesbury 2.0 £63.0
Cheltenham, 12%
Cotswold, 43%
Forest of Dean, 16%
Stroud, 18%
Tewkesbury, 12%
All day visits
Cheltenham, 14%
Cotswold, 40%
Forest of Dean, 15%
Stroud, 18%
Tewkesbury, 13%
All day visit spend

1111
Forest of Dean ‐ Day visits by location
Urban visits, 797,000
Countryside visits,
1,675,000
Day visits
Urban visits, £30,146,000
Countryside visits,
£46,233,000
Day visit spend
Total day visits Total day visit spend
2,472,000 £76,379,000

1212
Forest of Dean ‐ Direct visitor expenditure by category
6
Information on the breakdown of visitor spending is available from the three main tourism and day visitor surveys by type of visitor. The Model divides the expenditure between five sectors:
• Accommodation
• Shopping for gifts, clothes and other goods
• Eating and drinking in restaurants, cafes and inns
• Entry to attractions, entertainment and hire of goods and services
• Transport and travel costs including public transport, purchase of fuel and parking
The following pages look at the breakdown of this expenditure and business turnover arising from this expenditure.
By applying the expenditure breakdown to the estimates of visitor spending the Model generates estimates of total spending by the five business sectors. Visitor expenditure in each sector represents additional turnover for businesses in those sectors. However, evidence from national studies suggests that some minor adjustments are required to match visitor spend to business turnover. In particular, some expenditure on food and drink actually takes place in inns and hotels that fall into the accommodation sector and at attractions. The turnover for each business sector has therefore been adjusted to take account of these marginal changes. More significantly, expenditure on travel costs associated with individual trips is as likely to take place at the origin of the trip as it is at the actual destination. It is therefore assumed that only 60% of total travel expenditure accrues to the destination area.

1313
Forest of Dean – Direct visitor expenditure by category
6
Accommodation• UK staying visitors £15,084,000• Overseas staying visitors £5,378,000
Shopping• UK staying visitors £4,915,000• Overseas staying visitors £5,490,000• Day visitors £22,044,000
Food & drink• UK staying visitors £9,427,000• Overseas staying visitors £4,368,000• Day visitors £32,687,000
Attractions/entertainment• UK staying visitors £4,123,000• Overseas staying visitors £1,843,000• Day visitors £11,223,000
Travel• UK staying visitors £7,629,000• Overseas staying visitors £1,919,000• Day visitors £10,426,000

1414
Forest of Dean – Other visitor related expenditure by category
6
Second Homes£138,000
Visiting friends and relatives (non‐visitor spend)£4,751,000
• Spend on second homes estimates cover rates, maintenance, and replacement of furniture and fittings.
• Additional spending is incurred by friends and relatives as a result of people coming to stay with them.

1515
Forest of Dean – Business turnover
6
Turnover derived from trip expenditure Staying visitor related Day visitor related Total
Accommodation £20,738,000 £654,000 £21,392,000
Retailing £10,301,000 £21,824,000 £32,125,000
Catering £13,381,000 £31,706,000 £45,087,000
Attractions/entertainment £6,208,000 £11,770,000 £17,978,000
Transport £5,729,000 £6,255,000 £11,984,000
Arising from non trip spend £4,889,000 £0 £4,889,000
Total Direct £61,246,000 £72,209,000 £133,455,000
Total business turnover supported by tourism activity Staying visitor related Day visitor related Total
Direct £61,246,000 £72,209,000 £133,455,000
Supplier and income induced £15,111,000 £13,605,000 £28,716,000
Total £76,357,000 £85,814,000 £162,171,000
*Adjustments have been made to recognise that some spending on retail and food and drink will fall within attractions or accommodation establishments. It is assumed that 40% of travel spend will take place at the origin of the trip rather than at the destination.

1616
Forest of Dean – Tourism related employment
6
Having identified the value of turnover generated by visitor spending in each business sector it is possible to estimate the employment associated with that spending.
The use of visitor expenditure to generate job numbers underestimates the number of jobs arising in the attractions/entertainment sector. The underestimate arises because local authorities and voluntary bodies do not always seek to recoup the full operating costs of individual attractions of facilities from entrance charges. Therefore an additional percentage of direct employment is added to the attractions sector estimates to take account of this factor.
This section of the report looks at employment on three levels;
• Direct Jobs ‐ Direct jobs are those in businesses in receipt of visitor spending. For example, jobs supported by visitor spending at a hotel would be direct jobs.
• Indirect Jobs ‐ Indirect employment arises as a result of expenditure by businesses in direct receipt of visitor expenditure on the purchase of goods and services for their businesses. For example, some of the employment at a business supplying food and drink may be supported through the supplies that the business sells to hotels (or any other business in direct receipt of visitor expenditure).
• Induced Jobs ‐ Induced jobs are those that are supported by the spending of wages by employees in direct and indirect jobs. Such spending will be spread across a wide range of service sectors.
Estimates are shown for actual jobs and full time equivalent jobs (FTE’s).

1717
Forest of Dean – Tourism related employment
6
Direct 2,647
Indirect 397
Induced 123
Total 3,166
Direct 1,812
Indirect 348
Induced 108
Total 2,267
Estimated actual employment
Full time equivalent employment (FTE’s)
Direct employment in businesses in receipt of visitor expenditure (FTE’s)
Staying visitor related Day visitor related Total
Accommodation 349 11 360
Retailing 96 204 301
Catering 200 475 675
Attractions/entertainment 109 206 315
Transport 40 43 83
Arising from non trip spend 78 0 78
Total Direct 872 939 1,812

1818
Gloucestershire 2014

1919
Gloucestershire ‐ Key facts at a glance
Total visitor spendUK
£290,000,000Overseas
£116,198,000
Total visitor nights
UK 4,201,000
Overseas 1,775,000
Total staying trips
UK 1,751,000
Overseas 284,000
Total day trip spend£576,313,000
Total day trips17,897,000
Total staying and day trips19,932,000
Friends and relatives spend (non‐visitor)£34,700,000
Second home/holiday accommodation
spend£2,944,000
Total visitor related spend
£1,020,155,000
Total estimated actual employment
25,450(19,066 FTEs)
8%of all employment
Induced employment3,623
Indirect employment 4,820
Direct employment17,007
Total business turnover
£1,431,797,000

2020
Gloucestershire ‐ Staying visits in the regional context
Area Domestic trips (000’s)
Overseas trips (000’s)
Domestic nights(000’s)
Overseas nights(000’s)
Domestic spend(millions)
Overseas spend(millions)
Cornwall 3,912 335 19,821 2,345 £1,117 £138
Devon 5,121 444 19,687 3,120 £1,097 £192
Dorset 3,098 336 11,705 3,069 £682 £183
Former Avon 2,592 701 6,465 4,157 £498 £257
Gloucestershire 1,751 284 4,201 1,775 £290 £116
Somerset 2,303 192 7,631 1,347 £380 £66
Wiltshire 1,471 287 4,099 1,754 £258 £97
4,247
5,565
3,434 3,293
2,0352,495
1,758
0
1,000
2,000
3,000
4,000
5,000
6,000
All staying trips (000’s)
22,16622,807
14,774
10,622
5,9768,978
5,853
0
5,000
10,000
15,000
20,000
25,000
All staying nights (000’s)
£1,255£1,290
£864£755
£406 £447£355
£0
£200
£400
£600
£800
£1,000
£1,200
£1,400
All staying spend (millions)

2121
Gloucestershire ‐ Staying visits by accommodation type
Domestic tourists Trips Nights Spend
Serviced 562,000 1,047,000 £120,147,000Self catering 302,000 1,036,000 £85,758,000Touring caravans /tents 170,000 501,000 £20,953,000Static vans/holiday centres 24,000 96,000 £5,676,000Group/campus 17,000 51,000 £1,711,000Paying guest in private homes 0 0 £0Second homes 8,000 32,000 £1,253,000Boat moorings 9,000 21,000 £961,000Other 10,000 34,000 £2,982,000Staying with friends and relatives 649,000 1,383,000 £50,559,000Total 1,751,000 4,201,000 £290,000,000
Overseas tourists Trips Nights Spend
Serviced 114,000 307,000 £39,839,000Self catering 12,000 207,000 £14,310,000Touring caravans /tents 14,000 53,000 £3,131,000Static vans/holiday centres 0 2,000 £135,000Group/campus 11,000 124,000 £8,789,000Paying guest in private homes 5,000 157,000 £6,198,000Second homes 3,000 41,000 £2,321,000Boat moorings 0 0 £0Other 18,000 62,000 £4,391,000Staying with friends and relatives 107,000 822,000 £37,084,000Total 284,000 1,775,000 £116,198,000

2222
Gloucestershire ‐ Staying visits by purpose
6
Domestic tourists Trips Nights Spend
Holiday 1,254,000 3,208,000 £205,511,000
Business 239,000 503,000 £50,833,000
Visits to friends and relatives 239,000 453,000 £31,025,000
Other 19,000 37,000 £2,631,000
Study 0 0 £0
Total 1,751,000 4,201,000 £290,000,000
Overseas tourists Trips Nights Spend
Holiday 107,000 444,000 £37,643,000
Business 53,000 178,000 £19,332,000
Visits to friends and relatives 108,000 854,000 £38,731,000
Other 9,000 49,000 £6,214,000
Study 7,000 250,000 £14,278,000
Total 284,000 1,775,000 £116,198,000
92% 82%69% 68%
8% 18%31% 32%
100%
0%
20%
40%
60%
80%
100%
Holiday Business VFR Other Study
Trips
UK Overseas
88%74%
35% 43%
12%26%
65% 57%
100%
0%
20%
40%
60%
80%
100%
Holiday Business VFR Other Study
Nights
UK Overseas
85% 72%44%
30%
15% 28%56%
70%100%
0%
20%
40%
60%
80%
100%
Holiday Business VFR Other Study
Spend
UK Overseas

2323
Gloucestershire ‐ Estimated seasonality of staying visits
6
Jan Feb Mar Apr May Jun Jul Aug Sep Oct Nov Dec
UK trips (000's) 68.8 137.6 137.6 172.0 172.0 160.6 217.9 229.4 126.2 179.7 34.4 114.7
OS trips (000's) 10.8 15.8 13.0 22.6 31.2 25.8 40.7 46.9 26.7 21.4 13.7 15.4
Total trips (000's) 79.6 153.5 150.7 194.6 203.2 186.4 258.7 276.3 152.8 201.1 48.1 130.1
Seasonality ‐ trips
Jan Feb Mar Apr May Jun Jul Aug Sep Oct Nov Dec
UK nights (000's) 260.8 344.3 271.3 313.0 396.5 302.6 605.1 671.2 292.1 389.5 73.0 281.7
OS nights (000's) 67.1 90.1 76.2 115.7 162.0 140.1 316.8 352.8 133.8 128.0 77.2 115.1
Total nights (000's) 327.9 434.4 347.4 428.7 558.5 442.6 921.9 1024.0 425.9 517.5 150.3 396.8
Seasonality ‐ nights

2424
Gloucestershire ‐ Estimated seasonality of staying visits
6
Jan Feb Mar Apr May Jun Jul Aug Sep Oct Nov Dec
UK spend (mn's) 8.9 14.5 29.0 17.8 25.7 31.2 48.0 27.1 23.4 27.5 14.5 22.3
OS spend (mn's) 3.6 5.5 4.1 7.5 10.1 11.2 21.2 22.0 9.4 8.5 8.0 5.1
Total spend (mn's) 12.5 20.0 33.1 25.4 35.7 42.4 69.2 49.1 32.8 36.0 22.5 27.4
Seasonality ‐ spend

2525
Gloucestershire ‐ Day visits in the regional context
Cornwall9%
Devon20%
Dorset17%
Former Avon15%
Gloucestershire12%
Somerset15%
Wiltshire12%
Day visitsCornwall10%
Devon20%
Dorset17%
Former Avon16%
Gloucestershire11%
Somerset14%
Wiltshire12%
Day visit spend
Area Day visits (millions) Day visit spend (millions)
Cornwall 14.6 £499.8
Devon 29.8 £1,015.9
Dorset 25.5 £870.8
Former Avon 22.8 £839.3
Gloucestershire 17.9 £576.3
Somerset 22.3 £751.4
Wiltshire 18.1 £646.2

2626
Gloucestershire ‐ Day visits by location
Urban visits, 8,059,000
Countryside visits,
9,838,000
Day visits
Urban visits, £304,780,000
Countryside visits,
£271,533,000
Day visit spend
Total day visits Total day visit spend
17,897,000 £576,313,000

2727
Gloucestershire ‐ Estimated seasonality of day visits
6
Jan Feb Mar Apr May Jun Jul Aug Sep Oct Nov Dec
Urban(000's) 608.8 618.4 1062.9 628.1 560.5 628.1 502.5 753.7 560.5 715.1 695.7 724.7
Rural (000's) 517.8 610.3 536.3 573.3 906.1 1183.5 1220.5 998.6 1054.1 961.6 684.2 591.8
Total (000's) 1126.6 1228.7 1599.2 1201.4 1466.6 1811.6 1723.0 1752.3 1614.5 1676.7 1380.0 1316.5
Seasonality ‐ day visits (000’s)
Jan Feb Mar Apr May Jun Jul Aug Sep Oct Nov Dec
Urban (mn) 19.8 22.3 37.4 22.7 13.6 19.2 14.8 38.2 17.0 34.7 21.6 43.5
Rural (mn) 6.7 11.2 9.5 40.9 29.3 43.1 27.3 28.4 31.2 13.6 17.6 12.7
Total (mn) 26.5 33.6 46.9 63.6 42.9 62.3 42.1 66.6 48.2 48.3 39.2 56.2
Seasonality ‐ day visit spend (millions)
2828
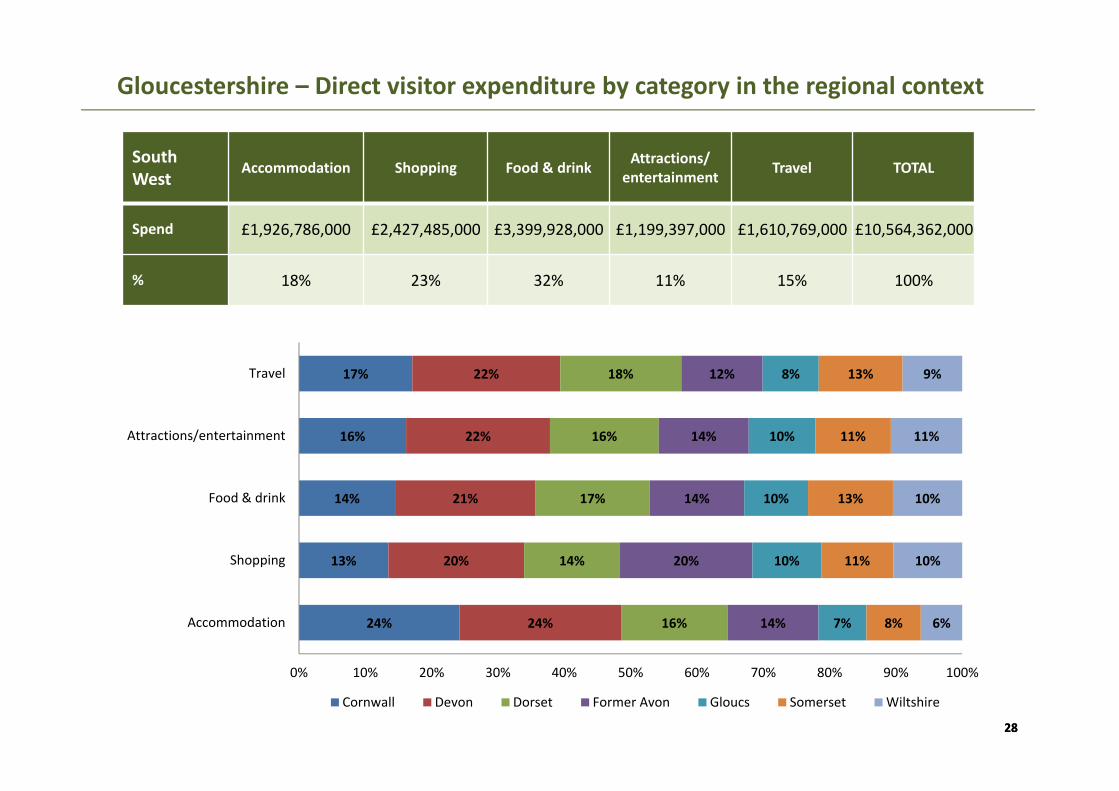
Gloucestershire – Direct visitor expenditure by category in the regional context
24%
13%
14%
16%
17%
24%
20%
21%
22%
22%
16%
14%
17%
16%
18%
14%
20%
14%
14%
12%
7%
10%
10%
10%
8%
8%
11%
13%
11%
13%
6%
10%
10%
11%
9%
0% 10% 20% 30% 40% 50% 60% 70% 80% 90% 100%
Accommodation
Shopping
Food & drink
Attractions/entertainment
Travel
Cornwall Devon Dorset Former Avon Gloucs Somerset Wiltshire
South West
Accommodation Shopping Food & drink Attractions/entertainment Travel TOTAL
Spend £1,926,786,000 £2,427,485,000 £3,399,928,000 £1,199,397,000 £1,610,769,000 £10,564,362,000
% 18% 23% 32% 11% 15% 100%

2929
Gloucestershire – Direct visitor expenditure by category
6
Accommodation• UK staying visitors £105,595,000• Overseas staying visitors £33,513,000
Shopping• UK staying visitors £35,314,000• Overseas staying visitors £32,967,000• Day visitors £185,652,000
Food & drink• UK staying visitors £66,292,000• Overseas staying visitors £25,135,000• Day visitors £239,377,000
Attractions/entertainment• UK staying visitors £29,814,000• Overseas staying visitors £13,415,000• Day visitors £78,202,000
Travel• UK staying visitors £52,986,000• Overseas staying visitors £11,168,000• Day visitors £73,082,000

3030
Gloucestershire – Other visitor related expenditure by category
6
Second Homes£1,934,000
Boats
£1,010,000
Visiting friends and relatives (non‐visitor spend)
£34,700,000
• Spend on second homes estimates cover rates, maintenance, and replacement of furniture and fittings.
• Spend on boats estimates cover berthing charges, servicing and maintenance and upgrading of equipment.
• Additional spending is incurred by friends and relatives as a result of people coming to stay with them.

3131
Gloucestershire – Business turnover
6
Turnover derived from trip expenditure Staying visitor related Day visitor related Total
Accommodation £140,937,000 £4,788,000 £145,725,000
Retailing £67,598,000 £183,796,000 £251,394,000
Catering £88,684,000 £232,196,000 £320,880,000
Attractions/entertainment £44,825,000 £82,452,000 £127,277,000
Transport £38,492,000 £43,849,000 £82,341,000
Arising from non trip spend £37,644,000 £0 £37,644,000
Total Direct £418,180,000 £547,081,000 £965,261,000
Total business turnover supported by tourism activity Staying visitor related Day visitor related Total
Direct £418,180,000 £547,081,000 £965,261,000
Supplier and income induced £226,796,000 £239,740,000 £466,536,000
Total £644,976,000 £786,821,000 £1,431,797,000
*Adjustments have been made to recognise that some spending on retail and food and drink will fall within attractions or accommodation establishments. It is assumed that 40% of travel spend will take place at the origin of the trip rather than at the destination.

3232
Gloucestershire – Tourism related employment in the regional context
6
Area Number of FTE’s
Cornwall 39,336
Devon 48,701
Dorset 35,054
Former Avon 27,279
Gloucestershire 19,066
Somerset 23,777
Wiltshire 20,937
20%
12%13%
8% 8%9%
8%
0%
5%
10%
15%
20%
25%
Cornwall Devon Dorset FormerAvon
Gloucs Somerset Wiltshire
% of all county employment
Cornwall, 18%
Devon, 23%
Dorset , 16%
Former Avon, 13%
Gloucestershire, 9%
Somerset, 11% Wiltshire, 10%
Distribution of tourism related employment (FTE’s)

3333
Direct employment in businesses in receipt of visitor expenditure (FTE’s) Staying visitor related Day visitor related Total
Accommodation 2,116 72 2,188
Retailing 564 1,532 2,096
Catering 1,184 3,100 4,283
Attractions/entertainment 699 1,286 1,985
Transport 239 272 510
Arising from non trip spend 598 0 598
Total Direct 5,399 6,262 11,661
Gloucestershire – Tourism related employment
6
Direct 11,661
Indirect 4,228
Induced 3,178
Total 19,066
Estimated actual employment
Full time equivalent employment (FTE’s)
Direct 17,007
Indirect 4,820
Induced 3,623
Total 25,450