forest product conversion factors for … timber section, geneva, switzerland geneva timber and...
TRANSCRIPT

United Nations Food and Agriculture Organization Economic Commission for Europe of the United Nations
GENEVA TIMBER AND FOREST DISCUSSION PAPER 49
FOREST PRODUCT CONVERSION FACTORS FOR THE UNECE REGION
UNITED NATIONS
UNECE


ECE/TIM/DP/49
Timber Section, Geneva, Switzerland
GENEVA TIMBER AND FOREST DISCUSSION PAPER 49
FOREST PRODUCT CONVERSION FACTORS FOR THE UNECE REGION
UNITED NATIONS Geneva, 2010
United Nations Economic Commission for Europe/ Food and Agriculture Organization of the United Nations
UNECE

Note
The designations employed and the presentation of material in this publication do not imply the expression of any opinion whatsoever on the part of the secretariat of the United Nations concerning the legal status of any country, territory, city or area, or of its authorities, or concerning the delimitation of its frontiers or boundaries.
Abstract
Forest Product Conversion Factors for the UNECE Region provides ratios of raw material input to the output of wood-based forest products for sixteen countries of the UNECE region. Analysts, policymakers, forest practitioners and forest-based manufacturers often have a need for this information when looking into the future of the forest sector via outlook studies, but also for a basic understanding of the drivers of efficiency, feasibility and economics of the sector. The publication includes explanations on the units of measure, the drivers of the ratios, as well as information on physical properties of wood-based forest products. Finally, where reported factors were unavailable, factors from other sources are given.
Keywords
Conversion factors, fibreboard, forest products, house logs, lumber, logs, OSB, particleboard, plywood, panels, pulp and paper, pilings, physical properties, poles, posts, ratio, recovery, roundwood, sawnwood, shakes, shingles, staves, veneer, wood energy, wood particles, wood pellets
UNITED NATIONS PUBLICATION
ISSN 1020 7228
ECE/TIM/DP/49

Forest products conversion factors for the UNECE Region________________________________________________________ iii
Preface
The collection and reporting of conversion factors by UNECE/FAO has been done at least eight times previously; starting in 1963, with the last formal report published in 1987. Given the changes that have occurred in the forest sector since the last report, it was timely of the FAO/UNECE Working Party on Forest Economics and Statistics to request this task.
Two key mandates of the UNECE/FAO Timber Section which use conversion factors are the regular reporting, analysis and dissemination of UNECE region forest products statistics and to conduct periodic assessments of the forest sector outlook within the region. Conversion factors are also important for benchmarking manufacturing efficiency, conducting trade in wood products and analyzing the feasibility of many transactions and business processes.
While it would appear that simply asking countries and practitioners for their list of conversion factors would be a simple process, it is complex as a result of the myriad of measurement unit definitions, utilization standards, measurement procedures, manufacturing practices, and the variability that is inherent in making diverse products from trees, which vary in size, shape, and density.
This report has gone beyond what was done in the past by providing insight into the drivers of product recovery factors and explanations as to why conversion factors vary. Subregional differences in measurement standards and factors have also been pointed to in the hope that further investigation and cooperation will improve harmonization of data and factors. This has a bearing not only on conversion factors, but also on nationally reported forest products statistics.
The report provides analysts, forest practitioners and private enterprises with the most current forest product conversion factors available and a better understanding of the units used in the manufacture, trade and reporting of wood-based forest products. Finally, this report will provide all in the intended audience with a better ability to understand the future outlook for the forest sector, estimate manufacturing efficiency and convert between units of measure within our region.
I express my appreciation to the Task Force, the national experts and the secretariat for this timely publication.
Ján Kubiš Executive Secretary
United Nations Economic Commission for Europe

iv________________________________________________________ Forest products conversion factors for the UNECE Region
Acknowledgements
The secretariat of the UNECE/FAO Timber Section wish to thank all of the members of the Task Force who assisted with this project. The Task Force members are:
Pekka Alajarvi, Stora Enso, Finland Wolfgang Bittermann, Statistik Austria Lars Bjorklund, Swedish Timber Measurement Council* Filip De Jaeger, European Organization of the Sawmill Industry, Belgium Peder Gjerdrum, Norwegian Forest and Landscape Institute* Peter Ince, United States Department of Agriculture, Forest Service, United States of America* Romain Jacques, Natural Resources Canada* Dmitriy Katkov, Russian Federal Forest Agency Eric Kilby, Confederation of European Paper Industries, Belgium* Arvydas Lebedys, Food and Agriculture Organization of the United Nations, Italy Nico Leek, Probos, Netherlands* Udo Mantau, University of Hamburg, Germany Eoin O'Driscoll, Council for Forest Research and Development, Ireland* Tatiana Pasi, Swiss Federal Office for the Environment, Switzerland* Susan Phelps, Natural Resources Canada Juan Picos Martin, Monte Industria, Spain* Peter Schwarzbauer, University of Natural Resources and Applied Life Sciences, Austria* Henry Spelter, United States Department of Agriculture, Forest Service, United States of America* Roman Svitok, National Forest Centre, Slovakia* Michal Synek, Forest Management Institute, Czech Republic* Alain Thivolle-Cazat, Institut Technique Forêt Cellulose Bois-Construction Ameublement, France* Erkki Verkasalo, Finnish Forest Research Institute* Darius Vizlenskas, State Forest Service, Lithuania* Sheila Ward, Forestry Commission, United Kingdom* Holger Weimar, Federal Research Institute for Rural Areas, Forestry and Fisheries, Germany* Adrian Whiteman, Food and Agriculture Organization of the United Nations, Italy Note: *Indicates that this Task Force member also filled in the questionnaire for their country, or for a sector within a country that their organization represents.
The work of the Task Force and the production of this publication were supported by the following members of the Geneva-based UNECE/FAO Timber Section:
Douglas Clark Matt Fonseca Alex McCusker Ed Pepke Christopher Prins Florian Steierer Many thanks to all of the people listed above for their contribution of time and expertise. Anyone having relevant information on forest products conversion factors, which could be used to improve future revisions of this publication are invited to contact the UNECE/FAO Timber Section.
Matt Fonseca, Project Leader UNECE/FAO Timber Section
Trade and Timber Division United Nations Economic Commission for Europe
Palais des Nations CH-1211 Geneva 10 Switzerland
Email: [email protected]

Forest products conversion factors for the UNECE Region_________________________________________________________ v
C O N T E N T S Page
Preface ...................................................................................................................................................... iii Acknowledgements .......................................................................................................................................................iv List of Abreviations ......................................................................................................................................................vii
INTRODUCTION ......................................................................................................................................................1 Conversion factors general use ................................................................................................................................2 Conversion factors use by UNECE/FAO.................................................................................................................2 Methods .......................................................................................................................................3 1. ROUNDWOOD ......................................................................................................................................................4 1.1 Volumetric measurement....................................................................................................................4
1.1.1 Cubic volume.................................................................................................................................4 1.1.2 Board foot log rules .......................................................................................................................6 1.1.3 Stacked measure ............................................................................................................................7
1.2 Weight and physical properties ..........................................................................................................7 1.2.1 Wood density .................................................................................................................................7 1.2.2 Moisture content ............................................................................................................................8 1.2.3 Bark and other unmeasured volume..............................................................................................8
1.3 Summary of country data on roundwood ...........................................................................................9 2. WOOD PARTICLES ....................................................................................................................................................10 2.1 Volumetric measurement..................................................................................................................10 2.2 Weight .....................................................................................................................................10 2.3 Summary of country data on wood particles ....................................................................................11 3. SAWNWOOD ....................................................................................................................................................12 3.1 Volumetric measurement..................................................................................................................13
3.1.1 Cubic volume...............................................................................................................................13 3.1.2 Board foot volume .......................................................................................................................13
3.2 Weight .....................................................................................................................................15 3.3 Material balance ...............................................................................................................................15 3.4 Summary of country data on sawnwood...........................................................................................16 4. VENEER AND PLYWOOD.........................................................................................................................................17 4.1 Volumetric and surface measurement...............................................................................................17 4.2 Weight .....................................................................................................................................17 4.3 Material balance ...............................................................................................................................18 4.4 Summary of country data on veneer and plywood ...........................................................................19 5. PANELS MADE OF WOOD PARTICLES................................................................................................................20 5.1 Volumetric and surface measurement...............................................................................................20 5.2 Weight .....................................................................................................................................20 5.3 Summary of country data on panels made from wood particles .......................................................21 6. WOOD PULP AND PAPER.........................................................................................................................................22 6.1 Weight .....................................................................................................................................22 6.2 Summary of country data on wood pulp and paper ..........................................................................23 7. ROUND AND SPLIT WOOD PRODUCTS...............................................................................................................24 7.1 Volumetric and surface measurement...............................................................................................24 7.2 Weight .....................................................................................................................................24 7.3 Material balance ...............................................................................................................................25 7.4 Summary of country data on round and split wood products ...........................................................25 8. ENERGY WOOD PRODUCTS AND PROPERTIES...............................................................................................26 8.1 Volumetric measurement..................................................................................................................26 8.2 Weight .....................................................................................................................................26 8.3 Energy values ...................................................................................................................................26 8.4 Summary of country data on energy wood products and properties.................................................26 9. REFERENCES ....................................................................................................................................................27 ANNEX ....................................................................................................................................................29
vi________________________________________________________ Forest products conversion factors for the UNECE Region
List of figures Page
1.1 True log volume calculation ...............................................................................................................4 1.2 Log volume comparison between national log scales for log in figure 1.1 ........................................5 1.3 Board foot log rules by small-end diameter class indexed against 1 m3 of B.C. Firmwood...............6 3.1 Example of roundwood to sawnwood factors by state of manufacture ............................................12 3.2 Material balance and sawnwood recovery by small-end diameter ...................................................13 3.2 Material balance in the sawmilling process for coniferous sawnwood.............................................15 3.3 Material balance in the sawmilling process for non-coniferous sawnwood .....................................15 4.1 Material balance and rotary peeled plywood recovery by small-end diameter.................................18 Annex figure 1 Example of wood balance using conversion factors ....................................................30
List of tables Page
1.1 Swedish National Board of Forestry stacked measure guidelines for pulp logs .................................7 1.3 Summary of country data on roundwood ...........................................................................................9 2.3 Summary of country data on wood particles ....................................................................................11 3.1 Board foot actual to nominal sizes and volumes by lumber (sawnwood) product type....................14 3.4 Summary of country data on sawnwood...........................................................................................16 4.4 Summary of country data on veneer and plywood ...........................................................................19 5.3 Summary of country data on panels made from wood particles .......................................................21 6.2 Summary of country data on wood pulp and paper ..........................................................................23 7.4 Summary of country data on round and split wood products ...........................................................25 8.4 Summary of country data on energy wood products and properties.................................................26 Annex tables 1 List of equivalents ............................................................................................................................29 2 Joint Forest Sector Questionnaire Conversion Factors .....................................................................31 3 Conversion factors used in the European Forest Sector Outlook Study 2005. .................................32 4 Country groupings with similar forest product sectors.....................................................................33 5 Conversion factors from ECE/TIM/55 .............................................................................................34

Forest products conversion factors for the UNECE Region________________________________________________________ vii
List of abbreviations
AB Alberta BC British Columbia bf board foot or board feet C Celsius cm centimetre FAO
Food and Agriculture Organization of the United Nations
GOST
Government standard of the Russian Federation
ft foot or feet ft2 square foot gj gigajoule gm gram kl kilolitre kg kilogram lbs pounds m metre m2 square metre m3 cubic metre m3p cubic metre product m3rw cubic metre roundwood m3sw cubic metre of solid wood mbf 1,000 board feet mcd moisture content dry basis mcw moisture content wet basis MDF medium density fibreboard mm millimetre mt metric ton n.a. not applicable NWLRAG Northwest Log Rules Advisory Group ob over bark odmt oven dry metric ton OSB oriented strand-board RW roundwood swe solid wood equivalent ub under bark UNECE
United Nations Economic Commission for Europe
USFS United States Department of Agriculture, Forest Service


Forest products conversion factors for the UNECE Region_________________________________________________________ 1
INTRODUCTION The origins of this paper lie in a workshop, “National Wood Energy Resource Balances”, held in Geneva on 31 March and 1 April 2008. A background paper, Conversion Factors: A Necessity for an Accurate Estimation of Wood Consumption by Industries1 (Thivolle-Cazat, 2008) highlighted the varied approaches to estimating roundwood consumption based on the outputs of wood products, as well as the challenge to convert these varied data into harmonized international units, which may then be compared directly.
The challenge is certainly not new. The Joint FAO/UNECE Working Party on Forest Economics and Statistics has been concerned with the problem of raw material/product conversion factors since the 1950s. It instituted a system of regular monitoring and reporting of national forest product conversion factors. However, the most recent report prior to this one was done in 1987.
The 2008 Joint FAO/UNECE Working Party, meeting immediately after the workshop, mandated the UNECE/FAO Timber Section to lead a cooperative effort to develop accurate conversion factors for the UNECE region as an aid to establishing national and subregional wood balances.
The result was the establishment of a Task Force of national and industry-based experts, which met for the first time on 17-18 June 2008 in Geneva2. This paper describes the method adopted by the Task Force to arrive at a set of conversion factors. It presents the results of its work and then summarizes and compares the conversion factors by products for the countries that responded to a questionnaire enquiry.
The term “forest products conversion factors” is used to cover a broad spectrum of ratios utilized in the wood-based forest resource, manufacturing, and energy sectors. For the purpose of this publication, conversion factor is defined as using a known figure to determine or estimate an unknown figure via a ratio. Often these ratios are exact, for example converting cubic feet to cubic metres (there is exactly 35.315 cubic feet in a cubic metre). Annex table 1 is a listing of some of the exact conversion factors (equivalents) relevant to forest products.
Often ratios are not exact, but rather a good average; for example, a cubic metre (under bark volume) of freshly felled Norway spruce sawlogs may average 860 kg of which 80 kg is bark and 780 kg is wood (with both bark and wood containing a certain amount of moisture), but might vary as a result of wood density, moisture content, the presence or lack of bark, etc.
In other instances, conversion factors may have little meaning unless some of the parameters of the numerator and the denominator of the ratio are known. For example: a cubic metre of logs with an average small end diameter of 15 cm might make 0.41 m3 of sawnwood, while a cubic metre of logs with an average small-end diameter of 60 cm might make 0.63 m3 (50% more), given the same level of processing efficiency in a sawmill. That is not to say that a single factor to convert roundwood to sawnwood cannot be used; it can be done with an accurate factor and when looking at a large population in the aggregate. When looking at a lower level, however, factors that account for various parameters are better suited (e.g. a mill or a subregion that only processes small logs).
Related to forest product conversion factors, is the use of the “material balance” (see annex figure 1). The sawnwood example above could lead to the incorrect assumption that only 41% of the wood fibre in the 15 cm sawlog and 63% of the 60 cm sawlog were utilized. In fact, almost 100% of the wood in each of these logs may have been utilized. The remaining non-sawnwood volume went to several wood residues having other and often distinct uses. For example: a cubic metre of 15 cm sawlogs could have a material balance of 41% sawnwood, 43% chips (raw material for paper, panels, wood energy, etc.), 9% sawdust (for making energy pellets, particleboard, MDF, etc.) and finally 7% shavings (particle board, MDF, animal bedding and wood energy, etc.). The components balance with 100%. Although not part of the material balance, as the log volume was represented as under bark, one might also apply a conversion factor to this scenario to estimate that 80 kg of bark (with moisture) are potentially available from each cubic metre of roundwood (measured under bark) for energy or other uses. Note that material balances are used at a manufacturing plant level, a sector level, or can be constructed to account for the cascading uses of wood raw material in a country, subregion, or region (Mantau, 2008). 1 Available at: www.unece.org/timber/workshops/2008/wood-balance/docs/ConversionFactor_v8.pdf 2 Minutes of the meeting are available at: http://timber.unece.org/fileadmin/DAM/CF_TF_08_Report.pdf

2 ________________________________________________________ Forest products conversion factors for the UNECE Region
Logs and their subsequent products have a predisposition towards inexact conversion factors, as a result of the wide range of shape and form, the variability of physical properties (density, moisture content and shrinkage), and other natural variables that affect conversion factors, such as species, size, defects or provenance. Wood fibre is also hygroscopic, thus its volume and weight change once dried in a kiln or exposed to the atmosphere. In addition, there are external biases that also have to be accounted for, such as differences in measurement procedures which often reflect a unit volume differently than another standard does. Finally, there are differences that occur as a result of product-manufacturing efficiency levels and utilization practices.
Conversion factors general use Conversion factors have long been utilized by the forest sector as a tool for analysing forests and forest products manufacturing facilities. Virtually every aspect of forecasting and analysis in the forest sector is somehow touched by conversion factors. Silvicultural growth models, biomass calculations, carbon sequestered in the forest, timber sale appraisals, to name just a few, are all dependent on conversion factors.
A practical example of this would be a timber sale appraisal that a sawmill is conducting to determine a bid price. The stand volume may be reported in cubic metres over bark but the purchaser may need to convert these volumes into inside bark volumes, weight or board feet3 to match their units of measure. To determine the value of the timber, the purchaser will need to know the cost of getting the timber from the stump to the mill site, thus weight to volume ratios are likely to be an important parameter for determining weight-based transport costs. Primary product recovery will need to be estimated using conversion factors from roundwood to the primary product, e.g., 2 m3 roundwood will produce 1 m3 sawnwood. A material balance will be used to determine the quantity and thus value of the residual products made, and finally, ratios may be used to estimate the quantity of unmeasured products from the timber sale such as bark and logging residue (top-wood, limbs, foliage) which may be profitable to utilize for energy or other purposes.
Analysts have used conversion factors in an effort to try to indicate illegally logged roundwood in the supply chain of manufacturing facilities in a subregion, i.e. when the roundwood removal volume is less than the apparent consumption as determined via conversion factors, it is assumed that the disparity may be made up of illegally logged volume. Additionally, organizations including the Convention on International Trade in Endangered Species (CITES) and others have been looking into the possibility of applying conversion factors to manufactured product volumes as an indication of the harvest level of endangered species such as bigleaf mahogany (CITES, 2008).
Conversion factors covering the input of raw material to output of forest products are a good indication of efficiency levels and thus are often used to benchmark a manufacturing facility’s effectiveness at converting raw materials into finished or semi-finished products.
At a higher level, policy analysts and policymakers may utilize conversion factors to determine the sequestered carbon in the forests of their country. The recent trade disputes and subsequent agreements on sawn softwood between the United States and Canada used conversion factors for comparing stumpage prices between the two countries (World Trade Organization, 2003).
Finally, outlook studies on long-term wood availability depend on conversion factors to predict needed raw materials to match the forecasted demand of wood and paper products.
Conversion factors use by UNECE/FAO To quote directly from Conversion Factors (Raw Material/Product) for Forest Products, (UNECE/FAO, 1987)4: “A major objective of collecting and publishing this information on an international basis is to calculate national and international wood balances, notably in the context of the UNECE/FAO studies of European timber trends and prospects, in order to estimate wood requirements. This information is also of use in the preparation of other national and international studies with a wood balance element.” 3 A board foot is ostensibly the equivalent volume of a board that is 1 inch thick x 1 foot wide x 1 foot long (0.00236 m3). 4 The publication is available at: http://timber.unece.org/fileadmin/DAM/publications/ECE_TIM_55.pdf

Forest products conversion factors for the UNECE Region_________________________________________________________ 3
At the data collection level, conversion factors for the following are also utilized:
1. Where a country has explicitly provided data in non-standard units. Typically this involves a conversion from square metres to cubic metres or from metric tons to cubic metres. Conversion factors from FAO are used for the metric tons to cubic metres. For the square metres to cubic metres conversion of panels, an estimate of the average thickness of the type of panels is needed (see annex table 2), Joint Forest Sector Questionnaire conversion factors sheet).
2. Where it is suspected that data are incorrect. Often the unit value (dividing value of trade of a product by its volume of trade) will indicate that an element is incorrect. Most obviously, plywood and fibreboard data are often reported in square metres rather than cubic metres without this being explicitly stated. Here, a standard unit value (e.g. an average thickness) is applied to convert the area figure into volume.
3. Converting data from other sources to UNECE/FAO standards (e.g. UN Comtrade5 data reported in kilograms). Official trade statistics usually indicate a trade volume in kilograms. Other units are also used but these are often not consistently applied. Thus when extracting data from UN Comtrade, for example, the total of the weight is converted from metric tons to m3 using the FAO standard conversion factors.
Clearly defining units used for harmonization is also an area that has been identified as important for the UNECE/FAO. Not only because it is necessary for obtaining accurate conversion factors, but also for understanding volumes when comparing national statistics, e.g. is a cubic metre of roundwood or sawnwood as reported from one country volumetrically equivalent to that from another country.
Conversion factors were used for the European Forest Sector Outlook Study, which was published in 2005 (UNECE, 2005) (see annex 3 for the conversion factors used). Moreover, forest product conversion factors have been a topic of work by the UNECE/FAO Timber Section on National Wood Resource Balances (March 2008)6.
Methods The Task Force reviewed the current problems with existing conversion factors and finalized the units and definitions as well as the desired factors and balances of the various forest products.
It also categorized the countries of the UNECE region into 19 groups that were expected to have similar conversion factors (annex table 4). This list is intended to be used to fill a void in information from a country by using the data of another country from the same group. Unfortunately, there are some country groupings without a single country represented by responses to this study’s inquiry. In lieu of other sources; annex table 3 includes the conversion factors used for the European Forest Sector Outlook Study 1960-2000-2020: Main Report7 (UNECE/FAO, 2005) and annex table 5 includes the conversion factors from Conversion Factors for Forest Products, (UNECE/FAO, 1987).
A questionnaire was developed8 and distributed to the Task Force members as well as to other national correspondents for collection of national conversion factors. The last of the completed questionnaires was received in January 2010. Sixteen countries and one trade association submitted conversion factors9.
5 The UN Commodity Trade Statistics Database is available at: http://comtrade.un.org/ 6 Documentation from this workshop is available at: www.unece.org/timber/workshops/2008/wood-balance/welcome.htm 7 This table is available at: www.unece.org/timber/efsos/data/conversion-factors.pdf 8 The questionnaire is available at: http://timber.unece.org/fileadmin/DAM/publications/Conversion_factor_questionnaire_v5.xls 9 Austria, Canada, Czech Republic, Finland, France, Germany, Ireland, Lithuania, Netherlands, Norway, Slovakia, Spain, Sweden, Switzerland, United Kingdom, United States of America, and the Confederation of European Paper Industries.

4 ________________________________________________________ Forest products conversion factors for the UNECE Region
1. ROUNDWOOD The conversion factors requested in the questionnaire related to two areas: 1. physical properties; and 2. national method of measuring roundwood as it relates to the “true volume”. Note that true volume of roundwood for the purposes of this publication and for UNECE/FAO statistics on roundwood volume always means under bark volume. Conversion factors for roundwood are often used to convert from one unit of measure to another, e.g., from weight to volume. Additionally, conversion factors within the same units are also quite common, e.g. a cubic metre of roundwood measured by the national standard in one country may be different if measured by the national standard of another country.
Most countries were able to submit data on the conversion factors relating to general physical properties of roundwood. It is important to note that species-specific data was not asked for; data fields were limited to coniferous and non-coniferous, with separate fields for saw and veneer logs, and pulp and energy logs.
Data availability on conversion factors for harmonizing national standards of roundwood measurement to a “true volume” was somewhat limited, (see sections 1.1.1 and 1.1.2).
1.1 Volumetric measurement
1.1.1 Cubic volume
Assessing the volume of roundwood is typically referred to as log scaling. In general, log scales attempt to either predict the displaced volume of the log (cubic log scale), or as is the case in the United States and some regions of Canada, in units of predicted output of sawnwood (board foot log rule).
One of the questions asked in the questionnaire was: “what is the ratio of volume as determined by your national standard to a m3 of true volume?” True volume was defined as the volume as determined using a logical cubic formula (one that approximates the volume of the log form) and unbiased rounding logic. There are a number of different cubic formulas, e.g. Smalian, Huber, Newton, centroid, or two-end conic, most with potential strengths and weaknesses which are dependent on log dimensions and form. All of the aforementioned cubic formulas will give similar results most of the time when measurement conventions are applied uniformly and on logs with typical parameters (figure 1.1). Thus, it is not within the scope of this report to specify a standardized roundwood volume formula. Figure 1.1 is an example of volume calculation using unbiased rounding logic and two different formulas (Smalian and Huber).
Figure 1.1 True log volume calculation
23.2 cm 25.5 cm 28.1 cm
22.7 cm 25.3 cm27.8 cm
Smalian formula: (((23.2+22.7)/2)2+((28.1+27.8)/2)2) x 5.02 x 0.00003927 = 2.58 m3
Huber formula: ((25.5+25.3)/2)2 x 5.02 x 0.00007854 = 2.54 m3
Source: UNECE/FAO, 2009.
Of much greater concern, in terms of harmonizing conversion factors based on national volumes to “true cubic,” is the common practice of truncating (rounding down) diameters and lengths. For example: a log with an actual length of 10.3 metres is recorded as being 10.0 m in length (with 30 cm of unmeasured “trim allowance”); and a log end with a diameter of 27.9 cm is recorded as having a diameter of 27.0 cm.
5.02 m

Forest products conversion factors for the UNECE Region_________________________________________________________ 5
The purpose of truncation should not be construed as a purposeful way of understating volume; it is generally done to make the mathematical calculation easier and to allow the manufacture of products at least as long as the recorded log length.
There are other areas that also create discrepancies between log scales, such as the reduction of volumes for defects vs. not accounting for defect with a volume reduction, but rather using a value reducing mechanism such as log grade. Additionally, some national and subregional log scaling standards treat the log as a cylinder with a diameter of the small-end of the log; assume the log form is a cylinder with the diameter that exists in the middle of the log length; or use assumed taper rates to establish diameters other than the small-end. Additionally, some national standards calculate the over bark volume. All of these differences can lead to variation in roundwood volume (figure 1.2). The figure shows saw/veneer log volumes calculated using thirteen different log scaling standards. Please note that this figure only represents one log and is included as an example of some of the differences that can occur. Logs with different dimensions and characteristics may produce quite different relative results, owing to the degree and points of rounding, as well as the relative size of truncated units, e.g. truncating a diameter of 13.9 cm to 13 will have a more significant impact to the volume on a percentage basis (-12.5%) then would truncating a diameter of 77.9 cm to 77 (-2.3%). While not included in the figure, the log shown in figure 1.1 would have a board foot volume of:
• 30 bf if measured in coastal Alaska, Oregon and Washington, US (Scribner long log rule). • 40 bf if measured in the western US, except as noted above (Scribner short log rule). • 25 bf if measured in the southeast of the US (Doyle log rule). • 50 bf if measured in the northeast of the US (International ¼ inch log rule). • 45 bf if measured in the province of Ontario, Canada (Ontario log rule). • 48 bf if measured in the provinces of New Brunswick or Nova Scotia Canada (New Brunswick log rule). • 54 bf if measured in the province of Newfoundland, Canada (Newfoundland log rule)
Figure 1.2 Log volume comparison between national log scales for log in figure 1.1
0.256 0.267 0.299 0.265 0.287 0.244 0.245 0.270 0.197 0.228 0.286 0.246 0.2500.258 0.2540.1800.1900.2000.2100.2200.2300.2400.2500.2600.2700.2800.2900.300
"True" Smalia
n
"True" Huber
Canada Albert
a
Canada Briti
sh Columbia
FinlandFran
ceIre
land
Germany
Norway
Russia GOST 2708
-75
Sweden
UK Conifer
UK Hardwood
US NWLRAG
US Forest Servic
e
Log
volu
me (
m3 )
-30%-26%-22%-18%-14%-10%-6%-2%2%6%10%14%18%
Diffe
renc
e fro
m "t
rue"
Sm
alian
(%)
Note: Calculated using the log dimensions in figure 1.1 and applying the procedures from the national roundwood measurement standards from the countries or organizations listed. NWLRAG = Northwest Log Rules Advisory Group, GOST 2708-75 is the standard for domestically consumed roundwood in the Russian Federation, UK Conifer = top diameter method, UK Hardwood = mid diameter method.
Source: See references under subsection on roundwood measurement standards (section 9.).
For the purpose of this report, conversion factors using roundwood input are assumed to be based on true volume, which is what was requested in the questionnaire. It is known that many of the countries adjust their national roundwood measurement standard volume to a true volume for reporting, e.g. Finland, Sweden and the United States. This is an area where future study could improve the accuracy, comparability and harmonization of what is often the starting point (the numerator) for many of the forest product conversion factors used.
over
bar
k
over
bar
k
over
bar
k

6 ________________________________________________________ Forest products conversion factors for the UNECE Region
1.1.2 Board foot log rules
In the United States and in Canada there are still regions that use board foot log rules. Most of these rules date from the 19th century and attempt to predict sawnwood as measured in board feet which could be milled from a log. Log rules are either based on diagrams or formulas, with assumptions made as to saw kerf, and slab loss. Except for the International ¼” rule, log segments were considered to be a cylinder having no taper. A US study used a population of 175 logs to model the conversion factors of various board foot rules used in North America and found that the board foot per cubic metre10, for just the Scribner rules (of which there are three subregional variants), ranged, on average, from as little as 108 (9.26 m3/1,000 board feet (mbf)) for logs with a small-end diameter of 4.5 to 7.49 inches to as much as 246 (4.06 m3/mbf) for logs with a small-end diameter over 15.5 inches (Fonseca, 2005). Figure 1.3 shows the conversion in mbf per cubic metre of the British Columbia standard (firmwood method) of measuring roundwood. As these rules do not correlate consistently with cubic volume across all diameters classes, it is necessary to view the ratios as they relate in various diameter groupings.
In the past, many sources of published conversion factors (including those from UNECE/FAO) have used a universal 4.53 m3 per mbf ratio (0.221 mbf/m3) to convert mbf into m3. This ratio dates from at least 1950 (Spelter, 2002) when timber harvest was concentrated on large diameter trees. Additionally, there is substantial subregional variation between the various board foot log rules and in the timber that they are applied to, so a subregional approach would appear to be more appropriate. In Conversion of Board Foot Scaled Logs to Cubic Meters in Washington State 1970-1998 (Spelter, 2002), it was found that the conversion factor from Scribner long log mbf to m3 had changed from about 0.213 mbf/m3 in 1970, to 0.149 mbf in 1998. In the interior of the State (Scribner short log method), the ratio went from 0.208 to 0.169 mbf/m3 during the same period). In the province of Nova Scotia, Canada, 0.177 mbf/m3 is used to convert logs measured with the board foot system to cubic metres. (Nova Scotia Department of Natural Resources, 2001).
Figure 1.3 Board foot log rules by small-end diameter class indexed against 1 m3 of B.C. Firmwood (mbf per m3 BC Firmwood)
0.147
0.138
0.108
0.058
0.159
0.153
0.153
0.124
0.125
0.193
0.194
0.151
0.180
0.225
0.246
0.246
0.215
0.246
0.259
0.194
0.000 0.050 0.100 0.150 0.200 0.250 0.300
Scribner Short (revised)
Scribner Short (notrevised)
Scribner Long Log
Doyle
International 1/4 inch
4.5 - 7.49 inches (11.4 - 19.0 cm)
7.5 - 11.49 inches (19.1 - 29.2 cm)
11.5 - 15.49 inches (29.21 - 39.3 cm)
>15.5 inches (>39.4 cm)
Note: Board foot (bf) log rules indexed in units of 1,000 bf, e.g., 147 BF Scribner Short (revised) (4.5-7-49 inch small end diameter) = 1.0 B.C. Firmwood m3. This analysis is based on a control group of 175 logs. Scribner Short (revised) = revised rule used in California and interior Oregon and Washington; Scribner Short (not revised) = non-revised rule used outside of the Pacific coast states; Scribner Long Log used only in coastal Oregon, Washington, and Alaska; Doyle used primarily in the mid-west and southeast of the US; International ¼ inch used primarily in New England and eastern Canada.
Source: Fonseca, 2005. 10 The roundwood measurement standard of the province of British Columbia, Canada (B.C. Firmwood) was chosen as the index because it has unbiased rounding logic and uniform application of formulas and measurements.
Forest products conversion factors for the UNECE Region_________________________________________________________ 7
1.1.3 Stacked measure
In the case of stacked roundwood, it is often assumed that approximately 66.7% of the displaced volume is wood, 11.5% is bark, and 21.6% is void. (Ontario Ministry of Natural Resources, 2000). In fact the ratio of wood volume can be less than 50% to more than 80% depending on many factors. A guideline to adjust for such factors can be found in Estimation of the Solid Volume Percentage (VMF Nord, 1999) shown in table 1.1, which allows estimation of the solid wood ratio based on visually assessed log attributes.
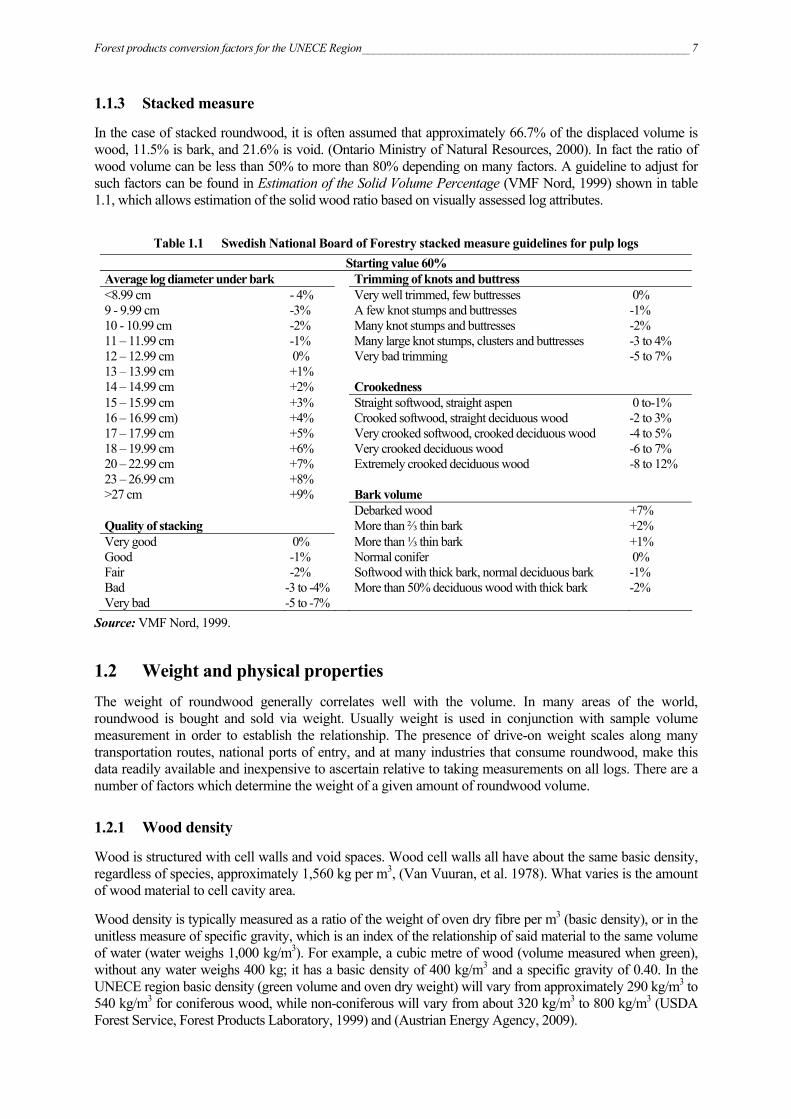
Table 1.1 Swedish National Board of Forestry stacked measure guidelines for pulp logs
Starting value 60% Average log diameter under bark Trimming of knots and buttress <8.99 cm - 4% Very well trimmed, few buttresses 0% 9 - 9.99 cm -3% A few knot stumps and buttresses -1% 10 - 10.99 cm -2% Many knot stumps and buttresses -2% 11 – 11.99 cm -1% Many large knot stumps, clusters and buttresses -3 to 4% 12 – 12.99 cm 0% Very bad trimming -5 to 7% 13 – 13.99 cm +1% 14 – 14.99 cm +2% Crookedness 15 – 15.99 cm +3% Straight softwood, straight aspen 0 to-1% 16 – 16.99 cm) +4% Crooked softwood, straight deciduous wood -2 to 3% 17 – 17.99 cm +5% Very crooked softwood, crooked deciduous wood -4 to 5% 18 – 19.99 cm +6% Very crooked deciduous wood -6 to 7% 20 – 22.99 cm +7% Extremely crooked deciduous wood -8 to 12% 23 – 26.99 cm +8% >27 cm +9% Bark volume Debarked wood +7% Quality of stacking More than ⅔ thin bark +2% Very good 0% More than ⅓ thin bark +1% Good -1% Normal conifer 0% Fair -2% Softwood with thick bark, normal deciduous bark -1% Bad -3 to -4% More than 50% deciduous wood with thick bark -2% Very bad -5 to -7%
Source: VMF Nord, 1999.
1.2 Weight and physical properties The weight of roundwood generally correlates well with the volume. In many areas of the world, roundwood is bought and sold via weight. Usually weight is used in conjunction with sample volume measurement in order to establish the relationship. The presence of drive-on weight scales along many transportation routes, national ports of entry, and at many industries that consume roundwood, make this data readily available and inexpensive to ascertain relative to taking measurements on all logs. There are a number of factors which determine the weight of a given amount of roundwood volume.
1.2.1 Wood density
Wood is structured with cell walls and void spaces. Wood cell walls all have about the same basic density, regardless of species, approximately 1,560 kg per m3, (Van Vuuran, et al. 1978). What varies is the amount of wood material to cell cavity area.
Wood density is typically measured as a ratio of the weight of oven dry fibre per m3 (basic density), or in the unitless measure of specific gravity, which is an index of the relationship of said material to the same volume of water (water weighs 1,000 kg/m3). For example, a cubic metre of wood (volume measured when green), without any water weighs 400 kg; it has a basic density of 400 kg/m3 and a specific gravity of 0.40. In the UNECE region basic density (green volume and oven dry weight) will vary from approximately 290 kg/m3 to 540 kg/m3 for coniferous wood, while non-coniferous will vary from about 320 kg/m3 to 800 kg/m3 (USDA Forest Service, Forest Products Laboratory, 1999) and (Austrian Energy Agency, 2009).

8 ________________________________________________________ Forest products conversion factors for the UNECE Region
When using published averages for calculating the basic density or specific gravity of a species, be careful to note whether the volume was established in the green state (prior to shrinkage) or in the dry state (after shrinkage), as wood volume in the UNECE region will shrink approximately 10% for coniferous species and about 15% for hardwood species when taken from green to a fully dry state. The exact amount of shrinkage will vary from one species to another and even from one sample of the same species to another. In general, basic density based on green volume, which is the standard for this publication unless otherwise noted, has the advantage of being applicable to standing tree volume and roundwood without having to know or estimate volumetric shrinkage.
1.2.2 Moisture content
Freshly cut wood contains large amounts of water, both in the cell cavities (free water) and within the cell walls themselves (bound water). Normally the moisture content is measured in terms of the weight of the moisture relative to the weight of the dry wood fibre. For example, if wood weighs 812 kg/m3 in the green state, and 400 kg m3 in the oven dry state (devoid of moisture), it is said to have 103% moisture content “dry basis” (mcd). In this example the wood had 400 kg of wood and 412 kg of moisture. Therefore, dividing the weight of the moisture by the weight of the dry wood gives the moisture content. Note that freshly cut wood can vary from 30% mcd to more than 200% mcd (USDA Forest Service, Forest Products Laboratory, 1999).
Moisture content can also be reflected via the ratio of moisture weight to the total weight of the wood fibre plus moisture content, which is referred to as moisture content “wet basis” (mcw), but this is typically used for measuring the moisture content of wood particles, wood for energy, and pulp and paper, which will be elaborated upon further in sections 2 and 6. This method is not normally used for solid wood, as the numerator is made up partly by the denominator.
It is also important to note that the moisture content of the wood and bark of many species has distinct seasonal variation. Some species may have little variation, while others may have significantly higher moisture content during the winter and early spring as opposed to the summer and early fall (Thivolle-Cazat, 2008).
Finally, the heartwood of many species, particularly coniferous trees, often have less moisture than the sapwood. Thus, older (generally larger) trees often have a lower weight to volume ratio than that of younger trees (generally smaller) by virtue of the age related increase in the ratio of heartwood to sapwood. Related to this, many species have a higher ratio of bark when young and small vs. old and large, thereby magnifying this trend.
1.2.3 Bark and other unmeasured volume
Bark, like wood, typically contains large amounts of water when fresh. In general, the bark of most species has weight to volume characteristics similar to the wood of the same species. In the UNECE region, the bark of conifers and non-coniferous species ranges from as little as 4% of the total over bark volume (and weight) to as much as 30%. Based on the questionnaire results shown in section 1.3, the percentage of bark averages about 11-12% of the over bark volume. Roundwood weight is normally reported with bark present; however, roundwood volume for UNECE/FAO purposes and many national roundwood measurement standards is reported for wood only, meaning that bark increases the weight to volume ratio of roundwood. Bark is an important source of forest-based energy, as well as having other uses such as decorative ground cover and soil treatment (mulch). Knowing the ratio of bark to roundwood volume is useful in terms of understanding weight ratios, but also for potential energy and other products that can be produced from bark. It is important to note, however, that bark volume typically decreases during handling from forest to mill, so the potential volume as reflected in over bark to under bark volumes are seldom available and highly volatile depending on log handling practices and season (bark loss from handling is generally higher during the spring of the year).
Defects in roundwood, such as unsound fibre (decay), fractures, splits, crooked portions, etc., have weight, but often no volume, when the scaling method calls for a deduction, thus increasing the ratio of weight to volume for roundwood.

Forest products conversion factors for the UNECE Region_________________________________________________________ 9
1.3 Summary of country data on roundwood
Products unit in/ unit out Cz
ech
Repu
blic
Finl
and
Fran
ce
Germ
any
Irelan
d
Neth
erlan
ds
Norw
ay
Slov
akia
Spain
Swed
en
Switz
erlan
d
Unite
d Ki
ngdo
m
Unite
d St
ates
Medi
an
Aver
age
Saw/veneer logs Conifer Green weight with bark kg/m3 940 930 970 810 -- 780 820 940 881 950 900 1 018 1 000 935 912 Wood basic density (dry weight/green m3) kg/m3 434 410 420 405 360 440 400 -- 436 415 440 -- 455 420 420 Volume ratio wood/bark plus wood ub/ob 0.90 0.89 0.87 0.89 0.89 0.81 0.9 0.901 0.87 0.9 -- 0.89 0.88 0.89 0.88 Non-conifer Green weight with bark kg/m3 1 150 1 050 1 130 1 130 -- 910 900 1 180 902 1 050 1 100 1 143 1 086 1 093 1 061 Wood basic density (dry weight/green m3) kg/m3 680 510 560 565 -- 420 500 -- 554 550 625 -- 527 552 549 Volume ratio wood/bark plus wood ub/ob 0.87 0.88 0.88 0.91 -- 0.83 0.85 0.893 0.88 0.88 -- 0.88 0.88 0.88 0.88 Conifer and non-conifer Green weight with bark kg/m3 1 045 935 1 018 865 -- 820 820 1 060 886 950 -- 1 019 1 029 950 950 Wood basic density (dry weight/green m3) kg/m3 557 415 462 432 -- 435 400 461 415 -- 465 435 449 Volume ratio wood/bark plus wood ub/ob 0.89 0.88 0.87 0.89 -- 0.82 0.90 0.90 0.87 0.90 -- 0.89 0.88 0.89 0.88 National m3/”true” m3 m3/m3 -- -- -- -- -- -- 0.975 -- 1.00 -- -- -- 0.94 0.975 0.972
Pulp/fuelwood logs Conifer Green weight with bark kg/m3 940 850 1015 810 -- 780 820 940 882 920 900 1 018 855 891 894 Wood basic density (dry weight/green m3) kg/m3 434 400 407 405 360 440 400 -- 436 400 444 -- 444 407 415 Volume ratio wood/bark plus wood ub/ob 0.9 0.87 0.83 0.89 0.89 0.81 0.9 0.901 0.84 0.9 -- 0.89 0.89 0.89 0.88 Non-conifer Green weight with bark kg/m3 1 150 950 1 090 1 130 -- 910 900 1 180 1 155 970 1 100 1 143 893 1 095 1 048 Wood basic density (dry weight/green m3) kg/m3 680 490 550 565 -- 420 500 -- 620 500 625 -- 471 525 542 Volume ratio wood/bark plus wood ub/ob 0.87 0.86 0.85 0.91 -- 0.83 0.85 0.89 0.85 0.88 -- 0.88 0.89 0.87 0.87 Conifer and non-conifer Green weight with bark kg/m3 1 045 885 1 038 865 -- 820 820 1 060 978 930 -- 1 019 864 930 939 Wood basic density (dry weight/green m3) kg/m3 557 430 450 432 -- 435 400 -- 461 420 -- -- 451 435 448 Volume ratio wood/bark plus wood ub/ob 0.89 0.87 0.84 0.89 -- 0.82 0.9 0.897 0.85 0.9 -- 0.89 0.89 0.89 0.88 National m3/”true” m3 m3/m3 -- -- -- -- -- -- 0.99 -- 1.0 -- -- -- 0.94 0.990 0.977
Source: UNECE/FAO Forest Products Conversion Factor Questionnaire, 2009.

10 _______________________________________________________ Forest products conversion factors for the UNECE Region
2. WOOD PARTICLES Wood particles (chips, sawdust, flakes and shavings), can be measured by volume or by weight (both in the dry state and “as delivered”). All of these products start out as solid wood from logs of varying density, are broken down into somewhat irregular shaped particles, and often contain varied amounts of moisture and void space between the particles.
Conversion factors for wood particles are determined by wood density, moisture content and compaction. In general, large enterprises that produce and use wood particles obtained from many sources, utilize oven dry weight as the unit of choice for measuring wood particles. Enterprises that work with wood particles obtained from fewer and more homogeneous sources might favour the use of volume or weight as delivered. Ultimately, the yield of most manufacturing processes using wood particles as a raw material is driven by the quantity of fibre excluding moisture and void.
Another driver of the yield of wood particles is classification. Often users of wood particles require particles within certain size classifications for the product that they are manufacturing e.g. some pulping processes and OSB. A sawmill or wood-chipping operation may need to remove small particles (fines) from the “on specification” particles, which would result in a lower yield of chips but a higher yield of small particles, which may be classified and marketed as sawdust.
2.1 Volumetric measurement Procedures for establishing the volume of particles is straightforward. Volumes contained in truck-loads, ship-hulls and bins can be easily calculated. Even huge irregularly shaped stockpiles at manufacturing facilities can be measured with surveying equipment to establish volume.
Solid wood equivalent is more complicated, however, as a result of the variation in void space. Wood particles in containers or piles will settle over time and the heavier the particles (due to density or moisture content) and the greater the depth (thus increasing weight), the more compaction will occur.
Based on the data obtained from the questionnaire, the median volume of wood particles per cubic metres of solid wood was 2.83 m3 for coniferous species (meaning that one cubic metre of solid wood will produce wood particles that displace 2.83 cubic metres including void space) and the median number for non-coniferous was 2.74 cubic metres. In Conversion Factors for the Pacific Northwest Forest Industry (Hartman et al, 1981), the following are listed as ratios of m3 loose to m3 solid for wood particles:
• pulp chips (compacted) 2.50
• pulp chips (un-compacted) 2.86
• sawdust 2.50
• planer shavings 4.00
2.2 Weight The weight of wood particles is generally reflected “as delivered” or as an oven dry weight (all moisture removed). The “as delivered” weight can have substantial variability as a result of the moisture content. For example: chips from a sawmill may have 50% mcw (50% of the weight is water and 50% is dry fibre), while a veneer plant, using identical logs for raw material as the sawmill, may produce chips where only 6% (mcw) of the weight is moisture. In this example, the sawmill chips were green, while the veneer chips would have been produced from dried veneer. Based on the questionnaire results, the median ratio of delivered metric tons to oven dried metric tons is 2.0 for conifers (indicating 50% dry fibre, 50% mcw) and 1.79 for non-coniferous (indicating 56% dry fibre and 44% mcw ).

Forest products conversion factors for the UNECE Region________________________________________________________ 11
The normal procedure for establishing oven dry weight of wood particles is via a sampling system. For example:
• if the net weight of a truck load of chips is 32,200 kg;
• a sample of “as delivered” chips is taken, which weighs 922 gm;
• the sample is placed in a vented oven at approximately 103° C for 24 hours, until the weight stabilizes at 497 gm (devoid of moisture);
• the oven dried weight of the sample is divided by the “as delivered” weight and this ratio is multiplied by the “as delivered” net weight of the truck load of chips;
• (497 ÷ 922) x 32,200 = 17,356 kg or 17.356 oven dried metric tons (ODMT)
2.3 Summary of country data on wood particles
unit in/ unit out Cz
ech
Repu
blic
Finl
and
Fran
ce
Germ
any
Irelan
d
Neth
erlan
ds
Norw
ay
Slov
akia
Spain
Swed
en
Switz
erlan
d
Unite
d St
ates
Medi
an
Aver
age
Conifer swe11 to oven dry metric ton m3/odmt 2.41 2.40 2.25 2.47 2.78 -- 2.50 2.44 2.45 2.30 2.25 2.31 2.41 2.41 Avg. delivered metric ton/odmt mt/odmt 2.00 2.00 1.85 -- 2.11 -- 1.80 1.98 -- 2.00 -- 2.15 2.00 1.99 m3 loose to solid m3 m3/m3 2.88 2.55 2.5 -- 2.7 2.86 3.30 3.38 -- 2.70 2.80 3.04 2.83 2.87 Non-conifer swe to oven dry metric ton m3/odmt -- 2.02 2.04 1.77 -- -- 2.10 1.54 2.40 -- 1.60 2.00 2.01 1.93 Avg. delivered metric ton/odmt mt/odmt -- 1.80 1.50 -- -- 1.80 1.57 -- -- -- 1.79 1.79 1.69 m3 loose to solid m3 m3/m3 -- 2.67 2.50 -- -- 3.23 2.86 2.57 -- -- 2.80 -- 2.74 2.77 Conifers and non-conifers swe to oven dry metric ton m3/odmt -- 2.35 2.19 2.31 -- -- 2.46 1.92 2.20 -- -- 2.27 2.27 2.24 Avg. delivered metric ton/odmt mt/odmt -- 2.0 1.75 1.67 -- -- 1.8 1.71 -- -- -- 2.10 1.78 1.84 m3 loose to solid m3 m3/m3 -- 2.65 3.00 2.44 -- 3.23 2.94 2.88 -- -- 2.80 -- 2.88 2.85
Source: UNECE/FAO Forest Products Conversion Factor Questionnaire, 2009.
11 Solid wood equivalent (swe) assumes green volume of wood, prior to any shrinkage. This number will correspond with the wood fibre contained in the product and the roundwood equivalent volume needed to produce the product when there are no losses or wood residues. For example, a cubic metre of green sawnwood will have a cubic metre solid wood equivalent, but it will take more volume of roundwood to produce that cubic metre of sawnwood because of the loss of residual products, such as chips and sawdust. Thus a cubic meter of sawnwood will have a swe of one cubic meter, however, the roundwood input required may be two cubic metres. A cubic meter of particleboard may contain 1.5 cubic meters of solid wood equivalent and use the equivalent of 1.5 cubic meters of roundwood to produce it since there are no losses.

12 _______________________________________________________ Forest products conversion factors for the UNECE Region
3. SAWNWOOD Sawnwood covers a large spectrum of sawn solid wood products. These range from semi-processed cants12, boules and flitches13, which are often still green; to fully edged, dried, trimmed, and planed sawnwood. The state of manufacture, such as boules/flitches vs. dried and planed sawnwood, will have a large impact on the conversion factor, e.g. a cubic metre of roundwood might produce 0.8 cubic metres of green boules and flitches but only half that amount (0.4 m3) of fully dried, edged, grade-trimmed and surfaced (planed) sawnwood. As a result, countries were asked to provide conversion factors for sub-categories of sawnwood products in order to understand why national conversion factors vary so much for sawnwood.
For example, Germany reported that the conversion factor for coniferous sawnwood is 1.67 m3 of roundwood per m3 of sawnwood vs. 2.04 for the United States. On face value, this might lead one to believe that the sawmills in the US are much less efficient than sawmills in Germany (this number indicates that United States mills require 22% more roundwood volume to make the same quantity of sawnwood). Upon further analysis of the sub-categories of sawnwood, however, it is seen that roundwood to sawnwood conversion factors for the sub-product categories such as rough green and surfaced dry are similar between the two countries, which would indicate that what actually differs at what point (state) in the manufacturing process the sawnwood production volume is calculated. It may also be that Germany produces more rough wood (not surfaced by planing) than the United States.
Correspondents from several countries reported that sawnwood production in their countries is measured in the rough green state in order to avoid “double counting” volume, which may be dried, grade trimmed or planed at a separate, off-site facility. This contrasts with other countries, notably the Nordic region and North America, where sawnwood volume is more often tallied and reported in a final state of manufacture. This, for example, can lead to a situation whereby the ratio of roundwood needed (RW factor) to make sawnwood is reported as 1.57 (64% recovery) in the rough green state; or 1.75 (57% recovery) if reported in the rough dry state, or 2.27 (44%) if reported in a fully planed and finished state (figure 3.1).
Figure 3.1 Example of roundwood to sawnwood factors by state of manufacture
Sawmill Dry kiln or yard Planing mill and/or grading chain To customer
Roundwood Loss m3 Rough green in Loss m3 Rough dry in Loss m3 Sawnwood shipped
m3 saw kerfslabs/trim/edge/cull m3
RW factor shrinkage m3
RW factor planing
trim/cull/re-edge m3
RW factor
Softwood (construction) 1.00 0.07 0.29 0.64 1.57 0.03 0.62 1.63 0.08 0.06 0.48 2.08Hardwoods (appearance) 1.00 0.14 0.22 0.64 1.57 0.07 0.57 1.75 0.10 0.03 0.44 2.27
sawdust chips H2o vapour shavings chips
Source: UNECE/FAO, 2009.
Aside from the issue of state of manufacture, there are many other drivers of efficiency that will affect the conversion factor from roundwood to sawnwood. The issue of volumetric measurement will be discussed in section 3.1, but log quality and size have a substantial impact on conversion efficiency, as do differences in how roundwood volume is measured (see section 1.1). In addition, the efficiency of the milling process and the type of products made will affect recovery ratios. Figure 3.2 shows the typical sawnwood product recovery and material balance for dried and planed dimension lumber14 (sawnwood) in North America. Note the substantial improvement in sawnwood recovery as diameter increases. 12 A cant is a semi-processed log with at least one (generally 2 or 4) flat faces (either sawn or chipped) on it. 13 A flitch is sawnwood, which has not yet had the edgings removed, thus the wide face is tapered lengthwise and includes the rounded profile of the log on its edges. A boule is a log manufactured into flitches and stacked together into a unit resembling the original log. 14 Dimension lumber (sawnwood) is a term used in North America to classify sawnwood which is 2 inches or greater in nominal thickness and is for use in applications where structural strength and serviceability are the primary concerns. It is normally produced in lengths from 8-20 feet (in two foot increments) and in widths from 4-12 inches (in two inch increments).

Forest products conversion factors for the UNECE Region________________________________________________________ 13
Figure 3.2 Material balance and sawnwood recovery by small-end diameter
0
10
20
30
40
50
60
70
80
90
100
13 15 18 20 23 25 28 30 33 36 38 41 43 46 48 51 53 56 58 61 64
Small-end diameter of log processed in cm
Perc
ent o
f log
vol
ume
Dry chips
Shavings
Shrinkage
Green chips
Sawdust
Sawnwood
Note: Based on studies at dimension lumber mills in the northwestern US. Green chips are produced in the sawmill, while dry chips come from trimming or edging to remove defects (after the wood is dried).
Source: Fonseca, M. 2005.
3.1 Volumetric measurement
3.1.1 Cubic volume
In most of the UNECE region, outside North America, sawnwood is measured in cubic metric volume. It is generally assumed that volumes are determined based on actual dimensions allowing for a small variation, e.g. ± 2 millimetres (mm). The formula is:
width in millimetres x thickness in millimetres x length in metres ÷ 1,000,000 = m3 sawnwood
It is known that sawnwood is sold in the retail market based on volumes determined by nominal sizes in some areas of Europe. For example: dried and planed lumber that is 45 mm x 95 mm, which might have started out at 50 mm x 100 mm prior to planning, will have its volume reported based on the latter dimensions. Where the ratio of actual to nominal volume is known, e.g. in North America for sawn softwood, production statistics and conversion factors are adjusted to reflect actual volume, however, where they are not known, no adjustments are made.
3.1.2 Board foot volume
In North America sawnwood is usually measured in terms of “board feet”, with a board foot defined as a board one inch (2.54 cm) thick and one foot square (30.48 cm x 30.48 cm), equivalent to 0.00236 m3. Therefore one cubic metre of sawnwood ostensibly equals 424 board feet (bf). This measure arose when sawnwood was commonly sold in a rough, green form. Today, sawn softwood is typically dried and surfaced before sale. To accommodate this, a set of standards allows wood of smaller dimensions to be sold on a nominal basis ignoring the shrinkage and material removed during surfacing. For example dried and planed sawnwood may have the volume calculated based on the nominal dimensions of 2 inches in thickness x 4 inches in width x 96 inches in length (0.0126 m3), while its actual dimensions may be 1.5 inches in thickness x 3.5 inches in width x 92.625 inches in length (0.008 m3).

14 _______________________________________________________ Forest products conversion factors for the UNECE Region
The formula for determining board feet is:
Nominal width in inches x nominal thickness in inches x nominal length in feet ÷ 12 = board feet.
Thus a board that is nominally 2 inches x 4 inches x 8 feet would have 5.333 bf.
When measuring the volume of sawn softwood, the width, thickness and, to a smaller degree, length have nominal measurement allowances. In other words, what nominally is represented as having 1 m3 is often as little as 0.66 m3. Since this is known, it is adjusted for in the conversion factors and the UNECE/FAO Timber Database. Sawn softwood was reported to have an average actualization factor of 0.72, which is 589 bf per m3.
Sawn hardwood in North America has a different set of standards from sawn softwood, and is considered to be truer to the implied 0.00236 m3 per bf (424 bf per m3), thus no actualization factor is used. Often, sawn hardwood is sawn oversize to the nominal thickness, and widths and lengths are based on actual dimensions. Additionally, a significant component of sawn hardwood is produced in the rough state.
The board feet contained in a cubic metre will vary according to the state of manufacture of the sawnwood (e.g. green, dry and rough, or surfaced and dry) and the type of sawnwood manufactured (table 3.1).
Table 3.1 Board foot actual to nominal sizes and volumes by lumber (sawnwood) product type
Nominal Green target size* Dried-planed size Softwood boards
Product Thick
(inches) Width
(inches) bf/m3 Thick
inches Width
(inches) bf/m3 Thick
(inches) Width
(inches) bf/m3 1x4 1 4 424 0.94 3.8 475 0.75 3.5 646 1x6 1 6 424 0.94 5.88 461 0.75 5.5 616 1x8 1 8 424 0.94 7.88 458 0.75 7.25 624 1x10 1 10 424 0.94 9.88 457 0.75 9.25 611 1x12 1 12 424 0.94 11.88 456 0.75 11.25 603 Dimension and studs 2x4 2 4 424 1.75 3.8 510 1.5 3.5 646 2x6 2 6 424 1.75 5.88 495 1.5 5.5 616 2x8 2 8 424 1.75 7.88 492 1.5 7.25 624 2x10 2 10 424 1.75 9.88 491 1.5 9.25 611 2x12 2 12 424 1.75 11.88 489 1.5 11.25 603 Softwood shop 5/4 1.25 actual 424 1.417 actual 374 1.156 actual 458 6/4 1.5 actual 424 1.68 actual 378 1.406 actual 452 7/4 1.75 actual 424 1.878 actual 395 1.594 actual 465 8/4 2 actual 424 2.108 actual 402 1.813 actual 468 9/4 2.25 actual 424 2.404 actual 397 2.094 actual 456 10/4 2.5 actual 424 2.7 actual 392 2.375 actual 446 Hardwood lumber 2/4 0.5 actual 424 0.605 actual 701 0.313 actual 1356 3/4 0.75 actual 424 0.874 actual 485 0.563 actual 753 4/4 1 actual 424 1.142 actual 371 0.813 actual 522 5/4 1.25 actual 424 1.411 actual 375 1.063 actual 499 6/4 1.5 actual 424 1.68 actual 378 1.313 actual 484 7/4 1.75 actual 424 1.882 actual 394 1.5 actual 494 8/4 2 actual 424 2.151 actual 394 1.75 actual 484 9/4 2.25 actual 424 2.487 actual 384 2.063 actual 462 10/4 2.5 actual 424 2.688 actual 394 2.25 actual 471 11/4 2.75 actual 424 2.957 actual 394 2.5 actual 466 12/4 3 actual 424 3.226 actual 394 2.75 actual 462 13/4 3.25 actual 424 3.495 actual 394 3 actual 459 14/4 3.5 actual 424 3.763 actual 394 3.25 actual 456 15/4 3.75 actual 424 4.032 actual 394 3.5 actual 454 16/4 4 actual 424 4.301 actual 394 3.75 actual 452
Note: * Green target sizes are set by the manufacturer based on shrinkage, size control, etc., thus these are reasonable averages. Softwood shop (used as stock to extract cuttings for further manufacture, such as door and window components) and hardwood lumber - widths are based on actual, which is commonly referred to as “random width”.
Source: Western Wood Products Association, 1998; National Hardwood Lumber Association, 1994; Fonseca, 2005.
Forest products conversion factors for the UNECE Region________________________________________________________ 15
3.2 Weight The relationship between weight and volume of sawnwood varies as a result of the basic density, moisture content and shrinkage (see sections 1.2.1 - 1.2.3). The relationship is useful, however, for estimating shipping weight from known volumes, or volumes from known shipping weights. It is also common to estimate this ratio by using the following formula (Briggs, 1994): (basic density ÷ (1-shrinkage)) x (1 + moisture content) For example, to estimate the kilograms per m3 of Scots pine sawnwood coming from a region where it has an average basic density of 400 kg/m3 (volume measured prior to shrinkage), volumetric shrinkage will be about 7.5%, assuming that the sawnwood will be dried to 15% mcd:
(400 ÷ (1-0.075)) x (1 + 0.15) = 497.3 kg/m3
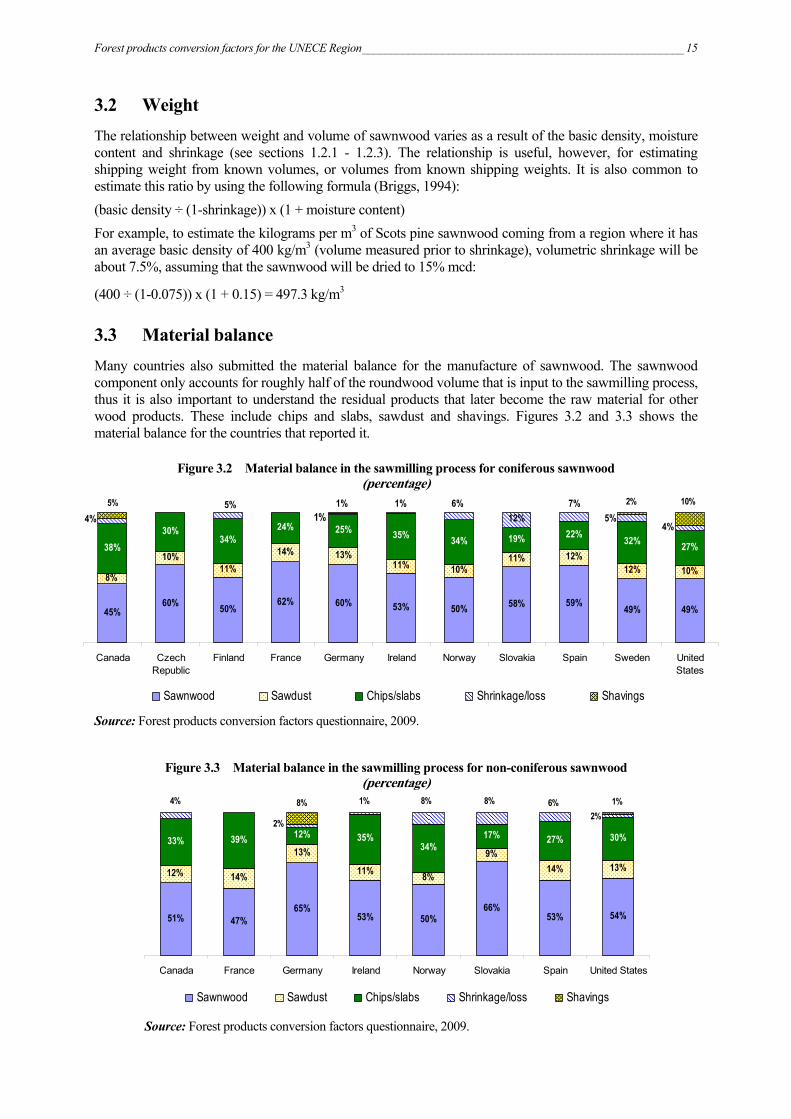
3.3 Material balance Many countries also submitted the material balance for the manufacture of sawnwood. The sawnwood component only accounts for roughly half of the roundwood volume that is input to the sawmilling process, thus it is also important to understand the residual products that later become the raw material for other wood products. These include chips and slabs, sawdust and shavings. Figures 3.2 and 3.3 shows the material balance for the countries that reported it.
Figure 3.2 Material balance in the sawmilling process for coniferous sawnwood (percentage)
10%11%
14% 13%11% 10%
11% 12%12% 10%
38%30%
34%24% 25% 35% 34% 19% 22% 32% 27%
49%49%59%58%50%53%60%45%
60% 50%62%
8%
7%6%4%
5% 1%1%5%
4%12%
10%5% 2%
Canada CzechRepublic
Finland France Germany Ireland Norway Slovakia Spain Sweden UnitedStates
Sawnwood Sawdust Chips/slabs Shrinkage/loss Shavings
Source: Forest products conversion factors questionnaire, 2009.
Figure 3.3 Material balance in the sawmilling process for non-coniferous sawnwood (percentage)
14%
13%
11% 8%
9%14% 13%
33% 39% 12% 35%34%
17% 27% 30%
53%65%
47%51% 50%66%
53% 54%
12%
2%1% 8% 8%
2%
4% 6% 1%8%
Canada France Germany Ireland Norway Slovakia Spain United States
Sawnwood Sawdust Chips/slabs Shrinkage/loss Shavings
Source: Forest products conversion factors questionnaire, 2009.
1%

16 _______________________________________________________ Forest products conversion factors for the UNECE Region
3.4 Summary of country data on sawnwood
unit in/ unit out Au
stria
Cana
da
Czec
h Re
publ
ic
Finl
and
Fran
ce
Germ
any
Irelan
d
Lith
uani
a
Neth
erlan
ds
Norw
ay
Slov
akia
Spain
Swed
en
Unite
d Ki
ngdo
m
Unite
d St
ates
Medi
an
Aver
age
Conifer m3rw/m3p 1.64 2.22 1.67 2.00 1.61 1.67 1.89 2.00 1.67 2.00 1.72 1.69 2.04 2.00 2.04 1.89 1.86 Sawnwood green/rough m3rw/m3p -- -- -- 1.65 1.66 1.89 -- 1.67 1.75 1.54 1.69 -- -- 1.62 1.67 1.68 Sawnwood green planed m3rw/m3p -- -- -- -- -- -- -- -- -- -- -- -- -- 2.00 2.00 2.00 Sawnwood dry/rough m3rw/m3p -- -- 2.00 1.88 -- 1.99 -- -- 2.00 1.72 1.90 2.04 2.00 1.69 1.99 1.91 Sawnwood dry planed m3rw/m3p -- -- -- 2.35 1.97 2.13 -- -- 2.50 -- -- -- -- 2.08 2.13 2.21 Flitches and boules (rough/green) m3rw/m3p -- -- -- 1.18 -- -- -- -- -- 1.33 -- -- -- -- 1.26 1.26 Flitches and boules (rough/dry) m3rw/m3p -- -- -- -- -- -- -- -- -- 1.49 -- -- -- -- 1.49 1.49 Material balance
Sawnwood % 61% 45% 60% 50% 62% 60% 53% 50% 60% 50% 58% 59% 49% 50% 49% 53% 54% Chips/slabs % -- 38% 30% 34% 24% 25% 35% -- -- 34% 19% 22% 32% -- 27% 30% 29% Sawdust % -- 8% 10% 11% 14% 13% 11% -- -- 10% 11% 12% 12% -- 10% 11% 11% Shavings % -- 5% -- -- -- 1% -- -- -- -- -- -- 2% -- 10% 0% 2% Shrinkage loss % -- 4% -- 5% -- 1% 1% -- -- 6% 12% 7% 5% -- 4% 5% 5%
Average sawnwood shipping weight kg/m3 -- -- -- -- -- -- 415 -- -- 440 600 -- -- 549 581 549 517 Non-conifer m3rw/m3p -- 1.96 1.56 1.85 2.13 1.54 1.89 2.10 1.67 2.00 1.52 1.89 1.90 2.50 1.85 1.89 1.88 Sawnwood green/rough m3rw/m3p -- -- -- -- 2.20 1.53 1.89 -- 1.82 2.00 1.54 1.90 -- -- 1.79 1.86 1.83 Sawnwood green planed m3rw/m3p -- -- -- -- -- -- -- -- -- -- -- -- -- -- -- Sawnwood dry/rough m3rw/m3p -- -- -- 1.85 2.59 -- -- -- -- 2.20 1.72 2.10 1.90 2.50 1.92 2.01 2.10 Sawnwood dry planed m3rw/m3p -- -- -- -- 3.23 -- -- -- -- -- -- -- -- -- 2.38 2.81 2.81 Flitches and boules (rough/green) m3rw/m3p -- -- -- -- -- -- -- -- -- 1.40 1.33 -- -- -- -- 1.37 1.37 Flitches and boules (rough/dry) m3rw/m3p -- -- -- -- -- -- -- -- -- 1.70 1.49 -- -- -- -- 1.60 1.60 Material balance
Sawnwood % -- 51% 64% 54% 47% 65% 53% 48% 60% 50% 66% 53% 53% 40% 54% 53% 55% Chips/slabs % -- 33% -- -- 39% 12% 35% -- -- 34% 17% 27% -- -- 30% 32% 28% Sawdust % -- 12% -- -- 14% 13% 11% -- -- 8% 9% 14% -- -- 13% 13% 12% Shavings % -- 0% -- -- -- 8% -- -- -- -- -- -- -- -- 1% 0% 1% Shrinkage loss % -- 4% -- -- -- 2% 1% -- -- 8% 8% 6% -- -- 2% 3% 4%
Average sawnwood shipping weight kg/m3 -- -- -- -- -- -- -- -- -- 550 790 -- -- 699 -- 699 680 Conifers and non-conifers 1.64 2.17 -- 2.00 1.75 1.64 1.89 -- -- 2.00 1.67 1.72 2.00 -- -- 1.75 1.83 Sawnwood green/rough m3rw/m3p -- -- -- -- 1.85 1.64 1.89 -- -- 1.75 1.48 1.75 -- -- -- 1.75 1.73 Sawnwood green planed m3rw/m3p -- -- -- -- -- -- -- -- -- -- -- -- -- -- -- Sawnwood dry/rough m3rw/m3p -- -- -- 2.00 2.09 -- -- -- -- 2.00 1.66 1.94 2.00 -- -- 2.00 1.95 Sawnwood dry planed m3rw/m3p -- -- -- -- 2.61 -- -- -- -- 2.50 -- -- -- -- -- 2.56 2.56 Material balance
Sawnwood % 61% 46% -- 50% 57% 61% 53% -- -- 50% 60% 58% 50% -- -- 55% 54% Chips/slabs % -- 37% -- 34% 29% 23% 35% -- -- 34% 18% 24% -- -- -- 32% 29% Sawdust % -- 8% -- 11% 14% 13% 11% -- -- 10% 11% 12% -- -- -- 11% 11% Shavings % -- 5% -- -- -- 2% -- -- -- -- -- -- -- -- -- 0% 1% Shrinkage loss % -- 4% -- 5% -- 1% 1% -- -- 6% 11% 6% -- -- -- 5% 4%
Ratio of captured bark odmt/ m3rw -- 0.075 -- -- -- 0.037 -- -- -- 0.03 0.1 -- 0.035 -- -- 0.037 0.055
Source: UNECE/FAO Forest Products Conversion Factor Questionnaire, 2009.

Forest products conversion factors for the UNECE Region________________________________________________________ 17
4. VENEER AND PLYWOOD Veneer is produced either by means of a lathe (the log is chucked and rotated against a stationary knife), or sliced, whereby a log is halved or quartered into flitches (sometimes referred to as cants) with a saw; with the flitch then pressed against and moved across a knife. Rotary peeled veneer is often used for producing thicker veneers for structural applications, and sliced veneer is used for producing thinner veneers having decorative uses; however, there are exceptions to this generalization.
Plywood is a composite product manufactured from veneer. It is produced by laminating sheets of veneer together into a panel.
The determiners of veneer and plywood recovery ratios are similar to sawnwood, in that log size and characteristics, product specifications, and milling efficiency have a strong influence.
4.1 Volumetric and surface measurement Veneer and plywood are normally measured via two systems: surface measure, which strictly measures the surface area and does not account for volume (because thickness is not accounted for); and volumetric. Volumetric measure has two distinct variations: straight cubic volume (e.g. thickness x width x length) and surface measure on a thickness basis.
In Europe, veneer and plywood can be measured in square metres 1 mm basis; and in North America, veneer and plywood are often measured in square feet 3/8 inch basis. In other words a sheet of plywood that measures 1.22 m x 2.44 m x 12 mm has 35.72 m2, 1 mm basis, which is easily converted to m3 by dividing by 1,000 (.03572 m3). In North America, this sheet would be measured in imperial measure and would be 4 feet x 8 feet x 0.472 inches which has 40.37 ft2 3/8 inch basis (4 x 8 x [0.472 ÷ 0.375] = 40.37). Note that 0.375 is the decimal equivalent of the 3/8 inch basis thickness. To convert ft2 3/8 inch to cubic volume, divide by 1,130 to get m3, or 32 to get ft3.
Typically, shrinkage has a significant effect on veneer and plywood because of the low moisture content (<6%) that is often initially required.
4.2 Weight Data on conversion factors for weight to volume was limited. Only four countries were able to provide information (see section 4.4). Like sawnwood, a theoretical approach can be used to calculating the weight of veneer (see section 3.2). This approach will work for plywood as well; however, an allowance may be made for the weight of the glue line between the veneer plies. A glue weight of 122 gm per m2 of glue-line surface area should be approximate (United States Department of Agriculture, Forest Service, 1956).
For example: an estimation is needed for the kg per m3 for plywood made from Norway spruce measuring 1.22 m x 244 m x 0.013 m and having five plies (four glue lines). The assumptions are that the wood will have a basic density of 380 kg per m3, the moisture content of the wood will be 8%, and that shrinkage will be 9%.
The weight per m3 of the wood component is calculated as: 380 ÷ (1-0.09) x (1 + 0.08) = panel wood weight of 451 kg/m3.
The volume of the panel is: 1.22 x 2.44 x 0.013 = 0.0387 m3; so the wood weight for the panel is 0.387 x 451 = 17.45 kg.
There are four glue lines, each with a surface area of 2.98 m2; 4 x 2.98 = 11.9 m2 of glue line, so the glue weight per panel is 122 x 11.9 = 1453 gm (1.45 kg); each panel’s glue weighs 1.45 kg glue + 17.45 kg wood = 18.9 kg; weight per m3 is : 18.9 ÷ 0.0387 = 488 kg/m3.

18 _______________________________________________________ Forest products conversion factors for the UNECE Region
4.3 Material balance The material balance for the production of plywood and veneer is interesting in that to varying degrees, other solid wood products are also made during the production of veneer, i.e., sawnwood in the production of sliced veneer and peeler cores15 in the production of rotary peeled veneer. When producing flitches for slicing, sawnwood is often a co-product made from sections of the log that are not suitable for veneer, but are, however, suitable for sawnwood. Additionally, sawnwood is made in the slicing process from the portion of the flitch that is grasped and held by the arm that moves the flitch across the stationary slicing knife. This sawnwood is commonly referred to as backing boards.
Peeler cores, which are a co-product from the manufacture of rotary peeled veneer, are often sold as round wood product e.g. posts for fencing, landscaping, etc.; or they may be chipped. In addition, some peeler cores are large enough to make into sawnwood. Figure 4.1 is an example of typical product recovery and material balance in a North American coniferous rotary plywood mill.
Figure 4.1 Material balance and rotary peeled plywood recovery by small-end diameter
0
10
20
30
40
50
60
70
80
90
100
13 15 18 20 23 25 28 30 33 36 38 41 43 46 48 51 53 56 58 61 64 66 69 71 74 76
Small-end diameter of log processed in cm
Perc
ent o
f log
vol
ume
Dry chips
Shrinkage
Green chips
Peeler core
Veneer
Source: Fonseca, M. 2005.
15 When a log is rotary peeled, it is often held and pivoted by lathe-chucks. In this situation, the minimum diameter limit of the log at which veneer can no longer be peeled is usually controlled by the diameter of the chucks. Thus a lathe chuck which is 8 cm in diameter will result in a peeler core, which is slightly larger in diameter (e.g. 8.5 cm) in order to prevent the veneer knife from coming into contact with the lathe-chucks.
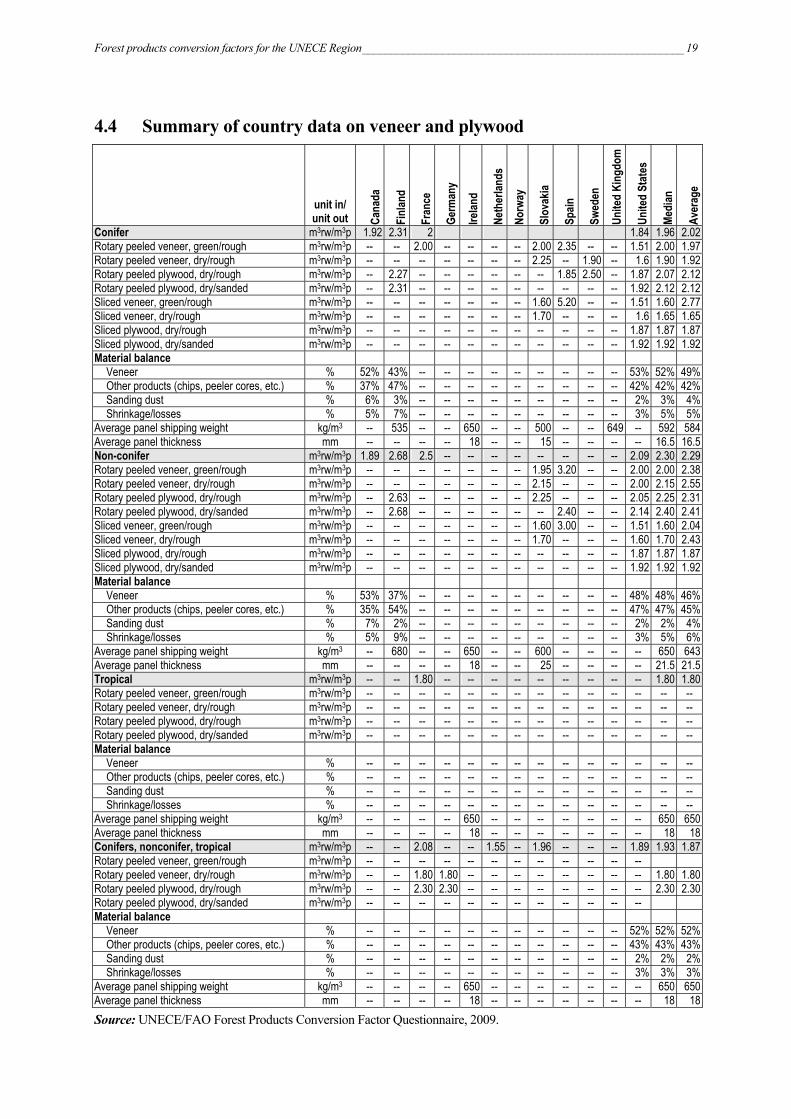
Forest products conversion factors for the UNECE Region________________________________________________________ 19
4.4 Summary of country data on veneer and plywood
unit in/ unit out Ca
nada
Finl
and
Fran
ce
Germ
any
Irelan
d
Neth
erlan
ds
Norw
ay
Slov
akia
Spain
Swed
en
Unite
d Ki
ngdo
m
Unite
d St
ates
Medi
an
Aver
age
Conifer m3rw/m3p 1.92 2.31 2 1.84 1.96 2.02 Rotary peeled veneer, green/rough m3rw/m3p -- -- 2.00 -- -- -- -- 2.00 2.35 -- -- 1.51 2.00 1.97 Rotary peeled veneer, dry/rough m3rw/m3p -- -- -- -- -- -- -- 2.25 -- 1.90 -- 1.6 1.90 1.92 Rotary peeled plywood, dry/rough m3rw/m3p -- 2.27 -- -- -- -- -- -- 1.85 2.50 -- 1.87 2.07 2.12 Rotary peeled plywood, dry/sanded m3rw/m3p -- 2.31 -- -- -- -- -- -- -- -- -- 1.92 2.12 2.12 Sliced veneer, green/rough m3rw/m3p -- -- -- -- -- -- -- 1.60 5.20 -- -- 1.51 1.60 2.77 Sliced veneer, dry/rough m3rw/m3p -- -- -- -- -- -- -- 1.70 -- -- -- 1.6 1.65 1.65 Sliced plywood, dry/rough m3rw/m3p -- -- -- -- -- -- -- -- -- -- -- 1.87 1.87 1.87 Sliced plywood, dry/sanded m3rw/m3p -- -- -- -- -- -- -- -- -- -- -- 1.92 1.92 1.92 Material balance
Veneer % 52% 43% -- -- -- -- -- -- -- -- -- 53% 52% 49% Other products (chips, peeler cores, etc.) % 37% 47% -- -- -- -- -- -- -- -- -- 42% 42% 42% Sanding dust % 6% 3% -- -- -- -- -- -- -- -- -- 2% 3% 4% Shrinkage/losses % 5% 7% -- -- -- -- -- -- -- -- -- 3% 5% 5%
Average panel shipping weight kg/m3 -- 535 -- -- 650 -- -- 500 -- -- 649 -- 592 584 Average panel thickness mm -- -- -- -- 18 -- -- 15 -- -- -- -- 16.5 16.5 Non-conifer m3rw/m3p 1.89 2.68 2.5 -- -- -- -- -- -- -- -- 2.09 2.30 2.29 Rotary peeled veneer, green/rough m3rw/m3p -- -- -- -- -- -- -- 1.95 3.20 -- -- 2.00 2.00 2.38 Rotary peeled veneer, dry/rough m3rw/m3p -- -- -- -- -- -- -- 2.15 -- -- -- 2.00 2.15 2.55 Rotary peeled plywood, dry/rough m3rw/m3p -- 2.63 -- -- -- -- -- 2.25 -- -- -- 2.05 2.25 2.31 Rotary peeled plywood, dry/sanded m3rw/m3p -- 2.68 -- -- -- -- -- -- 2.40 -- -- 2.14 2.40 2.41 Sliced veneer, green/rough m3rw/m3p -- -- -- -- -- -- -- 1.60 3.00 -- -- 1.51 1.60 2.04 Sliced veneer, dry/rough m3rw/m3p -- -- -- -- -- -- -- 1.70 -- -- -- 1.60 1.70 2.43 Sliced plywood, dry/rough m3rw/m3p -- -- -- -- -- -- -- -- -- -- -- 1.87 1.87 1.87 Sliced plywood, dry/sanded m3rw/m3p -- -- -- -- -- -- -- -- -- -- -- 1.92 1.92 1.92 Material balance
Veneer % 53% 37% -- -- -- -- -- -- -- -- -- 48% 48% 46% Other products (chips, peeler cores, etc.) % 35% 54% -- -- -- -- -- -- -- -- -- 47% 47% 45% Sanding dust % 7% 2% -- -- -- -- -- -- -- -- -- 2% 2% 4% Shrinkage/losses % 5% 9% -- -- -- -- -- -- -- -- -- 3% 5% 6%
Average panel shipping weight kg/m3 -- 680 -- -- 650 -- -- 600 -- -- -- -- 650 643 Average panel thickness mm -- -- -- -- 18 -- -- 25 -- -- -- -- 21.5 21.5 Tropical m3rw/m3p -- -- 1.80 -- -- -- -- -- -- -- -- -- 1.80 1.80 Rotary peeled veneer, green/rough m3rw/m3p -- -- -- -- -- -- -- -- -- -- -- -- -- -- Rotary peeled veneer, dry/rough m3rw/m3p -- -- -- -- -- -- -- -- -- -- -- -- -- -- Rotary peeled plywood, dry/rough m3rw/m3p -- -- -- -- -- -- -- -- -- -- -- -- -- -- Rotary peeled plywood, dry/sanded m3rw/m3p -- -- -- -- -- -- -- -- -- -- -- -- -- -- Material balance
Veneer % -- -- -- -- -- -- -- -- -- -- -- -- -- -- Other products (chips, peeler cores, etc.) % -- -- -- -- -- -- -- -- -- -- -- -- -- -- Sanding dust % -- -- -- -- -- -- -- -- -- -- -- -- -- -- Shrinkage/losses % -- -- -- -- -- -- -- -- -- -- -- -- -- --
Average panel shipping weight kg/m3 -- -- -- -- 650 -- -- -- -- -- -- -- 650 650 Average panel thickness mm -- -- -- -- 18 -- -- -- -- -- -- -- 18 18 Conifers, nonconifer, tropical m3rw/m3p -- -- 2.08 -- -- 1.55 -- 1.96 -- -- -- 1.89 1.93 1.87 Rotary peeled veneer, green/rough m3rw/m3p -- -- -- -- -- -- -- -- -- -- -- -- Rotary peeled veneer, dry/rough m3rw/m3p -- -- 1.80 1.80 -- -- -- -- -- -- -- -- 1.80 1.80 Rotary peeled plywood, dry/rough m3rw/m3p -- -- 2.30 2.30 -- -- -- -- -- -- -- -- 2.30 2.30 Rotary peeled plywood, dry/sanded m3rw/m3p -- -- -- -- -- -- -- -- -- -- -- -- Material balance
Veneer % -- -- -- -- -- -- -- -- -- -- -- 52% 52% 52% Other products (chips, peeler cores, etc.) % -- -- -- -- -- -- -- -- -- -- -- 43% 43% 43% Sanding dust % -- -- -- -- -- -- -- -- -- -- -- 2% 2% 2% Shrinkage/losses % -- -- -- -- -- -- -- -- -- -- -- 3% 3% 3%
Average panel shipping weight kg/m3 -- -- -- -- 650 -- -- -- -- -- -- -- 650 650 Average panel thickness mm -- -- -- -- 18 -- -- -- -- -- -- -- 18 18 Source: UNECE/FAO Forest Products Conversion Factor Questionnaire, 2009.

20 _______________________________________________________ Forest products conversion factors for the UNECE Region
5. PANELS MADE OF WOOD PARTICLES Unlike panels made of veneer, panels made of wood particles (e.g. particle board, OSB, fibreboard) can have significantly different properties depending on the source wood from which they were produced. Wood particles can be pressed into panels that are denser or less dense than the parent wood, so cubic metre of product will seldom equal a cubic metre of solid wood equivalent (swe). In addition there are non-wood components introduced that add to the bulk and weight, such as binders and fillers. In some countries a significant percentage of bark volume can be part of the raw material for non-structural panels (Thivolle-Cazat, 2008).
It is important to note that many panel producers use oven dry weight of raw material, rather than the volume of solid wood input, to track the raw material to product conversion efficiency. Less volume of raw materials from dense species is needed to make a given quantity of panels made of wood particles vs. what would be required from low-density species. For example, when using Norway spruce with a basic density of 380 kg/m3 as a raw material for MDF which will be pressed to a basic density of 760 kg/m3, it will require 2 m3 of solid wood equivalent raw material per m3 of MDF panel. However, if Siberian larch with a basic density of 460 kg/m3 is used, only 1.65 m3 would be needed (discounting the small effects of binders and fillers).
5.1 Volumetric and surface measurement As in plywood and veneer, panels made of wood particles are typically measured via cubic volume, surface measure, and surface measure on a thickness basis. In Europe, as with veneer and plywood, surface measure on a thickness basis is 1 mm. In North America panels made from wood particles and measured on a thickness basis have different thickness basis standards dependent on the product. These are as follows:
• OSB and waferboard 3/8 inch (0.375 inch) • Particleboard and MDF 3/4 inch (0.75 inch) • Hardboard 1/8 inch (0.125 inch) • Insulation board 1/2 inch (0.5 inch)
5.2 Weight The weight of panels made from wood particles will vary dependent on the density of the parent wood, the density at which the wood fibre is pressed into the panel, the moisture content, which is typically about 6-8% (Briggs, 1994), and finally the weight of binders and fillers.

Forest products conversion factors for the UNECE Region________________________________________________________ 21
5.3 Summary of country data on panels made from wood particles
unit in/ unit out Ca
nada
Czec
h Re
publ
ic
Finl
and
Fran
ce
Germ
any
Irelan
d
Lith
uani
a
Neth
erlan
ds
Norw
ay
Slov
akia
Spain
Swed
en
Unite
d Ki
ngdo
m
Unite
d St
ates
Medi
an
Aver
age
Particle board (without OSB) m3sw/m3p 1.48 1.59 1.60 1.30 1.93 1.57 1.30 1.50 1.20 1.40 1.50 1.62 1.60 1.50 1.51 Average thickness mm 15.9 23 -- -- -- 18 -- -- 18 19 16 -- -- -- 18.0 18.3 Product basic density kg/m3 -- 668 675 650 -- 625 -- 665 650 650 -- 649 720 650 661
Material balance Binders and fillers % -- -- 9% 6% -- 8% -- -- 9% 9% -- -- -- 9% 9% 8% Bark % -- -- 5% 5% -- 5% -- -- -- -- -- -- -- 1% 3% 3% Moisture % -- -- 7% 7% -- 8% -- -- 7% 8% -- -- -- 7% 7% 7% Wood % -- -- 79% 82% -- 79% -- -- 83% -- -- -- -- 84% 83% 82%
Share of recycled fibre in panels % -- -- -- -- -- 45% -- -- -- -- -- -- -- -- -- -- OSB and waferboard m3sw/m3p 1.61 2.00 1.30 1.93 1.30 1.65 1.63 1.63
Average thickness mm 11.1 19 -- -- -- 18 -- -- -- -- -- -- -- -- 18.0 16.0 Product basic density kg/m3 -- 565 -- 850 -- 630 -- -- -- -- -- -- -- 407 598 613
Material balance Binders and fillers % -- -- -- -- -- 4% -- -- -- -- -- -- -- 3% 4% 4% Bark % -- -- -- 0% -- 0% -- -- -- -- -- -- -- 1% 0% 0% Moisture % -- -- -- -- -- 6% -- -- -- -- -- -- -- 7% 7% 7% Wood % -- -- -- -- -- 90% -- -- -- -- -- -- -- 90% 90% 90%
Fibreboard, hard m3sw/m3p 1.79 -- -- 2.20 2.40 1.93 -- -- -- 1.75 -- 2.37 1.75 1.93 2.03 Average thickness mm 3.2 -- 3.0 -- -- 3.0 -- -- -- -- 3.0 -- -- -- 3.00 3.10 Product basic density kg/m3 -- -- 950 1 000 900 940 -- -- -- -- 830 -- 950 880 940 921
Material balance Binders and fillers % -- -- -- -- -- 9% -- -- -- -- -- -- -- -- 9% 9% Bark % -- -- -- 7% -- 0% -- -- -- -- -- -- -- -- 0% 0% Moisture % -- -- -- -- -- 6% -- -- -- -- -- -- -- -- 6% 6% Wood % -- -- -- -- -- 85% -- -- -- -- -- -- -- -- 85% 85%
Fibreboard, medium (MDF) m3sw/m3p 1.45 -- -- 1.80 1.70 1.93 -- -- -- -- 1.75 -- 1.50 1.60 1.70 1.68 Average thickness mm 15.9 24 -- -- -- 15 -- -- -- -- 16.5 -- -- -- 16.2 17.9 Product basic density kg/m3 -- 765 -- 780 650 740 -- -- -- -- 730 -- 600 704 730 713
Material balance Binders and fillers % -- -- -- -- -- 9% -- -- -- -- -- -- -- -- 9% 9% Bark % -- -- -- 7% -- 0% -- -- -- -- -- -- -- -- 0% 0% Moisture % -- -- -- -- -- 6% -- -- -- -- -- -- -- -- 6% 6% Wood % -- -- -- -- -- 85% -- -- -- -- -- -- -- -- 85% 85%
Insulation board m3sw/m3p -- -- -- 0.60 1.10 -- -- -- -- 1.10 -- -- 0.63 0.71 0.71 0.83 Average thickness mm -- -- -- -- -- -- -- -- -- 25 -- -- -- -- 25 25 Product basic density kg/m3 -- 220 290 300 400 -- -- -- -- 260 -- -- 250 300 290 289
Material balance Binders and fillers % -- -- -- -- -- -- -- -- -- 2% -- -- -- -- -- -- Bark % -- -- -- 7% -- -- -- -- -- -- -- -- -- -- -- -- Moisture % -- -- -- -- -- -- -- -- -- 6% -- -- -- -- -- -- Wood % -- -- -- -- -- -- -- -- -- -- -- -- -- -- -- --
Fibreboard, all m3sw/m3p -- -- 1.98 -- -- -- -- 1.45 -- -- -- -- -- -- 1.72 1.72 Source: UNECE/FAO Forest Products Conversion Factor Questionnaire, 2009.

22 _______________________________________________________ Forest products conversion factors for the UNECE Region
6. WOOD PULP AND PAPER Pulp is the raw material for paper and paperboard (cardboard). The manufacturing process involves separating the wood fibres by means of mechanical or chemical processes, or a combination of these.
Mechanical pulp is produced via a grinding action applied to wood, typically wood particles. As a result of the grinding process, the wood fibres tend to be short and thus lack strength compared to chemically produced pulp. However, the yield is high because little of the original components of the wood is lost. One oven dry metric ton of wood input will yield approximately 0.95 metric tons of oven dry pulp (i.e. 95% yield).
Chemical pulping involves using chemicals and heat to dissolve the lignin, leaving behind long wood fibres, which are strong, but at the price of lower yield, as much of the original wood is dissolved and suspended in the chemical treatment. There are several different chemical processes, with use dependent on species of wood and the desired characteristics of the paper. Bleached pulp results in white paper but at a lower yield in comparison to the non-bleached pulp. Chemical pulping generally results in yields in the 40-50% range (measured as oven dry input to oven dry output) (Briggs 1994).
Pulp is also produced using mechanical grinding in conjunction with chemical processes. There are a number of variations of this process and yield will generally be slightly less than that of strictly mechanical processes.
6.1 Weight Pulp and paper measurement is usually handled via weight. Generally, an unspecified metric ton or an “air dried metric ton” is assumed to be 10% mcw. Note that pulp and paper moisture content is reflected on a “wet basis” (mcw), i.e. one air-dried metric ton of pulp is assumed to be 900 kg of oven dry fibre and 100 kg of contained water. Pulp and paper can also be measured on an oven dry basis. For the purposes of the conversion factor questionnaire, conversions to the metric ton were requested and respondents were informed that it was at an assumed 10% mcw.
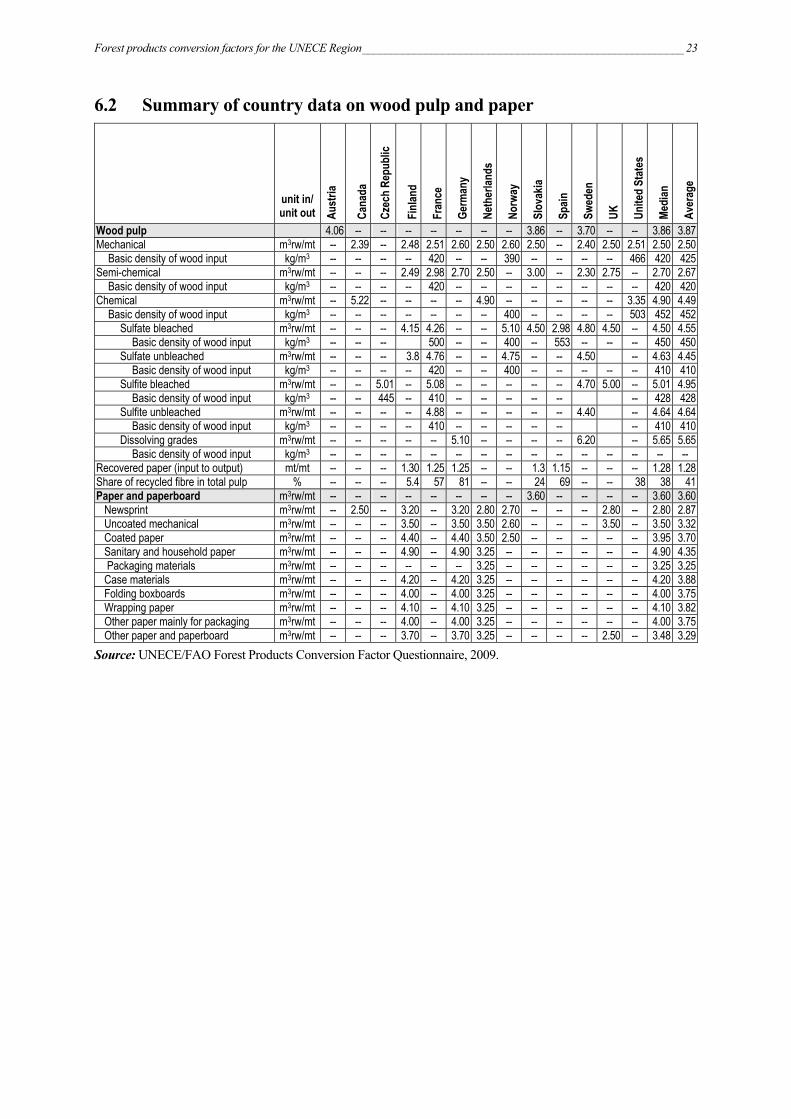
Forest products conversion factors for the UNECE Region________________________________________________________ 23
6.2 Summary of country data on wood pulp and paper
unit in/ unit out Au
stria
Cana
da
Czec
h Re
publ
ic
Finl
and
Fran
ce
Germ
any
Neth
erlan
ds
Norw
ay
Slov
akia
Spain
Swed
en
UK
Unite
d St
ates
Medi
an
Aver
age
Wood pulp 4.06 -- -- -- -- -- -- -- 3.86 -- 3.70 -- -- 3.86 3.87 Mechanical m3rw/mt -- 2.39 -- 2.48 2.51 2.60 2.50 2.60 2.50 -- 2.40 2.50 2.51 2.50 2.50
Basic density of wood input kg/m3 -- -- -- -- 420 -- -- 390 -- -- -- -- 466 420 425 Semi-chemical m3rw/mt -- -- -- 2.49 2.98 2.70 2.50 -- 3.00 -- 2.30 2.75 -- 2.70 2.67
Basic density of wood input kg/m3 -- -- -- -- 420 -- -- -- -- -- -- -- -- 420 420 Chemical m3rw/mt -- 5.22 -- -- -- -- 4.90 -- -- -- -- -- 3.35 4.90 4.49
Basic density of wood input kg/m3 -- -- -- -- -- -- -- 400 -- -- -- -- 503 452 452 Sulfate bleached m3rw/mt -- -- -- 4.15 4.26 -- -- 5.10 4.50 2.98 4.80 4.50 -- 4.50 4.55
Basic density of wood input kg/m3 -- -- -- 500 -- -- 400 -- 553 -- -- -- 450 450 Sulfate unbleached m3rw/mt -- -- -- 3.8 4.76 -- -- 4.75 -- -- 4.50 -- 4.63 4.45
Basic density of wood input kg/m3 -- -- -- -- 420 -- -- 400 -- -- -- -- -- 410 410 Sulfite bleached m3rw/mt -- -- 5.01 -- 5.08 -- -- -- -- -- 4.70 5.00 -- 5.01 4.95
Basic density of wood input kg/m3 -- -- 445 -- 410 -- -- -- -- -- -- 428 428 Sulfite unbleached m3rw/mt -- -- -- -- 4.88 -- -- -- -- -- 4.40 -- 4.64 4.64
Basic density of wood input kg/m3 -- -- -- -- 410 -- -- -- -- -- -- 410 410 Dissolving grades m3rw/mt -- -- -- -- -- 5.10 -- -- -- -- 6.20 -- 5.65 5.65
Basic density of wood input kg/m3 -- -- -- -- -- -- -- -- -- -- -- -- -- -- -- Recovered paper (input to output) mt/mt -- -- -- 1.30 1.25 1.25 -- -- 1.3 1.15 -- -- -- 1.28 1.28 Share of recycled fibre in total pulp % -- -- -- 5.4 57 81 -- -- 24 69 -- -- 38 38 41 Paper and paperboard m3rw/mt -- -- -- -- -- -- -- -- 3.60 -- -- -- -- 3.60 3.60 Newsprint m3rw/mt -- 2.50 -- 3.20 -- 3.20 2.80 2.70 -- -- -- 2.80 -- 2.80 2.87 Uncoated mechanical m3rw/mt -- -- -- 3.50 -- 3.50 3.50 2.60 -- -- -- 3.50 -- 3.50 3.32 Coated paper m3rw/mt -- -- -- 4.40 -- 4.40 3.50 2.50 -- -- -- -- -- 3.95 3.70 Sanitary and household paper m3rw/mt -- -- -- 4.90 -- 4.90 3.25 -- -- -- -- -- -- 4.90 4.35 Packaging materials m3rw/mt -- -- -- -- -- -- 3.25 -- -- -- -- -- -- 3.25 3.25 Case materials m3rw/mt -- -- -- 4.20 -- 4.20 3.25 -- -- -- -- -- -- 4.20 3.88 Folding boxboards m3rw/mt -- -- -- 4.00 -- 4.00 3.25 -- -- -- -- -- -- 4.00 3.75 Wrapping paper m3rw/mt -- -- -- 4.10 -- 4.10 3.25 -- -- -- -- -- -- 4.10 3.82 Other paper mainly for packaging m3rw/mt -- -- -- 4.00 -- 4.00 3.25 -- -- -- -- -- -- 4.00 3.75 Other paper and paperboard m3rw/mt -- -- -- 3.70 -- 3.70 3.25 -- -- -- -- 2.50 -- 3.48 3.29 Source: UNECE/FAO Forest Products Conversion Factor Questionnaire, 2009.

24 _______________________________________________________ Forest products conversion factors for the UNECE Region
7. ROUND AND SPLIT WOOD PRODUCTS For the purpose of this report, this category of forest products includes: barrel staves, utility poles, posts, pilings, house logs (manufactured round wood for constructing log buildings) and shakes and shingles. While shingles are a sawed product rather than a split product, they are generally manufactured along with shakes, which are split and thus are included in this grouping. Similar to this, barrel staves are both split and sawn, depending on the characteristics of the wood species used.
As these are relatively minor products in terms of volume, information on these products is limited. Where no country data were reported, as was the case for shakes and shingles, information from previously published sources is provided.
This category of products is not as technology driven as many of the other forest products, thus this aspect does not appear to be such a strong contributor of product recovery. Some of the significant controllers of product recovery by product are listed below.
The yield of barrel staves (used in the cooperage industry) is determined, to a great degree, by the process used to produce staves. Some species used for wine barrels (notably European oaks and Oregon white oak), need to be split in order to prevent the staves from being overly porous (caused by vessels that run parallel to the grain of the wood), while white oak of central and eastern North America does not have the same problems with porosity and thus can be sawn. The yield of sawn staves is significantly higher than for staves that are split. Staves generally have exacting standards in terms of quality, reducing yield according to the presence of knots or blemishes in the raw material used to produce them.
Utility poles, posts, pilings and house log yield is affected by the peeling process which is done to remove bumps and protrusions, as well as to round the profile. In addition, a portion of these products is peeled in order to remove taper, thereby creating a loss of roughly 10-40% dependent on the diameter and length of the product, with smaller diameter and longer products at the upper end of this range and larger, diameter, shorter products at the bottom of the range.
Shakes and shingles are generally used for roofing or siding. Shakes are split on one or both faces, while shingles are always sawn, thus losing a substantial volume to sawdust. Weatherization is an important factor, and quality standards tend to be exacting in terms of knots or other permeations which could allow water seepage, so a substantial percentage of the original log volume is often not usable and ends up as residue.
7.1 Volumetric and surface measurement As staves, poles, posts, pilings and house logs tend to be manufactured to exacting specifications; it is fairly straightforward to convert from the piece, of a given standard, to volume.
This is not the case with shakes and shingles, which are typically measured on a basis of the surface measurement of coverage. In North America the unit is the “square”, which is the proper amount of shakes or shingles to cover 100 square feet (10.764 m3). In Europe the unit is m2 of coverage. Converting shakes and shingles from surface (coverage) measure to solid wood equivalent volume is not as straightforward, as there are many combinations, by product classification, of thickness, taper, widths, length and overlap. Additionally there is the irregularity of shake thickness as a result of the splitting process.
7.2 Weight Like all other wood products, the weight to volume ratio will be driven by the basic density, moisture content and shrinkage of the wood. Using the methodology outlined in section 3.2 to calculate the theoretical weights of these products, it is important to consider that many of the round and split wood products will have treating done to them to prevent fungal decay or attacks by wood-boring insects and molluscs. Treated poles and pilings will have roughly 160 kg/m3 of additional weight due to wood treatment added (Hartman et al, 1981). If one were estimating the weight of the wood component as being

Forest products conversion factors for the UNECE Region________________________________________________________ 25
600 kg/m3, a treated pole would be approximately 760 kg/m3. Shakes and shingles are also often treated with decay and fire retardants, which adds to their weight.
7.3 Material balance Barrel staves. In addition to chips, sawdust and shavings, sawnwood can be a residual product made during the manufacturing process of staves. Another interesting point is that some of the wood residue from producing staves still finds its way into the wine industry in the form of chips or sticks used to flavour wine in non oak barrels such as stainless steel.
Utility poles, posts, pilings and house logs. Because these products generally cannot have any decay, crooked portions or overly large knots, the removal of these defects from the logs used as raw materials will reduce the yield of these products and increase the yield of secondary products such as chips and energy wood.
Shakes and shingles. A cubic metre of western red cedar logs will yield approximately:
Log quality Shingles Shakes Low grade logs 1.55 squares (14.4 m2 of coverage) NA Medium grade logs 1.65 squares (15.3 m2 of coverage) NA High grade logs 1.70 squares (15.8 m2 of coverage) 1.9 squares (17.7 m2 coverage)
Source: Herring and Massie, 1989
Hartman et al (1981) list the material balance for shingles as being roughly 40% shingles, 27% solid residue, and 33% sawdust. Briggs (1994) cites an unpublished study showing only 24% recovery of shingles and 53% for shakes (with the remaining balance of both (76% and 47% respectively) being classified as “residue”. It is likely that the large difference in these material balances could be a result of the difference between the use of high grade logs vs. lower grade logs as a raw material, which will change periodically as a result of availability and competition for logs with other sectors, such as the sawmill sector.
7.4 Summary of country data on round and split wood products
unit in/ unit out Fi
nlan
d
Fran
ce
Germ
any
Irelan
d
Norw
ay
Slov
akia
Spain
Medi
an
Aver
age
Barrel staves m3rw/m3p -- 4.25 5.0 -- -- 2.25 2.90 3.58 3.60 Utility poles m3rw/m3p 1.30 1.12 1.20 1.10 1.15 1.67 -- 1.18 1.26 Posts m3rw/m3p 1.50 1.11 1.20 1.15 1.50 1.67 -- 1.35 1.36 Pilings m3rw/m3p 1.50 -- 1.20 -- -- 1.75 -- 1.50 1.48 House logs m3rw/m3p 1.70 -- -- -- 1.65 -- -- 1.68 1.68
Source: UNECE/FAO Forest Products Conversion Factor Questionnaire, 2009.

26 _______________________________________________________ Forest products conversion factors for the UNECE Region
8. ENERGY WOOD PRODUCTS AND PROPERTIES This category includes fuelwood, bark and chipped fuel, as well as manufactured products such as pellets and briquettes, charcoal, and wood-based ethanol. Sections 1 and 2 include information that is applicable to analysing conversion factors for wood, wood residue and bark for energy.
8.1 Volumetric measurement These products can be measured in solid m3 or in a loose m3 (bulk m3). In the case of fuelwood, a loose m3 is often differentiated from “stacked m3”, with the difference being that loose m3 would be randomly placed vs. the neatly fit together structure of stacked measure. Section 1.1.3 outlines the measurement of stacked wood.
8.2 Weight When moisture content is accounted for, the weight of energy products is likely the most reliable unit for understanding energy generating potential of a given quantity of wood. Moisture not only displaces the potential weight of combustible material, but also consumes some of the energy potential to vaporize the water when combusted.
8.3 Energy values The energy content of wood can be reflected in many different measures and with assumptions made as to how much of the energy content can realistically be utilized, as no process of utilizing wood for energy is 100% efficient. For the purpose of the questionnaire, the joule was the basis, and the energy values were requested in “higher heating values,” knowing that while these are unachievable, it is a consistent basis to which the user could apply their own assumptions regarding conversion efficiency.
8.4 Summary of country data on energy wood products and properties
unit in/ unit out Au
stria
Czec
h Re
publ
ic
Finl
and
Fran
ce
Germ
any
Irelan
d
Norw
ay
Slov
akia
Spain
Swed
en
Unite
d King
dom
Unite
d St
ates
Medi
an
Aver
age
Fuelwood m3rw/odmt 2.4 -- 2.45 1.90 2.30 1.82 2.50 1.72 1.60 2.22 -- -- 2.22 2.10 Product basic density (solid volume, oven dry) kg/m3 417 -- 460 526 432 550 450 780 625 450 -- -- 460 521 Higher heating value m3 rw/gj 0.12 -- 0.12 0.1 -- 0.15 0.12 0.08 -- -- -- -- 0.12 0.12
Pellets16 m3rw/m3p solid -- -- 2.86 2.86 -- 2.20 -- 2.23 -- -- -- -- 2.55 2.54 Roundwood input to bulk m3 pellets m3rw/m3p bulk 1.44 -- 1.51 1.79 1.44 -- -- -- -- -- -- 1.44 1.44 1.52 Product basic density (solid volume, oven dry) kg/m3 -- -- 1 080 1 200 1 120 920 -- 1 070 1 010 -- -- -- 1 075 1 067 Bulk density (loose volume, 5-10% mcw) kg/m3 652 -- 650 750 650 -- -- 670 -- -- -- 689 661 677 Higher heating value (bulk volume) m3bulk/gj .083 -- 0.09 0.78 0.09 0.13 -- 0.08 0.07 -- -- 0.08 0.08 0.09
Pressed logs and briquettes m3rw/odmt 2.38 -- 0.87 2.38 -- 2.2 -- -- -- -- -- -- 2.29 1.96 Product basic density (solid volume, oven dry) kg/m3 -- -- 1 080 1 000 1 200 950 -- 1 120 1 100 -- -- -- 1 090 1 075 Bulk density (loose volume) kg/m3 761 -- -- -- -- -- -- -- -- -- -- -- 761 761 Higher heating value m3bulk/gj 0.07 -- 0.09 0.13 -- 0.13 -- 0.05 -- -- -- -- 0.09 0.09
Bark and chipped fuel m3rw/odmt 2.38 -- 2.5 -- -- -- -- 1.83 -- 2.85 -- -- 2.44 2.39 Product basic density (solid volume, oven dry) kg/m3 393 350 400 -- -- -- -- -- -- 350 -- -- 372 373 Bulk density (loose volume at 50% mcw) kg/m3 236 -- -- -- -- -- -- -- -- -- -- -- 236 236 Higher heating value m3 rw/gj 0.12 -- -- -- -- -- -- .08 -- -- -- -- 0.10 0.10
Charcoal m3rw/odmt -- -- 6.1 7.0 5.0 -- -- 5.7 -- -- 6.0 -- 6.00 5.96 Wood-based ethanol m3rw/kilolitre -- -- -- -- 8.62 -- -- -- -- -- -- 6.80 7.71 7.71 Source: UNECE/FAO Forest Products Conversion Factor Questionnaire, 2009.
16 The ratios shown for wood pellets assumes only the wood fibre input into the manufacture of pellets and does not include any wood fibre that may have been burned by heat dryers for the removal of moisture from the wood fibre.

Forest products conversion factors for the UNECE Region________________________________________________________ 27
9. REFERENCES Austrian Energy Agency. 2009. Available at: http://www.klimaaktiv.at/article/archive/12740/
Briggs, D. 1994. Forest Products Measurements and Conversion Factors with Special Emphasis on the U.S. Pacific Northwest. College of Forest Resources, University of Washington. Seattle, Washington.
CITES. 2008. Convention on International Trade in Endangered Species of Wild Fauna and Flora, Timber issues Bigleaf mahogany Volumetric Conversion of Standing Trees to Exportable Mahogany Sawn Wood. Available at: http://www.cites.org/eng/com/pc/17/E-PC17-16-01-03.pdf
Fonseca, M.A. 2005. The Measurement of Roundwood: Methodologies and Conversion Ratios. CABI Publishing, Wallingford, Oxfordshire, United Kingdom.
Forest Products Laboratory. 1956. Estimating the Weight of Plywood (technical note number 260). United States Department of Agriculture. Washington D.C.
Forest Products Laboratory. 1999. Wood handbook—Wood as an engineering material. Gen. Tech. Rep. FPL–GTR–113. Madison, WI: United States Department of Agriculture, Forest Service, Forest Products Laboratory.
Hartman, David A.; Atkinson, William A.; Bryant, Ben S.; Woodfin, Richard O. Jr. 1976. Conversion Factors for the Pacific Northwest Forest Industry. Institute of Forest Resources, College of Forest Resources, University of Washington. Seattle, Washington.
Herring, R. and Massie, M. 1989. Analysis of the British Columbia shake and shingle industry (FRDA report 070). Forestry Canada. Victoria B.C., Canada.
Mantau, Udo. 2008. Presentation given at the 2008 UNECE/FAO Workshop on National Wood Energy resources Balances. Available at: http://www.unece.org/timber/workshops/2008/wood-balance/ presentations/01_Mantau.pdf
Nova Scotia Department of Natural Resources .2001. Conversion Factors. Available at: http://www.gov.ns.ca/natr/forestry/registry/2001/ConversionFactors.PDF
Spelter, Henry. 2002. Conversion of board foot scaled logs to cubic meters in Washington State, 1970–1998. Gen. Tech. Rep. FPL-GTR-131. Madison, WI: United States Department of Agriculture, Forest Service, Forest Products Laboratory.
Thivolle – Cazat, Alain. 2008. Conversion Factors: A Necessity for an Accurate Estimation of Wood Consumption by Industries. UNECE/FAO. Geneva, Switzerland. Available at: http://www.unece.org/timber/workshops/2008/wood-balance/docs/ConversionFactor_v8.pdf
UNECE/FAO Timber Branch. 1987. Conversion Factors (Raw Material/Product) for Forest Products. United Nations Economic Commission for Europe/Food and Agriculture Organization Timber Branch. Geneva, Switzerland.
UNECE/FAO Timber Branch. 2005. European Forest Sector Outlook Study 1960-2000-2020 Main Report. United Nations Economic Commission for Europe/Food and Agriculture Organization Timber Branch. Geneva, Switzerland.
Van Vuuren N., Banks, C. and Stöhr, H. 1978. Shrinkage and Density of Timbers Used in the Republic of South Africa. Bulletin 57. Department of Forestry, Pretoria, South Africa.
VMF Nord. 1999. Estimation of the Solid Volume Percentage (Circular A 13). The Swedish Timber Measurement Council. Sweden.
World Trade Organization. 2003. WT/DS257/R. Available at: http://www.worldtradelaw.net/reports/ wtopanelsfull/us-lumbercvdsfinal(panel)(full).pdf

28 _______________________________________________________ Forest products conversion factors for the UNECE Region
Roundwood measurement standards references Alberta Land & Forest Service. 2002. Alberta Scaling Manual. Alberta Land & Forest Service. Edmonton,
Alberta. Available at: http://www.srd.gov.ab.ca/forests/pdf/Introduction.pdf
Association pour la rationalisation et la mécanisation de l’explotation forestière, Centre technique du bois et de l’ameublement, Mutualité sociale agricole. 1994. Manuel d’exploitation forestière, tome 2. Centre technique du bois et de l’ameublement. Fontainebleau, France.
British Columbia Ministry of Forestry. 2007. Scaling Manual. Crown Publications. Victoria, British Columbia. Available at: http://www.for.gov.bc.ca/hva/manuals/scaling/pdf/ ScalingManualMasterMay2007.pdf
Finland Ministry of Agriculture and Forestry. 1997. Roundwood Volume Measurement Standards [Reg 918/66/97]. Available at: http://www.finlex.fi/data/normit/12590-02074fil.PDF
GOST-Standard 2708-75 Round timber (volumes tables) Available at: http://ostapbenderx.narod.ru/ Index/41/4110.htm
Hamilton, G.J. 1975. Forest Mensuration Handbook, Forestry Commission. Her Majesty’s Stationary Office. London, United Kingdom.
National Council for Forest Resources and Development (COFORD). 2000. Timber Measurement Manual – Standard Procedures for the Measurement of Round Timber for Sale Purposes in Ireland. COFORD. Dublin, Ireland.
Northwest Log Rules Advisory Group. 2003. Official Log Scaling and Grading Rules. Northwest Log Advisory Group. Eugene, Oregon. Available at: http://www.nwlrag.com/official_Rules_Revised.pdf
Sächsisches Staatsministerium. Messung und Sortierung von Roholz. 1997. Sächsisches Staatsministerium. Dresden, Germany.
The Swedish Timber Measurement Council. 1999. Regulations for Measuring of Roundwood (Circular VMR 1-99). Sweden.
Tømmermålingforeningenes Fellesorgan. 1998. Grading and Scaling Regulations for Forestry Products. Tommermalingforeningenes Fellesorgan. Norway.
U.S. Forest Services. 1991. National Forest Cubic Scaling Handbook. USDA Forest Service FSH 2409.11a. USDA Forest Service. Washington D.C. Avaialble at: http://www.fs.fed.us/cgi-bin/Directives/get_directives/fsh?2409.11a

Forest products conversion factors for the UNECE Region________________________________________________________ 29
ANNEX Annex table 1 List of equivalents
To convert from To Multiply by To convert from To Multiply by Length Weight millimetre centimetre 0.1 gram pound 0.002205 millimetre inch 0.0394 gram kilogram 0.001 millimetre foot 0.00328 pounds gram 454 millimetre metre 0.001 pounds kilogram 0.454 centimetre millimetre 10 pounds ton 0.0005 centimetre inch 0.394 pounds metric ton 0.000454 centimetre foot 0.0328 kilogram gram 1000 centimetre metre 0.01 kilogram pounds 2.205 inch millimetre 25.4 kilogram ton 0.0011023 inch centimetre 2.54 kilogram metric ton 0.001 inch foot 0.0833 ton kilogram 907 inch metre 0.0254 ton pound 2000 foot millimetre 304.8 ton metric ton 1.1023 foot centimetre 30.48 metric ton pounds 2205 foot inch 12 metric ton kilogram 1 000 foot metre 0.3048 metric ton ton 0.907 metre millimetre 1 000 Volume metre centimetre 100 square foot (⅜ inch basis) square metre (1 mm basis) 0.885 metre inch 39.37 square foot (⅜ inch basis) cubic foot 0.03125 metre foot 3.281 square foot (⅜ inch basis) cubic metre 0.000885 Area square foot (⅜ inch basis) cunit 0.0003125 square centimetre square inch 0.155 square metre (1 mm basis) square foot (⅜ inch basis) 1.13008 square centimetre square foot 0.001076 square metre (1 mm basis) cubic foot 0.35315 square centimetre square metre 0.0001 square metre (1 mm basis) cubic metre 0.001 square inch square centimetre 6.452 square metre (1 mm basis) cunit 0.00035315 square inch square foot 0.0069444 cubic foot square foot ⅜” 32 square inch square metre 0.0006452 cubic foot square metre (1 mm basis) 28.32 square foot square centimetre 929 cubic foot cubic metre 0.02832 square foot square inch 144 cubic foot cunit 0.01 square foot square metre 0.0929 cubic metre square foot (⅜ inch basis) 1130.08 square metre square centimetre 10 000 cubic metre square metre (1 mm basis) 1000 square metre square inch 1 550 cubic metre cubic foot 35.315 square metre square foot 10.764 cubic metre cunit 2.832 Density cunit square foot (⅜ inch basis) 3 200 specific gravity basic density 1 000 cunit square metre (1 mm basis) 2 832 basic density specific gravity 0.001 cunit cubic foot 100 Stacked measure cunit cubic metre 2.832 cubic foot stere 0.02832 Heat cubic foot cord 0.0078125 British thermal unit joule 1 055 cubic metre stere 1 joule British thermal unit 0.0009479 cubic metre cord 0.2759 Weight to volume ratios cord cubic foot 128 lbs per cubic foot kg per cubic metre 16.019 cord cubic metre 3.6245 kg per cubic metre lbs per cubic foot .06243 cord Stere 3.6245 stere cubic foot 35.315 stere cubic metre 1 stere cord 0.2759 Source: Fonseca, 2005.

30 _______________________________________________________ Forest products conversion factors for the UNECE Region
Annex figure 1 Example of wood balance using conversion factors
Conversion Factors Products Forest Products (1,000 m3 swe) in units of output
1,593 Roundwood needed (1,000 m3) Material balance
Primary product Chips
Sawdust, shavings, sanding
dust Losses Bark*
Total excluding
bark
swe m3/ product
unit Quantity
Product Unit (1,000)
Sawmilling Sector1,000 Roundwood in
Sawnwood 50% 530 1.06 500 m3
Shrinkage 3%Chips 33% 330 2.4 138 odmt
Sawdust and shavings 10% 100 2.4 42 odmtLoss 4% 40
Recoverable bark 7% 73 1000 2.6 28 odmtPlywood/Veneer Mills
200 Roundwood inPlywood and veneer 53% 113 1.08 105 m3
Shrinkage 4%Chips 37% 75 2.4 31.1 odmt
Sanding and sawdust 3% 6 2.4 2.5 odmtLoss 3% 6
Recoverable bark 7% 15 200 2.6 5.6 odmtOSB Mills
40 Roundwood inPanels 60% 39.4 1.64 24 m3
Shrinkage (densification) 39%
Sanding and sawdust 1% 0.5 2.4 0.2 odmtLoss 0.3% 0.1
Recoverable bark 7% 3 40 2.6 1.1 odmtPulp and Paper Mills
353 Roundwood in 405 Chips in
Pulp and paper 95% 720 2.40 300 mt Loss 5% 38 Recoverable bark 7% 26 758 2.6 9.9 odmt
Particle board Mill106 Sawdust in
Particleboard 67% 106.5 1.5 71 m3
Shrinkage (densification) 33% 106.50 Biomass power plant*
116 Bark inPower out 100% 116 116 0.1824 636 gj
1509 84
m3
Losses
m3 Wood products
∑
∑
∑
∑ Energy out
Note: Conversion factors are used in outlook studies to predict the amount of raw material needed from the forest to supply a given quantity of manufactured forest products and vice-versa. A wood balance can check the accuracy of conversion factors and assist in predicting the flow and availability of wood residues.
This figure is an example of a simple wood balance utilizing conversion factors and could represent a national or subregional balance. In the example 500,000 m3 of sawnwood is predicted to be produced from 1,000,000 m3 of roundwood using the 2.0 input/output factor, which is represented in the recipricol format of 50%. One might assume that 500,000 m3 of sawnwood woud have a solid wood equivalent volume that is the same, but this is not the case, as wood products (including sawnwood) are often more or less dense than the parent wood used as the raw material. The 500,000 m3 of dried sawnwood was 530,000 m3 in the green state (prior to shrinkage), so a 1.06 factor is used to determine the solid wood equivalent (swe). Note that the total production of wood products in swe plus the losses (1,593,000 m3) balances with the roundwood consumed (excluding bark volume and wood energy produced).
* Biomass power plant in this example is assumed to be operated entirely from bark volume, which is excluded from the balance.
Source: UNECE/FAO Timber Section, 2009.

Forest products conversion factors for the UNECE Region________________________________________________________ 31
Annex table 2 Joint Forest Sector Questionnaire Conversion Factors
NOTE THESE ARE ONLY GENERAL NUMBERS. IT WOULD BE PREFERABLE TO USE SPECIES- OR COUNTRY-SPECIFIC FACTORS
Product JFSQ Product volume to weight volume to area volume to volume of roundwood
Code Quantity Roundwood Unit equivalent
1 1000 m3 ROUNDWOOD1.1 1000 m3 WOOD FUEL, INCLUDING WOOD FOR CHARCOAL 1.381.1.C 1000 m3 Coniferous 1.601.1.NC 1000 m3 Non-Coniferous 1.331.2 1000 m3 INDUSTRIAL ROUNDWOOD (WOOD IN THE ROUGH)1.2.C 1000 m3 Coniferous1.2.NC 1000 m3 Non-Coniferous1.2.NC.T 1000 m3 of which:Tropical 1.371.2.1 1000 m3 SAWLOGS AND VENEER LOGS1.2.1.C 1000 m3 Coniferous 1.431.2.1.NC 1000 m3 Non-Coniferous 1.251.2.2 1000 m3 PULPWOOD (ROUND & SPLIT) 1.481.2.2.C 1000 m3 Coniferous 1.541.2.2.NC 1000 m3 Non-Coniferous 1.331.2.3 1000 m3 OTHER INDUSTRIAL ROUNDWOOD 1.331.2.3.C 1000 m3 Coniferous 1.431.2.3.NC 1000 m3 Non-Coniferous 1.252 1000 MT WOOD CHARCOAL 6.003 1000 m3 WOOD CHIPS AND PARTICLES 1.604 1000 m3 WOOD RESIDUES 1.505 1000 m3 SAWNWOOD 1.6 / 1.82*5.C 1000 m3 Coniferous 1.825.NC 1000 m3 Non-Coniferous 1.435.NC.T 1000 m3 of which:Tropical6 1000 m3 WOOD-BASED PANELS 1.66.1 1000 m3 VENEER SHEETS 1.33 0.0025 1.9*6.1.C 1000 m3 Coniferous6.1.NC 1000 m3 Non-Coniferous6.1.NC.T 1000 m3 of which:Tropical6.2 1000 m3 PLYWOOD 1.54 2.3*6.2.C 1000 m3 Coniferous6.2.NC 1000 m3 Non-Coniferous6.2.NC.T 1000 m3 of which:Tropical6.3 1000 m3 PARTICLE BOARD (including OSB) 1.546.3.1 1000 m3 of which: OSB6.4 1000 m3 FIBREBOARD 6.4.1 1000 m3 HARDBOARD 1.05 0.0056.4.2 1000 m3 MDF (Medium Density) 2.00 0.0166.4.3 1000 m3 INSULATING BOARD 4.00 0.0257 1000 MT WOOD PULP 3.377.1 1000 MT MECHANICAL7.2 1000 MT SEMI-CHEMICAL7.3 1000 MT CHEMICAL7.3.1 1000 MT SULPHATE UNBLEACHED7.3.2 1000 MT SULPHATE BLEACHED7.3.3 1000 MT SULPHITE UNBLEACHED7.3.4 1000 MT SULPHITE BLEACHED7.4 1000 MT DISSOLVING GRADES8 1000 MT OTHER PULP 8.1 1000 MT PULP FROM FIBRES OTHER THAN WOOD8.2 1000 MT RECOVERED FIBRE PULP9 1000 MT RECOVERED PAPER10 1000 MT PAPER AND PAPERBOARD 3.3710.1 1000 MT GRAPHIC PAPERS10.1.1 1000 MT NEWSPRINT10.1.2 1000 MT UNCOATED MECHANICAL10.1.3 1000 MT UNCOATED WOODFREE10.1.4 1000 MT COATED PAPERS10.2 1000 MT SANITARY AND HOUSEHOLD PAPERS10.3 1000 MT PACKAGING MATERIALS10.3.1 1000 MT CASE MATERIALS10.3.2 1000 MT FOLDING BOXBOARD10.3.3 1000 MT WRAPPING PAPERS10.3.4 1000 MT OTHER PAPERS MAINLY FOR PACKAGING10.4 1000 MT OTHER PAPER AND PAPERBOARD N.E.SFor inverse relationships divide 1 by the factor given, e.g. to convert m3 of wood charcoal to mt divide 1 by m3/mt factor of 6 = 0.167Notes:MT = metric tonnes (1000 kg) Unit m3/unitm3 = cubic meters (solid volume) 1000 board feet (sawlogs) 4.53m2 = square meters 1000 board feet (sawnwood) 2.36(s) = solid volume 1000 square feet (1/8 inch thickness) 0.295
cord 3.625Unit Conversion cord (pulpwood) 2.551 inch = 25.4 millimetres cord (wood fuel) 2.121 square foot = 0.0929 square metre cubic foot 0.028321 pound = 0.454 kilograms cubic foot (stacked) 0.018411 short ton (2000 pounds) = 0.9072 metric ton cunit 2.831 long ton (2240 pounds) = 1.016 metric ton fathom 6.1164Bold = FAO published figure hoppus cubic foot 0.0222
hoppus super(ficial) foot 0* = ITTO hoppus ton (50 hoppus cubic feet) 0
Petrograd Standard 4.672stere 1
stere (pulpwood) 0.72prepared February 2004 - updated with RWE June 2007 stere (wood fuel) 0.65
JFSQFOREST SECTOR QUESTIONNAIRE
Conversion Factors
Forest Measures
m3 per MT
Multiply the quantity expressed in units on the right side of "per" with the factor to get the value expressed in units on left side of "per".
m3 per m2
Source: UNECE/FAO Joint Forest Sector Questionnaire, 2009.

32 _______________________________________________________ Forest products conversion factors for the UNECE Region
Annex table 3 Conversion factors used in the European Forest Sector Outlook Study 2005.
Conif
erou
s sa
wnwo
od
Non-
conif
erou
s sa
wnwo
od
Partic
le bo
ard
Fibre
boar
d
Plyw
ood
Vene
er
Mech
anica
l pulp
Chem
ical p
ulp
Semi
-chem
ical
pulp
News
Ot
her p
aper
and
pape
rboa
rd
Reco
vere
d pap
er
felled
m3 /m
3 ro
undw
ood
Albania 2.00 2.00 1.40 2.80 2.50 2.90 1.20 4.50 2.90 3.20 4.00 3.40 1.20 Austria 1.54 1.50 1.30 1.82 2.00 2.20 2.48 4.48 2.86 3.20 4.00 3.39 1.44 Belarus 1.60 1.45 1.60 3.00 2.65 2.00 2.50 5.21 2.90 3.50 4.20 3.80 1.14 Belgium 1.60 1.60 1.40 1.80 1.90 1.90 2.30 4.50 2.90 3.20 4.00 3.40 1.16 Bosnia and Herzegovina 1.80 1.70 1.40 1.80 2.90 2.20 2.50 4.50 2.90 3.20 4.00 3.40 1.25 Bulgaria 1.70 2.10 1.40 2.30 2.50 2.60 2.30 5.30 2.30 3.20 4.00 3.40 1.45 Croatia 1.80 1.70 1.40 1.80 2.90 2.20 2.50 4.50 2.90 3.20 4.00 3.40 1.24 Czech Republic 1.60 1.50 1.50 2.60 2.30 1.70 2.60 5.30 2.90 3.20 4.00 3.40 1.32 Denmark 1.76 1.69 1.44 1.82 2.89 2.20 2.48 4.48 2.86 3.20 4.00 3.39 1.02 Estonia 1.70 1.60 1.40 1.80 2.90 2.20 2.50 4.50 2.90 3.20 4.00 3.40 1.33 Finland 2.10 2.40 1.80 1.50 2.70 2.00 2.40 4.70 2.20 3.20 4.00 3.40 1.28 France 1.81 2.05 1.20 1.80 1.95 1.67 2.48 4.48 2.86 3.20 4.00 3.39 1.48 Germany 1.56 1.46 1.22 1.51 1.94 2.06 2.60 4.70 2.70 3.20 4.00 3.39 1.31 Greece 1.80 1.70 1.40 1.80 2.90 3.10 2.50 4.50 2.90 3.20 4.00 3.40 1.25 Hungary 1.50 1.70 1.60 3.30 1.80 2.00 2.50 4.50 2.90 3.20 4.00 3.40 1.25 Iceland 1.76 1.69 1.44 1.82 2.89 2.20 2.48 4.48 2.86 3.20 4.00 3.39 1.40 Ireland 1.76 1.69 1.44 1.82 2.89 2.20 2.48 4.48 2.86 3.20 4.00 3.39 1.11 Italy 1.76 1.69 1.44 1.82 2.89 2.20 2.48 4.48 2.86 3.20 4.00 3.39 1.12 Latvia 1.70 1.60 1.40 1.80 2.70 2.20 2.50 4.50 2.90 3.20 4.00 3.40 1.37 Lithuania 1.60 1.70 1.80 2.60 2.30 2.20 2.50 4.80 2.90 3.20 4.00 3.40 1.23* Luxembourg 1.60 1.60 1.40 1.80 1.90 1.90 2.30 4.50 2.90 3.20 4.00 3.40 1.15 Netherlands 1.64 1.57 1.44 1.82 1.89 1.89 2.27 4.48 2.86 3.20 4.00 3.39 1.43 Norway 1.76 1.69 1.44 1.82 2.89 2.20 2.39 4.50 2.86 3.20 4.00 3.39 1.25 Poland 1.50 1.40 1.80 1.80 2.30 1.90 2.60 5.30 3.10 3.20 4.00 4.70 1.44 Portugal 1.42 3.52 1.57 1.94 3.10 1.20 2.48 4.48 2.86 3.20 4.00 3.39 1.23 Republic of Moldova 2.00 2.00 1.40 2.80 2.50 2.90 1.20 4.48 2.86 3.50 4.20 3.80 1.76 Romania 1.70 1.60 1.70 2.10 2.30 2.90 2.90 6.40 3.20 3.20 4.00 3.40 1.43 Russian Federation 1.60 1.50 1.60 3.00 2.70 2.00 2.50 5.20 2.90 3.50 4.20 3.80 1.45 Serbia and Montenegro 1.80 1.70 1.40 1.80 2.90 2.20 2.50 4.50 2.90 3.20 4.00 3.40 1.25 Slovakia 1.80 1.70 1.40 1.80 2.90 2.20 2.50 4.50 2.90 3.20 4.00 3.40 1.44 Slovenia 1.80 1.70 1.40 1.80 2.90 2.20 2.50 4.50 2.90 3.20 4.00 3.40 1.15 Spain 1.42 3.52 1.57 1.94 3.10 1.20 2.48 4.48 2.86 3.20 4.00 3.39 1.12 Sweden 2.00 1.90 1.40 1.70 2.30 2.20 2.30 4.70 2.20 3.20 4.00 3.39 1.21 Switzerland 1.70 1.80 1.40 1.60 1.50 1.90 2.50 4.50 2.90 3.20 4.00 3.40 1.37 TFYR Macedonia 1.80 1.70 1.40 1.80 2.90 2.20 2.50 4.50 2.90 3.20 4.00 3.40 1.10 Turkey 1.80 1.70 1.40 1.80 2.90 2.20 2.50 4.50 2.90 3.20 4.00 3.40 1.22 Ukraine 1.60 1.50 1.60 3.00 2.70 2.00 2.50 5.20 2.90 3.50 4.20 3.80 1.33 United Kingdom 1.71 1.61 1.40 1.80 2.89 2.20 2.16 4.48 2.86 3.20 4.00 3.39 1.30 Note: Lithuania revised their felled m3 to m3 roundwood in January 2010. The number that was originally included in this table was 1.32 Source: UNECE/FAO, 2005.

Forest products conversion factors for the UNECE Region________________________________________________________ 33
Annex table 4 Country groupings with similar forest product sectors
Country Group Albania 1Bosnia and Herzegovina 1Croatia 1Montenegro 1Serbia 1The FYR of Macedonia 1Republic of Moldova 1Andorra 2Portugal 2Spain 2Austria 3Slovenia 3Belgium 4Luxembourg 4Netherlands 4Denmark 4Bulgaria 5Romania 5Turkey 6Cyprus 6Greece 6Israel 6Malta 6Czech Republic 7Slovakia 7Hungary 7Estonia 8Latvia 8Lithuania 8Finland 9Norway 9Sweden 9France 10Monaco 10Germany 11Ireland 12United Kingdom 12Italy 13San Marino 13Liechtenstein 14Switzerland 14Belarus 15Poland 15Ukraine 15Armenia 16Azerbaijan 16Georgia 16Kazakhstan 16Kyrgyzstan 16Tajikistan 16Turkmenistan 16Uzbekistan 16Russian Federation 17Canada 18United States of America 18Iceland 19
Note: These groupings were proposed by the Task Force so that known conversion factors from a country in a group can be used for another country within the same group when conversion factors are unknown.
Source: UNECE/FAO, 2009

34 _______________________________________________________ Forest products conversion factors for the UNECE Region
Annex table 5 Conversion factors from ECE/TIM/55
Country Con
ifero
us s
awnw
ood
Non
-con
ifero
us s
awnw
ood
Par
ticle
boa
rd
Fibr
eboa
rd
Ply
woo
d
Ven
eer
Mec
hani
cal p
ulp
Che
mic
al p
ulp
Sem
i-che
mic
al p
ulp
Austria 1.55 1.50 1.30 1.82 -- -- -- -- -- Denmark 2.17 2.63 2.14 -- -- -- -- -- -- Finland 1.96 1.66 1.61 -- -- -- 2.95 4.50 2.55 France 1.57 1.89 1.75 2.43 4.00 4.00 3.00 -- -- Germany 1.51 1.46 1.22 1.51 1.94 -- -- -- -- Italy 1.61 1.67 2.28 3.65 3.00 -- -- -- -- Luxembourg 1.90 1.70 -- -- -- -- -- -- -- Netherlands 1.67 1.73 -- -- -- 2.43 2.65 -- -- Norway 1.98 2.00 1.43 1.13 -- -- 2.45 4.91 2.86 Portugal 2.90 1.93 2.14 2.73 2.25 2.26 -- 3.29 -- Spain 1.75 1.55 1.50 1.90 2.10 2.10 -- -- -- Sweden 2.00 1.80 1.34 1.70 2.40 -- -- -- -- Switzerland 1.67 1.82 1.59 1.74 1.50 1.50 2.50 5.00 -- United Kingdom 1.75 1.72 1.37 2.26 -- -- 2.31 -- -- Bulgaria 1.68 2.12 1.43 2.27 2.64 2.46 -- -- -- Czechoslovakia 1.57 1.43 1.46 2.34 -- 2.23 2.69 5.01 2.90 Poland 1.49 1.36 1.60 -- 2.19 2.23 2.74 5.46 3.29 Turkey 1.45 1.33 -- -- 2.36 2.36 -- -- -- Belarus 1.46 1.51 1.65 -- -- 2.59 -- 3.86 -- USSR 1.60 1.45 1.70 2.88 -- 2.72 2.60 5.33 3.10 Cyprus 2.38 -- 1.44 -- -- 1.47 -- -- -- US 2.02 2.07 1.34 1.58 -- 2.08 2.38 3.99 2.34 Canada -- -- -- -- 2.13 -- 2.41 5.33 3.12
Source: UNECE/FAO, 1987

Forest products conversion factors for the UNECE Region________________________________________________________ 35
Some facts about the Timber Committee
The Timber Committee is a principal subsidiary body of the UNECE (United Nations Economic Commission for Europe) based in Geneva. It constitutes a forum for cooperation and consultation between member countries on forestry, the forest industry and forest product matters. All countries of Europe, the Commonwealth of Independent States, the United States, Canada and Israel are members of the UNECE and participate in its work.
The UNECE Timber Committee shall, within the context of sustainable development, provide member countries with the information and services needed for policy- and decision-making with regard to their forest and forest industry sectors (“the sector”), including the trade and use of forest products and, when appropriate, will formulate recommendations addressed to member Governments and interested organizations. To this end, it shall:
1. With the active participation of member countries, undertake short-, medium- and long-term analyses of developments in, and having an impact on, the sector, including those offering possibilities for the facilitation of international trade and for enhancing the protection of the environment;
2. In support of these analyses, collect, store and disseminate statistics relating to the sector, and carry out activities to improve their quality and comparability;
3. Provide the framework for cooperation e.g. by organizing seminars, workshops and ad hoc meetings and setting up time-limited ad hoc groups, for the exchange of economic, environmental and technical information between governments and other institutions of member countries required for the development and implementation of policies leading to the sustainable development of the sector and to the protection of the environment in their respective countries;
4. Carry out tasks identified by the UNECE or the Timber Committee as being of priority, including the facilitation of subregional cooperation and activities in support of the economies in transition of central and eastern Europe and of the countries of the region that are developing from an economic perspective;
5. It should also keep under review its structure and priorities and cooperate with other international and intergovernmental organizations active in the sector, and in particular with the FAO (Food and Agriculture Organization of the United Nations) and its European Forestry Commission, and with the ILO (International Labour Organization), in order to ensure complementarity and to avoid duplication, thereby optimizing the use of resources.
More information about the Committee’s work may be obtained by writing to:
UNECE/FAO Timber Section Trade and Timber Division United Nations Economic Commission for Europe Palais des Nations CH-1211 Geneva 10, Switzerland Fax: +41 22 917 0041 E-mail: [email protected] http://www.unece.org/timber

36 _______________________________________________________ Forest products conversion factors for the UNECE Region
UNECE/FAO Publications
Geneva Timber and Forest Study Papers
Private Forest Ownership in Europe ECE/TIM/SP/25
Forest Products Annual Market Review 2008-2009 ECE/TIM/SP/24
Forest Products Annual Market Review 2007-2008 ECE/TIM/SP/23
Forest Products Annual Market Review, 2006-2007 ECE/TIM/SP/22
Forest Products Annual Market Review, 2005-2006 ECE/TIM/SP/21
European Forest Sector Outlook Study: 1960 – 2000 – 2020, Main Report ECE/TIM/SP/20
Forest policies and institutions of Europe, 1998-2000 ECE/TIM/SP/19
Forest and Forest Products Country Profile: Russian Federation ECE/TIM/SP/18
(Country profiles also exist on Albania, Armenia, Belarus, Bulgaria, former Czech and Slovak Federal Republic, Estonia, Georgia, Hungary, Lithuania, Poland, Romania, Republic of Moldova, Slovenia and Ukraine) Forest resources of Europe, CIS, North America, Australia, Japan and New Zealand ECE/TIM/SP/17
State of European forests and forestry, 1999 ECE/TIM/SP/16
Non-wood goods and services of the forest ECE/TIM/SP/15
The above series of sales publications and subscriptions are available through United Nations Publications Offices as follows:
Orders from Africa, Europe and the Middle East should be sent to: Sales and Marketing Section, Room C-113 United Nations Palais des Nations CH - 1211 Geneva 10, Switzerland
Fax: + 41 22 917 0027 E-mail: [email protected]
Orders from North America, Latin America and the Caribbean, Asia and the Pacific should be sent to: Sales and Marketing Section, Room DC2-853 United Nations 2 United Nations Plaza New York, N.Y. 10017 United States, of America
Fax: + 1 212 963 3489 E-mail: [email protected]
Web site: http://www.un.org/Pubs/sales.htm
* * * * *

Forest products conversion factors for the UNECE Region________________________________________________________ 37
* signifies web downloads only
Geneva Timber and Forest Discussion Papers (original language only)
The Importance of China’s Forest Products Markets to the UNECE Region ECE/TIM/DP/57 Proceedings from Grenoble workshop on wood mobilization ECE/TIM/DP/56 Harvested Wood Products in the Context of Climate Change Policies: Workshop Proceedings - 2008 *ECE/TIM/DP/55 The Forest Sector in the Green Economy ECE/TIM/DP/54 National Wood Resources Balances: Workshop Proceedings *ECE/TIM/DP/53 Potential Wood Supply in Europe *ECE/TIM/DP/52 Wood Availability and Demand in Europe *ECE/TIM/DP/51 Forest Products Conversion Factors for the UNECE Region ECE/TIM/DP/49 Mobilizing Wood Resources : Can Europe's Forests Satisfy the Increasing Demand for Raw Material and Energy Under Sustainable Forest Management? Workshop Proceedings - January 2007 *ECE/TIM/DP/48 European Forest Sector Outlook Study: Trends 2000-2005 Compared to the EFSOS Scenarios ECE/TIM/DP/47 Forest and Forest Products Country Profile; Tajikistan *ECE/TIM/DP/46 Forest and Forest Products Country Profile: Uzbekistan ECE/TIM/DP/45 Forest Certification – Do Governments Have a Role? ECE/TIM/DP/44 International Forest Sector Institutions and Policy Instruments for Europe: A Source Book ECE/TIM/DP/43 Forests, Wood and Energy: Policy Interactions ECE/TIM/DP/42 Outlook for the Development of European Forest Resources ECE/TIM/DP/41 Forest and Forest Products Country Profile: Serbia and Montenegro ECE/TIM/DP/40 Forest Certification Update for the UNECE Region, 2003 ECE/TIM/DP/39 Forest and Forest Products Country Profile: Republic of Bulgaria ECE/TIM/DP/38 Forest Legislation in Europe: How 23 Countries Approach the Obligation to Reforest, Public Access and Use of Non-Wood Forest Products ECE/TIM/DP/37 Value-Added Wood Products Markets, 2001-2003 ECE/TIM/DP/36 Trends in the Tropical Timber Trade, 2002-2003 ECE/TIM/DP/35 Biological Diversity, Tree Species Composition and Environmental Protection in the Regional FRA-2000 ECE/TIM/DP/33 Forestry and Forest Products Country Profile: Ukraine ECE/TIM/DP/32 The Development of European Forest Resources, 1950 To 2000: a Better Information Base ECE/TIM/DP/31 Modelling and Projections of Forest Products Demand, Supply and Trade in Europe ECE/TIM/DP/30 Employment Trends and Prospects in the European Forest Sector ECE/TIM/DP/29 Forestry Cooperation with Countries in Transition ECE/TIM/DP/28 Russian Federation Forest Sector Outlook Study ECE/TIM/DP/27 Forest and Forest Products Country Profile: Georgia ECE/TIM/DP/26 Forest certification update for the UNECE region, summer 2002 ECE/TIM/DP/25 Forecasts of economic growth in OECD and central and eastern European countries for the period 2000-2040 ECE/TIM/DP/24 Forest Certification update for the UNECE Region, summer 2001 ECE/TIM/DP/23 Structural, Compositional and Functional Aspects of Forest Biodiversity in Europe ECE/TIM/DP/22 Markets for secondary processed wood products, 1990-2000 ECE/TIM/DP/21 Forest certification update for the UNECE Region, summer 2000 ECE/TIM/DP/20 Trade and environment issues in the forest and forest products sector ECE/TIM/DP/19 Multiple use forestry ECE/TIM/DP/18 Forest certification update for the UNECE Region, summer 1999 ECE/TIM/DP/17 A summary of “The competitive climate for wood products and paper packaging: the factors causing substitution with emphasis on environmental promotions” ECE/TIM/DP/16 Recycling, energy and market interactions ECE/TIM/DP/15 The status of forest certification in the UNECE region ECE/TIM/DP/14 The role of women on forest properties in Haute-Savoie (France): Initial research ECE/TIM/DP/13 Interim report on the Implementation of Resolution H3 of the Helsinki Ministerial Conference on the protection of forests in Europe (Results of the second enquiry) ECE/TIM/DP/12 Manual on acute forest damage ECE/TIM/DP/7 International Forest Fire News (two issues per year)

38 _______________________________________________________ Forest products conversion factors for the UNECE Region
The above series of publications may be obtained free of charge from:
UNECE/FAO Timber Section Trade and Timber Division United Nations Economic Commission for Europe Palais des Nations CH-1211 Geneva 10, Switzerland Fax: +41 22 917 0041 E-mail: [email protected] Downloads are available at: http://timber.unece.org/index.php?id=126

UNECE/FAO GENEVA TIMBER AND FOREST DISCUSSION PAPERS
The objective of the Discussion Papers is to make available to a wider audience work carried out, usually by national experts, in the course of UNECE/FAO activities. The Discussion Papers do not represent the final official outputs of particular activities but rather contributions, which, because of their subject matter or quality, deserve to be disseminated more widely than to the restricted official circles from whose work they emerged. The Discussion Papers are also utilized when the subject matter is not suitable (e.g. because of technical content, narrow focus, specialized audience) for distribution in the UNECE/FAO Geneva Timber and Forest Study Paper series. Another objective of the Discussion Papers is to stimulate dialogue and contacts among specialists.
In all cases, the author(s) of the discussion papers are identified, and the papers are solely their responsibility. The designation employed and the presentation of material in this publication do not imply the expression of any opinion whatsoever on the part of the secretariat of the United Nations concerning the legal status of any country, territory, city or area, or of its authorities, or concerning the delimitation of its frontiers or boundaries. The UNECE Timber Committee, the FAO European Forestry Commission, the Governments of the authors’ country and the UNECE/FAO secretariat, are neither responsible for the opinions expressed, nor the facts presented, nor the conclusions and recommendations in the Discussion Paper.
In the interests of economy, Discussion Papers are issued in the original language, with only minor language editing and final layout by the secretariat. They are distributed automatically to nominated forestry libraries and information centres in member countries.
This Discussion Paper is available on the Timber Section website at: http//www.unece.org/trade/timber.
The Discussion Papers are available on request from the secretariat. Those interested in receiving them on the continuing basis should contact the secretariat as well. Your comments are most welcome and will be referred to the authors:
UNECE/FAO Timber Section Trade and Timber Division United Nations Economic Commission for Europe Palais des Nations CH-1211 Geneva 10, Switzerland Fax: +41 22 917 0041 E-mail: [email protected] http://www.unece.org/timber

Printed at United Nations Geneva United Nations publication GE.XX-XXXXX – December 2009 ISSN 1020-7228 ECE/TIM/DP/49
Forest Product Conversion Factors for the UNECE Region
This publication provides ratios of raw material input to the output of wood-based forest products for 16 countries of the UNECE region. Analysts, policymakers, forest practitioners and forest-based manufacturers often have a need for this information when looking into the future of the forest sector via outlook studies, but also for a basic understanding of the drivers of efficiency, feasibility and economics of the sector. The publication includes explanations of the units of measure, the drivers of the ratios, as well as information on physical properties of wood-based forest products. Finally, where reported factors were unavailable, factors from other sources were given.
UNECE Timber Committee and FAO European Forestry Commission
Further information about forests and forest products, as well as information about the UNECE Timber Committee and the FAO European Forestry Commission is available on the website www.unece.org/trade/timber
Information about the UNECE may be found at www.unece.org and information about FAO may be found at www.fao.org
UNECE/FAO Timber Section Trade and Timber Division United Nations Economic Commission for Europe Palais des Nations CH-1211 Geneva 10, Switzerland Fax: +41 22 917 0041 E-mail: [email protected] http://www.unece.org/timber