forest sector information report annual review 2017
TRANSCRIPT

FOREST SECTOR INFORMATION REPORT
Annual Review
2017
GUYANA FORESTRY COMMISSION
2
Contents
GLOSSARY OF TERMS .......................................................................................................................... 5
1. Introduction .......................................................................................................................................... 6
2. Executive Summary .............................................................................................................................. 7
3. Economic Environment ........................................................................................................................ 9
3.1 The International Economy .......................................................................................................... 9
3.1.1 Economic Growth ................................................................................................................. 9
3.1.2 Flows to Developing Countries .......................................................................................... 11
3.2 International Forestry Environment ................................................................................................ 12
3.2.1 International Tropical Timber Market Summary ..................................................................... 12
3.2.2 Latin America ............................................................................................................................. 13
3.2.3 Markets Trend for Guyana Timber Export ............................................................................... 14
4. The Guyana Economy ......................................................................................................................... 15
4.1 Economic Growth ....................................................................................................................... 15
4.2 The Forest Sector ........................................................................................................................ 16
5. Contribution to GDP ........................................................................................................................... 26
6. Forestry Sector Structure ................................................................................................................... 27
6.1 Land Allocation Breakdown ....................................................................................................... 27
6.2 Other Forest Sector License ....................................................................................................... 28
7. Production .......................................................................................................................................... 29
7.1 Production Volumes ................................................................................................................... 30
7.1.1 Log Production ........................................................................................................................ 30
7.1.2 Log Production by GFC Exporting Regions and Forest Stations ....................................... 31
7.2 Monthly Production of Primary Lumber ................................................................................... 31
7.2.1 Primary Lumber by GFC Reporting Regions and Forest Stations ...................................... 32
7.3 Roundwood Production ............................................................................................................. 32
7.4 Splitwood Production ................................................................................................................. 33
7.5 Fuelwood Production ................................................................................................................. 34
7.6 Plywood and Veneer Production ............................................................................................... 34
7.7 Non- Timber Forest Products ..................................................................................................... 35
7.8 Comparative Production Volume Analysis ................................................................................ 35
8. Employment and Domestic Price ....................................................................................................... 36
Employment ........................................................................................................................................... 36

3
Domestic Prices ...................................................................................................................................... 37
9.1 Export Summary ......................................................................................................................... 38
9.2 Log Export ................................................................................................................................... 40
9.3 Sawnwood Export ...................................................................................................................... 40
9.4 Roundwood Export..................................................................................................................... 41
9.5 Splitwood Export ........................................................................................................................ 42
9.6 Plywood Export .......................................................................................................................... 42
9.7 Other Value Added Export ......................................................................................................... 43
9.8 Export by Destination ................................................................................................................. 43
9.8.1 Log Export by Destination ...................................................................................................... 43
9.8.2 Sawnwood Export by Destination ......................................................................................... 44
9.8.3 Roundwood Export by Destination ....................................................................................... 44
9.8.4 Splitwood Export by Regional Destination ............................................................................ 45
9.8.5 Plywood Export by Destination ............................................................................................. 45
9.8.6 Forestry Sector Export Earnings by Destination .................................................................... 46
9.9 Export Prices ............................................................................................................................... 47
10. References ...................................................................................................................................... 48
11. Appendices ..................................................................................................................................... 49
4
ABBREVIATIONS CET Common External Tariff
CFMA Community Forest Management Agreement
CFO Community Forestry Organisation
COTED Council for Trade and Economic Development
ECLAC Economic Commission for Latin America and the Caribbean
EMAC Economic Community of Central African States
EMDE Emerging Markets and Developing Economies
ESA European Space Agency
FAO Food and Agriculture Organisation of the United Nations
FDI Foreign Direct Investment
FLEGT (European Union) Forest Law Enforcement, Governance and Trade
FOB Free on Board Price
FPA Forest Products Association
FPDMC Forest Products Development and Marketing Council Inc. (Guyana)
FTCI Forestry Training Centre Inc. (Guyana)
GDP Gross Domestic Product
GFC Guyana Forestry Commission
GIS Geographic Information System
GMSA Guyana Manufacturers and Services Association
GOFC-GOLD Global Observation of Forest and Land Cover Dynamics
GRA Guyana Revenue Authority
GSDS Green State Development Strategy (Guyana)
GTLAS Guyana Timber Legality Assurance System
IMF International Monetary Fund
ITTO International Tropical Timber Organisation
LAC Latin America and the Caribbean
LCDS Low Carbon Development Strategy
M & A Mergers and Acquisitions
MIER Malaysian Institute of Economic Research
MoIPA Ministry of Indigenous Peoples’ Affairs (Guyana)
MRVS Monitoring Reporting and Verification System for REDD+
NTFP Non Timber Forest Product
REDD+ Reducing Emissions from Deforestation and Forest Degradation Plus
SFA State Forest Authorisation
SFB Brazilian Forest Service
SFEP State Forest Exploratory Permit
SFP State Forest Permission
TSA Timber Sales Agreement
UNCTAD United Nations Conference on Trade and Development
VAT Value Added Tax
VPA Voluntary Partnership Agreement
WCL Wood Cutting Lease

5
GLOSSARY OF TERMS
Dressed Lumber Firewood Fuelwood
Wood sawn lengthways from Logs, further processed by use of planes, etc. Includes parts of trees made up into bundles or loads, or cut in a manner in which it is usual to cut wood for burning, and all refuse wood generally, but does not include straight logs or poles of any kind. Wood in the rough, from trunks and branches of trees, to be used as fuel for purposes such as cooking, heating and power production. Categories of Fuelwood are converted to Charcoal.
Non-timber Forest Products Piles Poles Posts Primary Lumber Round Logs Roundwood
All biological material, other than timber products, that may be extracted from natural ecosystems, either for commercial purposes, for use within the household or for social, cultural or religious purposes. Also known as Non-wood Forest Products. Long straight pieces usually destined to be driven into the ground by impact, or pressed with mechanical pressure. Straight pieces of 5m or more in length taken from tree trunks. They are used principally to support telephone, telegraph and electrical transmission lines and for scaffolding. Round, hewn, squared or split wood, usually less than 3m in length, but possibly up to 5m, used for fencing, guard rails and the like. This includes Chainsaw Lumber and Lumber emanating from Portable Mills converted in the forest and declared at first point of declaration as Primary Lumber. A bole or a large branch after felling. Under the ITTO definition it is referred to as Industrial Roundwood. Wood in its natural state as felled or otherwise harvested, with or without bark, round, split, roughly squared or in other forms. Roundwood includes spars, posts, poles (Wallaba) and piles (Greenheart, Kakaralli and Mora).
Sawnwood Shingles Spars
Dressed lumber, undressed lumber, sleepers and pallets. Squares of usually Wallaba (Eperua falcata) wood used to construct roofs and for panelling purposes. Saplings 15-25cm in diameter.
Splitwood Timber
Comprises Paling and Vat Staves and Shingles. Includes a tree or any ligneous part of a tree whether standing, fallen or felled, and all wood, whether or not sawn, split, hewn or otherwise cut up or fashioned.
Undressed Lumber Wattles
Wood in the rough, sawn lengthways from Logs. Saplings less than 8cm in diameter.

6
1. Introduction
The Forest Sector Information Report (FSIR) focuses on the performance of the Forestry Sector in Guyana
for the year 2017 with a comparison done with the year 2016. Production and export of various forest
products based on Guyana Forestry Commission (GFC) data are assessed in comparison with the previous
year’s performance. Additionally, the Report compares summary averages of domestic and export prices
and sector employment levels.
Included as well, is a summary of State Forest lands allocation across concession classes (with areas
classified according to GFC designated use/size categories) for 2017 and the Forest Sector’s contribution
(as traditionally measured in official national statistics) to Guyana’s real Gross Domestic Product (GDP)
over the past few years, using the new rebased and re-benchmarked series to year 2006.
Before addressing the Forest Sector in Guyana, a qualitative background summary, covering
changes/features and outlook in the local and international economies, is provided. This Section includes
developments in the international tropical timber market with emphasis on the Latin America/Caribbean
region.
In the main body of the report, production data presents comparisons of the volumes of various forest
products by product and species categories (where applicable), between 2016 and 2017, and across the
reporting districts (as designated for GFC purposes, and corresponding to the three counties of Demerara,
Berbice and Essequibo), by their respective sub-divisions referred to as Forest Stations.
Export data is analysed in terms of both volume and value for various product types, and the market
destination for the various products of this sector. An analysis of local FOB market price of forest produced,
along with summary totals of forest sector employment, are outlined.
The FSIR, further provides an Annex, with various tables, which allows for further interpretation of
information given in the production and export sections of the Report.
7
2. Executive Summary
Total production of 384,445m3 was recorded for 2017. Log production of 280,891m3, Roundwood of
21,070m3, Sawnwood totalling 47,938m3, along with Plywood of 7,333m3, all contributed to forest
production for 2017. Other forest products produced included Fuelwood (comprising of Charcoal and
Firewood), Splitwood (Shingles and Paling Staves), Wattles, and Manicole Palm, were also produced in
the year.
In year 2017, Log production increased by 3.15% when compared to that of 2016. The main class
responsible for the increase was: Class 1, increasing by 28% when compared to that of 2016. Within the
Special Category group, production volume decreases was recorded for Greenheart and Purpleheart logs,
(by 6% and 69% respectively), when compared with year 2016. However, Other Special Category species
(Brown Silverballi, Bulletwood, Letterwood, and Red Cedar), recorded an increase of 28% when compared
to that of 2016.
The production of Roundwood increased by 41.46% when compared to 2016. Greenheart piles production
of 25,531m3, followed by Wallaba Poles of 5,739m3, were the main products responsible for this significant
increase. Kakaralli piles also recorded increased production (148%) in year 2017, when compared with the
corresponding production level recorded in 2016. Wallaba Post and Spars also contributed to the total
Roundwood production, although for these products, 2017 production volume recorded declines when
compared to that of 2016.
Primary Lumber production for 2017 was recorded as 47,938m3, increasing by 13.92% when compared to
same of 2016, for which production was recorded at 42,082m3. General Special Category products
increased by 6.83%. In this group, Greenheart lumber production declined by 11.99%, while all other
species (Purpleheart and Others Species) increased in production.
With respect to the various classes of lumber - Class 1 lumber was produced in a larger quantity; however,
Class 2 lumber recorded the highest percentage increase when compared to 2016. Total combined
production for this category was recorded at 39,401m3.
Plywood production of 7,333m3 was produced in 2017. Plywood production fell 51% below what was
produced in 2016.
Total export value of forest Products for 2017 is recorded at US$39.1M. For 2017, forest products export
value declined by 6%, down from US$41.9M which was recorded in 2016.
Logs export for 2017 increased by 2.1% in volume but decreased by 10% in value when compared to 2016.
On the other hand, Sawnwood decrease in both volume (15%) and Value (12%) when compared to 2016
figures. Within this category (Sawnwood), Dressed Sawnwood decreased in both volume and value by

8
31% and 20%, respectively. However, Undressed Sawnwood recorded increased in value by 0.76% but
volume declined by 2%.
Roundwood export declined in 2017, both in volume and value by 15% and 22%, respectively, when
compared to 2017. Within the Roundwood category, the most improved export product in terms of volume
and value was Wallaba poles. Greenheart Piles continue to be the highest value earner (US$2.4M) during
2017, although it decreased both in export volume and Value.
The export of Plywood recorded increase in both in volume and value during 2017. Plywood earning of
US$1.3M was recorded for 2017, increasing by 4.3% when compared to that of 2016.
Guyana’s forest products are mainly exported to the six main regions namely, North America, South
America, Asia Pacific, Latin American and the Caribbean, Europe and Africa.

9
3. Economic Environment
3.1 The International Economy
3.1.1 Economic Growth Global GDP growth is estimated to have picked up from 2.4% in 2016 to 3% in 2017. The upturn is broad-
based, with growth increasing in more than half of the world’s economies. In particular, the rebound in
global investment growth which accounted for three quarters of the acceleration in global GDP growth from
2016 to 2017 was supported by favourable financing costs, rising profits, and improved business sentiment
across both advanced economies and emerging market and developing economies.
Global growth is projected to edge up to 3% in 2018, as the cyclical momentum continues, and then slightly
moderate to an average of 3.1% in 2019-20.
In advanced economies, growth in 2017 is estimated to have rebounded to 2.3%, driven by a pickup in
capital spending, a turnaround in inventories, and strengthening external demand. While growth
accelerated in all major economies, the improvement was markedly stronger than expected in the Euro
Area.
According to World Bank Group, 2018 growth in Emerging Markets and Developing Economies (EMDEs)
is expected to accelerate, reaching 4.5% in 2018 and an average of 4.7% in 2019-20. This mainly reflects
a further pickup of growth in commodity exporters, which is forecast to rise to 2.7% in 2018 and to an
average of 3.1% in 2019-20, as oil and other commodity prices firm and the effects of the earlier commodity
price collapse dissipate. Growth in commodity importers is projected to remain stable, averaging 5.7% in
2018-20, as a gradual slowdown in China is offset by a pickup in some other large economies.
Within the broader group of EMDEs, growth in low-income countries is projected to rise to 5.4% in 2018
and to 5.6% on average in 2019-20, as conditions gradually improve in oil and metals-exporting economies.
Global activity that started pickup in the second half of 2016 gained momentum in the first half of 2017 but
continued at a buoyant rate during the latter part of the year. Looking back to a year and a half ago, the
world economy faced stalling growth and financial market turbulence. However, the picture now is very
different, with accelerating growth in Europe, Japan, China, and the United States.
Across the world, financial conditions remain buoyant, and financial markets seem to be expecting little
turbulence going forward, even as the United States Federal Reserve continues its monetary normalization
process and the European Central Bank inches up to its own.
Economists contend that these positive developments give good cause for greater confidence, but neither
policymakers nor markets should be lulled into complacency. Upon closer examination, it is suggested that
the global recovery may not be sustainable, since not all countries are participating, inflation often remains
below target with weak wage growth, and the medium-term outlook still disappoints in many parts of the
world.

10
Economic pundits are cautioning that the recovery is also vulnerable to serious risks. In particular, financial
markets that ignore these risks are susceptible to disruptive re-pricing, and in return are sending a
misleading message to policymakers. However, it is cautioned that policymakers, need to maintain a longer-
term vision and seize the current opportunity to implement the structural and fiscal reforms needed for
greater resilience, productivity, and investment.
According to the International Monetary Fund 2017, the current recovery is incomplete in some important
ways: within countries, across countries, and over time.
In particular, growth in China and other parts of emerging Asia remains strong, and the still-difficult
conditions faced by several commodity exporters in Latin America, the Commonwealth of Independent
States, and sub-Saharan Africa show some signs of improvement. In advanced economies, the notable
2017 growth pickup is broad based, with stronger activity in the United States and Canada, the Euro area,
and Japan. Prospects for medium-term growth are more subdued, however, as negative output gaps shrink
leaving less scope for cyclical improvement and demographic factors and weak productivity weigh on
potential growth.
With respect to country specifics, China’s growth forecast for 2017 was revised upwards to 6.5% from 6.2%
that was projected at the latter half of 2016 on expectations of continued policy support. However according
to the IMF “continued reliance on policy stimulus measures, with rapid expansion of credit and slow
progress in addressing corporate debt, especially in hardening the budget constraints of state-owned
enterprises, raises the risk of a sharper slowdown or a disruptive adjustment since these risks can be
exacerbated by capital outflow pressures, especially in a more unsettled external environment”.

11
3.1.2 Flows to Developing Countries
Global flows of foreign direct investment (FDI) fell by 16% in 2017 to an estimated $1.52 trillion, down from
a revised $1.81 trillion in 2016, according to the latest UNCTAD Global Investment Trends Monitor.
According to the report, global FDI continues to struggle after the recovery from the 2008 financial crisis,
growth remains sluggish and will continue to be for the next few years.
According to the UNCTAD Global Investment Trends Monitor 2018, the principal factor behind the global
decline was due to a slump in FDI flows to developed countries by (-27%). Particularly, a strong decrease
in flows was reported in Europe (-27%) as well as in North America (-33%), mainly due to a return to prior
levels of inflows in the United Kingdom and the United States after spikes in 2016.
UNCTAD further contended that the decline was tempered by an 11% growth in flows to other developed
economies, principally Australia. Hence, FDI to developing economies remained stable overall, at an
estimated $653 billion, 2% more than the previous year. For developed economies, inflows rose by 2% to
an estimated US$653B, which is partially due to modest increases in Asia, and Latin America and the
Caribbean.
Cross borders mergers and acquisitions (M&A) increased by 44% across developing sub-regions during
2017 from US$69B to US$100B, according to the report.
FDI flows to Latin America and the Caribbean is recorded at 3% higher than that of 2016, estimated at
US$143B, representing the first rise in approximately five years. However, this still falls 25% below the level
reached in 2012, during the apex of the commodity explosion. UNCTAD posits that for 2017 the Latin
America and the Caribbean region had modest economic growth. This growth began to push investors to
start looking for investment opportunities particularly in Brazil. The report stated that most of the investment
companies were Brazilian owned, hence this pushed up FDI flows to Brazil from US$58B to an estimated
US$60B. Mexico came in second in FDI flows with an estimated US$29B.
Flows to Central America and the Caribbean, which excludes offshore financial companies, remained
stable. FDI flows to mainland countries such as Chile, Colombia and Peru reported decline by 44%, 1%
and 20% respectively, since FDI was dependent on the extractive industries. (UNCTAD 2018)
During 2017, FDI flows to transitional economies declined by 17% to approximately US$55B, which is the
lowest it has dropped since 2005. UNCTAD explained that the two main sub-regions: South and East
Europe, experienced opposing trend for 2017.

12
3.2 International Forestry Environment
3.2.1 International Tropical Timber Market Summary
Markets in Europe have maintained a trade surplus in wood furniture since 2011 when exports to countries
outside of the EU block surpassed imports from outside the EU. According to reports, this surplus remained
broadly flat between the start of 2015 and the first quarter of 2016 (averaging close to Euro3 billion per
annum), as both imports and exports were stable.
Weak demand has resulted in some prices weakness for species which are most susceptible to even small
shifts in demand. The ITTO summaries further explain that large scale buyers are overstocked with high
end species and are holding off on imports. Markets analysis conclude that this situation is adding to the
slackening off in prices being offered by importers.
Asian markets on the other hand are reported as quite robust. Importers in China have once again made
their presence known by actively buying in larger than usual quantities, which has lifted the price on specific
peeler logs for veneer face. There is a continued interest by both Chinese and Indians consumers for large
size peeler logs for sliced veneer and for flooring. According to ITTO, this has helped slow the slide in FOB
prices for logs that have poor demand in Europe.
Reports out of Africa state that the Gabon government continued to encourage timber companies to invest
in value added processing such as furniture. Although, even with constant encouragement, local timber
companies has remained averted to this venture. Most of the companies’ argument is that the local markets
remain too small to support large scale furniture manufacturing and the high taxes levied on exports even
to neighbouring Economic Community of Central African States (EMAC) discourages investment in
downstream processing.
Reports out of Ghana indicate that the private sector welcomes the creation of a Ghanaian Business
Ministry. The newly elected government in Ghana has signalled its intention to create a Ministry of Business
Development, which would be aimed at accelerating and strengthening private sector growth. Both private
and other government agencies in Ghana agreed that the initiative is both a positive and a timely move.
The private sector hopes that the new ministry will prioritise its intervention towards business growth, with
a focused on manufacturing sub-sector as the seed-bed of the industry and an engine of growth in the
economy.
Over in Asia, Malaysia achieved economic growth of 0.3% in Gross Domestic Products over initial projected
figures. According to the Malaysian Institute of Economic Research (MIER) Gross Domestic Product (GDP)
growth was estimated at 4.2%. However, growth amassed to 4.5%, against previous projected levels for
2016. ITTO reports state that according to the Malaysian Institute of Economic Research (MIER),
anticipates the economy will perform better in 2017 if the trade balance momentum continues. GDP growth
forecast for 2017 was revised downwards to 4.5% from its previous forecast of between 4.5% and 5.5%.

13
Indonesia has announced that its first shipment of FLEGT timber has arrived in Europe. According to reports
the first shipment of legally verified timber, arrived in the UK in early January, and more is expected to arrive
as the year continued. Further, the World Bank has reported that fiscal policy reforms and the improved
investment climate are expected to boost the Indonesian economy. Based on reports, Indonesia has
improved its fiscal credibility but needs to accelerate tax administration and policy reforms in order to
increase tax revenue.
India has announced that there has been a change in the market of logs and Lumber. The ITTO Reports
summarise that over the past five years, there has been a steady decline in log imports but that over the
same period, Sawnwood imports have grown almost 200%. According to the report, the imports of good
quality Sawnwood of appropriate dimension leads to a reduction of excesses which is a key concern of
door manufacturers, construction companies and furniture makers.
Moving to the South American region, ITTO reported that in Brazil, there has been a recovery of the furniture
sector in 2016. Also, the Brazilian Forest Service (SFB) has established an incentive programme for forest
concessionaires (Procof), setting out revised rules and payment schedules for forest products harvested
within national forests under forest concession. Under the new scheme companies can postpone payments
due to the Forest Service for up to 14 months without fines and interest. The aim of this is to relieve the
pressures on company cash flows without compromising the financial obligations to the federal government.
This scheme is apparently a temporary measure to take account of the country's macroeconomic
environment and its impacts on the enterprises.
3.2.2 Latin America
According to ECLAC, after two years of contraction, Latin America and the Caribbean will experience a
modest growth of 1.3% in 2017. The region closed out 2016 with an average contraction of 1.1%. South
America will be the sub-region most affected, with a decline of -2.4%, while the Caribbean will contract by
-1.7% and Central America will have positive growth of 3.6%.
ECLAC contended that Latin America and the Caribbean will resume growth but moderately and without
clear engines driving it. But its recovery will be fragile as long as the uncertainties of the economic context
continue, particularly the recently observed protectionist trends. The Report posits that for this growth to be
realised, there must be a significant mobilization of financial resources which would require much caution
and a reversal of the investment process dynamic.
A preliminary overview of the economies showed that collective urban unemployment rate showed an
upward trend throughout 2016, which was much higher than the 7.4% recorded in 2015, and was mostly
due to a decline in the employment rate and an increase in the labour force participation rate.
Different levels of Inflation prevailed amongst the various sub-regions. In South America, inflation went from
9.2% in September 2015 to 10.9% for the same month in 2016, while accumulated inflation (over 12

14
months) for the economies of Central America and Mexico (as a group) rose from 2.5% in September 2015
to 3.4% in September 2016.
With regard to growth projections for 2017, improved commodities prices would benefit the terms of trade
for South America, which is forecast to resume growth with an increase in GDP of 0.9%, while the Caribbean
is expected to grow by 1.3%, mainly due to tourism. Central America, meanwhile, is forecast to expand by
3.7%.
ECLAC explains that greater external demand will benefit the region in general in 2017, coupled with the
addition of a recovery of intra-regional trade due to improved performance by the southern economies. The
uncertainties of the international context will have differentiated effects on the individual countries and sub-
regions of Latin America and the Caribbean, and this will accentuate sub-regional differences based on the
productive and trade orientation of their economies, according to the report. Within these situations, ECLAC
recommends that the countries of the region continue fostering investment through countercyclical
economic policies, with productivity gains in addition to active fiscal measures and smart adjustments.
ECLAC further calls for reducing tax evasion and avoidance (which totals 6.7% of regional GDP),
safeguarding public spending, revising subsidy structures (especially for fuel) and incentives, and
reorienting measures to promote investment and essential social spending.
3.2.3 Markets Trend for Guyana Timber Export
The main market destinations for Guyana’s timber products for the year 2017 continued to be Asia, Latin
America and the Caribbean, North America, South America and Europe. The Asian market accounted for
99% of log export from Guyana; where the two main markets have been China (77%) and India (20%) of
total Log value. The main species of log exported in 2017 were Wamara, Greenheart, Darina Kabukalli,
Mora, Tatabu, Wamaradan, and Tonka Bean.
Sawnwood export market has predominantly been in Latin America and the Caribbean Region (44.5%),
North America (23.2%), Asia Pacific (18.1%), Europe (13.8%) and Africa (0.24%). Dressed category lumber
has seen the highest demand with 51.8% of lumber export; whilst the Undressed category lumber accounts
for the remaining 48.2% exported.
The Latin America and Caribbean region and North America were the two dominant markets for Guyana’s
Dressed Lumber in 2017, whilst Asia Pacific region and Europe markets accounted for the majority of
Guyana’s Undressed lumber. The main exported species for both dressed and undressed lumber are
Greenheart, Purpleheart, Washiba, Mora, Locust, Wallaba, Darina, Kabukalli, Tonka Bean, and Red Cedar.
The average FOB price for Guyana Dressed lumber has been between the range of US$900 per m3 and
US$1,192 per m3 respectively.

15
Plywood export increased during 2017, with the majority being exported to Latin America and the Caribbean
(95%) and South America (5%). The markets in Latin America and the Caribbean have been Belize,
Trinidad and Tobago, Cuba, Dominica and Grenada. The main markets in South America have been French
Guiana.
The markets for Splitwood have been Latin America and the Caribbean (45.4%), Asia Pacific (25%), North
America (22.8%), Africa (5.8%) and Europe (1%).
4. The Guyana Economy
4.1 Economic Growth
Guyana’s economy was projected to grow by 3.5% according to the IMF. However this figured was revised
downwards to 3.1% on account of expected weak performances in the mining and quarrying sector, and
the sugar and forestry industries. The projected outturn for real growth of the economy, in 2017, is 2.9%.
Overall projected balance of payments improved slightly to a deficit of US$53.1 million in 2017. This
outcome was primarily driven by an improvement in the capital account, from a deficit of US$13.2 million,
in 2016, to an anticipated surplus of US$181.8 million, in 2017. This is in spite of the deterioration of the
current account from a surplus of US$13 million, in 2016, to a projected deficit of US$235 million, in 2017.
The agriculture, fishing, and forestry sector increased 0.2% above the 1.03% decline recorded in 2016.This
reversal was due to the anticipated positive growth performance in the rice, fishing, livestock, and other
crops subsectors, which has compensate for the continued decline in the sugar and forestry
industries.Expected rice production output of 602,087 tonnes for 2017, was responsible for the 12.7 % over
2016 production. This was due mainly to an additional 14,000 hectares planted for the 2017 spring crop
and a further 74,481 hectares planted in the autumn crop, coupled with an improvement in the yield.
Mining and quarrying sector contracted by 1.9%, compared to the 46.1% expansion in 2016. While gold
declarations remain stable, bauxite production and other mining declined by 2.3% and 12.6%, respectively.
The manufacturing sector grew by 3.6% as a result of the improved performance of the rice industry and
light manufacturing. In addition, there was increased production of certain beverages such as malta, distilled
water, and aerated beverages; as well as certain building materials, including paint and putty.
Growth in construction is expected to accelerate, in 2017, to 13.5%, 7.2% points higher than in 2016. This
positive development is attributed to increased activity in private sector construction as well as measures
taken by Government to improve the implementation of the Public Sector Investment Programme (PSIP).
The services sector has grown in importance and now represents over half of Guyana‘s GDP. This sector
was expected to grow by 3.1% in 2017. Wholesale and retail expanded by 3.1%; transport and storage
improved to 3.9%; and growth in the financial and insurance activities doubled to 5.8%.
16
4.2 The Forest Sector
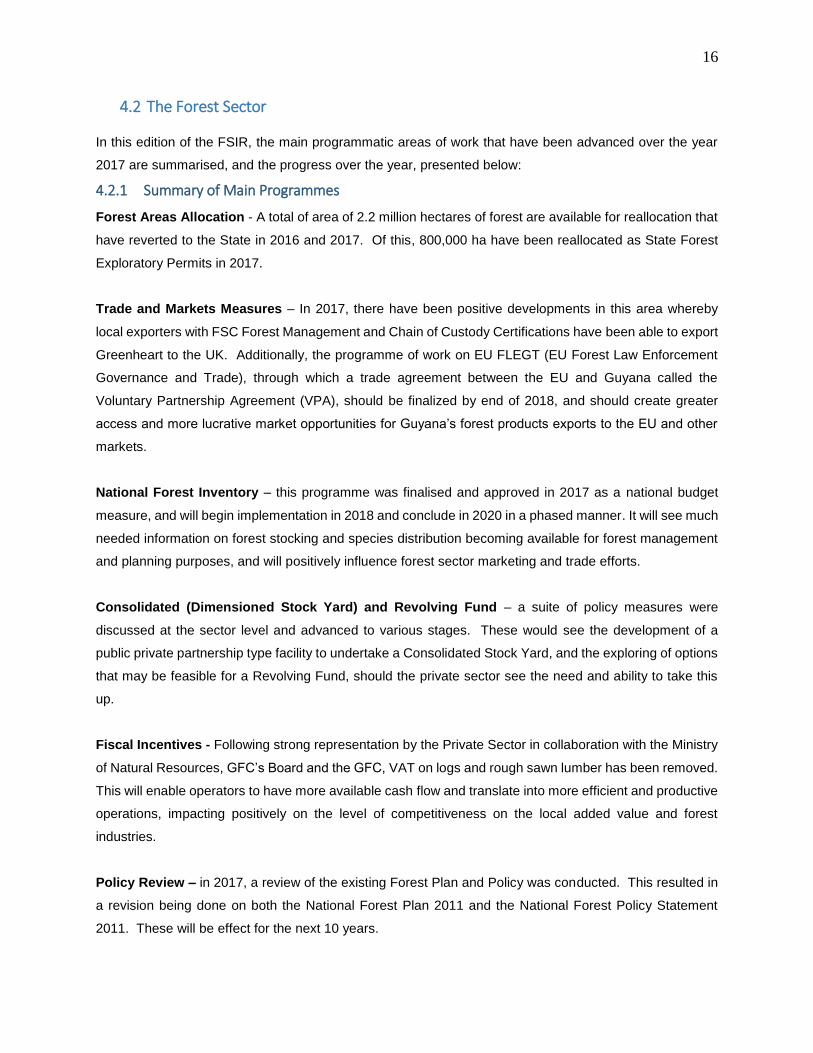
In this edition of the FSIR, the main programmatic areas of work that have been advanced over the year
2017 are summarised, and the progress over the year, presented below:
4.2.1 Summary of Main Programmes
Forest Areas Allocation - A total of area of 2.2 million hectares of forest are available for reallocation that
have reverted to the State in 2016 and 2017. Of this, 800,000 ha have been reallocated as State Forest
Exploratory Permits in 2017.
Trade and Markets Measures – In 2017, there have been positive developments in this area whereby
local exporters with FSC Forest Management and Chain of Custody Certifications have been able to export
Greenheart to the UK. Additionally, the programme of work on EU FLEGT (EU Forest Law Enforcement
Governance and Trade), through which a trade agreement between the EU and Guyana called the
Voluntary Partnership Agreement (VPA), should be finalized by end of 2018, and should create greater
access and more lucrative market opportunities for Guyana’s forest products exports to the EU and other
markets.
National Forest Inventory – this programme was finalised and approved in 2017 as a national budget
measure, and will begin implementation in 2018 and conclude in 2020 in a phased manner. It will see much
needed information on forest stocking and species distribution becoming available for forest management
and planning purposes, and will positively influence forest sector marketing and trade efforts.
Consolidated (Dimensioned Stock Yard) and Revolving Fund – a suite of policy measures were
discussed at the sector level and advanced to various stages. These would see the development of a
public private partnership type facility to undertake a Consolidated Stock Yard, and the exploring of options
that may be feasible for a Revolving Fund, should the private sector see the need and ability to take this
up.
Fiscal Incentives - Following strong representation by the Private Sector in collaboration with the Ministry
of Natural Resources, GFC’s Board and the GFC, VAT on logs and rough sawn lumber has been removed.
This will enable operators to have more available cash flow and translate into more efficient and productive
operations, impacting positively on the level of competitiveness on the local added value and forest
industries.
Policy Review – in 2017, a review of the existing Forest Plan and Policy was conducted. This resulted in
a revision being done on both the National Forest Plan 2011 and the National Forest Policy Statement
2011. These will be effect for the next 10 years.

17
4.2.2 Progress in 2017 on Main Programmes
Review of the National Forest Plan and Policy Statement
Over the period February, 2017 to October, 2017, the National Forest Plan 2011 and the National Forest
Policy 2011 were revised. Guyana has made steady progress in the sustainable management and use of
its forests and, more recently, has been leading international efforts to more accurately value forests beyond
simply their timber potential. Following the formulation of the last policy in 2011, a number of significant
changes have occurred with relevance to the sector. The previous 2011 revision of the National Forest Policy
Statement (NFPS) and the NFP came in response to Guyana’s promulgation of its Low Carbon Development
Strategy (LCDS) which established that Guyana would maintain its forest cover in order to offer climate
services to the global community.
Guyana, in recognizing the need for a holistic approach to the sustainable management of the country’s
forests, released the Green State Development Strategy (GSDS) framework in 2016. The Strategy
envisions “A green, inclusive and prosperous Guyana that provides a good life for all its citizens based
on a sound education and social protection, low-carbon resilient development, green and decent jobs,
economic opportunities, individual equality and political empowerment. Guyana serves as a model of
sustainable development and environmental security worldwide, demonstrating the transition to a
decarbonised and resource efficient economy that integrates the multi-ethnicity of our country and
enhances quality of life for all Guyanese”.
The proposed goal for Guyana’s natural resources (which includes 87% of the land covered in forests) is for
it to be holistically managed under proper “stewardship of our natural patrimony”; through sustainable
management of the nation’s (biodiversity) patrimony, allowing for efficient use of resources in a net carbon
sequestering and climate resilient forest - through social cohesion, inclusion, good governance,
decentralization, and participatory processes - sustainably financed to ensure the wellbeing, education and
good life for current and future generations of Guyanese. This is the overarching development policy under
which the revised NFPS will be implemented.
The revised National Forest Plan and Policy Statement addressed the advancement of forest resources in
a visionary way. The revisions create a platform of forest resources development across sectors and with a
broader goal to maximize more than timber values from these resources.
It is expected that over 2018, the Policy and Plan will commence implementation with many areas seeing
immediate programme of work being developed and rolled out.
18
The Policy will be guided by six overarching principles of sustainable development, as outlined below1
1. Balanced decision-making - decision-making processes should effectively integrate both long-
term and short-term economic, environmental, social and equitable considerations;
2. The precautionary principle - if there are threats of serious or irreversible loss of biodiversity, or
serious or irreversible harm to habitats or ecosystems, lack of full scientific certainty should not be
used as a reason for postponing measures to prevent such loss or harm;
3. Inter-generational equity - the present generation should ensure that the health, diversity and
productivity of the environment is maintained or enhanced for the benefit of future generations;
4. Protection of the natural capital base - the conservation of biological diversity and the
maintenance of ecological integrity should be a fundamental consideration in decision-making;
5. Policy intervention to correct market failure - the market failures that are leading to
environmental degradation and the reduction in natural capital should be corrected by policy
interventions including the development and application of improved valuation and pricing
mechanisms for ecosystem services;
6. Local benefit - local people, particularly in indigenous and forest-dependent communities, should
be provided with training and education relevant to job placement opportunities in the nation’s
forest.
This policy has an overall objective and four specific objectives. Each of the specific objectives has
accompanying strategies which are the bases for planning activities in support of the Policy.
The Policy’s overall objective is:
The conservation, protection, and utilization of the state’s forest, by ensuring it’s social, economic, and
environmental attributes and benefits are sustained and enhanced for the benefit of current and future
generations of Guyanese, whilst fulfilling Guyana’s commitments under international agreements and
conventions.
This objective promotes modern forest-based enterprises, including those that go beyond traditional
timber extraction, and covers a broad range of forest-based products and services. Under this objective,
emphasis will be placed on promoting sustainable livelihoods, both nationally and in forest dependent
communities. The objective stresses the need for equitable benefit sharing not just among current
stakeholders, but also between present and future generations.
1 In-line with the Protected Areas Act 2011
ECONOMIC Specific Objective 1: Deriving Economic Benefits from the Forest
19
This objective recognises that Guyana’s future is closely tied to its forests, and that the country benefits
when our forests thrive. This objective outlines strategies to both avoid lasting damage to our forests
ecosystems, and reverse existing negative impacts. Forests are valued for more than just wood and trees,
with emphasis placed on maintaining the health of watersheds, aquatic systems, wildlife, biodiversity
and culturally important sites.
This objective emphasizes mechanisms for improved efficiency, efficacy, equity, transparency, financial
prudence, and stakeholders’ participation in the management of our forests. Appropriate governance
mechanisms must be established at the local, regional, and national levels, and monitored for
performance and continuous improvement.
The policy promotes the generation and application of knowledge, technology and capacity building for
effective forest management in Guyana. It requires research, training, application of learning,
technological development, information management and education. The dissemination of this
knowledge and information must be done using the appropriate language, communication tools and
messages, and be tailored to different audiences, at their appropriate (kindergarten to post-graduate)
levels of education.
Community Forestry in 2017
The Community Forestry program remained a focal area of the Guyana Forestry Commission throughout
2017. The program is designed to provide communities an opportunity to improve their livelihood, and is
guided by the Forest Act (2009) and the National Forest Policy Statement which identifies the objective of
the program as, “to generate employment and provide greater access to forest resources, especially in low-
income rural areas. Through this Community Forestry initiative, Village Councils, communities or a group
of individuals may apply for and be awarded forest concessions to operate on a commercial basis to
improve their livelihood and contribute to community development.”
Overall, 2017 was a fruitful year for the Community Development Unit. The Unit was able to achieve its
goals of establishing and supporting the work of Community Forestry Organizations and assisting these
groups with the implementation of initiatives geared at fostering sustainable forest management practices.
In 2018 emphasis will be placed on communities acquiring funding for value added activities, and improving
governance (planning and decision-making processes, compliance with relevant regulations, transparency,
accountability, efficiency and effectiveness) at the community level.
GOVERNANCE
CAPACITY
CONSERVATION Specific Objective 2: Conserving, Protecting and Sustaining the Forest
Specific Objective 3: Governing the Forest
Specific Objective 1: Building Capacity for effective Forest Management

20
General Information on Community Forestry Organizations
CATEGORY DETAILS
New Associations
formed in 2017
Kimbia Small Loggers Association
SpeightLand Logging & Agricultural Cooperative Society Limited
Hauraruni Forest & Agriculture Cooperative Society Limited
CFOs Profile 69 CFOs active in 2017; all with concessions
1,281,458 acres (518,809 hectares) of State forests
133 Community Forestry Management Agreements
Total membership, 1483
100% of CFOs renewed all their concessions for 2017/2018
contractual period
Capacity Building at
the Community Level
Five hundred & sixty seven (567) participants from thirty five (35) CFOs and
Indigenous communities received various training in sustainable forest
management practices during 2017. Majority of the training was done by
FTCI with support from FAO, EU FLEGT VPA and the Department of
International Development. Much of the training provided was in response
to the request made by the various groups, these included:
Tree identification
Forest inventory
First Aid
Computer Operations
Forest Monitoring
Directional Felling
Survey and Mapping
Timber grading
GPS and Compass reading
Decision Makers
Guyana Legality Assurance System
Record keeping and Administrative Management
Scholarship: Five persons from indigenous communities were sponsored
by GFC to read for a Certificate in Forestry at the Guyana School of
Agriculture.

21
Budget Measures Finalized in 2017
The Ministry of Natural Resources, the Board of Directors of the GFC and the Commission have worked
together with the Ministry of Finance, to implement a suite of measures that will be directed at strengthening
and improving the sector’s performance in 2017 and to continue working on these in 2018. These measures
will be implemented in collaboration with the private sector and indigenous communities with whom there
are continuous consultations. The FPA, GMSA along with the MOIPA are members of the GFC Board.
An Inter-Ministerial Task force was established in July 2017, as a part of the agreement between the
Ministry of Finance and the Guyana Manufacturers and Services Association, to address several issues
affecting the Manufacturing Sector. The Wood Products sub sector was one of three of the manufacturing
groupings identified. Over the period August to November 2017, several engagements were held with the
GMSA, the Ministry of Finance, Ministry of Natural Resources, Ministry of Business, Ministry of Public
Infrastructure, the GRA and the GFC. Stemming from these discussions, several areas were identified for
inclusion as Budget Measures 2018 to help develop the sector.
The Minister of Finance in his Budget Proposal for 2018, highlighted these measures that are intended to
support and further develop the forest sector of Guyana, in terms of competitiveness, growth and with a
specific objective of boosting the sector’s output and incomes. Among the measures announced in Budget
2018, for the forest sector are:
a) Managing the importation of Pine Wood and Pine Wood Products, with effect from January
1, 2018.
This will streamline the importation of Pine Lumber into Guyana and also allow more effective
monitoring of pine lumber. Under Guyana’s commitment to the EU VPA, all forest produce whether
local or imported must show evidence of a system of chain of custody and legality. The import licence
will address this issue as well as assist to address the issue of competition with local forest produce.
Following strong representation at the recent meeting of the Council for Trade and Economic
Development (COTED), an organ of CARICOM, Guyana's request for Suspension to increase the
Common External Tariff (CET) on Pine Wood and Pine Wood Products, from 5% to 40%, has
been approved. The new tariff will be in effect from January 1, 2018 to December 31, 2019.
b) With effect from January 1, 2018, VAT charge will be exempt for logs and rough lumber to the
sawmilling industry. This would improve the cash flow of operators in the industry by at least $80
million.

22
Logs and rough sawn account for over 75% of Guyana’s national production (National production is 350,000
cubic meters annually, on average). The removal of VAT on logs and rough sawn lumber will allow more
competiveness in the price of locally produce lumber, the easing and freeing up of cash flows as well as
drive local production. This will have a positive impact on the growth and development of the forestry sector
both at the primary production level and value adding processing as it will make the input material (rough
sawn) more cost effective.
c) Budgetary allocation set aside to commence a forest inventory.
Forest Inventory is an important planning tool for the effective management of the nation’s forest resources.
The last national forest inventory was done in the 1950’s. With so much importance attached to the forest
both in terms of timber production and more importantly the whole issue of climate change and
environmental services, the Government has recognized the need to conduct a national forest inventory.
The 2018 allocation is to commence phase 1 of a three year process. The monies will be utilize to develop
modern inventory methodologies, the reporting platform, data collection design, sample plots and pilot of
at least 200,000 hectares of forest.
An updated National Forest Inventory will support the development and implementation of Guyana’s Green
State Development Strategy (GSDS). The GSDS requires for effective planning to be conducted with full
knowledge of the forest resource base. This can only be possible with information on forest resources
which will be a main deliverable of the national forest inventory.
The benefits of an inventory far exceed the management of timber harvesting operations, including;
- Stratification of Guyana’s forests based on the quantity and quality of forest resources in different
areas
- Efficient zonation of forests based on intended use (timber, mining, NTFP etc.), maximising the
multi-purpose potential of Guyana’s forests
- Identification of areas for conservation and protection such as biodiversity hotspots, and provide
baseline data for understanding the forest dynamics in these areas.
- Allow for efficient biological and ecological research by providing preliminary baseline data on forest
species, composition and distribution.
- Integration of forest inventories with GIS/Remote Sensing technology, using empirical national
forest data to design specific technologies for the monitoring of Guyana’s forests.
- Provide a reference dataset on forest resources for long-term monitoring and decision-making,
including creating historical records of forest use for future generations.
NFI would significantly improve the way forests are allocated in Guyana for various land use options; and
enable management frameworks that support economic, social and environmental benefits.

23
d) Partnering with the private sector in a Public Private Partnership, to establish a Dimension
Stockyard.
The consolidated or dimensional stock yard is intended to bridge the gap of obtaining improved quality of
lumber, in sufficient quantity and with a reliability of supply. This will be a public/private sector initiative that
will be managed by an oversight body. The facility will work with operators so that orders will be consolidated
to meet a particular demand or market in accordance with set quality standards. The facility will in no way
compete with the private sector as there will be no price disadvantage or compulsory requirements from
the private sector. The facility will be housed in a central accessible location at perhaps one of the industrial
sites. This initiative has actually been proposed by the private sector as an initiative to improve growth in
the sector. The funds will be used to set up the regulatory framework of the facility, the governance and
administrative structure, site preparatory activities inclusive of minimal capital equipment and marketing
efforts.
The Facility will consolidate and facilitate trading of wood products. It will also be a “clearing house” for
legally produced timber. The facility will serve two purposes as follows:
an open market place for trade in tropical wood products; and
a clearing house for legally produced wood products.
create a space where dimensioned, high quality wood will be available as demanded by local and
export stakeholders.
The facility will assist in creating a secondary market for tropical wood products in Guyana. It will be useful
for operators in the forestry sector who do not wish to take on acquiring and managing a forest concession,
as well as those operators focused only on downstream processing and value adding.
The facility will help to:
enhance further, efficiency in the allocation of tropical wood products in Guyana based on open
market principles
promote market-based competition in the allocation of tropical wood products in Guyana, and
encourage the emergence of a secondary market in the trading of wood products;
increase value adding in the sector by using market-based principles in the allocation of wood
products; and
further enhance the production and trade in legally produced wood products, through the Facility
becoming a clearing house for wood products which have been assessed and cleared through
the Guyana Timber Legality System (GTLAS).

24
State of Guyana’s Forest (2015- 2016)
The sixth assessment (Year 6) covers a 24-month period spanning 2015 and 2016 under Guyana
Monitoring Reporting and Verification System (MRVS). Forest change of forest to non-forest excluding
degradation between 1 January 2015 and 31 December 2016 is estimated at 18 416 ha. Over this period,
this equates to an annualised deforestation rate of 0.050% which is lower than the Year 5 (2014) rate
(0.065%). This rate is the lowest of all annual periods from 2010 to present, assessed to date.
The main deforestation driver for the current forest year reported is mining (sites), which accounts for 74%
of the deforestation in this period. The majority (94%) of the deforestation is observed in the State Forest
Area. The temporal analysis of forest changes post-1990 indicates that most of the change is clustered
around existing road infrastructure and navigable rivers. In Year 6 the change has continued primarily near
the footprint of historical change. For this assessment (Year 6), the results from the Accuracy Assessment
have been used. The scope of the work was to conduct an independent assessment of deforestation, forest
degradation and forest area change estimates for the period January 2015–December 2016. The methods
follow the recommendations set out in the GOFC-GOLD guidelines to help identify and quantify uncertainty
in the level and rate of deforestation and the amount of degraded forest area in Guyana over the period 01
January 2015 to 31 December 2016 (Interim Measures Period – Year 6). High resolution ESA Sentinel-2
and PlanetScope imagery was used to assess change.
The estimated total area of change in the 24-month Year 6 period from forest to degraded forest (between
Y5 and Y6) is 13 068 ha. This represents an annualised rate of 6 534 ha. Of the total degraded area, some
5 679 ha (or 77%) is associated with changes relating to new infrastructure. The largest contributor is
mining, followed by roads and settlements. Emissions resulting from anthropogenic forest fires account for
762 ha whilst shifting cultivation contributes 93 ha of forest degradation, both as annualised rates.

25
Annualised Rate of Forest Change by Period & Driver from 1990 to 2016
Area Deforested 1990 to 2016
Period Years
Image
Resolution Forest Area
('000 ha)
Change
('000 ha)
Annualised
Change Rate
(%)
Initial forest area 1990 30 m 18 473.39
Benchmark (Sept 2009) 19.75 30 m 18 398.48 74.92 0.41
Year 1 (Sept 2010) 1 30 m 18 388.19 10.28 0.056
Year 2 (Oct 2010 to Dec 2011) 1.25 30 m & 5 m 18 378.30 9.88 0.054
Year 3 (Jan 2012 to Dec 2012) 1 5 m *18 487.88 14.65 0.079
Year 4 (Jan 2013 to Dec 2013) 1 5 m 18 475.14 12.73 0.068
Year 5 (Jan 2014 to Dec 2014) 1 5 m **18 470.57 11.98 0.065
Year 6 (Jan 2015 to Dec 2016) 2 10 m & 30 m 18 452.16 18.41 0.050
0.00%
0.01%
0.02%
0.03%
0.04%
0.05%
0.06%
0.07%
0.08%
0.09%
1990 to2000
2001 to2005
2006 to2009
2009-10 2010-11(15
months)
2012 2013 2014 2015-16(24
months)
Deforestation Rate (%)
Change Period (Year)
26
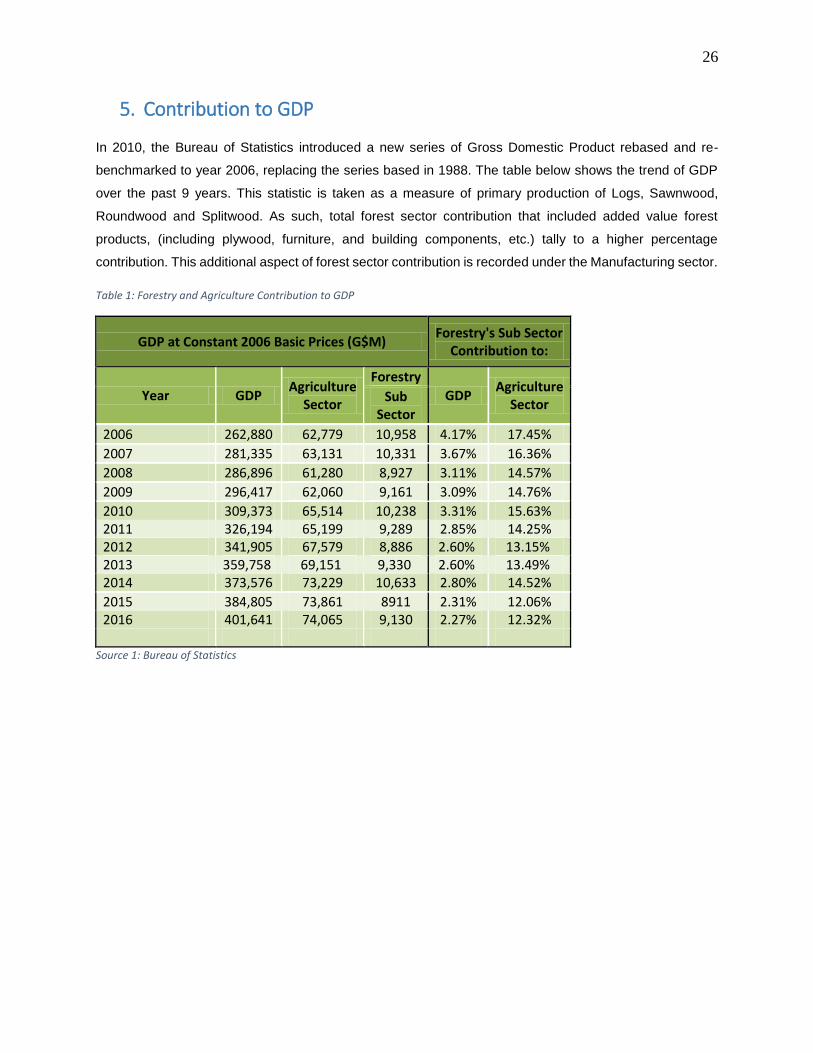
5. Contribution to GDP
In 2010, the Bureau of Statistics introduced a new series of Gross Domestic Product rebased and re-
benchmarked to year 2006, replacing the series based in 1988. The table below shows the trend of GDP
over the past 9 years. This statistic is taken as a measure of primary production of Logs, Sawnwood,
Roundwood and Splitwood. As such, total forest sector contribution that included added value forest
products, (including plywood, furniture, and building components, etc.) tally to a higher percentage
contribution. This additional aspect of forest sector contribution is recorded under the Manufacturing sector.
Table 1: Forestry and Agriculture Contribution to GDP
GDP at Constant 2006 Basic Prices (G$M) Forestry's Sub Sector
Contribution to:
Year GDP Agriculture
Sector
Forestry
GDP Agriculture
Sector Sub
Sector
2006 262,880 62,779 10,958 4.17% 17.45%
2007 281,335 63,131 10,331 3.67% 16.36%
2008 286,896 61,280 8,927 3.11% 14.57%
2009 296,417 62,060 9,161 3.09% 14.76%
2010 309,373 65,514 10,238 3.31% 15.63% 2011 326,194 65,199 9,289 2.85% 14.25% 2012 341,905 67,579 8,886 2.60% 13.15% 2013 359,758 69,151 9,330 2.60% 13.49% 2014 373,576 73,229 10,633 2.80% 14.52%
2015 384,805 73,861 8911 2.31% 12.06% 2016 401,641 74,065 9,130 2.27% 12.32%
Source 1: Bureau of Statistics

27
6. Forestry Sector Structure
6.1 Land Allocation Breakdown
Below is an overview of the different types of State Forest Authorisations (SFAs) issued: State Forest
Permissions (SFPs) and Community Forest Management Agreements (CFMA) are granted for 2 years for
an area no more than 8,047 ha; Wood Cutting Leases (WCLs) are granted for up to 10 years of an area
between 8,047 ha and 24,000 ha; and Timber Sales Agreements (TSAs) are granted for a period up to 30
years for an area in excess of 24,000 ha. All leases are renewable subject to compliance with the terms of
the agreement. State Forest Exploratory Permits (SFEPs) are granted for 3 years and is the precursor to
a TSA and WCL.
Table 2: Forestry Land Allocation
CLASSIFICATIONS COUNT Area (Hectares)
% %
Total Allocation
State Forest
PRODUCTION LANDS
State Forest Permits (SFP) 410 1,671,539 39 13.3
State Exploratory Permits (SFEP) 3 916,945 21 7.3
Wood Cutting Leases (WCL) 1 21,268 1 0.2
Timber Sale Agreements (TSA) 15 1,700,743 39 13.5
Total Production Area Allocated 4,310,495 100 34.3
PERMANENT RESEARCH AND RESERVES
GFC Forest Reserves 12 17,924.92
Other Research & Reserves [Shell Beach, Kanuku Mountains)
2 733,291.72
Total Research & Reserve Areas 14 751,216.64
Total Forest Allocated 14 5,061,711.64
Unallocated State Forest 7,504,288.36
Total State Forest 12,566,000
Iwokrama 1 371,610.44
Kaieteur National Park 1 61,091.34
Source 2: Guyana Forestry Commission
28
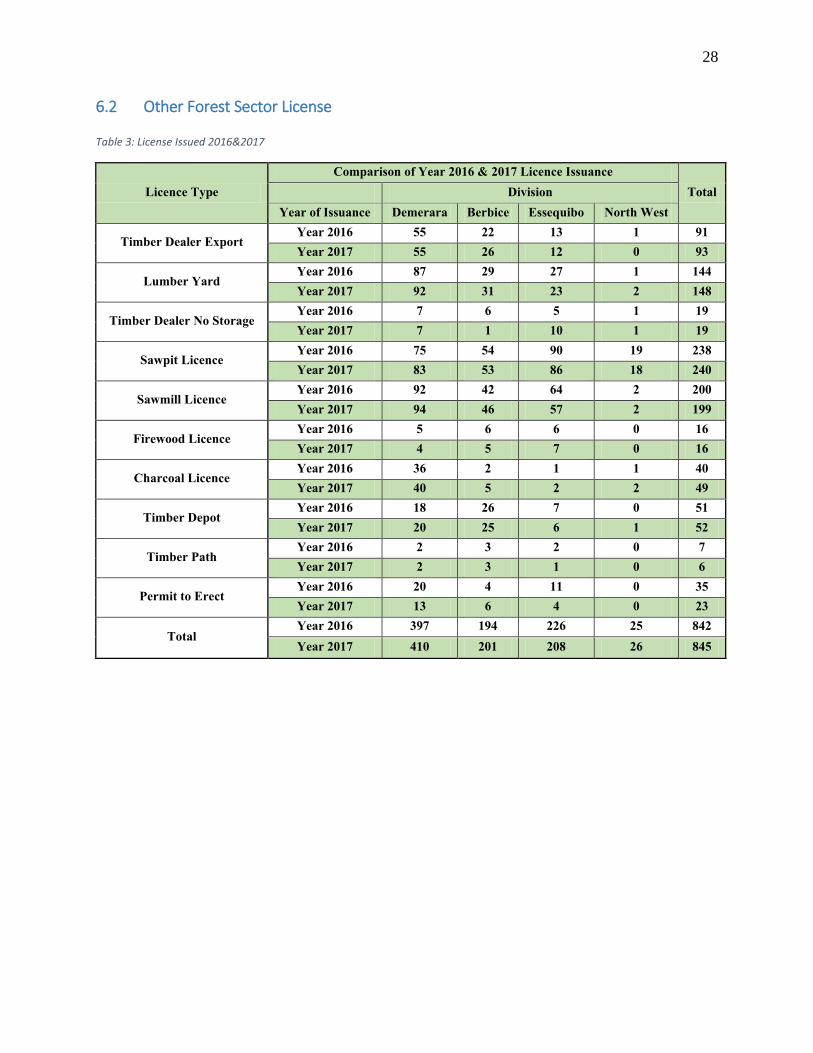
6.2 Other Forest Sector License
Table 3: License Issued 2016&2017
Licence Type
Comparison of Year 2016 & 2017 Licence Issuance
Total Division
Year of Issuance Demerara Berbice Essequibo North West
Timber Dealer Export Year 2016 55 22 13 1 91
Year 2017 55 26 12 0 93
Lumber Yard Year 2016 87 29 27 1 144
Year 2017 92 31 23 2 148
Timber Dealer No Storage Year 2016 7 6 5 1 19
Year 2017 7 1 10 1 19
Sawpit Licence Year 2016 75 54 90 19 238
Year 2017 83 53 86 18 240
Sawmill Licence Year 2016 92 42 64 2 200
Year 2017 94 46 57 2 199
Firewood Licence Year 2016 5 6 6 0 16
Year 2017 4 5 7 0 16
Charcoal Licence Year 2016 36 2 1 1 40
Year 2017 40 5 2 2 49
Timber Depot Year 2016 18 26 7 0 51
Year 2017 20 25 6 1 52
Timber Path Year 2016 2 3 2 0 7
Year 2017 2 3 1 0 6
Permit to Erect Year 2016 20 4 11 0 35
Year 2017 13 6 4 0 23
Total Year 2016 397 194 226 25 842
Year 2017 410 201 208 26 845

29
7. Production
The table below shows the production level of forest products over the 2017 review period as compared to
the 2016 levels. In this section, the production aspects are examined, as it relates to the utilization of forest
resources based on Timber Products (Logs, Sawnwood, Roundwood, Splitwood, Plywood, and Fuelwood)
and Non-Timber products (Inclusive of Wattles and Manicole Palm).
Table 4: Forest Sector Production 2017&2016
Jan-Dec 2017 Jan-Dec 2016 % Change
PRODUCTS Unit Total Total over Jan-Dec '16
TIMBER PRODUCTS
Logs m3
Special Category
Greenheart 53,988.41 57,726.57 (6.48)
Purpleheart 7,690.81 25,242.34 (69.53)
Others 5,372.47 4,174.15 28.71
Total Special Category Logs 67,051.69 87,143.06 (23.06)
Class 1 142,346.10 110,835.79 28.43
Class 2 51,848.90 53,055.78 (2.27)
Class 3 19,645.28 21,275.22 (7.66)
Total Other Class Logs 213,840.28 185,166.79 15.49
Total Logs 280,891.97 272,309.85 3.15
Roundwood m3
- -
Greenheart Piles 12,531.08 10,055.62 24.62
Kakaralli Piles 713.54 286.73 148.85
Mora Piles - - -
Wallaba Poles 5,793.54 2,494.20 132.28
Posts 1,851.60 1,853.51 (0.10)
Spars 180.26 204.11 (11.69)
Total Roundwood 21,070.01 14,894.18 41.46
PriApry (Chainsaw) Lumber m3
- -
Special Category - -
Greenheart 3,801.89 4,319.99 (11.99)
Purpleheart 2,001.70 1,567.08 27.73
Others 2,734.13 2,104.49 29.92
Total Special Cat. Lumber 8,537.72 7,991.56 6.83
Class 1 23,101.40 22,061.75 4.71
Class 2 12,358.74 8,157.54 51.50
Class 3 3,940.95 3,871.57 1.79
Total Other Class Lumber 39,401.09 34,090.86 15.58
Total Primary Lumber 47,938.81 42,082.42 13.92
Splitwood m3
- -
Paling Staves 60.07 68.38 (12.14)
Vat Staves - - -
Shingles - 2.75 -
Total Splitwood 60.07 71.12 (15.53)
Fuelwood Charcoal m3
10,226.94 8,151.73 25.46
Firew ood m3
16,923.27 15,985.94 5.86
Total Fuelwood m3
27,150.20 24,137.67 12.48
- 12,033.00 -
7,333.62 15,131.00 (51.53)
NON - TIMBER FOREST PRODUCTS - -
Wattles pieces 391,522.00 304,438.00 28.60
Manicole Palm pieces 4,017,142.00 3,603,210.00 11.49
Veneer
Plywood

30
7.1 Production Volumes
Table 4 presents production volumes for various Timber and Non-Timber forest products, together with
Plywood, for the Year 2017 compared to 2016. Production declared at individual Forest Stations within the
respective Regions (as per GFC reporting areas) of Demerara, Essequibo, and Berbice, are shown in
Appendices I – IV.
7.1.1 Log Production
Log production of 280,891m3 was recorded for the period January to December 2017. This was 3% higher
in comparison to the recorded production volume in 2016, which was 272,309m3.
The sub category of Others, under Special Category Logs, recorded the largest percentage increase at
28.71% and this was followed by Class 1 with an increase of 28.43%. All other categories of log production
recorded decrease by small percentages, with the exception of Purpleheart logs for which the production
volume declined by 69.53%.
This increased production level is owed mostly to high volume of Kabukalli (23,501m3), Wamara
(71,098m3), and Shibadan (10,286m3). A higher production level of Wamara was expected, and was driven
mainly by increased prices in the Asian market. The decline of Class 2 logs is owed to lower production of
Baromalli logs for which production declined with the exit of the Barama Company from the logging sub
sector, and for which previously a large quantity of Baromalli logs were harvested from the Barama
concession. In the case of Class 3 logs, production moved from 21,275m3 in 2016 to 19,645m3 in 2017,
although there was an increase in the number of species harvested.
Figure 1: Monthly Trends of Log Production 2016 & 2017
The graph above compares monthly log production for the years 2016 and 2017. Over the review period
production remained below compared 2016 production for most of the year with the exception for the
Jan Feb Mar Apr May Jun Jul Aug Sep Oct Nov Dec
2016 22,664 20,999 24,904 22,687 22,472 16,742 17,694 19,816 20,360 27,531 23,771 32,669
2017 10,979 16,039 20,328 18,223 19,797 16,967 19,375 17,962 18,493 25,846 24,398 72,485
-
10,000
20,000
30,000
40,000
50,000
60,000
70,000
80,000
GRAPH SHOWING MONTHLY LOG PRODUCTION ( JANUARY -DECEMBER 2017) IN M 3 COMPARED TO 2016

31
months of June, July, November and December. However high production level during the last two months
of 2017, resulted in overall higher total volume when compared to 2016.
7.1.2 Log Production by GFC Exporting Regions and Forest Stations
Of the total volume of Logs produced, 134,167m3 or 48% came from Demerara County. The leading
producing stations were Linden (47,056m3) and Soesdyke (44,347m3) followed by Georgetown and Ituni.
Berbice followed with the production of 80,438m3 of logs. The highest production of logs came from
Kwakwani Springlands and Canje forest stations with 49,939m3 14,748m3 and 13,162m3 respectively. The
remaining producing stations in Berbice were Bamboo landing, Unamco Road and Hururu with smaller
volumes.
Essequibo, which holds the majority of State Forest Lands (inclusive of the North West region) accounted
for the remaining 66,337m3 of logs during 2017. Of the thirteen (13) forest stations in Essequibo for 2017,
Parika (27,075m3), Winiperu (15,432m3) and Iteballi (10,668m3) recorded the largest quantity of logs, with
the remaining 13,161m3 coming from the remaining ten stations. Noteworthy, the absence of the Barama
Company Limited, resulted in the Essequibo region being removed as the leading log producing district in
Guyana.
7.2 Monthly Production of Primary Lumber
Production of Primary Lumber for 2017 was 47,938m3 and increased by 13.92% when compared to 2016
when the production level was 42,082m3. The increase in volume is primarily due to an increase in
production of the main categories of lumber, with the exception of Special Category Greenheart, for which
production declined by 12%. Nevertheless, Special Category Lumber increased overall by 6.83% when
compared to 2016.
Figure 2: Primary Lumber Production Trend
Jan Feb Mar Apr May Jun Jul Aug Sep Oct Nov Dec
2016 1,462 2,376 3,498 3,062 4,097 3,505 3,366 3,963 3,834 3,658 4,063 5,203
2017 3,486 4,640 3,681 3,831 3,218 3,016 3,452 4,319 3,778 4,549 3,852 6,117
-
1,000
2,000
3,000
4,000
5,000
6,000
7,000
GRAPH SHOWING MONTHLY PRIMARY LUMBER PRODUCTION ( JANUARY -DECEMBER 2017) IN M 3 COMPARED TO 2016
32
Within the Classes 1-3, the largest percentage increase was recorded in Class 2, increasing by 51.50%
when compared to 2016. Class 1 and Class 3 increased by 4.71% and 1.79%, respectively.
The monthly trends in Lumber production for the year 2017 revealed higher production when compared to
the months of 2016. With the exception of May, June, September and November, primary lumber recorded
significant increase when compared to 2016. The top ten (10) species used in the production of Primary
Lumber during 2017 were Wallaba, Kabukalli, Tauroniro, Greenheart, Mora, Bulletwood, Simarupa,
Purpleheart, Crabwood, and Kereti.
7.2.1 Primary Lumber by GFC Reporting Regions and Forest Stations
Of the three reporting region for 2017, Demerara produced the highest volume of Primary Lumber
(24,769m3) representing 52% of the national total. Soesdyke (9501m3) and Georgetown (7,326m3) were
the stations recording the highest volumes.
Essequibo followed second with production of 14,976m3. In this county, fifteen (15) forest stations recorded
Primary lumber of various quantities. The largest volumes were recorded at Supenaam, Charity and
Arapiaco with 3,563m3, 2,571m3 and 1,524m3 respectively. Berbice reporting district recorded production
total of 8,194m3 of Primary Lumber for 2017. Springlands (6,160m3) and Canje (1,419m3) were the highest
producing stations in this reporting district.
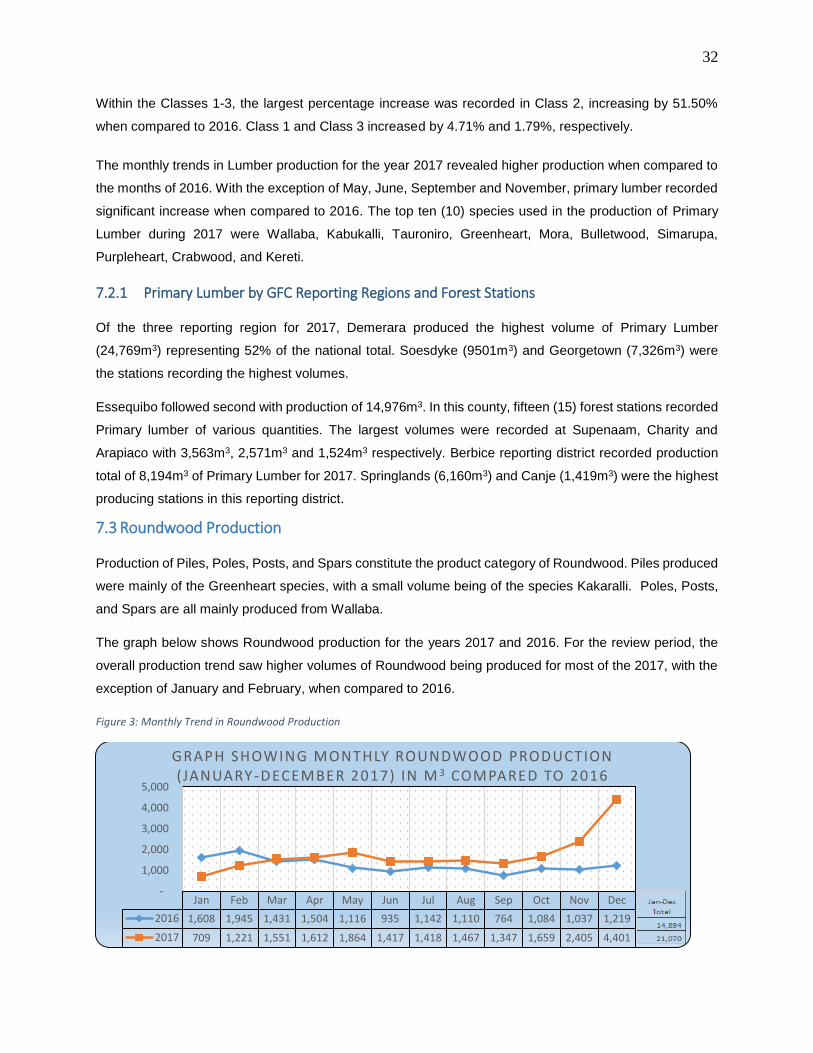
7.3 Roundwood Production
Production of Piles, Poles, Posts, and Spars constitute the product category of Roundwood. Piles produced
were mainly of the Greenheart species, with a small volume being of the species Kakaralli. Poles, Posts,
and Spars are all mainly produced from Wallaba.
The graph below shows Roundwood production for the years 2017 and 2016. For the review period, the
overall production trend saw higher volumes of Roundwood being produced for most of the 2017, with the
exception of January and February, when compared to 2016.
Figure 3: Monthly Trend in Roundwood Production
Jan Feb Mar Apr May Jun Jul Aug Sep Oct Nov Dec
2016 1,608 1,945 1,431 1,504 1,116 935 1,142 1,110 764 1,084 1,037 1,219
2017 709 1,221 1,551 1,612 1,864 1,417 1,418 1,467 1,347 1,659 2,405 4,401
-
1,000
2,000
3,000
4,000
5,000
GRAPH SHOWING MONTHLY ROUNDWOOD PRODUCTION (JANUARY-DECEMBER 2017) IN M 3 COMPARED TO 2016

33
Total Roundwood production for 2017 was 21,070m3, 41% higher than the total production volume for
Roundwwod for 2016 which was 14,894m3. The overall increase in Roundwood was attributed to most of
the products in the category with the exception of Wallaba Post and Spars. Greenheart Piles continue to
be the leading contributor in this category with 12,531m3 moving from 10,055m3 in 2016. Following closely,
was Wallaba Poles production with a high 5,793m3 increasing from a lower level at 2,494m3, recorded in
2016.
Figure 4: Production Trend for Greenheart Piles 2016&2017
The graph above represents the monthly trends in Greenheart Piles production during the period January
to December 2017, and is compared to the same period of 2016. The 2017 period saw a high production
trend after a relatively low first quarter when compared to 2016. There were another decrease in the month
of August, however this was not significant enough to change the overall high trend recorded for the year.
7.4 Splitwood Production
Splitwood refers to Staves (both Paling Staves and Vat Staves), and Shingles (non-machine made), all of
which are usually produced from the Wallaba species. This category only includes hand split shingles. Over
the review period, Splitwood production totalled 60m3. This represents a decline of 16% when compared to
Splitwood production recorded in 2016 at 71m3.
Figure 5: Trend in Splitwood Production 2016&2017
Jan Feb Mar Apr May Jun Jul Aug Sep Oct Nov Dec
2016 1,092 1,569 1,093 898 668 646 731 813 478 639 698 731
2017 410 692 857 1,196 1,222 1,052 773 719 706 868 1,483 2,555
-
500
1,000
1,500
2,000
2,500
3,000
GRAPH SHOWING MONTHLY GREENHEART PILES PRODUCTION ( JANUARY -DECEMBER 2017) IN M 3 COMPARED TO 2016
Jan Feb Mar Apr May Jun Jul Aug Sep Oct Nov Dec
2016 8.05 3.96 5.72 5.84 9.22 12.97 2.07 3.71 8.44 3.17 2.55 5.44
2017 3.53 3.76 6.95 10.91 3.87 2.36 14.57 1.44 5.50 2.81 1.13 3.25
-
5.00
10.00
15.00
20.00
GRAPH SHOWING MONTHLY SPL ITWOOD PRODUCTION ( JANUARY -DECEMBER 2017) IN M 3 COMPARED TO 2016

34
Figure 5 shows the monthly production volumes for Splitwood for 2017 compared to the 2016 levels. With
respect to the production volumes by reporting district, Berbice continues to be the main district for
Splitwood production followed by Essequibo.
7.5 Fuelwood Production
There are two (2) products which comprise this category, namely; Charcoal and Firewood. The graph below
shows the monthly trend in Fuelwood production for the review period January to December 2017 and
compares this to the same period of 2016.
Fuelwood production for 2017 saw an overall increase by 12% when compared to the same of 2016. With
the exception of a few months, Fuelwood production trend for 2017 remained above that of 2016.
Figure 6: Monthly Trend in Fuelwood Production 2016&2017
Charcoal production totalled 10,226m3 increasing by 25.46% when compared to 8,151m3 recorded in 2016.
The majority of Charcoal was produced in Demerara with smaller volumes coming from Essequibo and
Berbice. Production of Firewood during 2017 increased by 5.86% in comparison to production volume in
2016, an increase from 15,985m3 in 2016 to 16,923m3 in 2017.
7.6 Plywood and Veneer Production
Plywood production for 2017 recorded a decrease of 51.53% in comparison to 2016, declining from
15,131m3 in 2016 to 7,333m3 in 2017. The Graph below, shows the monthly trend of Plywood production
for the years 2016 and 2017.
Jan Feb Mar Apr May Jun Jul Aug Sep Oct Nov Dec
2016 343.8 1,191 1,812 2,626 1,782 1,576 2,024 2,257 2,542 2,983 2,853 2,142
2017 1,208 1,643 2,894 2,579 3,789 1,471 2,082 2,503 1,857 1,999 2,273 2,846
- 500.00
1,000.00 1,500.00 2,000.00 2,500.00 3,000.00 3,500.00 4,000.00
GRAPH SHOWING MONTHLY FUELWOOD PRODUCTION ( JANUARY -DECEMBER 2017) IN M 3 COMPARED TO 2016
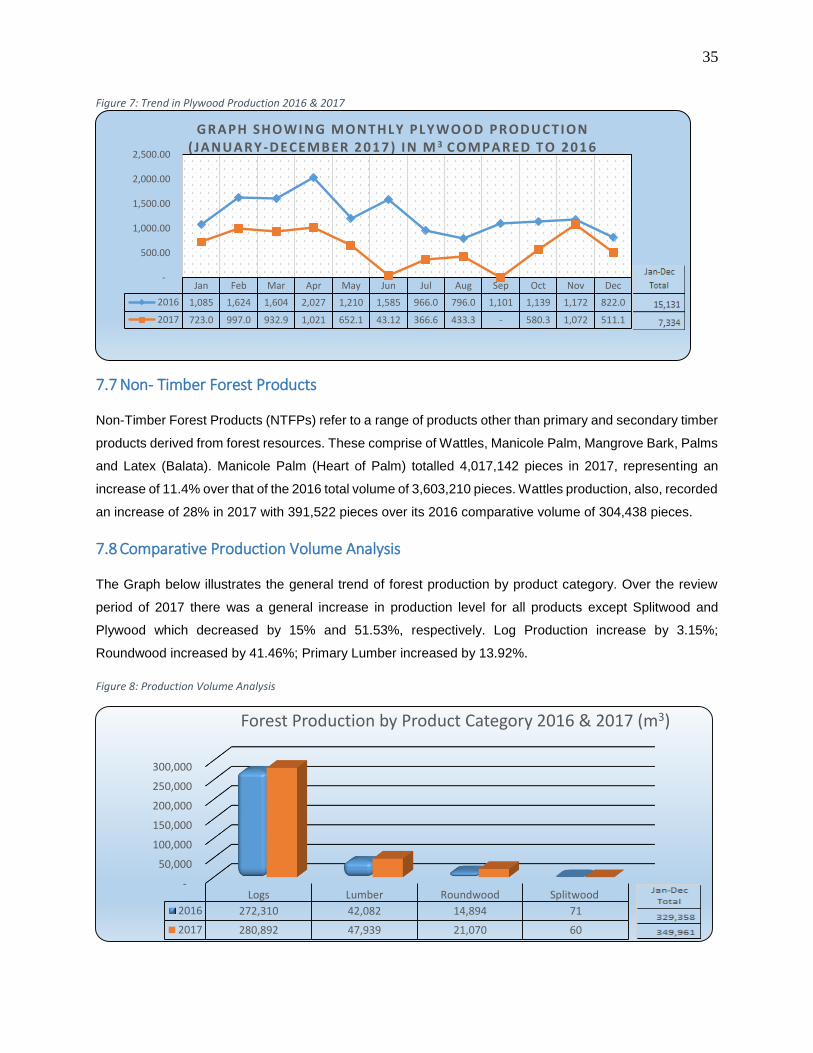
35
Figure 7: Trend in Plywood Production 2016 & 2017
7.7 Non- Timber Forest Products
Non-Timber Forest Products (NTFPs) refer to a range of products other than primary and secondary timber
products derived from forest resources. These comprise of Wattles, Manicole Palm, Mangrove Bark, Palms
and Latex (Balata). Manicole Palm (Heart of Palm) totalled 4,017,142 pieces in 2017, representing an
increase of 11.4% over that of the 2016 total volume of 3,603,210 pieces. Wattles production, also, recorded
an increase of 28% in 2017 with 391,522 pieces over its 2016 comparative volume of 304,438 pieces.
7.8 Comparative Production Volume Analysis
The Graph below illustrates the general trend of forest production by product category. Over the review
period of 2017 there was a general increase in production level for all products except Splitwood and
Plywood which decreased by 15% and 51.53%, respectively. Log Production increase by 3.15%;
Roundwood increased by 41.46%; Primary Lumber increased by 13.92%.
Figure 8: Production Volume Analysis
Jan Feb Mar Apr May Jun Jul Aug Sep Oct Nov Dec
2016 1,085 1,624 1,604 2,027 1,210 1,585 966.0 796.0 1,101 1,139 1,172 822.0
2017 723.0 997.0 932.9 1,021 652.1 43.12 366.6 433.3 - 580.3 1,072 511.1
-
500.00
1,000.00
1,500.00
2,000.00
2,500.00
GRAPH SHOWING MONTHLY PLYWOOD PRODUCTION ( JANUARY -DECEMBER 2017) IN M 3 COMPARED TO 2016
-
50,000
100,000
150,000
200,000
250,000
300,000
Logs Lumber Roundwood Splitwood
2016 272,310 42,082 14,894 71
2017 280,892 47,939 21,070 60
Forest Production by Product Category 2016 & 2017 (m3)

36
8 Employment and Domestic Prices
Employment Table 5: Employment Estimates for the Forest Sector 2016 & 2017
Activity 2016 2017 %
Change
Logs 11,865 10,595 -10.70
Sawmilling 4,680 4,640 -0.85
Timber Dealership (Lumberyards) 1,330 1,400 5.26
Plywood and Veneer 275 250 -9.09
Manicole Palm 462 462 0
Other* 2,275 2,250 -1.10
Total 20,887 19,597 -6.18
* Other: includes activities in Furniture, Building Components, Craft, Utensils/Ornaments, Firewood, Charcoal and Conservation.
Over the 2017 period, total employment declined marginally due mainly to the logging sub sector being
faced with several closures and expirations. However, this decline was far less than expected as indicative
by the higher production level in 2017, as the smaller concessions including Community Forestry
Associations, were able to fill this gap.
Sawmilling and Lumber licences were largely stable in 2017, indicating stable employment levels at this
sub sector. Likewise, for Manicole Palm and Value Added operators, the level of employment remained
stable in 2017.
However, the largest level decline was seen in the Plywood subsector where employment dropped by
approximately 9%. This was reflective in the volume of production for this product which saw a 51% drop
in production recorded in 2017.

37
Domestic Prices
Table 6: Average Domestic Prices for Timber and Plywood 2013-2017
PRODUCT
Year % Change over 2016
2013 2014 2015 2016 2017
G$ US$ G$ US$ G$ US$
G$ US$
G$ US$
Logs 46,088 224 47,150 230 44,290 215 37,080 180 36,400 175 -2.78
Sawnwood * 133,600 668 141,450 690 144,200 700 140,080 680 143,520 690 1.47
Dressed 138,057 673 147,600 720 152,440 740 154,500 750 161,200 775 3.33
Undressed 108,660 530 118,900 580 121,540 590 117,420 570 117,520 565 -0.88
Roundwood 79,224 386 83,025 405 85,490 415 92,700 450 91,520 440 -2.22
Splitwood 50,248 245 51,250 250 51,500 250 49,440 240 54,080 260 8.33
Fuelwood 5,533 26 6,560 32 7,210 35 7,210 35 8,320 40 14.29
* Row indicates combined average for Dressed and Undressed Sawnwood
** Average 2017 Exchange Rate: G$208 =US$1
Domestic prices increased in 2017 for most forest products, with the exception of Logs, Undressed
Sawnwood and Roundwood.
Overall Sawnwood decreased 1.47%, but recorded increase within its sub-group for Dressed Lumber which
increased by 3.3%.
Fuelwood recorded the largest price increase of 14.29%. This was followed by Splitwood which also
recorded a price increase of 8.33%.
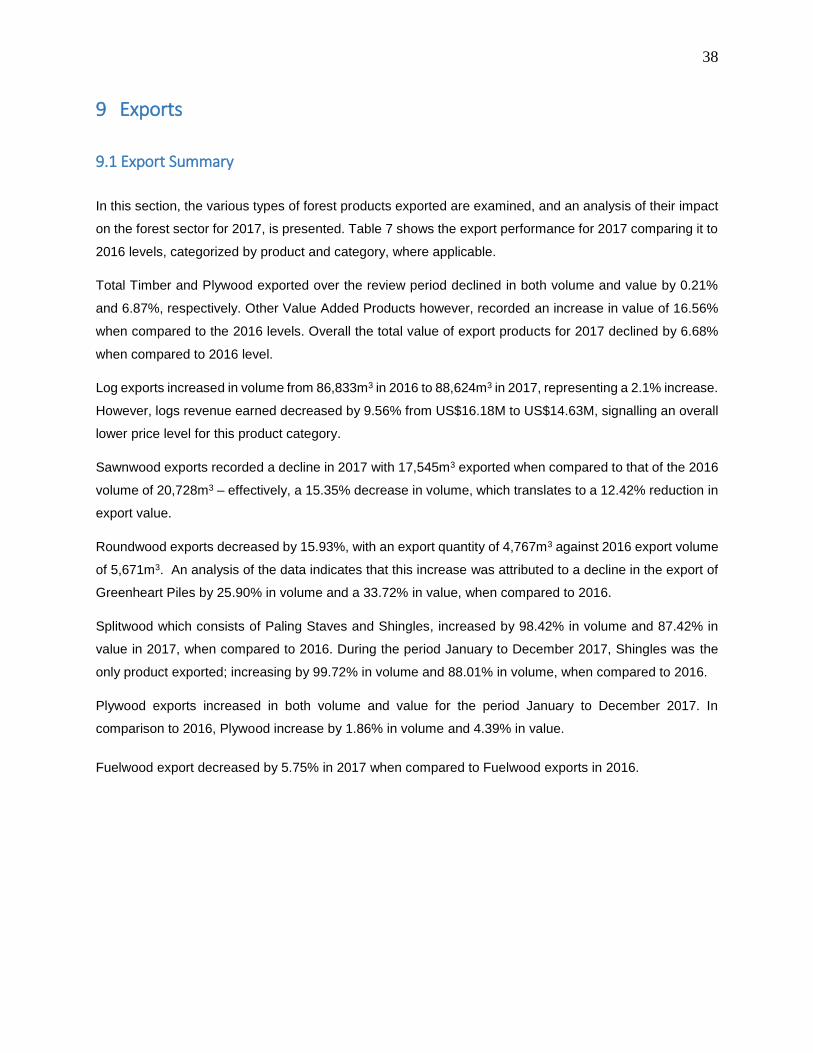
38
9 Exports
9.1 Export Summary
In this section, the various types of forest products exported are examined, and an analysis of their impact
on the forest sector for 2017, is presented. Table 7 shows the export performance for 2017 comparing it to
2016 levels, categorized by product and category, where applicable.
Total Timber and Plywood exported over the review period declined in both volume and value by 0.21%
and 6.87%, respectively. Other Value Added Products however, recorded an increase in value of 16.56%
when compared to the 2016 levels. Overall the total value of export products for 2017 declined by 6.68%
when compared to 2016 level.
Log exports increased in volume from 86,833m3 in 2016 to 88,624m3 in 2017, representing a 2.1% increase.
However, logs revenue earned decreased by 9.56% from US$16.18M to US$14.63M, signalling an overall
lower price level for this product category.
Sawnwood exports recorded a decline in 2017 with 17,545m3 exported when compared to that of the 2016
volume of 20,728m3 – effectively, a 15.35% decrease in volume, which translates to a 12.42% reduction in
export value.
Roundwood exports decreased by 15.93%, with an export quantity of 4,767m3 against 2016 export volume
of 5,671m3. An analysis of the data indicates that this increase was attributed to a decline in the export of
Greenheart Piles by 25.90% in volume and a 33.72% in value, when compared to 2016.
Splitwood which consists of Paling Staves and Shingles, increased by 98.42% in volume and 87.42% in
value in 2017, when compared to 2016. During the period January to December 2017, Shingles was the
only product exported; increasing by 99.72% in volume and 88.01% in volume, when compared to 2016.
Plywood exports increased in both volume and value for the period January to December 2017. In
comparison to 2016, Plywood increase by 1.86% in volume and 4.39% in value.
Fuelwood export decreased by 5.75% in 2017 when compared to Fuelwood exports in 2016.
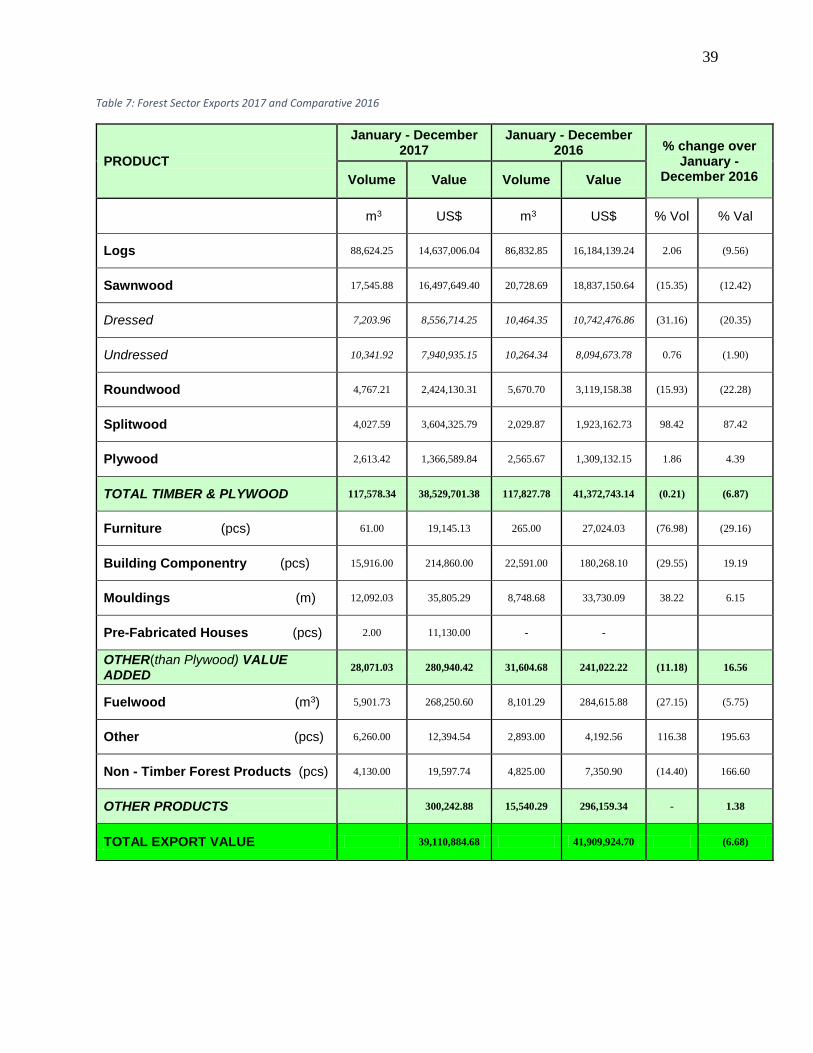
39
Table 7: Forest Sector Exports 2017 and Comparative 2016
PRODUCT
January - December 2017
January - December 2016 % change over
January - December 2016 Volume Value Volume Value
m3 US$ m3 US$ % Vol % Val
Logs 88,624.25 14,637,006.04 86,832.85 16,184,139.24 2.06 (9.56)
Sawnwood 17,545.88 16,497,649.40 20,728.69 18,837,150.64 (15.35) (12.42)
Dressed 7,203.96 8,556,714.25 10,464.35 10,742,476.86 (31.16) (20.35)
Undressed 10,341.92 7,940,935.15 10,264.34 8,094,673.78 0.76 (1.90)
Roundwood 4,767.21 2,424,130.31 5,670.70 3,119,158.38 (15.93) (22.28)
Splitwood 4,027.59 3,604,325.79 2,029.87 1,923,162.73 98.42 87.42
Plywood 2,613.42 1,366,589.84 2,565.67 1,309,132.15 1.86 4.39
TOTAL TIMBER & PLYWOOD 117,578.34 38,529,701.38 117,827.78 41,372,743.14 (0.21) (6.87)
Furniture (pcs) 61.00 19,145.13 265.00 27,024.03 (76.98) (29.16)
Building Componentry (pcs) 15,916.00 214,860.00 22,591.00 180,268.10 (29.55) 19.19
Mouldings (m) 12,092.03 35,805.29 8,748.68 33,730.09 38.22 6.15
Pre-Fabricated Houses (pcs) 2.00 11,130.00 - -
OTHER(than Plywood) VALUE ADDED
28,071.03 280,940.42 31,604.68 241,022.22 (11.18) 16.56
Fuelwood (m3) 5,901.73 268,250.60 8,101.29 284,615.88 (27.15) (5.75)
Other (pcs) 6,260.00 12,394.54 2,893.00 4,192.56 116.38 195.63
Non - Timber Forest Products (pcs) 4,130.00 19,597.74 4,825.00 7,350.90 (14.40) 166.60
OTHER PRODUCTS 300,242.88 15,540.29 296,159.34 - 1.38
TOTAL EXPORT VALUE 39,110,884.68 41,909,924.70 (6.68)

40
9.2 Log Export
This section provides an analysis of the various aspects of forest product exports during 2017.
Logs export volume for the period January to December 2017 totalled 88,624m3 with a corresponding value
of US$14.63M. Compared to the previous year total of US$ 16.18M, this indicates a decrease of 9.56% in
value. However, logs volume increased by 2.06% when compared to 2016. The line graph below illustrates
the total monthly log export for 2017, compared to 2016, monthly volume.
Figure 9: Log Export 2016 & 2017
9.3 Sawnwood Export
Total Sawnwood exports for 2017 totalled 17,545m3 and earned US$16.49M in revenue, compared to
20,729m3 and US$18.84M in volume and value respectively, in the comparative year of 2016.
Special Category Sawnwood contributed the largest percentage share of all Sawnwood lumber exports,
accounting for 71.46% of total volume and 66.87% in value. This was followed by Class 1 lumber with a
percentage share of 23% of total volume and 29% of total revenue.
The graph below shows the percentage share of the various categories of Sawnwood exports and their
contribution to the product total.
Jan Feb Mar Apr May Jun Jul Aug Sep Oct Nov Dec
2016 2,889 4,272 10,085 5,524 6,070 7,397 6,622 7,114 6,633 5,981 13,694 10,553
2017 3,883 5,481 6,911 7,134 7,445 7,529 7,618 8,663 6,124 6,323 12,044 9,468
- 2,000 4,000 6,000 8,000
10,000 12,000 14,000 16,000
Monthly Log Export Volume January to December 2017 and 2016 (m3)
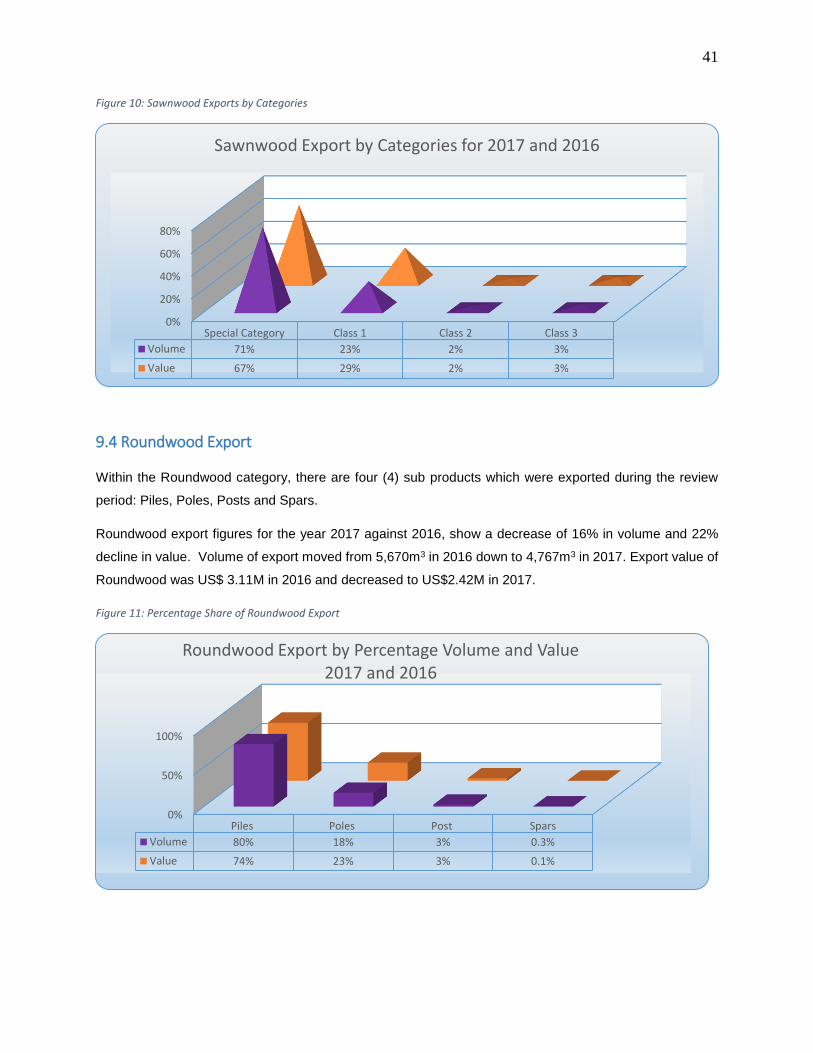
41
Figure 10: Sawnwood Exports by Categories
9.4 Roundwood Export
Within the Roundwood category, there are four (4) sub products which were exported during the review
period: Piles, Poles, Posts and Spars.
Roundwood export figures for the year 2017 against 2016, show a decrease of 16% in volume and 22%
decline in value. Volume of export moved from 5,670m3 in 2016 down to 4,767m3 in 2017. Export value of
Roundwood was US$ 3.11M in 2016 and decreased to US$2.42M in 2017.
Figure 11: Percentage Share of Roundwood Export
0%
20%
40%
60%
80%
Special Category Class 1 Class 2 Class 3
Volume 71% 23% 2% 3%
Value 67% 29% 2% 3%
Sawnwood Export by Categories for 2017 and 2016
0%
50%
100%
Piles Poles Post Spars
Volume 80% 18% 3% 0.3%
Value 74% 23% 3% 0.1%
Roundwood Export by Percentage Volume and Value 2017 and 2016

42
Figure 11 shows the distribution of Roundwood product export for 2017. Piles contributed to the bulk of
export volume and value of Roundwood, whilst smaller volumes and value came from the three (3)
remaining products; Poles, Post and Spars.
9.5 Splitwood Export Figure 12: Shingles Regional Markets
Splitwood exports increased in both volume and value by 98.42% and 87.42% respectively in 2017.
Shingles were the only form of Splitwood exported during the review period. From the Pie chart above, the
majority of Splitwood consumers were found in the Latin America/Caribbean region followed by the
Asia/Pacific and North America.
9.6 Plywood Export
Total Plywood exports for the year 2017 recorded higher volume and value that that of 2016. Plywood
export totalled 2,613m3 in volume at a value of US$1.36M. This total represents an increase of 1.86% and
4.39% in volume and value respectively, over 2016 volume of 2,566m3 and value which totalled US$1.31M.
Figure 13: Monthly Trend in Plywood Export 2017 & 2016
Africa, 5.15%
Asia/Pacific, 25.67%
Europe, 0.55%
Latin America/Caribbean,
46.91%
North America, 21.72%
Shingles Regional Markets for 2017
Africa Asia/Pacific Europe Latin America/Caribbean North America
-
100
200
300
400
500
600
700
800
Jan Feb Mar Apr May Jun Jul Aug Sep Oct Nov Dec
2016 130 726 78 97 73 275 - 131 451 330 275 -
2017 402 - 553 262 - - 112 - 464 79 649 92
Monthly Plywood Export Volume January to December 2017 and 2016 (m3)

43
9.7 Other Value Added Export
Export revenue from Other Value-Added Products (value-added items other than Plywood) for 2017
increased by 16.56% (from US$0.24M up to US$0.28M) when compared to the review period of January
to December 2016. This increase in value was mostly as a result of increase in the category of Building
Components which increased by 19.19% in value. Others products in this category are Doors, Door
Components and Other Builder Joinery.
9.8 Export by Destination
This section examines exports of various timber products; Logs, Sawnwood, Roundwood, Splitwood, and
Plywood, by their export destinations in terms of the international regions of Asia/Pacific, Europe, Latin
America/Caribbean, North America and Africa. Summaries by volume and value, respectively, are
presented in Appendix V and Appendix VI.
9.8.1 Log Export by Destination
The pie chart below shows the percentage breakdown of Guyana’s log exports by region. As can be seen,
volumes amounting to 99% of all log export went to the Asia/Pacific region, accounting for 99% of log export
revenues, while the remainder was exported to the North American region.
China accounted for 79% of the Asian/Pacific market share followed by India 18% with the remaining being
shared between Vietnam, United Arab Emirates, Hong Kong, Democratic People’s Republic of Korea, and
Bangladesh. With respect to export to North America, the individual market was the United States of
America.
In terms of volume and value: total logs exported to Asia Pacific amounted to 88,471m3 and valued at
US$1.46M. The remaining 152m3 and US$29,391 of volume and value respectively of logs was exported
to North America.
Figure 14: Log Export by Regions
99.83% of 100%
0.17% of 100%
Log Export by Regions in 2017
Asia/Pacific
North America

44
9.8.2 Sawnwood Export by Destination Figure 15: Sawnwood Export by Regional Destination
The main destination for dressed lumber for 2017 was Jamaica (Latin America and Caribbean region),
accounting for 2,136m3. In 2017, Asia Pacific surpassed both North America and Europe to take the
position as the second largest destination for Guyana’s Sawnwood, which was primarily the result of an
increased exports of Undressed lumber. In this region, the largest market for Guyana’s Sawnwood was
found in New Zealand, consuming 1,571m3. Other markets for Guyana’s Sawnwood were: United Kingdom
(UK) with 1,659m3, followed by United States with 2,848m3.
9.8.3 Roundwood Export by Destination
The graph below provides a comparison of 2017 and 2016 for Roundwood exports across the various
regions. During the period January to December 2017, Guyana’s Roundwood was exported to Asia Pacific,
Europe, Latin America/Caribbean and North America. The majority of Roundwood exported was to the
North American regional market (3,312m3), with the USA being the sole destination.
Figure 16: Roundwood Export by Regional Destination
-
1,000
2,000
3,000
4,000
5,000
6,000
7,000
8,000
2017 2016 2017 2016 2017 2016 2017 2016 2017 2016
Africa Asia/Pacific Europe Latin America/Caribbean North America
Dressed - - 535 1,176 152 94 5,283 7,802 1,235 1,392
Undressed 40 - 2,700 3,346 2,801 1,907 3,188 2,704 1,614 2,308
- 1,000 2,000 3,000 4,000
2017 2016 2017 2016 2017 2016 2017 2016
Asia/Pacific Europe LatinAmerica/Caribbean
North America
Pile 48 438 754 65 51 3,293 4,270
Poles 2 0.34 828 361 6
Post 1 107 185 13
Spars 14
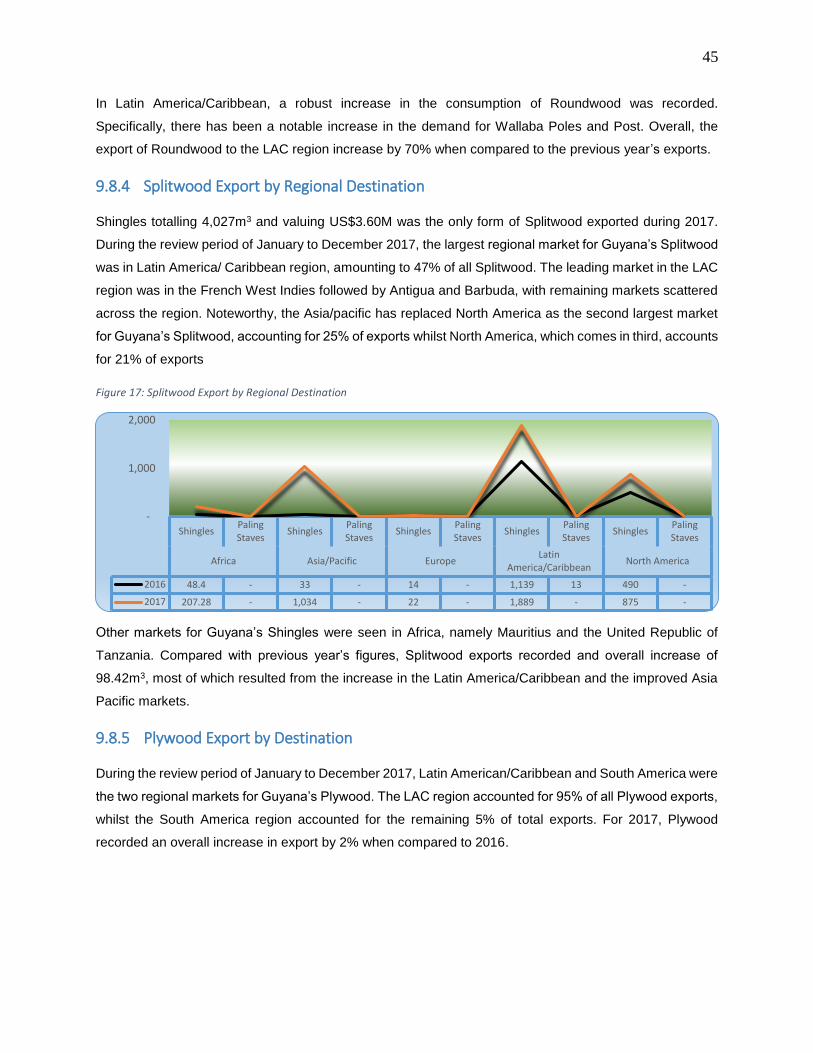
45
In Latin America/Caribbean, a robust increase in the consumption of Roundwood was recorded.
Specifically, there has been a notable increase in the demand for Wallaba Poles and Post. Overall, the
export of Roundwood to the LAC region increase by 70% when compared to the previous year’s exports.
9.8.4 Splitwood Export by Regional Destination
Shingles totalling 4,027m3 and valuing US$3.60M was the only form of Splitwood exported during 2017.
During the review period of January to December 2017, the largest regional market for Guyana’s Splitwood
was in Latin America/ Caribbean region, amounting to 47% of all Splitwood. The leading market in the LAC
region was in the French West Indies followed by Antigua and Barbuda, with remaining markets scattered
across the region. Noteworthy, the Asia/pacific has replaced North America as the second largest market
for Guyana’s Splitwood, accounting for 25% of exports whilst North America, which comes in third, accounts
for 21% of exports
Figure 17: Splitwood Export by Regional Destination
Other markets for Guyana’s Shingles were seen in Africa, namely Mauritius and the United Republic of
Tanzania. Compared with previous year’s figures, Splitwood exports recorded and overall increase of
98.42m3, most of which resulted from the increase in the Latin America/Caribbean and the improved Asia
Pacific markets.
9.8.5 Plywood Export by Destination
During the review period of January to December 2017, Latin American/Caribbean and South America were
the two regional markets for Guyana’s Plywood. The LAC region accounted for 95% of all Plywood exports,
whilst the South America region accounted for the remaining 5% of total exports. For 2017, Plywood
recorded an overall increase in export by 2% when compared to 2016.
ShinglesPalingStaves
ShinglesPalingStaves
ShinglesPalingStaves
ShinglesPalingStaves
ShinglesPalingStaves
Africa Asia/Pacific EuropeLatin
America/CaribbeanNorth America
2016 48.4 - 33 - 14 - 1,139 13 490 -
2017 207.28 - 1,034 - 22 - 1,889 - 875 -
-
1,000
2,000

46
Figure 18: Plywood Export by Regional Destination
9.8.6 Forestry Sector Export Earnings by Destination
The Asia/Pacific region continues to be the largest market for Guyana’s forest product with value earned in
2017 amounting to US$ 18.5M and accounting for 47% of total export earnings. This represents a decrease
in the value earned from this region however, when compared to 2016. For 2017, China was the single
largest destination for Guyana’s timber products which was followed closely by India.
The Latin America/Caribbean region was the second largest market zone for Guyana’s forest produce, with
earnings from the region totalling US$11.5M and accounting for 29% of total export value. Within this region,
Barbados, and Trinidad and Tobago, continue to be the major destinations for Guyana’s forest products.
Barbados and Trinidad recorded a combined export value total of US$ 4.42M.
Cumulative export value for the other four (4) regional markets (Africa, Europe, North America, and South
America) totalled US$9.73M.
Table 8: Comparative Export Value by Regional Destination
- 500
1,000 1,500 2,000 2,500
LatinAmerica/Caribbean
North America South America
2016 2,423 30 112
2017 2,475 - 139
1%
47%
7%
29%
16%0%
Africa
Asia/Pacific
Europe
LatinAmerica/Caribbean
North America
South America
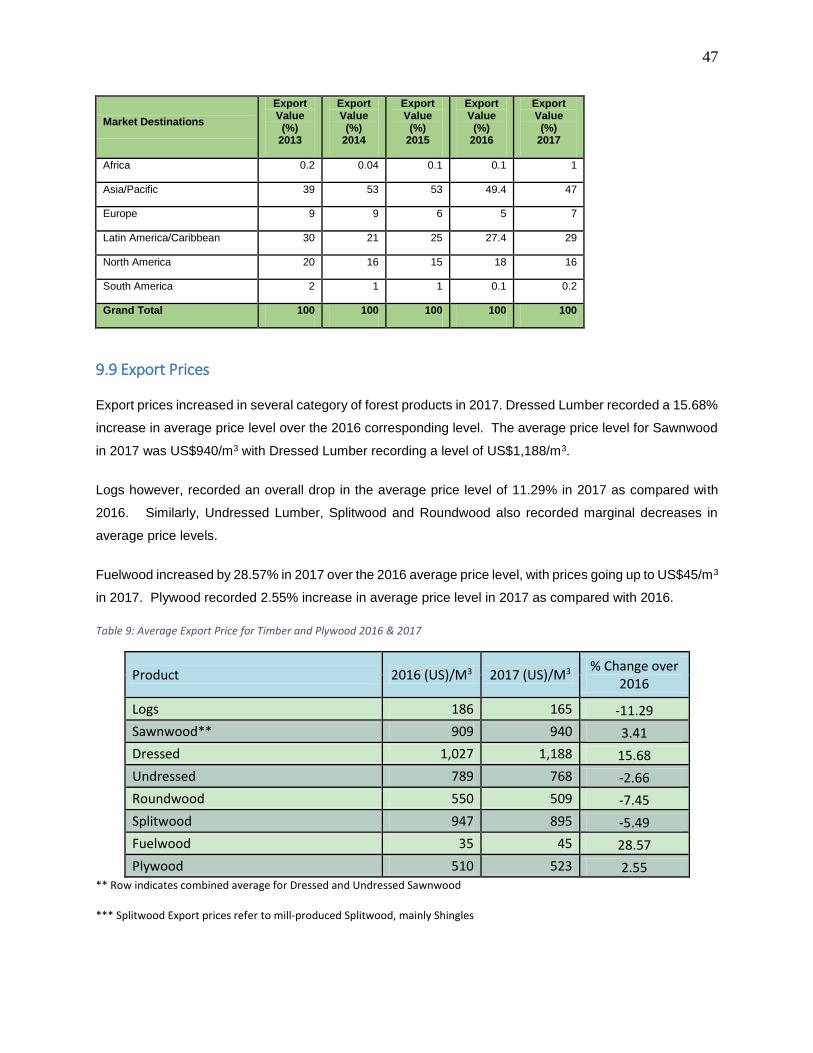
47
Market Destinations
Export Value (%)
2013
Export Value (%)
2014
Export Value (%)
2015
Export Value (%)
2016
Export Value (%)
2017
Africa 0.2 0.04 0.1 0.1 1
Asia/Pacific 39 53 53 49.4 47
Europe 9 9 6 5 7
Latin America/Caribbean 30 21 25 27.4 29
North America 20 16 15 18 16
South America 2 1 1 0.1 0.2
Grand Total 100 100 100 100 100
9.9 Export Prices
Export prices increased in several category of forest products in 2017. Dressed Lumber recorded a 15.68%
increase in average price level over the 2016 corresponding level. The average price level for Sawnwood
in 2017 was US$940/m3 with Dressed Lumber recording a level of US$1,188/m3.
Logs however, recorded an overall drop in the average price level of 11.29% in 2017 as compared with
2016. Similarly, Undressed Lumber, Splitwood and Roundwood also recorded marginal decreases in
average price levels.
Fuelwood increased by 28.57% in 2017 over the 2016 average price level, with prices going up to US$45/m3
in 2017. Plywood recorded 2.55% increase in average price level in 2017 as compared with 2016.
Table 9: Average Export Price for Timber and Plywood 2016 & 2017
Product 2016 (US)/M3 2017 (US)/M3 % Change over
2016
Logs 186 165 -11.29
Sawnwood** 909 940 3.41
Dressed 1,027 1,188 15.68
Undressed 789 768 -2.66
Roundwood 550 509 -7.45
Splitwood 947 895 -5.49
Fuelwood 35 45 28.57
Plywood 510 523 2.55 ** Row indicates combined average for Dressed and Undressed Sawnwood
*** Splitwood Export prices refer to mill-produced Splitwood, mainly Shingles
48
10 References 1. Bureau of Statistics. Constant Gross Domestic Products at 2006 Prices. Georgetown: Bureau of
Statistics, 2016.
2. Government of Guyana. Budget 2017. Georgetown: Government of Guyana, 2017.
3. International Monetary Fund. World Economic Outlook. Washington, DC, October: International
Monetary Fund, 2017.
4. ITTO. “Tropical Timber and Market Report.” First Fortnight Report, 1st - 15th January 2018: 4.
5. ITTO, “Tropical Timber and Market Report Volume 23.” Second Fortnight, 16th -31st January
2018.
6. ITTO. Tropical Timber and Market Report Volume 22. ITTO Publishing, 2018.
7. UNCTAD. Investment Trend Monitor. Geneva: United Nation, 2018.
8. World Bank Group. Global Economic Prospects: Broad Based Upturn, but for How Long.
Washington, DC: World Bank. License: Creative Commons Attribution CC BY 3.0 IGO, 2018.

49
11 Appendices
Appendix 1: State Forest Production by County ................................................................................ 50
Appendix 2: Production by Stations in Demerara .............................................................................. 51
Appendix 3Production by Stations in Berbice .................................................................................... 52
Appendix 4: Production by Stations in Essequibo .............................................................................. 53
Appendix 5: Export Volumes by Regional Destination ....................................................................... 54
Appendix 6: Export Value by Regional Destination ............................................................................ 55

50
Appendix 1: State Forest Production by County
Appendix I: State Forest Total Production Volume by County in 2017
Product UOM Category BER DEM ESS Grand Total
Logs Cubic Metre
Special Category 7,729.89
17,108.06
30,021.21
54,859.16
Class 1 Log 49,466.27
56,842.75
13,113.64
119,422.66
Class 2 Log 8,482.89
23,278.04
10,678.10
42,439.03
Class 3 Log 5,122.45
4,893.92
3,983.36
13,999.73
Logs Total 70,801.50
102,122.77
57,796.31
230,720.58
Sawnwood Cubic Metre
Special Category 372.24
2,844.70
3,136.10
6,353.04
Class 1 Lumber 1,614.13
10,635.17
3,192.56
15,441.86
Class 2 Lumber 622.57
3,376.66
1,416.19
5,415.42
Class 3 Lumber 150.83
1,364.09
832.36
2,347.28
Sawnwood Total 2,759.77
18,220.62
8,577.21
29,557.60
Roundwood Cubic Metre
Piles 2,008.49
6,984.20
1,971.12
10,963.81
Poles 369.65
4,534.04
274.87
5,178.57
Posts 60.93 -
76.84
137.78
Spars - 13.56
0.31
13.87
Roundwood Total 2,439.08
11,531.80
2,323.14
16,294.02
Splitwood Cubic Metre Paling Staves
1.86 - -
1.86
Splitwood Total 1.86 - -
1.86
Fuelwood Cubic Metre
Firewood - 9,938.03
528.14
10,466.17
Charcoal 702.39
2,287.15
976.21
3,965.75
Fuelwood Total 702.39
12,225.18
1,504.35
14,431.92
Wattles Pieces Wattles 10,827.00
338,600.00
4,021.00
353,448.00
Wattles Total 10,827.00
338,600.00
4,021.00
353,448.00
Manicole Palm Heart Pieces
Manicole Palm Heart -
152,750.00
3,290,701.00
3,443,451.00
Manicole Palm Heart Total - 152,750.00
3,290,701.00
3,443,451.00

51
Appendix 2: State Forest Production by Stations in Demerara
Appendix II: State Forest Total Production by Stations in Demerara for 2017
Product UOM Category Georgetown Ituni Linden Mabura Soesdyke Grand Total
Logs Cubic Metre
Special Category 3,339.58 152.20
2,343.71
2,283.59
8,988.98
17,108.06
Class 1 Log 7,796.17 4,976.24
19,784.51
2,161.59
22,124.24
56,842.75
Class 2 Log 1,870.85 1,020.33
10,696.06
188.58
9,502.22
23,278.04
Class 3 Log 1,037.26 315.13
1,643.12
55.26
1,843.15
4,893.92
Logs Total 14,043.86
6,463.90
34,467.40
4,689.02
42,458.59
102,122.77
Sawnwood Cubic Metre
Special Category 751.13 240.84
625.72
30.13
1,196.88
2,844.70
Class 1 Lumber 2,378.99 3,758.24
864.73
76.59
3,556.62
10,635.17
Class 2 Lumber 483.72 283.36
161.77
1.57
2,446.24
3,376.66
Class 3 Lumber 756.49 33.39
164.92
2.00
407.29
1,364.09
Sawnwood Total 4,370.33 4,315.83
1,817.14
110.29
7,607.03
18,220.62
Roundwood Cubic Metre
Piles 1,212.88 244.11
498.20
71.43
4,957.57
6,984.20
Poles 805.10 -
809.26
-
2,919.68
4,534.04
Spars 0.30 -
-
-
13.26
13.56
Roundwood Total 2,018.28 244.11
1,307.47
71.43
7,890.51
11,531.80
Fuelwood Cubic Metre
Firewood 793.81 -
-
-
9,144.22
9,938.03
Charcoal 518.97 -
381.10
-
1,387.08
2,287.15
Fuelwood Total 1,312.78 -
381.10
-
10,531.30
12,225.18
Wattles Pieces Wattles 25,100.00
-
3,800.00
-
309,700.00
338,600.00
Wattles Total 25,100.00
-
3,800.00
-
309,700.00
338,600.00
Manicole Palm Heart Pieces
Manicole Palm Heart
152,750.00
-
-
- -
152,750.00
Manicole Palm Heart Total 152,750.00
-
-
- -
152,750.00

52
Appendix 3: State Forest Production by Stations in Berbice
Appendix III: State Forest Total Production by Stations in Berbice for 2017
Product UOM Category Bamboo Landing
Canje Kwakwani Orealla Springlands Unamco
Road 110 KM
Grand Total
Logs Cubic Metre
Special Category
3,371.17
158.69
3,147.57
- 182.11
870.35
7,729.89
Class 1 Log 1,483.59
7,032.55
32,557.22
- 6,183.50
2,209.41
49,466.27
Class 2 Log 1.92
675.79
3,668.59
- 4,136.59
-
8,482.89
Class 3 Log 102.79
344.40
1,989.91
- 2,471.43
213.92
5,122.45
Logs Total 4,959.47
8,211.43
41,363.29
- 12,973.63
3,293.68
70,801.50
Sawnwood Cubic Metre
Special Category
-
137.36
207.87
- 27.01
-
372.24
Class 1 Lumber
-
744.30
235.09
3.55 631.19
-
1,614.13
Class 2 Lumber
-
369.62
78.21
- 174.74
-
622.57
Class 3 Lumber
-
46.20
57.98
- 46.65
-
150.83
Sawnwood Total -
1,297.48
579.15
3.55 879.59
-
2,759.77
Roundwood Cubic Metre
Piles 554.37
6.78
1,357.96
- -
89.38
2,008.49
Poles -
282.03
87.62
- -
-
369.65
Posts -
2.79 -
- 58.14
-
60.93
Roundwood Total 554.37
291.61
1,445.58
- 58.14
89.38
2,439.08
Splitwood Cubic Metre Paling Staves
-
- -
- 1.86
-
1.86
Splitwood Total -
- -
- 1.86
-
1.86
Fuelwood Cubic Metre Charcoal
702.39 -
- -
-
702.39
Fuelwood Total -
702.39 -
- -
-
702.39
Wattles Pieces Wattles -
10,827.00 -
- -
-
10,827.00
Wattles Total -
10,827.00 -
- -
-
10,827.00

53
Appendix 4: Production by Stations in Essequibo
Product UoM Category Annai Arapiaco Bartica Capoey Charity Drumhill Iteballi Kwebanna Lethem Mabaruma Moruca ParikaPort
KaitumaSupenaam Winiperu
Grand
Total
Special Category - 568.78 1.34 27.46 - 5,392.69 - - 5.82 - 7,743.99 - 4,075.58 12,205.55 30,021.21
Class 1 Log - 4.66 721.65 - 139.59 - 1,755.73 - - - - 6,329.31 - 1,201.40 2,961.30 13,113.64
Class 2 Log - 376.42 649.73 - 874.49 - 2,921.18 - - - - 4,592.55 - 1,263.73 - 10,678.10
Class 3 Log - 8.33 150.10 - 7.35 - 598.72 - - - - 2,406.94 - 546.45 265.47 3,983.36
- 389.41 2,090.26 1.34 1,048.89 - 10,668.32 - - 5.82 - 21,072.79 - 7,087.16 15,432.32 57,796.31
Special Category 57.49 29.52 180.08 15.41 456.51 - 86.28 55.26 55.52 214.98 22.50 514.85 9.96 1,437.74 - 3,136.10
Class 1 Lumber 220.56 363.96 43.08 12.75 810.43 - 98.28 56.70 237.60 317.77 - 214.56 3.43 813.44 - 3,192.56
Class 2 Lumber 4.29 10.20 34.52 19.53 143.17 - - - 13.95 54.28 - 703.94 2.59 429.72 - 1,416.19
Class 3 Lumber 180.29 102.26 15.30 10.32 117.24 - 25.06 18.54 167.01 32.21 - 48.95 2.74 112.44 - 832.36
462.63 505.94 272.98 58.01 1,527.35 - 209.62 130.50 474.08 619.24 22.50 1,482.30 18.72 2,793.34 - 8,577.21
Piles - - 33.20 - - - 320.62 - - - - 1,067.69 - 549.61 - 1,971.12
Poles - - - - 274.87 - - - - - - - - - - 274.87
Posts 68.86 - - - - - - - - - - 7.98 - - - 76.84
Spars - - 0.31 - - - - - - - - - - - - 0.31
68.86 - 33.51 - 274.87 - 320.62 - - - - 1,075.67 - 549.61 - 2,323.14
Firew ood - - - - - - - - - - - - - 528.14 - 528.14
Charcoal - - - - - - - - - - - 976.21 - - - 976.21
- - - - - - - - - - - 976.21 - 528.14 - 1,504.35
Wattles Pieces Wattles - - 210.00 - - - - - - - - - - 3,811.00 - 4,021.00
- - 210.00 - - - - - - - - - - 3,811.00 - 4,021.00
Manicole Palm Heart Pieces Manicole Palm Heart - - - - - 3,290,701.00 - - - - - - - - - 3,290,701.00
- - - - - 3,290,701.00 - - - - - - - - - 3,290,701.00
Appendix IV: State Forest Total Production by Stations in Essequibo for 2017
Manicole Palm Heart Total
wattles Total
Fuelwood Total
Roundwood Total
Sawnwood Total
Logs Total
Cubic Metre
Cubic Metre
Cubic Metre
Cubic Metre
Fuelwood
Roundwood
Sawnwood
Logs
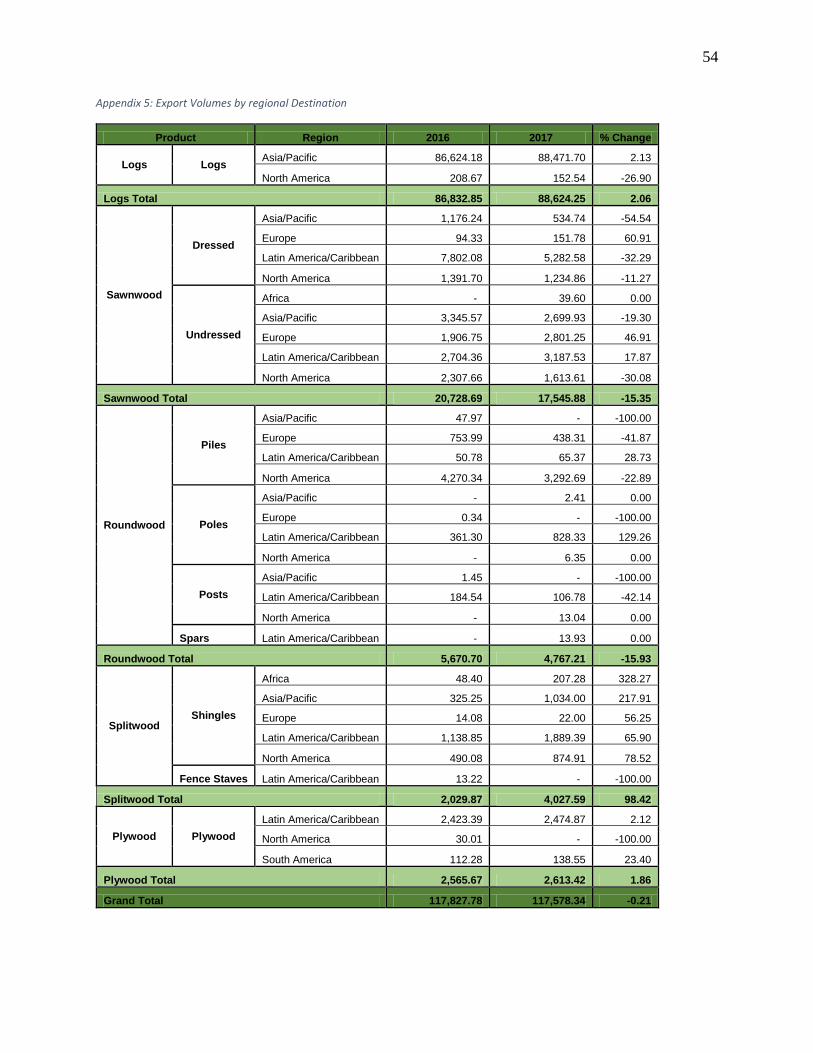
54
Appendix 5: Export Volumes by regional Destination
Product Region 2016 2017 % Change
Logs Logs Asia/Pacific 86,624.18 88,471.70 2.13
North America 208.67 152.54 -26.90
Logs Total 86,832.85 88,624.25 2.06
Sawnwood
Dressed
Asia/Pacific 1,176.24 534.74 -54.54
Europe 94.33 151.78 60.91
Latin America/Caribbean 7,802.08 5,282.58 -32.29
North America 1,391.70 1,234.86 -11.27
Undressed
Africa - 39.60 0.00
Asia/Pacific 3,345.57 2,699.93 -19.30
Europe 1,906.75 2,801.25 46.91
Latin America/Caribbean 2,704.36 3,187.53 17.87
North America 2,307.66 1,613.61 -30.08
Sawnwood Total 20,728.69 17,545.88 -15.35
Roundwood
Piles
Asia/Pacific 47.97 - -100.00
Europe 753.99 438.31 -41.87
Latin America/Caribbean 50.78 65.37 28.73
North America 4,270.34 3,292.69 -22.89
Poles
Asia/Pacific - 2.41 0.00
Europe 0.34 - -100.00
Latin America/Caribbean 361.30 828.33 129.26
North America - 6.35 0.00
Posts
Asia/Pacific 1.45 - -100.00
Latin America/Caribbean 184.54 106.78 -42.14
North America - 13.04 0.00
Spars Latin America/Caribbean - 13.93 0.00
Roundwood Total 5,670.70 4,767.21 -15.93
Splitwood Shingles
Africa 48.40 207.28 328.27
Asia/Pacific 325.25 1,034.00 217.91
Europe 14.08 22.00 56.25
Latin America/Caribbean 1,138.85 1,889.39 65.90
North America 490.08 874.91 78.52
Fence Staves Latin America/Caribbean 13.22 - -100.00
Splitwood Total 2,029.87 4,027.59 98.42
Plywood Plywood
Latin America/Caribbean 2,423.39 2,474.87 2.12
North America 30.01 - -100.00
South America 112.28 138.55 23.40
Plywood Total 2,565.67 2,613.42 1.86
Grand Total 117,827.78 117,578.34 -0.21

55
Appendix 6: Export Value by Regional Destination
Product3 Region 2016 2017 % Change
Logs Logs Asia/Pacific 16,144,999.04 14,607,614.76 -9.52
North America 39,140.20 29,391.28 -24.91
Logs Total 16,184,139.24 14,637,006.04 -9.56
Sawnwood
Dressed
Asia/Pacific 1,452,306.21 699,444.26 -51.84
Europe 131,515.72 92,942.30 -29.33
Latin America/Caribbean 6,341,666.31 5,256,069.79 -17.12
North America 2,816,988.62 2,508,257.90 -10.96
Undressed
Africa 39,600.00 0.00
Asia/Pacific 2,785,920.43 2,282,062.13 -18.09
Europe 1,487,923.93 2,199,607.84 47.83
Latin America/Caribbean 1,880,487.60 2,094,336.52 11.37
North America 1,940,341.82 1,325,328.66 -31.70
Sawnwood Total 18,837,150.64 16,497,649.40 -12.42
Roundwood
Piles
Asia/Pacific 25,223.25 -100.00
Europe 364,313.96 285,400.75 -21.66
Latin America/Caribbean 26,030.50 28,296.00 8.70
North America 2,286,688.69 1,477,426.55 -35.39
Poles
Asia/Pacific 3,060.00 0.00
Europe 150.00 -100.00
Latin America/Caribbean 327,446.50 551,385.01 68.39
North America 5,002.50 0.00
Posts
Asia/Pacific 2,640.00 -100.00
Latin America/Caribbean 86,665.48 64,247.00 -25.87
North America 6,687.50 0.00
Spars Latin America/Caribbean 2,625.00 0.00
Roundwood Total 3,119,158.38 2,424,130.31 -22.28
Splitwood Shingles
Africa 48,180.00 210,140.00 336.16
Asia/Pacific 286,820.00 913,760.00 218.58
Europe 4,400.00 19,500.00 343.18
Latin America/Caribbean 1,071,852.73 1,637,823.79 52.80
North America 505,835.00 823,102.00 62.72
Fence Staves Latin America/Caribbean 6,075.00 -100.00
Splitwood Total 1,923,162.73 3,604,325.79 87.42
Plywood Plywood
Latin America/Caribbean 1,234,445.34 1,298,459.59 5.19
North America 18,588.80 -100.00
South America 56,098.01 68,130.25 21.45
Plywood Total 1,309,132.15 1,366,589.84 4.39
Grand Total 41,372,743.14 38,529,701.38 -6.87

56
Major Timber Species and Uses
Classification Species
(Local Names)
Species
(Scientific Names) Major Uses
Special
Category
Greenheart Chlorocardium
rodiei
Boat building, marine work, piling, general heavy construction,
flooring, heavy furniture, turnery and finishing rods.
Purpleheart Peltogyne venosa
Building construction, flooring, bridging, boat building – keels,
transoms, canoes, coach building, furniture, turnery, inlay, tool
handles, sticks, bows, and veneer.
Brown
Silverballi Licaria cannella
Boat building, canoes, furniture, interior work, and general
carpentry.
Red Cedar Cedrela odorata Furniture, cabinet work, panelling, boats, coffins and cigar boxes.
Letterwood Brosimum guianense Inlay, turnery, sticks, tool handles and bows for archery.
Bulletwood Manilkara bidentata General heavy construction, house framing, sleepers, mill rollers,
wheel spokes, fencing, axe and tool handles, turnery.
Class 1
Crabwood Carapa guianensis General construction, interior work, carpentry, furniture, and
turnery, plywood and veneer.
Yellow
Silverballi Aniba hypoglauca
Boat planking, canoes, furniture, cabinet work, and interior
construction.
Itikiboraballi Swartzia
xanthopetala
Inlay turnery, cabinet work, walking sticks, bag-pipes and tool
handles.
Locust Hymenaea courbaril Ship-building, general construction, carriage buildings, tool
handles, furniture and croquet mallets.
Tatabu Diplotropis
purpurea
Boat-building, house framing, and flooring, furniture and turnery,
interior work, carriage-building, tool handles, and sleepers.
Determa Ocotea rubra Boat and carriage building, masts, furniture, carving, interior
work, and general carpentry.
Wamara Eperua grandiflora Furniture, cabinet work, parquet flooring, turnery, inlay, tool
handles, walking sticks, and bows for archery.
Kabukalli Goupia glabra
Heavy construction, house framing, flooring, decking, punt
bottoms, canoes, railway sleepers, paving blocks, furniture and
decorative plywood.
Shibadan Aspidosperma
album Fuel and Plywood.
Tauroniro Humiria balsamifera Heavy construction, piling, bridges, house framing, flooring,
wheelwright work, furniture, sleepers, counters, work bench tops.
Manniballi Moronobea
coccinea
Heavy construction house sills, machinery frames, flooring,
furniture and sheet piling.
Washiba Tabebuia sp. Bridges, house framing, sleepers, tool handles, rollers’ walking
sticks, and fishing rods.

57
Hakia Tabebuia
serratifolia
Bridges, house framing, sleepers, tool handles, rollers’ walking
sticks, and fishing rods.
Dalli Virola spp. Match boxes, coffins, inside boarding, carpentry, packing cases,
plywood, slack cooperage chip board and concrete shuttering.
Suya Pouteria speciosa Interior boarding, carpentry, and plywood.
Ulu Trattinickia
demerarae Inside boarding, cupboard linings, canoes and plywood.
Simarupa Quassia simarouba Interior construction, furniture, shelves, drawer linings, shoe
heels, plywood, paper pulp, toys.
Aromata Clathrotropis
branchypetala Furniture, house framing, boat building, flooring and sleepers.
Mora Mora excelsa
Building construction especially flooring, framing and siding,
boat building especially ribs, stems, knees, transoms, and
decking, sleepers, furniture, turnery, wagon building;
wheelwright-work, naves and felloes, croquet mallets.
Morabukea Mora gonggrijpii Heavy construction, sleepers, flooring and siding, heavy
furniture, boat timbers, truck bodies.
Hububalli Loxopterygium
sagotii Panelling, furniture and cabinet work.
Class 2
Baromalli Catostemma
commune Dry cooperage, interior work, paper pulp, and plywood.
Dukalli Parahancornia
fasciculata
Carpentry, interior work, furniture, door and window stock,
concrete shuttering, match boxes and plywood.
Kereti
Silverballi Lauraceae spp Shuttering, temporary buildings, box making, and plywood.
Kurahara Calophyllum
lucidum Boat planking, canoes, punt mast and furniture.
Wabaima Licaria cannella Heavy construction, flooring, furniture, boat building (planking),
bridge decking, musical instruments.
Baradan Ocotea tomentella Canoes, concrete shuttering and plywood.
Ubudi Anarcadium
giganteum Interior work and plywood.
Kirikua Iryanthera
macrophylla
Oars, interior construction, utility plywood, slack cooperage and
concrete shuttering.
Kurokai Protium decandrum Masts, spars, house framing and plywood.
Maporokan Inga alba Interior work, fuel and cheap plywood.
Monkey Pot Lecythis zabucajo General construction, furniture, turnery and wheel spokes.
Manni Symphonia
globulifera
Utility wood, paper, pulp, plywood, cooperage, railway sleepers,
sheet piling, packing cases, general carpentry, flooring, furniture
and fuel.
Pakuri Platonia insignis Piling, boat building, furniture, turnery, house framing, flooring,
panelling, tight cooperage and general carpentry.

58
Yaruru (Yarula) Aspidosperma
excelsum
Paddles, axe and tool handles, walking sticks, fishing rods and
fuel.
Muneridian Siparuna spp.
Wallaba Eperua falcata
Eperua grandiflora
Pillar trees, roundwood framing, fence posts, transmission poles,
sleepers, paling and vat staves, shingles, charcoal, particle board
and firewood.
Class 3
Burada Parinari campestris Heavy construction, flooring.
Duka Tapirira marchandi Interior construction, furniture, and plywood.
Dukuria Sacoglottis
cydonioides Heavy construction.
Fukadi Terminalia
amazonia
House framing, framing, constructional work, railway sleepers
and plywood.
Inyak Antonia ovata Interior work, furniture and boxes.
Limonaballi Chrysophyllum
pomiferum Heavy construction and fuel.
Suradan Hyeronima
alchorneoides
Boat-framing, railway sleepers, heavy construction, truck
building, wheel spokes, furniture, plywood and gun stocks.
White Cedar Tabebuia insignis Paddles, shovel handles, and interior work, packing cases and
cheap furniture.
Futui Jacaranda copaia Coffins, matches, concrete shuttering and interior construction.
Halchiballi Pera
schomburgkiana Fuel and utility plywood.
Haiariballi Alexa imperatricis Interior construction, packing cases and plywood.
Huruasa Abarema jupunba Fuel and plywood.
Iteballi Vochysia
schomburgkii Carpentry and furniture.
Kakaralli Eschweilera alata Piling, house framing, mine lagging, posts and sleepers.
Kauta Licania laxiflora Light gauge railway sleepers, roof shingles, mine timbering, fuel
and charcoal.
59
Contact Details
Guyana Forestry Commission
1 Water Street, Kingston, Georgetown, GUYANA, South America
Tel: + (592) 226-7271/4; Fax: + (592) 226-8956
Website: www.forestry.gov.gy