foreword - parliament of victoria€¦ · • “exercise” – data not statistically significant...
TRANSCRIPT

ii
FOREWORD
It is not uncommon for local authorities to aspire to build strong, healthy communities. There are three things that distinguish Mildura Rural City Council’s ambitions in this regard and which provide grounds for confidence that it will be especially successful in its endeavours. They are:
(i) the integration of community development planning with a range of local government functions rather than positioning community concerns as an abstract pursuit on the margins of ‘real’ local government business;
(ii) the creation of planning bodies that bring together community stakeholders and local government to identify regional strengths and deficiencies and to plan remedial action where needed; and
(iii) using systematically gathered data, to guide the choice of community priorities and community strengthening activities and to monitor progress in achieving community objectives.
The present publication testifies to the seriousness of Council’s commitment to basing its social planning on tangible evidence. In 2006 Mildura Social Indicators presented data on the general profile of the region, the presence of different forms of social distress, health problems and strengths, community safety, the structure of the regional economy, the educational progress of young people and qualifications of adults, and the use made of cultural repositories (essentially the Art Gallery and local libraries). The picture that emerged from that data review has assisted in the region’s dealings with other levels of government and has attracted the interest of other regional councils, particularly in Victoria. More importantly, the data has encouraged discussion between different local organisations and branches of government services leading to a range of new, collaborative community initiatives. Some of these are aimed at reducing what are considered to be problems of one kind or another; others relate more to expanding life opportunities where previously they have been in short supply or not accessed by sections of the Mildura community. As I prepare this Foreword I have by me a publication titled Hope Project, 2008 which testifies to the imaginativeness of the Arts Centre Board, a number of local bodies and especially Mildura Primary School in exhibiting and publishing the work of Koori students. The success of this initiative has brought joy to many people; the project also exemplifies ways in which hitherto under-utilised collaborations can enrich people’s lives and build organisational and person-to-person connections for further community endeavours. It was always hoped that the sequel to the 2006 indicators would introduce refinements to the initial collection and the local La Trobe University staff have done an excellent job in this regard. Mildura Social
Indicators, 2008 is a tribute to the University’s professionalism and provides an opportunity to check the accuracy of the picture obtained in 2006 and note any new insights afforded by the data. I have no doubt that the document will stimulate continuing constructive efforts to attain Council’s ultimate goal of “Making this the most liveable, people friendly community in Australia.” Tony Vinson Professor Emeritus; Patron, Mallee Family Care

iii
Acknowledgements The authors would like to acknowledge the kind assistance of the following organisations in the research and writing of this document: Victoria Police; the Mildura Rural City Council Library Service; Department of Human Services, Victoria; Australian Bureau of Statistics; Mildura Tourism Inc., and the Victorian Injury Surveillance and Applied Research and Accident Research Centre, Monash University. Research Notes This version of the Mildura Social Indicators has seen some changes to the measures that made up the indicators in the 2006 version. Some measures have been excluded and others included as better and more appropriate data became available. Other indicators have been omitted from this latest document but may re-enter the study as more reliable statistics become available in the future. The major differences are listed below and other minor instances of change are described throughout the text where relevant. Omissions
• “Low Birth Weight” – data not statistically significant at this point in time
• “Exercise” – data not statistically significant at this point in time
• Section 5 “Community Safety” – extant measures replaced with “Crimes Against the Person”, “Crimes Against Property”, and “Road Trauma”
Changes
• “Social Cohesion” – change in the type of data collected, exclusion of the ‘sociable recreation’ measure, replaced with Volunteering and Unpaid Assistance to Those With a Disability, two new measures from the 2006 census.
• “Occupational Accidents” – previous data included “all” farm and non-farm accidents measured against labour force participation. 2008 data now measures only accidents that are occupationally related.
• Data for the “Unemployment” section (New Start allowance) and “Disability/Sickness Payment” was restricted in accordance with Centrelink’s privacy policies.
• “Computer and Internet Use/Access” measure replaced with Internet Access and Connection Type, two new measures from the 2006 census.
• “Incomplete Education/Training 17 – 24 year olds” has included those who have completed year 12 but are not in any other training or education.
• “Library Borrowings” – has been changed to measure use of the library through library visits. Localities
Readers should note that some of the localities in this iteration of the Mildura Social Indicators have changed slightly since the first publication in 2006. This iteration has carried over many of the previous geographic locales from the first publication in the interests of replication and added new ones so that there now exists some overlap between localities.
• “Greater Red Cliffs” is the large aggregation of localities inclusive of “Red Cliffs Proper” a number of townships and farming districts indicated by the plain yellow colouring on the map. Greater Red Cliffs also includes the entire locales of the Millewa and the Mallee Track, which appear as independent localities within the study.
• “Red Cliffs Proper” includes the township of Red Cliffs and immediate surrounds.
• Similarly, Nangiloc/Colignan is also incorporated within the Mildura Central category, while appearing as a separate locale. This is also in the interest of replication.
• Other locale categories, for special measures such as occupational categories (Mildura – Central and Mildura – Rural) follow the pattern of the previous Mildura Social Indicators that set these localities to avoid unnecessarily complicated data. The locales are roughly divided between more rural (Mildura – Rural) and town areas (Mildura – Central).

iv
TABLE OF CONTENTS
Foreword ii Acknowledgements and Research Notes iii Table of Contents iv List of Tables and Figures v Data Sources vi Executive summary vii Map and postcodes viii
Section 1 Overview of the Region 1 Age/Gender profile 1 An Aging Population 3 Backgrounds of Arrivals 4 Family Structures 5 Country of Birth 6 Stability of Population 7
Section 2 Social Distress 8 Family Income 8 Rental Stress 9 Home Purchase Stress 10 Lone Person Households 10
Section 3 Health 11 Childhood Accidents 11 Immunisation Cover 12 Disability/Sickness Payment 13 Occupational Accidents 14 Psychiatric Hospital Admissions 15 Section 4 Community Engagement 16 Individuals Isolated by Language 16 Profile of Group 17 Education 17 Social Cohesion 18
Section 5 Community Safety 20 Child Maltreatment 20
Crimes Against the Person 20 Crimes Against Property 20 Road Trauma 21
Section 6 Economic 22 Occupations 22 Occupational Categories 22 Types of Businesses 23 Employment Within Business Categories 24 Unemployment 25 Long Term Unemployment 25
Taxable Income 26 Tourism 27 Internet Connection/Access 30
Section 7 Education 31 Attendance at Pre-School 31 Incomplete Education/Training (17 – 24 Year Olds) 32 Overall Education 33 Post Schooling Qualifications 34
Section 8 Cultural Indicators 35 Art Gallery 35 Library Visits and Membership 36
Section 9 Environmental Indicators 37

v
LIST OF TABLES Table 1: Data Sources vi Table 2: Age Distribution Across Mildura Localities 1 Table 3: Gender Distribution Across Mildura Localities 2 Table 4: Ten Year Comparison of Residents Aged 80+ & 85+ Years of Age 3 Table 5: Individual Weekly Incomes in 2006 x Place of Residence 4 Table 6: Country of Birth by Localities 6 Table 7: Population Stability 2006 Census 7 Table 8: Home Rental Stress 9 Table 9: Home Purchase Stress 10 Table 10: Characteristics of New Arrivals 17 Table 11: Volunteering by Sub-Regions, Regional Victoria, and Melbourne 18 Table 12: Proportion of Employees in Occupational Categories (Mildura Central and Rural) 22 Table 13: Proportion of Businesses Within Mildura Sub-Regions 23 Table 14: Proportion of Workforce by Employment Categories Within Mildura’s Sub-Regions 24 Table 15: Recipients of New Start Allowance and Unemployed for 2+ Years (2008) 25 Table 16: Overall Education 33 Table 17: Post-Schooling Qualifications (Whole Population) 34 Table 18: Actual and Virtual Library Visits 2006 – 2007 36 Table 19: Annual Targets and/or Best Practice KPI 07/08 37
LIST OF FIGURES Figure 1: Age Distribution Across Mildura Localities 2 Figure 2: Comparison of Rate of Increase Between 2001 and 2006 Censuses x Aged Groups 3 Figure 3: Family Structures Across Mildura 5 Figure 4: Population Movement 2001 – 2006 7 Figure 5: Family Incomes by Localities 8 Figure 6: Spread of Single Person Households Across Mildura’s Sub-Regions 10 Figure 7: Rate of Childhood Accidents Over Three Years, January 2004 – December 2007 11 Figure 8: Children Immunised 2006 – 2008 12 Figure 9: Children Immunised 2006 – 2006 NSW 12 Figure 10: Distribution of Disability Pensions and Sickness Allowances – Rates Per 1000 13 Figure 11: Average Rate of Farm Accidents Over January 2004 – December 2006 14 Figure 12: Average Rate of Non-Farm Accidents Over Period January 2004 – December 2006 14 Figure 13: Rate per 1000 Psychiatric Admissions Across Mildura’s Sub-Regions 15 Figure 14: Individuals Isolated by Language Across Sub-Region’s (2006 Census) English Not Very Well/At All as % Total Population 16 Figure 15: Volunteering by Sub-Regions, Regional Victoria, and Melbourne 18 Figure 16: Unpaid Assistance to a Person With a Disability by Sub-Region, Regional Victoria and Melbourne 19 Figure 17: Crimes Against Property 20 Figure 18: Crimes Against the Person 21 Figure 19: Road Trauma as Injury and Fatality and no Injury 21 Figure 20: Comparative Rates of Unemployment 25 Figure 21: Taxable Income Distribution Across Mildura Localities 26 Figure 22: Domestic Overnight Visitors 27 Figure 23: Domestic Visitor Nights 28 Figure 24: Domestic Daytrip Visitation 29 Figure 25: Internet Connection/Access 30 Figure 26: Attendance at Pre-School 31 Figure 27: Proportion of 17 – 24 Year Olds Neither Completing VCE Nor Undertaking Further Schooling Education and Training 32 Figure 28: Proportion of Visitors to Art Gallery From Sub-Regions and Proportions Expected on a Population Basis 35 Figure 29: Library Membership as a Percentage of Population and Active Membership as a Percentage of Members 36 Figure 30: Community Kerbside Recycling Service Participation Rate 37 Figure 31: Tonnes of Green Waste Diverted From Mildura Landfill 38 Figure 32: Service Eco-Recycle Best Practice Target 38

vi
TABLE 1: DATA SOURCES
INDICATOR SOURCE
1. Overview of the Region
Age/Gender profile ABS
An Aging Population ABS
Backgrounds of Arrivals ABS
Family Structures ABS
Country of Birth ABS
Stability of Population ABS
2. Social Distress
Family Income ABS
Rental Stress ABS
Home Purchase Stress ABS
Lone Person Households ABS
3.Health
Childhood Accidents Monash University
Immunisation Cover Medicare
Disability/Sickness Payment Centrelink
Occupational Accidents Monash University
Psychiatric Hospital Admissions DHS
4. Community Engagement
Individuals Isolated by Language ABS
Profile of Group DIMIA
Education DIMIA
Social Cohesion ABS
5.Community Safety
Child Maltreatment Department of Human Services, Victoria
Crimes Against the Person Police Victoria, Mildura
Crimes Against Property Police Victoria, Mildura
Road Trauma Police Victoria, Mildura
6. Economic
Occupations ABS
Occupational Categories ABS
Types of Businesses ABS
Employment Within Business Categories ABS
Long Term Unemployment Centrelink
Unemployment ABS
Taxable Income Australian Tax Office
Tourism Mildura Tourism Inc.
Internet Connection/Access ABS
7. Education
Attendance at Pre-School ABS
Incomplete Education/Training (17-24 Year Olds) ABS
Overall Education ABS
Post Schooling Qualifications ABS
8. Cultural Indicators
Art Gallery Mildura Art Gallery
Library Visits and Membership Mildura Council's Library Service
9. Environmental Indicators
Water and Waste Indicators Mildura Council's Environmental Services

vii
EXECUTIVE SUMMARY While many of the indicators presented did not report substantial change since the first Mildura Social Indicators, the 2008 version has witnessed a few key changes that may warrant closer attention. As the Mildura Social Indicators is a document that relies solely on quantitative data, we summarize the main changes in terms of the more substantial increases and decreases of rate, proportion and or amount, as a quick guide to the key areas of interest.
• An Ageing Population: the rate of residents in the region who are 80 years and over has increased by 14% from 1996 to 2006
• Rental Stress: the rate of households that are experiencing rental stress has increased since 2001 by between 3.7% and 14.7% as an aggregate range inclusive of all the localities
• Childhood Accidents: continue to climb for every year studied and the municipality still experiences rates over twice that of Melbourne and Regional Victoria
• Farm Accidents: significant reduction, however the municipality overall is still above of Regional Victoria
• Psychiatric Hospital Admissions: a seemingly significant reduction, but really a reflection of the changes in the provision of mental heath services since the first Mildura Social Indicators (2006)
• Community Engagement: the region saw an increase in arrivals from Afghanistan and India. Most new arrivals from overseas are Muslim.
• Volunteering is significantly higher in the region than in Melbourne, significantly higher in more rural localities (such as the Mallee Track) than in built up areas (such as Mildura Central)
• Types of Businesses: the percentage of agricultural businesses has doubled in Mildura Central and Property and Business Services have dramatically increased across the region.
• Employment within Business Categories: some significant drift away from agricultural work throughout the region, margins greatest in Greater Red Cliffs and Wentworth.
• Incomplete Education/Training: just on a third (32.9%) of the municipality’s 17 – 24 year olds have not completed year 12 or are attending school, university, or TAFE.

Zone Locality Postcode
Irymple Irymple 3498
Merbein Merbein 3505
Merbein Merbein South 3505
Mildura Central Mildura 3500
Mildura Central Nichols Point 3501
Mildura Central Koorlong 3501
Mildura Central Hattah 3501
Mildura Central Kiamal 3501
Mildura Central (in NSW) Gol Gol 2738
Mildura Central (in NSW) Buronga 2739
Mildura Central (in NSW) Dareton 2717
Mildura Central/Nangiloc Colignan Colignan 3494
Mildura Central/Nangiloc Colignan Nangiloc 3494
Wentworth Wentworth 2648
Ouyen Ouyen 3490
Ouyen/Mallee Track Walpeup 3507
Greater Red Cliffs/Red Cliffs Proper Red Cliffs 3496
Greater Red Cliffs Carwarp 3494
Greater Red Cliffs Iraak 3494
Greater Red Cliffs Cardross 3496
Greater Red Cliffs/Millewa Cullulleraine 3496
Greater Red Cliffs/Millewa Meringur 3496
Greater Red Cliffs Merrinee 3496
Greater Red Cliffs/Millewa Werrimull 3496
Greater Red Cliffs Linga 3509
Greater Red Cliffs/Mallee Track Underbool 3509
Greater Red Cliffs/Mallee Track Cowangie 3506
Greater Red Cliffs Yelta 3505
Greater Red Cliffs Yarrara 3496
Greater Red Cliffs Karadoc 3496
Greater Red Cliffs Nowingi 3494
Greater Red Cliffs Boinka 3490
Greater Red Cliffs Tutye 3490
Greater Red Cliffs/Mallee Track Murrayville 3512
Greater Red Cliffs Patchewollock 3491
Greater Red Cliffs Baring 3491

1
SECTION 1: OVERVIEW OF REGION
AGE / GENDER PROFILE
The distribution of males and females across Mildura’s sub-regions is, as it was for the 2006 social indicators report, mostly within the range + or – 2% of Regional Victoria’s profile (49.2% males and 50.8 females). There exist some exceptions however. Again Wentworth is slightly above this range with 51.9% males and 48.1% females. New regions added to the Mildura Social Indicators for 2008 Mallee Track (51.4% males and 48.6% females) Millewa (53.2% males and 46.8% females) and Nangiloc/Colignan (57.4% males and 42.6% females) all to various degrees display a larger proportion of males to females also. Overall the age distribution for the region follows a similar pattern to the pattern reported in the 2006 indicators with Ouyen again displaying the most variance against the sub-regions, regional Victoria and Melbourne. The Mallee Track also demonstrates a similar pattern to Ouyen throughout. The range of the percentages of toddlers (under 5 years of age) has remained the same since 2006 from 4.8% to 7.9% to 3.9% to 7% but this range overall has slightly decreased. The Mallee Track has the smallest percentage of children under 5 (3.9%) and conversely the highest percentage of older people in the region (23.2%), closely followed by Ouyen (22.4%). With the exception of Greater Red Cliffs (7.3% - 5.1%), Ouyen (4.8% - 5.4%), and Merbein (7.2% - 5.5%) which all demonstrate some changes since the 2006 report, the remaining sub-regions were more or less consistent with regional Victoria and Melbourne for the very youngest age category. For the school age categories (5 – 19 years) the latest pattern is more or less consistent with the pattern displayed in the 2006 report. But for the Mallee Track (20.5%), again Ouyen (21.0%) has the lowest percentage of people in this age group in the region. Merbein (25.1%) and Irymple (26.2%) were again at the upper end of the range. The percentage of the population in Regional Victoria aged 65 years or over has increased to 16% from 14.2% in the 2006 report. Greater Red Cliffs is the only sub-region in the district to be within + or – 1% of the figure for regional Victoria with an increase of 3.5% from the 2006 indicator. The other regions, with the extreme exceptions of the Mallee Track (23.2%) and Ouyen (22.4% up from 19.5%) demonstrate figures closer to the Melbourne figure and below, well below in the case of Nangiloc/Colignan (8.4%), with the proportions of other localities, that have not changed significantly, falling between Regional Victoria and Melbourne. In the middle category of 20 – 44 years Ouyen (23.0% from 27.4%) again, along with the Mallee Track (24.1%) has the lowest proportion of 20 to 44 year olds. For 45 – 64 year olds Ouyen however ranks 5th behind other regions and is much closer to the regional Victorian figure than it was in the 2006 report. Again Ouyen and the Mallee Track have the greatest proportion of people in the middle to later stages of life. Of the over 65’s the number of women is proportionally higher than men in all of the localities in the region with the exception of Nangiloc/Colignan which has over double the percentage of males to females, a finding that has to be accompanied with some caution due to the very low numbers in that category.
TABLE 2: AGE DISTRIBUTION ACROSS MILDURA LOCALITIES
Mallee T
rack
Millew
a Area
Nan
gilo
c/Colig
nan
Red
Cliffs (P
roper)
Greater R
ed C
liffs
Mild
ura C
entral
Merb
ein
Irym
ple
Ouyen
Mild
ura R
CC
Wen
tworth
Reg
ional V
ictoria
Melb
ourn
e
0 to 4 3.9% 6.5% 6.1% 5.0% 5.1% 7.0% 5.5% 6.5% 5.4% 6.5% 6.4% 6.1% 6.3%
5 to 19 20.5% 23.5% 23.6% 24.5% 24.0% 22.4% 25.1% 26.2% 21.0% 23.1% 21.9% 21.4% 19.3%
20 to 44 24.1% 28.1% 28.4% 27.8% 27.2% 32.3% 29.0% 30.3% 23.0% 31.1% 28.9% 29.9% 37.7%
45 to 64 28.4% 29.6% 33.4% 26.3% 27.7% 23.6% 27.5% 25.2% 28.2% 24.5% 28.7% 26.7% 23.9%
65+ 23.2% 11.7% 8.4% 16.3% 16.1% 14.7% 12.8% 11.9% 22.4% 14.8% 14.1% 16.0% 12.8%
Total 772 477 605 4,598 6,828 35,608 4,763 5,739 1,492 49,817 6,780 1,333,437 3,592,592
Source: Table B04 2006 Census of Population and Housing

2
FIGURE 1: AGE DISTRIBUTION ACROSS MILDURA LOCATITIES
Source: Table B04 2006 Census of Population and Housing
TABLE 3: GENDER DISTRIBUTION ACROSS MILDURA LOCALITIES
Mallee T
rack
Millew
a Area
Nan
gilo
c/Colig
nan
Red
Cliffs (P
roper)
Greater R
ed C
liffs
Mild
ura C
entral
Merb
ein
Irym
ple
Ou
yen
Mild
ura R
CC
Wen
two
rth
Reg
ional V
ictoria
Melb
ou
rne
Males 51.4% 53.2% 57.4% 49.3% 49.9% 48.5% 50.4% 50.4% 50.4% 48.9% 51.9% 49.2% 49.0%
Females 48.6% 46.8% 42.6% 50.7% 50.1% 51.5% 49.6% 49.6% 49.6% 51.1% 48.1% 50.8% 51.0%
Total Persons 772 477 605 4,598 6,828 35,608 4,763 5,739 1,492 49,817 6,780 1,333,437 3,592,590
Source: Table B04 2006 Census of Population and Housing

3
AN AGING POPULATION
The proportion of Mildura residents aged 80 years and over for the decade between 1996 and 2006 has increased steeply from 42% to 56.3%. The proportion of those residents aged 85 years and over has also increased by over 10% throughout this decade. Mildura residents aged 80 years and over make up 4% of the total population.
TABLE 4: TEN YEAR COMPARISON OF RESIDENTS AGED 80+ & 85+ YEARS OF AGE
Source: Table c94 2006 Census of Population and Housing; Table B03 2001 Census of Population and Housing.
A substantial change from the 2006 report is the rate of increase of the proportion of people aged over 80 years of age residing in Mildura now exceeds that of both Regional Victoria and Melbourne perhaps increasing demand for services to the elderly.
FIGURE 2: COMPARISON OF RATE OF INCREASE BETWEEN 2001 AND 2006 CENSUSES X AGE GROUPS
1996 2006 Increase
80 years + 1,262 persons 1,972 persons 56.3%
85 years + 532 persons 859 persons 61.5%
All ages 44,801 persons 49,818 persons 11.2%

4
BACKGROUNDS OF ARRIVALS
Age
From 2001 to 2006, 7934 people of all ages took up residence in Mildura Municipality. This represents an increase of around 17% from the years 1996 to 2001. A similar proportion of people arrived in Mildura from other states and territories (46.2%) to the previous report (45.2%). The remainder arrived from overseas (8%, an increase of 3% from 2001). Considering age groups, 84.4% of those who took up residence in Mildura Municipality within the last five years were under 55 years of age compared with 67.2% of the longer term Mildura residents, a comparable rate to 2001 (86.4%). 15.6% of the new arrivals from 2001 to 2006 were 55 years and older compared with 32.7% of longer term residents (up from 13.6% in 2001). 3.4% of arrivals were 75 years old (up from 2.3% in 2001) or over while 8.4% of the longer term residents were 75 years of age and over. The increase in aged residents is again a local phenomenon.
Income
This section is based on incomes of longer term Mildura residents and recent arrivals to the region who lived outside the region in 2001. Again a higher proportion of local residents (69%) had incomes below $600 than people who lived outside the region in 2001, with the exception of those who lived in other regions of Victoria five years earlier, excluding Melbourne (59.2%). The overall proportion of those in the region who have incomes below $600 a week has fallen since the 2006 social indicators (averaged out at 73.8% in 2001 compared with 65.7% in 2006). Conversely the proportion of people earning over $1000 a week has increased overall (averaged out at 7.4% in 2001 compared with 12.8% in 2006). Again a higher proportion of longer term residents displayed higher rates of lower incomes (69%) than recent arrivals from Melbourne (59.2%) or overseas (64.6%).
TABLE 5: INDIVIDUAL WEEKLY INCOMES IN 2006 X PLACE OF RESIDENCE IN 2001
Below $600.0 $600-$999.0 $1,000 +
Mildura 69.0% 21.0% 10.0%
Other states 63.6% 23.0% 13.4%
Melbourne 59.2% 24.9% 15.9%
Overseas 64.6% 18.6% 16.8%
Elsewhere 72.4% 19.8% 7.8%
Source: 2006 Census of Housing and Population – Special Run

5
FAMILY STRUCTURES
In the 2006 report the type of family structure for Ouyen residents (46.7% couple without children) reflected the middle to late stage of life that many residents in that locality had attained. Ouyen is again amongst the localities that have the highest proportion of couple families without children (48.3%) but is behind Mallee Track (51.4%) an area that is also characterised by a higher proportion of people in the later stages of life, and Millewa residents (51.1%). The proportion of couple families without children in Wentworth (41.3%) is closer to the regional Victorian figure (40.7%) than it was in the previous report (43.3% compared with 38.9%) reflecting a general increase in the proportion of older people in regional Victoria. Greater Red Cliffs (45.3%), Irymple (52.1%), and Merbein (47.1%) again have higher proportions of families with children than does regional Victoria. Nangiloc/Colignan (48%) also claims a higher proportion of this type of family structure consistent with its higher proportion of people in the 20 – 44 year category. Mildura Central and the Municipality as a whole (Mildura RCC) again have a slightly increased proportion of single parent families than regional Victoria (18.1% and 16.5% to 15.4% compared with 17.1% and 15% to 14.6% for the 2006 report).
FIGURE 3: FAMILY STRUCTURES ACROSS MILDURA
Source: Table B24 2006 Census of Population and Housing

6
COUNTRY OF BIRTH
The country of birth of the region’s residents has displayed little significant change since the last report with only minor fluctuations due to some arrivals to the district of people born overseas. Figures for the Australian born are very near to or above the figure for Regional Victoria and again well above Melbourne. Residents in the Mallee Track and the Millewa who were born in Australia are above the figure for Regional Victoria also. Of interest is the figure for Nangiloc/Colignan, a significant minority of whose residents were born elsewhere overseas. This locality has a marginally lower proportion of residents born in Australia compared with the other localities in the region.
TABLE 6: COUNTRY OF BIRTH BY LOCALITIES
Mallee T
rack
Millew
a Area
Nan
gilo
c/Colig
nan
Red
Cliffs (P
roper)
Greater R
ed C
liffs
Mild
ura C
entral
Merb
ein
Irym
ple
Ou
yen
Mild
ura R
CC
Wen
two
rth
Reg
ional V
ictoria
Melb
ou
rne
Total 769 474 606 4,598 6,825 35,615 4,763 5,739 1,493 49,817 6,780 1,333,438 3,592,588
Australia 90.1% 89.7% 75.7% 86.0% 88.1% 83.2% 86.7% 85.6% 90.2% 84.2% 87.9% 84.3% 64.2%
United Kingdom 2.7% 1.3% 1.2% 2.3% 2.1% 1.9% 1.6% 1.3% 1.7% 1.9% 1.7% 3.7% 4.6%
Italy 0.0% 0.0% 0.0% 1.4% 1.2% 1.5% 1.4% 2.3% 0.0% 1.5% 1.0% 0.7% 2.1%
Turkey 0.0% 0.0% 0.0% 0.5% 0.5% 1.2% 0.5% 0.2% 0.0% 1.0% 0.0% 0.1% 0.4%
New Zealand 0.5% 0.6% 3.5% 0.9% 0.7% 1.1% 1.0% 0.9% 0.5% 1.0% 0.8% 0.9% 1.5%
Greece 0.0% 0.6% 0.0% 0.2% 0.1% 0.5% 0.2% 0.5% 0.0% 0.4% 0.1% 0.2% 1.5%
Germany 0.0% 0.6% 0.0% 0.2% 0.2% 0.3% 0.4% 0.3% 0.2% 0.3% 0.2% 0.5% 0.6%
Croatia 0.0% 0.0% 0.0% 0.1% 0.1% 0.2% 0.4% 0.5% 0.0% 0.3% 0.1% 0.2% 0.4%
Polynesia 0.0% 0.0% 2.5% 0.3% 0.2% 0.7% 0.0% 0.6% 0.0% 0.6% 0.3% 0.1% 0.8%
India 0.0% 1.3% 0.0% 0.0% 0.1% 0.3% 0.1% 0.0% 0.0% 0.2% 0.3% 0.2% 1.4%
Other 6.6% 5.9% 17.2% 7.9% 6.8% 9.2% 7.7% 7.8% 7.4% 8.7% 7.6% 9.2% 22.6%
Indigenous 3 16 18 75 108 1,549 137 72 12 1,432 612 15,924 14,127
Indigenous % 0.4% 3.4% 3.0% 1.6% 1.6% 4.3% 2.9% 1.3% 0.8% 2.9% 9.0% 1.2% 0.4%
Source: Table c25c 2006 Census of Population and Housing; Table c128 2006 Census of Population and Housing

7
STABILITY OF POPULATION
According to Vinson and Cooper1 the residential stability of households is a contributory factor to communication and connection between people. Non-stability and a particular level of household movement, the authors add, affect social cohesion. Consistent with the previous report the table below reports data for individuals and not households. Most of the localities within the region as well as the proportions of population movement for Regional Victoria and Melbourne have all maintained very similar patterns since the last report. The exceptions are Irymple (38.3% between 1996 and 2001 compared to 33.1% for 2001 – 2006) Merbein (41.1% for 1996 – 2001 compared to 34.2% for 2001 – 2006) and Greater Red Cliffs (34.8% for 1996 – 2001 compared to 31.1% for 2001 – 2006). The new additions to the social indicators project (Mallee Track, Millewa, and Nangiloc/Colignan) vary quite considerably between themselves and against the figures for the region, Regional Victoria, and Melbourne.
TABLE 7: POPULATION STABILITY 2006 CENSUS
Mallee T
rack
Millew
a Area
Nan
gilo
c/Colig
nan
Red
Cliffs (p
rop
er)
Greater R
ed C
liffs
Mild
ura C
entral
Merb
ein
Irym
ple
Ou
yen
Mild
ura R
CC
Wen
two
rth
Reg
ional V
ictoria
Melb
ou
rne
Same Address 2001 564 286 294 2,680 4,272 16,406 2,798 3,412 950 25,246 3,743 717,079 1,913,946
Different Address 2001 158 143 226 1,442 1,927 14,591 1,456 1,691 380 18,581 2,213 465,722 1,226,360
FIGURE 4: POPULATION MOVEMENT 2001-2006
Source: Table b38 2006 Census of Population and Housing
1 Mildura Social Indicators 2006 pg 11

8
SECTION 2: SOCIAL DISTRESS
FAMILY INCOME
“Low income is interwoven with the influence of other forms of disadvantage. It can be the consequence of factors like mental illness, crime and child maltreatment. Much recent research has emphasised the importance of relative inequality of income and people’s consciousness of their comparative position rather than the direct effects of material standards”2. The previous social indicators measured low family income at below $600 per week. The present iteration has indexed income against inflation for the five years since 2001 and presents an accurate figure of below $650 per week for the updated social indicators based on the $600 mark. The higher income bracket of $1200 or more per week has risen to $1400. Again the region’s localities have a higher proportion of families on a low family income compared with Melbourne. The range between the Melbourne figure and the sub-regions has increased with the introduction of the Mallee Track (20.1% to 38.9% compared with 22% to 35.9% (Wentworth) in 2001). With the exceptions of Irymple and Nangiloc/Colignan, the rest of the localities were below the rates expressed for 2001 but further from the Regional Victorian figure for low income families. Some family incomes in the Mallee Track (38.9%) and the Millewa (35.4%) exceeded the Regional Victorian figure by quite a high margin. While Mildura’s sub-regions, with the exceptions of Ouyen and Greater Red Cliffs, have experienced a slight increase in the proportion of families who earn a high income as measured here, the figure for regional Victoria and Melbourne has also increased. The proportion of families who earn a high income for the new additions of Mallee Track, Millewa, and Nangiloc/Colignan are generally below the other subregions, somewhat below Regional Victoria and well below Melbourne.
FIGURE 5: FAMILY INCOMES BY LOCALITIES
2 Mildura Social Indicators 2006 pg 12
9
RENTAL STRESS
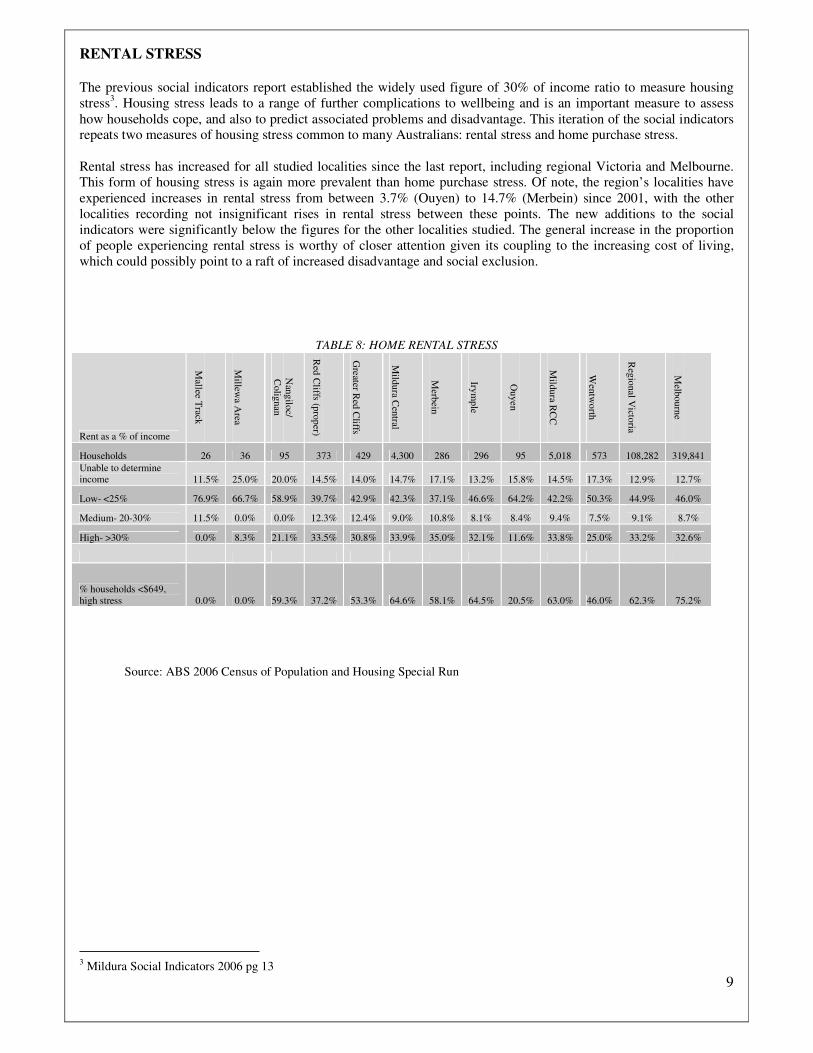
The previous social indicators report established the widely used figure of 30% of income ratio to measure housing stress3. Housing stress leads to a range of further complications to wellbeing and is an important measure to assess how households cope, and also to predict associated problems and disadvantage. This iteration of the social indicators repeats two measures of housing stress common to many Australians: rental stress and home purchase stress. Rental stress has increased for all studied localities since the last report, including regional Victoria and Melbourne. This form of housing stress is again more prevalent than home purchase stress. Of note, the region’s localities have experienced increases in rental stress from between 3.7% (Ouyen) to 14.7% (Merbein) since 2001, with the other localities recording not insignificant rises in rental stress between these points. The new additions to the social indicators were significantly below the figures for the other localities studied. The general increase in the proportion of people experiencing rental stress is worthy of closer attention given its coupling to the increasing cost of living, which could possibly point to a raft of increased disadvantage and social exclusion.
TABLE 8: HOME RENTAL STRESS
Rent as a % of income
Mallee T
rack
Millew
a Area
Nan
gilo
c/ C
olig
nan
Red
Cliffs (p
rop
er)
Greater R
ed C
liffs
Mild
ura C
entral
Merb
ein
Irym
ple
Ou
yen
Mild
ura R
CC
Wen
two
rth
Reg
ional V
ictoria
Melb
ou
rne
Households 26 36 95 373 429 4,300 286 296 95 5,018 573 108,282 319,841
Unable to determine income 11.5% 25.0% 20.0% 14.5% 14.0% 14.7% 17.1% 13.2% 15.8% 14.5% 17.3% 12.9% 12.7%
Low- <25% 76.9% 66.7% 58.9% 39.7% 42.9% 42.3% 37.1% 46.6% 64.2% 42.2% 50.3% 44.9% 46.0%
Medium- 20-30% 11.5% 0.0% 0.0% 12.3% 12.4% 9.0% 10.8% 8.1% 8.4% 9.4% 7.5% 9.1% 8.7%
High- >30% 0.0% 8.3% 21.1% 33.5% 30.8% 33.9% 35.0% 32.1% 11.6% 33.8% 25.0% 33.2% 32.6%
% households <$649, high stress 0.0% 0.0% 59.3% 37.2% 53.3% 64.6% 58.1% 64.5% 20.5% 63.0% 46.0% 62.3% 75.2%
Source: ABS 2006 Census of Population and Housing Special Run
3 Mildura Social Indicators 2006 pg 13

10
HOME PURCHASE STRESS
The proportion of households that experienced home purchase stress was again significantly lower than the proportion of residents who experienced rental stress. However the table below reports an overall increase in home purchase stress for all localities studied since 2001. While Melbourne residents recorded the highest percentage change in home rental stress between the reports of 6.4% (17.4% in 2001 compared with 23.8 in 2006), the region’s localities reported increases between 2.3% (Greater Red Cliffs) and 6.2% (Mildura Central).
TABLE 9: HOME PURCHASE STRESS WHERE INCOME IS KNOWN
% of income
Mallee T
rack
Millew
a Area
Nan
gilo
c/ C
olig
nan
Red
Cliffs (p
rop
er)
Greater R
ed C
liffs
Mild
ura C
entral
Merb
ein
Irym
ple
Ouy
en
Mild
ura R
CC
Wen
two
rth
Reg
ional V
ictoria
Melb
ou
rne
Total purchase 36 38 54 590 900 4,338 708 813 118 6,187 815 167,613 466,934
Unable to determine income 27.8% 42.1% 38.9% 18.5% 21.6% 16.8% 22.3% 18.5% 27.1% 17.6% 22.8% 17.7% 16.7%
Low- <25% 47.2% 34.2% 38.9% 56.4% 52.8% 54.1% 52.1% 55.7% 56.8% 54.4% 52.1% 55.0% 50.2%
Medium- 20-30% 8.3% 15.8% 0.0% 7.5% 6.3% 9.0% 5.8% 7.9% 2.5% 8.3% 6.1% 8.2% 9.3%
High- >30% 16.7% 7.9% 22.2% 17.6% 19.2% 20.2% 19.8% 18.0% 13.6% 19.7% 18.9% 19.1% 23.8%
Source: ABS 2006 Census of Population and Housing Special Run
LONE PERSON HOUSEHOLDS
The proportion of lone person households has not changed dramatically since the last report with only very minor fluctuations in the percentages of people residing alone across all of the localities. Of note however are the higher proportions of lone person households in the Mallee Track and the Nangiloc/Colignan regions.
FIGURE 6: SPREAD OF SINGLE PERSON HOUSEHOLDS ACROSS MIDLURA'S SUB-REGIONS (2006 CENSUS)
Source: Table B30 2006 Census of Population and Housing, Table B04 2006 Census of Population and Housing

11
SECTION 3: HEALTH4
CHILDHOOD ACCIDENTS5 A range of factors such as low income, single parent families, limited education and unemployment are all related to the rate of childhood (0 – 18 years) accidents in a given locality6. While the number of childhood accidents has increased incrementally across all the localities studied, with the exception of Ouyen and Wentworth, the proportional pattern between childhood accidents in the region’s localities and the rest of the state up to 20067 has not changed. The Mildura region still records substantially higher incidents of childhood accidents to the rest of the state.
FIGURE 7: RATE OF CHILDHOOD ACCIDENTS OVER THREE YEARS JANUARY 2004 - DECEMBER 2007 (RATE PER
1,000)
Source: Victorian Injury Surveillance and Applied Research Accident Research Centre Monash University 2008, Table B04 2006 Census of Population Housing
4 There have been some changes made to the indicators in this section since the Mildura Social Indicators 2006, please refer to the Research Notes section for a description. 5 Population increase/decreased factored in from 2001 Census. 6 Mildura Social Indicators pg 16 7 Victorian Injury Surveillance and Applied Research Accident Research Centre has changed its timeframe for data collection from the financial year to the calendar year.

12
IMMUNISATION COVER8 The immunisation of children for the region compares well with Regional Victoria and Melbourne, as it did in the previous social indicators. Among the key changes is an increase in the rate of children immunised who live in Ouyen, up from 84% in 2005 to 100% in 2007. The figure for Merbein however has decreased from near 98% in 2006 to 85% in 2007. The New South Wales localities, itemised separately from the Victorian localities for this indicator, are quite close to the Regional Victorian and Melbourne rates.
FIGURE 8: CHILDREN IMMUNISED 2006-2007
Source: Medicare Australia (Victoria), Australian Childhood Register - Coverage Report 2006-2007
FIGURE 9: CHILDREN IMMUNISED 2006-2007NSW
Source: Medicare Australia, (NSW), Immunisation Coverage Rates by Division of General Practice 2006-2007 *No percentages have been produced for postcodes with less than 100 children.
8 Data from NSW Medicare do not receive the level of breakdown as Victoria does as there is minimal immunisation service
delivered through councils. As the NSW assessment and age categories are different, an appropriate comparison has been provided in a separate table.

13
DISABILITY/SICKNESS PAYMENT9 This indicator again combines data for disability support pension and sickness allowance as one means of assessing the individual health of residents living in the region’s localities and also the Mildura community’s wellbeing in comparison to Regional Victoria and Melbourne. ‘Briefly, sickness allowance is available to Australian residents (or newly arrived migrants after 104 weeks in Australia) who are temporarily incapacitated for work or full-time study. Recipients must have a job or full-time study to which they can return. A disability support pension is available to Australian residents of ten years standing who are aged 16 years or over. The beneficiaries must have a physical, intellectual or psychiatric impairment assessed at 20 points or more and be unable to work for at least the next two years as a result of impairment and be unable to undertake vocational or educational training that would equip them for work within two years'10.
In both 2006 and 2007, the rates of disability/sickness payments in three of the sub-areas of Mildura fell below that of Regional Victoria, with two slightly exceeding and Mildura RCC almost equalling that of Regional Victoria. This is in contrast to the 2005 figures where four of the sub-area figures fell below the Regional Victoria figure. Notwithstanding, all locations and sub-regions with the exception of Melbourne, have seen a dramatic decrease in figures from 2005. Melbourne in the previous report displayed substantially lower figures than all other locations and sub-areas with the exception of Ouyen, this current report shows Melbourne figures to be once again below all other locations with the exception of Irymple for both years. Nonetheless, caution must be exercised when reviewing the
most recent findings expressed below. Due to the issues of privacy, numbers below 20 in some of the smaller postcodes within the raw data were not available and therefore averages were estimated.
FIGURE10: DISTRIBUTION OF DISABILITY PENSIONS AND SICKNESS ALLOWANCES - RATES PER 1,000
Source: Centrelink Unpublished Data, 2008
9 Data provided by Centrelink was specific to Victoria only therefore the separate sub-area of Wentworth is absent and in this instance the locality of Mildura Central does not include New South Wales measures. 10 Mildura Social Indicators 2006 pg 18

14
OCCUPATIONAL ACCIDENTS11
As was the case for the first social indicators this section uses data based on hospital treatment records from January 2004 to December 2006. Again the results have been averaged and expressed as a rate per 1,000 in the farm and non-farm labour force. FIGURE 11: AVERAGE RATE OF FARM ACCIDENTS OVER PERIOD JANUARY 2004 - DECEMBER 2006 (RATE PER 1,000
PEOPLE IN FARM LABOUR FORCE)
Source: Victorian Injury Surveillance and Applied Research Accident Research Centre Monash University 2008, Table B42 2006 Census of Population and Housing
Since the last social indicators report there has been a significant reduction in farm accidents for the region, Regional Victoria, and localities surrounding Melbourne. The reductions are greatest in Irymple (30.3), Wentworth (12.7), and Mildura Central (11.7) and are perhaps the result of targeted campaigns and initiatives designed to improve safety. Turning to non-farm accidents, the updated table reports that many of the region’s figures are still over two and up to nearly four times the amount of Melbourne and at times still more than doubling that of Regional Victoria. FIGURE 12: AVERAGE RATE OF NON-FARM ACCIDENTS OVER PERIOD JANUARY 2004 - DECEMBER 2006 (RATE PER
1,000 PEOPLE IN NON-FARM LABOUR FORCE)
Source: Victorian Injury Surveillance and Applied Research Accident Research Centre Monash University 2008, Table B42 2006 Census of Population and Housing
11 Please refer to Research Notes for changes to this indicator
15
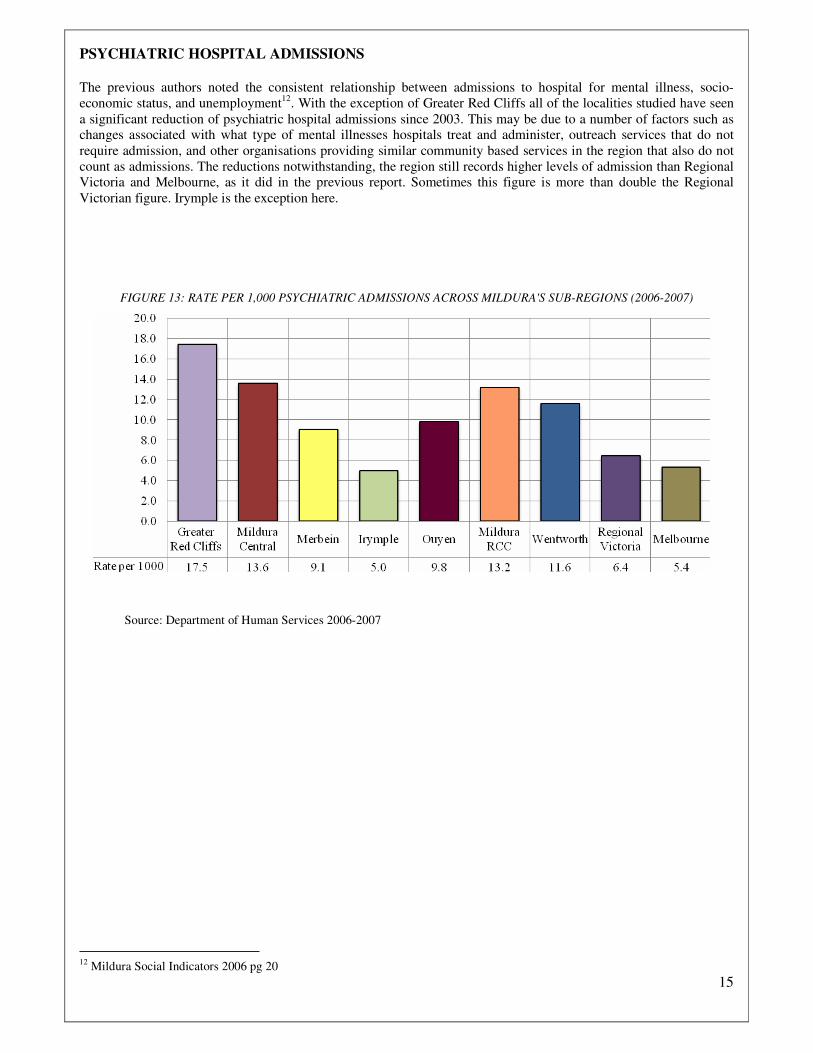
PSYCHIATRIC HOSPITAL ADMISSIONS The previous authors noted the consistent relationship between admissions to hospital for mental illness, socio-economic status, and unemployment12. With the exception of Greater Red Cliffs all of the localities studied have seen a significant reduction of psychiatric hospital admissions since 2003. This may be due to a number of factors such as changes associated with what type of mental illnesses hospitals treat and administer, outreach services that do not require admission, and other organisations providing similar community based services in the region that also do not count as admissions. The reductions notwithstanding, the region still records higher levels of admission than Regional Victoria and Melbourne, as it did in the previous report. Sometimes this figure is more than double the Regional Victorian figure. Irymple is the exception here.
FIGURE 13: RATE PER 1,000 PSYCHIATRIC ADMISSIONS ACROSS MILDURA'S SUB-REGIONS (2006-2007)
Source: Department of Human Services 2006-2007
12 Mildura Social Indicators 2006 pg 20
16
SECTION 4: COMMUNITY ENGAGEMENT
INDIVIDUALS ISOLATED BY LANGUAGE
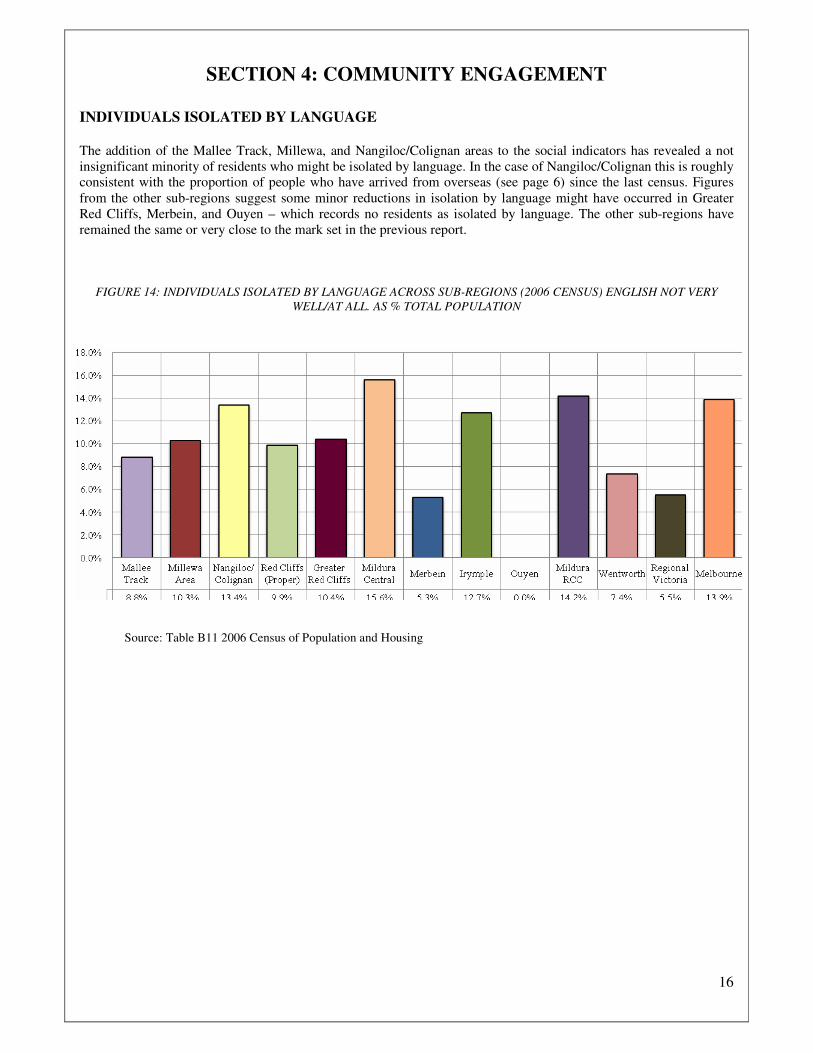
The addition of the Mallee Track, Millewa, and Nangiloc/Colignan areas to the social indicators has revealed a not insignificant minority of residents who might be isolated by language. In the case of Nangiloc/Colignan this is roughly consistent with the proportion of people who have arrived from overseas (see page 6) since the last census. Figures from the other sub-regions suggest some minor reductions in isolation by language might have occurred in Greater Red Cliffs, Merbein, and Ouyen – which records no residents as isolated by language. The other sub-regions have remained the same or very close to the mark set in the previous report.
FIGURE 14: INDIVIDUALS ISOLATED BY LANGUAGE ACROSS SUB-REGIONS (2006 CENSUS) ENGLISH NOT VERY
WELL/AT ALL. AS % TOTAL POPULATION
Source: Table B11 2006 Census of Population and Housing

17
PROFILE OF GROUP
This updated report has again used data from the Department of Immigration, Multicultural and Indigenous Affairs (DIMIA) to report on new arrivals to Mildura from overseas between January 1 2005 and January 1 2008. Data from the DIMIA informs us that arrivals to the region between the specified dates were born in the following countries, belonged to the following religions, and spoke the following languages in the table below. Some changes have occurred to the countries of birth of recent arrivals since 2005 as reported in the previous Mildura Social Indicators. The top four countries of birth for recent arrivals include four new listings: Afghanistan, India, South Africa, and Iraq. Part of this change might reflect broader geo-political changes that impact upon immigration patterns such as the military conflicts in Afghanistan and Iraq. Another factor associated with this change is the attraction of skilled migrants to the region that have arrived from India and South Africa. Accompanying these changes is the increasing proportion of Muslims, among other religious groups, who are settling in the area (54.4% of total arrivals from 2000 – 2005 compared with 73.1%). A further change is the introduction of new language groups to the region such as Dari, a dialect of Persian spoken by Afghanis, Farsi, Hazaragi, and Hindi.
TABLE 10: CHARACTERISTICS OF NEW ARRIVALS
Country of birth % (Total = 242) Religion % (Total known = 134) Major Language % (Total known = 192) Afghanistan 31.4 Islam 73.1 Dari 34.4 India 8.7 Catholic/Western Catholic 6.0 English 24.0 South Africa 8.7 Christian (nfd) 6.0 Arabic 7.8 Iraq 7.0 Buddhism 4.5 Turkish 4.7 United Kingdom 7.0 Hinduism 4.5 Hazaragi 3.6 Philippines 5.4 Ancestor Veneration 0.7 Farsi (Persian) 3.1 Turkey 4.5 Catholic (nec) 0.7 Hindi 2.6 Iran 3.7 No Religion (nfd) 0.7 African Languages, n 2.1 Sri Lanka 2.1 Orthodox (nfd) 0.7 Kurdish 1.6 Thailand 2.1 Other Protestant (nfd) 0.7 Romanian 1.6 Others 17.7 Others 2.2 Others 14.6 Birthplace unknown 1.6
EDUCATION
The years of education completed for recent arrivals was again available for only under half of the total figure 95/242 (39.2%). The educational levels of recent arrivals from overseas for this report closely match those from the previous report in terms of the proportions who had six years or less (29.7% compared with 35.7%), seven to ten years (21.7% compared with 21.2%) and over ten years of education (42.9% compared with 43.1%)

18
SOCIAL COHESION
Measures for this dimension of the Mildura Social Indicators have changed since the last report as a result of changes to the census since 2001. The Australian Bureau of Statistics have introduced two measures of social cohesion to the census that will provide reliable and statistically significant data on this issue into the future. The two measures are volunteering and unpaid assistance to those with a disability, both indicating the level of care in the community. The proportion of those undertaking voluntary work across the region’s localities is significantly above that of Melbourne, substantially so in some localities such as the Mallee Track, Ouyen, and the Millewa, perhaps reinforcing the importance of this form of social cohesion in more isolated areas. The lower rates of volunteering are consistent with areas that are more ‘urban’ or built up in character such as Mildura Central and Irymple.
TABLE 11 VOLUNTEERING BY SUB-REGIONS, REGIONAL VICTORIA AND MELBOURNE
Mallee T
rack
Millew
a Area
Nan
gilo
c/ C
olig
nan
Red
Cliffs (p
roper)
Greater R
ed C
liffs
Mild
ura C
entral
Merb
ein
Irym
ple
Ouyen
Mild
ura R
CC
Wen
tworth
Reg
ional V
ictoria
Melb
ourn
e
Volunteer 46.5% 34.2% 20.4% 20.5% 26.6% 18.3% 21.3% 19.2% 41.5% 20.2% 22.4% 24.2% 15.6%
Not a volunteer 47.2% 56.6% 65.0% 68.3% 63.4% 71.9% 69.6% 71.7% 49.2% 70.1% 67.8% 67.0% 74.8%
Voluntary work not stated 6.3% 9.3% 14.6% 11.2% 9.9% 9.7% 9.1%
9.04% 9.4% 9.7% 9.7% 8.8%
9.56%
Source: Table B18 2006 Census of Population and Housing
FIGURE 15: VOLUNTEERING BY SUB-REGIONS, REGIONAL VICTORIA, AND MELBOURNE
Source: Table B18 2006 Census of Population and Housing
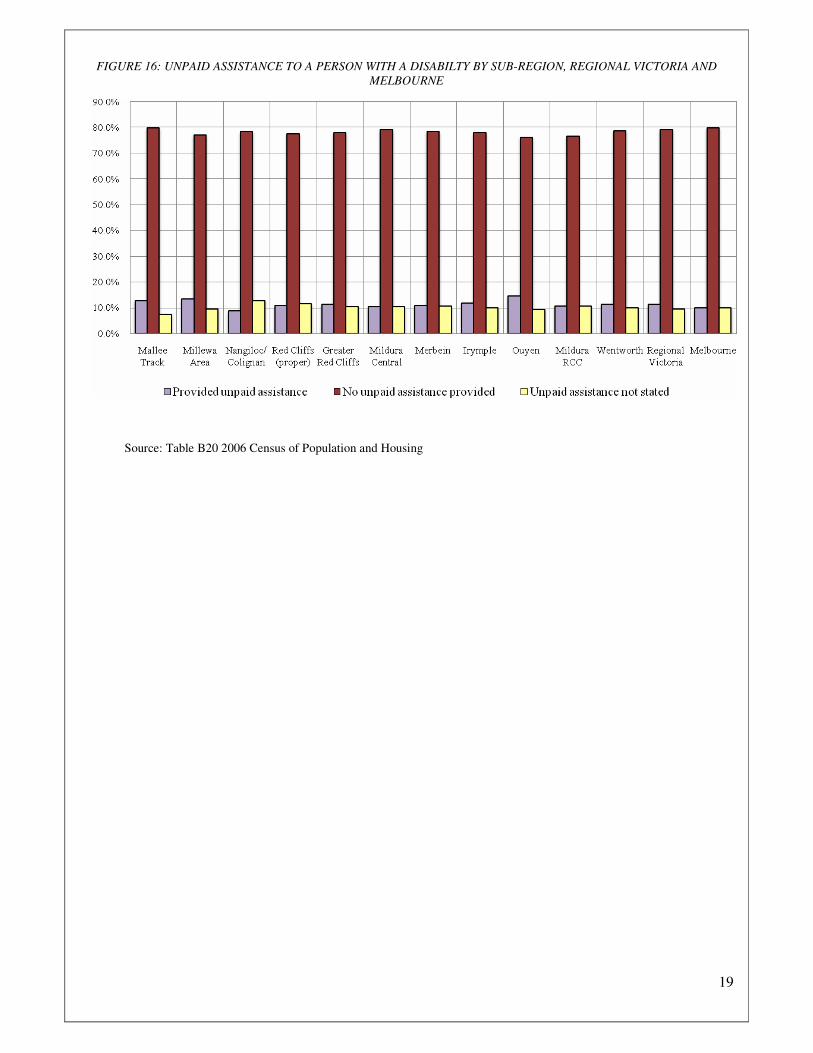
The level of unpaid assistance to people with a disability is more equal between the region’s localities, Regional Victoria, and Melbourne. However the more isolated areas of the Mallee track, the Millewa, and Ouyen again record a higher proportion than less isolated and built up areas.
19
FIGURE 16: UNPAID ASSISTANCE TO A PERSON WITH A DISABILTY BY SUB-REGION, REGIONAL VICTORIA AND
MELBOURNE
Source: Table B20 2006 Census of Population and Housing

20
SECTION 5: COMMUNITY SAFETY13
With the exception of child maltreatment, the indicators for community safety have changed since the last Mildura Social Indicators report. The new measures draw on key indicators of community safety to reflect the more common crimes and road dangers that communities experience. The data used for this section is drawn from Victoria Police and is reported through the police service’s own Response Zones of: Werrimull, Underbool, Murrayville, Red Cliffs, Greater Mildura, Merbein, Ouyen, Mildura RCC (Police Service Area). Greater Mildura inclusive of Irymple and Nichols Point, excludes the New South Wales communities of Gol Gol, Buronga and Dareton.
CHILD MALTREATMENT Child maltreatment is influenced by particular socio-economic conditions such as employment rates and income14. This iteration of the Mildura Social Indicators uses Department of Human Services (VIC) data from 2007 to asses the comparative rate of substantiated cases of child maltreatment in the municipality against the Melbourne rate. Again due to the sensitive nature of this data and the constraints of its use, individual rates for localities will not be published. Substantiated cases of child maltreatment for Melbourne since 2002 have fallen slightly to 5.7 instances per 1,000 children. The Mildura figure, based on the municipality as a whole, is just on three times that of Melbourne at 17.2 instances per 1,000 children. Again this area of community safety warrants closer attention from the Community Engagement Framework Governance Group.
CRIME AGAINST PROPERTY From 2002/2003 the greater majority of the region’s localities record lower rates for crimes against property than for Regional Victoria and Melbourne. A general pattern for all localities studied is a decreasing rate of recorded crimes against property from 2002 to 2007, with the exception of Merbein, rates for which have remained steady over the five year period. Greater Mildura (equated to Mildura Central) has the highest rate of crimes against property for the region, throughout the time-frame analysed.
FIGURE 17: CRIMES AGAINST PROPERTY
Source: Victoria Police, Mildura
13 The measures that were used for this section of the Mildura Social Indicators 2006 have changed, please refer to the Research Notes for a description. 14 Mildura Social Indicators 2006 pg 25
21
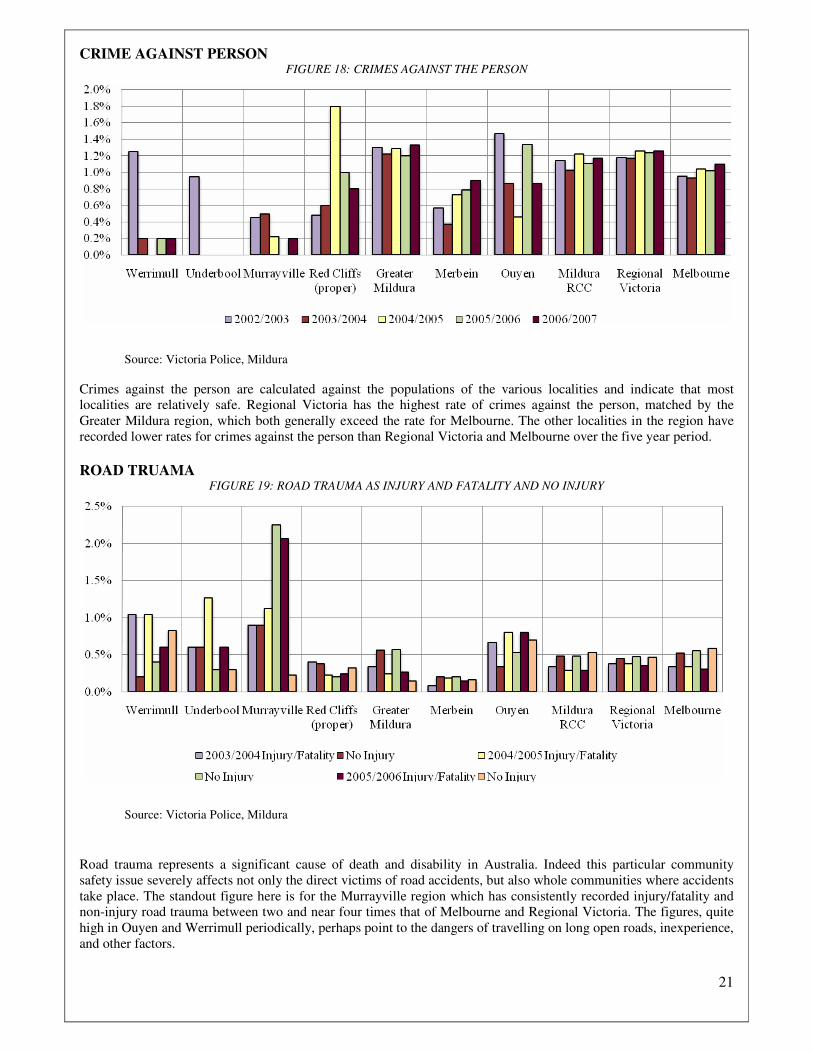
CRIME AGAINST PERSON FIGURE 18: CRIMES AGAINST THE PERSON
Source: Victoria Police, Mildura
Crimes against the person are calculated against the populations of the various localities and indicate that most localities are relatively safe. Regional Victoria has the highest rate of crimes against the person, matched by the Greater Mildura region, which both generally exceed the rate for Melbourne. The other localities in the region have recorded lower rates for crimes against the person than Regional Victoria and Melbourne over the five year period.
ROAD TRUAMA
FIGURE 19: ROAD TRAUMA AS INJURY AND FATALITY AND NO INJURY
Source: Victoria Police, Mildura
Road trauma represents a significant cause of death and disability in Australia. Indeed this particular community safety issue severely affects not only the direct victims of road accidents, but also whole communities where accidents take place. The standout figure here is for the Murrayville region which has consistently recorded injury/fatality and non-injury road trauma between two and near four times that of Melbourne and Regional Victoria. The figures, quite high in Ouyen and Werrimull periodically, perhaps point to the dangers of travelling on long open roads, inexperience, and other factors.

22
SECTION 6: ECONOMIC
OCCUPATIONS
The previous report drew on ABS data to explore the occupational patterns of the Mildura region by defining broad occupational categories across aggregated regional localities of Mildura – Rural, Mildura – Central and compared them with figures for Victoria. This method provides meaningful details about occupations without overly data intensive tables and reports; the present section replicates this scheme. There are some minor changes to the way the data has been collected by the ABS therefore the categories below are a close approximation to the categories in the previous report rather than an exact replication. These changes do not compromise the analysis however and a clear picture of the most recent occupational patterns is able to be produced.
OCCUPATIONAL CATEGORIES
Mildura – Central and Victoria record similar proportions of occupational categories again with some minor changes and a couple of more substantial differences. Mildura – Central has a steady decrease of managers over the decade from 1996 to 2006, however the figure remains above the Victorian average (as was reported in the previous report, managers in Mildura – Rural are mostly farmers who manage their own properties). While the proportion of professionals has slightly risen in Mildura – Central it has not kept pace with the general Victorian figure which is just over six percent higher, which is also the proportional difference for labourers between Mildura - Central and Victoria. Other occupational categories are more or less similar between Mildura – Central and Victoria. The occupational categories for Mildura – Rural reflect the dominant industries in this region such as agriculture and therefore explain the lower figures for professionals, technicians and trade workers, clerical and sales workers.
TABLE 12: PROPORTION OF EMPLOYEES IN OCCUPATIONAL CATEGORIES15
(MILDURA CENTRAL AND RURAL)
Mildura - Rural Mildura - Central Victoria
1996 2001 2006 1996 2001 2006 1996 2001 2006
Managers 41.5% 40.3% 42.4% 18.9% 16.9% 14.9% 13.9% 13.6% 13.5%
Professionals 8.1% 8.8% 9.7% 13.0% 14.0% 14.6% 17.9% 19.6% 20.7%
Technicians and trade workers (b) 7.1% 6.5% 7.4% 13.2% 13.7% 14.2% 15.1% 14.3% 14.0%
Comm. and personal service workers 5.1% 5.1% 5.5% 7.0% 8.2% 8.6% 7.1% 7.7% 8.4%
Clerical and admin. Workers 5.5% 5.9% 5.5% 11.7% 11.8% 11.9% 15.8% 15.3% 14.8%
Sales workers 3.7% 4.2% 3.6% 10.6% 10.8% 11.6% 9.5% 10.2% 10.2%
Mach. Operators and drivers 6.2% 6.3% 5.4% 6.5% 6.6% 6.6% 8.2% 7.4% 6.6%
Labourers 19.8% 20.4% 19.0% 15.8% 15.6% 15.7% 9.7% 9.8% 9.9%
Inadequately described/Not stated 2.8% 2.4% 1.5% 3.1% 2.2% 1.8% 2.7% 2.1% 2.0%
Total 100.0% 100.0% 100.0% 100.0% 100.0% 100.0% 100.0% 100.0% 100.0%
Source: Table T26 2006 Census of Population and Housing
15 'Occupation' was coded to the 2006 Australian and New Zealand Standard Classification of Occupations (ANZSCO). This has replaced the
1996 Australian Standard Classification of Occupations (ASCO) Second Edition. Data for 1996 and 2001 have been concorded. In 1996 and 2001 'Technicians and trades workers' includes Engineering, Information and Communications Technology and Science Technicians and Tradespersons.

23
TYPES OF BUSINESSES
The previous social indicators report used data from the Small Business Register (Australian Bureau of Statistics) to record the variety of industries that small business in the region is involved in. The ABS has ceased to collect this data via the Small Business Register therefore an exact replication is impossible. However comparable data was available through the Australian Business Register (ABS) and can lend some empirical evidence to the structure of business activity in the region for this iteration of the indicators. We urge caution when interpreting the following statistics however. Not surprisingly the region is dominated by businesses involved in the Agriculture, Forestry, and Fishing sector, which also includes horticulture. Perhaps the most important changes since the last report affect Mildura Central. This region has seen a 12.6% increase in businesses enter the agricultural industry, with comparable reductions in the percentages of businesses trading in the construction (-5.8%) and retailing (-5.1%) industries. Businesses involved in Property and Business Services has also risen sharply since the last report with an almost sixfold increase in the proportion of businesses trading in this sector (3% in 2001 compared with 17.7% in 2006). Indeed Businesses recorded under the Property and Business Services has increased dramatically across all of the sub-regions perhaps pointing to changing economic conditions and opportunities.
TABLE 13: PROPORTIONS OF BUSINESSES WITHIN MILDURA SUB-REGIONS
Greater R
ed C
liffs
Mild
ura C
entral
Merb
ein
Irym
ple
Ouyen
Mild
ura R
CC
Wen
tworth
Reg
ional V
ictoria
Melb
ourn
e
Agriculture, Forestry and Fishing 68.0% 25.7% 61.3% 45.1% 67.4% 38.5% 62.6% 28.5% 2.8%
Construction 6.6% 13.3% 8.8% 17.4% 4.7% 11.8% 5.3% 16.6% 15.2%
Retail Trade 4.6% 12.7% 4.9% 3.8% 9.3% 10.1% 5.3% 10.9% 11.3%
Finance & Insurance 1.7% 5.3% 1.5% 2.2% 1.2% 3.9% 2.3% 3.8% 8.0%
Transport & Storage 3.1% 4.5% 6.4% 5.4% 4.7% 4.6% 3.1% 5.3% 6.3%
Property & Business Services 6.3% 17.7% 6.9% 12.0% 2.3% 13.6% 6.1% 15.0% 29.3%
Personal & Other Services 1.4% 2.9% 1.5% 1.6% 1.2% 2.5% 1.5% 2.4% 2.9%
Manufacturing 2.3% 3.8% 3.4% 4.3% 0.0% 3.7% 1.5% 4.5% 6.5%
Health & Community Services 0.9% 4.2% 1.0% 0.9% 2.3% 3.1% 0.8% 3.2% 4.9%
Wholesale Trade 2.3% 3.1% 1.5% 3.8% 2.3% 2.9% 3.1% 3.0% 5.3%
Cultural & Recreational Services 0.3% 1.4% 0.5% 1.1% 0.0% 1.1% 2.3% 1.7% 2.6%
Education 0.0% 0.6% 0.0% 0.0% 0.0% 0.4% 0.0% 0.5% 0.9%
Accommodation, Cafes and Restaurants 1.1% 3.6% 1.0% 1.6% 2.3% 2.7% 5.3% 3.4% 2.5%
Communication Services 1.1% 0.6% 0.5% 0.5% 2.3% 0.8% 0.0% 0.9% 1.3%
Electricity, Gas, & Water Supply 0.3% 0.4% 0.0% 0.0% 0.0% 0.2% 0.0% 0.1% 0.1%
Mining 0.0% 0.2% 1.0% 0.0% 0.0% 0.2% 0.8% 0.2% 0.1%
Source: Australian Business Register June 2003 – June 2006, ABS, special request.

24
EMPLOYMENT WITHIN BUSINESS CATEGORIES
Overall the proportional patterns for employment have not changed greatly since the last report, yet some important changes have emerged within employment since 2001. Again the major proportion of employment in Mildura’s more rural areas is in agriculture. Not surprisingly this business type provides over half the total employment opportunities for Mallee Track (50.9%) Millewa (58.8%) and Nangiloc/Colignan (65%), substantially more than other sub-regions and Regional Victoria. Conversely these regions are well below other localities, with the exceptions of Ouyen and Wentworth (a pattern similar to the previous report) in the other major business categories of manufacturing, retail trade, health care and social assistance. Though the ways in which the ABS categorise businesses has changed (Industry of employment was coded to the 2006 Australian and New Zealand Standard Industrial Classification (ANZSIC), this coding has replaced the 1993 ANZSIC first edition on which this section was based in the first Mildura Social Indicators report), there are signs of a changing economy in the region’s more rural areas, perhaps as drought and other constraints take their toll. Many of the localities have experienced a shrinking of the agriculture sector, Greater Red Cliffs and Wentworth the most prominent (40.7% to 28.2% and 35.2% to 23.9% respectively) as people move away from rural areas and/or, alternative forms of work/employment.
TABLE 14: PROPORTION OF WORKFORCE X EMPLOYMENT CATEGORIES WITHIN MILDURA’S SUB-REGIONS
Mallee T
rack
Millew
a Area
Nan
gilo
c/Colig
nan
Red
Cliffs (P
roper)
Greater R
ed C
liffs
Mild
ura C
entral
Merb
ein
Irym
ple
Ouyen
Mild
ura R
CC
Wen
tworth
Reg
ional V
ictoria
Melb
ourn
e
Agriculture Forestry and Fishing 50.9% 58.8% 65.0% 22.1% 28.2% 9.6% 17.5% 13.2% 31.1% 13.3% 23.9% 9.2% 0.6%
Mining 0.0% 0.0% 0.0% 0.2% 0.1% 0.4% 0.4% 0.4% 1.5% 0.4% 1.3% 0.6% 0.2%
Manufacturing 0.8% 1.3% 1.9% 16.2% 12.1% 9.4% 12.8% 12.0% 2.5% 10.5% 7.6% 11.8% 12.9%
Elec., gas, water & waste services 0.8% 3.3% 0.0% 1.2% 1.1% 1.3% 1.4% 1.3% 1.3% 1.3% 1.5% 1.3% 0.7%
Construction 2.3% 1.3% 2.2% 5.2% 4.5% 7.0% 7.4% 7.8% 4.9% 6.7% 6.7% 8.2% 7.3%
Wholesale trade 3.1% 3.8% 3.5% 4.1% 3.8% 3.9% 2.4% 3.6% 1.6% 3.5% 4.3% 3.3% 5.5%
Retail trade 5.4% 7.1% 1.9% 10.4% 9.0% 13.9% 11.1% 13.8% 10.3% 13.4% 8.3% 12.2% 11.4%
Accommodation & food services 2.8% 2.5% 1.9% 5.1% 4.4% 7.2% 5.8% 5.2% 3.7% 6.3% 7.4% 6.3% 5.6%
Transport, postal & warehousing 5.4% 3.8% 1.3% 3.6% 3.8% 4.6% 6.0% 5.0% 6.0% 4.6% 4.1% 4.2% 4.7%
Information media & telecom. 0.0% 0.0% 0.0% 0.6% 0.6% 1.0% 0.5% 1.1% 0.0% 1.0% 0.8% 1.3% 2.5%
Financial & insurance services 0.8% 0.0% 1.9% 1.3% 1.0% 2.2% 1.4% 1.5% 0.4% 1.9% 1.5% 2.0% 4.8%
Rental, hiring & real estate ser. 0.0% 0.0% 0.0% 0.5% 0.3% 1.3% 0.7% 1.2% 0.0% 1.0% 0.9% 1.1% 1.4%
Professional, scientific & tec. Ser. 3.1% 2.5% 2.2% 1.6% 1.4% 3.9% 2.0% 3.1% 0.9% 3.2% 2.9% 3.7% 8.3%
Administrative & support ser. 1.0% 0.0% 6.3% 5.4% 3.9% 3.9% 3.4% 4.1% 0.4% 3.9% 3.3% 2.6% 3.5%
Public admin. & safety 2.6% 2.9% 0.0% 3.6% 3.3% 5.3% 4.4% 4.0% 4.9% 5.0% 4.8% 5.8% 4.9%
Education & training 11.6% 9.2% 1.9% 6.7% 7.1% 7.8% 7.2% 7.0% 9.6% 7.6% 6.5% 7.9% 7.6%
Health care & social assistance 5.7% 2.5% 2.2% 6.0% 6.3% 10.3% 8.8% 8.5% 14.9% 9.8% 7.3% 11.4% 10.0%
Arts & recreation services 0.0% 0.0% 0.9% 0.5% 0.4% 0.9% 0.9% 1.0% 1.0% 0.8% 0.8% 1.2% 1.7%
Other services 1.5% 1.3% 0.0% 2.5% 2.5% 3.1% 2.6% 3.3% 1.3% 2.9% 2.7% 3.5% 3.6%
Inadeq. described/ Not stated 2.3% 0.0% 6.9% 3.2% 4.3% 2.9% 3.1% 2.9% 1.8% 2.9% 3.3% 2.3% 2.7%
Source: Table B42 2006 Census of Population and Housing

25
UNEMPLOYMENT
While unemployment rates have lowered across all of the localities since the last census in 2001 Mildura Central (6.3%) is slightly above the rate for Regional Victoria (5.6%) and Melbourne (5.3%). Other localities such as Merbein, Mildura RCC, and Wentworth, are again quite near the rate of unemployment for Regional Victoria and Melbourne. The new additions of Mallee Track, Millewa, and Nangiloc/Colignan are below the Regional Victorian and Melbourne rates.
FIGURE 20: COMPARATIVE RATES OF UNEMPLOYMENT (2006)
Source: Table B41 2006 Census of Population and Housing
New Start recipients are again reviewed as a means of assessing the state of protracted unemployment (unemployed for 2+ years) in the region compared with the rate for Victoria. With the exception of Irymple and Ouyen, the other localities in the region all exceed the state rate, some, such as Mildura Central, considerably. For the localities studied, the comparisons from the 2001 figures for unemployment suggest the percentage of the workforce who receive New Start benefits has approximately doubled since 2001, again with the exception of Irymple and Ouyen. The percentage of New Start recipients who have been out of work for 2 or more years has increased since 2001 also.
TABLE 15: RECIPIENTS OF NEW START ALLOWANCE AND UNEMPLOYMEND FOR 2+ YEARS (2006)
Greater R
ed C
liffs
Mild
ura C
entral
Merb
ein
Irym
ple
Ouyen
Mild
ura R
CC
Victo
ria
% of work-force 2006 6.6% 8.4% 7.1% 3.3% 4.0% 7.2% 4.6%
% of New Start Recipients (2006) 51.1% 49.7% 48.1% 49.5% 50.0% 49.8% 45.0%
Source: Centrelink 2008, Table B41 2006 Census of Population and Housing

26
TAXABLE INCOME
Data concerning taxable incomes for the period between 2004 and 2006 again see the region’s taxable incomes well below that of Melbourne’s as they were in the 2006 indicators. This is to be expected as Melbourne, like other metropolitan areas, is home to the most extreme incomes derived from quite a different economic base. The taxable incomes of all the regions in the district, with the exception of Greater Red Cliffs and Ouyen, have increased since 2003. Since 2003 however the gap between the lowest (Wentworth) and the highest (Melbourne) taxable incomes has increased from just under $12,000 to over $17,000 (Greater Red Cliffs - Melbourne). The difference between the lowest taxable incomes in the region compared to that for Regional Victoria has also increased since 2003 by over $1300 between Greater Red Cliffs and Regional Victoria.
FIGURE 21: TAXABLE INCOME DISTRIBUTION ACROSS MILDURA LOCALITIES
Source: ATO Taxation statistics 2003-04, 2004-05, 2005-06.

27
TOURISM (Mildura region)
The previous social indicators reported tourism statistics for the entire Murray region which incorporated regions outside the district. This iteration of the social indicators has refined the measures for this section of the report by concentrating on the Mildura region so as to provide readers with more relevant data. This section employs three measures of tourist activity in the region since 2003: domestic overnight visitors, domestic visitor nights, and domestic day-trip visitation.
Despite some minor growth in 2004 the proceeding years since then have seen a slight decline (about 10%) in the number of domestic overnight visitors to 2007.
FIGURE 22: DOMESTIC OVERNIGHT VISITORS (000s)
Source: Mildura Tourism Inc. http://www.visitmildura.com.au/latest-research.html

28
After a more substantial decline in 2006, 2007 figures for domestic visitor nights have recovered to achieve a figure closer to those recorded between 2003 and 2005.
FIGURE 23: DOMESTIC VISITOR NIGHTS (000s)
Source: Mildura Tourism Inc. http://www.visitmildura.com.au/latest-research.html

29
Domestic day-trip visitation to and about the region has witnessed a 20% increase overall since 2003 with continuous growth since that time.
FIGURE 24: DOMESTIC DAY-TRIP VISITATION (000s)
Source: Mildura Tourism Inc. http://www.visitmildura.com.au/latest-research.html

30
INTERNET CONNECTION/ACCESS
As was the case for other measures derived from the Australian Bureau of Statistics used in this document, the way in which the ABS measure computer use has also changed since the 2001 census. Computer use is now more simply stated as internet access for this iteration of the social indicators reflecting this change and measures the type of internet connection contained within a dwelling. The importance of access to the internet cannot be understated as Australia embraces the information economy. It is vital that regional and rural Australia ‘get online’ to not only participate in this change but also to combat other issues that regional and rural Australians face, such as social isolation.
The table below displays the percentage of households connected to the internet and the type of connection they have. The average figure for internet connection in the region is approximately 15% below that of Melbourne (54.5% compared with 68.4%) and slightly below that of Regional Victoria. Melbourne has substantially more households with a broadband connection, although this may be the result of greater availability, while some of the region’s localities are reliant on slower dial-up connections.
FIGURE 25: INTERNET ACCESS AND CONNECTIONS ACROSS SUB-REGIONS
Source: Table c86 2006 Census of Population and Housing

31
SECTION 7: EDUCATION
ATTENDANCE AT PRE-SCHOOL
Attendance rates at pre-school are again measured using data from the census that includes infants from the ages of 0 to 4. The 2006 figures match those of 2001 in that the rates of attendance at pre-school across the sub-regions is slightly above or below that for Regional Victoria and Melbourne. The excessive figure for Nangiloc/Colignan is a result of far fewer actual numbers in these age categories skewing the percentage data and should be interpreted with caution.
FIGURE 26: PROPORTION OF PRE-SCHOOL ATTENDANCE ACROSS MILDURA'S SUB-REGIONS (CALCULATED ON
BASIS NUMBER 0-4 YEAR OLDS)
Source: Table b14 2006 Census of Population and Housing

32
INCOMPLETE EDUCATION/TRAINING (17-24 YEAR OLDS)
The previous social indicators set a benchmark of incomplete education and training by identifying “the number of 17 – 24 year olds who are neither completing the VCE and not in further education and training”16. Educational attainment is an important factor in successful participation in the workforce. This section of the current iteration of the social indicators reflects a slight change to the way in which the ABS measure educational attainment since the 2001 census. As a result we now have the means to be able to ascertain who has completed year 12 in addition to those who have not for the stated age cohort, thereby gaining a more accurate picture of educational attainment in the region. The key statistic here, due to the importance placed on completing the VCE, is “not attending did not complete year 12” for which the region’s average is over twice that of Melbourne, but nearer to the Regional Victorian figure, some variation of educational attainment, as it is considered here, exists between the localities also.
FIGURE 27: PROPORTION 17-24 YEAR OLDS NEITHER COMPLETING VCE NOR UNDERTAKING FURTHER
SCHOOLING EDUCATION AND TRAINING (CENSUS 2006)
Source: 2006 Census of Population and Housing Special Run
16 Mildura Social Indicators 2006 pg 37

33
OVERALL EDUCATION
The following table indicates the overall levels of education within each of the localities for the region against Regional Victoria and Melbourne. The first indicators report tabled these figures for everyone over the age of 15 years but deduced from this group those still completing their education as well as those who had not stated their educational level in the census. The following table follows this format. The table shows a consistent pattern with the data recorded in the previous social indicators for overall education in that there remains a marked difference in the rates of high school completion between Melbourne and Regional Victoria entailing the localities within the region (48.2% compared with 30.6% in 2001; 53.8% compared with 34.8% in 2006). Despite the fact that overall rates of completing high school have risen for all of the localities studied, the rates of completion are proportionally similar between Melbourne and Regional Victoria five years later. The year 12 rate in Melbourne is again double that of Merbein, Greater Red Cliffs, and Ouyen, and despite the rate for Wentworth being below half that of Melbourne for completion of year 12, it has shown some improvement since 2001 (20.5% in 2001 compared with 28.3% in 2006). At the other end of the educational attainment scale, some improvement in the rates of education can be seen between 2001 and 2006 when comparing those who completed year 9 and below, however the disparities between Melbourne and Regional Victoria are still quite close to 2001 figures (20.4% compared with 27.1% in 2001 and 16.9% compared with 23.1% in 2006). Very similar rates were recorded for Mildura’s sub-regions again for this level of overall education when compared with Melbourne (Irymple, Mallee Track, Millewa, Wentworth, Mildura Central, Merbein, and Ouyen exceeded the Melbourne figure between 1.5 and 1.7 times, Greater Red Cliffs 1.8 times).
TABLE 16: LEVEL OF SCHOOLING ATTAINED BY RESIDENTS OVER 15 EXCLUDING THOSE STILL AT SCHOOL
Mallee T
rack
Millew
a Area
Nan
gilo
c/Co
lign
an
Red
Cliffs (p
rop
er)
Greater R
ed C
liffs
Mild
ura C
entral
Merb
ein
Irym
ple
Ou
yen
Mild
ura R
CC
Wen
two
rth
Reg
ion
al Victo
ria
Melb
ou
rne
Year 12 of equivalent 25.3% 29.4% 30.2% 24.7% 24.8% 32.1% 26.8% 30.3% 23.8% 30.3% 28.3% 34.8% 53.8%
Year 11 or equivalent 23.3% 23.3% 20.3% 18.8% 19.7% 17.1% 19.1% 19.3% 21.8% 18.1% 16.6% 19.1% 13.9%
Year 10 or equivalent 23.1% 19.3% 26.1% 25.6% 25.1% 24.1% 26.2% 25.8% 24.9% 24.3% 28.2% 23.1% 15.5%
Year 9 or equivalent 13.7% 13.8% 12.1% 15.4% 14.7% 11.7% 13.4% 11.2% 13.9% 12.2% 13.7% 11.4% 6.8%
Year 8 or equivalent 14.6% 14.1% 11.3% 14.3% 14.7% 13.9% 14.1% 12.7% 15.0% 14.1% 12.5% 11.1% 8.6%
Did not go to school 0.0% 0.0% 0.0% 1.3% 1.1% 1.1% 0.4% 0.7% 0.6% 0.9% 0.7% 0.5% 1.5%
*Also excludes "not stated" respondents Source: Table B15 2006 Census of Population and Housing

34
POST-SCHOOLING QUALIFICATIONS (WHOLE POPULATION)
With the exception of Wentworth (3.9% in 2001 compared with 4.8% in 2006), all localities including Regional Victoria and Melbourne have experienced a slight decrease in the proportion of the whole population that have degrees. The differences in proportions between Melbourne, Regional Victoria and Mildura’s sub-regions however are very similar to the 2001 differences in that the proportion of degree holders in Melbourne is again double and sometimes more than triple the region’s localities. Regional Victoria is again slightly ahead of the sub-regions on this measure. A similar pattern again occurs for Post-graduate degrees, graduate diplomas and graduate certificates. Figures for the Millewa area are above Regional Victoria and even exceed Melbourne for graduate diplomas and graduate certificates, and exceed the Regional Victorian figure for postgraduate degrees. Postgraduate degree holders are proportionally higher in Nangiloc/Colignan than they are for Regional Victoria also.
TABLE 17: POST-SCHOOLING QUALIFICATIONS (WHOLE POPULATION)
Mallee T
rack
Millew
a Area
Nan
gilo
c/Colig
nan
Red
Cliffs (p
rop
er)
Greater R
ed C
liffs
Mild
ura C
entral
Merb
ein
Irym
ple
Ouy
en
Mild
ura R
CC
Wen
tworth
Reg
ional V
ictoria
Melb
ou
rne
Postgraduate Degree 0.0% 1.5% 1.0% 0.1% 0.1% 0.6% 0.3% 0.3% 0.4% 0.5% 0.4% 0.9% 2.7%
Grad Diploma/Grad Cert. 0.8% 2.1% 0.0% 0.8% 1.0% 0.9% 0.9% 0.9% 1.0% 0.9% 0.6% 1.2% 1.6%
Degree 4.4% 3.8% 3.1% 3.5% 3.6% 5.5% 3.5% 4.8% 4.3% 5.0% 4.8% 6.3% 11.6%
Diploma 2.5% 1.7% 5.0% 3.2% 3.3% 3.9% 3.2% 4.0% 3.6% 3.7% 3.7% 4.9% 6.2%
Certificate 10.5% 10.9% 10.7% 11.9% 11.7% 12.8% 12.8% 13.1% 11.6% 12.7% 13.0% 14.8% 11.5%
Not Applicable 81.9% 80.1% 80.2% 80.5% 80.4% 76.4% 79.2% 76.8% 79.1% 77.2% 77.6% 71.9% 66.4%
Source: Table B39 2006 Census of Population and Housing

35
SECTION 8: CULTURAL INDICATORS The first social indicators sought to collect data on cultural opportunities afforded people living in the region to assess Mildura Rural City Council’s plan for cohesive development17. Two cultural indicators were sought in the first social indicators: visits to the City Art Gallery and library borrowings. Professor Tony Vinson qualified the findings in the previous report by alerting readers to the limitations of the data used to indicate cultural opportunities. These limitations still exist and a similar caution must be exercised when reviewing the most recent findings expressed below. An added limitation for the 2007 figures is a technical problem concerning the gallery’s computer storage of data. The loss of some data was permanent and therefore impacts upon the spread of visitors to the gallery across the region’s localities. Further, the measures for library use have changed to better reflect the holistic usage of this facility in the community.
ART GALLERY
Despite these difficulties a similar pattern to the 2004 data is apparent for the data between 2005 and 2008. Again the overwhelming majority of visitors to the city gallery are from the Mildura Central locality (67.3% in 2004 compared to 82.7% in 2008). Visitors from the region show an increase for Mildura Central and a decrease of visitors from other localities within the district since 2004. Again this might serve to highlight the possible consideration of outreach and educational activities to further engage residents outside of the Mildura Central region.
FIGURE 28: PROPORTION OF VISITORS TO ART GALLERY FROM SUB-REGIONS AND PROPORTIONS EXPECTED ON A
POPULATION BASIS
Source: Mildura Regional Rural Council - Art Gallery
(2008) Mildura Arts Centre, Arts and Culture Strategy, 2008-2011 and Beyond (Draft), April.
17 Mildura Social Indicators 2006 pg 40

36
LIBRARY VISITS and MEMBERSHIP18
The measures for library use have been updated to reflect the diverse services that the Council’s libraries offer the Mildura community. The previous authors made mention of the fact that over 40% of Australians aged between 15 to 74 years visit all kinds of libraries at least once a year, making libraries the second most attended cultural venue after cinemas19. Mildura’s libraries received over a quarter of a million visits between 2006 and 2007. The average visiting rate per capita across the region (5.6) was close to the state average (6.8) and includes virtual visits (visits via the internet (these lower rates are to be expected given the lower rates of internet connection in homes see page 30)), and visits to remote sections of the region and to people with mobility difficulties such as those with a disability via the mobile unit. The community’s library service covers a distance of over 22,000 kms², amongst the highest in the state.
TABLE 18 ACTUAL AND VIRTUAL LIBRARY VISITS 2006 – 2007
Source: Mildura Rural City Council Library Service 2008
The proportion of people who are members of the library fluctuate from locality to locality, with some above or well below the state average such as they are in Merbein and Irymple. The proportion of people who are members of the library throughout the municipality however, exceeds the state average. Of those who are members, a range of rates below that for the state, are active members, i.e. borrowed an item between 2006 and 2007.
FIGURE 29: LIBRARY MEMBERSHIP AS A PERCENTAGE OF POPULATION AND ACTIVE MEMBERSHIP AS A
PERCENTAGE OF MEMBERS
Source: Mildura Rural City Council Library Service 2008
18 The data for this section has changed since the Mildura Social Indicators 2006, please see the Research Notes section for a description 19 Mildura Social Indicators 2006 pg 41
Visits Red
Cliffs Mildura Central Merbein Irymple
MRCC Mobile
Mildura RCC Victoria
Actual number of visits 20211 207787 15073 16048 10143 269262 27147593
Virtual number of visits 34596 6249405
Total number of visits 303858 33396998
Actual per capita 4.4 5.8 3.2 2.8 2.7 4.9 5.5
Virtual per capita 0.6 1.3
Total visits/per capita 5.6 6.8

37
SECTION 9: ENVIRONMENTAL INDICATORS The environmental indicators for this iteration of the social indicators are the same as were presented in the last report: Community Kerbside Recycling Service, the number of tonnes of green waste diverted from landfill, and the Service Eco-Recycle.
TABLE 19: ANNUAL TARGETS AND/OR BEST PRACTICE KPI 07/0820
Total tonnes of waste deposited to Mildura Landfill < 30,000 tonnes per annum
Tonnes of domestic waste collected from Kerbside Service < 11,000 tonnes per annum
Tonnes of contaminated waste from the Kerbside Recycling Service deposited to Mildura Landfill < 15% of total collected
Tonnes of domestic material collected from Kerbside Recycling Service 4,200 tonnes per annum
Cost of Kerbside Recycling $50.00 per tenement per annum
Service Eco-Recycle Best Practice Target $200 per tonne collected
Community Kerbside Recycling Service participation rate 90%
Tonnes of steel recycled from Mildura Landfill 300 tonnes per annum
Number of chemical containers diverted from all waste facilities 14,000 drums per annum
Litres of oil diverted from Mildura Landfill 3,000 litres of Oil per annum
Tonnes of green waste diverted from Mildura Landfill 7,000 tonnes per annum
Number of car tyres diverted from Mildura Landfill 1,200 tonnes per annum
Tonnes of concrete diverted from Mildura Landfill 2,000 tonnes per annum
Number of schools participating in School Recycling Program 25 schools in total (10 participating)
Source: Mildura Rural City Council - Environmental Services
The Community Kerbside Recycling Service produced an increased participation rate of three percent from January 2006 to January 2007. While this is a small increase, the participation rate is generally very high for the Municipality.
20 Annual targets and/or best practice kpi 05/06 remains the same – subject to review late 2008

38
FIGURE 30: COMMUNITY KERBSIDE RECYCLING SERVICE PARTICIPATION RATE
The average amount of green waste for the year January 2006 to January 2007 fell from 550 tonnes to just over 400 tonnes.
FIGURE 31: TONNES OF GREEN WASTE DIVERTED FROM MILDURA LANDFILL
The best practice target for Service Eco-Recycling is $200 per tonne collected. The average for the year January 2005 to January 2006 was $226.90, the corresponding average for the year January 2006 to January 2007 was $215.70.
FIGURE 32: SERVICE ECO-RECYCLE BEST PRACTICE TARGET

Older people, community and mobility
For most older people access to a motor vehicle is an important part of maintaining their independence and continuing their participation in the community. Stopping driving can lead to reduced community participation which in turn can lead to poor health and wellbeing outcomes for the individual. It can also be detrimental to the community if people are less able to participate in community events, volunteer activities or the local economy.
Regional taxi services and population aged 65 years and over1
Census Collection Districts, 2005
Population aged over 75 years and living alone2
Local Government Areas, 2004
Older non-drivers
RACV surveys have found that the transition to being a non-driver is a major one for many older people because of the loss of independence and choice. One factor which can determine how people cope with the change is whether they have support from family and friends to provide alternative transport. Issues of distance and service availability make such transition very difficult in more isolated regions. Reliance on family members can pose problems where younger family members have moved away. Population decline and out-migration of young people can also reduce support networks.3
Main activities non-drivers have trouble doing3
Community Wellbeing “Volunteers and the community” p. 32Changing Populations “Population change” p. 9
Transport and access: seniors
Sources 1ABS Census 2001 & Victorian Taxi Directorate 2005 2ABS Census 2001 3RACV 2002 “Understanding Retired Drivers”
42

TR
Integra
RAN
ated transThe last de Firstly, tranthe goal is passengersdecade, is mode stratedevelopmesea freight Road freighmethods susection sho Secondly, trecognisesreserve lanand higher of: Contain Consoli Concen
Key integradocuments Victorian Go
Policies and
Victorian Tra(VTP) (2008
Freight FutuFreight Netw(2008)
A Fairer Vic
Meeting OurChallenges (2006)
Growing VicTogether (G
Linking MelbMetropolitanPlan (MTP)
NSP
port ecade has se
nsport modesto integrate s. This appronow central egies. An ex
ent of Victoriacorridors tha
ht movementuch as road ow the region
transport plas that the exisnd for future t
transport co
ning urban grdating devel
ntrating econo
ated policy ds are describ
vernment trans
d strategies
ansport Plan 8)
ures: Victorian work Strategy
toria (2008)
r Transport (MOTC)
ctoria GVT) (2005)
bourne: n Transport (2004)
POR
een two majo
s are now semodes to prooach, which wto transport
xample of thea’s Principal at link existints will be encspace allocanal and metr
ans have becsting approatransport exp
osts. Victoria
rowth to withopment in exomic activity
ocuments ared in the rele
sport policies
Description
The VTP setstransform Vic
Freight Futuresustainable frState.
A Fairer Victoplan was firstand participataccess to pub
MOTC sets ospecific command priorities
GVT is a 10-ygoals. VicRoasafe streets, g
MTP is the Gtransport systmetropolitan
RT
or changes in
een as complovide a seamwas first introplanning, wh
e implementaFreight Netw
ng and new fcouraged onation and trafopolitan com
come integrach of urban spansion, resuhas adopted
in boundariexisting areas and employ
re summariseevant section
and strategies
s out practical sctoria’s transport
es is the Victorireight network fo
oria builds on tht released. The tion. It includes blic transport.
out an action blumitments to a nuincluded within
year vision that ads has a role ingrowing and link
overnment’s platem. It includes growth and prom
n transport p
lementary ramless transpooduced into Vhether they aation of integwork (PFN). Treight activitythe PFN and
ffic signal conmponents of t
ted with landsprawl, unplaults in incread a strategic
es s resulting in yment into ce
ed in the tabn.
s7
teps being taket network. It con
an Governmentor Victoria that s
e strategic appraction plan aimstrategies to en
ueprint for Victorumber of progra the MTP.
sets out the Gon contributing toking Victoria an
an for the manastrategies to im
mote economic
lanning and
ather than coort task, wheVictoria’s pla
are transport rated transpThis networky centres, sud discouragentrols. The fithe PFN.
d planning stanned develoased congest
land plannin
higher densentres.
le below. Tra
n over the shortntains $38 billion
t’s long-term strsupports the pro
roach set in 200s to reduce disa
nhance social in
ria’s transport sams and project
overnment’s soco several aspecd promoting sus
agement and demprove safety, m
growth.
operation in
mpeting. Thiether for freiganning documstrategies oort planning
k consists of uch as intermed on other rgures at the
rategies. Thiopment, andtion and socing approach
ities
ansport mod
rt, medium and ln in investment
rategy to shape osperity and live
05 when the socadvantage and nclusion such as
ystem into the fts that will advan
cial, economic ats of the GVT instainable develo
evelopment of Mmanage congest
Victoria.
is means thaght or ments early tr individual is the road, rail and
modal centresroads througend of this
is developmed failure to ial exclusion which consis
e specific
long term to .
an efficient andeability of the
cial policy actionpromote inclusios improving
future. It providence the strategi
and environmenncluding creatingopment.
Melbourne’s tion, manage
9
at
this
d s. h
ent
sts
d
n on
es es
tal g

Transport
10
Policies and strategies Description
Melbourne 2030 (2002) Melbourne 2030 is the Government’s plan for the growth and development of the metropolitan area. It includes policies that are relevant to VicRoads, particularly in developing activity centres, creating networks with regional cities and developing better transport links.
Examples of multi-mode integration are metropolitan integrated ticket systems for train, tram and bus services, and V/Line’s integrated rail and coach activities. Examples of ways being pursued to integrate land planning and transport include: Encouraging infill developments focused largely on activity centres with existing rail stations,
and on-fringe developments in existing and new rail corridors Encouraging economic development around activity centres Upgrading the public transport network to link the activity centres Containing urban sprawl by setting an urban growth boundary (this boundary was recently
expanded to provide land for an additional 284,000 households)8 Commencement of land reservation and planning for the post 2020 Outer Metropolitan Ring/E6
Transport Corridor (OMR-E6), and planning of early land releases, which integrate with this 100km long road and rail corridor in Melbourne’s north and west, linking Werribee, Melton, Tullamarine, Craigieburn/Mickleham and Epping/Thomastown areas.9
Integration will be accelerated following the modernising of the Planning and Environment Act 1987, the passage of the Transport Integration Bill in 2010 and the use of provisions in the Major Transport Projects Facilitation Act 2009. The Planning and Environment Act 1987 governs the use, development and protection of land in Victoria.10 The Transport Integration Bill aims to ensure that transport projects are integrated and meet land-use objectives. The Major Transport Projects Facilitation Act 2009 will accelerate the delivery of major road and rail infrastructure projects by establishing a one-stop shop for decision making, introducing fixed time limits for decisions, and reducing opportunities for reviews and appeals.11
Key challenges for Victoria in achieving an integrated transport approach are addressing problems caused by the legacy transport networks and historic land-use decisions, and the need to ensure that planning decisions remain true to the integrated strategic vision over many decades. The Principal Freight Network – Regional12

Transport
11
The Principal Freight Network – Metropolitan13
Case study: The M1 Upgrade: An example of future infrastructure development New urban transport developments are very expensive, politically difficult and logistically challenging. An alternative is more efficient use of existing infrastructure. The $1.39 billion Monash-CityLink-West Gate (M1) upgrade is an example of the latter. This project involves both civil engineering work and an electronic road management system to optimise traffic flow with the result being significant improvements in road capacity, traffic flow and safety. The upgrade will improve the efficiency of the freeway by increasing throughput by up to 50%, reducing travel times and increasing travel time reliability, and reducing casualty crashes by up to 20%. Traffic flow improvements are being achieved by: Adding additional lanes Installing ramp signals to manage conditions to prevent the main road from becoming overly congested
and managing traffic volumes at critical bottlenecks Separating traffic by destination which involves the use of dedicated lanes to improve traffic flows and
reduce merging and weaving Providing on-road driver information on lane closures, speed limits and freeway conditions.
The M1’s key elements are: Building an additional lane in each direction on the Monash Freeway and Southern Link between the
CityLink tunnels and the South Gippsland Freeway Widening the West Gate Freeway between the CityLink tunnels and the West Gate Bridge to reduce
weaving and merging movements Implementing a state-of-the-art freeway management system that includes ramp signalling and real time
traffic information, and allows VicRoads and emergency services to better manage incidents quickly.

Transport
12
The project is the biggest ever state-funded road upgrade and is being delivered jointly by VicRoads and Transurban. Schematic of the M1 Upgrade14
As shown in the figure above, the project has the following four geographic sections: West Gate Bridge Strengthening, expected to be completed in 2011 West Gate Freeway (West Gate Bridge to west of the CityLink tunnels), expected to be completed
March/April 2010 Southern Link (CityLink tunnels to east of Glenferrie Road), civil works completed in mid 2010, freeway
management system completed in late 2010 Monash Freeway (East of Glenferrie Road to South Gippsland Freeway), completed in late 2009.

1
1.1
1.2
1.2.1
Roads
Summar
Infrastructu
Roads overa
National roa
State roads
Local roads
This rating demand risbetween suare mostly Since the la The rele The dev
Recently co Improve
repriorit Enhanc
public tr Strategi
M1 upg Challenges Reducin Maintain Improvin Deliveri
Infrastru
System deThe Victori Freewa Arterial Municip Other m
The networof travel pecountry Vic
s
ry
ure type
all
ads
recognises tsing faster thupply and dejust maintain
ast Report Cease of the Vvelopment of
ompleted anements in roatisation cing the integransport usaic road infrasrade.
s to improvinng road congning long-terng the qualitng integrated
ucture ove
escription an road infrays (840km) aurban and re
pal roads (12minor roads/tr
rk carries moer annum. Almctoria are tran
Victoria 2010
C+
C+
C+
C-
that the metran supply. W
emand, congning their exi
Card, the majVictorian Tranf a transport
d in-progresad capacity b
gration of roage structure upg
g road infrasgestion and irm funding foy of municipad land use a
erview
astructure is and freeway egional roads9,171km) racks (50,00
ore than 41 bmost all goodnsported by
0 Vict
ropolitan roaWithout introdestion will coisting quality
or road sectonsport Plan wsupply chain
s major infraby grade sep
ad and rail ba
grades such
structure inclncreasing av
or roads as pal roads andnd transport
comprised otollways (61s (21,400km
0km).
billion tonne-ds in the meroad.15
toria 2005
Not rated
C
C-
C-
d infrastructuducing methoontinue to ris, but will dec
or developmwith its $38 bn improveme
astructure proparation, imp
ased public tr
as the comp
ude: verage road per the Victord bridges
planning ou
of: km)
m)
km of freighttropolitan are
National 2
C
C+
C
C-
ure is increasods to signifise even furthcline unless i
ments have bebillion of tranent blueprint c
ojects includeproved driver
ransport, res
pletion of Eas
speeds rian Transpo
tcomes.
t and provideea and more
2005
+
singly under cantly reducer. Roads in nvestment in
een: sport initiativcalled Freigh
e: information
sulting in an i
stLink, Geelo
rt Plan
es for 57 billioe than 80% o
National 2001
Not rated
C
C-
D
stress due te the gap regional are
ncreases.
ves ht Futures.
and signal
ncrease in
ong Bypass a
on vehicle-kmof goods in
13
d
o
eas
and
m
Transport
14
Victoria’s arterial roads (previously known as main roads) total some 22,300km of roads and 5,250 bridges and major culverts, and are valued at approximately $17 billion.16 There are 11,391 lane-km of urban and 41,480 lane-km of regional arterial roads. Municipal Roads (also known as council or local roads) total 129,171km of which 54,055km are sealed.17 Municipal Roads are the public suburban roads on which most residents live or access property. All maintenance, road safety and traffic measures on them are the responsibilities of local government. The hierarchy of importance for municipal roads, based on traffic volume and function, are: Link Roads that generally have the highest traffic volume and link to arterial roads Collector Roads that channel traffic to Link Roads from local access streets Access Roads that provide the direct access required for residential, commercial, industrial and
farming properties where traffic volumes are relatively lower than Link and Collector Roads and direct access is the primary function of the road.
Other Roads is a category of non-arterial and municipal roads, and includes tracks in parks and forests. There are some 50,000km of Other Roads and these are the responsibilities of a range of organisations including the Department of Sustainability and Environment, Parks Victoria, and water catchment authorities. Toll roads consist of: Melbourne CityLink (22km) which is responsibility of Transurban EastLink (39km) which is the responsibility of ConnectEast.
There are some 3,090 road bridges on the arterial network, of which 885 are metropolitan and 2,205 are regional.18 VicRoads’ bridge assessment management strategy is called the Victoria’s Arterial Bridges: Critical Links for Transport Efficiency. Published in 2002, the asset management strategy is designed to: Optimise accessibility, mobility and freight efficiency in a safe and environmentally friendly
manner for the Victorian community Ensure that the bridge assets are managed in a manner that balances road transport needs
with maintenance funding. Bridges generally have a nominal design life of 90 years but require significant rehabilitation during their lifetime to ensure that they achieve this. The ages of VicRoads’ bridges are shown in Figure 1.1 and the average age is 40 years. Many of VicRoads’ bridges will require major and expensive maintenance over the next decade to prolong their life.19
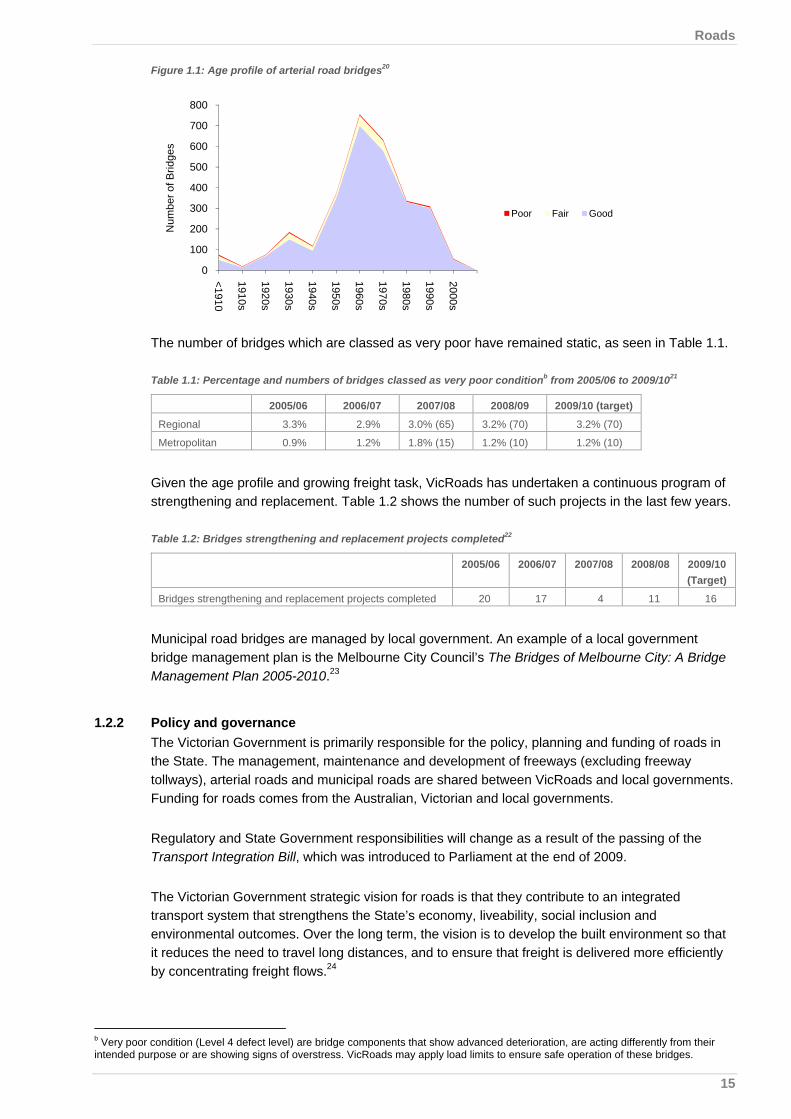
Roads
15
Figure 1.1: Age profile of arterial road bridges20
The number of bridges which are classed as very poor have remained static, as seen in Table 1.1. Table 1.1: Percentage and numbers of bridges classed as very poor conditionb from 2005/06 to 2009/1021
2005/06 2006/07 2007/08 2008/09 2009/10 (target)
Regional 3.3% 2.9% 3.0% (65) 3.2% (70) 3.2% (70)
Metropolitan 0.9% 1.2% 1.8% (15) 1.2% (10) 1.2% (10)
Given the age profile and growing freight task, VicRoads has undertaken a continuous program of strengthening and replacement. Table 1.2 shows the number of such projects in the last few years. Table 1.2: Bridges strengthening and replacement projects completed22
2005/06 2006/07 2007/08 2008/08 2009/10 (Target)
Bridges strengthening and replacement projects completed 20 17 4 11 16
Municipal road bridges are managed by local government. An example of a local government bridge management plan is the Melbourne City Council’s The Bridges of Melbourne City: A Bridge Management Plan 2005-2010.23
1.2.2 Policy and governance The Victorian Government is primarily responsible for the policy, planning and funding of roads in the State. The management, maintenance and development of freeways (excluding freeway tollways), arterial roads and municipal roads are shared between VicRoads and local governments. Funding for roads comes from the Australian, Victorian and local governments. Regulatory and State Government responsibilities will change as a result of the passing of the Transport Integration Bill, which was introduced to Parliament at the end of 2009. The Victorian Government strategic vision for roads is that they contribute to an integrated transport system that strengthens the State’s economy, liveability, social inclusion and environmental outcomes. Over the long term, the vision is to develop the built environment so that it reduces the need to travel long distances, and to ensure that freight is delivered more efficiently by concentrating freight flows.24
b Very poor condition (Level 4 defect level) are bridge components that show advanced deterioration, are acting differently from their intended purpose or are showing signs of overstress. VicRoads may apply load limits to ensure safe operation of these bridges.
0
100
200
300
400
500
600
700
800
<1910
1910s
1920s
1930s
1940s
1950s
1960s
1970s
1980s
1990s
2000s
Num
ber o
f Brid
ges
Poor Fair Good
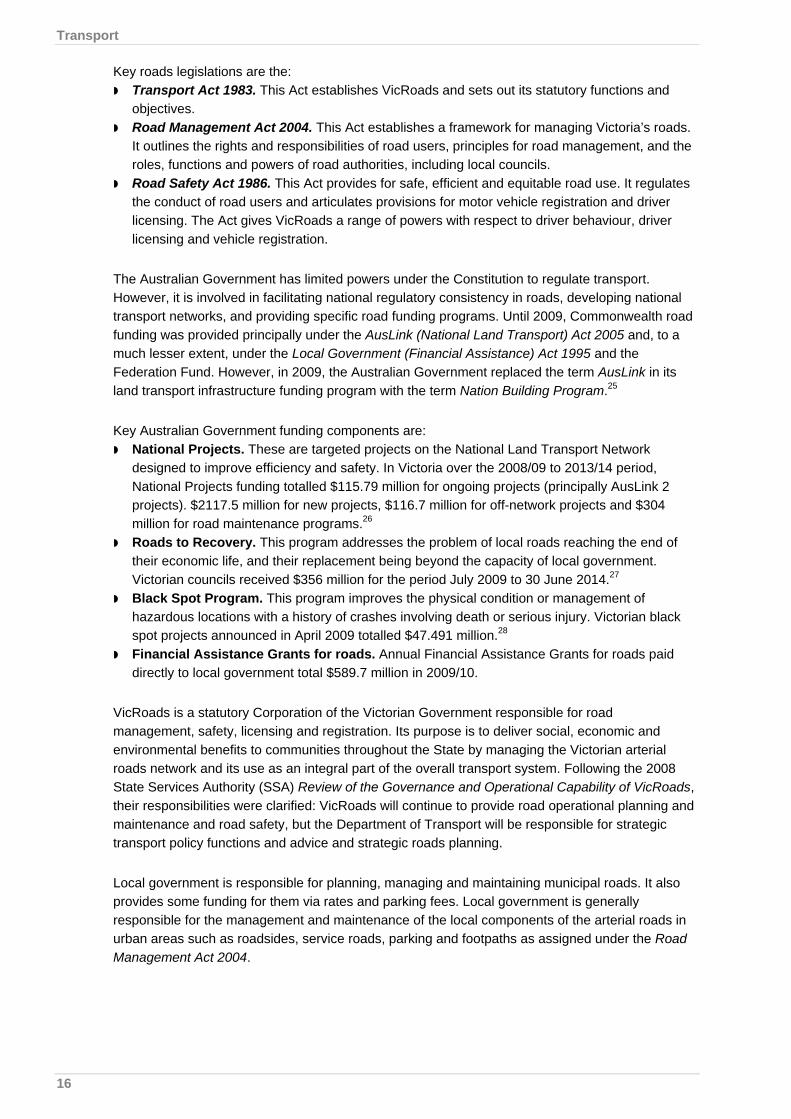
Transport
16
Key roads legislations are the: Transport Act 1983. This Act establishes VicRoads and sets out its statutory functions and
objectives. Road Management Act 2004. This Act establishes a framework for managing Victoria’s roads.
It outlines the rights and responsibilities of road users, principles for road management, and the roles, functions and powers of road authorities, including local councils.
Road Safety Act 1986. This Act provides for safe, efficient and equitable road use. It regulates the conduct of road users and articulates provisions for motor vehicle registration and driver licensing. The Act gives VicRoads a range of powers with respect to driver behaviour, driver licensing and vehicle registration.
The Australian Government has limited powers under the Constitution to regulate transport. However, it is involved in facilitating national regulatory consistency in roads, developing national transport networks, and providing specific road funding programs. Until 2009, Commonwealth road funding was provided principally under the AusLink (National Land Transport) Act 2005 and, to a much lesser extent, under the Local Government (Financial Assistance) Act 1995 and the Federation Fund. However, in 2009, the Australian Government replaced the term AusLink in its land transport infrastructure funding program with the term Nation Building Program.25 Key Australian Government funding components are: National Projects. These are targeted projects on the National Land Transport Network
designed to improve efficiency and safety. In Victoria over the 2008/09 to 2013/14 period, National Projects funding totalled $115.79 million for ongoing projects (principally AusLink 2 projects). $2117.5 million for new projects, $116.7 million for off-network projects and $304 million for road maintenance programs.26
Roads to Recovery. This program addresses the problem of local roads reaching the end of their economic life, and their replacement being beyond the capacity of local government. Victorian councils received $356 million for the period July 2009 to 30 June 2014.27
Black Spot Program. This program improves the physical condition or management of hazardous locations with a history of crashes involving death or serious injury. Victorian black spot projects announced in April 2009 totalled $47.491 million.28
Financial Assistance Grants for roads. Annual Financial Assistance Grants for roads paid directly to local government total $589.7 million in 2009/10.
VicRoads is a statutory Corporation of the Victorian Government responsible for road management, safety, licensing and registration. Its purpose is to deliver social, economic and environmental benefits to communities throughout the State by managing the Victorian arterial roads network and its use as an integral part of the overall transport system. Following the 2008 State Services Authority (SSA) Review of the Governance and Operational Capability of VicRoads, their responsibilities were clarified: VicRoads will continue to provide road operational planning and maintenance and road safety, but the Department of Transport will be responsible for strategic transport policy functions and advice and strategic roads planning. Local government is responsible for planning, managing and maintaining municipal roads. It also provides some funding for them via rates and parking fees. Local government is generally responsible for the management and maintenance of the local components of the arterial roads in urban areas such as roadsides, service roads, parking and footpaths as assigned under the Road Management Act 2004.

Roads
17
1.2.3 Sector trends Increasing urban congestion Congestion of roads is a major problem that increases the time and cost of road tasks, which reduces economic efficiency and liveability. In 2005, the cost of congestion for Melbourne was estimated to be $3 billion, increasing by 103% to $6.1 billion by 2020.29 Road congestion is occurring for a host of reasons. These include rapid growth of both population and economic activity, a tendency for road and public transport infrastructure to lag growth, and the lack of congestion-pricing mechanisms.30 The increase in congestion indicators on metropolitan roads is evident in Table 1.3. The trend from 2001/02 to 2008/09 is a continual increase in traffic delays, and a decline in actual travel speeds. The high variability of travel time, which is the difference in travel times experienced due to delay, is a key measure of service quality from the road user’s perspective. Table 1.3: Summary of urban travel data31
Unit 2001/02 2002/03 2003/04 2004/05 2005/06 2006/07 2007/08 2008/09
Traffic Delay: Melbourne
am peak min/km 0.74 0.73 0.70 0.76 0.78 0.82 0.83 0.84
pm peak min/km 0.63 0.59 0.61 0.66 0.66 0.69 0.71 0.72
Variability of Travel Time: Melbourne (% difference of travel times experienced due to delay
am peak % 24 21.2 20.8 25.3 19.9 18.9 20.4 n/a
pm peak % 19.1 17.3 18.8 17.7 18.6 17.6 18.4 n/a
Actual Travel Speed: Urban
am peak km/h 36.7 36.8 37.4 36.2 35.8 35.0 34.8 n/a
pm peak km/h 39.3 40.3 39.8 38.5 38.6 38.0 37.4 n/a
The above information is represented graphically in Figure 1.2. Figure 1.2: Traffic delay and actual urban travel speed over the last decade
Reducing congestion is a key goal for the Victorian Government and VicRoads. In April 2008, the Government announced the $112.7 million anti-congestion plan Keeping Melbourne Moving. This supplements VicRoads’s Congestion Improvements Program. A distinguishing feature of Melbourne’s road network is its shared road space with trams. As a result of congestion, 30% of trams are regularly delayed, with tram speeds reduced to an average of only 16km/h across the network and 11km/h in the central business district.32
0
0.1
0.2
0.3
0.4
0.5
0.6
0.7
0.8
0.9
1999-00
2000-01
2001-02
2002-03
2003-04
2004-05
2005-06
2006-07
2007-08
2008-09
min
/km
33
33.5
34
34.5
35
35.5
36
36.5
37
37.5
38
38.5
km/h Traff ic Delay (am peak)
Actual Travel Speed (Urban)

Transport
18
Growth in the freight task Almost 90% of freight by volume is moved around the State by road trucks.33 Road freight increased by 54% between 1996 and 2005, measured in tonne-km.34 This is reflected in the growth in the road truck fleet, see Table 1.4. Table 1.4: Victorian road vehicle fleet 1995-200735
1995 1998 2007 % Change
Light commercial vehicles (LCVs) with carrying capacity of less than 3.5 tonnes
363,782 360,037 490,513 +35%
Rigid trucks 82,674 84,643 93,131 +13%
Articulated trucks 17,399 16,946 22,254 +28%
Total 463,855 461,626 605,898 +31%
Despite the number of light commercial vehicles (LCV), the majority of the freight task is carried by Victoria’s rigid and articulated truck fleet, as shown in Figure 1.3. Figure 1.3: Percentage of road freight (tonnes) carried by vehicle type36
Growth is expected to continue and is expected to more than double by 2020 as seen in Figure 1.4. Figure 1.4: Freight on metropolitan Melbourne’s roads in 202037
The National Transport Commission’s Twice The Task report warned that the greatest impact of freight growth will be in urban areas, near ports and intermodal freight terminals, and in outer industrial suburbs.
Rigid40%
Light Commercial Vehicles
9%
Articulated51%
02468
101214161820
Today 2020
(milli
on to
nnes
)

Roads
19
1.3 Performance
1.3.1 Road safety The quality of road infrastructure influences road safety. According to the Australian Transport Council “improving the safety of roads is the single most significant achievable factor in reducing road trauma”. It notes that “road investment improves road safety through general road improvements — typically, ‘new’ roads are safer than ‘old’ roads — as well as through treatment of black spots”.38 Victoria’s strategy for road safety is called arrive alive 2008-2017. The strategy aims to reduce annual road deaths and serious injuries by 30% by 2017. It is based on the assumption that as road crashes will always occur, the best approach to minimise crashes is through maximising: Safer roads – designing and maintaining roads and roadsides to reduce risk Safer vehicles – encouraging the take-up of vehicles with safety features that reduce the
likelihood of a crash and safety features that reduce injury severity Safer road users – advising, educating and encouraging road users to comply with road rules,
to be unimpaired and alert, and to drive according to the conditions. These requirements for a multi-pronged approach to road safety have resulted in a coordinated approach being taken which principally involves the Transport Accident Commission (TAC), VicRoads, Victoria Police and the Department of Justice. The two key indicators for road accidents are: Fatality rate per 100 million vehicle kilometres Serious crashes per 100 million vehicle kilometres.
Table 1.5 provides details of these indicators. Victoria consistently has achieved a low fatality rate compared with other jurisdictions. However, it is mid-range in terms of serious casualty crash rates. Table 1.5: Road safety indicators*39
Road safety indicator (per 100 million vehicle kilometres)
Victoria/National Average
2000 2001 2002 2003 2004 2005 2006 2007
Serious Casualty Crashes
Vic 10.1 11.3 11.9 10.4 10.5 10.4 10.7 11.4
National average 11 10.7 11.2 10.5 n/a n/a n/a n/a
Fatality rate Vic 0.75 0.87 0.77 0.6 0.65 0.67 0.62 0.57
National average 0.98 0.91 0.89 0.8 0.8 0.79 0.76 0.75 * This series is no longer being produced by Austroads.
A 2008 government review noted that while ‘VicRoads argues Victoria’s performance in the road safety area is world class … Norway, Sweden and Switzerland outperform the State on all [fatality and serious casualty crash] measures, suggesting that Australia in general and Victoria in particular may have something to learn from their experience’.40 Figure 1.5 shows the annual road death in Victoria over the last 15 years compared with NSW and the national figures. The annual Victorian road toll between 2004 and 2009 has ranged between 295 and 346.
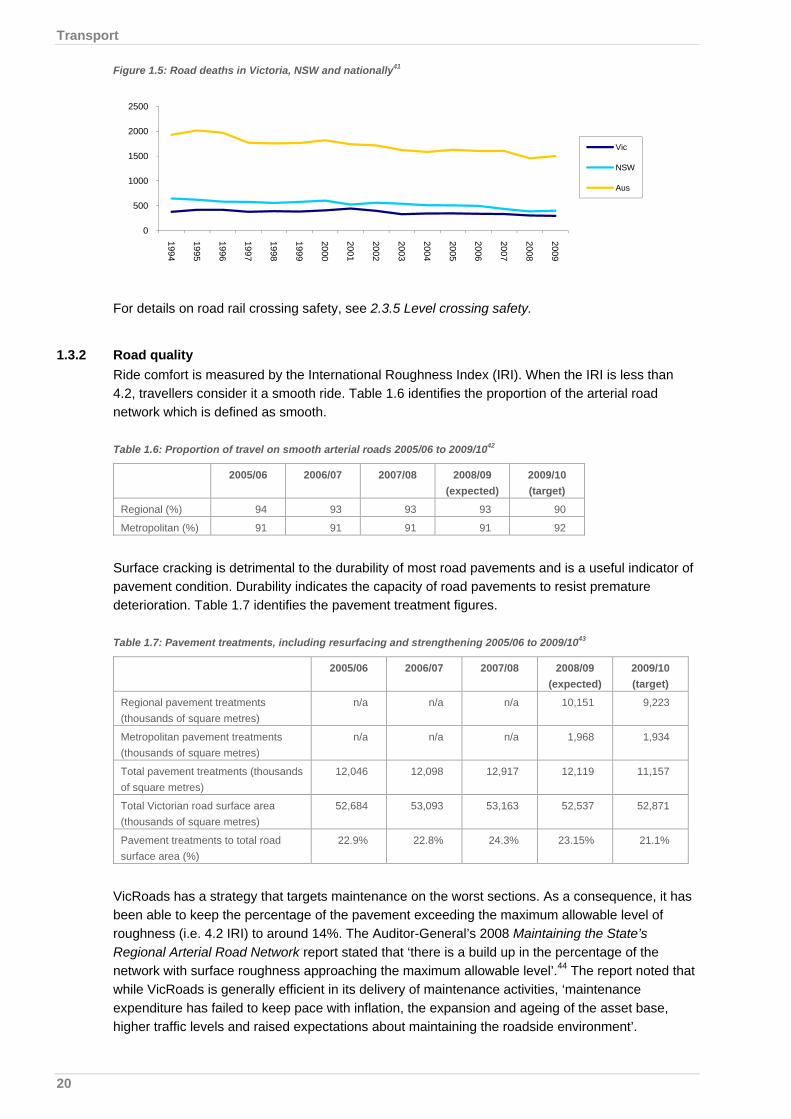
Transport
20
Figure 1.5: Road deaths in Victoria, NSW and nationally41
For details on road rail crossing safety, see 2.3.5 Level crossing safety.
1.3.2 Road quality Ride comfort is measured by the International Roughness Index (IRI). When the IRI is less than 4.2, travellers consider it a smooth ride. Table 1.6 identifies the proportion of the arterial road network which is defined as smooth. Table 1.6: Proportion of travel on smooth arterial roads 2005/06 to 2009/1042
2005/06 2006/07 2007/08 2008/09 (expected)
2009/10 (target)
Regional (%) 94 93 93 93 90
Metropolitan (%) 91 91 91 91 92
Surface cracking is detrimental to the durability of most road pavements and is a useful indicator of pavement condition. Durability indicates the capacity of road pavements to resist premature deterioration. Table 1.7 identifies the pavement treatment figures. Table 1.7: Pavement treatments, including resurfacing and strengthening 2005/06 to 2009/1043
2005/06 2006/07 2007/08 2008/09 (expected)
2009/10 (target)
Regional pavement treatments (thousands of square metres)
n/a n/a n/a 10,151 9,223
Metropolitan pavement treatments (thousands of square metres)
n/a n/a n/a 1,968 1,934
Total pavement treatments (thousands of square metres)
12,046 12,098 12,917 12,119 11,157
Total Victorian road surface area (thousands of square metres)
52,684 53,093 53,163 52,537 52,871
Pavement treatments to total road surface area (%)
22.9% 22.8% 24.3% 23.15% 21.1%
VicRoads has a strategy that targets maintenance on the worst sections. As a consequence, it has been able to keep the percentage of the pavement exceeding the maximum allowable level of roughness (i.e. 4.2 IRI) to around 14%. The Auditor-General’s 2008 Maintaining the State’s Regional Arterial Road Network report stated that ‘there is a build up in the percentage of the network with surface roughness approaching the maximum allowable level’.44 The report noted that while VicRoads is generally efficient in its delivery of maintenance activities, ‘maintenance expenditure has failed to keep pace with inflation, the expansion and ageing of the asset base, higher traffic levels and raised expectations about maintaining the roadside environment’.
0
500
1000
1500
2000
2500
1994
1995
1996
1997
1998
1999
2000
2001
2002
2003
2004
2005
2006
2007
2008
2009
Vic
NSW
Aus

Roads
21
Table 1.8 identifies VicRoads’ funding including maintenance. Table 1.8: Funding of VicRoads45
Year Ended 30 June 2004 $m 2005 $m 2006 $m 2007 $m 2008 $m 2009 $m
Australian Government
Construction 109.7 205.0 259.5 261.5 262.4 215.9
Asset maintenance and minor works 36.5 28.5 43.9 37.5 55.4 58.7
Federal Interstate Road Transport Scheme
11.0 11.6 13.8 13.4 14.5 13.4
National Blackspot program 10.4 7.1 11.8 10.4 10.2 11.4
Total Australian Government Funding 167.6 252.2 329.0 322.8 342.5 299.4
State Government
Outputs appropriations 400.8 379.7 151.3 148.8 224.3 192.3
Contributed capital appropriations 31.9 19.5 88.1 59.4 182.4 439.5
Better Roads Victoria Trust Account 148.4 152.0 863.0 446.3 631.5 569.6
Total State Government Funding 581.1 551.2 1,102.4 654.5 1,038.2 1,201.4
Transport Accident Commission Program Funding
1.7 38.5 102.1 72.7 100.1 126.7
VicRoads generated revenue 154.3 185.3 179.3 196.0 246.0 226.2
Total Funding 904.7 1,027.2 1,712.8 1,246.0 1,726.8 1,853.7
Given the level of inflation in the construction sector, the expansion and ageing of the asset base, higher traffic levels and raised exceptions, ‘maintenance expenditure has failed to keep pace’46 Part of the reason for this has been that when bids for new roads were made, they failed to include ongoing maintenance funding. VicRoads now includes an accompanying bid for maintenance on major projects and increasingly for smaller scale projects. Below is an extract from Maintaining the State’s Regional Arterial Road Network which explains the maintenance situation.
Over the last four years, the rates of periodic maintenance have been below the revised minimum levels required to cost-effectively maintain the road pavement over the long-term. The 2008–09 State Budget continues this trend and we estimate that planned periodic maintenance will cover 5.7% of all arterial roads compared to the target rate of 6.6%. VicRoads estimates that the cost of raising periodic maintenance coverage by 1% across the state is approximately $15 million. Between 2001–02 and 2007–08 the maintenance program allowed for the rehabilitation of between 0.2 and 0.5% of the Victorian arterial road network. In 2007–08 the coverage rate of 0.2% implied an effective life of 500 years for these pavements. VicRoads estimates that works in other parts of the 2007–08 roads program increased the rehabilitation rate to about 0.45%, implying a pavement life of 220 years. In the 2008–09 budget pavement rehabilitation coverage is similar to the level funded in 2007–08.
A more realistic figure for the time that road pavements can perform adequately between rehabilitation treatments is around 70 years. Adopting this standard would require the rehabilitation of an additional 0.95% of the arterial road network. VicRoads’ preliminary estimates indicate that the cost of raising rehabilitation coverage by 1.2% across the State’s arterial roads is approximately $80 million. We found that VicRoads’ target periodic maintenance and rehabilitation coverage rates are consistent with sustaining the condition and performance of the road pavement over the long term. We examined VicRoads’ maintenance program costs and estimated that an additional $77 million per year would be needed to achieve the required levels of coverage. This includes about: $14 million to raise periodic maintenance coverage from 5.7 to 6.6% $63 million to raise rehabilitation coverage from 0.45 to 1.4%.47
The Municipal Association of Victoria (MAV) runs the MAV Asset Management Step Program which is used for asset management by local governments. The MAV Step Program allows for the

Transport
22
State-wide assessment of municipal assets. Between 2006 and 2009, its index measuring the quality of local roads has decreased by 2%, indicating a drop in quality. The MAV analysis notes that the immediate risk areas on local roads are being addressed in rural areas but there are less funds than are necessary for the required long term renewal. Between 2006 and 2009, its index measuring the quality of bridges has increased by 3%, indicating an improvement in quality. The MAV analysis notes that investment in bridges is meeting renewal need.48
1.3.3 Environmental sustainability A key objective in Victoria’s transport policy is to reduce greenhouse gas emissions from the transport sector by encouraging mode shift from road transport which accounts for almost 90% of transport emissions.49 The action being pursued to reduce greenhouse gas production from transport by the Victorian Government includes: Reducing the need to travel without sacrificing people’s access to opportunities and industry’s
need to move goods Using less-polluting forms of transport more often for passenger and freight traffic Ensuring that all forms of transport are as greenhouse-friendly as possible.50
The Victorian Transport Plan and the 2009/10 Budget initiatives to achieve the above include: Improving public transport $100 million increase in funding for bicycle lanes and shared walking and cycling paths on
priority bicycle routes A $5 million public bicycle hire scheme for inner Melbourne Setting a mandatory carbon emissions target for the Victorian Government vehicle fleet.51
Actions by VicRoads to enhance sustainability include: The development of a framework for determining the carbon footprint of a road construction
project to deliver VicRoads’ first carbon neutral road construction project, the Mickleham Road duplication at Greenvale
Implementing a sustainability rating system to encourage a triple bottom-line approach Constructing innovative fauna crossings, such as those on the Calder Freeway.
Ongoing environmental challenges include: Vehicle emissions and greenhouse gases Water quality from road run-off Noise Alienation of land.
1.4 Future challenges The future challenges to achieving improvements in road infrastructure are: Reducing road congestion and increasing average road speeds. In the short to medium
term, congestion is likely to increase and average road speeds are likely to decrease. Efforts to shift travel to other modes, such as rail and cycling, will only have a marginal impact due to constraints such as limited metropolitan rail capacity. Innovative methods are required to reduce demand including using congestion pricing, reducing just-in-time logistic practices and encouraging working locally. Supply augmentation in built-up areas will increasingly involve improving road asset utilisation rather than building new roads. Ways to improve efficiency are targeting roadworks on points of connection, building links between existing road networks, minimising the impact of road works, ensuring quick clearance of traffic incidents, improving

Roads
23
traffic signal coordination, and prioritising road space high occupancy vehicles or ‘high value’ movements.
Maintaining long-term funding for roads as per the Victorian Transport Plan. The Victorian Transport Plan includes an ambitious program of roads projects which will cost some dozens of billions of dollars. While recent expenditure on roads has increased significantly, maintaining this high level will be essential for the foreseeable future if the Plan is to be achieved. Key projects will include:
Construction of Peninsula Link, a 25-kilometre, four lane connection between EastLink at Carrum Downs and Mt Martha at an estimated cost of $750 million
Extension and improvement of outer suburban arterial roads costing some $1.9 billion Completion of the ‘missing link’ in the Metropolitan Ring Road – a connection between the
Eastern Freeway at Bulleen and the Metropolitan Ring Road in Greensborough at a cost of more than $6 billion
Construction of an alternative to the West Gate Bridge –a tunnel between Geelong Road/Sunshine Road and Dynon Road/Footscray Road at a cost of more than $2.5 billion
Completion of the next stage of the Dingley Arterial linking Perry Road and Springvale Road at Westall Road, costing $80 million
Development of a Truck Action Plan in stages to remove thousands of trucks from inner-western suburban streets, including building a new connection from the West Gate Freeway to Hyde Street/Whitehall Street linking to the port at a cost of $380 million for Stage 1
Grade separating of key junctions on Hoddle Street.52 Australian Government funding will be essential in achieving these projects. Although the Australian Government’s Nation Building Program initiatives announced in May 2009 did not fund any Victorian road-specific projects, it identified the following projects as ones which may gain future support: Donnybrook Inter-modal Terminal, and the Green Triangle Road Upgrades. This recognition means that they are more likely to be funded in the future.
Improving the quality of municipal roads and bridges. Municipal Roads are facing the following three main problems:
Maintaining road quality in the face of greater freight volumes. Many municipal roads were not designed for large loads and the amount of tonnage they currently carry, nor do local governments have the ability to fund their maintenance
Developing roads that provide acceptable access without encouraging excessive traffic and speed, while providing road access for larger vehicles such as garbage trucks and fire trucks
Maintaining bridges. Local governments have responsibility for a large number of timber bridges that are deteriorating. For example, in the Gippsland region there are approximately 599 bridges maintained by local government. Of these bridges, 75% of the total bridge deck area is timber. Timber deck bridges cost approximately double the amount required by concrete bridges to maintain per annum.53 Maintaining these bridges is very costly for local governments.
Addressing these problems requires greater visibility of asset quality across all local governments, and increased funding.
Delivering integrated land use and transport planning outcomes. Implementing integrated plans will require overcoming the following major challenges:
Ensuring that land-use decisions to slow the growth in urban boundaries, reserve land corridors for future roads, and focus on building in designated growth corridors are maintained over many decades
Implementing the principal freight network which is dependant on private sector supply chain organisations planning their operations to align with the network, such as locating assets in the freight activity centres
Increasing significantly the amount of funding for both new roads and maintenance.

Transport
24
1.5 Report Card rating
Infrastructure type Victoria 2010 Victoria 2005 National 2005 National 2001
Roads overall C+ Not rated C Not rated
National roads C+ C C+ C
State roads C+ C- C C-
Local roads C- C- C- D
Based on considerations of planning, funding, and infrastructure capacity and condition, Victoria’s overall road infrastructure has been rated C+. This rating recognises that the metropolitan road infrastructure is increasingly under stress due to demand rising faster than supply. Without introducing methods to significantly reduce the gap between supply and demand, congestion will continue to rise even further. Roads in regional areas are mostly just maintaining their existing quality, but will decline unless investment increases. Positives that have contributed to the rating are: The delivery of several strategic road infrastructure upgrades Increase in funding for roads The release of an integrated transport plan that places roads within a broader transport task The policy integration of road and land-use developments Increased quality of data on municipal road condition and assets.
Negatives that have contributed to the rating are: Increased road congestion and reduced travel time Static or declining quality of municipal roads Lack of committed forward funding of many road projects Lack of comparable data on all road assets in Victoria, regardless of its owner and funding
source Lack of planning to address gaps in urban network connectivity, notably, for example, Westlink
and North East link Limited deployment of intelligent transport systems.

2
2.1
Rail
Summar
Infrastructu
Rail
This rating rail networkimprovememeet the siWhile impofreight to ininadequatespeed and Since the la The com
160km/h Starting The com
passeng The imp
metropo The ach
trips ma The ent
access The Vic
V/Line nnetwork
High levwesternlines
Overcro Recently co The com
line in 6 The ele Restora Stage O
tracks in Tram ov Purchas
started of up to delivere
Delivery
ry
ure type
recognises tk since 2005ents. Over thignificant inc
ortant regionancrease its me. The qualitycapacity.
ast Report Cmmencemenhr
g the rebuildinmmencemenger rail and tplementationolitan passenhievement ofade in Melbotry of severalregime
ctorian Governow managink vels of congen and norther
owding on a
ompleted anmmencemen60 years ctrification of
ation of the raOne of the Stn the Arts Prverhead powse of new rolentering serv70 new met
ed progressivy of the new
Victoria 2010
D
that that ther5, although the long-term,
crease in demal rail segme
market share.y of the tram
Card, the majnt of four Reg
ng of the regnt of revised atram network of targeted
nger rail f the Victoriaurne by publl competing a
rnment’s buyng both the r
estion along rn lines, the D
number of tra
d in-progresnt of the $4.3
f the track froailway to Echt Kilda Road recinct (compwerlines renelling stock. Tvice progresstropolitan travely at the rametropolitan
0 Vict
C- O D Fr
re has been here are a nua complete
mand expecteents have imp. Less used enetwork is im
or rail sectorgional Fast R
gional freight and longer-teks measures to
n Governmelic transport tabove-rail op
y-back of theregional rail n
a number of Dandenong
am routes.
s major infra billion Regio
om Broadmehuca (completram improv
pleted in 200wed along 5
The Governmsively in earlins. 54 VLoc
ate of one a mn train contro
toria 2005
Overall reight
no fundamenumber of projmodernisatioed from risinproved, qualelements of tmproving but
r developmeRail routes wh
network erm franchis
o reduce con
ent’s 2002 tarto 20% by 20perators follo
regional railnetwork and
f heavy rail roline, and the
astructure proonal Rail Lin
eadows to Creted in 2006)vement strate08) 5km of doub
ment has ordely 2010 as pa
city carriagesmonth ol (Metrol) sys
National 2
C-
ntal improvejects underwon of metropng populationity is still belothe regional t is still inade
nts have beehich carry tra
ee leases fo
gestion and
rget to doubl02054 owing the intr
l network, copassenger t
outes, notabl Sunshine-F
ojects includek project, the
raigieburn (c)
egy, providing
ble track ered 38 new art of a comm
s are currentl
stem
2005
ment to the mway that shou
olitan rail is rn and public tow what is nrail network
equate in term
en: ains capable
r the metrop
improve the
e the share o
roduction of t
ompleted in Mrain operatio
ly SydenhamFootscray-No
e: e first new m
ompleted in
g platform st
metropolitanmitment to puy on order a
National 2001
D-
metropolitan uld deliver required to transport use
needed for raremain ms of averag
of travelling
olitan
service of
of motorised
the regional
May 2007, wions on that
m corridor, orth Melbourn
ajor railway
2007)
tops and new
n trains, whicurchase a tond are being
25
e. ail
ge
at
d
rail
ith
ne
w
ch tal
g

Transport
26
Rollout of the myki contactless smartcard ticketing system Construction of the South Morang Rail Extention.
Challenges to improving rail infrastructure include: Reducing metropolitan rail congestion and improving services Maintaining long-term funding for rail as per the Victorian Transport Plan Improving the interstate and regional freight rail lines, and their intermodal connections Delivering integrated land use and transport planning outcomes Commissioning and implementation of the myki ticketing system.
2.2 Infrastructure overview
2.2.1 System description The Victorian rail infrastructure is comprised of: Melbourne metropolitan heavy rail passenger network (366km of track and 211 stations) Metropolitan tram (light rail) passenger network (249km of track, 1,800 stops and 496 trams) Regional rail network (intrastate), which carries both freight and passengers within Victoria
(2,877km mostly broad gauge network consisting of 1,483km of passenger tracks and 1,394km freight only tracks)
Defined Interstate Rail Network, which consists of the Victorian sections of the interstate rail system between Albury, Melbourne and the SA border, used mostly by freight trains with some interstate passenger services (1,384km).
Figure 2.1 identifies Victoria’s rail networks. Figure 2.1: Victoria’s rail network55

Rail
27
Metropolitan heavy rail network The metropolitan network is run by a franchisee that operates a fleet of over 300 trains and provides 12,909 services each week resulting in 214 million customer trips per year.56 Over 213 million passenger trips were undertaken on the metropolitan train system in the 2008/09 financial year.57 Train services across Melbourne operate as part of an integrated system of train, tram and bus services. The ticketing system operates across services and offers a two-zone, time-based fare structure. Metropolitan tram network Melbourne has one of the world’s most extensive tram (light rail) networks, providing 5,080 weekday services to 27 routes (excluding the free City Circle service).58 178 million passenger trips were undertaken on trams in 2008/09.59 Regional rail network About 60% of the regional rail network carries only freight services, with the remainder carrying both freight and passenger services. Total train journeys cover around 6.8 million kilometres each year, made up of passenger services (71%), grain (11%) and other freight (18%).60 The V/Line passenger network operates 1,248 rail services every week across regional Victoria. The station network includes 81 stations, supported by a network of agents providing access to V/Line tickets and services.61 Regional Victorian freight trains operate on the V/Line and metropolitan passenger networks to gain access to the ports of Melbourne and Geelong, the Dynon freight terminals and other metropolitan terminals (Brooklyn, Sunshine, Kensington and Springvale). Freight trains generally operate outside peak periods and are scheduled to fit in with passenger train operations without delaying passenger trains. Defined Interstate Rail Network The Australian Rail Track Corporation (ARTC) is responsible for the Defined Interstate Rail Network which is leased to it by VicTrack. This network is predominantly for freight services with the only passenger services at present being the Melbourne-Sydney daily service and the Melbourne-Adelaide service that operates three times per week. This network is of national importance as the Melbourne-Sydney corridor is the busiest interstate freight corridor in Australia with freight volumes expected to increase from 10.3 million tonnes to around 25 million tonnes by 2029. The Melbourne-Adelaide-Perth rail corridor carries more than 80% of all freight between Melbourne and Perth. The Victorian interstate rail network consists of 1,213km of standard gauge track between Albury, Melbourne and the South Australian border, and the 171km Portland to Maroona standard gauge rail line.62 The ARTC leases the two mainline interstate and standard gauge corridors from the Victorian Government which are from Southern Cross Station to Albury (NSW) and from Tottenham Junction to Wolseley (SA). The ARTC is responsible for selling access to train operators, capital investment in the corridors and management of infrastructure maintenance. Metropolitan train franchisee From December 2009, Metro Trains Melbourne became the metropolitan train franchisee for eight years with an option to extend its term for a further seven. Metro Trains Melbourne is a joint venture between Hong Kong’s MTR Corporation Ltd, and the Australian companies John Holland Melbourne Rail Franchise Pty Ltd (John Holland) and United Group Rail Services Ltd (UGL). Metro Trains Melbourne’s responsibilities include: Delivering passenger services that are safe, reliable, punctual, clean and convenient, and
operated as part of an integrated multimodal transport network

Transport
28
Maintaining the electrified suburban train network Overseeing the maintenance of the metropolitan electrified train fleet which is outsourced to:
United Melbourne Transport Ltd (UMTL), a subsidiary of the United Group, which is responsible for the X’Trapolis trains built by Alstom and the older trains (Hitachi and Comeng) in the fleet
Siemens Rail Services Bayside Pty Ltd, a subsidiary of Siemens, which is responsible for the remainder of the new train fleet.
The franchising of the metropolitan train network started in 1999 when the network was shared between two franchisees, Bayside Trains (then owned by National Express) and Hillside Trains (owned by Connex). Connex was the sole franchisee from 2004 to 2009. Metropolitan tram franchisee From December 2009, Keolis Downer EDI (KDR) became the metropolitan tram franchisee for eight years with an option to extend its term for a further seven. KDR is a consortium between Keolis, a subsidiary of the French public enterprise railway company SNCF, and Australian maintenance provider Downer EDI. KDR’s responsibilities include: Maintaining the tram network in Melbourne including tram lines and tram stops Maintaining the older trams in the fleet Overseeing the maintenance of the low floor trams which is outsourced to:
Siemens Rail Services Swanston Pty Ltd for the Siemens Combino trams (D1 Class 3 and D2 Class 5 section low floor trams)
United Group Melbourne Transport Ltd (UMTL) for the Alstom Citadis trams (C-Class low floor trams).63
The franchising of the tram network started in 1999 when the network was shared between two franchisees, Swanston Trams and Yarra Trams. In 2004, Yarra Trams took responsibility for the entire Melbourne tram network. Regional train operator and owner From May 2007, V/Line Passenger Pty Ltd (V/Line) has been responsible for providing passenger trains and freight services. V/Line’s responsibilities include: Maintaining the Victorian regional rail network train network including both the freight-only and
regional passenger networks; this includes some non-electrified, broad gauge freight-only lines in and around Melbourne including to the Port of Melbourne
Maintaining the country passenger train fleet which is outsourced to: Bombardier, responsible for the VLocity trains EDI, responsible for the rest of the fleet.
Third party freight operators on the regional network include Asciano/Pacific National and Toll.
2.2.2 Policy and governance The Victorian Government is ultimately responsible for the State’s rail policy, capital investment, most maintenance funding, and performance oversight of the metropolitan and regional rail networks. It also owns the vast majority of rail land and infrastructure. The metropolitan tram and train networks are operated under franchisee arrangements where the operators are responsible for passenger service delivery, infrastructure maintenance and rolling stock maintenance. The regional rail network is operated by the government owned V/Line Passenger Pty Ltd (V/Line), and is responsible for its operation and maintenance. The Regional Network and Access (RNA)

Rail
29
division of V/Line is responsible for the provision of access to other freight and passenger train operators. Regulatory and State Government responsibilities will change as a result of the passing of the Transport Integration Bill, which was introduced to Parliament at the end of 2009. The Victorian Government’s strategic vision for rail is that it should play a much greater role in the State’s transport task. This will reduce road congestion, improve the liveability of Melbourne, reduce negative environmental consequences of transport, and enhance economic activity. Victoria’s rail transport legislation is comprised primarily of the following Victorian Acts: Rail Safety Act Transport Act 1983 Rail Corporations Act 1996.
Key multi-jurisdictional bodies and government agencies are: Australian Rail Track Corporation (ARTC), which operates the Defined Interstate Rail
Network. Department of Transport (DOT), the lead agency responsible for the development and
management of the public transport network in Victoria. Key divisions and authorities are: Public Transport Safety Victoria, responsible for improving rail safety including providing
accreditation for train and tram operators Transport Ticketing Authority, responsible for overseeing Victoria’s public transport
ticketing system contract as well as procuring and managing the new ticketing system for Victoria64
VicTrack, responsible for rail and tram land and below-rail infrastructure owned by the Victorian Government. VicTrack leases the infrastructure to the Director for Public Transport within DOT. VicTrack also owns the majority of rolling stock (trains and trams) that operate on the metropolitan system. Some yards and terminals in metropolitan Melbourne are also managed by VicTrack.65 66
2.2.3 Sector trends Growth in passenger numbers Both the metropolitan and intrastate networks have experienced considerable passenger growth over the last decade, with a rapid increase in patronage since 2005/06. This growth is due to Melbourne’s increasing population, inner city growth where public transport is more accessible, rising CBD employment, petrol price fluctuations and the impact of the global financial crisis on spending patterns. Changes to the ticket system, notably the removal of Zone 3 from the metropolitan ticketing system, have also made public transport more attractive. Melbourne’s train patronage has grown by more than 70% in the last decade, including more than 50% in the past four years. This contrasts with the decade before 2005 when patronage growth rate was 1% to 3% per year. Prior to 2005, population growth was the biggest driver of increased patronage. Since 2005, growth has exploded, which indicates that non-population trends are dominating.67 Table 2.1 below details the patronage for metropolitan trains and trams over the last decade.

Transport
30
Table 2.1: Annual patronage for metropolitan trains and trams68
Financial Year Metropolitan rail Metropolitan trams
Financial Year Boardings (million) Annual Growth (%) Boardings (million) Annual Growth (%)
1998-99 118.0 4.4 120.4 3.1
1999-00 124.2 5.3 127.3 5.7
2000-01 130.3 4.9 129.4 1.6
2001-02 131.8 1.2 131.9 1.9
2002-03 133.8 1.5 134.7 2.1
2003-04 134.9 0.8 135.9 0.9
2004-05 145.12 4.01 145.32 2.01
2005-06 159.13 9.73 149.63 2.93
2006-07 178.6 12.2 154.9 3.6
2007-08 201.2 12.7 158.3 2.2
2008-09 213.9 6.3 178.1 12.5
Patronage on the regional rail networks increased by more than 70% over the past four years. Key reasons for this include the completion of the Regional Fast Rail project in 2006, the average 20% V/Line fare reduction from March 2007, and frequency improvements.69 Passenger growth is expected to continue due to population growth, and cost, travel time and environmental reasons. Growth in freight During the late 1990s and until the mid-2000s, regional rail freight traffic declined by an estimated 20%.70 One of the key reasons for a lack of investment in rail infrastructure occurred because of the nature of the lease signed in 1999 with Freight Victoria Limited and the Victorian Government. This lease contained no specific obligations in the short to medium term for the track lessee to continuously maintain the freight-only rail network to any particular standard. As a result, minimal maintenance occurred because such investment resulted in little benefit to the lessee. The consequence was that about 10% of the network became inoperable and most of the rest was subject to speed restrictions of 50km/h or less due to very poor sleeper condition. c 71 The recognition that maintenance was urgently required to prevent massive future rehabilitation costs resulted in the State Government providing $25 million in 2006/07 for essential track maintenance work.72 The rebuilding of the regional freight network accelerated following the work of the Victorian Government’s Rail Freight Network Review Taskforce. Its 2007 report, Switchpoint: The template for rail freight to revive and thrive! contained 29 recommendations, many of which have been or are being implemented, such as the reduced rail access fees for grain transport and a targeted investment program in the freight-only rail network, notably the gold and silver line upgrades. As a result, regional rail freight continues to grow. Increased capital and maintenance expenditure During the 1990s and early 2000s, there was massive under-investment in railways, closure of rail lines and a decrease in government subsidy for operations and maintenance of networks.73 This led to a fall in the service levels on many rail lines and a massive backlog of maintenance. Since 2004/05, the investment in rail has increased substantially to address past shortfalls as illustrated in Figure 2.2.
c In 1999, the regional rail network was leased for 15 years to Freight Victoria Limited (later known as Freight Australia). In 2004, when Pacific National purchased the owner of Freight Victoria, the Director of Public Transport in DOT consented to the change of control of ownership to Pacific National. Following the withdrawal of National Express in late 2002, and with the imminent delivery of the Regional Fast Rail project, the State decided to retain V/Line in public operation at that time.

Rail
31
Figure 2.2: Capital expenditure on rail74
Maintenance has also increased as illustrated in Table 2.2 below. Table 2.2: Annual expenditure on network maintenance ($ millions)75
Financial Year Metropolitan (Connex) Regional (V/Line) TOTAL
2005/06 $145 $129 $275
2006/07 $157 $163 $321
2007/08 $170 $180 $350,
2008/09 $205 $196 $402
Maintenance on metropolitan rail and trams will increase over the next few years because the new franchising regime specifies that franchisees are required to increase maintenance expenditure which is also supplemented by a 50% increase in State Government funding.76
2.3 Performance
2.3.1 Passenger service network performance Key parameters to assess the performance of passenger services are efficiency, levels of service and safety/security. Due to the recent change in franchisees, insufficient information is available to assess the quality of their performance. Consequently, the information below relates to the previous franchisees. Performance in the short-term is likely to be similar to that of the recent past due to the inability to rapidly improve legacy infrastructure and operating processes.
2.3.2 Efficiency There are no simple measures of efficiency for rail networks. Evaluations of efficiency are made by comparing past with current performance, or by comparing similar elements of rail sectors across jurisdictions. Below are two findings that reflect on Victoria’s rail network: A 2008 NSW Independent Pricing and Regulatory Tribunal (IPART) report concluded that by
using a number of measures, efficiency levels on Melbourne’s heavy rail network are markedly higher than Sydney’s in all aspects of service delivery.77 Specifically, Connex was found to be more efficient in terms of infrastructure maintenance, rolling stock maintenance, crewing, station staffing and head office overheads.78
A 2005 Victorian Auditor-General report into the franchising of Melbourne’s train system found that ‘the current train and tram franchise agreements represent reasonable value-for-money (assuming that franchisee performance meets contracted levels)’.79
0100200300400500600700800
1999
/00
2000
/01
2001
/02
2002
/03
2003
/04
2004
/05
2005
/06
2006
/07
2007
/08
2008
/09 es
timate
d
2009
/10 bu
dget
Dol
lars
($m
)

Transport
32
2.3.3 Levels of service The DOT sets and monitors the performance levels that each of the franchisees needs to meet. The targets are primarily: Punctuality, measured as a percentage of the services arriving on time at specified monitoring
points Reliability, measured as a proportion of the timetabled train or tram services that have run Customer satisfaction, measured through surveys that include questions about service delivery,
personal safety and passenger comfort.80 Table 2.3 below lists reliability and punctuality performance. Table 2.3: Reliability and punctuality performance
Vehicle Performance measures81 Actual (Dec 2008 to Dec 2009) 82
Metropolitan trains
In each financial quarter Metro Trains Melbourne is required to: • deliver at least 98% of the timetable each month • ensure that at least 87% of services arrive at their destination
no later than four minutes and 59 seconds after the timetabled arrival time.
• 1.2% network cancellations • 1.4% timetable not
delivered • 90.5% train punctuality on-
time to 5:59 • 86.5% train punctuality on-
time to 4:59
Regional trains In each financial quarter V/Line Passenger rail services is required to: • deliver at least 96% of scheduled train kilometres • ensure that at least 92% of services arrive at their destination
no later than five minutes and 59 seconds after the timetabled arrival time for short distance services and ten minutes and 59 seconds after the timetabled arrival time for long distance services.
• 1.9% cancellations • 86.7% train punctuality on-
time
Metropolitan trams
The delivery of tram services in Melbourne can be significantly affected by road traffic. Therefore, punctuality of trams is measured as an average of the performance at three of five monitoring points along the route. For any given monitoring point a service is considered on-time where it arrives no earlier than 59 seconds before and no later than four minutes and 59 seconds after the timetabled arrival time. In each financial quarter the performance standards for Yarra Trams are that: • the average punctuality of services must be at least 77% • the per cent of timetable delivered must be at least 98%
• 0.2% network cancellations • 0.8% timetable not
delivered • 74.7% tram punctuality at
destination on-time to 5:59 • 69.8% tram punctuality at
destination on-time to 5:59 • 83.9% average tram
punctuality over length of route on-time to 5:59
• 80.6% average tram punctuality over length of route on-time to 4:59
If the franchisees fail to meet performance measures, they can be fined. For example, over the 2008/09 financial period, V/Line was fined over $1.6 million.83 Hot weather continues to be a major cause of train cancellation and delays, such as observed in January 2010. A key factor in customer satisfaction is overcrowding on trains. Based on Metlink’s attitudinal surveys, overcrowding consistently sits behind ‘service reliability’ in the factors influencing satisfaction with services.84 The massive increase in patronage on metropolitan trains has increased overcrowding, peaking in 2008 but still very high in 2009. Overcrowding results are seen in see Figure 2.3.

Rail
33
Figure 2.3: Overcrowding measures85
There is widespread recognition that the metropolitan and to a lesser degree the rural passenger network has reached capacity in many areas, and is suffering severe congestion and providing inadequate service. For example, Metlink notes that the ‘current level of passenger congestion on the metropolitan train system is unsatisfactory … and the impact of overcrowding is more pronounced in Melbourne than other cities – 43% of people in Melbourne are discouraged from using public transport because of overcrowding (Sydney and Brisbane 32%, Adelaide 27%, Perth 26% and Canberra 16%)’.86 The Victorian Government has stated that ‘many metropolitan lines are now operating at or near the limits of their practical capacity’.87 The lines suffering most congestion are: The Sydenham corridor, where the practical track capacity was effectively exhausted when
additional metropolitan services were added in November 2008 The western and northern lines (the Northern Group) and the south-eastern lines (the Caulfield
Group) which will reach their practical capacity limit within five years The Dandenong line88 The Sunshine/Footscray/North Melbourne corridor where all three of V/Line’s western lines
come together with metropolitan services and use the same track to enter Southern Cross station.
Some tram routes are also suffering overcrowding and the current fleet is insufficient to address forecasted growth.89A key cause of this is road congestion which makes trams on shared road/tram lines delayed and unreliable. While many cities have trams in fully segregated lanes, in only 50km of the 249km tram network in Melbourne do trams have exclusive right of way.90
2.3.4 Safety and security Ensuring the pre-eminence of safety in rail operations, given the massive growth and pressure to meet service performance targets, is a continue challenging for rail services. To enhance safety, the Victorian Government introduced a new safety regulatory regime that came into effect on 1 August 2006. It required the accreditation of all commercial operators by 1 July 2008, which was achieved.
0
10
20
30
40
50
60
2004 2005 2006 2007 2008 2009
Num
ber o
f Rol
ling
Hou
rs
Greensborough - Westgarth
Belgrave - Heathmont
Williamstow n - North Williamstow n
Glen Waverley - Heyington
Sandringham - Prahran
Lillydale - Ringw ood East
Hurstville - Montmorency
Frankston - Glenhuntly
Epping - Rushal
Cranbourne - Merinda Park
Craigieburn - Kensington
Werribee - Seddon
Sydenham - Middle Footscray
Pakenham -Halam
Dandenong - Carnegie

Transport
34
As the passenger rail networks and to a lesser degree, other rail networks, are relatively accessible and have been the target of terrorist attacks overseas, rail networks are considered potential terrorist targets. To address this risk, the Victorian Government introduced the Terrorism (Community Protection) Act in 2003. This requires rail organisations to develop specific counter-terrorism risk management plans and undertake a training exercise to test the operation of their plan at least once a year. The counter-terrorism response designed to ensure continuity of service and rapid recovery has been built upon by rail organisations to increase the network’s protection from an ‘all-hazards’ and ‘extreme events’ perspective. As this can only be achieved through sector-wide coordination, a Transport Sector Committee of the Victorian Government’s Security and Continuity Network was established. This committee meets regularly and is chaired by the Security and Emergency Management Division of DOT. The committee consists of the Emergency Planning Coordinators from the franchisees, V/Line Passenger, Pacific National, Australian Rail Track Corporation (ARTC), VicTrack Access, Southern Cross Station Authority, Bus Association Victoria, and representatives from Victoria Police and emergency services agencies. Awareness of the need to improve continuity of service and rapid recovery was raised following the 2008 Oaks Day rail disruption. This left about 50,000 Oaks Day race-goers stranded during peak hour when an overhead deficiency resulted in power being cut to the line and two other suburban rail services. Key recommendations resulting from the incident included ready-to-roll emergency plans, modified command control structures, rapid staff mobilisation and communications to provide clear information about modified services to the travelling public as early as possible.91 In the new metropolitan rail franchise, the Victorian Government has stated that it requires increased expenditure on maintenance and renewals from 1 December 2009 as this will build ‘greater resilience to the impacts of extreme weather’.92
2.3.5 Level crossings safety The metropolitan network has a high number of level crossings compared with other States. For instance, Melbourne has 180 level crossings across the metropolitan electrified suburban train system compared with two in the entire Greater Sydney area. There are 62 sites on the network where there is a level crossing or pedestrian crossing within 100 metres of the end of the platform.93 The large number of level crossings poses road and rail safety risks and increases road congestion on key roads. Across Victoria, there are about 1,100 rail level crossings that still have passive protection measures. Between 1 January 2001 and 30 June 2008, there have been 220 road vehicle collisions at Victorian level crossings. There have been 578 across Australia over the same period. The Australian Government has provided $30.3 million over 2008/09 and 2009/10 to fund the installation of boom gates, flashing lights and pedestrian gates at 59 high-risk rail level crossing sites across Victoria.94
2.3.6 Environmental sustainability A key objective in Victoria’s transport policy is to reduce greenhouse gas emissions from the transport sector by encouraging mode shift from road transport that accounts for almost 90% of transport emissions.95 This is being achieved directly by the Victorian Government through investing in public transport and integrating transport and land-use planning to link employment, services and homes, aiming to minimise the need for trips and increasing the efficiency of people and goods movements.

Rail
35
Rail operators are also contributing to the mode shift by highlighting the environmental benefit of rail transport to passengers. An example from the previous franchisee was Connex’s Carbon Calculator that works out the CO2 emissions for a travel journey and identifies the impact that choosing public transport has. Reducing resource consumption has also been important from a financial, environmental and reputation perspective. An example of this is Yarra Trams’ green-depot program. The program included a range of water reduction measures that resulted in saving 4.09 million litres of water each year.96
2.4 Future challenges The future challenges to achieving improvements in rail infrastructure are: Reducing metropolitan rail congestion and improving services. While congestion has
decreased recently, overcrowding and delays are likely to return as passenger numbers rise. The Victorian Government, in conjunction with the rail operators, is undertaking a range of initiatives to address these problems. These include increasing the utilisation of the existing network, more funding for maintenance, and targeting medium-sized investments. Medium sized projects, such as new rail vehicles, will result in improvements, but not for several years. For example, it takes a minimum of three years to manufacture, deliver and commission a new train assuming that there is an existing production line.97 The Victorian Government has responded slowly and generally provided insufficient investment to address the problems. As many metropolitan lines are reaching capacity, the only ways to significantly increase capacity are by building major additional lines, large-scale duplication, expanding the rail fleet, rebuilding signalling and control systems, and/or redesigning the network to allow very high frequency services.
Maintaining long-term funding for rail as per the Victorian Transport Plan. The Victorian Transport Plan includes an ambitious program of rail projects that will cost some dozens of billions of dollars. While recent expenditure on rail has increased significantly, maintaining this high level will be essential for the foreseeable future if the Plan is to be achieved. Key projects will include:
Metro Stage 1, which consists of a rail tunnel under Melbourne between Dynon and St Kilda Roads at the Domain, doubling the Underground Loop capacity for the western and northern lines. It also includes a new station at Parkville.98 The Australian Government, under the May 2009 Building Australia initiative, has provided $40 million funding for preconstruction work on this tunnel. Work is under way to determine the final tunnel alignment. Over $4.5 billion will be required to build the tunnel and funding for this has not been confirmed.99
Regional Rail Link project, which is the largest investment in regional rail ever in Victoria. It is fully funded with both State and Australian Government contributions. It will reduce congestion and safety risk along Melbourne’s western rail lines that carry both regional and metropolitan trains to Southern Cross Station. The $4.3 billion Regional Rail Link project was announced in May 2009 as a joint Victorian and Commonwealth Government project funded under the National Building program. The project involves a 40km dual track link from West Werribee to central Melbourne’s Southern Cross Station via Sunshine, and the construction of a new rail line from Werribee to Deer Park. Work has started on lengthening Platforms 15 and 16 at Southern Cross Station as part of a $35 million program of station works including installation of lifts, escalators, systems, a platform canopy, finishes and furniture (expected completion at the end of 2010).100
Improving the interstate and regional freight rail line, and their intermodal connections. The Australian Government, via its 2009 Nation Building package, is enhancing the Defined Interstate Rail Network with the following projects: Seymour-Wodonga Track Upgrade, Wodonga Bypass, Melbourne-Junee Passing Lanes, and Western Victoria Track Upgrade. These are significant improvements for interstate rail freight. However, due to major limitations of the NSW, Queensland and SA rail network, and the rail connections to ports and road-rail hubs, the opportunities of rail freight in Victoria cannot be realised. Improvements to all elements of the supply chain are required.

Transport
36
Delivering integrated land use and transport planning outcomes. See the challenges in the Road section.
2.5 Report Card rating
Infrastructure type Victoria 2010 Victoria 2005 National 2005 National 2001
Rail D C- Overall D Freight
C- D-
Based on considerations of planning, funding, and infrastructure capacity and condition, Victoria’s rail infrastructure has been rated D. This rating recognises that that there has been no fundamental improvement to the metropolitan rail network since 2005, although there are a number of projects underway that should deliver improvements. Over the long-term, a complete modernisation of metropolitan rail is required to meet the significant increase in demand expected from rising population and public transport use. While important regional rail segments have improved, quality is still below what is needed for rail freight to increase its market share. Less used elements of the regional rail network remain inadequate. The quality of the tram network is improving but is still inadequate in terms of average speed and capacity. Positives that have contributed to the rating are: Rail line upgrades including electrification, separation of freight and passenger traffic New rail lines being constructed Rail and tram vehicle fleet upgrades A renewed focus on intermodal planning that acknowledges the importance of rail A policy commitment that public transport is central to future urban development and transport-
oriented development in particular. Negatives that have contributed to the rating are: Severe rail congestion and inadequate service to meet the growing demand Minimal progress in removing railway crossings Minimal progress in increasing tram-road separations Inadequate air-conditioning on most rail carriages Insufficient new locomotives ordered to allow the retirement of aged locomotives Insufficient improvement in intrastate rail freight and intermodal connections Inadequate progress in providing rail lines to outer suburbs and urban fringe.

3
3.1
3.2
3.2.1
Ports
Summar
Infrastruct
Por
This rating strategic plremaining a Since the la The com
dock at The rele Release Remova
deregulall ports
Recently co $119 m Rehabil
Dock, a Port of G $25 mill
be comp Develop
Challenges Meeting Impleme Integrat
Infrastru
System deVictoria’s p Four co Thirteen Shippin
ry
ture type
rts
recognises tans have beat and aroun
ast Report Cmpletion of ththe Port of M
ease of a lone of land-useal of economation of port
s.
ompleted anillion Dynon itation worksnd deck replGeelong Railion extensiopleted in Aprping a hardw
s to improving future contaentation of thting land-use
ucture ove
escription port infrastrucommercial sen local ports g channels f
Victoria 2010
C+
that while infeen developend ports.
Card, the majhe major dreMelbourne ng-term visione strategies fo
mic regulationprices for br
d in-progresPort Rail Lin
s and crane rlacement at Yl Access (co
on of Geelongril 2010)
wood chip sto
g port infrastainer growthhe port and fe decisions w
erview
cture consisteaports – the servicing loc
for the ports
0 Vic
frastructure ued, there are
or port sectodging works
n for Victoriafor all ports n at the portsreak-bulk (ex
s major infrank (completedrail replacemYarraville101
ompleted midg’s Corio Qu
orage facility
tructure inclu
freight planswith port deve
ts of: ports of Mel
cal industriesof Melbourne
ctoria 2005
C
upgrades havmany signifi
or developmein Port Philli
an ports in th
s of Geelong,xcluding moto
astructure prod in July 200
ment at Swan
d-2009) ay North Wh
at the Port o
ude:
elopment.
lbourne, Gees, tourism ane, Geelong,
National
C+
ve occurred,icant access
ents have beip Bay which
e context of
, Portland anor vehicles) l
ojects include09) nson Dock, w
harf for wood
of Portland
elong, Hastind recreation Hastings and
l 2005
+
, and port lan and conges
een: h will allow la
an integrate
nd Hastings, liquid bulk an
e:
wharf rehabili
dchip exports
ngs and Portl
d Portland.
National 2001
B
nd-use and stion problem
arger ships to
d supply cha
with the nd dry bulk fo
tation at We
s (expected t
land
37
ms
o
ain
or
bb
o

Transport
38
This section focuses on the four commercial seaports as they are an integral part of the State and national transport system. It does not cover local portsd or stevedoring services whose primary role is to load and unload ships. The key functions of commercial seaports are: The provision and management of basic port infrastructure such as facilities for the berthing of
ships and loading cargo; navigation infrastructure, such as shipping channels, to provide for the safe access of ships to the berths; and harbour masters services, which involves directing shipping movements within the port waters.
The provision of land in the vicinity of the berths on which cargoes can be assembled for loading or placed temporarily following discharge, as well as road and rail access and other services within the port environs.
The provision of complementary infrastructure, such as cargo storage facilities or specialised cargo handling equipment.102
Of Victoria’s commercial ports, the Port of Melbourne is Australia’s largest international container port, while the regional commercial trading ports of Geelong, Portland and Hastings are mostly involved in moving large volumes of non-containerised bulk cargoes such as grain, fertiliser, woodchips, chemicals, petrochemicals and crude oil. Ports are key hubs in the Victorian and national transport network, and this integration is seen in Figure 3.1. Figure 3.1: Victoria’s commercial trading ports and key transport networks103
d Local ports around Victoria provide facilities and services to fishing vessels, charter boats, recreational boats and small commercial vessels. There are 13 local ports in Victoria, under management of eight local port managers. These include:
• Gippsland Ports (Gippsland Lakes, Corner Inlet and Port Albert, Snowy River, Mallacoota and Andersons Inlet) • Port Phillip Bay and Western Port (public piers and jetties at Portsea, Sorrento, Rye, St Kilda, Gem Pier, Portarlington,
Queenscliff and San Remo) • Port Fairy • Apollo Bay • Warrnambool • Port Campbell • Lorne and • Barwon Heads.
Victorian Regional Channels Authority, Our Local Ports webpage, http://www.regionalchannels.vic.gov.au/index.php?option=com_content&task=view&id=5&Itemid=6, accessed 28 September 2009.

Ports
39
Port of Melbourne The Port of Melbourne is managed by the Port of Melbourne Corporation (PoMC), a statutory authority of the Victorian Government. It is Australia’s largest container and general cargo port, handling around 37%104of the nation’s container trade. It handles nearly $75 billion in international and coastal trade each year.105 Non-container cargo passing through the Port includes motor vehicles, dry cargoes such as cement, grain and sugar, and liquids such as crude oil and petrochemicals. The Port of Melbourne has 34 commercial berths at five docks, river wharves, Gellibrand Pier at Williamstown and Station Pier at Port Melbourne. The berths service two purpose-built international container terminals as well as multi-purpose berths. The berths at Station Pier service the Bass Strait passenger ferry, cruise shipping and visiting naval vessels. The Port’s land covers 497 hectares along the lower reaches of the Yarra and Maribyrnong Rivers at Williamstown and at Port Melbourne. The Port is connected to other transport modes, including road and rail.106 PoMC also manages all of the shipping channels serving the Port, including the channels at the entrance to Port Phillip Bay. Private terminal operators operate the main freight facilities. Common user facilities for general cargo are operated by PoMC.107 Port of Geelong The Port of Geelong was privatised in July 1996 and is now managed by GeelongPort. The Port handles 25% of Victoria’s overseas exports, and more than 12 million tonnes of bulk cargo annually, worth around $5.6 billion.108 The Port handles a wide variety of cargoes, particularly bulk commodities such as grain, woodchips, fertiliser, petroleum and chemical products. The Port of Geelong is serviced by 17 berths, with depths up to 12.3m. The Port is connected to other transport modes such as road and rail. Trade in bulk and break-bulk trade is expected to increase by as much as 59% by 2020. Trade in liquid bulk is also expected to grow substantially.109 Port of Hastings The Port of Hastings is owned by the Port of Hastings Corporation (PoHC), which is a statutory corporation owned by the Victorian Government. The Port has a number of commercial jetties and wharves, including Stony Point jetty and depot (which also acts as access point for ferry services to French and Phillip Islands and the berth for Harbour Tugs), Crib Point liquid berths, Long Island Point liquid berth, BlueScope Steel wharves and the Esso Fractionation Plant at Long Island Point. The Port handles exports of steel, iron, ferrous alloys and LPG, and imports of petroleum products.110 Around 200 vessels visit the Port each year, carrying around five million tonnes of cargo, including petroleum, LPG and steel.111 The Victorian Government considers the Port of Hastings to be the preferred site for future container freight, once capacity at the Port of Melbourne is reached. It is planned that the Port of Hastings would supplement rather than replace Melbourne and both ports would continue to operate in parallel. Hastings has the advantages of natural deep water, large areas of vacant land and proximity to the south east of Melbourne, which is the source and destination of a significant proportion of international container flows in Victoria. However, it has the disadvantage of requiring significant infrastructure investment to make it useable for container traffic. To facilitate the development, in December 2007 the Port submitted to the Victorian Government the final draft of the Port of Hastings Land Use and Transport Strategy. This sets how future land and transport corridors will be preserved and integrated to ensure that the Port can achieve its

Transport
40
vision.112 The Victorian Government has stated that it will progress preliminary planning work for expansion of the Port of Hastings, and the Victorian Transport Plan allocated $20 million for work, including environmental studies, business case development and detailed design work, so that development can proceed when required.113 The Port is expected to develop significantly over the next two and three decades, but it may be required sooner if exports of products derived from brown coal from Gippsland occur. Necessary developments will include: Construction of new berths in the Long Island Point precinct Construction of container terminal facilities to the north of the existing BlueScope facility Upgrading the broad gauge railway connecting the Port to standard guard network.
Currently the Port has no infrastructure projects under way. Port of Portland The Port of Portland was privatised in July 1996 and is now owned and managed by the Port of Portland Pty Ltd. The Port handles dry, break bulk and liquid bulk cargoes. The Port’s throughput is four million tonnes of cargo annually, valued at approximately $1.5 billion. Exports include grain, woodchips, logs, aluminium ingots, mineral sands and livestock, while the major import commodities include alumina, liquid pitch and fertiliser products.114 The Port consists of six berths with depths of up to 12.2m. Deep water approaches allow for minimal pilotage.115 Over the next five to ten years, the Port of Portland is expecting to handle more than twice the amount of trade that it handles today. The majority of the growth is expected to come from forestry products in the Green Triangle Region.116
3.2.2 Policy and governance The Victorian Government’s strategic vision for ports is identified in Port Futures (August 2009). It is to develop an efficient, integrated and sustainable ports system that fits seamlessly into national transport and freight networks. Port Futures updates the Victorian Port Strategic Framework (2004). Key priorities and actions outlined in Port Futures include: Progressing development at the Port of Melbourne including considering options for new
container capacity Continuing to plan for the development of the Port of Hastings Improving governance arrangements by bringing responsibility for all ports under a single
portfolio, with management of Victoria’s local ports transferred to the Department of Transport from the Department of Sustainability and Environment from 1 July 2010
Improving access to Victoria’s ports including a new proposed Geelong channel improvement program
Championing the ‘Green Port’ concept by incorporating world’s best practice sustainability principles into future port development.117
The Victorian Government has long recognised that the key impediment to efficient and growing ports is inadequate land-use planning and development near ports and along freight corridors linking ports with freight hubs. This recognition is reflected in the Ports Futures, which identified that long-term land planning is essential to ensure ports that can grow to meet future demand. To operationalise this, each port has developed long-term land-use plans that provide more certainty on land-use planning for the port and its surrounding areas. These plans include: Port of Melbourne Port Development Strategy, which guides port development over the next 30
years

Ports
41
Port of Geelong Land Use Strategy, which guides development and investment in the Port over the next 20 years
Port of Hastings Port Land Use and Transport Strategy (PLUTS), which identifies port berthing areas and transport access corridors that are likely to be required due to both new trade requirements and displaced Port of Melbourne trade
Port of Portland Land Use Strategy (Portland PLUS), which provides a framework for the sustainable development of the Port over the next 20 years.118
To ensure that planning documents stay current, the Victorian Government requires all commercial trading ports to prepare and regularly update their long-term strategic plans.119 As well as planning documents, the Victorian Government is likely to amend the Port Services Act 1995 enabling the Port of Melbourne to influence and participate in the development of the new Metropolitan Freight Terminal Network, notably the closer integration of the Dynon rail precinct with the Port and the establishment of a new Melbourne International Freight Terminal on the current Wholesale Fruit and Vegetable Market site.120 The Victorian Government has initiated a number of activities to integrate ports into supply chains. Examples include: Rolling out of the Melbourne Port@L initiative which aims to develop an intermodal transport
hub Integration of the ports into the Victorian Principal Freight Network Consideration of port freight traffic in the East West Links Needs Assessment study Enhancing the rail port links in the Green Triangle.
Port operations and development are regulated in three main areas. They are: Port economic regulation. The Port Services Act 1995 results in prices being prescribed for
certain port services including the provision of channels, berthing of vessels, short-term storage or cargo marshalling, utility connections to vessels berthed in the port, and towage in the ports of Portland, Geelong and Hastings. These prices are regulated by the Essential Services Commission (ESC).e In June 2009, the Essential Services Commission released its final review of Victorian ports regulation. It recommended that the Ports of Geelong, Portland and Hastings should not be regulated, and that price regulation will be limited to port berth services for container and motor vehicle cargoes and to the shipping channel services using both the Port of Melbourne channels and the shared channels at the entrance to Port Phillip Bay.121 In December 2009, the Victorian Government agreed with the above recommendations.122
Market competition in stevedoring and freight-forwarding operations. The Australian Competition and Consumer Commission (ACCC) reviews stevedoring and freight-forwarding operations to ensure that the market remains competitive.
Development of ports. Proposals for expansion of port facilities are subject to environmental assessment processes under the Environment Effects Act 1978 and the Commonwealth’s Environment Protections and Biodiversity Conservation Act 1995.123
e Following a review of the regulatory framework completed in June 2004, the ESC has implemented a price-monitoring framework through the Price Monitoring Determination, available from the ESC. The key features of the framework are that:
• port operators determine and publish Reference Tariff Schedules to set out standard terms and conditions for providing port services
• port users and port operators may negotiate prices for regulated port services that differ from the published reference tariff • prices of regulated port services are subject to monitoring by the ESC • the ESC will publish an annual Monitoring Report to provide information to interested parties on the provision of regulated port
services. http://www.esc.vic.gov.au/NR/rdonlyres/230EF294-526F-4F08-AFA7-841FF65D65BC/0/PortsBrochure2005.pdf.

Transport
42
Key multi-jurisdictional bodies and government agencies are Department of Transport (DOT). The DOT’s Freight, Logistics and Marine Division is
responsible for delivering the government’s policies in the ports and for the management of marine safety.
Victorian Regional Channels Authority (VRCA). The VCRA manages the commercial navigation of the channels in Geelong port waters and oversees the channel licences for the Port of Hastings and Port of Portland.
Essential Services Commission (ESC). The ESC is responsible for the economic regulation of Victoria’s four commercial seaports of Melbourne, Geelong, Portland and Hastings.
Department of Sustainability and Environment. The DSE is currently responsibility for local ports but this responsibility will be transferred to DOT on 1 July 2010.
3.2.3 Sector trends Port throughput growth The throughput of all Victorian ports has increased 1% per year on average for the last four years. However, the actual growth figures vary with individual ports as seen in Table 3.1. This variation reflects the fact that port traffic is heavily dependent on the state of the economy, product demand, geographic location and seasonal variations. For instance, grain traffic, notably at the Port of Portland, is related to harvest time. Table 3.1: Cargo throughput by port (’000 mass tonnes)124
Year ending June
2004 2005 2006 2007 2008 4-year average
change(%)
Melbourne
Containers 16,800 18,370 18,552 19,744 21,092 5.9
Vehicles 450 593 605 677 768 14.3
Other 9,400 9,345 8,604 9,095 8,962 -1.2
Sub-total 26,650 28,308 27,761 29,515 30,822 3.7
Geelong 9,740 10,043 9,435 9,859 9,555 -0.5
Portland 3,798 3,645 3,513 3,044 3,258 -3.8
Hastings 4,572 3,512 3,083 3,250 2,954 -10.3
Total 44,760 45,507 43,754 45,668 46,589 1.0
Table 3.2 identifies the throughput for each port. Table 3.2: Total throughput for 2007/2008125
Port Import (mass tonnes)
Export (mass tonnes)
Total Throughput Cruise vessel visits
Melbourne 18,763,144 12,059,097 30,822,241 44
Geelong 7,023,097 3,732,198 10,755,295 0
Hastings 1,108,966 1,733,196 2,842,162 0
Portland 1,301,553 1,951,193 3,252,746 0
Victorian Total 28,196,760 19,475,684 47,672,444 44
The Port of Melbourne is the only Victorian port that handles large volumes of containers. Figure 3.2 illustrates the growth in numbers of these containers which is averaging some 10% increase per annum across six years.126

Ports
43
Figure 3.2: Quarterly Container Traffic, Port of Melbourne127
Total throughput volumes at ports are expected to increase significantly over the next 20 years. For example, by 2030 port tonnage is expected to double for the ports of Melbourne and Hastings.128 Table 3.3 and Figure 3.3 present growth forecasts for the Port of Melbourne. Table 3.3: Growth forecasts for the Port of Melbourne129
Freight today Freight future
Over two million twenty foot equivalent containers (TEUs) move through the Port of Melbourne annually.
By 2030, approximately 6.8 million TEUs will be traded through the Port of Melbourne, a 210% increase on today.
The average size of ships visiting the Port of Melbourne is approximately 2,400 TEU.
Average ship size through the Port of Melbourne in 2030 will be over 4,500 TEU, an 88% increase.
Approximately 3,500 ships visit the Port of Melbourne per annum.
By 2030 there are forecast to be 5,500 ship visits to the Port of Melbourne per annum, an increase of 57%.
Figure 3.3: Projected containerised exports and imports for Melbourne Port130
0
100000
200000
300000
400000
500000
600000
2000
Dec
2001
Jun
2001
Dec
2002
Jun
2002
Dec
2003
Jun
2003
Dec
2004
Jun
2004
Dec
2005
Jun
2005
Dec
2006
Jun
2006
Dec
2007
Jun
Tota
l TEU
per
qua
rter
Total TEUs
Linear (Total TEUs)
0
1000
2000
3000
4000
5000
6000
2005
-06
2007
-08
2009
-10
2011
-12
2013
-14
2015
-16
2017
-18
2019
-20
2021
-22
2023
-24
Milli
on T
EUs
Total TEUs (millions)
Linear (Total TEUs (millions))

Transport
44
3.3 Performance
3.3.1 Price and quality of service Performance measures of port service quality are not comparable across ports due to differences in location, port infrastructure and the types of cargo handled.131 In addition, most port measures, such as average ship turnaround time, are likely to be influenced by the efficiency of stevedores rather than for port infrastructure. However, changes in prices provide an indication of efficiency. See Table 3.4. Table 3.4: Victorian ports – estimated average increase in reference prices (%)132
Real price increase 2005/06 2006/07 2007/08 2008/09
Port of Portland -1.4 0.3 3.6 2.2
Port of Geelong -0.4 -0.4 6.0 0.6
VRCA -2.3 -2.9 0.0 -0.2
Port of Hastings 10.5 3.0 15.1 19.1
Port of Melbourne 6.0 1.7 9.7 22.2
3.3.2 Port security The ports of Melbourne, Hastings, Geelong and Portland are all Security Regulated Ports. All have security plans that aim to safeguard maritime transport and facilities against unlawful interference. The security regulatory environment is governed by the Commonwealth’s Maritime Transport and Offshore Facilities Security Act 2003 and Offshore Facilities Security Regulation 2003, which reflect the International Ship and Port Facility and Security (ISPS) Code. Over the last few years, each port has increased security measures such as participating in information-sharing forums between government agencies and regulated port users, building new and upgraded fencing and gates, restricting access to sensitive areas, undertaking background checking of port workers through the introduction of the Maritime Security Identification Card (MSIC), and increasing the volume of closed circuit television (CCTV) surveillance.
3.3.3 Environmental sustainability The Victorian Government is working with Victorian ports to develop the ‘green port’ concept. It aims to ensure that ports not only manage their short-term environmental risks, but also integrate sustainability into port development and ongoing business activities.133 Environmental factors that are key to green ports are resource consumption (e.g. water, energy, transportation) and environmental quality (e.g. emissions, water quality, land use). The importance of environmental issues is reflected in the fact that it was a key requirement to the approval and successful financial and political completion of the project. Future port developments will continue to meet increasingly strict environmental guidelines.
3.4 Future challenges The challenges in achieving improvements in port infrastructure are: Meeting future container growth. Container freight volumes are expected to grow continually
for the foreseeable future. Over the short to medium term, this growth can be accommodated by on-port incremental improvements such as developing additional stevedoring capacity and infrastructure upgrades. However, over the long-term, the growth cannot be accommodated unless fundamental changes at the ports occur. This is because the congestion, delays and pollution caused by the huge traffic movements will be untenable from the exporters’ and importers’ perspectives, as well as politically. Future ports will need to be integrated into intermodal hubs/supply chains where consolidation and dispatch of containers occur, rather
Ports
45
than at the ports. Instead, container ports will focus on rapid loading and unloading of containers, and optimising transfers.
Implementation of the port and freight plans. The Victorian Government has released several port and freight plans which are focused on improving ports as part of enhancing supply chain efficiency. The plans are Victorian Transport Plan, Freight Futures and Ports Future. The Australian Government is also developing a National Ports Strategy and this may drive developments at Victorian ports. Key projects identified to improve supply chains include:
Donnybrook/Beveridge Interstate Freight Terminal, north of Melbourne, which will be the first of a new network of suburban freight terminals to take pressure off the Port of Melbourne134
Melbourne Freight Terminal network, activity centres and freight corridors High capacity rail and road transport links on the Principal Freight Network connecting the
metropolitan Freight Terminals and the Port of Melbourne. These projects need to be funded and implemented to enable ports to cope with future growth in an economic, social and environmentally sustainable fashion.
Integrating land-use decisions with port development. Ports require large amounts of land and generate significant road and rail traffic. Ensuring compatible land use around ports is challenging due to the typically high value of land around ports. The need to consider future port requirements when making nearby urban development decisions is recognised by the Victorian Government. However, ensuring that this occurs is challenging and requires that:
Local governments consider the port’s future requirements Ports better contribute to local and regional planning Urban encroachment and other development do not prevent the efficient functioning of the
port.
3.5 Report Card rating
Infrastructure type Victoria 2010 Victoria 2005 National 2005 National 2001
Ports C+ C C+ B
Based on considerations of planning, funding, and infrastructure capacity and condition, Victoria’s port infrastructure has been rated C+. This rating recognises that while infrastructure upgrades have occurred, and port land-use and strategic plans have been developed, there are many significant access and congestion problems remaining at and around ports. Positives that have contributed to the rating are: Significant improvement in port land use and strategic planning Successful completion of the channel deepening project Access improvements at the ports of Melbourne, Portland and Geelong Improved planning alignment between the ports of Melbourne and Hastings.
Negatives that have contributed to the rating are: Ongoing vehicle congestion problems at and around ports Inadequate truck and rail connections to the ports and intermodal centres Uncertainty about the future of break-bulk freight Insufficient development in the rail and road connections to the Port of Hastings in preparation
for its long-term expansion.

Transport
46

4
4.1
4.2
4.2.1
Airpor
Summar
Infrastruct
Airpo
This rating Melbourne commerciathose deveall airports. Since 2005 The rele The gro Financia
Recently co Road ac Runway
Challenges Aligning Meeting Maintain
Infrastru
System DeAirport infra(i.e. aeronasystems an In Victoria tcategories: Internat Major g Significa
YarrawoBendigo
Minor a
rts
ry
ture type
orts
recognises tAirport, and
al/industrial deloped by nea. The ongoin
5, the major aease of final owth in non-aal difficulties
ompleted anccess to Essy, tarmac, ter
s to improving on-airport dg long-term pning the fina
ucture ove
escription astructure coautical and nnd fencing.
there are som: tional and maeneral aviatiant regional onga, Warrnao irports and a
Victoria 2010
B
the consider the mainten
developmentsarby local gog viability of
airport develMaster Plan
aeronautical din maintainin
d in-progressendon airporminal, car p
g airport infrdevelopmentpassenger anncial viability
erview
onsists of fixeon-aeronaut
me 200 airpo
ajor domesticon airports –airports – Poambool, Gee
airstrips.135
0 Vict
N
able improvenance of Mels pursued byovernments ismaller regio
opments havs for all Comdevelopmenng the infras
s major infrart arking and fr
astructure int with local land freight groy of regional
ed assets ontical industria
orts and airst
c airports – M– Essendon aortland, Milduelong, Shepp
toria 2005
Not rated
ement in capbourne Airpoy Melbourne,s unsatisfactonal airports
ve been: mmonwealth-
ts on Commtructure stan
astructure pro
reight upgrad
nclude: and-use plansowth airports.
n airport landal, commercia
trips. These
Melbourne anand Moorabbura, Hamiltonparton, Albur
National 2
B
pacity and quort's curfew-f, Essendon atory as is acc
s is a concern
-leased airpoonwealth-lea
ndard at sma
ojects include
des at Melbo
s
including rual and retail
can be divid
nd Avalon aibin airports n, Swan Hill, ry-Wodonga,
2005
uality of infrasfree status. Inand Moorabbcess by publn.
orts ased airportsaller airports.
e:
ourne Airport
nways, termbuildings), ro
ed into the fo
rports
Sale, Bairns Mt Hotham,
National 2001
B
structure at ntegration ofbin airports wic transport t
s
t.
inals, buildinoads, drainag
ollowing
sdale, , Ballarat and
47
f with to
ngs ge
d

Transport
48
Table 4.1 identifies the passenger statistics for Victoria’s major airports in the last four years. Table 4.1: Passenger statistics for Victoria’s airports136
Total Revenue Passengers
Airport 2005/06 2006/07 2007/08 2008/09
Melbourne 21,040,864 22,156,871 23,943,342 24,448,326
Mildura 154,654 167,983 170,002 155,626
Essendon 7,558 6,883 16,235 14,545
Moorabbin 8,849 8,676 9,410 12,684
Portland 13,856 10,139 11,981 11,612
International freight data has shrunk from 197,083 tonnes in 2005/06 to 193,197 in 2008/09.137 Domestic freight data is held by cargo terminal operators and is not generally available.138 Melbourne Airport Melbourne Airport is owned and operated by Australia Pacific Airports Melbourne (APAM). It was acquired in 1997 and operates under a 50-year lease from the Australian Government, with an option for a further 49 years. Melbourne Airport is the second busiest airport in Australia for passengers and provides the main aviation hub for the southern part of the continent. It is a key component of Victoria’s transport infrastructure and contributes to the State’s economy through tourism, airfreight and business development. Despite the global economic crisis and pandemic (H1N1) 2009 influenza (swine flu), Melbourne Airport’s 2008/2009 passenger figures grew by 2.1% as seen in Table 4.2. Table 4.2: Melbourne Airport’s passenger figures139
2007/2008 (‘000) 2008/2009 (‘000) % Change
International 4,774 4,911 + 3%
Domestic 19.362 19.743 + 2%
Transit 123 119 - 4%
Total 24,259 24,772 + 2%
The Airport’s Master Plan (produced in 2008 and approved in 2009), stated that international passenger movements are expected to increase to between 9.3 and 12.3 million by 2027/28. Domestic passenger growth has been forecast to moderate over the next 20 years to between 34.6 million and 42.6 million in 2027/28. Total passenger movements are shown graphically in Figure 4.1.

Airports
49
Figure 4.1: Total passenger movements at Melbourne Airport from 2000/01 to 2027/28 (millions)140
Melbourne Airport accounts for 32% of the nation’s airfreight. It handles 350,000 tonnes of airfreight each year, placing it in the top 50 of world airports in terms of freight tonnage.141 Since 2003, Melbourne airport has made extensive investment in airfield and terminals expansion, road access, car parking, forecourt management and competitive food, beverage and retail stores. The international airport was extended for the 2006 Commonwealth Games and the runway widened and tarmacs upgraded for the A380 aeroplane. In January 2008, a $330 million, three stage project to double the size of the international terminal commenced. In 2009, a $60 million expansion was completed142 of Melbourne Airport’s car parking facilities, which provided an additional 2,300 spaces to the multi-level car park area in front of the Melbourne Airport terminal. Melbourne Airport is the first of three airports143 to have its air traffic control tower replaced under Airservices’ Stage 1 of the National Towers Program. This program involves replacing or upgrading Airservices’ 26 control towers throughout Australia. This investment is part of a Capital Expenditure Program of almost $900 million over five years and includes upgrading fire stations, communications and navigation infrastructure. Avalon Airport Avalon Airport commenced domestic passenger operations in 2004 after Linfox purchased a 100-year lease of Avalon Airport from the Commonwealth Government. Today it is the 11th largest airport in the country.144 Since 2004, around three million passengers have passed through Avalon’s terminals.145 The Avalon Airport is located on a 1,800 hectare site to the south of the Princes Highway, 18km north east of Geelong. The land surrounding the airport includes the townships of Lara and Little River, grazing, sewerage treatment works, quarrying, salt production and a Department of Defence armament facility.
0
10
20
30
40
50
60
2000/012001/022002/032003/042004/052005/062006/072007/082008/092009/102010/112011/122012/132013/142014/152015/162016/172017/182018/192019/202020/212021/222022/232023/242024/252025/262026/272027/28
Mill
ions
of P
asse
nger
Mov
emen
ts
Upper
Actual
Lower

Transport
50
The site is currently used as an intermodal freight hub, a domestic airport for Jetstar and other aviation services. Avalon Airport is working towards making the airport an international airfreight centre and already undertakes international airfreight movements, particularly for freight associated with major Melbourne events such as the Formula One Grand Prix. Avalon is the location for Qantas’s Boeing 747 maintenance base. As of early 2010, Avalon Airport is still in the process of applying to the Australian Government for the establishment of an international passenger terminal. The proposed development is a 7,300 m2 international passenger terminal with external areas for baggage handling facilities. The international terminal will include an entrance foyer, facilities for passenger security screening, customs, passport control, quarantine, passenger lounges, retail and cafe amenities. The proposed international passenger terminal will be located to the east of the existing domestic terminal.146 The development of Avalon Airport as Victoria’s second international gateway is a significant priority for the Government.147 In 2008, the Department of Defence rejected an application for a new international terminal at Avalon, supported by both the Victorian Government and the airport’s surrounding local government. The key challenge facing the airport is resolving the uncertainty about which planning arrangements will apply. Specifically, the Victorian Government understands that ‘that the Commonwealth may be considering regulating Avalon Airport under Commonwealth law’. However, the Victorian Government ‘understands that Avalon Airport wants more flexibility to be able to better respond to commercial opportunities as they arise and not be constrained by a Master Plan approach that is prescriptive in relation to various land uses and developments’.f Essendon Airport Essendon Airport is a general aviation and corporate jet airport situated at the intersection of the Tullamarine and Calder Freeways, 10km from Melbourne. Essendon Airport provides facilities and services for international and domestic corporate aircraft, aircraft maintenance, airfreight, aircraft charter and emergency air service providers. A curfew applies between the hours of 11pm and 6am.g In April 2009, the new $20.27 million Victorian Police Airwing and Air Ambulance Centre at Essendon Airport was opened. The facilities include a new apron, five hangars and ancillary support areas including offices, mess areas and maintenance facilities. Situated on 305 hectares, the airport has two runways, and comprises a significant mix of aviation and non-aviation activities.h 148 Essendon Airport is divided into five property developments and two aviation precincts. All commercial developments undertaken around the airport are coordinated by Essendon Fields.149 The Linfox Group and Beck Corporation acquired the lease for Essendon Airport from the Australian Government in 2001. The Commonwealth retains ownership of Essendon Airport, which
f Avalon Airport’s planning controls reflect the fact that it was a defence airport in the past. When Defence force activity ceased at Avalon Airport over two years ago, consistent with other inactive Defence-owned sites in Victoria, the State planning law has been applied to the airport. Previously, the site, as Commonwealth land, was identified as not controlled by Planning Scheme (CA). The site is therefore not affected by State planning controls and use and development on the site is not subject to the planning requirements of the Planning and Environment Act 1987, including the Greater Geelong Planning Scheme. Following concerns that a retail factory outlet similar to the Essendon Direct Factory Outlet (DFO) was to be built at Avalon Airport and this was contrary to the policy objectives of Melbourne 2030, and the current CA designation of the land would not require any planning approval for the use or development of the DFO, the State Government brought the area under the Greater Geelong Planning Scheme. http://www.scca.org.au/Pdf%20links/2006PDFlinks/Avalon%20Hulls%20Advice%20June06.pdf. g Aircraft movements are not permitted at Essendon Airport between the hours of 11pm and 6am except for propeller-driven aircraft with a maximum take off weight (MTOW) not exceeding 8,618 kilograms, unless the specific aircraft or aircraft type has been included in a Prohibited Aircraft Schedule. Exceptions are also granted to propeller driven aircraft with a MTOW exceeding 8,618 kilograms that have noise emissions that do not exceed 90 EPNdB on take off and 95 EPNdB on approach. Helicopters that comply with relevant noise levels, aircraft involved in an emergency, and the police air wing are also exempt (Air Navigation Regulations 2001). h The vision of Essendon Airport Pty Ltd is ‘to establish a commercially viable, safe and functional general aviation facility which meets projected aviation requirements and opportunities whilst utilising the property’s strategic land holdings for high quality commercial development’.

Airports
51
is leased for 50 years with a 49-year option. The lease requires Essendon Airport to continue operating the facility as an airport, and must develop the airport site at its own cost and expense, having regard to the actual and anticipated future growth in traffic demand for the airport site. There were 50,000 aircraft movements at the airport in 2008. During this decade, there has been an average decline in flight activity by approximately 5.3% per annum. The Master Plan predicts that this decline will stop and the number of flight movements will remain consistent for the future. Over the next 20 years, the average aircraft movements are expected to be within the range of 50,000 to 55,000 movements per annum.150 The approved 2008 Master Plan identified the following initiatives that may be pursued: Retention of the two-runway system The façade and internal improvement of the passenger terminal The development of general aviation and corporate jet hangars Further relocation and consolidation of aviation operations Redevelopment of existing commercial areas Improvement to road infrastructure.
The future of Essendon airport is contested. The airport owners intend to continue its aviation activities, including capitalising on the growing corporate jet market. However, the Victorian Government has stated they would like to have the airport closed in the medium term.151 The restrictions on aircraft weighti and curfew arrangements are currently preventing the airport from capturing more of the jet market. The airport’s commercial and retail development over the past few years has transformed the area into a major economic hub. However, as the development is outside local government planning control, it has resulted in large traffic volumes through residential streets, and significant traffic congestion on the Tullamarine Freeway. There is currently no public transport access into the airport.j In relocating aeronautical activities, in particular from the Bulla Precinct, aircraft have moved closer to the east side of the airport, the residential side. This has increased residential concerns of noise and health.k Regional airports Victoria has a network of regional airports that support passenger services, charter facilities and economic development by providing freight services. While some are high revenue-generating airports, such as Albury-Wodonga and Mildura, the majority make annual operating losses due to their high ongoing maintenance costs and low revenues. Unlike other States, Victoria has reasonable regional road and rail infrastructure that makes it difficult for regional airports to attract freight and passenger traffic. Increasingly, local governments are seeking State financial assistance for infrastructure upgrades.152 The Victorian Government supports airport infrastructure through the Regional Infrastructure Development Fund (Latrobe, Yarrawonga, Mallacoota and Stawell airports have received funding in the past) and the Small Towns Development Fund. In addition, the 2008 Victorian Transport Plan allocated $20 million for regional airport upgrades.153 Recent Government regional airport funding has included:
i Land aircraft above 45,000 kilograms maximum take off weight. j The Airport West tram route has two stops situated near the Western perimeter of the airport along Matthews Avenue. This route provides direct access to the city and connection to the Essendon Railway Station. k The creation of a mixed-use activity centre might be supported by the Victorian Government depending on the successful resolution of issues of public transport access (such as linking to the Principal Public Transport Network), and its role in the network of Activity Centres in the region. http://www.dse.vic.gov.au/melbourne2030online/content/policies_initiatives/04c_policy43.html.

Transport
52
Mildura airport to help facilitate Virgin to fly in and out of Mildura, aimed at expanding tourism Ballarat to help facilitate industrial land development around the airport Yarrawonga to assist in industrial developments.
4.2.2 Policy and governance The Victorian Government has made airports, aviation and the aviation sector a priority. This is because it recognises that they have both direct and indirect benefits. Their direct benefits include that they provide transport services that generate significant direct economic activity, employment and expert revenue, as well as enhance the quality of life. They also are becoming major centres of activities in their own right with clusters of retail, commercial and both on airport property and around them. They also facilitate indirect economic activity as direct flights are identified as a key driver of investment, trade, tourism and international education. Of particular importance is attracting international air services. This is why the government has allocated $8 million over four years to further boost its international marketing and air services attraction capacity, continues to advocate for further liberalisation of international air access, and works to make Avalon Airport Victoria’s second international airport.154 The Victorian Government has an aviation policy but this is not publicly available. As of early 2010, the Victorian Government is exploring developing a new policy and strategy. All airports are governed by the Commonwealth Air Navigation Act 1920 and the Aviation Transport Security Act 2004. Airports leased from the Commonwealth come under the Airports Act 1996. Airports owned by the Commonwealth are subject to additional Commonwealth legislation provisions, and (with the exception of Avalon) are not subject to other State legislation. On-airport planning at Commonwealth-leased airports is defined by an airport’s Master Plan. Master plans must be developed by the new airport operators within a prescribed period to cover the next twenty years and reviewed and updated at no more than five-yearly intervals. Master plans are required to be approved by the Minister for Infrastructure. Major development plans are required for certain types and scale of developments, such as runway extensions, terminal expansions and capital works over $10 million. While the use of master plans is the basis for planning considerations on airports, these stop at airport boundaries and have little, if any, influence off-airport.155 The regulations and planning policies that influence off-airport planning decisions vary depending on whether or not they are Commonwealth-leased airports, defence airports or airports that come under the State planning regimes. All airports not owned by the Commonwealth are subject to State legislation. The Victorian Government advises airport operators and local governments on the appropriate use of the Victorian planning provision overlays covering aerodrome environments. In December 2009, the Australian Government released the National Aviation Policy White Paper. This will drive an improvement in the better integrated planning at Commonwealth-leased airports by: Requiring each capital city airport to establish a Planning Coordination Forum, which will act as
the vehicle to lead the ongoing discussions between the airports and the three levels of government on issues including the Master Plans, the airport’s program for proposed on-airport developments, regional planning initiatives, off-airport development approvals and significant ground transport developments that could affect the airport and its connections.
Requiring airports to produce more detailed Master Plans that will have to contain:

Airports
53
additional detail on proposed use of land in the first five years of a Master Plan, including information on planning for each non-aviation precinct, the number of jobs likely to be created, anticipated traffic flows, and the airport’s assessment of the potential impacts on the local and regional economy and community
the inclusion of a ground transport plan in the Master Plan the inclusion of a more detailed analysis of how the Master Plan aligns with State, Territory
and local government planning laws, as well as a justification for any inconsistencies. Requiring all airports to establish and lead Community Aviation Consultation Groups to ensure
that local communities have direct input on airport planning matters, with appropriate arrangements for engagement with other industry stakeholders such as airlines and Airservices Australia where necessary.
Prohibiting incompatible developments on federal airport sites, such as residential developments and schools, unless exceptional circumstances exist.
Developing a number of initiatives to safeguard both airports and communities from inappropriate off-airport developments which could threaten public safety and the future viability of aviation operations. These would include working with the jurisdictions on national land use planning regimes near airports.156
Key multi-jurisdictional bodies and government agencies are: Civil Aviation Safety Authority (CASA). CASA is an independent statutory authority
established in 1995 under the Civil Aviation Act 1988 to regulate aviation safety in Australia and the safety of Australian aircraft overseas.
Airservices Australia. Airservices Australia is the monopoly provider of air traffic management and fire fighting services at Australia’s major civil airports.
Commonwealth Department of Infrastructure, Transport, Regional Development and Local Government. The Department has a policy advisory role in aviation and provides advice to the Government on the Commonwealth’s aviation agencies’ strategic direction, their financial and operational performance, and their governance framework. The Department also has a role in leading the development and publishing of major future air traffic policy directions to give effect to the Government’s decisions, as well as leading and coordinating the implementation review processes.
Australian Competition and Consumer Commission (ACCC). The ACCC is responsible for the financial and service quality monitoring at five capital city airports including Melbourne.
Department of Innovation, Industry and Regional Development (DIIRD). DIIRD is responsible for the Regional Infrastructure Development Fund (RIDF) that provides funding for capital works to enhance the development of rural and regional Victoria, including funding to boost regional tourism by providing infrastructure upgrades to regional airports across Victoria.
4.2.3 Sector trends Increasing passenger movements and air freight volumes The Bureau of Infrastructure, Transport, and Regional Economics predicts that passenger movements through all airports will increase by 4% per annum over the next 20 years resulting in a doubling of passenger movements over the period. Each master plan provides forecasts of passenger demand for their airport. Melbourne Airport has sufficient terminal space to meet the predicted increasing international passenger demand until 2020.157 A new third runway is not expected to be required earlier than 2020.158 There is sufficient available land at both Melbourne and Avalon airports to grow their operations as planned. International airfreight represents 0.1% of Australia’s total physical exports in tonnes but represents 25% of physical exports by value. About 90% of airfreight is carried in the hold of passenger jets.159

Transport
54
Victorian airfreight represents up to a quarter of all Australian airfreight by value.160 In 2006, Melbourne Airport exported 84,060 international tonnes of airfreight worth an estimated $3.6 billion, and imported 124,004 tonnes worth $10.4 billion. This amounts to 208,064 tonnes of international airfreight, valued in excess of $14 billion. Melbourne Airport has more than 30% of Australia’s airfreight market.161 Melbourne’s international airfreight is well balanced, with 59% of airfreight being imports, leading to greater utilisation of aircraft and the ability to minimise the risk associated with empty back loading. In addition, Melbourne Airport achieves greater utilisation levels by international aircraft (8.2 tonnes per aircraft) than other Australian airports leading to more tonnage being moved per aircraft.162 The future growth of airfreight tonnage will be directly influenced by the number of international airlines operating at Melbourne Airport and the destinations they service. It is anticipated that Melbourne’s airfreight volumes will grow in response to initiatives to gain additional international flights and destinations.163 Melbourne Airport has five dedicated airfreighter positions on its Southern Freighter Apron, ensuring significant capacity for growth in airfreight over the next decade.164 Conflicts between on-airport development and off-airport land-use planning The State Government and local government have no control over land-use planning decisions on Commonwealth-leased airports. This has led to on-airport developments that do not mesh with local development and infrastructure plans. The problem arises because the Airports Act 1996, which applies to the airports, diminishes the ability of the States and local government to ensure that airport development conforms with broader planning strategies. Specifically, the Act results in airport development plans being exempt from State planning legislation. It only requires airport owners to involve State and local governments in airport planning via seeking comments on draft master plans on a five-yearly cycle. This problem is well recognised and resulted in the undermining of the State’s land-use policy to concentrate development in activity centres, and freight and logistics precincts. An example of inappropriate development has been certain projects at Essendon and Moorabbin airports. While attracting significant numbers of customers, the Direct Factory Outlet (DFO) sites have inadequate vehicle access, car parking and public transport access, and have unsafe pedestrian access. They have also caused a loss of business in nearby areas. An example of this is the Essendon airport where its DFO draws on local catchments of surrounding activity centres at Keilor Road, Niddrie, Westfield, Airport West, Moonee Ponds and North Essendon, thereby adversely affecting the viability of businesses in these areas.165 There are examples of airport operators of Commonwealth-leased airports working to ensure that on- and off-airport developments mesh. An example of this is the new north-south connector road to be built at Moorabbin Airport. This road, entirely located upon airport land, will be open to the public and will provide an essential north-south road link between Centre Dandenong Road and Lower Dandenong Road and importantly, a south/western entry point to the airport providing improved access to terminal and operational facilities. This development was planned in consultation with Vic Roads.166 The State Government believes that the planning problems are best addressed if there is a formal integration of airport planning and development with the surrounding area’s existing planning system. Making non-aeronautical developments on airports subject to the same assessment process would not only create a level playing field between on- and off-airport uses, it would also ensure that non-aeronautical airport development will deliver a net community benefit.

Airports
55
Major airports becoming Airport Cities A global trend is for major airports to become major business areas that integrate air facilities with business, industrial and commercial developments. This builds on the historical concept that key transport nodes (such as coastal and river ports and railway towns) have become major commercial centres. In Victoria, this is occurring at Melbourne, Essendon and Moorabbin airports. Airports are no longer just a key piece of transport infrastructure; they are becoming destinations in their own right and are becoming Airport Cities. The challenge for airports in achieving this goal includes: Simultaneously meeting both the growing demand for air passengers and freight, and the
demand for other non-aeronautical functions due to commercial and retail developments Ensuring that they have sufficient on-airport infrastructure to meet demand Ensuring that there is sufficient off-airport infrastructure to allow transport to and from airports to
operate efficiently Preventing or minimising inappropriate creep of residential developments towards the airport
boundary which could compromise the operations of the airport Minimising noise and other environmental complaints by those living close to the airport from
air, road and rail movements.
4.3 Performance
4.3.1 Aviation safety Table 4.3 provides details on air accidents and fatal accident statistics for Victoria 1999–2009. Table 4.3: Non–fatal and fatal accidents in Victoria, 1999 to 31 March 2009167
Victoria 1999 2000 2001 2002 2003 2004 2005 2006 2007 2008 2009 Total
Non–fatal Accidents
26 25 20 15 20 21 12 10 17 19 8 193
Fatal accidents
2 3 3 2 0 4 3 3 5 2 2 29
Fatalities 5 4 4 3 0 12 5 4 9 2 2 50
4.3.2 On-time arrivals Only two Victorian airports are monitored for punctuality and reliability by the Bureau of Infrastructure, Transport and Regional Economics (BITRE), and these are listed in Table 4.4.168 Table 4.4: On-time arrivals and departments for 2008169
Airport Percentage On-time Arrivals Percentage On-time Departures
Melbourne 82.9 82.8
Mildura 76.1 85.9
To put these figures in perspective, in December 2009 Proserpine Airport recorded the highest percentage of on-time departures (95.1%), while Coffs Harbour recorded the lowest (71.1%). Proserpine Airport also recorded the highest percentage of on-time arrivals (95.1%), while Coffs Harbour Airport also recorded the lowest (73.9%).
4.3.3 Quality of service Melbourne Airport is the only Victorian airport required to report on its quality of service to the ACCC.170 Quality of service includes subjective measures such as surveys of airport users’ perceptions and objective measures such as check-in waiting times. As seen in the Figure 4.2 below, over the entire reporting period (2003–04 to 2007–08), Melbourne airport’s overall rating

Transport
56
was stable at around 3.55 (satisfactory) out of 5 on average, although airside services’ overall rating decreased from 3.82 in 2005–06 to 3.51 in 2007–08. Figure 4.2: Melbourne Airport—overall quality of service ratings for international and domestic terminal services, and airside services171
In 2007 (awarded in 2008), Melbourne Airport was named in the top five for airports that handle between 15 and 25 million passengers in the Airports Council International (ACI) Airport Service Quality Survey.172 The survey interviewed nearly 200,000 passengers across the world and is the largest review of passengers’ opinions of its kind. The survey measured overall passenger experience at each airport on 34 different parameters, including key issues such as ease of access, staff courtesy, terminal connection times and value for money. It was not a winner in 2008 (awarded in 2009).173
4.3.4 Security Following the terrorist incidents on 11 September 2001, the Australian Government introduced additional security requirements, notably through the Aviation Transport Security Act 2004 and the Aviation Transport Security Regulations 2005, at Australian airports including: Increased Australian Federal Police presence at airports 100% checked bag screening for all international flights Screening of all domestic checked bag at major airportsl Limiting liquids, aerosols and gels on international flights.m
While security requirements are determined by the Australian Government, airports have the ability to enhance their operational effectiveness via coordination with police, security operators, and airlines. The additional security measures, notably the requirement of 100% checked bag screening, contributed to the increase in airports’ costs during 2004–05. Costs incurred included the equipment to screen passengers and checked baggage, and the installation of overt and covert closed-circuit television security cameras.174 Future security priorities of airports will be to: Extend security along the supply chain to address the security risk of freight Expand the counter-terrorism focus of security measures to address other forms of criminal
behaviour at airports.
l Came into effect in 2006. m New legislation, notably Aviation Transport Security Act 2004 and the Aviation Transport Security Regulations 2005.

Airports
57
4.3.5 Environmental sustainability Commonwealth-leased airports are required to prepare and maintain an Airport Environment Strategy (AES) which is reviewed and updated every five years. The main intent of an AES is to demonstrate to the Australian Government, key stakeholders and the surrounding community how an airport will manage environmental issues on the airport for that five-year cycle. The Act requires that an airport undertakes consultation with key stakeholders and the community prior to submission of the AES to the Government. Environmental issues on the leased airports are administered principally by Australian legislation, the Airports Act 1996, the Airport (Environment Protection) Regulations 1997 and the Airport (Building Control) Regulations 1997. The Airport Building Controller (ABC) and the Airport Environment Officer (AEO) are the on-site regulatory representatives for the Australian Department of Infrastructure, Transport, Regional Development and Local Government (DITRDLG) who administer the Act and Regulations on behalf of the Australian Government. The larger airports, by their very nature of operations, tend to produce noise and hydrocarbons from aircraft. As such, the implementation of various elements of the environment strategy is important in displaying a proactive approach to manage the impact on the environment. The AESs prepared for Melbourne, Avalon, Essendon and Moorabbin airports address the following issues and propose monitoring and mitigation strategies: Air quality Soil quality Water quality Noise emissions Waste Flora and fauna Waste management Heritage considerations.
The smaller airports, including the rural and remote areas, do not normally prepare such detailed documents for their facilities. However, they have procedures in place for more immediate environmental issues such as fuel spills. Greenhouse gas mitigation Civil aviation accounts for about 2% of global emissions and this is expected to rise due to growth in the aviation sector. Ways to reduce emissions include improving aircraft fuel efficiency and air traffic management such as continuous descent approaches. A challenge for aviation sector will be the impact of the ETS. If it results in subsidies for alternative modes of travel (e.g. fuel credit for heavy on-road transport businesses), there is a risk that the exclusion of the aviation industry from comparable assistance may have the effect of creating a structural competitive distortion in the market for passenger travel and freight. Major airports are actively involved in reducing greenhouse gas emissions by enhancing building energy efficiency, working to provide increased public transport and reducing road congestion. For example, Moorabbin Airport considered Ecologically Sustainable Development (ESD) principles in their buildings, such as energy efficiency, natural ventilation, orientation, glazing shading and water harvesting.175An important driver by airport owners to reduce greenhouse gas emissions of their buildings is to position their assets as having low environmental impacts in order to attract environmentally-conscious tenants.

Transport
58
By the end of 2009, Melbourne Airport will have identified its carbon footprint. Melbourne Airport has stated that it will continue to undertake initiatives to ensure that airport expansion achieves a 25% reduction in energy usage per square metre of managed and controlled terminal areas by 2013.176 No work has been specifically identified by Victorian airports targeted at climate change adaptation. Noise Noise concerns from airports have resulted in the imposition of curfews at Essendon airports, and restriction of land use around Avalon and Melbourne airports to ensure that they can operate curfew-free. The Victorian Government supports the continuation of both Melbourne and Avalon airports’ curfew-free status.
4.4 Future challenges The challenges in achieving improvements in airport infrastructure are: Aligning on-airport development with local land-use plans. Past development at
Commonwealth-leased airports have lead to on-airport retail and commercial development that has caused significant problems for commuters, off-airport businesses and airport users. The cause of this is outside the Victorian Government's control and will require Commonwealth intervention to prevent this from occurring in the future.
Meeting long-term passenger and freight growth. In the short and medium term, there is sufficient capacity at Melbourne Airport to meet expected growth. In the longer-term, an additional runway will be needed. This may require the Commonwealth to acquire land as it is a Commonwealth-leased airport. The Victorian Government has noted that ‘in the recent past the Commonwealth has declined to accept responsibility for acquiring the private properties that will be required to develop the future runway’.177 Once Melbourne Airport has reached its capacity in several decades, the development of additional airports to augment Melbourne Airport as a freight and passenger hub will be required.178 Options include expanding an existing airport, such as Avalon, or developing a new airport in greater Melbourne.
Maintaining the financial viability of regional airports. Larger regional airports have the capacity to meet the slowly-growing regional passenger and freight needs. However, additional State Government support for development will be required if there are significant new nearby tourist developments or additional freight tasks. Upgrading of these airports is occurring on an as-needed basis, via RIDF.179 However, a challenge for many regional airports is funding the maintenance of ageing infrastructure. There is a growing gap between the funding need and the airport revenue. For example, the Registered Aerodromes operated by the Swan Hill Rural City Council during the period 2006-2010 have an anticipated total expenditure of $693,000 with an income of $85,000, with the difference funded by rates, reserves and loans.180 The long-term viability of smaller regional airports will depend on ongoing government financial support.
4.5 Report Card rating
Infrastructure type Victoria 2010 Victoria 2005 National 2005 National 2001
Airports B Not rated B B
Based on considerations of planning, funding, and infrastructure capacity and condition, Victoria’s airport infrastructure has been rated B. This rating recognises the considerable improvement in capacity and quality of infrastructure at Melbourne Airport, and the maintenance of Melbourne Airport's curfew-free status. Integration of commercial/industrial developments pursued by Melbourne, Essendon and Moorabbin airports with those developed by nearby local governments
Airports
59
is unsatisfactory as is access by public transport to all airports. The ongoing viability of smaller regional airports is a concern. Positives that have contributed to the rating are: Upgrades at Melbourne Airport and Avalon Airport Protection of Melbourne Airport's curfew-free status Prevention of urban encroachment around Melbourne Airport.
Negatives that have contributed to the rating are: Inappropriate on-airport development at Commonwealth-leased airports Financial challenges in maintaining the infrastructure at smaller regional airports Failure to advance planning for the rail link to Melbourne Airport Uncertainty about the future growth of Avalon Airport.

Transport
60