form 10-k cyanotech corporation - russell communications group
TRANSCRIPT

UNITED STATES SECURITIES AND EXCHANGE COMMISSION
Washington, D. C. 20549
FORM 10-K
ANNUAL REPORT PURSUANT TO SECTION 13 OR 15(d) OF THE SECURITIES EXCHANGE ACT OF 1934
For the Fiscal Year Ended March 31, 2005 Commission File Number 0-146-02
CYANOTECH CORPORATION (Exact name of registrant as specified in its charter)
Nevada 91-1206026 (State or other jurisdiction of (I. R. S. Employer incorporation or organization) Identification No.) 73-4460 Queen Kaahumanu Highway, Suite 102, Kailua-Kona, Hawaii 96740 (Address of principal executive offices) (Zip Code)
Registrant’s telephone number, including area code: (808) 326-1353
Securities registered pursuant to Section 12(b) of the Act: None
Securities registered pursuant to Section 12(g) of the Act:
Common Stock, $.005 par value
(Title of Class)
Indicate by check mark whether the Registrant (1) has filed all reports required to be filed by Section 13 or 15(d) of the Securities Exchange Act of 1934 during the preceding 12 months (or for such shorter period that the Registrant was required to file such reports), and (2) has been subject to such filing requirements for the past 90 days. Yes [ √ ] No [ ] Indicate by check mark if disclosure of delinquent filers pursuant to Item 405 of Regulation S-K is not contained herein, and will not be contained, to the best of Registrant’s knowledge, in definitive proxy or information statements incorporated by reference in Part III of this Form 10-K or any amendment to this Form 10-K. [ √ ] Indicate by check mark whether the Registrant is an accelerated filer (as defined in Rule 12-b of the Act). Yes [ ] No [ √ ] The aggregate market value of the Registrant’s Common Stock held by non-affiliates of the Registrant on June 24, 2005 was approximately $16,284,000 based on the closing sale price of the Common Stock on the NASDAQ SmallCap Market on that date. Number of shares outstanding of Registrant’s Common Stock at June 24, 2005 was 20,269,000.
DOCUMENTS INCORPORATED BY REFERENCE Portions of the Registrant’s Definitive Proxy Statement for its 2005 Annual Meeting of Stockholders, to be filed with the Securities and Exchange Commission on or prior to July 15, 2005 and to be used in connection with the Annual Meeting of Stockholders expected to be held on August 22, 2005, are incorporated by reference in Part III of this Form 10-K.
1

TABLE OF CONTENTS Item Page
PART I 1. Business……………………………………………………………………………………. 3 2. Properties…………………………………………………………………………………... 9 3. Legal Proceedings………………………………………………………………………….. 9 4. Submission of Matters to a Vote of Security Holders……………………………………… 9
PART II
5. Market for Registrant’s Common Equity and Related Stockholder Matters………………. 10 6. Selected Financial Data…………………………………………………………………….. 10 7. Management’s Discussion and Analysis of Financial Condition and Results of Operations 11 7a. Quantitative and Qualitative Disclosures About Market Risk……………………………… 18 8. Financial Statements and Supplementary Data…………………………………………….. 19 9. Changes in and Disagreements with Accountants on Accounting and Financial Disclosure 35 9a. Controls and Procedures……………………………………………………………………. 35
PART III
10. Directors and Executive Officers of the Registrant………………………………………… 35 11. Executive Compensation…………………………………………………………………… 35 12. Security Ownership of Certain Beneficial Owners and Management……………………… 35 13. Certain Relationships and Related Transactions…………………………………………… 35 14. Principal Accounting Fees and Services……………………………………………………. 35
PART IV
15. Exhibits, Financial Statement Schedules, and Reports on Form 8-K………………………. 36
Signatures…………………………………………………………………………………… 40
2

PART I Item 1. Business General Cyanotech Corporation is a world leader in the production of high value natural products derived from microalgae. Incorporated in 1983, the Company is guided by the principle of providing beneficial, quality microalgal products for human and animal nutrition in a sustainable, reliable and environmentally sensitive operation. We are ISO 9001:2000 compliant, reinforcing our commitment to quality in our products, to quality in our relationships (with our customers, suppliers, co-workers and the communities we live in), and to quality of the environment we work in. The Company’s products include:
• BioAstin® natural astaxanthin, a powerful antioxidant with expanding application as a human nutraceutical in areas such as enhanced immune response, sunburn protection and relief from pain and inflammation caused by conditions such as carpal tunnel syndrome and rheumatoid arthritis;
• NatuRose® natural astaxanthin, used as a feed ingredient for the aquaculture feed industry, specifically providing natural pigmentation to aquaculture-raised shrimp, salmon, yellowtail tuna and “tai” (red sea bream), and for the animal feed industry such as in poultry feed formulations to naturally pigment the yolk of chicken eggs;
• Spirulina Pacifica®, a nutrient-rich dietary supplement used for extra energy, a strengthened immune system and as a source of antioxidant carotenoids; and
• Natural phycobiliproteins, highly fluorescent pigments used as tags or markers in many kinds of biological assays in the immunological diagnostics market.
Microalgae are a diverse group of microscopic plants that have a wide range of physiological and biochemical characteristics and contain, among other things, high levels of natural protein, amino acids, vitamins, pigments and enzymes. Microalgae have the following properties that make commercial production attractive: (1) microalgae grow much faster than land grown plants, often up to 100 times faster; (2) microalgae have uniform cell structure with no bark, stems, branches or leaves, permitting easier extraction of products and higher utilization of the microalgae cells; and (3) the cellular uniformity of microalgae makes it practical to manipulate and control growing conditions in order to optimize a particular cell characteristic. Efficient cultivation of microalgae requires consistent light, warm temperature, low rainfall and proper chemical balance in a very nutrient-rich environment. If the chemical composition of a pond changes from its required balance, contamination can occur as a result of the growth of unwanted organisms.
Since 1983, we have designed, developed and implemented proprietary production and harvesting technologies, systems and processes resulting in the elimination of many of the stability and contamination problems frequently encountered in the production of microalgae. Our capacity to produce these products at our 90-acre facility on the Kona Coast of Hawaii provides significant advantages. We selected the Keahole Point location in order to take advantage of the consistent warm temperatures, abundant sunshine and low levels of rainfall needed for optimal cultivation of microalgae. This location also offers us access to cold deep ocean water, drawn from an offshore depth of 2,000 feet, which we use in our patented Ocean-Chill Drying system to eliminate the oxidative damage caused by standard drying techniques and as a source of trace nutrients for microalgal cultures. We believe that our technology, systems, processes and favorable growing location permit year-round harvest of our microalgal products in a cost-effective manner.
Unless otherwise indicated, all references in this report to the “Company,” “we,” “us,” “our,” and “Cyanotech” refer to Cyanotech Corporation and its wholly owned subsidiaries, Nutrex Hawaii, Inc. (“Nutrex Hawaii” or “Nutrex”), a Hawaii corporation, and Cyanotech Japan YK (“Cyanotech Japan” or “CJYK”), a Japan corporation.
3

Cyanotech’s Business
The Company operates entirely in one operating segment, the cultivation and production of microalgae into high-value, high-quality natural products. The Company currently cultivates, on a large-scale basis, two microalgal species from which our two major product lines, spirulina products and natural astaxanthin products, are derived. Cyanotech records revenue and cost of sales information by product category but does not record operating expenses by such product category. The following table sets forth, for the three years ended March 31, 2005, the net sales contributed by each of the Company’s product lines (in thousands):
Net Sales 2005 2004 2003 Spirulina products: Spirulina Pacifica $ 6,626 $ 6,511 $ 6,181 Natural astaxanthin products: NatuRose 1,817 2,545 1,301 BioAstin 2,855 2,388 1,312 Other including phycobiliproteins 147 138 157 Total $ 11,445 $ 11,582 $ 8,951 Spirulina Products Since 1985, Cyanotech has been producing a strain of spirulina microalgae marketed as Spirulina Pacifica. Accounting for 58%, 56% and 69% of net sales for the years ended March 31, 2005, 2004, and 2003, respectively, Spirulina Pacifica provides a vegetable-based, highly absorbable source of protein, natural beta-carotene, mixed carotenoids, B vitamins, gamma linolenic acid, essential amino acids and other phytonutrients. Spirulina Pacifica is produced in three forms: powder, flake and tablets. Powder is used as an ingredient in nutritional supplements and health food drinks while flakes are used as a seasoning on various foods. Tablets are consumed as a daily dietary supplement. All three forms are sold as raw material in bulk quantities and as packaged consumer products under the Nutrex Hawaii label.
Since 1994, we have produced two grades of Spirulina Pacifica: an all-natural grade cultivated by using conventional agricultural fertilizers and an organic grade that is cultivated using only organic fertilizers. Our organic Spirulina Pacifica is grown and processed in accordance with the National Organic Program of the United States Department of Agriculture (“USDA”) effective October 2002. Prior to the establishment of the USDA organic standard, our organic standard was the California Organic Food Act of 1990. Our organic cultivation and processing methods are certified annually by Quality Assurance International of San Diego, California, a leading third-party agency. In addition to such organic certification, both grades of Spirulina Pacifica are certified Kosher by Organized Kashrus Laboratories of Brooklyn, New York and are cultivated without the use of herbicides or pesticides. In its 2002 decision the USDA National Organics Standards Board (“NOSB”) allowed the use of certain fertilizers in organic Spirulina cultivation through October 2005, after which all cultivators must find alternate sources of key nutrients in order to retain organic certification. The Company has determined that although alternative fertilizers exist, the costs are prohibitive. Other cultivators in the United States have reached similar conclusions. If the USDA-NOSB does not extend the use of certain fertilizers for organic Spirulina cultivation at its October 2005 meeting, the Company plans to discontinue cultivating organic Spirulina and will convert all Spirulina cultivation to all-natural. The Company does not expect this decision to have a material effect on overall sales of our Spirulina Pacifica products.
In March 2003, Cyanotech and Earthrise Nutritionals, Inc. of Petaluma, California submitted a joint notice to the United States Food and Drug Administration (“FDA”) reporting their determination, through scientific procedures, that the spirulina cultivated by both companies is GRAS (generally recognized as safe) for addition to a variety of foods. In November 2003, the FDA concluded the notification procedure by written response that it had no questions about the companies’ determination that spirulina is GRAS for addition to a variety of foods.
Our Spirulina Pacifica is cultivated in a combination of fresh water and a metered amount of nutrient-rich deep ocean water (containing essential trace elements), drawn from a depth of 2,000 feet below sea level. This water mixture is supplemented with the other major required nutrients such as sodium bicarbonate (baking soda) and infused with carbon dioxide. With the exception of deep ocean water, the raw materials and nutrients required in our spirulina production are available from multiple sources; however, there can be no assurance that the pricing from a new source will be comparable to current pricing. In the case of deep ocean water, although abundantly available at this location, the facility to pump and deliver the water to the Company is owned by the State of Hawaii.
4

The facility is constructed of two separately located pump stations providing redundancy should one station fail. The State of Hawaii sets the price for deep ocean water annually based on its cost to deliver the water. If the pricing for a critical raw material or nutrient significantly increases, this could have a material adverse effect on our business, financial condition and results of operations. The ability of the Company’s suppliers to meet performance and quality specifications and delivery schedules is important to operations.
Continuing the production process, the spirulina crop in each pond is circulated by paddlewheels to keep an even blend of nutrients in suspension and a uniform exposure of the algae to sunlight. Our ponds are engineered to maintain the right media depth for sunlight to permeate each crop completely, facilitating rapid growth. The design of our cultivation ponds promotes efficient growing conditions, allowing the Spirulina Pacifica algae to reproduce rapidly. Each pond can be harvested, on average, in six days. As sunlight is a major component of cultivation, production can be impacted from seasonality changes during the winter months, with shortened daylight hours and potential inclement weather.
Once ready for harvest, some 70% of the spirulina algae is pumped from a pond through underground pipes to our processing building where the crop is separated from the culture media by stainless steel screens. The remaining culture serves as an inoculum for the next growth cycle. Harvested spirulina is washed with fresh water and vacuum filtered before moving to the drying stage. Culture media separated from spirulina algae during processing is conserved and recycled. Recycled media is refortified with nutrients before being returned to the culture ponds for another cycle of cultivation. Our Integrated Culture Biology Management (“ICBM”) technology for microalgae cultivation has proven to be a reliable and stable operating environment, allowing us to grow and harvest spirulina without significant contamination by unwanted microorganisms and without associated loss of productivity.
Spirulina Pacifica powder is dried via our patented low-oxygen Ocean-Chill Drying process, thereby preserving high levels of antioxidant carotenoids and other nutrients sensitive to heat and oxygen. This process also allows us to recover carbon dioxide from our drying system gas to be reused as a raw material back in our growing ponds. The drying process takes about six seconds and results in a dark green powder. Spirulina powder is difficult to form into tablets. Most tablet manufacturers either add high amounts (from 10% to 30%) of inert substances to “glue” the tablet together or use a heat granulation process that destroys nutrients. In contrast, our Spirulina Pacifica tablets (except for our Hawaiian Energizer label) contain a maximum of 2% of such substances and are produced in cold press compression tablet-making machines. Our Spirulina Pacifica flakes are produced by combining freshly harvested Spirulina Pacifica with food-grade lecithin and drying this blend in a proprietary system.
Each production lot of Spirulina Pacifica is sampled and subjected to thorough quality control analyses including testing for moisture, carotenoids, minerals, color and taste, among others. Further, each lot of our Spirulina Pacifica undergoes a prescribed set of microbiological food product tests, including total aerobic bacteria, coliform bacteria and E. coli. The Spirulina Pacifica powder, tablets and flakes are vacuum-sealed in oxygen-barrier foil laminate bags along with a packet of oxygen absorbent. This packaging ensures product freshness and extends the shelf life of bulk Spirulina Pacifica products. The Company’s packaged consumer products are bottled and labeled by two contractors in California. These contractors are organic and Kosher certified, subject to regular government inspections. Such packaging services are readily available from multiple sources.
The majority of our bulk spirulina sales are to health food manufacturers and formulators with their own spirulina product lines, many of whom identify and promote Cyanotech’s Hawaiian Spirulina Pacifica in their products. Such customers purchase bulk powder or bulk tablets and package these products under their brand label for sale to the health and natural food markets. Many of the brands produced by these customers are marketed and sold domestically in direct competition with the packaged consumer products sold through our Nutrex Hawaii subsidiary. Nutrex Hawaii packaged consumer products are sold through an established health food distribution network in the domestic market and shipped through one of our wholesale distributors. In selected foreign markets, we have exclusive sales distributors for both our bulk and packaged consumer products.
Our Spirulina Pacifica products compete with a variety of vitamins, dietary supplements, other algal products and similar nutritional products available to consumers. The nutritional products market is highly competitive and includes international, national, regional and local producers and distributors, many of whom have greater resources than Cyanotech and many of whom offer a greater variety of products. Our direct competition in the spirulina market is currently from Dainippon Ink and Chemical Company’s Earthrise facility in California and several farms in China. Other competitors include numerous smaller farms in China, India, Thailand, Taiwan, Cuba, South Africa and South America. The market for spirulina is mature with slow growth expected in future periods. In this mature market, the Company has experienced increased price competition due to more spirulina suppliers as well as a larger portion of sales coming from bulk product orders whose customers generally treat these products as commodities
5

with price being the major determining factor driving their purchasing decision. As one of the largest producers of spirulina, our challenge is to increase our market share among customers who seek the high-quality products we produce while concurrently adjusting our product mix to meet our revenue targets. The backlog of all Spirulina products totaled $ 661,000, $334,000 and $266,000 as of March 31, 2005, 2004 and 2003, respectively.
Natural Astaxanthin Products The Company commenced commercial production of natural astaxanthin in early 1997 with the introduction of NatuRose to the aquaculture market. Astaxanthin is a red pigment used in the aquaculture market primarily to impart a pink to red color to the flesh of commercially raised fish and shrimp but also has been found to be essential for their proper growth and survival. Since its introduction, several feeding trials have been performed by our customers and potential customers that prove the efficacy of NatuRose as an alternative to the petrochemical-based synthetic astaxanthin presently used by most aquaculture companies. The appeal of our product is that it is derived from a natural source and produces results that are comparable, or in some cases superior, to synthetic astaxanthin. Sold in bulk quantities as a powder, NatuRose sales accounted for 16%, 22% and 14% of net sales for the years ended March 31, 2005, 2004 and 2003, respectively.
In 1999, our natural astaxanthin product for the human nutrition market, BioAstin, was introduced. BioAstin sales accounted for 25%, 21% and 15% of net sales for the years ended March 31, 2005, 2004 and 2003, respectively. BioAstin is produced in three forms: a liquid lipid extract, gelcaps and microencapsulated “beadlets” with all three forms sold in bulk quantities. BioAstin gelcaps are also sold in packaged consumer form under the Nutrex Hawaii label. A growing body of scientific literature is suggesting that the beneficial antioxidant properties of natural astaxanthin may surpass many of the antioxidant properties of vitamin C, vitamin E, beta-carotene and other carotenoids. Independent scientific studies indicate that in certain models, natural astaxanthin has up to 550 times the antioxidant activity of vitamin E and 10 times the antioxidant activity of beta-carotene.
The Company produces natural astaxanthin from Haematococcus pluvialis microalgae grown in fresh water supplemented with nutrients. As these algae are extremely susceptible to contamination by unwanted algae, protozoa and amoebae, the Company developed a proprietary system known as the PhytoDome Closed Culture System or PhytoDome CCS to overcome this problem. Using these large-scale photobioreactors, we are able to grow consistently large volumes of contaminant-free Haematococcus culture. Raw materials and nutrients for our natural astaxanthin production share the same sourcing constraints and pricing risks as those existing in our spirulina production. Fresh water is critical to the production of our natural astaxanthin and is supplied by the County of Hawaii. While the Company has not experienced any constraint on fresh water availability to date, availability could be impacted by a significant population growth in the region as well as throughput constraints on the water delivery infrastructure. The Company has met with officials of the County of Hawaii to assess the fresh water situation and evaluate the probability of future risks. The Company recycles fresh water in its production process where possible and continues to explore further recycling opportunities. However, there is no guarantee that these efforts will result in significant changes to our fresh water utilization.
For the final stage of cultivation, the Haematococcus algae is transferred to open ponds where an environmental stress is applied causing the algae to form spores which accumulate high levels of astaxanthin. Once ready for harvest, the media containing these spores is transported through underground pipes to our astaxanthin processing building where the culture media and algal spores are separated. Fresh water recovered from this stage of processing may be recycled for further use in cultivation. The harvested algal spores are dried to a fine powder. During processing, the spores are cracked in a proprietary system to assure high bioavailability of astaxanthin. Each production lot of astaxanthin is sampled and tested for astaxanthin concentration. Finally the bulk powder is vacuum-sealed in oxygen-barrier foil laminate bags along with a packet of oxygen absorbent.
Unlike spirulina, astaxanthin is produced in a batch-mode and each cultivation pond must be completely drained and thoroughly cleaned between cycles. While the entire astaxanthin production cycle takes a total of four weeks, each stage of the four-step process is staggered and continuously feeds the next stage of cultivation. As a result, we are currently able to produce a new crop of astaxanthin from each of our 500,000 liters culture ponds approximately once per week. Pond cultivation can be negatively impacted seasonally with shortened daylight hours and potential inclement weather in winter months. The Company produced approximately the same quantity of product during fiscal 2005 as compared to fiscal 2004.
Natural astaxanthin for human consumption is processed further utilizing a high-pressure extraction process. The resulting product is a lipid extract insoluble in water used for the production of gelcaps. This product can also be micro-encapsulated into “beadlets” which our customers use in other formulations. All natural astaxanthin products destined for human consumption undergo a prescribed set of microbiological food product tests to ensure
6

safety and quality. The Company uses third party contractors for the extraction services, the production of gelcaps and the production of beadlets. Although these services are available only from a limited number of sources, we have the ability to use other parties if any of the current contractors become unavailable; however, there is no assurance that the pricing from a new contractor will be comparable to current negotiated pricing. In addition, a new contractor would have to pass the Company’s qualification process ensuring quality standards can be met or exceeded. If the pricing, for any of these services, significantly increases, this could have a material adverse effect on our business, financial condition and results of operations.
NatuRose is sold through a network of agents and distributors primarily to feed manufacturers and farmers in the aquaculture industry. Japan is one of our primary markets for the application of NatuRose in aquaculture and was a major factor in our decision to establish CJYK as a channel of distribution. In addition, NatuRose is sold to poultry feed formulators to naturally pigment the yolk of chicken eggs and to formulators of feeds for commercial breeding of high-value tropical fish. As our product is a natural astaxanthin, many of these formulators identify NatuRose by name as a component of their feed.
The animal nutrition astaxanthin market is currently dominated by Royal DSM of the Netherlands (“Royal DSM”). Royal DSM purchased F. Hoffmann-LaRoche’s division of vitamins and fine chemicals, including their synthetic astaxanthin operation, in 2003. NatuRose competes with the synthetic astaxanthin products derived from petrochemicals as well as other natural astaxanthin products derived from other natural sources such as Phaffia yeast and Paracoccus bacteria. Although synthetic astaxanthin has widespread use as a pigmentation source in commercial aquaculture, independent scientific analysis and feeding trials have shown that the molecular structure of the astaxanthin derived from the Haematococcus microalga more closely resembles the astaxanthin obtained naturally by fish in the wild. With the continued growth in the world aquaculture industry and the growing propensity towards “natural” alternatives, we believe NatuRose can compete against other products on the basis of its natural state, performance and price.
While the positive effects of astaxanthin in aquaculture have been recognized for years, the potential benefits of astaxanthin to human health are still emerging. As natural astaxanthin is one of the most potent and bioactive biological antioxidants found in nature, the number of potential roles of natural astaxanthin for human health is growing. Much research has been published in recent years on the beneficial roles of antioxidants in our health, in the aging process and on specific health conditions. The full efficacy of BioAstin as a human nutraceutical supplement requires significant clinical studies and testing and, although the Company did not spend significant amounts on clinical trials over the past two fiscal years in our efforts to contain costs, continued independent antioxidant research and prior clinical trials show promising human applications. The Company holds three United States patents relating to the usage of BioAstin in the treatment of Carpal Tunnel Syndrome, the treatment of canker/cold sores and for its use as a topical and oral sunscreen.
BioAstin is sold in the liquid lipid form as a raw ingredient to dietary supplement manufacturers, health food formulators and cosmetic manufacturers and BioAstin gelcaps and beadlets are sold in bulk quantities to distributors. BioAstin gelcaps are also sold as a packaged consumer product through Nutrex Hawaii directly to natural product distributors, retailers and consumers. BioAstin competes directly with similar products marketed by other manufacturers including Fuji Chemical of Japan, Valensa (a joint venture between Algatechnologies of Israel and U.S. Nutraceuticals) and Mera Pharmaceuticals in the United States. In the general category of nutritional supplements, BioAstin also competes with a variety of vitamins, dietary supplements and other antioxidant products available to consumers. The nutritional products market is highly competitive and includes international, national, regional and local producers and distributors, many of whom have greater resources than Cyanotech and many of whom offer a greater variety of products.
The natural astaxanthin market is an emerging market. In order to meet anticipated future demand growth and increase its ability to meet market demand the Company completed capital investment projects aimed at improving adaptability of its cultivation and production in fiscal 2005. The Company constructed additional PhytoDome CCS modules, retrofitted existing Spirulina ponds for haematococcus cultivation and invested in key production equipment providing for future redundancy in the case of equipment failure. The Company estimates that the expansion may provide an increase of up to 70% over current production volumes for our natural astaxanthin. In addition, the Company believes that production, sales and our ability to meet our customer demands for spirulina may be impacted from the conversion of ponds.
As of March 31, 2005, the backlog of orders for all natural astaxanthin products totaled approximately $74,000 and such orders are expected to be fulfilled in the first quarter of fiscal 2006. Such backlog at the end of fiscal 2004 and 2003 were $389,000 and $202,000, respectively.
7

Phycobiliprotein Products The Company also produces phycobiliproteins for sale to the medical and biotechnology research industries. Phycobiliproteins are highly fluorescent pigments purified from microalgae. Their spectral properties make them useful as tags or markers in many kinds of biological assays, such as flow cytometry, fluorescence immunoassays and fluorescence microscopy. We do not anticipate that phycobiliproteins will represent a significant component of total sales in future periods.
Major Customers Approximately $1,130,000 or 10% of net sales for the year ended March 31, 2005 were to Spirulina International B. V., a spirulina marketing and distribution company based in the Netherlands. Sales to this customer amounted to $1,560,000 or 13% of net sales for the fiscal year 2004 and $1,546,000 or 17% of net sales for the fiscal year 2003. We believe that sales to this customer will continue to represent a significant portion of total net sales in future periods and any significant reduction in demand from this customer could have a material adverse effect on our business, financial condition and results of operations.
Research and Development Cyanotech’s expertise is in the development of efficient, stable and cost-effective production systems for microalgal products. Our researchers investigate each specific microalga identified in the scientific literature for potentially marketable products and then strive to develop the technology to grow such microalgae on a commercial scale. Successful microalgal product development is highly uncertain and is dependent on numerous factors, many beyond the Company’s control. Products that appear promising in early phases of development may be found to be ineffective, may be uneconomical because of manufacturing costs or other factors, may be precluded from commercialization due to the proprietary rights of other companies, or may fail to receive necessary regulatory approvals.
The Company had research and development expenditures of $257,000, $149,000 and $217,000 in fiscal years 2005, 2004 and fiscal 2003, respectively. The Company reduced investment in scientific clinical trials during the first three quarters of fiscal 2005 and throughout fiscal 2004 as part of our effort to contain cost, but plans to increase investment in such trials in future periods. Fiscal 2005 and 2004 expenses were aimed at increasing production yields for Spirulina and Astaxanthin products and continually improving the quality and stability of such products. The Company continues to explore customer sponsored research and development as a potential opportunity in the future. Amounts spent on customer-sponsored research were not material in each of the three years ended March 31, 2005.
Patents, Trademarks and Licenses Cyanotech has received five United States patents: two on aspects of our production methods and three for use of our BioAstin products. The Company views its proprietary rights as important, but believes that a loss of such rights is not likely to have a material adverse effect on the Company’s present business as a whole. The Company’s operations are not dependent upon any single trademark, although some trademarks are identified with a number of the Company’s products and are of importance in the sale and marketing of such products.
Regulations and Environmental Matters On March 18, 2002, the Company was issued an Endangered Species Act (“ESA”) incidental take permit by the United States Department of Interior Fish and Wildlife Service (“FWS”). The ESA defines “incidental take” as take that is “incidental to, and not the purpose of, the carrying out of an otherwise lawful activity.” This permit authorizes incidental take of the endangered Hawaiian stilt (Himantopus mexicanus knudseni) that is anticipated to occur as a result of ongoing operations and maintenance at the Company’s Kona facility. As a mandatory component for the issuance of a permit, the Company submitted and maintains a habitat conservation plan (“HCP”) to ensure that the effects of the permitted action on listed species are adequately minimized and mitigated.
The HCP called for the creation of a nesting and breeding ground for the Hawaiian stilt to offset any take activity. The Company complied with these requirements in 2002. The breeding program was so successful that the increase in the Hawaiian stilt population in the area became a potential hazard for the adjacent State airport facility. The Company disassembled the stilt habitat and is mitigating “take” by using standard non-lethal hazing devices to discourage nesting and breeding.
A requirement of the incidental take permit is to provide insurance of funding for project completion for the term of the incidental take permit. The Company’s insurance broker was unable to locate an underwriter who would provide such a bond. As permitted by law, the FWS waived this requirement recognizing that this HCP did
8

not involve a significant capital expenditure. However, under Hawaii state law, no waiver provision is available. In lieu of insurance, the Company provided a refundable deposit of approximately $89,000 to the State of Hawaii. The permit, which expired on March 17, 2005 has been renewed by the Company for an additional year.
Employees As of March 31, 2005, the Company employed 64 people on a full-time basis. Of the total, 48 are involved in the harvesting and production process, 2 in research and development and the remainder in sales, administration and support. Management believes that its relations with employees are good. We currently are experiencing some difficulty in attracting entry-level operations personnel due to increased wage competition for workers due to the growth in the State’s construction industry. None of our employees are subject to collective bargaining agreements.
Internet Information Our Internet address is www.cyanotech.com. There we make available, free of charge, copies of Cyanotech news releases and financial statements issued in the last 12 months. The information found on our Web site, unless otherwise indicated, is not part of this or any other report we file with or furnish to the Securities and Exchange Commission. Spirulina Pacifica and BioAstin are sold directly online through the Company’s website, www.nutrex-hawaii.com, as well as through resellers in over 30 countries worldwide. Technical information for the Company’s phycobiliproteins products is available at www.phycobiliprotein.com. Corporate data, product information and charters of our Board committees are also available at www.cyanotech.com.
Item 2. Properties
The Company’s principal facility and corporate headquarters is located at the Natural Energy Laboratory of Hawaii Authority (“NELHA”) at Keahole Point in Kailua-Kona, Hawaii. It encompasses approximately 90 fully developed acres containing microalgal cultivation ponds, processing facilities, research and quality control laboratories, and sales and administrative offices. The property is leased from the State of Hawaii under a 30-year commercial lease expiring in 2025. We believe that there is sufficient available land at NELHA to meet our currently anticipated needs.
The Company also rents warehouse space near NELHA and also in San Dimas, California and office space in Toyko, Japan.
Item 3. Legal Proceedings
From time to time the Company may become party to lawsuits and claims that arise in the ordinary course of business relating to employment, intellectual property, and other matters. There were no significant legal matters which occurred during fiscal 2005. We believe that any future claims, individually or in the aggregate, will not result in a material adverse effect on our business, financial position, or results of operations.
Item 4. Submission of Matters to a Vote of Security Holders
No matters were submitted to a vote of stockholders during the fourth quarter of fiscal 2005.
9

PART II Item 5. Market for Registrant’s Common Equity and Related Stockholder Matters The Company’s common stock is traded on the NASDAQ SmallCap Market under the symbol “CYAN”. As of June 24, 2005, there were 1,304 registered holders of record of our common stock. The high and low selling prices as reported by the NASDAQ Stock Market were as follows: Quarter Ended: June 30 September 30 December 31 March 31 Fiscal 2005 Common stock price per share: High $ 1.65 $ 1.85 $ 1.70 $ 1.53 Low $ 1.10 $ 1.00 $ 1.10 $ 1.20 Fiscal 2004 Common stock price per share: High $ 0.72 $ 0.75 $ 1.97 $ 2.30 Low $ 0.40 $ 0.41 $ 0.36 $ 1.05 During fiscal 2002, the Company’s common stock was traded on the NASDAQ National Market. On June 17, 2002, the Company received a delisting warning letter from NASDAQ for failure to comply with the $1.00 per share minimum bid price. The Company was unable to regain compliance during the allowed grace period and subsequently applied for, and received listing for its common stock on the NASDAQ SmallCap Market. The Company was provided additional time to comply with all of the listing criteria for the SmallCap Market. On September 15, 2003, the Company requested a hearing with the NASDAQ Listing Qualifications Panel (the “Panel”) which was subsequently heard on October 16, 2003. In a letter dated November 26, 2003, the Panel determined that the Company had evidenced compliance with all requirements necessary for continued listing on the SmallCap Market.
The Company is prohibited from declaring any common stock dividends without the prior written consent of a lender per the conditions of an existing term loan agreement with such lender. The Company has never declared or paid cash dividends on its common stock. We currently intend to retain all of our earnings for use in the business and do not anticipate paying any cash dividends on common stock in the foreseeable future.
Item 6. Selected Financial Data Years ended March 31, 2005 2004 2003 2002 2001 (In thousands, except per share data) Results of Operations Net sales $ 11,445 $ 11,582 $ 8,951 $ 8,235 $ 8,043 Gross profit 3,818 3,940 2,895 1,562 2,345 Income (loss) from operations 562 729 (1,210) (2,185) (708) Net income (loss) 486 399 (1,775) (2,589) (1,067) Net income (loss) per common share - diluted 0.02 0.02 (0.10) (0.15) (0.07) Selected Balance Sheet Data Cash and investment securities 3,005 2,531 579 1,051 2,269 Working capital 5,102 4,083 2,352 1,008 4,177 Total assets 18,542 18,357 17,482 18,400 21,423 Long-term debt, excluding current maturities 1,743 2,093 3,694 2,765 4,336 Stockholders’ equity 15,080 14,440 12,273 13,191 15,695
10

Item 7. Management’s Discussion and Analysis of Financial Condition and Results of Operations The following discussion should be read in conjunction with the Company’s consolidated financial statements and accompanying notes included in Part II. Item 8. Financial Statements and Supplementary Data. For a more comprehensive description of the Company’s products and markets for such products, see Part I. Item 1. Business.
Overview
Cyanotech Corporation’s core competency is cultivating and processing microalgae into high-value, high-quality natural products for the human and animal nutrition markets. Our products are sold in bulk quantities to manufacturers, formulators and distributors in the health foods, nutritional supplements and animal nutrition markets and as packaged consumer products to distributors, retailers and direct consumer sales. The Company manufactures its products in Hawaii but markets them worldwide, generating 49%, 58% and 54% of its revenues outside of the United States for each of the years ended March 31, 2005, 2004 and 2003, respectively. Competing in a global marketplace, the Company is influenced by the general economic conditions of the countries in which its customers operate, including adherence to its customers’ local governmental regulations and requirements. The Company has no material foreign exchange exposure.
The Company reported net income of $486,000, or $0.02 per diluted share for fiscal 2005 an improvement of 22% over net income of $399,000, or $0.02 per diluted share for fiscal 2004. Cash, cash equivalents and short-term investment balances at March 31, 2005 were $3,005,000, up $474,000 from a year ago. Working capital improved 25% to $5,102,000 at March 31, 2005 from working capital of $4,083,000 a year ago, primarily due to increased short-term investment and inventory balances (see Consolidated Statements of Cash Flows in Part II, Item 8.)
The following table details selected financial data highlighting three key areas (dollars in thousands):
Year Ended March 31, 2005 2004 2003 Net sales: Spirulina products $ 6,626 $ 6,511 $ 6,181 Natural astaxanthin products 4,672 4,933 2,613 Other products 147 138 157 $ 11,445 $ 11,582 $ 8,951 Gross profit as a percentage of sales 33% 34% 32% Operating expenses as a percentage of sales 28% 28% 46%
Net sales for fiscal 2005 were $11,445,000, slightly lower than the $11,582,000 reported for the prior fiscal year. During fiscal 2005, the Company experienced a disruption of NatuRose sales to the worldwide aquaculture market due to damage to customers’ operations from typhoons in Japan and heightened competition in other markets, but this decrease was offset in large part by increased sales of Spirulina and BioAstin. The Company believes that sales of NatuRose will return to historical levels in the Japan market during the coming fiscal year but there can be no guarantee of the timing of such recovery. During fiscal 2005 the Company completed a capital project, funded from operations, aimed at improving its ability to meet market demand for all products and providing increased production capacity of natural astaxanthin. Anticipating growth in demand for our natural astaxanthin products, the Company’s internal focus was, and will be, on reallocating its cultivation resources in an effort to increase production of natural astaxanthin while concurrently optimizing its spirulina production to improve yield and quality. The Company will continue to contain discretionary operating spending but may invest in focused expenditures particularly in advertising and clinical trials in the human nutrition and cosmetics markets. Externally, the Company is also working with industry-leading manufacturers in these markets to integrate BioAstin into their products. The Company believes that it needs to continue to focus on market acceptance of its natural astaxanthin products in all markets as increased competition from other producers of natural and synthetic astaxanthin may result in the decline of margins generated for its natural astaxanthin products. Management cannot predict whether the outcomes of any of these strategies will be successful. Results of Operations Revenues Net sales for fiscal 2005 was $11,445,000, a slight decline from net sales of $11,582,000 in fiscal 2004 and an increase of 28% from net sales of $8,951,000 reported in fiscal 2003. The following is a discussion of revenues by major product category.
11

Spirulina The Company has been producing Spirulina Pacifica, a strain of spirulina microalga, since 1985. Revenues generated from the Company’s spirulina products are a significant portion of total revenues, amounting to $6,626,000, $6,511,000 and $6,181,000 for the years ended March 31, 2005, 2004 and 2003 respectively. Although the Company believes that Spirulina is a mature product in a highly competitive market, the dollar amount of revenues has remained relatively consistent over the three year period. As a percentage of total revenues, spirulina product sales represented 58% in 2005, 56% in 2004 and 69% in 2003 reflecting the Company’s changing product mix. Approximately $1,130,000 or 10% of net sales for the year ended March 31, 2005 were to Spirulina International B. V., a spirulina marketing and distribution company based in the Netherlands. Sales to this customer amounted to $1,560,000 or 13% of net sales for the fiscal year 2004 and $1,546,000 or 17% of net sales for the fiscal year 2003. We believe that sales to this customer will continue to represent a significant portion of total net sales in future periods and any significant reduction in demand from this customer could have a material adverse effect on our business, financial condition and results of operations.
The Company has experienced increased competition for its spirulina products resulting from an increasing number of suppliers of spirulina as well as from a larger portion of our sales coming from bulk product orders whose customers generally treat these products as commodities with price being the major determining factor driving their purchasing decision. We expect this competitive pricing pressure to continue in future periods and in response have focused on improving the quality of our Spirulina products in support of customers who demand higher quality raw materials for their formulations. In fiscal 2005, this approach in Spirulina sales resulted in average unit prices improving approximately 5% in fiscal 2005 as compared to the prior year with a slight decrease in the number of units sold during the current year. At March 31, 2005 our backlog of Spirulina orders increased from the previous year by $327,000, due primarily to the timing of orders from our customers. In fiscal 2004, we had experienced a decline in average unit price of approximately 4% as compared to the prior year but this was offset by a 14% increase in the number of units sold.
Natural Astaxanthin In fiscal 2005, the Company’s sales of its natural astaxanthin products were $4,672,000, a decrease of 5% from $4,933,000 in fiscal 2004, with both years being a significant increase from revenues of $2,613,000 in fiscal 2003. The decrease in natural astaxanthin sales were primarily due to weather-related disruptions affecting sales of NatuRose into the aquaculture market during fiscal 2005, but this decrease was offset in large part by increased unit sales of higher-priced BioAstin into the human nutritional market. At March 31, 2005 our backlog of orders for all natural astaxanthin products was $74,000, a decrease of $315,000 from that of a year ago. This decrease is due primarily to our improved ability to meet the demand for natural astaxanthin products due to increased production capacity resulting from our pond conversion project. The sales growth in fiscal 2004 compared to fiscal 2003 resulted from increased units sold in all bulk natural astaxanthin products.
The Company believes that the findings of clinical trials undertaken in prior years by the Company, its customers and other unaffiliated parties, taken individually and on a cumulative basis, have generated a growing consumer awareness of the beneficial antioxidant and anti-inflammatory properties of astaxanthin. Validation of natural astaxanthin benefits identified in such scientific studies has helped to spur demand for our natural astaxanthin products in both the human and animal nutrition markets and could provide the basis for proprietary intellectual property. The Company reduced its expenditures on natural astaxanthin scientific clinical trials during the first three quarters of fiscal 2005 and all of fiscal 2004, as part of its cost containment effort, but plans to increase expenditures on targeted scientific trials in the future in accordance with its strategy to increase sales of natural astaxanthin products.
In order to meet anticipated future demand growth for all products, during fiscal 2005 and 2004 the Company invested in capital projects aimed at increasing its ability to respond to market demand. Two major components of this capital investment were adaptation of existing ponds for cultivation of both Spirulina and Haematoccocus algae (for astaxanthin) and upgrading key elements of our processing facility for natural astaxanthin products. All projects were complete as of March 31 2005 and were funded entirely from operating cash flows.
Cost of Sales Our cost of sales, as a percentage of net sales, was steady at 67%, 66% and 68% for fiscal years 2005, 2004, and 2003, respectively. Cost of sales includes the cost of nutrients and materials, direct labor and manufacturing overhead costs, and depreciation and amortization of production equipment, buildings and leasehold improvements specific to the production process. Although the Company experienced improved production efficiencies for both product lines during fiscal 2005 resulting from our completed natural astaxanthin pond conversion project and ongoing improvement in Spirulina cultivation. The Company continues to strive for increased production efficiencies in volume yield, potency and quality consistent with our commitment to produce high-value, high-quality products. For fiscal 2004 and 2003 increased cultivation yields in biomass were achieved.
12
However, the cost improvement in fiscal 2004 was partially offset by the reduction of certain bulk spirulina finished goods inventory to market realizable value and a contract extraction facility problem that was rectified during the first quarter of 2004.
Raw materials and nutrients required in our production processes are available from multiple sources; however, there can be no assurance that the pricing from a new source will be comparable to current negotiated pricing. If the pricing for a critical raw material or nutrient significantly increases, this could have a material adverse effect on our business, financial condition and results of operations. For future periods, with the rising cost of fuel oil, the Company could incur higher electrical utility costs dependent upon the regulated public utility’s ability to obtain approval for rate increases. In addition, fresh water is critical for our natural astaxanthin production and while the Company has not experienced any constraint on fresh water availability, future availability could be negatively impacted by significant growth in the local population as well as by throughput constraints on the water delivery infrastructure owned by the County of Hawaii. The Company has met with County officials to assess the situation and evaluate the probability of future risks. In addition, given the criticality of fresh water to our operations and the community, the Company recycles fresh water where possible and continues to explore further recycling opportunities in its efforts to efficiently utilize fresh water. For the production of BioAstin, the Company’s natural astaxanthin product for the human nutrition market, a sole third party contractor is utilized for each of the processes of extraction, encapsulation (for gelcaps) and micro-encapsulation (for beadlets) and although these services are available only from a limited number of sources, we have the ability to use other parties if any of the current contractors become unavailable. If pricing for any of these services significantly increases, this could have a material adverse effect on our business, financial condition and results of operations.
Gross Profit Gross profit margin for fiscal 2005 was 33%, which is comparable to the 34% and 32% gross profit margin for fiscal years 2004 and 2003, respectively.
Operating Expenses Operating expenses as a percentage of net sales were 28% for fiscal 2005 and 2004, significantly lower than the 46% reported in 2003. Operating expenses during fiscal 2005 increased slightly in amount due to higher spending in research and development. This increase, related to clinical trials, was offset by decreased sales/marketing and general/administrative expenses. In comparison, spending decreased in all functional areas in fiscal 2004 as compared to fiscal 2003, a direct result of the Company’s efforts to contain costs and align its spending with actual sales. The Company is committed to ongoing cost containment aimed at controlling its level of operating expenses but may increase such discretionary spending in future periods as dictated by the needs of the business. Fiscal 2003 operating expenses were impacted by certain write-offs that did not recur in 2004. The following is a discussion of spending by functional area.
Our research and development costs increased to $257,000, up 72% from $149,000 in fiscal 2004 and up 18% from $217,000 in 2003. This increase is due primarily to initiation of a new scientific clinical trial and costs related to product registration, both occurring during the fourth quarter of fiscal 2005. During most of fiscal 2005 and all of fiscal 2004, the Company reduced spending on scientific clinical trials as part of our efforts to contain costs. During these two years, such expenses related primarily to increasing our production yields and improving the quality and stability of our products in contrast to fiscal 2003 when efforts were primarily directed at validating the anecdotal indications of BioAstin through clinical evaluations and trials.
Our sales and marketing costs were $1,202,000, $1,239,000 and $1,827,000 in fiscal 2005, 2004 and 2003, respectively. Fiscal 2005 and 2004 expenses were significantly lower than fiscal 2003 primarily due to reduced advertising expenditures for packaged consumer products and discretionary contract services. In addition, fiscal 2003 costs included a $260,000 write-off for the discontinuation of a television infomercial project.
Our general and administrative costs were $1,797,000, $1,823,000 and $2,061,000 in fiscal 2005, 2004 and 2003, respectively. Compared to fiscal 2004, fiscal 2005 expenses decreased slightly primarily due to elimination of a royalty payment obligation which ended in fiscal 2004, reduced contract services expenses and a reduction in bad debt expense, offset in part by increased personnel expenses. Fiscal 2004 expenses decreased from fiscal 2003 primarily due to costs associated with certain transactions in the prior year that did not recur in 2004 and a lower bad debt provision. Fiscal 2003 expenses include a charge for the write-down of a warehouse project and a NASDAQ fee associated with the change in the trading of the Company’s common stock on the National Market to the Small Cap Market which did not recur in fiscal 2005 or 2004.
13

Other Expense The following details the amounts included in other expense (dollars in thousands):
2005 2004 2003 Interest expense on Term Loan Agreement (1) $ 158 $ 160 $ 196 Interest expense on convertible debentures (2) - 119 204 Other interest expense 5 7 18 Costs relating to extension of debentures (3) - - 236 Other income, net (4) (46) (31) (80) Total other expense $ 117 $ 255 $ 574
(1) The principal balance on the Term Loan was $2,098,000, $2,439,000 and $2,767,000 as of March 31, 2005, 2004 and 2003 respectively. The interest rate under the Term Loan is 1% above the prime rate. The prime rate as of March 31, 2005, 2004 and 2003 was 5.25%, 4.0% and 4.25% respectively.
(2) In December 2003, the convertible debentures were voluntarily converted into common stock (see Note 5 of Notes to Consolidated Financial Statements Part II. Item 8.).
(3) In May 2002, debentures due to mature on April 30, 2002 were extended to October 31, 2002 (see Note 5 of Notes to Consolidated Financial Statements Part II. Item 8.).
(4) Other income, net includes interest earned on certain cash and cash equivalents balances and gains arising from exchange rate fluctuations on transactions of the Company’s Japan subsidiary.
Income Taxes For fiscal 2005, an estimated federal and Hawaii State income tax benefit of $68,000 was recorded partially offset by income taxes of $27,000 related to our Japan operations. For fiscal 2004, a provision for income taxes of $75,000 was recorded for taxes relating to our operations in Japan partially offset by a state tax refund. For fiscal 2003 a $9,000 income tax benefit representing state tax refunds was recorded.
Liquidity and Capital Resources
Financial Condition During fiscal 2005 and 2004, the Company funded its growth largely through cash provided by operations. In prior years, the Company had primarily funded its growth in operations through a combination of long-term borrowings and the issuance of common stock in connection with certain debt restructurings.
The Company has a Term Loan Agreement (“Term Loan”) with a lender providing up to $3.5 million in credit facilities, secured by substantially all the assets of the Company. The outstanding balance under the Term Loan as of March 31, 2005 is approximately $2,098,000. The Term Loan has a maturity date of May 1, 2010 and is payable in 120 equal monthly principal and interest payments of approximately $38,000. The interest rate under the Term Loan, in absence of a default under the agreement, is the prime rate, as defined, in effect as of the close of business on the first day of each calendar quarter, plus 1% (the prime rate was 5.25% at March 31, 2005). The Company is in compliance with all restrictive covenants of the Term Loan. The Company is prohibited by the Term Loan from declaring any cash dividends without the lender’s prior written consent. In July 2003, the Company received approval from the Term Loan lender for the release of $250,000 of cash previously held as a restricted deposit. A remaining $250,000 restricted cash deposit continues to be held in an interest-bearing restricted cash account per the terms of the Term Loan and is included in Other Assets in the consolidated balance sheet at March 31, 2005.
In October 2002, the Company issued in a private placement (a) $1,250,000 principal amount of 10% Convertible Subordinated Debentures (the “Debentures”) originally due September 30, 2004, convertible into shares of the Company’s Common Stock at a price of $0.65 per share and (b) 750,000 shares of Common Stock with proceeds to the Company of $300,000. Proceeds from the Debentures were used to retire convertible debentures of $1,238,000 due to mature on October 31, 2002. In December 2003, the holder of the Debentures voluntarily converted the entire principal amount of the Debentures into 1,923,076 shares of Common Stock pursuant to the terms of the Debentures.
The following table presents the Company’s debt and lease obligations at March 31, 2005 (in thousands):
Less Than After 1 Year 1 – 3 Years 4 – 5 Years Years Total Term Loan $ 355 $ 780 $ 884 $ 79 $ 2,098 Operating leases 251 446 334 2,331 3,362 Total $ 606 $ 1,226 $ 1,218 $ 2,410 $ 5,460
14

Our working capital was $ 5,102,000 at March 31, 2005 compared to $4,083,000 and $2,352,000 at March 31, 2004 and 2003, respectively. The improvement in our working capital balances as of March 31, 2005 and March 31, 2004 was primarily due to the Company’s ability to generate cash from operations.
Cash Flows Our cash, cash equivalents and short-term investments were $3,005,000, $2,531,000 and $579,000 at March 31, 2005, 2004 and 2003, respectively. At March 31, 2005, $1,000,000 of this amount represents short-term investments in certificates of deposit.
During fiscal years 2005 and 2004, the Company generated cash from operating activities of $1,328,000 and $1,966,000, respectively. This contrasts with cash used in operating activities of $502,000 during fiscal 2003. Cash from operations in fiscal years 2005 and 2004 reflect the Company’s profitability and improved collection of trade accounts receivable, with net income of $486,000 in 2005 and $399,000 in 2004 compared to a net loss of $1,775,000 in 2003.
Cash used in investing activities during fiscal 2005 of $1,649,000 included $1,000,000 invested in short-term financial instruments and investments in equipment and leasehold improvements of $649,000. Investments in equipment and leasehold improvements were $413,000 and $250,000 in fiscal years 2004 and 2003. The capital expenditures for all periods presented pertained primarily to improvements in cultivation and processing facilities. For fiscal 2005, such expenditures were primarily related to capital projects aimed at increasing our ability to respond to market demand. Two major components of this capital investment were adaptation of existing ponds for cultivation of both Spirulina and Haematoccocus algae (for astaxanthin) and upgrading key elements of our processing facility for natural astaxanthin products. Such pond conversion is substantially less costly than constructing new ponds. At March 31, 2005, these projects were complete. Depreciation and amortization expense was $1,319,000, $1,346,000 and $1,324,000 for the years ended March 31 2005, 2004 and 2003, respectively. For fiscal 2006 management expects investment in equipment and leasehold improvements to return to the level experienced in fiscal 2004.
During fiscal 2005, cash used in financing activities amounted to $205,000, representing principal payments on long-term debt of $341,000, offset in part by proceeds from issuance of common stock and from the exercise of stock options and warrants totaling $136,000. For fiscal 2004 and 2003, financing activities provided cash of $399,000 and $280,000, respectively. Fiscal 2004 financing activities consisted primarily of the following: (1) net proceeds received from the exercise of warrants and stock options totaling $477,000 (see Note 7 of Notes to Consolidated Financial Statements in Part II. Item 8.), (2) the partial release of a restricted deposit held in connection with the Term Loan of $250,000 and (3) principal payments on long-term debt of $328,000. For fiscal 2003, financing activities primarily consisted of (1) proceeds from the issuance of $1,250,000 convertible subordinated debentures used to retire $1,238,000 of convertible debentures (see Note 5 of Notes to Consolidated Financial Statements in Part II. Item 8.), (2) net proceeds received from the issuance of common stock and from the exercise of stock options and warrants of $630,000 and (3) principal payments on long-term debt of $303,000 (excluding the debenture retirement previously noted).
15

Variability of Results The following selected quarterly financial data (unaudited) as of and for the periods presented highlights the significant fluctuations in operating results and financial condition that the Company has experienced in the past three fiscal years (dollars in thousands):
4th Quarter 3rd Quarter 2nd Quarter 1st Quarter Ended March 31, December 31, September 30, June 30, Fiscal 2005: Net sales $ 2,560 $ 3,180 $ 2,998 $ 2,707 Cost of sales 1,846 2,017 1,944 1,820 Operating expenses 804 845 881 726 Net income (loss) (74) 326 121 113 Working capital 5,102 4,991 4,474 4,274 Fiscal 2004: Net sales $ 3,290 $ 3,024 $ 2,840 $ 2,428 Cost of sales 2,099 1,840 1,979 1,724 Operating expenses 736 892 829 754 Net income (loss) 441 109 (10) (141) Working capital 4,083 3,141 2,921 2,436 Fiscal 2003: Net sales $ 2,427 $ 2,474 $ 2,018 $ 2,032 Cost of sales 1,596 1,763 1,450 1,247 Operating expenses 1,053 826 1,002 1,224 Net income (loss) (270) (180) (540) (785) Working capital 2,352 2,367 1,965 1,051
As a normal course of business, adjustments are recorded in the consolidated financial statements to fairly represent the Company’s financial condition, results of operations or liquidity. During the fourth quarter of fiscal 2005, adjustments were made to properly state certain accrued liabilities related to general and administrative operating expenses and receivables related to income tax benefits of approximately $70,000. These adjustments related to previously reported periods but would not have had a material impact on any such previously reported period .
The Company’s results of operations and financial condition can be affected by numerous factors, many of which are beyond its control and could cause future results of operations to fluctuate materially as it has in the past. Future operating results may fluctuate as a result of changes in sales volumes to our largest customers, weather patterns, increased competition, increased materials, nutrient and energy costs, foreign currency exchange fluctuations, governmental regulations and other factors beyond our control. In addition, while the Company maintains product liability insurance in limited amounts for all of its products involving human consumption, broader product liability coverages are cost prohibitive.
A significant portion of our expense levels are relatively fixed, so the timing of increases in expense levels is based in large part on forecasts of future sales. If net sales are below expectations in any given period, the adverse impact on results of operations may be magnified by our inability to adjust spending quickly enough to compensate for the sales shortfall. We may also choose to reduce prices or increase spending in response to market conditions, which may have a material adverse effect on financial condition and results of operations.
Effect of Recently Issued Accounting Standards and Estimates In December 2004, the Financial Accounting Standards Board (“FASB”) issued SFAS No. 123 (Revised 2004) “Share-Based Payment” which is a revision of FASB Statement No. 123 “Accounting for Stock-Based Compensation.” SFAS No. 123 (Revised 2004) requires an entity to measure the cost of employee services received in exchange for an award. If an award vests or becomes exercisable based on the achievement of a condition other than service, performance or market condition, the award is liability-classified. Liability-classified awards are remeasured to fair value at each balance sheet date until the award is settled. Equity –classified awards, including grants of employee stock options, are measured at the grant-date fair value of the award and are not subsequently remeasured. The cost of equity-classified awards is recognized in the income statement over the period during
16

which an employee is required to provide the service in exchange for the award. Currently the company accounts for its employee and non-employee director stock options under the intrinsic value provision of APB Opinion No. 25. The Company is required to adopt the provisions for SFAS No. 123 (Revised 2004) as of the beginning of the first annual reporting period that begins after June 15, 2005, although earlier adoption is permitted. SFAS No. 123 (Revised 2004) offers several alternatives for implementation. At this time, management has not made a decision as to the alternative it may select.
In November 2004, the FASB issued SFAS No. 151 “Inventory Costs – an amendment of Accounting Research Bulletin No. 43, Chapter 4”. SFAS No. 151 requires that abnormal amounts of freight, handling costs and wasted material (spoilage) be recognized as current-period charges and fixed production overhead costs be allocated to inventory based on the normal capacity of production facilities. Normal capacity is defined as “the production expected to be achieved over a number of periods or seasons under normal circumstances, taking into account the loss of capacity resulting from planned maintenance.” Companies will no longer be permitted to capitalize inventory costs on the balance sheet when the production defect rate varies significantly from the expected defect rate. SFAS No. 151 is effective for inventory costs incurred during fiscal years beginning after June 15, 2005. Earlier application is permitted for inventory costs incurred during fiscal years beginning after November 24, 2004. The Company has yet to determine the impact, if any, of SFAS No. 151 on its consolidated financial statements.
In December 2004, the FASB issued SFAS No. 153, “Exchange of Nonmonetary Assets, an amendment of APB Opinion No. 29, ‘Accounting for Nonmonetary Transactions.’” SFAS No. 153 is based on the principle that exchange of nonmonetary assets should be measured based on the fair market value of the assets exchanged. SFAS No. 153 eliminates the exception of nonmonetary exchanges of similar productive assets and replaces it with a general exception for exchanges of nonmonetary assets that do not have commercial substance. SFAS No. 153 is effective for nonmonetary asset exchanges in fiscal periods beginning after June 15, 2005. Adoption of the provisions of SFAS No. 153 is not expected to have a material impact on the Company’s financial condition, results of operations, or liquidity. In March 2005, the FASB issued FASB Interpretation No. 47 (“FIN 47”), “Accounting for Conditional Asset Retirement Obligations — an interpretation of FASB Statement No. 143.” FIN 47 clarifies that the term “conditional asset retirement obligation” as used in FASB Statement No. 143, “Accounting for Asset Retirement Obligations,” refers to a legal obligation to perform an asset retirement activity in which the timing and (or) method of settlement are conditional on a future event that may or may not be within the control of the entity. Accordingly, an entity is required to recognize a liability for the fair value of a conditional asset retirement obligation if the fair value of the liability can be reasonably estimated. FIN 47 is effective for fiscal years ending after December 15, 2005. The Company has yet to determine the impact, if any, of FIN 47 on its consolidated financial statements. On March 29, 2005, the Securities and Exchange Commission (SEC) staff issued Staff Accounting Bulletin No. 107, “Share-Based Payment” (SAB No. 107), which expressed the SEC staff’s views on Statement No. 123R, but did not modify any of Statement No. 123R’s provisions. The Company is evaluating the views expressed by the SEC in SAB No. 107 in conjunction with its assessment of Statement No. 123R’s impact to the Company.
In May 2005, the FASB issued SFAS No. 154, "Accounting Changes and Error Corrections, a replacement of APB Opinion No. 20 and FASB Statement No. 3." SFAS No. 154 requires retrospective application for voluntary changes in accounting principle unless it is impracticable to do so. In addition, indirect effects of a change in accounting principle should be recognized in the period of the accounting change. SFAS No. 154 is effective for accounting changes and corrections of errors made in fiscal years beginning after December 15, 2005. Application of Critical Accounting Policies and Estimates The Company’s discussion and analysis of its financial condition and results of operations are based upon the Company’s consolidated financial statements, which have been prepared in accordance with accounting principles generally accepted in the United States. The preparation of financial statements in conformity with those accounting principles requires management to make judgments and estimates that affect the amounts reported in the consolidated financial statements and accompanying notes. Actual results could differ from those estimates. The Company regularly re-evaluates its judgments and estimates which are based upon historical experience and on various other assumptions that are believed to be reasonable under the circumstances. The Company believes that of its significant accounting policies (see Note 1 of Notes to Consolidated Financial Statements in Part II. Item 8.), policies that may involve a higher degree of judgment and complexity are inventory valuations, valuation of equipment and leasehold improvements and long-lived assets, and income taxes.
17

The Company is required to state inventories at the lower of cost or market. Cost is defined as the sum of the applicable expenditures and charges directly or indirectly incurred in bringing inventories to their existing condition and location. Cost for inventory purposes may be determined under any one of several assumptions as to the flow of cost factors, such as first-in, first-out; average cost; and last-in, first-out. Our inventories are stated at the lower of cost, which approximates first-in, first-out, or market. For fiscal 2006, with the rising cost of fuel oil, the Company could incur higher electrical utility costs dependent upon the regulated public utility’s ability to obtain approval for rate increases. If electrical utility costs were to double from fiscal 2005 costs, the Company estimates that the cost to manufacture its products could increase by as much as 15 % above prior year costs.
Equipment and leasehold improvements are reported at cost. Self-constructed leasehold improvements include design, construction and supervision costs. These costs are recorded in construction in progress and are transferred to equipment and leasehold improvements when construction is completed and the facilities are placed in service. If the Company experiences an impairment to its equipment or leasehold improvement, we would account for the impairment in accordance with SFAS No. 144. Pursuant to SFAS No. 144, long-lived assets, such as property, plant and equipment and purchased intangibles subject to amortization shall be reviewed for impairment whenever events or changes in circumstances indicate that the carrying amount of an asset may not be recoverable. Recoverability of assets to be held and used is measured by a comparison of the carrying amount of an asset to the estimated undiscounted future cash flows expected to be generated by the asset. If the carrying amount of an asset exceeds its estimated future cash flows, an impairment charge is recognized to the extent that the carrying amount exceeds the asset’s fair value.
Income taxes are accounted for under the asset and liability method. The asset and liability method requires the recognition of deferred tax assets and liabilities for the expected future tax consequences attributable to differences between the financial statement carrying amounts of existing assets and liabilities and their tax bases and operating loss and tax credit carryforwards. Deferred tax assets and liabilities are measured using enacted income tax rates applicable to the period in which the deferred tax assets or liabilities are expected to be recovered or settled. The Company records a valuation allowance to reduce its deferred tax assets to the amount that it believes is more likely than not to be realized. Judgment is required in assessing the need for the valuation allowance. The ultimate realization of deferred tax assets is dependent upon the generation of future taxable income during the periods in which those temporary differences become deductible. In recent periods the Company has returned to profitability and begun to generate taxable income which has resulted in the utilization of our previously generated net operating losses. If we continue to generate taxable income, management may conclude that a portion or all of the existing valuation allowance is no longer required. (See Note 11 of Notes to Consolidated Financial Statements in Part II. Item 8.).
Item 7a. Quantitative and Qualitative Disclosures About Market Risk We have never entered into any transactions using derivative financial instruments or derivative commodity instruments and believe that our exposure to market risk associated with other financial instruments is not material.
We have a term loan agreement which adjusts quarterly based on the prime rate. As such we are exposed to the interest rate risk whereby a 1% increase in the prime rate would lead to an increase of approximately $15,000 in interest expense for the year ending March 31, 2006 (based on March 31, 2005 amounts outstanding).
18

Item 8. Financial Statements and Supplementary Data
Report of Independent Registered Public Accounting Firm
The Board of Directors and Stockholders Cyanotech Corporation:
We have audited the accompanying consolidated balance sheets of Cyanotech Corporation and subsidiaries (the Company) as of March 31, 2005 and 2004, and the related consolidated statements of operations, stockholders’ equity and comprehensive income (loss), and cash flows for each of the years in the three-year period ended March 31, 2005. These consolidated financial statements are the responsibility of the Company’s management. Our responsibility is to express an opinion on these consolidated financial statements based on our audits.
We conducted our audits in accordance with the standards of the Public Company Accounting Oversight Board (United States). Those standards require that we plan and perform the audit to obtain reasonable assurance about whether the financial statements are free of material misstatement. An audit includes examining, on a test basis, evidence supporting the amounts and disclosures in the financial statements. An audit also includes assessing the accounting principles used and significant estimates made by management, as well as evaluating the overall financial statement presentation. We believe that our audits provide a reasonable basis for our opinion.
In our opinion, the consolidated financial statements referred to above present fairly, in all material respects, the financial position of Cyanotech Corporation and subsidiaries as of March 31, 2005 and 2004, and the results of their operations and their cash flows for each of the years in the three-year period ended March 31, 2005, in conformity with U.S. generally accepted accounting principles.
/s/ KPMG LLP
Honolulu, Hawaii June 6, 2005
19

CONSOLIDATED BALANCE SHEETS March 31, 2005 and 2004
(in thousands, except share data) 2005 2004 ASSETS Current assets: Cash and cash equivalents $ 2,005 $ 2,531 Short-term investments 1,000 - Accounts receivable, net of allowance for doubtful accounts of $46 in 2005 and $96 in 2004 2,069 2,211 Refundable income taxes 97 11 Inventories 1,565 1,099 Prepaid expenses and other current assets 85 55 Total current assets 6,821 5,907 Equipment and leasehold improvements, net 11,174 11,844 Other assets 547 606 Total assets $ 18,542 $ 18,357 LIABILITIES AND STOCKHOLDERS’ EQUITY Current liabilities: Current maturities of long-term debt $ 355 $ 346 Accounts payable 977 874 Accrued expenses 387 604 Total current liabilities 1,719 1,824 Long-term debt, excluding current maturities 1,743 2,093 Total liabilities 3,462 3,917 Stockholders’ equity: Common stock of $.005 par value, authorized 30,000,000 shares; issued and outstanding 20,896,265 shares for 2005 and 20,714,246 shares for 2004 104 104 Additional paid-in capital 27,298 27,141 Accumulated other comprehensive income – foreign currency translation adjustments 27 30 Accumulated deficit (12,349) (12,835) Total stockholders’ equity 15,080 14,440 Total liabilities and stockholders’ equity $ 18,542 $ 18,357
See accompanying Notes to Consolidated Financial Statements. 20

See accompanying Notes to Consolidated Financial Statements. 21
CONSOLIDATED STATEMENTS OF OPERATIONS Years ended March 31, 2005, 2004 and 2003
(in thousands, except per share data) 2005 2004 2003 Net sales $ 11,445 $ 11,582 $ 8,951 Cost of sales 7,627 7,642 6,056 Gross profit 3,818 3,940 2,895 Operating expenses: Research and development 257 149 217 Sales and marketing 1,202 1,239 1,827 General and administrative 1,797 1,823 2,061 Total operating expense 3,256 3,211 4,105 Income (loss) from operations 562 729 (1,210) Other income (expense): Interest income 31 6 33 Interest expense (163) (286) (418) Other income (expense), net 15 25 (189) Total other expense, net (117) (255) (574) Income (loss) before income taxes 445 474 (1,784) Income tax expense (benefit) (41) 75 (9) Net income (loss) $ 486 $ 399 $ (1,775) Net income (loss) per share: Basic $ 0.02 $ 0.02 $ (0.10) Diluted $ 0.02 $ 0.02 $ (0.10) Shares used in calculation of net income (loss) per share: Basic 20,784 18,971 17,840 Diluted 20,979 19,111 17,840

See accompanying Notes to Consolidated Financial Statements. 22
CONSOLIDATED STATEMENTS OF STOCKHOLDERS’ EQUITY AND COMPREHENSIVE INCOME (LOSS) Years ended March 31, 2005, 2004 and 2003
Accumulated Additional Comprehen- Other Com- Total Common Stock Common Paid-in Accumulated sive Income prehensive Stockholders’ (in thousands, except share data) Shares Stock Capital Deficit (Loss) Income (Loss) Equity Balances at March 31, 2002 17,043,701 $ 85 $ 24,567 $ (11,459) $ - $ (2) $ 13,191 Issuances of common stock for: Cash, net of costs of $21 1,265,000 7 623 - - - 630 Non-employee directors’ services, at fair value 8,000 - 5 - - - 5 Issuance of warrants in connection with extension of convertible debentures, at fair value - - 223 - - - 223 Comprehensive loss: Net loss - - - (1,775) (1,775) - (1,775) Other comprehensive loss – foreign currency translation adjustments - - - - (1) (1) (1) Comprehensive loss - - - - (1,776) - - Balances at March 31, 2003 18,316,701 92 25,418 (13,234) - (3) 12,273 Conversion of debentures to common stock 1,923,076 10 1,240 - - - 1,250 Issuances of common stock for: Exercise of stock options for cash 45,800 - 43 - - - 43 Exercise of warrants for cash, net of costs $19 429,234 2 451 - - - 453 Third party services, at fair value 10,000 - 5 - - - 5 Non-employee directors’ services, at fair value 6,000 - 3 - - - 3 Common stock purchased at fair value and cancelled (16,565) - (19) - - - (19) Comprehensive income: Net income - - - 399 399 - 399 Other comprehensive income – foreign currency translation adjustments - - - - 33 33 33 Comprehensive income - - - - 432 - - Balances at March 31, 2004 20,714,246 104 27,141 (12,835) - 30 14,440 Issuances of common stock for: Exercise of stock options for cash 36,019 - 32 - - - 32 Exercise of warrants for cash 132,000 - 104 - - - 104 Non-employee directors’ services, at fair value 14,000 - 15 - - - 15 Issuance of stock options for third party services, at fair value - - 6 - - - 6 Comprehensive income (loss): Net income - - - 486 486 - 486 Other comprehensive loss – foreign currency translation adjustments - - - - (3) (3) (3) Comprehensive income - - - - 483 - - Balances at March 31, 2005 20,896,265 $ 104 $ 27,298 $ (12,349) $ - $ 27 $ 15,080

See accompanying Notes to Consolidated Financial Statements. 23
CONSOLIDATED STATEMENTS OF CASH FLOWS Years ended March 31, 2005, 2004 and 2003
(in thousands) 2005 2004 2003 CASH FLOWS FROM OPERATING ACTIVITIES: Net income (loss) $ 486 $ 399 $ (1,775) Adjustments to reconcile net income (loss) to cash provided by (used in) operating activities: Depreciation and amortization 1,319 1,346 1,324 Amortization of debt issue costs and other assets 27 65 123 Issuance of common stock and stock options in exchange for services 21 8 5 Provision for doubtful accounts 50 36 2 Issuance and revision of warrants in connection with extension of convertible debentures - - 223 Write-down of capital expenditure project - - 80 Net (increase) decrease in assets: Accounts receivable 92 (408) (501) Refundable income taxes (86) (2) - Inventories (466) 301 (406) Prepaid expenses and other assets (1) (65) 132 Net increase (decrease) in liabilities: Accounts payable 103 71 118 Accrued expenses (217) 215 173 Net cash provided by (used in) operating activities 1,328 1,966 (502) CASH FLOWS FROM INVESTING ACTIVITIES: Purchase of short-term investments (1,000) - - Investment in equipment and leasehold improvements (649) (413) (250) Net cash used in investing activities (1,649) (413) (250) CASH FLOWS FROM FINANCING ACTIVITIES: Proceeds from issuance of common stock and exercise of stock options and warrants, net of issuance costs 136 477 630 Release of restricted cash deposit - 250 - Proceeds from issuance of long-term debt - - 1,250 Principal payments on long-term debt (341) (328) (1,541) Debt issue costs - - (59) Net cash provided by (used in) financing activities (205) 399 280 Net increase (decrease) in cash and cash equivalents (526) 1,952 (472) Cash and cash equivalents at beginning of year 2,531 579 1,051 Cash and cash equivalents at end of year $ 2,005 $ 2,531 $ 579 SUPPLEMENTAL DISCLOSURE OF CASH FLOW INFORMATION: Cash paid during the year for: Interest $ 132 $ 260 $ 295 Income taxes $ 178 $ 17 $ - Supplemental disclosure of non-cash financing activities: Conversion of debentures to common stock $ - $ 1,250 $ -

NOTES TO CONSOLIDATED FINANCIAL STATEMENTS
Note 1 Description of Business and Summary of Accounting Policies
Description of Business Cyanotech Corporation (the Company) cultivates and produces high-value, high-quality natural products derived from microalgae. The Company currently cultivates, on a large-scale basis, two microalgal species from which its two major product lines are derived. The Company is currently producing microalgal products for the nutritional supplement, animal feed/pigments and immunological diagnostics markets. The Company manufactures all of its products in the United States and sells its products worldwide. As the Company’s operations are solely related to microalgae-based products, management of the Company considers its operations to be in one industry segment. Correspondingly, the Company records revenue and cost of sales information by product category but does not record operating expenses by such product category.
Accounting Principles The consolidated financial statements and accompanying notes are prepared in accordance with accounting principles generally accepted in the United States of America.
Principles of Consolidation The accompanying consolidated financial statements include the accounts of Cyanotech Corporation and its wholly owned subsidiaries, Nutrex Hawaii, Inc. (“Nutrex Hawaii” or “Nutrex”) and Cyanotech Japan YK (“Cyanotech Japan” or “CJYK”). All significant intercompany balances and transactions have been eliminated in consolidation.
Estimates and Assumptions The preparation of the consolidated financial statements requires management to make estimates and assumptions that affect the reported amounts of assets and liabilities and the disclosure of any contingent assets and liabilities as of the date of the financial statements and the reported amounts of revenues and expenses during the period reported. Management reviews theses estimates and assumptions periodically and reflects the effect of revisions in the period that they are determined to be necessary. Actual results could differ significantly from those estimates and assumptions.
Foreign Currency Translation and Risk The Japanese Yen is the functional currency for Cyanotech Japan. As such, Cyanotech Japan’s assets and liabilities are translated at the exchange rate on the balance sheet date and revenues and expenses are translated at average rates of exchange prevailing during the year. Translation adjustments are charged or credited to accumulated other comprehensive income (loss) in stockholders’ equity. Certain transactions for Cyanotech Japan are exposed to foreign currency risk. The Company actively monitors and manages the balances subject to foreign currency risk. Currently, we do not hedge any of our foreign currency risk.
Financial Instruments Cash and cash equivalents consist of cash and highly liquid debt instruments such as commercial paper and certificates of deposit with maturities of three months or less from the date of purchase. Short-term investments are certificates of deposits maturing between three and nine months from the purchase date and are stated at cost. Interest earned on short-term investments is deposited monthly into an accessible cash account and is therefore classified as cash and cash equivalents. The Company’s practice is to invest cash with financial institutions that have acceptable credit ratings and to limit the amount of credit exposure to any one financial institution.
Statement of Financial Accounting Standards (“SFAS”) No. 107, “Disclosures About Fair Value of Financial Instruments,” defines the fair value of a financial instrument as the amount at which the instrument could be exchanged in a current transaction between willing parties. Management applies the following methods and assumptions in estimating the fair value of each class of financial instruments for all periods presented.
Cash and Cash Equivalents, Short-Term Investments, Accounts Receivable and Accounts Payable Due to the short-term nature of these instruments, management believes that the carrying amounts approximate fair value.
24

Long-Term Debt The carrying amount of long-term debt approximates fair value as interest rates applied to the underlying debt are adjusted quarterly to market interest rates which approximates current interest rates for similar debt instruments of comparable maturities.
Trade Accounts Receivable and Allowance for Doubtful Accounts Trade accounts receivable are recorded at the invoiced amount and do not accrue interest. The allowance for doubtful accounts reflects management’s best estimate of probable credit losses inherent in the accounts receivable balance. The Company determines the allowance based on historical experience, specifically identified nonpaying accounts and other currently available evidence. The Company reviews its allowance for doubtful accounts monthly with focus on significant individual past due balances over 90 days. All other balances are reviewed on a pooled basis. Account balances are charged off against the allowance after all means of collection have been exhausted and the potential for recovery is considered remote. The Company does not have any off-balance sheet credit exposure related to its customers.
Inventories Inventories are stated at the lower of cost (which approximates first-in, first-out) or market.
Equipment and Leasehold Improvements and Long-Lived Assets Equipment and leasehold improvements are stated at cost. Depreciation and amortization are provided using the straight-line method over the estimated useful lives for equipment and furniture and fixtures, or the shorter of the land lease term (see Note 3) or estimated useful lives for leasehold improvements as follows:
Equipment 3 to 10 years Furniture and fixtures 7 years Leasehold improvements 10 to 21 years
The Company accounts for impairment of its equipment or leasehold improvement in accordance with SFAS No. 144. Pursuant to SFAS No. 144, long-lived assets, such as property, plant and equipment and purchased intangibles subject to amortization shall be reviewed for impairment whenever events or changes in circumstances indicate that the carrying amount of an asset may not be recoverable. Recoverability of assets to be held and used is measured by a comparison of the carrying amount of an asset to the estimated undiscounted future cash flows expected to be generated by the asset. If the carrying amount of an asset exceeds its estimated future cash flows, an impairment charge is recognized to the extent that the carrying amount exceeds the asset’s fair value.
Assets to be disposed of and related liabilities would be separately presented in the consolidated balance sheet. Assets to be disposed of would be reported at the lower of the carrying value or fair value less costs to sell and would not be depreciated.
SFAS No. 143 “Accounting for Asset Retirement Obligations” requires the fair value of a liability for an asset retirement obligation to be recognized in the period in which it is incurred if a reasonable estimate of fair value can be made. The associated asset retirement costs would be capitalized as part of the carrying amount of the long-lived asset and depreciated over the life of the asset. The liability is accreted at the end of each period through charges to operating expense. If the obligation is settled for other than the carrying amount of the liability, the Company will recognize a gain or loss on settlement.
Revenue Recognition The Company recognizes revenues when goods are shipped (FOB shipping point) and when significant risks and benefits of ownership are transferred.
Research and Development and Advertising Research and development and advertising costs are expensed as incurred.
25
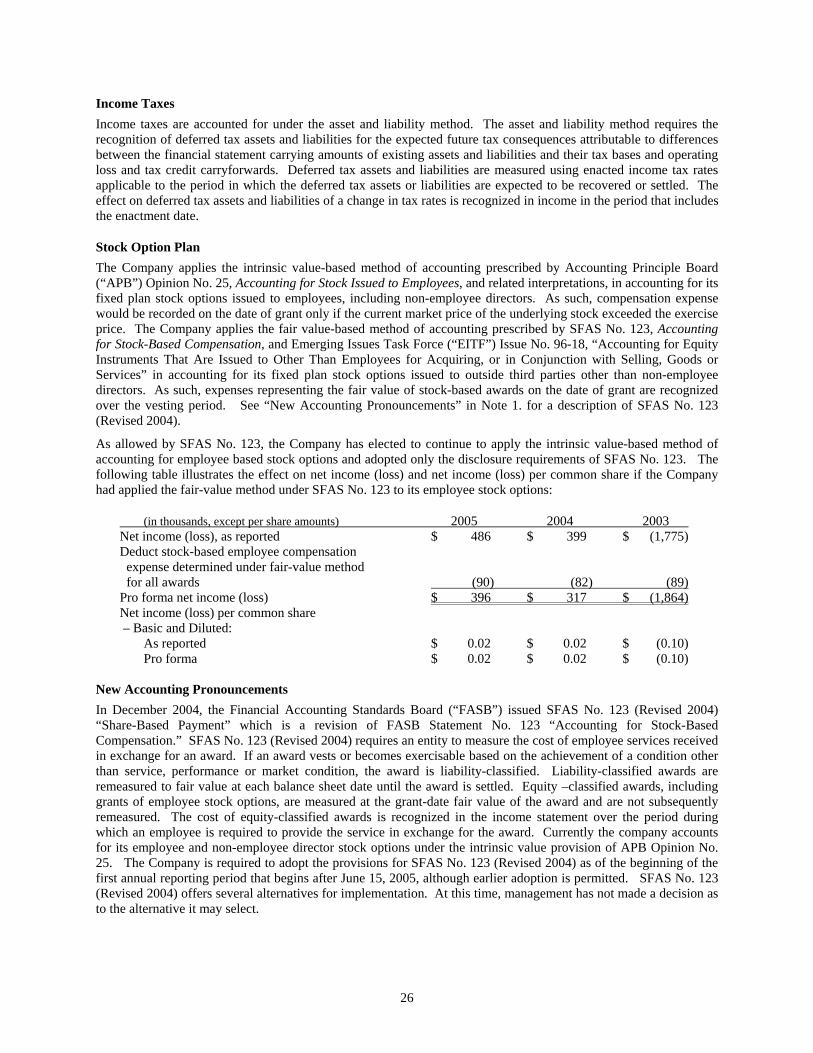
Income Taxes Income taxes are accounted for under the asset and liability method. The asset and liability method requires the recognition of deferred tax assets and liabilities for the expected future tax consequences attributable to differences between the financial statement carrying amounts of existing assets and liabilities and their tax bases and operating loss and tax credit carryforwards. Deferred tax assets and liabilities are measured using enacted income tax rates applicable to the period in which the deferred tax assets or liabilities are expected to be recovered or settled. The effect on deferred tax assets and liabilities of a change in tax rates is recognized in income in the period that includes the enactment date.
Stock Option Plan The Company applies the intrinsic value-based method of accounting prescribed by Accounting Principle Board (“APB”) Opinion No. 25, Accounting for Stock Issued to Employees, and related interpretations, in accounting for its fixed plan stock options issued to employees, including non-employee directors. As such, compensation expense would be recorded on the date of grant only if the current market price of the underlying stock exceeded the exercise price. The Company applies the fair value-based method of accounting prescribed by SFAS No. 123, Accounting for Stock-Based Compensation, and Emerging Issues Task Force (“EITF”) Issue No. 96-18, “Accounting for Equity Instruments That Are Issued to Other Than Employees for Acquiring, or in Conjunction with Selling, Goods or Services” in accounting for its fixed plan stock options issued to outside third parties other than non-employee directors. As such, expenses representing the fair value of stock-based awards on the date of grant are recognized over the vesting period. See “New Accounting Pronouncements” in Note 1. for a description of SFAS No. 123 (Revised 2004).
As allowed by SFAS No. 123, the Company has elected to continue to apply the intrinsic value-based method of accounting for employee based stock options and adopted only the disclosure requirements of SFAS No. 123. The following table illustrates the effect on net income (loss) and net income (loss) per common share if the Company had applied the fair-value method under SFAS No. 123 to its employee stock options:
(in thousands, except per share amounts) 2005 2004 2003 Net income (loss), as reported $ 486 $ 399 $ (1,775) Deduct stock-based employee compensation expense determined under fair-value method for all awards (90) (82) (89) Pro forma net income (loss) $ 396 $ 317 $ (1,864) Net income (loss) per common share – Basic and Diluted: As reported $ 0.02 $ 0.02 $ (0.10) Pro forma $ 0.02 $ 0.02 $ (0.10) New Accounting Pronouncements In December 2004, the Financial Accounting Standards Board (“FASB”) issued SFAS No. 123 (Revised 2004) “Share-Based Payment” which is a revision of FASB Statement No. 123 “Accounting for Stock-Based Compensation.” SFAS No. 123 (Revised 2004) requires an entity to measure the cost of employee services received in exchange for an award. If an award vests or becomes exercisable based on the achievement of a condition other than service, performance or market condition, the award is liability-classified. Liability-classified awards are remeasured to fair value at each balance sheet date until the award is settled. Equity –classified awards, including grants of employee stock options, are measured at the grant-date fair value of the award and are not subsequently remeasured. The cost of equity-classified awards is recognized in the income statement over the period during which an employee is required to provide the service in exchange for the award. Currently the company accounts for its employee and non-employee director stock options under the intrinsic value provision of APB Opinion No. 25. The Company is required to adopt the provisions for SFAS No. 123 (Revised 2004) as of the beginning of the first annual reporting period that begins after June 15, 2005, although earlier adoption is permitted. SFAS No. 123 (Revised 2004) offers several alternatives for implementation. At this time, management has not made a decision as to the alternative it may select.
26

In November 2004, the FASB issued SFAS No. 151 “Inventory Costs – an amendment of Accounting Research Bulletin No. 43, Chapter 4”. SFAS No. 151 requires that abnormal amounts of freight, handling costs and wasted material (spoilage) be recognized as current-period charges and fixed production overhead costs be allocated to inventory based on the normal capacity of production facilities. Normal capacity is defined as “the production expected to be achieved over a number of periods or seasons under normal circumstances, taking into account the loss of capacity resulting from planned maintenance.” Companies will no longer be permitted to capitalize inventory costs on the balance sheet when the production defect rate varies significantly from the expected defect rate. SFAS No. 151 is effective for inventory costs incurred during fiscal years beginning after June 15, 2005. Earlier application is permitted for inventory costs incurred during fiscal years beginning after November 24, 2004. The Company has yet to determine the impact, if any, of SFAS No. 151 on its consolidated financial statements.
In December 2004, the FASB issued SFAS No. 153, “Exchange of Nonmonetary Assets, an amendment of APB Opinion No. 29, ‘Accounting for Nonmonetary Transactions.’” SFAS No. 153 is based on the principle that exchange of nonmonetary assets should be measured based on the fair market value of the assets exchanged. SFAS No. 153 eliminates the exception of nonmonetary exchanges of similar productive assets and replaces it with a general exception for exchanges of nonmonetary assets that do not have commercial substance. SFAS No. 153 is effective for nonmonetary asset exchanges in fiscal periods beginning after June 15, 2005. Adoption of the provisions of SFAS No. 153 is not expected to have a material impact on the Company’s financial condition, results of operations, or liquidity. In March 2005, the FASB issued FASB Interpretation No. 47 (“FIN 47”), “Accounting for Conditional Asset Retirement Obligations — an interpretation of FASB Statement No. 143.” FIN 47 clarifies that the term “conditional asset retirement obligation” as used in FASB Statement No. 143, “Accounting for Asset Retirement Obligations,” refers to a legal obligation to perform an asset retirement activity in which the timing and (or) method of settlement are conditional on a future event that may or may not be within the control of the entity. Accordingly, an entity is required to recognize a liability for the fair value of a conditional asset retirement obligation if the fair value of the liability can be reasonably estimated. FIN 47 is effective for fiscal years ending after December 15, 2005. The Company has yet to determine the impact, if any, of FIN 47 on its consolidated financial statements. On March 29, 2005, the Securities and Exchange Commission (SEC) staff issued Staff Accounting Bulletin No. 107, “Share-Based Payment” (SAB No. 107), which expressed the SEC staff’s views on Statement No. 123R, but did not modify any of Statement No. 123R’s provisions. The Company is evaluating the views expressed by the SEC in SAB No. 107 in conjunction with its assessment of Statement No. 123R’s impact to the Company.
In May 2005, the FASB issued SFAS No. 154, "Accounting Changes and Error Corrections, a replacement of APB Opinion No. 20 and FASB Statement No. 3." SFAS No. 154 requires retrospective application for voluntary changes in accounting principle unless it is impracticable to do so. In addition, indirect effects of a change in accounting principle should be recognized in the period of the accounting change. SFAS No. 154 is effective for accounting changes and corrections of errors made in fiscal years beginning after December 15, 2005.
Note 2 Inventories
Inventories consists of the following as of March 31, 2005 and 2004: (in thousands) 2005 2004 Raw materials $ 246 $ 191 Work in process 243 154 Finished goods 957 567 Supplies 119 187 $ 1,565 $ 1,099
27

Note 3 Equipment and Leasehold Improvements, Net
Equipment and leasehold improvements consists of the following as of March 31, 2005 and 2004: (in thousands) 2005 2004 Equipment $ 10,241 $ 9,753 Leasehold improvements 14,603 14,326 Furniture and fixtures 86 83 24,930 24,162 Less accumulated depreciation and amortization (14,006) (12,687) Construction in-progress 250 369 $ 11,174 $ 11,844 Note 4 Accrued Expenses
Components of accrued expenses as of March 31, 2005 and 2004 are as follows: (in thousands) 2005 2004 Accrued wages, commissions and royalties $ 158 $ 214 Accrued income taxes - 119 Accrued interest 11 11 Other accrued expenses 218 260 $ 387 $ 604 Note 5 Long-Term Debt
Long-term debt consists of the following as of March 31, 2005 and 2004: (in thousands) 2005 2004 Term loan $ 2,098 $ 2,439 Less current maturities (355) (346) Long-term debt, excluding current maturities $ 1,743 $ 2,093 At March 31, 2005, the aggregate maturities of long-term debt are as follows: Year ending March 31: (in thousands) 2006 $ 355 2007 378 2008 402 2009 428 2010 456 Thereafter 79 $ 2,098 Term Loan Agreement In April 2000, the Company executed a Term Loan Agreement (“Term Loan”) with a lender providing for $3.5 million in aggregate credit facilities, secured by the Company’s assets. The Term Loan has a maturity date of May 1, 2010 and is payable in 120 equal monthly principal and interest payments. The interest rate under this Term Loan, in the absence of a default under the agreement, is the prime rate, in effect as of the close of business on the first day of each calendar quarter, plus 1%. As of March 31, 2005 and 2004, the prime rate was 5.25% and 4.0%, respectively. The Company is in compliance with all restrictive covenants of the Term Loan as of March 31, 2005. The Company is prohibited from declaring any common stock dividends without the lender’s prior written consent. A warrant to purchase 20,000 shares of the Company’s common stock was issued in conjunction with this Term Loan. The warrant expires in April 2011 and has an exercise price of $2.55 per share. The warrant may only be exercised after the Company has repaid the Term Loan in full.
28

Of the loan proceeds, $500,000 had been deposited in an interest-bearing restricted cash account per the terms of the Term Loan. In July 2003, the Company received $250,000 of cash previously held as a restricted deposit. The remaining $250,000 restricted cash deposit continues to be held in the restricted cash account and is included in Other Assets in the accompanying consolidated Balance Sheets at March 31, 2005 and 2004.
Convertible Debentures In October 2002, the Company issued in a private placement $1,250,000 principal amount 10% convertible subordinated debentures (the “Debentures”) and 750,000 shares of common stock. Subsequent to this transaction, the debenture holder was elected to the Company’s Board of Directors. In December 2003, the holder of the Debentures voluntarily converted the entire $1,250,000 principal amount into 1,923,076 shares of common stock at a conversion price of $0.65 per share pursuant to the terms of the Debentures.
Proceeds from the Debentures were used in October 2002 to retire $1,238,000 of convertible debentures issued in May 2000 (the “May 2000 Debentures”). The May 2000 Debentures which originally totaled $1,250,000, were convertible into shares of the Company’s common stock and were originally due to mature on April 30, 2002. In addition, warrants were issued in May 2000 to the placement agent to purchase 83,334 shares of the Company’s common stock. In May 2002, the maturity of the May 2000 Debentures was extended six months to October 31, 2002. In exchange for the six months maturity extension, the terms of the May 2000 Debentures were revised:
Original Terms Renegotiated Terms Maturity date April 30, 2002 October 31, 2002 Interest rate 6% per annum 10% per annum Conversion price $1.50 per share $1.00 per share Warrant terms: Number of shares 83,334 shares 454,734 shares Exercise price $1.80 per share $1.10 per share Expiration date May 2005 May 2004 As a result of the renegotiation of the May 2000 Debentures, the Company recorded a charge of approximately $236,000 during the year ended March 31, 2003, of which approximately $223,000 was a non-cash charge. The charge was recorded as Other Expense, Net in the accompanying Consolidated Statement of Operations for the year ended March 31, 2003.
Note 6 Leases
The Company leases facilities, equipment and land under operating leases expiring between 2005 and 2025. The land lease provides for contingent rentals in excess of minimum rental commitments based on a percentage of the Company’s sales. Contingent rental for the years ended March 31, 2005 and 2004 was $88,000 and $39,000, respectively. Contingent rentals for fiscal year 2003 were not material.
Future minimum lease payments under non-cancelable operating leases at March 31, 2005 are as follows:
Year ending March 31: (in thousands) 2006 $ 251
2007 223 2008 223 2009 186 2010 148 Thereafter through 2025 2,331 Total minimum lease payments $ 3,362 Rent expense under operating leases amounted to $338,000, $271,000 and $218,000 for the years ended March 31, 2005, 2004 and 2003, respectively.
29

Note 7 Stock Options and Warrants
Stock Options The Company has a stock option plan, approved by stockholders in 1995 (the “1995 Plan”), that provides for the issuance of both incentive and non-qualified stock options. Options are granted at, or above, the fair market value of the Company’s common stock at the date of grant and generally become exercisable over a five-year period. 800,000 shares of common stock were reserved for issuance under the 1995 Plan.
On August 16, 2004, the stockholders approved the Independent Director Stock Option and Stock Grant Plan (the “2004 Plan”). 300,000 shares of common stock are reserved for issuance under the 2004 Plan. Under the 2004 Plan, upon election to the Board of Directors, a newly elected non-employee director is granted a ten-year option to purchase 4,000 shares of the Company’s common stock at a fair market value on the date of grant. In addition, on the date of each Annual Meeting of Stockholders, each non-employee director continuing in office will be automatically granted, without payment, 3,500 shares of common stock, non-transferable for six months following the date of grant. Concurrently with the 2004 Plan approval, the 1994 Non-Employee Director Stock Option and Stock Grant Plan was terminated except for the outstanding options issued thereunder.
Previously under the terminated 1994 Plan, upon election to the Board of Directors, non-employee directors were granted a ten-year option to purchase 3,000 shares of the Company’s common stock at fair market value on the date of grant. In addition, on the date of each Annual Meeting of Stockholders, each non-employee director continuing in office was granted, without payment, 2,000 shares of common stock, non-transferable for six months following the date of grant. Expense recognized from the 2004 Plan and the 1994 Plan grants of shares of common stock for the years ended March 31, 2005, 2004 and 2003 was $15,000, $3,000 and $5,000, respectively.
At March 31, 2005, there were 127,194 shares available for grant under the 1995 Plan and 282,000 shares available under the 2004 Plan. The per share weighted average fair value of stock options granted during 2005, 2004 and 2003 was $0.80, $0.38 and $0.48, respectively, on the date of grant using a Black Scholes option pricing model with the following weighted average assumptions:
2005 2004 2003 Expected dividend yield 0% 0% 0% Risk-free interest rate 4.5% 4.5% 3.3% Expected volatility 104% 97% 113% Expected life in years 4.0 5.0 4.0 Activity for stock options outstanding during the periods indicated were as follows:
Weighted Number of Average Shares Exercise Price Balance at March 31, 2002 740,696 $ 2.10 Granted 142,500 0.59 Exercised - - Expired (72,900) 6.31 Forfeited (51,600) 1.46 Balance at March 31, 2003 758,696 1.46 Granted 190,400 0.49 Exercised (45,800) 0.95 Expired (75,900) 3.13 Forfeited (171,700) 1.31 Balance at March 31, 2004 655,696 1.06 Granted 139,095 1.10 Exercised (36,019) 0.88 Expired (58,952) 1.12 Forfeited (93,833) 1.00 Balance at March 31, 2005 605,987 1.09
30

The following table summarizes the weighted average characteristics of outstanding stock options at March 31, 2005 for various exercise price ranges:
Outstanding Options Exercisable Options Number of Remaining Weighted Number of Weighted Range of Exercise Prices Shares Life (Years) Average Price Shares Average Price $ 0.46 – $ 0.77 266,098 3.0 $ 0.55 141,541 $ 0.57 $ 1.03 – $ 1.69 311,889 2.1 1.29 198,729 1.40 $ 3.69 – $ 6.13 28,000 2.9 3.95 28,000 3.95
Warrants The Company had issued warrants which allow the warrant holders rights to acquire an equivalent number of shares of common stock at a stated exercise price. Warrants outstanding during the periods indicated were as follows:
Warrants issued in connection with: 50,000 Shares 3rd Party Purchased by Term Loan Debentures Services Stockholder (See Note 5) (See Note 5) Grant date: December 1999 January 2000 April 2000 May 2000 & May 2002 Expiration date: December 2004 January 2005 April 2011 May 2004 Exercise price: $ 0.63 $ 1.00 $ 2.55 $ 1.10 Total Balance at March 31, 2002 75,000 50,000 20,000 83,334 228,334 Granted in May 2002 in connection with Debentures maturity extension (see Note 5) - - - 371,400 371,400 Balance at March 31, 2003 75,000 50,000 20,000 454,734 599,734 Exercises - - - (429,234) (429,234) Balance at March 31, 2004 75,000 50,000 20,000 25,500 170,500 Exercises (75,000) (50,000) - (7,000) (132,000) Expired - - - (18,500) (18,500) Balance at March 31, 2005 - - 20,000 - 20,000
Note 8 Earnings Per Share
Basic earnings per share is computed on the basis of the weighted average number of common shares outstanding. Diluted earnings per share is computed on the basis of the weighted average number of common shares outstanding plus the potentially dilutive effect of outstanding stock options and warrants using the “treasury stock” method and convertible securities using the “if-converted” method. Reconciliations between the numerator and the denominator of the basic and diluted earnings per share computations for the years ended March 31, 2005 and 2004 are as follows (there were no reconciling items for the year ended March 31, 2003):
Net Income Shares Per Share (in thousands, except per share amounts) (Numerator) (Denominator) Amount Year ended March 31, 2005: Basic earnings per share $ 486 20,784 $ 0.02 Effect of dilutive securities - Common stock options and warrants - 195 Diluted earnings per share $ 486 20.979 $ 0.02 Year ended March 31, 2004: Basic earnings per share $ 399 18,971 $ 0.02 Effect of dilutive securities - Common stock options and warrants - 140 Diluted earnings per share $ 399 19,111 $ 0.02
31

The following securities were excluded from the calculation of diluted earnings per share because their effect was antidilutive: 2005 2004 2003 (in thousands) Debentures, prior to conversion (see Note 5) - 1,329 1,923 Stock options and warrants 158 441 1,358
Note 9 Profit Sharing Plan
The Company sponsors a profit sharing plan for all employees not covered under a separate management incentive plan. Under the profit sharing plan, 5% of pre-tax profits on a quarterly basis may be allocated to non-management employees based on gross wages. At management’s discretion, the profit sharing bonus may be distributed all in cash on an after-tax basis or distributed half in cash (on an after-tax basis) and the remainder deposited in an employee’s 401(k) account on a pre-tax basis with a six year vesting schedule, based on years of service with the Company. All employees may make voluntary pre-tax contributions to their 401(k) accounts; Company contributions are discretionary. For the years ended March 31, 2005, 2004 and 2003 compensation expense relative to this plan was approximately $30,000, $36,000 and nil, respectively.
Note 10 Major Customers and Geographic Information
Net sales by product line for the years 2005, 2004 and 2003 are as follows:
(in thousands) 2005 2004 2003 Net sales: Spirulina products $ 6,626 $ 6,511 $ 6,181 Natural astaxanthin products NatuRose 1,817 2,545 1,301 BioAstin 2,855 2,388 1,312 Other products 147 138 157 $ 11,445 $ 11,582 $ 8,951 Approximately $1,130,000, or 10% of our total net sales for the year ended March 31, 2005 was to a single customer. Sales to this customer for fiscal 2004 and 2003 were $1,560,000 (13% of net sales) and $1,546,000 (17% of net sales), respectively.
The following table presents sales for the years 2005, 2004 and 2003 by geographic region:
(dollars in thousands) 2005 2004 2003 Net sales (1): United States $ 5,847 51% $ 4,918 42% $ 4,149 46% Japan 1,759 16% 2,020 17% 1,043 12% The Netherlands 1,180 10% 1,562 14% 1,550 17% Other areas 2,659 23% 3,082 27% 2,209 25% $ 11,445 100% $ 11,582 100% $ 8,951 100% (1) Net sales are attributed to countries based on location of customer. Substantially all long-lived assets are located in the United States as of March 31, 2005 and 2004.
Note 11 Income Taxes
Income (loss) before income taxes consisted of:
(in thousands) 2005 2004 2003 United States $ 375 $ 224 $ (1,817) Foreign 70 250 33 Income (loss) before income taxes $ 445 $ 474 $ (1,784)
32

Income tax expense (benefit) for the years ended March 31, 2005, 2004 and 2003 consisted of:
(in thousands) 2005 2004 2003 Current: Foreign $ 11 $ 121 $ - Federal (5) 5 - State (62) (33) (9) Total current (56) 93 (9) Deferred: Foreign 15 (18) - Federal - - - State - - - Total deferred 15 (18) - Income tax expense (benefit) $ (41) $ 75 $ (9)
The following table reconciles the amount of income taxes computed at the federal statutory rate of 34%, for all periods presented, to the amount reflected in the Company’s consolidated statement of operations for the years ended March 31, 2005, 2004 and 2003:
(in thousands) 2005 2004 2003 Tax provision at federal statutory income tax rate $ 151 $ 161 $ (607) State income taxes, net of federal income tax effect (41) (22) (6) Foreign income taxes in excess of federal statutory income tax rate 2 36 - Increase (decrease) in valuation allowance for deferred tax assets 55 (188) 727 Adjustment of deferred tax assets (163) - - Other, net (45) 88 (123) Income tax expense (benefit) $ (41) $ 75 $ (9) The tax effects of temporary differences related to various assets, liabilities and carryforwards that give rise to deferred tax assets and deferred tax liabilities as of March 31, 2005 and 2004 are as follows:
(in thousands) 2005 2004 Deferred tax assets: Net operating loss carryforwards $ 5,340 5,295 Impairment loss on leasehold improvements for financial reporting purposes 1,062 1,062 Tax credit carryforwards 115 119 Other 169 199 Gross deferred tax assets 6,686 6,675 Less valuation allowance (5,133) (5,078) Net deferred tax assets 1,553 1,597 Deferred tax liability: Differences in depreciation and amortization on equipment and leasehold improvements (1,550) (1,579) Net deferred tax assets $ 3 $ 18
In assessing the realizability of deferred tax assets, management considers whether it is more likely than not that some portion or all of the deferred tax assets will not be realized. The ultimate realization of deferred tax assets is dependent upon the generation of future taxable income during the periods in which those temporary differences become deductible. Management considers the scheduled reversal of deferred tax liabilities, projected future taxable income and tax planning strategies in making this assessment. Based upon the level of historical taxable income and projections for future taxable income over the periods in which net deferred tax assets are deductible, management does not believes it is more likely than not the Company will realize a portion of its gross deferred tax assets, and has thus established a valuation allowance to reflect its estimated realizability. The amount of the deferred tax assets considered realizable, however, could be reduced in the near term if estimates of future taxable income during the carryforward period are reduced.
33

At March 31, 2005, the Company has net operating loss carryforwards and tax carryfowards available to offset future federal income tax as follows (in thousands):
Research and Net Operating Experimentation Expires March 31, Losses Tax Credits 2011 $ - $ 23 2012 - 9 2013 1,514 - 2019 3,632 - 2020 2,051 - 2021 1,727 - 2022 3,161 - 2023 1,977 - $ 14,062 $ 32 In addition, at March 31, 2005, the Company has alternative minimum tax credit carryforwards of approximately $83,000 available to reduce future federal regular income taxes over an indefinite period.
At March 31, 2005, the Company has state tax net operating loss carryforwards of $9,322,000, which expire in March 31, 2019 through 2023, available to offset future Hawaii state taxable income.
Note 12 Commitments and Contingencies
During the third quarter of fiscal 2004, a final royalty payment was made to Aquasearch under a confidential agreement relating to the settlement of a patent suit. The patent suit was settled in the fourth quarter of fiscal 2001 with agreement of the parties to dismiss, with prejudice, all claims asserted in the litigation. In compliance with this settlement, the Company made a lump sum payment and paid royalties on sales of BioAstin during fiscal 2002 through 2004.
Note 13 Selected Quarterly Financial Data (Unaudited)
First Second Third Fourth (in thousands, except per share data) Quarter Quarter Quarter Quarter Year 2005 Net sales $ 2,707 $ 2,998 $ 3,180 $ 2,560 $ 11,445 Gross profit 887 1,054 1,163 714 3,818 Net income (loss) 113 121 326 (74) 486 Net income (loss) per share – Basic and Diluted 0.01 0.01 0.02 (0.00) 0.02 2004 Net sales $ 2,428 $ 2,840 $ 3,024 $ 3,290 $ 11,582 Gross profit 704 861 1,184 1,191 3,940 Net income (loss) (141) (10) 109 441 399 Net income (loss) per share – Basic and Diluted (0.01) (0.00) 0.01 0.02 0.02
As a normal course of business, adjustments are recorded in the consolidated financial statements to fairly represent the Company’s financial condition, results of operations or liquidity. During the fourth quarter of fiscal 2005, adjustments were made to properly state certain accrued liabilities related to general and administrative operating expenses and receivables related to income tax benefits of approximately $70,000. These adjustments related to previously reported periods but would not have had a material impact on any such previously reported period.
34

Item 9. Changes in and Disagreements with Accountants on Accounting and Financial Disclosure
Not applicable.
Item 9A. Controls and Procedures
Under the supervision and with the participation of management, including the Chief Executive Officer and Chief Financial Officer, we have evaluated the effectiveness of the design and operation of our disclosure controls and procedures as of the end of the period covered by this report. Based on that evaluation, the Chief Executive Officer and Chief Financial Officer have concluded that these disclosure controls and procedures are effective to ensure that the information required to be disclosed by the Company is recorded, processed, summarized and reported in accordance with Securities and Exchange Commission rules and forms. Subsequent to the date of our evaluation, there were no changes in our internal control over financial reporting that have materially affected, or are reasonably likely to materially affect, our internal controls over financial reporting.
PART III
Item 10. Directors and Executive Officers of the Registrant
Information with respect to Directors may be found under captions “Proposal One: Election of Directors,” “Board Meetings and Committees,” “Security Ownership of Certain Beneficial Owners and Management” and “Compliance with Section 16(a) of the Exchange Act” contained in Cyanotech’s definitive 2005 Proxy Statement. Information on Executive Officers may be found under the caption “Executive Officers” contained in Cyanotech’s definitive 2005 Proxy Statement. Such information is incorporated herein by reference.
We have adopted the Cyanotech Code of Ethics for Chief Executive Officer and Senior Financial Officers (the “Code of Ethics”) included in our Code of Conduct. Our Code of Ethics is publicly available on our website at www.cyanotech.com. If we make any substantive amendments to or grant any waivers from the Code of Ethics relating to our Chief Executive Officer, Chief Financial Officer or Controller, we will disclose the nature of such amendment in a report on Form 8-K.
Item 11. Executive Compensation
The information required by this Item is incorporated herein by reference from the sections captioned “Executive Compensation and Other Information,” “Director Remuneration” and “Stockholder Return Performance Graph” contained in Cyanotech’s definitive 2005 Proxy Statement.
Item 12. Security Ownership of Certain Beneficial Owners and Management
The security ownership information required by this Item is incorporated herein by reference from the sections captioned “Equity Compensation Plan Information” and “Security Ownership of Certain Beneficial Owners and Management” contained in Cyanotech’s definitive 2005 Proxy Statement.
Item 13. Certain Relationships and Related Transactions
Not applicable.
Item 14. Principal Accountant Fees and Services
Information concerning principal accountant fees and services appears in Cyanotech’s definitive 2005 Proxy Statement under the heading “Independent Registered Public Accounting Firm’s Fees” and is incorporated herein by reference.
35

PART IV
Item 15. Exhibits, Financial Statement Schedules and Reports on Form 8-K
(a) Financial Statements and Schedules
(1) The following Financial Statements of Cyanotech Corporation and subsidiaries and the Report of Independent Registered Public Accounting Firm are included in Item 8 of this report: Consolidated Balance Sheets, March 31, 2005 and 2004 Consolidated Statements of Operations for the years ended March 31, 2005, 2005 and 2003 Consolidated Statements of Stockholders’ Equity and Comprehensive Income (Loss) for the
years ended March 31, 2005, 2004 and 2003 Consolidated Statements of Cash Flows for the years ended March 31, 2005, 2004 and 2003 Notes to Consolidated Financial Statements
(2) The following financial statement schedule is included in this report on the pages indicated below:
Schedule II – Valuation and Qualifying Accounts ……………………….… 38 Report of Independent Registered Public Accounting Firm………………… 39
Financial statement schedules not listed above have been omitted since they are either not required, not applicable or the information is included in the consolidated financial statements or notes thereto.
(b) Reports on Form 8-K
(1) A report on Form 8-K dated January 31, 2005 included Items 2.02-Results of Operations and Financial Condition and 9.01-Financial Statements and Exhibits, in conjunction with the Company’s press release and transcript of investor call announcing the financial results for the quarter ended December 31, 2004.
(2) A report on Form 8-K dated April 25, 2005 included Items 7.01-Regulation FD Disclosure, 8.01-Other Events and 9.01-Financial Statements and Exhibits, referencing a press release issued by Earthrise Nutritionals LLC in which the Company was mentioned.
(3) A report on Form 8-K dated May 18, 2005 included Items 2.02-Results of Operations and Financial Condition and 9.01-Financial Statements and Exhibits, in conjunction with the Company’s press release and transcript of investor call announcing the financial results for the quarter and fiscal year ended March 31, 2005.
(4) A report on Form 8-K dated June 8, 2005 included Items 8.01 – Other Events and 9.01 – Financial Statements and Exhibits, in conjunction with the Company’s press release announcing results of testing on its Spirulina.
36

(c) Exhibit Listing
Exhibit Number Document Description 3.1 Restated Articles of Incorporation (Incorporated by reference to Exhibit 3.1 to
the Company’s Quarterly Report on Form 10-QSB for the quarter ended December 31, 1996, File No. 0-14602)
3.2 Bylaws of the Registrant, as amended (Incorporated by reference to Exhibit 3.1 to the Company’s Quarterly Report on Form 10-QSB for the quarter ended December 31, 1996, File No. 0-14602)
4.1 Specimen Common Stock Certificate (Incorporated by reference to Exhibit 4.1 to The Company’s Registration Statement on Form SB-2 filed on February 28, 1996, File No. 333-00951)
10.1 1994 Non-Employee Directors Stock Option and Stock Grant Program (Incorporated by reference to Exhibit 10.7 to the Company’s Annual Report on Form 10-KSB for the fiscal year ended March 31, 1994, File No. 0-14602)
10.2 1995 Stock Option Plan for Cyanotech Corporation dated August 9, 1995, as amended (Incorporated by reference to Exhibit 4(c) to the Company’s Registration Statement on Form S-8 filed on October 27, 1995, File No. 33-63789)
10.3 Sub-Lease Agreement between the Company and Natural Energy Laboratory of Hawaii Authority dated December 29, 1995 (Incorporated by reference to Exhibit 10.1 to the Company’s Quarterly Report on Form 10-QSB for the quarter ended December 31, 1995, File No. 0-14602)
10.4 Term Loan Agreement dated April 21, 2000 between the Company and B&I Lending, LLC (Incorporated by reference to Exhibit 10.11 to the Company’s Annual Report on Form 10-K for the year ended March 31, 2000, File No. 0-14602)
14.1 Code of Ethics for Chief Executive Officer and Senior Financial Officers (Incorporated by reference to Exhibit E to the Company’s definitive 2004 Proxy Statement)
21.1 Subsidiaries of the Company (Incorporated by reference to Exhibit 21.1 to the Company’s Annual Report on Form 10-K for the year ended March 31, 2003, File No. 0-14602)
23.1 Consent of Independent Registered Public Accounting Firm 31.1 Certifications of Chief Executive Officer Pursuant to Section 302 of the
Sarbanes-Oxley Act of 2002 31.2 Certifications of Chief Financial Officer Pursuant to Section 302 of the
Sarbanes-Oxley Act of 2002 32.1 Certifications of Chief Executive Officer Pursuant to Section 906 of the
Sarbanes-Oxley Act of 2002 32.2 Certifications of Chief Financial Officer Pursuant to Section 906 of the
Sarbanes-Oxley Act of 2002 99.1 Risk Factors
37

Schedule II
Cyanotech Corporation and Subsidiaries Valuation and Qualifying Accounts
Years Ended March 31, 2005, 2004 and 2003
(In Thousands)
Additions Balance at Charged to Charged to Balance at Beginning Costs and Other End of Description of Year Expense Accounts Deductions Year Allowance for Doubtful Receivables: 2005 $ 96 $ 31 $ - $ 81 $ 46 2004 $ 60 $ 37 $ - $ 1 $ 96 2003 $ 40 $ 70 $ - $ 50 $ 60
38

REPORT OF INDEPENDENT REGISTERED PUBLIC ACCOUNTING FIRM
The Board of Directors Cyanotech Corporation:
Under date of June 6, 2005, we reported on the consolidated balance sheets of Cyanotech Corporation and subsidiaries (the Company) as of March 31, 2005 and 2004, and the related consolidated statements of operations, stockholders’ equity and comprehensive income (loss), and cash flows for each of the years in the three-year period ended March 31, 2005, which are included in the Company’s March 31, 2005 annual report on Form 10-K. In connection with our audits of the aforementioned consolidated financial statements, we also audited the related financial statement schedule as listed in Item 15(a)(2). The financial statement schedule is the responsibility of the Company’s management. Our responsibility is to express an opinion on the financial statement schedule based on our audits.
In our opinion, such financial statement schedule, when considered in relation to the basic consolidated financial statements taken as a whole, presents fairly, in all material respects, the information set forth therein.
/s/ KPMG LLP Honolulu, Hawaii June 6, 2005
39
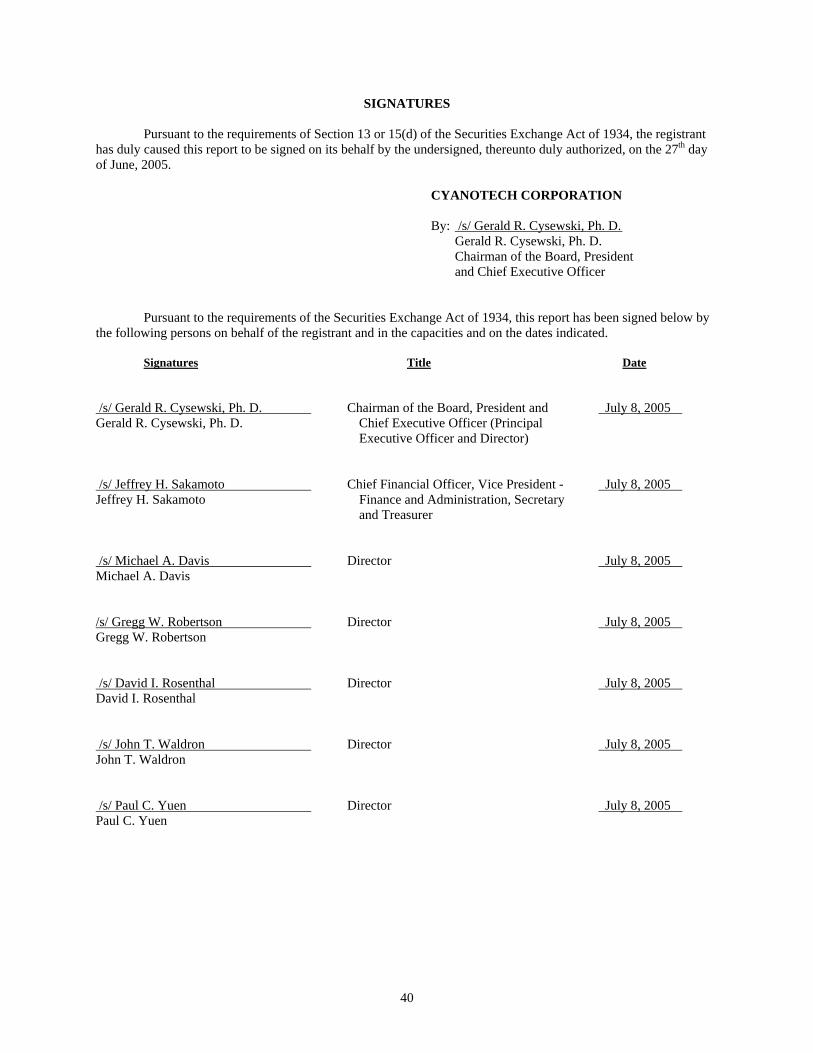
SIGNATURES Pursuant to the requirements of Section 13 or 15(d) of the Securities Exchange Act of 1934, the registrant has duly caused this report to be signed on its behalf by the undersigned, thereunto duly authorized, on the 27th day of June, 2005. CYANOTECH CORPORATION By: /s/ Gerald R. Cysewski, Ph. D. Gerald R. Cysewski, Ph. D. Chairman of the Board, President and Chief Executive Officer Pursuant to the requirements of the Securities Exchange Act of 1934, this report has been signed below by the following persons on behalf of the registrant and in the capacities and on the dates indicated. Signatures Title Date /s/ Gerald R. Cysewski, Ph. D. Chairman of the Board, President and July 8, 2005 Gerald R. Cysewski, Ph. D. Chief Executive Officer (Principal Executive Officer and Director) /s/ Jeffrey H. Sakamoto Chief Financial Officer, Vice President - July 8, 2005 Jeffrey H. Sakamoto Finance and Administration, Secretary and Treasurer /s/ Michael A. Davis Director July 8, 2005 Michael A. Davis /s/ Gregg W. Robertson Director July 8, 2005 Gregg W. Robertson /s/ David I. Rosenthal Director July 8, 2005 David I. Rosenthal /s/ John T. Waldron Director July 8, 2005 John T. Waldron /s/ Paul C. Yuen Director July 8, 2005 Paul C. Yuen
40

Exhibit 23.1
CONSENT OF INDEPENDENT REGISTERED PUBLIC ACCOUNTING FIRM
The Board of Directors Cyanotech Corporation:
We consent to the incorporation by reference in the Registration Statement Nos. 33-63789, 33-55310, and 333-42484 on Form S-8 and 333-42486 and 333-101401 on Form S-3 of Cyanotech Corporation of our reports dated June 6, 2005, with respect to the consolidated balance sheets of Cyanotech Corporation and subsidiaries as of March 31, 2005 and 2004, and the related consolidated statements of operations, stockholders’ equity and comprehensive income (loss), and cash flows for each of the years in the three-year period ended March 31, 2005, and the related financial statement schedule, which reports appears in the March 31, 2005 annual report on Form 10-K of Cyanotech Corporation.
/s/ KPMG LLP Honolulu, Hawaii July 7, 2005
41
Exhibit 31.1 Certification Pursuant
To 18 U. S. C. Section 1350, As Adopted Pursuant To
Section 302 of the Sarbanes-Oxley Act of 2002 I, Gerald R. Cysewski, Chairman of the Board of Directors, President and Chief Executive Officer certify that: 1. I have reviewed this annual report on Form 10-K of Cyanotech Corporation; 2. Based on my knowledge, this report does not contain any untrue statement of a material fact or omit to state a
material fact necessary to make the statements made, in light of the circumstances under which such statements were made, not misleading with respect to the period covered by this report;
3. Based on my knowledge, the financial statements, and other financial information included in this report, fairly
present in all material respects the financial condition, results of operations and cash flows of the registrant as of, and for, the periods presented in this report;
4. The registrant's other certifying officer and I are responsible for establishing and maintaining disclosure controls
and procedures (as defined in Exchange Act Rules 13a-15(e) and 15d-15(e)) for the registrant and we have:
a) Designed such disclosure controls and procedures, or caused such disclosure controls and procedures to be designed under our supervision, to ensure that material information relating to the registrant, including its consolidated subsidiaries, is made known to us by others within those entities, particularly during the period in which this report is being prepared;
b) Evaluated the effectiveness of the registrant's disclosure controls and procedures and presented in this
report our conclusions about the effectiveness of the disclosure controls and procedures, as of the end of the period covered by this report based on such evaluation; and
c) Disclosed in this report any change in the registrant’s internal control over financial reporting that occurred
during the registrant’s most recent fiscal quarter (the registrant’s fourth quarter in the case of an annual report) that has materially affected, or is reasonably likely to materially affect, the registrant’s internal control over financial reporting; and
5. The registrant's other certifying officer and I have disclosed, based on our most recent evaluation of internal
control over financial reporting, to the registrant's auditors and the audit committee of registrant's board of directors (or persons performing the equivalent function):
a) All significant deficiencies and material weaknesses in the design or operation of internal controls over
financial reporting which are reasonably likely to adversely affect the registrant’s ability to record, process, summarize and report financial information; and
b) Any fraud, whether or not material, that involves management or other employees who have a significant
role in the registrant's internal controls over financial reporting. Date: June 27, 2005 /s/ Gerald R. Cysewski Gerald R. Cysewski, Chairman of the Board of Directors, President and Chief Executive Officer
42

Exhibit 31.2
Certification Pursuant To 18 U. S. C. Section 1350,
As Adopted Pursuant To Section 302 of the Sarbanes-Oxley Act of 2002
I, Jeffrey H. Sakamoto, Vice President – Finance and Administration certify that: 1. I have reviewed this annual report on Form 10-K of Cyanotech Corporation; 2. Based on my knowledge, this report does not contain any untrue statement of a material fact or omit to state a
material fact necessary to make the statements made, in light of the circumstances under which such statements were made, not misleading with respect to the period covered by this report;
3. Based on my knowledge, the financial statements, and other financial information included in this report, fairly
present in all material respects the financial condition, results of operations and cash flows of the registrant as of, and for, the periods presented in this report;
4. The registrant's other certifying officer and I are responsible for establishing and maintaining disclosure controls
and procedures (as defined in Exchange Act Rules 13a-15(e) and 15d-15(e)) for the registrant and we have:
a) Designed such disclosure controls and procedures, or caused such disclosure controls and procedures to be designed under our supervision, to ensure that material information relating to the registrant, including its consolidated subsidiaries, is made known to us by others within those entities, particularly during the period in which this report is being prepared;
b) Evaluated the effectiveness of the registrant's disclosure controls and procedures and presented in this
report our conclusions about the effectiveness of the disclosure controls and procedures, as of the end of the period covered by this report based on such evaluation; and
c) Disclosed in this report any change in the registrant’s internal control over financial reporting that occurred
during the registrant’s most recent fiscal quarter (the registrant’s fourth quarter in the case of an annual report) that has materially affected, or is reasonably likely to materially affect, the registrant’s internal control over financial reporting; and
5. The registrant's other certifying officer and I have disclosed, based on our most recent evaluation of internal
control over financial reporting, to the registrant's auditors and the audit committee of registrant's board of directors (or persons performing the equivalent function):
a) All significant deficiencies and material weaknesses in the design or operation of internal controls over
financial reporting which are reasonably likely to adversely affect the registrant’s ability to record, process, summarize and report financial information; and
b) Any fraud, whether or not material, that involves management or other employees who have a significant
role in the registrant's internal controls over financial reporting. Date: June 27, 2005 /s/ Jeffrey H. Sakamoto Jeffrey H. Sakamoto Chief Financial Officer
43

Exhibit 32.1
Certification Pursuant To 18 U.S.C. 1350,
As Adopted Pursuant to Section 906 of the Sarbanes-Oxley Act of 2002
In connection with the Annual Report of Cyanotech Corporation (the “Company”) on Form 10-K for the period ended March 31, 2005 as filed with the Securities and Exchange Commission on the date hereof (the “Report”), I, Gerald R. Cysewski, Chief Executive Officer of the Company certify, pursuant to 18 U.S.C. Section 1350, as adopted pursuant to Section 906 of the Sarbanes-Oxley Act of 2002, that: 1) The Report fully complies with the requirements of Section 13(a) or 15(d) of the Securities Exchange
Act (15 U.S.C. 78m or 78o (d)); and
2) The information contained in the Report fairly presents, in all material aspects, the financial condition and results of operations of the Company.
Date: June 27, 2005 /s/ Gerald R. Cysewski Gerald R. Cysewski Chairman of the Board of Directors, President and Chief Executive Officer
44

Exhibit 32.2 Certification Pursuant To 18 U.S.C. 1350,
As Adopted Pursuant to Section 906 of the Sarbanes-Oxley Act of 2002
In connection with the Quarterly Report of Cyanotech Corporation (the “Company”) on Form 10-K for the period ended March 31, 2005 as filed with the Securities and Exchange Commission on the date hereof (the “Report”), I, Jeffrey H. Sakamoto, Vice President – Finance and Administration of the Company, certify, pursuant to 18 U.S.C. Section 1350, as adopted pursuant to Section 906 of the Sarbanes-Oxley Act of 2002, that: 1) The Report fully complies with the requirements of Section 13(a) or 15(d) of the Securities Exchange
Act (15 U.S.C. 78m or 78o (d)); and
2) The information contained in the Report fairly presents, in all material aspects, the financial condition and results of operations of the Company.
Date: June 27, 2005 /s/ Jeffrey H. Sakamoto Jeffrey H. Sakamoto Chief Financial Officer
45

Exhibit 99.1 RISK FACTORS You should carefully consider the risks described below which we believe are significant but not the only ones we face. Any of the following risks could have a material adverse effect on our business, financial condition and operating results. You should also refer to the other information contained in this report, including our financial statements and the related notes.
A Significant or Prolonged Economic Downturn Could Have a Material Adverse Effect on Our Results of Operations Our results of operations are affected by the level of business activity of our clients and customers whom in turn are affected by the level of economic activity in the industries and markets that they serve. A decline in the level of business activity of our clients could have a material adverse effect on our revenues and profit margin.
Our Quarterly Operating Results May Vary From Quarter to Quarter, Which May Result in Increased Volatility of Our Share Price We have experienced, and may in the future continue to experience, fluctuations in our quarterly operating results. These fluctuations could reduce the market price of our Common Stock. Factors that may cause our quarterly operating results to vary include, but are not limited to:
• the business decisions of our customers regarding orders for our products; • increased energy costs; • increased raw material costs; • production difficulties; • weather-related cultivation difficulties; • contamination of our cultivation and production facilities; • the effect of weather on customer demand patterns; • the introduction of new products by us or our competitors; • changes in our pricing policies or those of our competitors; • seasonal trends in our customers’ buying patterns • changes in government regulation, both domestic and foreign; • fluctuation in foreign currency exchange rates; • global economic and political conditions and related risks, including acts of terrorism; and • other factors beyond our control.
A significant portion of our expense levels are relatively fixed and the timing of increases in expense levels is based in large part on our forecasts of future sales. If net sales are below expectations in any given period, the adverse impact on results of operations may be magnified by our inability to adjust expenses quickly enough to compensate for the sales shortfall.
Our Global Operations Expose Us to Complex Management, Foreign Currency, Legal, Tax and Economic Risks, Which We May Not Be Able to Adequately Address We conduct business in a number of countries around the world. For the year ended March 31, 2005, approximately 49% of our net sales were from sales to foreign customers. As a result, we are subject to a number of risks which include, but are not limited to:
• the burden of complying with a wide variety of national and local laws; • potentially longer payment cycles for foreign sales; • multiple and possibly overlapping and conflicting tax laws; • coordinating geographically separated locations; • restrictions (government and otherwise) on the movement of cash; • the absence in some jurisdictions of effective laws to prevent our intellectual property rights; • changes in government regulations, both domestic and foreign; • global economic and political conditions and related risks, including acts of terrorism; and • fluctuations in foreign currency exchange rates.
46

Competition in Our Industry is Intense
The nutritional products market is highly competitive. In includes international, national, regional and local producers and distributors, many of whom have greater resources than Cyanotech and many of whom offer a greater variety of products. Increased competition in our industry could result in price reductions, reduced gross profit margin or loss of market share, any of which could have a material effect on our business, results of operations and financial condition.
Our Revenues Could Be Adversely Affected By the Loss of a Significant Customer or the Failure to Collect a Large Accounts Receivable We have in the past derived, and may continue in the future to derive, a significant portion of our revenues from a relatively limited number of major customers. From quarter to quarter, revenues from one or more individual customers may exceed 10% of our revenues for the quarter. During the year ended March 31, 2005, sales to one customer, a European distributor of natural products, were approximately 10% of net sales. If sales to this customer or other such major customer decrease significantly, this may materially affect our results of operations. In addition, if we fail to collect large accounts receivable from such major customers, we could be subject to significant financial exposure.
If We Are Unable to Protect Our Intellectual Property Rights or if We Infringe Upon the Intellectual Property Rights of Others Our Business May Be Harmed Cyanotech has received five United States patents: two on aspects of our production methods and three for use of our BioAstin® products. Although we regard our proprietary technology, trade secrets, trademarks and similar intellectual property as important, we rely on a combination of trade secret, contract, patent, copyright and trademark law to establish and protect our rights in our products and technology. There can be no assurance that we will be able to protect our technology adequately or that competitors will not be able to develop similar technology independently. In addition, the laws of certain foreign countries may not protect the Company’s intellectual property rights to the same extent as the laws of the United States. Litigation in the United States or abroad may be necessary to enforce our patent or other intellectual property rights, to protect our trade secrets, to determine the validity and scope of the proprietary rights of others or to defend against claims of infringement. Such litigation, even if successful, could result in substantial costs and diversion of resources and could have a material adverse effect on our business, results of operations and financial condition. Additionally, if any such claims are asserted against us, we may seek to obtain a license under the third party’s intellectual property rights. There can be no assurance, however, that a license would be available on terms acceptable or favorable to us, if at all.
We May Need to Raise Additional Capital in the Future Which May Not Be Available At March 31, 2005, the Company’s working capital was $5,102,000 with cash, cash equivalents and short-term investments totaling $3,005,000. While the Company generated cash and cash equivalents from operating activities for the year ended March 31, 2005, there can be no assurance that future efforts will continue to be successful or that the Company will have sufficient cash resources to support its future operations.
Our Insurance Liability Coverage is Limited in Certain Circumstances In the ordinary course of business, the Company purchases insurance coverages (e.g., property and liability coverages) to protect itself against loss of or damage to its properties and claims made by third parties and employees for property damage or personal injuries. However, the protection provided by such insurance is limited in significant respects and, in some instances, the Company has no coverage and certain of the Company’s insurance has substantial “deductibles” or has limits on the maximum amounts that may be recovered. For example, if a hurricane or other uninsured catastrophic natural disaster should occur, the Company may not be able to recover all facility restoration costs and revenues lost from business interruption. In addition, the Company maintains product liability insurance in limited amounts for all of its products involving human consumption, however, broader product liability coverage is prohibitively expensive. Insurers have also introduced new exclusions or limitations of coverage for claims related to certain perils including, but not limited to, mold and terrorism. If a series of losses occurred, such as from a series of lawsuits in the ordinary course of business each of which were subject to the deductible amount, or if the maximum limit of the available insurance were substantially exceeded, the Company could incur losses in amounts that would have a material adverse effect on its result of operations and financial condition.
47