form 10-k public storage · storage facilities and sell merchandise, primarily locks and cardboard...
TRANSCRIPT
1
UNITED STATES SECURITIES AND EXCHANGE COMMISSION
WASHINGTON, D.C. 20549
FORM 10-K [X] Annual Report Pursuant to Section 13 or 15(d) of the Securities Exchange Act of 1934
For the fiscal year ended December 31, 2017.
or
[ ] Transition Report Pursuant to Section 13 or 15(d) of the Securities Exchange Act of 1934
For the transition period from to .
Commission File Number: 001-33519
PUBLIC STORAGE (Exact name of Registrant as specified in its charter)
Maryland 95-3551121
(State or other jurisdiction of incorporation or organization) (I.R.S. Employer Identification Number)
701 Western Avenue, Glendale, California 91201-2349
(Address of principal executive offices) (Zip Code)
(818) 244-8080
(Registrant's telephone number, including area code)
Securities registered pursuant to Section 12(b) of the Act:
Title of each class
Name of each exchange on which registered
Depositary Shares Each Representing 1/1,000 of a 5.625% Cumulative Preferred Share, Series U $.01 par value
New York Stock Exchange
Depositary Shares Each Representing 1/1,000 of a 5.375% Cumulative Preferred Share, Series V $.01 par value
New York Stock Exchange
Depositary Shares Each Representing 1/1,000 of a 5.200% Cumulative Preferred Share, Series W $.01 par value
New York Stock Exchange
Depositary Shares Each Representing 1/1,000 of a 5.200% Cumulative Preferred Share, Series X $.01 par value
New York Stock Exchange
Depositary Shares Each Representing 1/1,000 of a 6.375% Cumulative Preferred Share, Series Y $.01 par value
New York Stock Exchange
Depositary Shares Each Representing 1/1,000 of a 6.000% Cumulative Preferred Share, Series Z $.01 par value
New York Stock Exchange
Depositary Shares Each Representing 1/1,000 of a 5.875% Cumulative Preferred Share, Series A $.01 par value
New York Stock Exchange
Depositary Shares Each Representing 1/1,000 of a 5.400% Cumulative Preferred Share, Series B $.01 par value
New York Stock Exchange
2
Depositary Shares Each Representing 1/1,000 of a 5.125% Cumulative Preferred Share, Series C $.01 par value
New York Stock Exchange
Depositary Shares Each Representing 1/1,000 of a 4.950% Cumulative Preferred Share, Series D $.01 par value
New York Stock Exchange
Depositary Shares Each Representing 1/1,000 of a 4.900% Cumulative Preferred Share, Series E $.01 par value
New York Stock Exchange
Depositary Shares Each Representing 1/1,000 of a 5.150% Cumulative Preferred Share, Series F $.01 par value
New York Stock Exchange
Depositary Shares Each Representing 1/1,000 of a 5.050% Cumulative Preferred Share, Series G $.01 par value
New York Stock Exchange
Common Shares, $.10 par value New York Stock Exchange
Securities registered pursuant to Section 12(g) of the Act: None (Title of class)
Indicate by check mark if the registrant is a well-known seasoned issuer, as defined in Rule 405 of the Securities Act.
Yes [X] No [ ]
Indicate by check mark if the registrant is not required to file reports pursuant to Section 13 or Section 15(d) of the Exchange Act.
Yes [ ] No [X]
Indicate by check mark whether the registrant (1) has filed all reports required to be filed by Section 13 or 15(d) of the Securities Exchange Act of 1934 during the preceding 12 months (or for such shorter period that the registrant was required to file such reports), and (2) has been subject to such filing requirements for the past 90 days.
Yes [X] No [ ]
Indicate by check mark whether the registrant has submitted electronically and posted on its corporate Web site, if any, every Interactive Data File required to be submitted and posted pursuant to Rule 405 of Regulation S-T (§232.405 of this chapter) during the preceding 12 months (or for such shorter period that the registrant was required to submit and post such files).
Yes [X] No [ ]
Indicate by check mark if disclosure of delinquent filers pursuant to Item 405 of Regulation S-K (§229.405) is not contained herein, and will not be contained, to the best of registrant's knowledge, in definitive proxy or information statements incorporated by reference in Part III of this Form 10-K or any amendment to this Form 10-K. [ ]
Indicate by check mark whether the registrant is a large accelerated filer, an accelerated filer, a non-accelerated filer, a smaller reporting company, or an emerging growth company. See the definitions of “large accelerated filer,” “accelerated filer,” “smaller reporting company,” and “emerging growth company” in Rule 12b-2 of the Exchange Act.
Large accelerated filer
Accelerated filer
Non-accelerated filer
Smaller reporting company
Emerging growth company
[X] [ ] [ ] [ ] [ ]
3
If an emerging growth company, indicate by check mark if the registrant has elected not to use the extended transition period for complying with any new or revised financial accounting standards provided pursuant to Section 13(a) of the Exchange Act. [ ] Indicate by check mark whether the registrant is a shell company (as defined in Rule 12b-2 of the Exchange Act).
Yes [ ] No [X]
The aggregate market value of the voting and non-voting common shares held by non-affiliates of the Registrant as of June 30, 2017:
Common Shares, $0.10 Par Value Per Share – $31,047,469,000 (computed on the basis of $208.53 per share, which was the reported closing sale price of the Company's Common Shares on the New York Stock Exchange (the “NYSE”) on June 30, 2017).
As of February 26, 2018, there were 174,215,770 outstanding Common Shares, $.10 par value per share.
DOCUMENTS INCORPORATED BY REFERENCE
Portions of the definitive proxy statement to be filed in connection with the Annual Meeting of Shareholders to be held in 2017 are incorporated by reference into Part III of this Annual Report on Form 10-K to the extent described therein.

4
PART I
ITEM 1. Business
Forward Looking Statements
This Annual Report on Form 10-K contains forward-looking statements within the meaning of the Private Securities Litigation Reform Act of 1995. All statements in this document, other than statements of historical fact, are forward-looking statements which may be identified by the use of the words "expects," "believes," "anticipates," "should," "estimates" and similar expressions.
These forward-looking statements involve known and unknown risks and uncertainties, which may cause our actual results and performance to be materially different from those expressed or implied in the forward-looking statements. Factors and risks that may impact future results and performance include, but are not limited to, those described in Part 1, Item 1A, "Risk Factors" and in our other filings with the Securities and Exchange Commission (the “SEC”) including:
general risks associated with the ownership and operation of real estate, including changes in demand, risk related to development of self-storage facilities, potential liability for environmental contamination, natural disasters and adverse changes in laws and regulations governing property tax, real estate and zoning;
risks associated with downturns in the national and local economies in the markets in which we operate, including risks related to current economic conditions and the economic health of our customers;
the impact of competition from new and existing self-storage and commercial facilities and other storage alternatives;
difficulties in our ability to successfully evaluate, finance, integrate into our existing operations, and manage acquired and developed properties;
risks associated with international operations including, but not limited to, unfavorable foreign currency rate fluctuations, changes in tax laws, and local and global economic uncertainty that could adversely affect our earnings and cash flows;
risks related to our participation in joint ventures;
the impact of the regulatory environment as well as national, state and local laws and regulations including, without limitation, those governing environmental, taxes, our tenant reinsurance business and labor, and risks related to the impact of new laws and regulations;
risks of increased tax expense associated either with a possible failure by us to qualify as a real estate investment trust (“REIT”), or with challenges to the determination of taxable income for our taxable REIT subsidiaries;
changes in United States (“U.S.”) federal or state tax laws related to the taxation of REITs and other corporations;
security breaches or a failure of our networks, systems or technology could adversely impact our business, customer and employee relationships;
5
risks associated with the self-insurance of certain business risks, including property and casualty insurance, employee health insurance and workers compensation liabilities;
difficulties in raising capital at a reasonable cost;
delays in the development process;
ongoing litigation and other legal and regulatory actions which may divert management’s time and attention, require us to pay damages and expenses or restrict the operation of our business; and
economic uncertainty due to the impact of war or terrorism.
These forward looking statements speak only as of the date of this report or as of the dates indicated in the statements. All of our forward-looking statements, including those in this report, are qualified in their entirety by this statement. We expressly disclaim any obligation to update publicly or otherwise revise any forward-looking statements, whether as a result of new information, new estimates, or other factors, events or circumstances after the date of these forward looking statements, except when expressly required by law. Given these risks and uncertainties, you should not rely on any forward-looking statements in this report, or which management may make orally or in writing from time to time, neither as predictions of future events nor guarantees of future performance.
General
Public Storage (referred to herein as “the Company”, “we”, “us”, or “our”), a Maryland REIT, was organized in 1980.
At December 31, 2017, our principal business activities were as follows:
(i) Self-storage Operations: We acquire, develop, own and operate self-storage facilities, which offer storage spaces for lease on a month-to-month basis, for personal and business use. We are the largest owner and operator of self-storage facilities in the U.S. We have direct and indirect equity interests in 2,386 self-storage facilities that we consolidate (an aggregate of 159 million net rentable square feet of space) located in 38 states within the U.S. operating under the “Public Storage” brand name. We also own one self-storage facility in London, England which is managed by Shurgard Europe (defined below).
(ii) Ancillary Operations: We reinsure policies against losses to goods stored by customers in our self-storage facilities and sell merchandise, primarily locks and cardboard boxes, at our self-storage facilities.
(iii) Investment in PS Business Parks: We have a 42% equity interest in PS Business Parks, Inc. (“PSB”), a publicly held REIT that owns, operates, acquires and develops commercial properties, primarily multi-tenant flex, office, and industrial parks. At December 31, 2017, PSB owns and operates 28.0 million rentable square feet of commercial space.
(iv) Investment in Shurgard Europe: We have a 49% equity interest in Shurgard Self Storage Europe Limited (“Shurgard Europe”) which owns 221 self-storage facilities (twelve million net rentable square feet) located in seven countries in Western Europe operated under the “Shurgard” brand name. We believe Shurgard Europe is the largest owner and operator of self-storage facilities in Western Europe.
We also manage approximately 27 self-storage facilities for third parties. We are seeking to expand our third-party management operations to further increase our economies of scale and leverage our brand; however, there is no assurance that we will be able to do so. We also own 0.9 million net rentable square feet of commercial space which is managed primarily by PSB.
6
For all periods presented herein, we have elected to be treated as a REIT, as defined in the Internal Revenue Code of 1986, as amended (the “Code”). As a REIT, we do not incur U.S. federal income tax if we distribute 100% of our “REIT taxable income” (generally, net rents and gains from real property, dividends, and interest) each year (for this purpose, certain distributions paid in a subsequent year may be considered), and if we meet certain organizational and operational rules. We believe we met these requirements in all periods presented herein and we expect to continue to elect and qualify as a REIT.
We report annually to the SEC on Form 10-K, which includes financial statements certified by our independent registered public accountants. We also report quarterly to the SEC on Form 10-Q, which includes unaudited financial statements. We expect to continue such reporting.
On our website, www.publicstorage.com, we make available, free of charge, our Annual Reports on Form 10- K, quarterly reports on Form 10-Q, current reports on Form 8-K, and all amendments to those reports as soon as reasonably practicable after the reports and amendments are electronically filed with or furnished to the SEC. The information contained on our website is not a part of, or incorporated by reference into, this Annual Report on Form 10-K.
Competition
We believe that our customers generally store their goods within a five mile radius of their home or business. Our facilities compete with nearby self-storage facilities owned by other operators using marketing channels similar to ours, including Internet advertising, signage, and banners and offer services similar to ours. As a result, competition is significant and affects the occupancy levels, rental rates, rental income and operating expenses of our facilities. There has been an increase in supply of newly constructed self-storage facilities in several of our markets, most notably Atlanta, Austin, Charlotte, Chicago, Dallas, Denver, Houston, and New York.
Ownership and operation of self-storage facilities is highly fragmented. As the largest owner of self-storage facilities, we believe that we own approximately 7% of the self-storage square footage in the U.S. and that collectively the five largest self-storage owners in the U.S. own approximately 15%, with the remaining 85% owned by numerous regional and local operators.
We generally own facilities in major markets. We believe that we have significant market share and concentration in major metropolitan centers, with approximately 71% of our 2017 same-store revenues generated in the 20 Metropolitan Statistical Areas (each, an “MSA”, as defined by the U.S. Census Bureau) with the highest population levels. We believe this is a competitive advantage relative to other self-storage operators, which do not have our geographic concentration and market share.
Industry fragmentation also provides opportunities for us to acquire additional facilities; however, we compete with a wide variety of institutions and other investors who also view self-storage facilities as attractive investments. The amount of capital available for real estate investments greatly influences the competition for ownership interests in facilities and, by extension, the yields that we can achieve on newly acquired investments.
Business Attributes
We believe that we possess several primary business attributes that permit us to compete effectively:
Centralized information networks: Our centralized reporting and information network enables us to identify changing market conditions and operating trends as well as analyze customer data and quickly change each of our individual properties’ pricing and promotions on an automated basis.
Convenient shopping experience: Customers can conveniently shop for available storage space, reviewing attributes such as facility location, size, amenities such as climate-control, as well as pricing, through the following marketing channels:

7
Our Desktop and Mobile Websites: The online marketing channel is a key source of customers. Approximately 69% of our move-ins in 2017 were sourced through our websites and we believe that many of our other customers who reserved directly through our call center or arrived at a facility and moved in without a reservation, have reviewed our pricing and availability online through our websites. We invest extensively in advertising on the Internet to attract potential customers, primarily through the use of search engines, and we regularly update our websites to enhance their productivity.
Our Call Center: Our call center is staffed by skilled sales specialists. Customers primarily reach our call center by calling our advertised toll-free telephone numbers provided on search engines or our website. We believe giving customers the option to interact with a call center agent, despite the higher marginal cost relative to a reservation made on our website enhances our ability to close sales with potential customers.
Our Properties: Customers can also shop at any one of our facilities. Property managers access the same information that is available on our website and to our call center agents, and can inform the customer of available space at that site or our other nearby storage facilities. Property managers are trained to maximize the conversion of such “walk in” shoppers into customers.
Economies of scale: The size and scope of our operations have enabled us to achieve high operating margins and a low level of administrative costs relative to revenues through the centralization of many functions, such as facility maintenance, employee compensation and benefits programs, revenue management, as well as the development and documentation of standardized operating procedures. We also believe that our major market concentration provides managerial efficiencies stemming from having a large percentage of our facilities in close proximity to each other.
Brand name recognition: We believe that the “Public Storage” brand name is the most recognized and established name in the self-storage industry, due to our national reach in major markets in 38 states, our highly visible facilities, and our facilities’ distinct orange colored doors and signage. We believe the “Public Storage” name is one of the most frequently used search terms used by customers using Internet search engines for self-storage. We believe that the “Shurgard” brand, used by Shurgard Europe, is a well-established and valuable brand in Europe. We believe that the awareness of our brand name results in a high percentage of potential storage customers considering our facilities relative to other operators.
Marketing and advertising efficiencies: Our major-market concentration relative to the fragmented ownership and operation of the rest of the industry, combined with our well-recognized brand name, improves our prominence in unpaid online search results for self-storage and reduces our average cost per “click” for multiple-keyword advertising. The large number of facilities we have in major metropolitan centers enables us to efficiently use television advertising from time to time. Our competitors generally do not use television advertising because they lack the scale in major metropolitan centers.
Growth and Investment Strategies
Our growth strategies consist of: (i) improving the operating performance of our existing self-storage facilities, (ii) acquiring more facilities, (iii) developing new facilities and adding more self-storage space to existing facilities, (iv) participating in the growth of our investment in PSB, and (v) participating in the growth of our investment in Shurgard Europe. While our long-term strategy includes each of these elements, in the short run the level of growth in our asset base in any period is dependent upon the cost and availability of capital, as well as the relative attractiveness of available investment alternatives.
Improve the operating performance of existing facilities: We seek to increase the net cash flow of our existing self-storage facilities by (i) regularly analyzing our call volume, reservation activity, Internet activity, move-in/move-out rates and other market supply and demand factors and responding by adjusting our marketing and promotional activities and rental rates charged to new and existing customers, (ii) attempting to maximize revenues
8
through evaluating the appropriate balance between occupancy, rental rates, and promotional discounting and (iii) controlling operating costs. We believe that our property management personnel, information technology, our convenient shopping options for the customer, our economies of scale, and our Internet marketing and advertising programs will continue to enhance our ability to meet these goals.
Acquire properties owned by others in the U.S.: We seek to capitalize on the fragmentation of the self-storage business through acquiring attractively priced, well-located existing self-storage facilities. We believe our presence in and knowledge of substantially all of the major markets in the U.S. enhances our ability to identify attractive acquisition opportunities. Data on the rental rates and occupancy levels of our existing facilities provides us an advantage in evaluating the potential of acquisition opportunities. Self-storage owners decide whether to market their facilities for sale based upon many factors, including potential reinvestment returns, expectations of future growth, estimated value, the cost of debt financing, as well as personal considerations. Our aggressiveness in bidding for particular marketed facilities depends upon many factors including the potential for future growth, the quality of construction and location, the cash flow we expect from the facility when operated on our platform, how well the facility fits into our current geographic footprint, as well as our yield expectations. During 2017, 2016 and 2015, we acquired 22, 55 and 17 facilities, respectively, from third parties for approximately $150 million, $429 million and $169 million, respectively, primarily through one to five property portfolio acquisitions. On December 31, 2017, we acquired the remaining 74.25% of the interests which we did not own in a limited partnership that owns 12 self-storage facilities for a total cost of approximately $136 million. We will continue to seek to acquire properties in 2018; however, there is significant competition to acquire existing facilities. As a result, there can be no assurance as to the level of facilities we may acquire.
Develop new self-storage facilities and expansion of existing facilities: The development of new self-storage locations and the expansion of existing facilities has been an important source of growth. Since the beginning of 2013, we have expanded our development efforts due in part to the significant increase in prices being paid for existing facilities, in many cases well above the cost of developing new facilities. At December 31, 2017, we had a development pipeline to develop new self-storage facilities and, to a lesser extent, expand existing self-storage facilities, which will add approximately 4.6 million net rentable square feet of self-storage space, at a total cost of $613.8 million. Some of these projects are subject to significant contingencies such as entitlement approval. We expect to continue to seek additional development projects; however, the level of future development may be limited due to various constraints such as difficulty in finding projects that meet our risk-adjusted yield expectations, challenges in obtaining building permits for self-storage activities in certain municipalities, as well as challenges in sourcing quality construction materials, labor, and design elements.
Participate in the growth of PS Business Parks, Inc.: Our investment in PSB provides diversification into another asset type. PSB is a stand-alone public company traded on the NYSE. As of December 31, 2017, we have a 42% equity interest in PSB.
PSB seeks to grow its asset base in favorable markets as well as increase the cash flows from its existing portfolio. As of December 31, 2017, PSB owned and operated approximately 28.0 million rentable square feet of commercial space, and had an enterprise value of approximately $5.4 billion (based upon the trading price of PSB’s common stock combined with the liquidation value of its preferred stock as of December 31, 2017).
Participate in the growth of Shurgard Europe: We believe Shurgard Europe is the largest self-storage company in Western Europe. It owns and operates 221 self-storage facilities with approximately 12 million net rentable square feet in: France (principally Paris), Sweden (principally Stockholm), the United Kingdom (principally London), the Netherlands, Denmark (principally Copenhagen), Belgium and Germany. We own 49% of Shurgard Europe, with the other 51% owned by a large U.S. institutional investor.
Customer awareness and availability of self-storage is significantly lower in Europe than in the U.S. However, with more awareness and product supply, we believe there is potential for increased demand for storage space in Europe. In the long run, we believe Shurgard Europe could capitalize on potential increased demand through the development of new facilities or, to a lesser extent, acquiring existing facilities. From 2014 through 2017, Shurgard Europe acquired 28 facilities with an approximate 1.4 million net rentable square feet in Germany, the Netherlands, the United Kingdom and France for an aggregate purchase price of approximately $266.0 million. In
9
addition, from 2014 through 2017, Shurgard Europe opened six development properties in the United Kingdom containing 507,000 net rentable square feet at a cost of $81.1 million.
Financing of the Company’s Growth Strategies
Overview of financing strategy and sources of capital: As a REIT, we generally distribute 100% of our taxable income to our shareholders, which relative to a taxable C corporation, limits the amount of cash flow from operations that we can retain for investments. As a result, in order to grow our asset base, access to capital is important.
Our financial profile is characterized by strong credit metrics, including low leverage relative to our total capitalization and operating cash flows. We are one of the highest rated REITs, as rated by major rating agencies Moody’s and Standard & Poor’s. Our senior debt has an “A” credit rating by Standard & Poor’s and “A2” by Moody’s. Our credit ratings on each of our series of preferred shares are “A3” by Moody’s and “BBB+” by Standard & Poor’s. Our credit profile and ratings enables us to effectively access both the public and private capital markets to raise capital.
Sources of capital available to us include retained operating cash flow, the issuance of preferred and common securities, the issuance of medium and long-term debt, joint venture financing and the sale of properties. We view our line of credit, as well as short-term bank loans, as bridge financing.
Historically, we have financed our cash investment activities primarily with retained operating cash flow and the issuance of preferred securities. While we have issued common shares, such issuances have been minimal, because preferred securities have had a more attractive cost of capital. In 2015 and 2016, we issued euro-denominated medium-term debt primarily as a hedge to our euro-denominated investment in Shurgard Europe. On September 18, 2017, we completed a public offering of $1.0 billion in aggregate principal amount of unsecured notes in two equal tranches (collectively, the “U.S. Dollar Notes”), one maturing in September 2022 bearing interest at 2.370%, and another maturing in September 2027 bearing interest at 3.094%. While we have increased the level of debt in our capital structure, we expect to continue to remain conservatively capitalized and not subject ourselves to significant refinancing risk.
We do not expect to use joint venture financing or the sale of properties as sources of capital; however, there can be no assurance that we will not.
We select among the sources of capital available to us based upon relative cost, availability, the desire for leverage, as well as intangibles such as covenants in the case of debt.
Retained operating cash flow: Although we are required to generally distribute 100% of our taxable income to our shareholders, we are nonetheless able to retain operating cash flow to the extent that our tax depreciation exceeds our maintenance capital expenditures. In recent years, we have retained approximately $200 million to $300 million per year in cash flow.
Preferred equity: As noted above, we view preferred equity as an important source of capital over the long term. However, rates and market conditions for the issuance of preferred securities can be volatile or inefficient from time to time, particularly so in the last few years. Since 2013, we have issued preferred securities at fixed rates ranging from 4.900% to 6.375%. Most recently, in August 2017, we issued $300 million of preferred securities at a fixed rate of 5.050%. We believe that the market coupon rate of our preferred securities is influenced by long-term interest rates, as well as demand specifically from retail investors. Institutional investors are generally not buyers of our preferred securities. At December 31, 2017, we have approximately $4.0 billion in preferred securities outstanding with an average coupon rate of 5.4% and an average market yield of 5.3%. As of February 28, 2018, we have four series of preferred securities that are eligible for redemption, at our option and with 30 days’ notice; our 5.625% Series U Preferred Shares, with $287.5 million outstanding, our 5.375% Series V Preferred Shares with $495.0 million outstanding, our 5.200% Series W Preferred Shares with $500.0 million outstanding and our 5.200% Series X Preferred Shares with $225.0 million outstanding. Redemption of such preferred shares will depend upon many

10
factors, including the rate at which we could issue replacement preferred securities. None of our preferred securities are redeemable at the option of the holders.
Medium or long-term debt: We have broad powers to issue debt to fund our business. Our corporate credit ratings are “A” by Standard & Poor’s and “A2” by Moody’s. We believe this high rating, combined with our current level of debt, could allow us to issue additional unsecured debt at lower interest rates than the coupon rates on preferred securities.
At December 31, 2017, we have $1.0 billion of U.S. Dollar Notes, as noted above, and approximately €342 million of Euro-denominated senior unsecured notes (the “Euro Notes”) outstanding, which were issued to institutional investors in 2015 and 2016.
Common equity: Except in connection with mergers, most notably a merger in 2006 with Shurgard Storage Centers, we have not raised capital through the issuance of common equity because lower cost alternatives have been available. However, we believe that the market for our common equity is liquid and, as a result, common equity is a significant potential source of capital.
Bridge financing: We have a $500.0 million revolving line of credit which we occasionally use as temporary “bridge” financing, along with short-term bank loans, until we are able to raise longer-term capital. As of December 31, 2017, there were no borrowings outstanding on our revolving line of credit and no short-term bank loans.
Unlikely capital alternatives: We have issued both our common and preferred securities in exchange for real estate and other investments in the past. We do not expect such issuances to be a material source of capital in the future, though there can be no assurance.
We have participated in joint ventures with institutional investors in the past to acquire, develop, and operate self-storage facilities, most notably Shurgard Europe, in which we own a 49% interest and an institutional investor owns the remaining 51%. We do not expect joint venture financing to be a material source of capital in the future because we have other sources of capital that are less expensive and because of potential constraints resulting from joint management. However, there can be no assurance that we will not.
Generally, we have disposed of self-storage facilities only when compelled to do so through condemnation proceedings. Because we believe that we are an optimal operator of self-storage facilities, we have generally found that we cannot obtain sufficient value in selling properties. As a result, we do not expect to raise significant capital selling self-storage facilities; however, though there can be no assurance that we will not.
Investments in Real Estate and Unconsolidated Real Estate Entities
Investment Policies and Practices with respect to our investments: Following are our investment practices and policies which, though we do not anticipate any significant alteration, can be changed by our board of trustees (the “Board”) without a shareholder vote:
Our investments primarily consist of direct ownership of self-storage facilities (the nature of our self-storage facilities is described in Item 2, “Properties”), as well as partial interests in entities that own self-storage facilities.
Our partial ownership interests primarily reflect general and limited partnership interests in entities that we control that own self-storage facilities that are managed by us under the “Public Storage” brand name in the U.S., as well as storage facilities located in Europe managed by Shurgard Europe under the “Shurgard” brand name.
Additional acquired interests in real estate (other than the acquisition of properties from third parties) will include common equity interests in entities in which we already have an interest.
11
To a lesser extent, we have interests in existing commercial properties (described in Item 2, “Properties”), containing commercial and industrial rental space, primarily through our investment in PSB.
Facilities Owned by Unconsolidated Real Estate Entities
At December 31, 2017, we had ownership interests in PSB and Shurgard Europe (each discussed above), which we do not control or consolidate. On December 31, 2017, we acquired the remaining 74.25% of the interests which we did not own in a partnership owning 12 self-storage facilities.
PSB and Shurgard Europe, have debt and other obligations that we do not consolidate in our financial statements. Such debt or other obligations have no recourse to us. See Note 4 to our December 31, 2017 financial statements for further disclosure regarding the assets, liabilities and operating results of PSB and Shurgard Europe, as well as PSB’s public filings which are available at its website, www.psbusinessparks.com and on the SEC website.
Canadian self-storage facilities owned by Former Chairman and Member of Board of Trustees
At December 31, 2017, B. Wayne Hughes, our former Chairman and his daughter, Tamara Hughes Gustavson, a member of our Board of Trustees together owned and controlled 58 self-storage facilities in Canada. These facilities operate under the “Public Storage” tradename, which we license to the owners of these facilities for use in Canada on a royalty-free, non-exclusive basis. We have no ownership interest in these facilities and we do not own or operate any facilities in Canada. If we chose to acquire or develop our own facilities in Canada, we would have to share the use of the “Public Storage” name in Canada. We have a right of first refusal, subject to limitations, to acquire the stock or assets of the corporation engaged in the operation of these facilities if their owners agree to sell them. Our subsidiaries reinsure risks relating to loss of goods stored by customers in these facilities, and have received approximately $1.1 million, $848,000 and $562,000 for the years ended December 31, 2017, 2016 and 2015, respectively. Our right to continue receiving these premiums may be qualified.
Limitations on Debt
Our revolving credit facility, U.S. Dollar Notes and Euro Notes contain various customary financial covenants, including limitations on our ability to encumber our properties with mortgages and limitations on the level of indebtedness. We believe we were in compliance with each of these covenants as of December 31, 2017.
Employees
We had approximately 5,600 employees in the U.S. at December 31, 2017 who are engaged primarily in property operations.
Seasonality
We experience minor seasonal fluctuations in the demand for self-storage space, with demand and rental rates generally higher in the summer months than in the winter months. We believe that these fluctuations result in part from increased moving activity during the summer months.
Insurance
We have historically carried property, earthquake, general liability, employee medical insurance and workers compensation coverage through internationally recognized insurance carriers, subject to deductibles. Our deductible for general liability is $2.0 million per occurrence. Our annual deductibles for property losses are $25.0 million for first occurrence with an aggregate of $35.0 million for multiple occurrences and $5.0 million per occurrence thereafter. Insurance carriers’ aggregate limits on these policies of $75.0 million for property losses and $102.0 million for general liability losses are higher than estimates of maximum probable losses that could occur from individual catastrophic events determined in recent engineering and actuarial studies; however, in case of multiple catastrophic events, these limits could be exceeded.
12
We reinsure a program that provides insurance to our customers from an independent third-party insurer. This program covers tenant claims for losses to goods stored at our facilities as a result of specific named perils (earthquakes are not covered by this program), up to a maximum limit of $5,000 per storage unit. We reinsure all risks in this program, but purchase insurance to cover this exposure for a limit of $15.0 million for losses in excess of $5.0 million per occurrence. The program is subject to licensing requirements and regulations in several states. Customers participate in the program at their option. At December 31, 2017, there were approximately 900,000 certificates held by our self-storage customers, representing aggregate coverage of approximately $2.8 billion.
ITEM 1A. Risk Factors
In addition to the other information in our Annual Report on Form 10-K, you should consider the risks described below that we believe may be material to investors in evaluating the Company. This section contains forward-looking statements, and in considering these statements, you should refer to the qualifications and limitations on our forward-looking statements that are described in Item 1, “Business.”
We have significant exposure to real estate risk.
Since our business consists primarily of acquiring and operating real estate, we are subject to the risks related to the ownership and operation of real estate that could result in reduced revenues, increased expenses, increased capital expenditures, or increased borrowings, which could negatively impact our operating results, cash flow available for distribution or reinvestment, and our stock price:
Natural disasters or terrorist attacks could cause damage to our facilities, resulting in increased costs and reduced revenues. Natural disasters, such as earthquakes, hurricanes and floods, or terrorist attacks could cause significant damage and require significant repair costs, and make facilities temporarily uninhabitable, reducing our revenues. Damage and business interruption losses could exceed the aggregate limits of our insurance coverage. In addition, because we self-insure a portion of our risks, losses below a certain level may not be covered by insurance. See Note 13 to our December 31, 2017 financial statements for a description of the risks of losses that are not covered by third-party insurance contracts. We may not have sufficient insurance coverage for losses caused by a terrorist attack, or such insurance may not be maintained, available or cost-effective. In addition, significant natural disasters, terrorist attacks, threats of future terrorist attacks, or resulting wider armed conflicts could have negative impacts on the U.S. economy, reducing storage demand.
Operating costs, including property taxes, could increase. We could be subject to increases in insurance premiums, property or other taxes, repair and maintenance costs, payroll, utility costs, workers compensation, and other operating expenses due to various factors such as inflation, labor shortages, commodity and energy price increases, weather, increases to minimum wage rates, changes to governmental safety and real estate use limitations, as well as other governmental actions. Our property tax expense, which totaled approximately $236.4 million during the year ended December 31, 2017, generally depends upon the assessed value of our real estate facilities as determined by assessors and government agencies, and accordingly could be subject to substantial increases if such agencies changed their valuation approaches or opinions or if new laws are enacted.
The acquisition of existing properties is subject to risks that may adversely affect our growth and financial results. We have acquired self-storage facilities from third parties in the past, and we expect to continue to do so in the future. We face significant competition for suitable acquisition properties from other real estate investors. As a result, we may be unable to acquire additional properties we desire or the purchase price for desirable properties may be significantly increased. Failures or unexpected circumstances in integrating newly acquired properties into our operations or circumstances we did not detect during due diligence, such as environmental matters, needed repairs or deferred maintenance, or the effects of increased property tax following reassessment of a newly-acquired property, as well as the general risks of real estate investment, could jeopardize realization of the anticipated earnings from an acquisition.
Development of self-storage facilities can subject us to risks. At December 31, 2017, we have a pipeline of development projects totaling $614 million (subject to contingencies), and we expect to continue to seek additional development projects. There are significant risks involved in developing self-storage facilities, such as delays or cost

13
increases due to changes in or failure to meet government or regulatory requirements, failure of revenue to meet our underwriting estimates, weather issues, unforeseen site conditions, or personnel problems. Self-storage space is generally not pre-leased, and rent-up of newly developed space can be delayed or ongoing cash flow yields can be reduced due to competition, reductions in storage demand, or other factors.
There is significant competition among self-storage operators and from other storage alternatives. Our self-storage facilities generate most of our revenue and earnings. Competition in the local market areas in which many of our properties are located is significant and has affected our occupancy levels, rental rates and operating expenses. Development of self-storage facilities has increased in recent years, which has intensified competition and will continue to do so as newly developed facilities are opened. Development of self-storage facilities by other operators could continue to increase, due to increases in availability of funds for investment or other reasons, and further intensify competition.
We may incur significant liabilities from environmental contamination or moisture infiltration. Existing or future laws impose or may impose liability on us to clean up environmental contamination on or around properties that we currently or previously owned or operated, even if we were not responsible for or aware of the environmental contamination or even if such environmental contamination occurred prior to our involvement with the property. We have conducted preliminary environmental assessments on most of our properties, which have not identified material liabilities. These assessments, commonly referred to as “Phase 1 Environmental Assessments,” include an investigation (excluding soil or groundwater sampling or analysis) and a review of publicly available information regarding the site and other nearby properties.
We are also subject to potential liability relating to moisture infiltration, which can result in mold or other damage to our or our customers’ property, as well as potential health concerns. When we receive a complaint or otherwise become aware that an air quality concern exists, we implement corrective measures and seek to work proactively with our customers to resolve issues, subject to our contractual limitations on liability for such claims.
We are not aware of any environmental contamination or moisture infiltration related liabilities that could be material to our overall business, financial condition, or results of operation. However, we may not have detected all material liabilities, we could acquire properties with material undetected liabilities, or new conditions could arise or develop at our properties, any of which would result in a cash settlement or adversely affect our ability to sell, lease, operate, or encumber affected facilities.
Economic conditions can adversely affect our business, financial condition, growth and access to capital.
Our revenues and operating cash flow can be negatively impacted by reductions in employment and population levels, household and disposable income, and other general economic factors that lead to a reduction in demand for rental space in each of the markets in which we operate.
Our ability to raise capital to fund our activities may be adversely affected by challenging market conditions. If we were unable to raise capital at reasonable rates, prospective earnings growth through expanding our asset base could be limited.
We have exposure to European operations through our ownership in Shurgard Europe.
We own a 49% equity interest in Shurgard Europe, with our investment having a $324 million book value at December 31, 2017, and $25.9 million in equity in earnings in 2017. As a result, we are exposed to additional risks related to international operations that may adversely impact our business and financial results, including the following:
Currency risks: Currency fluctuations can impact the fair value of our equity investment in Shurgard Europe, as well as future repatriation of cash.
Legislative, tax, and regulatory risks: We are subject to complex foreign laws and regulations related to

14
permitting and land use, the environment, labor, and other areas, as well as income, property, sales, value added and employment tax laws. These laws can be difficult to apply or interpret and can vary in each country or locality, and are subject to unexpected changes in their form and application due to regional, national, or local political uncertainty and other factors. Such changes, or Shurgard’s failure to comply with these laws, could subject it to penalties or other sanctions, adverse changes in business processes, as well as potentially adverse income tax, property tax, or other tax burdens.
Impediments to capital repatriation could negatively impact the realization of our investment in Shurgard Europe: Laws in Europe and the U.S. may create, impede or increase our cost to repatriate capital or earnings from Shurgard Europe.
Risks of collective bargaining and intellectual property: Collective bargaining, which is prevalent in certain areas in Europe, could negatively impact Shurgard Europe’s labor costs or operations. Many of Shurgard Europe’s employees participate in various national unions.
Potential operating and individual country risks: Economic slowdowns or extraordinary political or social change in the countries in which it operates have posed, and could continue to pose, challenges or result in future reductions of Shurgard Europe’s operating cash flows.
Impediments of Shurgard Europe’s joint venture structure: Shurgard Europe’s strategic decisions, involving activities such as borrowing money, capital contributions, raising capital from third parties, as well as selling or acquiring significant assets, require the consent of our joint venture partner. As a result, Shurgard Europe may be precluded from taking advantage of opportunities that we would find attractive but that we may not be able to pursue economically outside the joint venture. In addition, our 49% equity investment may not be easily sold or readily accepted as collateral by potential lenders to Public Storage due to the joint venture structure.
The Hughes Family could control us and take actions adverse to other shareholders.
At December 31, 2017, B. Wayne Hughes, our former Chairman and his family, which includes his daughter, Tamara Hughes Gustavson and his son, B. Wayne Hughes, Jr., who are both members of our Board of Trustees (collectively, the “Hughes Family”), owned approximately 14.3% of our aggregate outstanding common shares. Our declaration of trust permits the Hughes Family to own up to 35.66% of our outstanding common shares while it generally restricts the ownership by other persons and entities to 3% of our outstanding common shares. Consequently, the Hughes Family may significantly influence matters submitted to a vote of our shareholders, including electing trustees, amending our organizational documents, dissolving and approving other extraordinary transactions, such as a takeover attempt, resulting in an outcome that may not be favorable to other shareholders.
Takeover attempts or changes in control could be thwarted, even if beneficial to shareholders.
In certain circumstances, shareholders might desire a change of control or acquisition of us, in order to realize a premium over the then-prevailing market price of our shares or for other reasons. However, the following could prevent, deter, or delay such a transaction:
Provisions of Maryland law may impose limitations that may make it more difficult for a third party to negotiate or effect a business combination transaction or control share acquisition with Public Storage. Currently, the Board has opted not to subject the Company to these provisions of Maryland law, but it could choose to do so in the future without shareholder approval.
To protect against the loss of our REIT status due to concentration of ownership levels, our declaration of trust generally limits the ability of a person, other than the Hughes Family or “designated investment entities” (each as defined in our declaration of trust), to own, actually or constructively, more than 3% of our outstanding common shares or 9.9% of the outstanding shares of any class or series of preferred or equity shares. Our Board may grant a specific exemption.
15
These limits could discourage, delay or prevent a transaction involving a change in control of the Company not approved by our Board.
Similarly, current provisions of our declaration of trust and powers of our Board could have the same effect, including (1) limitations on removal of trustees, (2) restrictions on the acquisition of our shares of beneficial interest, (3) the power to issue additional common shares, preferred shares or equity shares on terms approved by the Board without obtaining shareholder approval, (4) the advance notice provisions of our bylaws and (5) the Board’s ability under Maryland law, without obtaining shareholder approval, to implement takeover defenses that we may not yet have and to take, or refrain from taking, other actions that could have the effect of delaying, deterring or preventing a transaction or a change in control.
If we failed to qualify as a REIT, we would have to pay substantial income taxes.
REITs are subject to a range of complex organizational and operational requirements. A qualifying REIT does not generally incur federal income tax on its net income that is distributed to its shareholders. Our REIT status is also dependent upon the ongoing REIT qualification of PSB as a result of our substantial ownership interest in it. We believe we have qualified as a REIT and we intend to continue to maintain our REIT status.
There can be no assurance that we qualify or will continue to qualify as a REIT, because of the highly technical nature of the REIT rules, the ongoing importance of factual determinations, the possibility of unidentified issues in prior periods or changes in our circumstances, as well as share ownership limits in our articles of incorporation that do not necessarily ensure that our shareholder base is sufficiently diverse for us to qualify as a REIT. For any year we fail to qualify as a REIT, unless certain relief provisions apply (the granting of such relief could nonetheless result in significant excise or penalty taxes), we would not be allowed a deduction for dividends paid, we would be subject to corporate tax on our taxable income, and generally we would not be allowed to elect REIT status until the fifth year after such a disqualification. Any taxes, interest, and penalties incurred would reduce our cash available for distributions to shareholders and could negatively affect our stock price. However, for years in which we failed to qualify as a REIT, we would not be subject to REIT rules which require us to distribute substantially all of our taxable income to our shareholders.
Holders of our preferred shares have dividend, liquidation and other rights that are senior to the rights of the holders of shares of our common stock.
Holders of our preferred shares are entitled to cumulative dividends before any dividends may be declared or set aside on our common stock. Upon liquidation, holders of our preferred shares will receive a liquidation preference of $25,000 per share (or $25.00 per depositary share) plus any accrued and unpaid distributions before any payment is made to the common shareholders. These preferences may limit the amount received by our common shareholders either from ongoing distributions or upon liquidation. In addition, our preferred shareholders have the right to elect two additional directors to our Board whenever dividends are in arrears in an aggregate amount equivalent to six or more quarterly dividends, whether or not consecutive.
Recent and potential changes in tax laws could negatively impact us.
The United States Treasury Department and Congress frequently review federal income tax legislation, regulations and other guidance. We cannot predict whether, when or to what extent new federal tax laws, regulations, interpretations or rulings will be adopted. Any legislative action may prospectively or retroactively modify our tax treatment and, therefore, may adversely affect taxation of us or our shareholders. In particular, the legislation passed last December, commonly referred to as the Tax Cuts and Jobs Act (the “TCJA”), which was signed into law on December 22, 2017 and which generally takes effect for taxable years beginning on or after January 1, 2018 (subject to certain exceptions), makes many significant changes to the federal income tax laws that will profoundly impact the taxation of individuals and corporations (both regular C corporations as well as corporations that have elected REIT status). A number of changes that affect non-corporate taxpayers will expire at the end of 2025 unless Congress acts to extend them. These changes will impact us and our shareholders in various ways, some of which are potentially

16
adverse compared to prior law. To date, the IRS has issued only limited guidance with respect to certain of the new provisions, and there are numerous interpretive issues that will require guidance. It is highly likely that technical corrections legislation will be needed to clarify certain aspects of the new law and give proper effect to Congressional intent. There can be no assurance, however, that technical corrections needed to prevent unintended or unforeseen tax consequences will be enacted by Congress in the near future or that any corrections made may not have further adverse, unintended or unforeseen tax consequences.
Changes made by the TCJA will limit our ability to deduct compensation in excess of $1 million paid to
certain senior executives. This could require us to increase distributions to our shareholders in order to avoid paying tax and to maintain our REIT status.
We may pay some taxes, reducing cash available for shareholders.
Even if we qualify as a REIT for federal income tax purposes, we may be subject to some federal, foreign, state and local taxes on our income and property. Since January 1, 2001, certain consolidated corporate subsidiaries of the Company have elected to be treated as “taxable REIT subsidiaries” for federal income tax purposes, and are taxable as regular corporations and subject to certain limitations on intercompany transactions. If tax authorities determine that amounts paid by our taxable REIT subsidiaries to us are not reasonable compared to similar arrangements among unrelated parties, we could be subject to a 100% penalty tax on the excess payments, and ongoing intercompany arrangements could have to change, resulting in higher ongoing tax payments. To the extent the Company is required to pay federal, foreign, state or local taxes or federal penalty taxes due to existing laws or changes thereto, we will have less cash available for distribution to shareholders.
In addition, certain local and state governments have imposed taxes on self-storage rent. While in most cases those taxes are paid by our customers, they increase the cost of self-storage rental to our customers and can negatively impact our revenues. Other local and state governments may impose self-storage rent taxes in the future.
We are exposed to ongoing litigation and other legal and regulatory actions, which may divert management’s time and attention, require us to pay damages and expenses or restrict the operation of our business.
We have over 5,500 employees and 1.5 million customers at any point of time, and we conduct business at facilities with 159 million net rentable square feet of storage space. As a result, we are subject to the risk of legal claims and proceedings (including class actions) and regulatory enforcement actions in the ordinary course of our business and otherwise, and we could incur significant liabilities and substantial legal fees as a result of these actions. Resolution of these claims and actions may divert time and attention by our management and could involve payment of damages or expenses by us, all of which may be significant. In addition, any such resolution could involve our agreement to terms that restrict the operation of our business. The results of legal proceedings cannot be predicted with certainty. We cannot guarantee losses incurred in connection with any current or future legal or regulatory proceedings or actions will not exceed any provisions we may have set aside in respect of such proceedings or actions or will not exceed any available insurance coverage. The impact of any such legal claims, proceedings, and regulatory enforcement actions and could negatively impact our operating results, cash flow available for distribution or reinvestment, and or the price of our common shares.
We are heavily dependent on computer systems, telecommunications and the Internet to process transactions, summarize results and manage our business. Security breaches or a failure of such networks, systems or technology could adversely impact our business, customer, and employee relationships.
We are heavily dependent upon automated information technology and Internet commerce, with more than half of our new customers coming from the telephone or over the Internet, and the nature of our business involves the receipt and retention of personal information about our customers. We also maintain personally identifiable information about our employees. We centrally manage significant components of our operations with our computer systems, including our financial information, and we also rely extensively on third-party vendors to retain data, process transactions and provide other systems services. These systems are subject to damage or interruption from power outages, computer and telecommunications failures, computer worms, viruses and other destructive or disruptive security breaches and catastrophic events.
17
As a result, our operations could be severely impacted by a natural disaster, terrorist attack or other circumstance that results in a significant outage of our systems or those of our third party providers, despite our use of back up and redundancy measures. Our or our customers’ or employees’ confidential information could be compromised or misappropriated, due to a breach of our network security. Such cybersecurity and data security breaches as well as systems disruptions and shutdowns could result in additional costs to repair or replace such networks or information systems and possible legal liability, including government enforcement actions and private litigation. In addition, our customers could lose confidence in our ability to protect their personal information, which could cause them to discontinue leasing our self-storage facilities. Such events could lead to lost future revenues and adversely affect our results of operations and could result in remedial and other costs, fines or lawsuits, which could be in excess of any available insurance that we have procured.
We are subject to laws and governmental regulations and actions that require us to incur compliance costs affecting our operating results and financial condition.
Our business is subject to regulation under a wide variety of U.S. federal, state and local laws, regulations and policies including those imposed by the SEC, the Sarbanes-Oxley Act of 2002, the Dodd-Frank Wall Street Reform and Consumer Protection Act and NYSE, as well as applicable local, state, and national labor laws. Although we have policies and procedures designed to comply with applicable laws and regulations, failure to comply with the various laws and regulations may result in civil and criminal liability, fines and penalties, increased costs of compliance, restatement of our financial statements and could also affect the marketability of our real estate facilities.
In response to current economic conditions or the current political environment or otherwise, laws and regulations could be implemented or changed in ways that adversely affect our operating results and financial condition, such as legislation that could facilitate union activity or that would otherwise increase operating costs.
All of our properties must comply with the Americans with Disabilities Act and with related regulations and similar state law requirements, as well as various real estate and zoning laws and regulations, which are subject to change and could become more costly to comply with in the future. Compliance with these requirements can require us to incur significant expenditures, which would reduce cash otherwise available for distribution to shareholders. A failure to comply with these laws could lead to fines or possible awards of damages to individuals affected by the non-compliance. Failure to comply with these requirements could also affect the marketability of our real estate facilities.
Our tenant reinsurance business is subject to governmental regulation which could reduce our profitability or limit our growth.
We hold Limited Lines Self-Service Storage Insurance Agent licenses from a number of individual state Departments of Insurance and are subject to state governmental regulation and supervision. Our continued ability to maintain these Limited Lines Self-Service Storage Insurance Agent licenses in the jurisdictions in which we are licensed depends on our compliance with related rules and regulations. The regulatory authorities in each jurisdiction generally have broad discretion to grant, renew and revoke licenses and approvals, to promulgate, interpret, and implement regulations, and to evaluate compliance with regulations through periodic examinations, audits and investigations of the affairs of insurance agents. As a result of regulatory or private action in any jurisdiction, we may be temporarily or permanently suspended from continuing some or all of our reinsurance activities, or otherwise fined or penalized or suffer an adverse judgment, which could reduce our net income.
ITEM 1B. Unresolved Staff Comments
None.

18
ITEM 2. Properties
At December 31, 2017, we had direct and indirect ownership interests in 2,386 self-storage facilities located in 38 states within the U.S. and 222 (including one wholly-owned facility) storage facilities located in seven Western European nations:
At December 31, 2017
Number of Storage
Facilities (a) Net Rentable Square Feet
(in thousands) U.S.: California
Southern 248 18,225Northern 178 11,057
Texas 297 21,280Florida 285 19,341Illinois 126 7,952Georgia 108 7,129Washington 94 6,438North Carolina 89 6,281Virginia 91 5,593New York 67 4,672Colorado 67 4,379New Jersey 58 3,863Maryland 62 3,761Minnesota 48 3,359South Carolina 58 3,229Ohio 47 3,081Arizona 45 2,975Michigan 44 2,869Missouri 38 2,236Indiana 34 2,152Oregon 39 2,040Pennsylvania 29 1,993Tennessee 32 1,952Nevada 27 1,818Massachusetts 25 1,691Oklahoma 21 1,477Kansas 21 1,268Other states (12 states) 108 6,406
Total - U.S. 2,386 158,517
Europe (b): Netherlands 61 3,112France 56 2,929Sweden 30 1,659United Kingdom 28 1,640Belgium 21 1,267Germany 16 889Denmark 10 572
Total - Europe 222 12,068
Grand Total 2,608 170,585
19
(a) See Schedule III: Real Estate and Accumulated Depreciation in the Company’s 2017 financials, for a summary of land, building, and accumulated depreciation by market.
(b) The facilities located in Europe include one facility in the United Kingdom that we wholly own, as well as the facilities owned by Shurgard Europe.
We seek to maximize our facilities’ cash flow through the regular review and adjustment of rents charged and promotions granted to our existing and new incoming customers, and controlling expenses. For the year ended December 31, 2017, the weighted average occupancy level and the average realized rent per occupied square foot for our self-storage facilities were approximately 92.1% and $16.78, respectively, in the U.S. and 86.7% and $22.15, respectively, in Europe.
At December 31, 2017, 30 of our U.S. facilities with a net book value of $118 million were encumbered by an aggregate of $29 million in mortgage notes payable.
We have no specific policy as to the maximum size of any one particular self-storage facility. However, none of our facilities involves, or is expected to involve, 1% or more of our total assets, gross revenues or net income.
Description of Self-Storage Facilities: Self-storage facilities, which comprise the majority of our investments, offer accessible storage space for personal and business use at a relatively low cost. A user rents a fully enclosed space, securing the space with their lock, which is for the user's exclusive use and to which only the user has access. Property managers operate the facility and are supervised by district managers. Some self-storage facilities also include rentable uncovered parking areas for vehicle storage. Space is rented on a month-to-month basis and rental rates vary according to the location of the property, the size of the storage space and other characteristics that affect the relative attractiveness of each particular space, such as whether the space has “drive-up” access, its proximity to elevators, or if the space is climate controlled. All of our self-storage facilities in the U.S. are operated under the "Public Storage" brand name, while our facilities in Europe are operated under the “Shurgard” brand name.
Users include individuals from virtually all demographic groups, as well as businesses. Individuals usually store furniture, household appliances, personal belongings, motor vehicles, boats, campers, motorcycles and other household goods. Businesses normally store excess inventory, business records, seasonal goods, equipment and fixtures.
Our self-storage facilities generally consist of between 350 to 750 storage spaces. Most spaces have between 25 and 400 square feet and an interior height of approximately eight to 12 feet.
We experience minor seasonal fluctuations in the occupancy levels of self-storage facilities with occupancies generally higher in the summer months than in the winter months. We believe that these fluctuations result in part from increased demand from moving activity during the summer months and incremental demand from college students.
Our self-storage facilities are geographically diversified and are located primarily in or near major metropolitan markets in 38 states in the U.S. Generally our self-storage facilities are located in heavily populated areas and close to concentrations of apartment complexes, single family residences and commercial developments.
Competition from other self-storage facilities is significant and affects the occupancy levels, rental rates, rental income and operating expenses of our facilities.
We believe that self-storage facilities, upon achieving stabilized occupancy levels of approximately 90%, have attractive characteristics consisting of high profit margins, a broad tenant base, low levels of capital expenditures to maintain their condition and appearance, and excellent returns on invested capital. Historically, upon reaching stabilization, our U.S. self-storage facilities have generally shown a high degree of stability in generating cash flows.
Description of Commercial Properties: We have an interest in PSB, which, as of December 31, 2017, owns and operates approximately 28.0 million rentable square feet of commercial space in six states. At December 31,
20
2017, the $400.1 million book value and $1.8 billion market value, respectively, of our investment in PSB represents approximately 4% and 17%, respectively, of our total book value assets. We also directly own 0.9 million net rentable square feet of commercial space managed primarily by PSB.
The commercial properties owned by PSB consist primarily of flex, multi-tenant office and industrial space. Flex space is defined as buildings that are configured with a combination of office and warehouse space and can be designed to fit a wide variety of uses (including office, assembly, showroom, laboratory, light manufacturing and warehouse space).
Environmental Matters: We accrue environmental assessments and estimated remediation cost when it is probable that such efforts will be required and the related costs can be reasonably estimated. Our current practice is to conduct environmental investigations in connection with property acquisitions. Although there can be no assurance, we are not aware of any environmental contamination of any of our facilities, which individually or in the aggregate would be material to our overall business, financial condition, or results of operations.
ITEM 3. Legal Proceedings
We are a party to various legal proceedings and subject to various claims and complaints; however, we believe that the likelihood of these contingencies resulting in a material loss to the Company, either individually or in the aggregate, is remote.
ITEM 4. Mine Safety Disclosures
Not applicable.
21
PART II
ITEM 5. Market for Registrant’s Common Equity, Related Shareholder Matters and Issuer Purchases of Equity Securities
a. Market Information of the Registrant’s Common Equity:
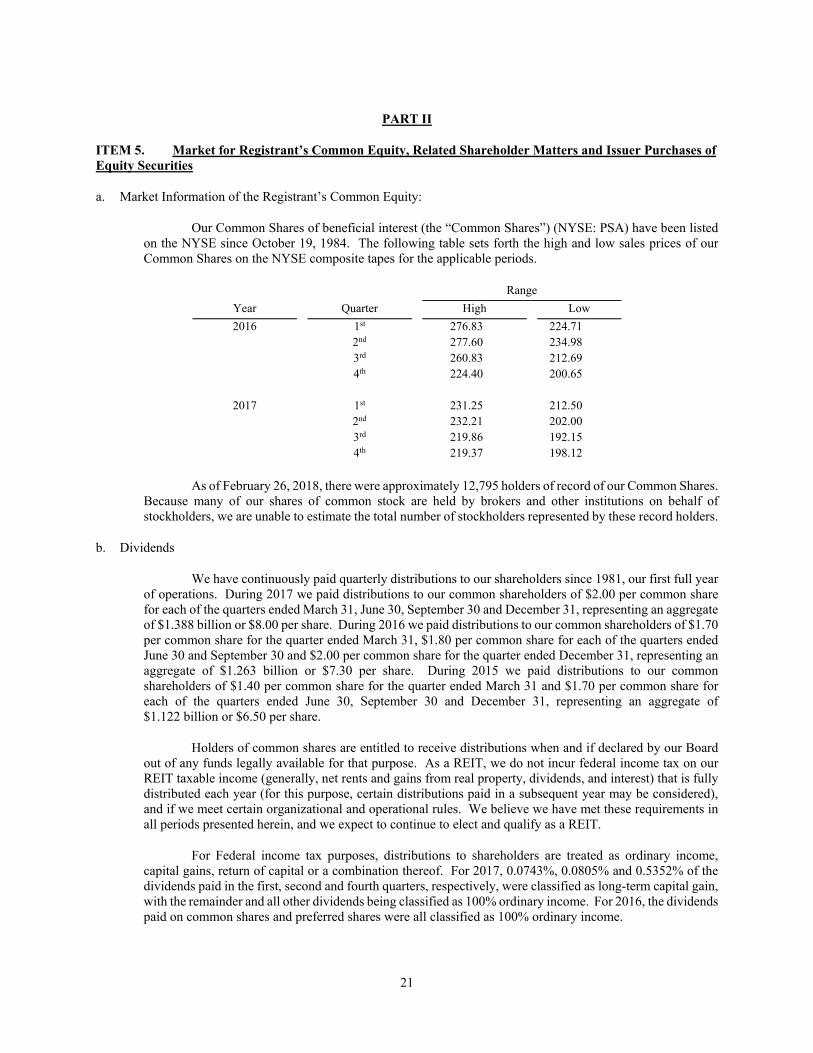
Our Common Shares of beneficial interest (the “Common Shares”) (NYSE: PSA) have been listed on the NYSE since October 19, 1984. The following table sets forth the high and low sales prices of our Common Shares on the NYSE composite tapes for the applicable periods.
Range
Year Quarter High Low
2016 1st 276.83 224.71 2nd 277.60 234.98 3rd 260.83 212.69 4th 224.40 200.65
2017 1st 231.25 212.50 2nd 232.21 202.00 3rd 219.86 192.15 4th 219.37 198.12
As of February 26, 2018, there were approximately 12,795 holders of record of our Common Shares. Because many of our shares of common stock are held by brokers and other institutions on behalf of stockholders, we are unable to estimate the total number of stockholders represented by these record holders.
b. Dividends
We have continuously paid quarterly distributions to our shareholders since 1981, our first full year of operations. During 2017 we paid distributions to our common shareholders of $2.00 per common share for each of the quarters ended March 31, June 30, September 30 and December 31, representing an aggregate of $1.388 billion or $8.00 per share. During 2016 we paid distributions to our common shareholders of $1.70 per common share for the quarter ended March 31, $1.80 per common share for each of the quarters ended June 30 and September 30 and $2.00 per common share for the quarter ended December 31, representing an aggregate of $1.263 billion or $7.30 per share. During 2015 we paid distributions to our common shareholders of $1.40 per common share for the quarter ended March 31 and $1.70 per common share for each of the quarters ended June 30, September 30 and December 31, representing an aggregate of $1.122 billion or $6.50 per share.
Holders of common shares are entitled to receive distributions when and if declared by our Board out of any funds legally available for that purpose. As a REIT, we do not incur federal income tax on our REIT taxable income (generally, net rents and gains from real property, dividends, and interest) that is fully distributed each year (for this purpose, certain distributions paid in a subsequent year may be considered), and if we meet certain organizational and operational rules. We believe we have met these requirements in all periods presented herein, and we expect to continue to elect and qualify as a REIT.
For Federal income tax purposes, distributions to shareholders are treated as ordinary income, capital gains, return of capital or a combination thereof. For 2017, 0.0743%, 0.0805% and 0.5352% of the dividends paid in the first, second and fourth quarters, respectively, were classified as long-term capital gain, with the remainder and all other dividends being classified as 100% ordinary income. For 2016, the dividends paid on common shares and preferred shares were all classified as 100% ordinary income.
22
c. Equity Shares
We are authorized to issue 100,000,000 equity shares from time to time in one or more series and our Board has broad authority to fix the dividend and distribution rights, conversion and voting rights, redemption provisions and liquidation rights of each series of equity shares. We had no equity shares outstanding for any period in the years ended December 31, 2017, 2016 or 2015. We have no plans to issue equity shares.
d. Common Share Repurchases
Our Board has authorized management to repurchase up to 35,000,000 of our common shares on the open market or in privately negotiated transactions. From the inception of the repurchase program through February 28, 2018, we have repurchased a total of 23,721,916 common shares (all purchased prior to 2010) at an aggregate cost of approximately $679.1 million. Our common share repurchase program does not have an expiration date and there are 11,278,084 common shares that may yet be repurchased under our repurchase program as of December 31, 2017. We have no current plans to repurchase shares; however, future levels of common share repurchases will be dependent upon our available capital, investment alternatives, and the trading price of our common shares.
e. Preferred Share Redemptions
We had no preferred redemptions during the three months ended December 31, 2017.

23
ITEM 6. Selected Financial Data
For the year ended December 31,
2017 2016 2015 2014 2013
(Amounts in thousands, except share and per share data) Revenues $ 2,668,528 $ 2,560,549 $ 2,381,696 $ 2,177,296 $ 1,964,942 Expenses:
Cost of operations 707,978 669,083 635,502 613,324 559,759 Depreciation and amortization 454,526 433,314 426,008 437,114 387,402 General and administrative 82,882 83,656 88,177 71,459 66,679
1,245,386 1,186,053 1,149,687 1,121,897 1,013,840 Operating income 1,423,142 1,374,496 1,232,009 1,055,399 951,102 Interest and other income 18,771 15,138 16,544 17,638 33,979 Interest expense (12,690) (4,210) (610) (6,781) (6,444)Equity in earnings of unconsolidated real
estate entities 75,655 56,756 50,937 88,267 57,579 Foreign currency exchange (loss) gain (50,045) 17,570 306 (7,047) 17,082 Casualty loss (7,789) - - - -
Gain on real estate investment sales 1,421 689 18,503 2,479 4,233 Net income 1,448,465 1,460,439 1,317,689 1,149,955 1,057,531
Net income allocated to noncontrolling
equity interests (6,248) (6,863) (6,445) (5,751) (5,078)
Net income allocable to Public Storage
shareholders $ 1,442,217 $ 1,453,576 $ 1,311,244 $ 1,144,204 $ 1,052,453
Per Common Share:
Distributions $8.00 $7.30 $6.50 $5.60 $5.15Net income – Basic $6.75 $6.84 $6.10 $5.27 $4.92Net income – Diluted $6.73 $6.81 $6.07 $5.25 $4.89
Weighted average common shares –
Basic 173,613 173,091 172,699 172,251 171,640
Weighted average common shares –
Diluted 174,151 173,878 173,510 173,138 172,688
Balance Sheet Data: Total assets $ 10,732,892 $ 10,130,338 $ 9,778,232 $ 9,818,676 $ 9,876,266 Total debt $ 1,431,322 $ 390,749 $ 319,016 $ 64,364 $ 839,053 Total preferred equity $ 4,025,000 $ 4,367,500 $ 4,055,000 $ 4,325,000 $ 3,562,500
Public Storage shareholders’ equity $ 8,940,009 $ 9,411,910 $ 9,170,641 $ 9,480,796 $ 8,791,730
Permanent noncontrolling interests’
equity $ 24,360 $ 29,744 $ 26,997 $ 26,375 $ 27,125 Net cash flow:
Provided by operating activities $ 1,975,679 $ 1,945,336 $ 1,748,279 $ 1,603,542 $ 1,438,407
Used in investing activities $ (739,854) $ (699,111) $ (456,135) $ (194,331) $ (1,415,638)Used in financing activities $ (992,219) $ (1,148,826) $ (1,391,283) $ (1,236,864) $ (24,228)
24
ITEM 7. Management’s Discussion and Analysis of Financial Condition and Results of Operations
Management’s Discussion and Analysis of Financial Condition and Results of Operations (“MD&A”) should be read in conjunction with our financial statements and notes thereto.
Critical Accounting Policies
Our MD&A discusses our financial statements, which have been prepared in accordance with United States (“U.S.”) generally accepted accounting principles (“GAAP”), and are affected by our judgments, assumptions and estimates. The notes to our December 31, 2017 financial statements, primarily Note 2, summarize our significant accounting policies.
We believe the following are our critical accounting policies, because they have a material impact on the portrayal of our financial condition and results, and they require us to make judgments and estimates about matters that are inherently uncertain.
Income Tax Expense: We have elected to be treated as a REIT, as defined in the Internal Revenue Code of 1986, as amended (the “Code”). As a REIT, we do not incur federal income tax on our REIT taxable income that is fully distributed each year (for this purpose, certain distributions paid in a subsequent year may be considered), and if we meet certain organizational and operational rules. We believe we have met these REIT requirements for all periods presented herein. Accordingly, we have recorded no federal income tax expense related to our REIT taxable income.
Our evaluation that we have met the REIT requirements could be incorrect, because compliance with the tax rules requires factual determinations, and circumstances we have not identified could result in noncompliance with the tax requirements in current or prior years. For any taxable year that we fail to qualify as a REIT and for which applicable statutory relief provisions did not apply, we would be taxed at the regular corporate rates on all of our taxable income for at least that year and the ensuing four years, we could be subject to penalties and interest, and our net income would be materially different from the amounts estimated in our financial statements.
In addition, certain of our consolidated corporate subsidiaries have elected to be treated as “taxable REIT subsidiaries” for federal income tax purposes, which are taxable as regular corporations and subject to certain limitations on intercompany transactions. If tax authorities determine that amounts paid by our taxable REIT subsidiaries to us are not reasonable compared to similar arrangements among unrelated parties, we could be subject to a 100% penalty tax on the excess payments. Such a penalty tax could have a material adverse impact on our net income.
Impairment of Long-Lived Assets: The analysis of impairment of our long-lived assets involves identification of indicators of impairment, projections of future operating cash flows, and estimates of fair values, all of which require significant judgment and subjectivity. Others could come to materially different conclusions. In addition, we may not have identified all current facts and circumstances that may affect impairment. Any unidentified impairment loss, or change in conclusions, could have a material adverse impact on our net income.
Accrual for Uncertain and Contingent Liabilities: We accrue for certain contingent and other liabilities that have significant uncertain elements, such as property taxes, workers compensation claims, tenant reinsurance claims, as well as other legal claims and disputes involving customers, employees, governmental agencies and other third parties. We estimate such liabilities based upon many factors such as assumptions of past and future trends and our evaluation of likely outcomes. However, the estimates of known liabilities could be incorrect or we may not be aware of all such liabilities, in which case our accrued liabilities and net income could be misstated.
Accounting for Acquired Real Estate Facilities: We estimate the fair values of the land, buildings and intangible assets acquired for purposes of allocating the purchase price. Such estimates are based upon many assumptions and judgments, including (i) market rates of return and capitalization rates on real estate and intangible assets, (ii) building and material cost levels, (iii) comparisons of the acquired underlying land parcels to recent land transactions, and (iv) future cash flows from the real estate and the existing tenant base. Others could come to

25
materially different conclusions as to the estimated fair values, which would result in different depreciation and amortization expense, gains and losses on sale of real estate assets, and real estate and intangible assets.
Overview
Our self-storage operations generate most of our net income, and we believe that our earnings growth is most impacted by the level of organic growth in our existing self-storage portfolio. Accordingly, a significant portion of management’s time is devoted to maximizing cash flows from our existing self-storage facilities.
Most of our facilities compete with other well-managed and well-located competitors and we are subject to general economic conditions, particularly those that affect the spending habits of consumers and moving trends. We believe that our centralized information networks, national telephone and online reservation system, the brand name “Public Storage,” and our economies of scale enable us to meet such challenges effectively.
We plan on growing organically as well as through the acquisition and development of additional facilities. Since the beginning of 2013 through December 31, 2017, we acquired a total of 271 facilities with 19.0 million net rentable square feet from third parties for approximately $2.5 billion, and we opened newly developed and redeveloped self-storage space for a total cost of $887.4 million, adding approximately 8.1 million net rentable square feet.
Subsequent to December 31, 2017, we acquired or were under contract to acquire (subject to customary closing conditions) two self-storage facilities for $18.3 million. We will continue to seek to acquire properties; however, there is significant competition to acquire existing facilities and there can be no assurance as to the level of facilities we may acquire.
As of December 31, 2017, we had additional development and redevelopment projects in process which will add approximately 4.6 million net rentable square feet at a total cost of approximately $613.8 million. We expect to continue to seek additional development projects; however, the level of such activity may be limited due to various constraints such as difficulty in finding available sites that meet our risk-adjusted yield expectations, as well as challenges in obtaining building permits for self-storage activities in certain municipalities.
We believe that our development and redevelopment activities are beneficial to our business over the long run. However, in the short run, such activities dilute our earnings due to the three to four year period that it takes to fill up newly developed and redeveloped storage facilities and reach a stabilized level of cash flows offset by the cost of capital to fund the cost, combined with related overhead expenses flowing through general and administrative expense. We believe this dilution will increase in 2018 and beyond, because of an increased level of net rentable square feet being added to our portfolio due to continued development and redevelopment efforts.
On September 18, 2017, we completed a public offering of $1.0 billion in aggregate principal amount of unsecured notes in two equal tranches (collectively, the “U.S. Dollar Notes”), one maturing in September 2022 bearing interest at 2.370%, and another maturing in September 2027 bearing interest at 3.094%. This was our first public offering of debt, which should also serve to facilitate future offerings.
As of December 31, 2017, our capital resources over the next year are expected to be approximately $1.2 billion which exceeds our current planned capital needs over the next year of approximately $378.9 million. Our capital resources include: (i) $433.4 million of cash as of December 31, 2017, (ii) $483.9 million of available borrowing capacity on our revolving line of credit, and (iii) approximately $200 million to $300 million of expected retained operating cash flow for the next twelve months. Retained operating cash flow represents our expected cash flow provided by operating activities, less shareholder distributions and capital expenditures to maintain our real estate facilities.
Our planned capital needs over the next year consist of (i) $349.4 million of remaining spend on our current development pipeline, (ii) $18.3 million in property acquisitions currently under contract, and (iii) $11.2 million in principal repayments on existing debt. Our capital needs may increase significantly over the next year as we expect

26
to increase our development pipeline and acquire additional properties. In addition to other investment activities, we may also redeem outstanding preferred securities or repurchase shares of our common stock in the future.
In August and September of 2017, due to Hurricanes Harvey and Irma, we recorded a $7.8 million casualty loss due to damaged buildings and associated expenses, as well as $5.2 million in incremental ancillary cost of operations representing claims costs resulting from the hurricanes with respect to tenants covered under our tenant reinsurance program. Current loss estimates (including business interruption) are less than our insurance deductibles, as a result, we do not expect to receive any insurance proceeds.
See Liquidity and Capital Resources for further information regarding our capital requirements and anticipated sources of capital to fund such requirements.
Results of Operations
Operating results for 2017 and 2016
In 2017, net income allocable to our common shareholders was $1,171.6 million or $6.73 per diluted common share, compared to $1,183.9 million or $6.81 per share in 2016 representing a decrease of $12.3 million or $0.08. The decrease primarily reflects (i) a $67.6 million reduction due to the impact of foreign exchange translation gains and losses associated with our euro denominated debt, (ii) an $8.5 million increase in interest expense associated with higher outstanding debt balances and (iii) a $7.8 million casualty loss and $5.2 million in incremental tenant reinsurance losses related to Hurricanes Harvey and Irma offset partially by (iv) a $66.9 million increase in self-storage net operating income (described below) and (v) an $18.9 million increase in our equity in earnings of unconsolidated real estate entities.
The $66.9 million increase in self-storage net operating income is a result of a $44.6 million increase in our Same Store Facilities (as defined below) and a $22.3 million increase in our Non Same Store Facilities (as defined below). Revenues for the Same Store Facilities increased 3.0% or $63.0 million in 2017 as compared to 2016, due primarily to higher realized annual rent per occupied square foot. Cost of operations for the Same Store Facilities increased by 3.4% or $18.4 million in 2017 as compared to 2016, due primarily to increased property taxes, advertising and selling expense and repairs and maintenance costs, offset partially by lower snow removal costs. The increase in net operating income for the Non Same Store Facilities is due primarily to the impact of 345 self-storage facilities acquired, developed or expanded since January 2015.
Operating results for 2016 and 2015
In 2016, net income allocable to our common shareholders was $1,183.9 million or $6.81 per diluted common share, compared to $1,053.1 million or $6.07 per share in 2015 representing an increase of $130.8 million or $0.74 per share. The increase is primarily due to (i) a $139.1 million increase in self-storage net operating income and (ii) a $17.3 million increase in foreign exchange translation gains associated with our euro denominated debt offset partially by (iii) a $29.0 million reduction in gains on sales of real estate investments, including our equity share and (iv) a $20.0 million increase in EITF D-42 charges, including our equity share, as a result of preferred redemption activities.
The $139.1 million increase in self-storage net operating income is a result of a $104.6 million increase in our Same Store Facilities and a $34.5 million increase in our Non Same Store Facilities. Revenues for the Same Store Facilities increased 5.8% or $117.6 million in the year ended December 31, 2016 as compared to 2015, due primarily to higher realized annual rent per occupied square foot. Cost of operations for the Same Store Facilities increased by 2.5% or $13.1 million in the year ended December 31, 2016 as compared to 2015, due primarily to increased property taxes, on-site property manager payroll and repairs and maintenance, offset partially by lower snow removal costs. The increase in net operating income for the Non Same Store Facilities is due primarily to the impact of 295 self-storage facilities acquired, developed or expanded in 2015 and 2016.
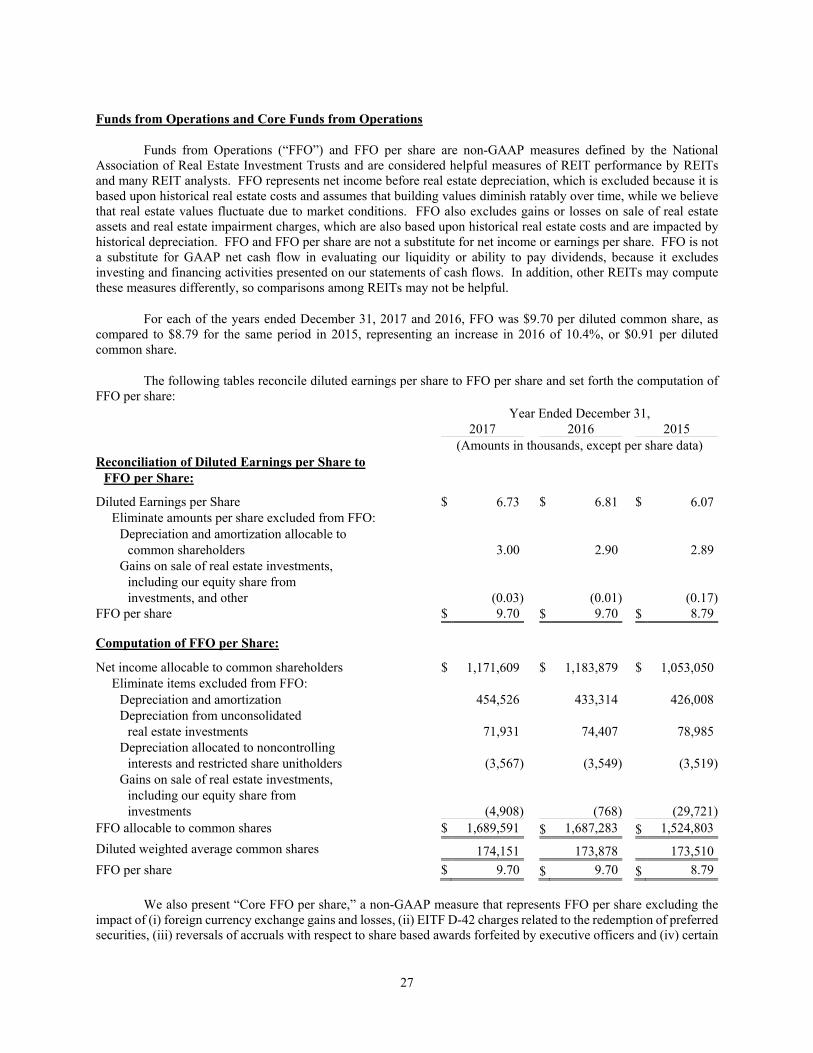
27
Funds from Operations and Core Funds from Operations
Funds from Operations (“FFO”) and FFO per share are non-GAAP measures defined by the National Association of Real Estate Investment Trusts and are considered helpful measures of REIT performance by REITs and many REIT analysts. FFO represents net income before real estate depreciation, which is excluded because it is based upon historical real estate costs and assumes that building values diminish ratably over time, while we believe that real estate values fluctuate due to market conditions. FFO also excludes gains or losses on sale of real estate assets and real estate impairment charges, which are also based upon historical real estate costs and are impacted by historical depreciation. FFO and FFO per share are not a substitute for net income or earnings per share. FFO is not a substitute for GAAP net cash flow in evaluating our liquidity or ability to pay dividends, because it excludes investing and financing activities presented on our statements of cash flows. In addition, other REITs may compute these measures differently, so comparisons among REITs may not be helpful.
For each of the years ended December 31, 2017 and 2016, FFO was $9.70 per diluted common share, as compared to $8.79 for the same period in 2015, representing an increase in 2016 of 10.4%, or $0.91 per diluted common share.
The following tables reconcile diluted earnings per share to FFO per share and set forth the computation of FFO per share:
Year Ended December 31, 2017 2016 2015 (Amounts in thousands, except per share data)
Reconciliation of Diluted Earnings per Share to FFO per Share:
Diluted Earnings per Share $ 6.73 $ 6.81 $ 6.07Eliminate amounts per share excluded from FFO:
Depreciation and amortization allocable to common shareholders 3.00 2.90 2.89
Gains on sale of real estate investments, including our equity share from investments, and other (0.03) (0.01) (0.17)
FFO per share $ 9.70 $ 9.70 $ 8.79
Computation of FFO per Share:
Net income allocable to common shareholders $ 1,171,609 $ 1,183,879 $ 1,053,050Eliminate items excluded from FFO:
Depreciation and amortization 454,526 433,314 426,008Depreciation from unconsolidated
real estate investments 71,931 74,407 78,985Depreciation allocated to noncontrolling
interests and restricted share unitholders (3,567) (3,549) (3,519)Gains on sale of real estate investments,
including our equity share from investments (4,908) (768) (29,721)
FFO allocable to common shares $ 1,689,591 $ 1,687,283 $ 1,524,803
Diluted weighted average common shares 174,151 173,878 173,510
FFO per share $ 9.70 $ 9.70 $ 8.79
We also present “Core FFO per share,” a non-GAAP measure that represents FFO per share excluding the impact of (i) foreign currency exchange gains and losses, (ii) EITF D-42 charges related to the redemption of preferred securities, (iii) reversals of accruals with respect to share based awards forfeited by executive officers and (iv) certain

28
other non-cash and/or nonrecurring income or expense items. We review Core FFO per share to evaluate our ongoing operating performance, and we believe it is used by investors and REIT analysts in a similar manner. However, Core FFO per share is not a substitute for net income per share. Because other REITs may not compute Core FFO per share in the same manner as we do, may not use the same terminology or may not present such a measure, Core FFO per share may not be comparable among REITs.
The following table reconciles FFO per share to Core FFO per share:
Year Ended December 31, Year Ended December 31, Percentage Percentage 2017 2016 Change 2016 2015 Change
FFO per share $ 9.70 $ 9.70 0.0% $ 9.70 $ 8.79 10.4%Eliminate the per share impact of items
excluded from Core FFO, including our equity share from investments:
Foreign currency exchange loss (gain) 0.29 (0.11) (0.11) (0.01) Application of EITF D-42 0.19 0.17 0.17 0.06 Casualty losses and tenant claims
due to hurricanes 0.07 - - - Reversals of accruals on forfeited
executive share-based awards (0.03) - - - Other items 0.01 0.03 0.03 0.06
Core FFO per share $ 10.23 $ 9.79 4.5% $ 9.79 $ 8.90 10.0%
Analysis of Net Income by Reportable Segment
The following discussion and analysis is presented and organized in accordance with Note 11 to our December 31, 2017 financial statements, “Segment Information.” Accordingly, refer to the tables presented in Note 11 in order to reconcile such amounts to our total net income and for further information on our reportable segments.
Self-Storage Operations
Our self-storage operations are analyzed in two groups: (i) the 2,042 facilities that we have owned and operated on a stabilized basis since January 1, 2015 (the “Same Store Facilities”), and (ii) all other facilities, which are newly acquired, newly developed, or recently redeveloped (the “Non Same Store Facilities”). See Note 11 to our December 31, 2017 financial statements “Segment Information,” for a reconciliation of the amounts in the tables below to our total net income.
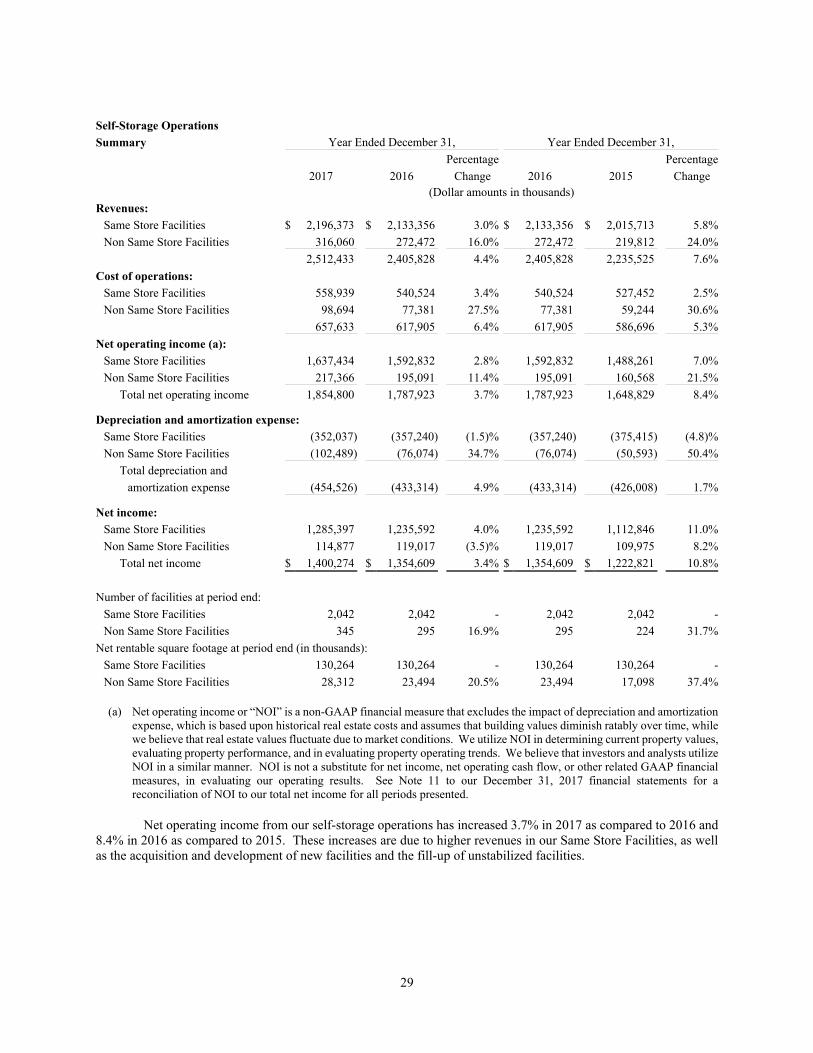
29
Self-Storage Operations
Summary Year Ended December 31, Year Ended December 31,
Percentage Percentage
2017 2016 Change 2016 2015 Change (Dollar amounts in thousands) Revenues:
Same Store Facilities $ 2,196,373 $ 2,133,356 3.0% $ 2,133,356 $ 2,015,713 5.8%
Non Same Store Facilities 316,060 272,472 16.0% 272,472 219,812 24.0%
2,512,433 2,405,828 4.4% 2,405,828 2,235,525 7.6%
Cost of operations:
Same Store Facilities 558,939 540,524 3.4% 540,524 527,452 2.5%
Non Same Store Facilities 98,694 77,381 27.5% 77,381 59,244 30.6%
657,633 617,905 6.4% 617,905 586,696 5.3%
Net operating income (a):
Same Store Facilities 1,637,434 1,592,832 2.8% 1,592,832 1,488,261 7.0%
Non Same Store Facilities 217,366 195,091 11.4% 195,091 160,568 21.5%
Total net operating income 1,854,800 1,787,923 3.7% 1,787,923 1,648,829 8.4%
Depreciation and amortization expense:
Same Store Facilities (352,037) (357,240) (1.5)% (357,240) (375,415) (4.8)%
Non Same Store Facilities (102,489) (76,074) 34.7% (76,074) (50,593) 50.4%
Total depreciation and
amortization expense (454,526) (433,314) 4.9% (433,314) (426,008) 1.7%
Net income:
Same Store Facilities 1,285,397 1,235,592 4.0% 1,235,592 1,112,846 11.0%
Non Same Store Facilities 114,877 119,017 (3.5)% 119,017 109,975 8.2%
Total net income $ 1,400,274 $ 1,354,609 3.4% $ 1,354,609 $ 1,222,821 10.8%
Number of facilities at period end:
Same Store Facilities 2,042 2,042 - 2,042 2,042 -
Non Same Store Facilities 345 295 16.9% 295 224 31.7%
Net rentable square footage at period end (in thousands):
Same Store Facilities 130,264 130,264 - 130,264 130,264 -
Non Same Store Facilities 28,312 23,494 20.5% 23,494 17,098 37.4%
(a) Net operating income or “NOI” is a non-GAAP financial measure that excludes the impact of depreciation and amortization expense, which is based upon historical real estate costs and assumes that building values diminish ratably over time, while we believe that real estate values fluctuate due to market conditions. We utilize NOI in determining current property values, evaluating property performance, and in evaluating property operating trends. We believe that investors and analysts utilize NOI in a similar manner. NOI is not a substitute for net income, net operating cash flow, or other related GAAP financial measures, in evaluating our operating results. See Note 11 to our December 31, 2017 financial statements for a reconciliation of NOI to our total net income for all periods presented.
Net operating income from our self-storage operations has increased 3.7% in 2017 as compared to 2016 and 8.4% in 2016 as compared to 2015. These increases are due to higher revenues in our Same Store Facilities, as well as the acquisition and development of new facilities and the fill-up of unstabilized facilities.
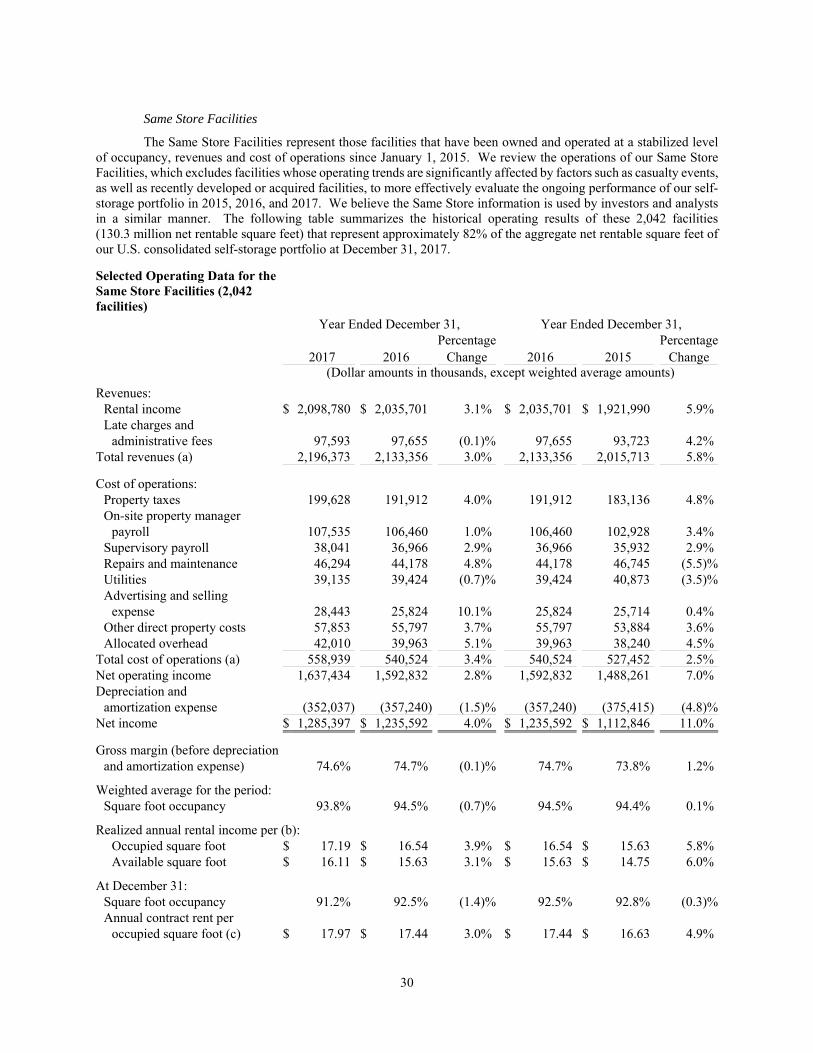
30
Same Store Facilities
The Same Store Facilities represent those facilities that have been owned and operated at a stabilized level of occupancy, revenues and cost of operations since January 1, 2015. We review the operations of our Same Store Facilities, which excludes facilities whose operating trends are significantly affected by factors such as casualty events, as well as recently developed or acquired facilities, to more effectively evaluate the ongoing performance of our self-storage portfolio in 2015, 2016, and 2017. We believe the Same Store information is used by investors and analysts in a similar manner. The following table summarizes the historical operating results of these 2,042 facilities (130.3 million net rentable square feet) that represent approximately 82% of the aggregate net rentable square feet of our U.S. consolidated self-storage portfolio at December 31, 2017.
Selected Operating Data for the Same Store Facilities (2,042 facilities)
Year Ended December 31, Year Ended December 31, Percentage Percentage 2017 2016 Change 2016 2015 Change (Dollar amounts in thousands, except weighted average amounts)
Revenues: Rental income $ 2,098,780 $ 2,035,701 3.1% $ 2,035,701 $ 1,921,990 5.9%Late charges and
administrative fees 97,593 97,655 (0.1)% 97,655 93,723 4.2%Total revenues (a) 2,196,373 2,133,356 3.0% 2,133,356 2,015,713 5.8%
Cost of operations: Property taxes 199,628 191,912 4.0% 191,912 183,136 4.8%On-site property manager
payroll 107,535 106,460 1.0% 106,460 102,928 3.4%Supervisory payroll 38,041 36,966 2.9% 36,966 35,932 2.9%Repairs and maintenance 46,294 44,178 4.8% 44,178 46,745 (5.5)%Utilities 39,135 39,424 (0.7)% 39,424 40,873 (3.5)%Advertising and selling
expense 28,443 25,824 10.1% 25,824 25,714 0.4%Other direct property costs 57,853 55,797 3.7% 55,797 53,884 3.6%Allocated overhead 42,010 39,963 5.1% 39,963 38,240 4.5%
Total cost of operations (a) 558,939 540,524 3.4% 540,524 527,452 2.5%Net operating income 1,637,434 1,592,832 2.8% 1,592,832 1,488,261 7.0%Depreciation and
amortization expense (352,037) (357,240) (1.5)% (357,240) (375,415) (4.8)%Net income $ 1,285,397 $ 1,235,592 4.0% $ 1,235,592 $ 1,112,846 11.0%
Gross margin (before depreciation and amortization expense) 74.6% 74.7% (0.1)% 74.7% 73.8% 1.2%
Weighted average for the period: Square foot occupancy 93.8% 94.5% (0.7)% 94.5% 94.4% 0.1%
Realized annual rental income per (b): Occupied square foot $ 17.19 $ 16.54 3.9% $ 16.54 $ 15.63 5.8%Available square foot $ 16.11 $ 15.63 3.1% $ 15.63 $ 14.75 6.0%
At December 31: Square foot occupancy 91.2% 92.5% (1.4)% 92.5% 92.8% (0.3)%Annual contract rent per
occupied square foot (c) $ 17.97 $ 17.44 3.0% $ 17.44 $ 16.63 4.9%

31
(a) Revenues and cost of operations do not include tenant reinsurance and merchandise sale revenues and expenses generated at the facilities.
(b) Realized annual rent per occupied square foot is computed by dividing rental income, before late charges and administrative fees, by the weighted average occupied square feet for the period. Realized annual rent per available square foot (“REVPAF”) is computed by dividing rental income, before late charges and administrative fees, by the total available net rentable square feet for the period. These measures exclude late charges and administrative fees in order to provide a better measure of our ongoing level of revenue. Late charges are dependent upon the level of delinquency, and administrative fees are dependent upon the level of move-ins. In addition, the rates charged for late charges and administrative fees can vary independently from rental rates. These measures take into consideration promotional discounts, which reduce rental income.
(c) Annual contract rent represents the agreed upon monthly rate that is paid by our tenants in place at the time of measurement. Contract rates are initially set in the lease agreement upon move-in, and we adjust them from time to time with notice. Contract rent excludes other fees that are charged on a per-item basis, such as late charges and administrative fees, does not reflect the impact of promotional discounts, and does not reflect the impact of rents that are written off as uncollectible.
Analysis of Same Store Revenue
Revenues generated by our Same Store Facilities increased by 3.0% in 2017 as compared to 2016 and by 5.8% in 2016 as compared to 2015, due primarily to increases of 3.9% and 5.8% in 2017 and 2016, respectively, as compared to the year prior for the respective periods in realized annual rental income per occupied square foot.
Year-over-year growth in our Same Store revenues has declined from 5.8% in 2016 as compared to 2015, to 3.0% in 2017 as compared to 2016. Growth trends were decelerating throughout 2017, with year over year revenue growth at 4.0% for the three months ended March 31, 2017, 3.4% for the three months ended June 30, 2017, 2.4% for the three months ended September 30, 2017, and 2.1% for the three months ended December 31, 2017. We are experiencing softness in demand in substantially all of our major markets, which has led to lower move-in volumes combined with a lack of pricing power with respect to new tenants. We attribute some of this softness to local economic conditions and, in some markets most notably Atlanta, Austin, Charlotte, Chicago, Dallas, Denver, Houston, and New York, increased supply of newly constructed self-storage facilities.
Same Store weighted average square foot occupancy remained strong at 93.8%, 94.5% and 94.4% during 2017, 2016 and 2015, respectively, as move-out volumes declined in 2017, partially offsetting lower move-in volume.
We believe that high occupancies help maximize our rental income. We seek to maintain a weighted average square foot occupancy level of at least 90%, by regularly adjusting the rental rates and promotions offered to attract new tenants as well as adjusting our marketing efforts on both television and the Internet in order to generate sufficient move-in volume to replace tenants that vacate.
Increasing rental rates to existing tenants, generally on an annual basis, is a key component of our revenue growth. We determine the level of rental increases based upon our expectations regarding the impact of existing tenant rate increases on incremental move-outs. Rental rate increases to existing tenants in 2017 have been similar to 2016, and we expect rate increases to existing tenants in 2018 to be similar to 2017.
Annual contract rent per occupied foot increased 3.0% from December 31, 2016 to December 31, 2017, as compared to a 4.9% increase from December 31, 2015 to December 31, 2016. These year-over-year increases were primarily driven by annual rate increases given to existing tenants, partially offset by the net impact of replacing vacating tenants with new tenants with lower contract rates, or “rent roll down.” The reduction in the year over year growth in average contract rent per occupied foot to 3.0% from 4.9% is due primarily to a greater degree of rent roll down.
During 2017 and 2016, the annual contract rent for tenants who moved in was flat at $14.67 per foot, and the annual contract rent for tenants who moved out increased 2.8% to $16.10 per foot as compared to $15.66 per foot for 2016. During 2016, the annual contract rent for tenants who moved in increased 1.4% to $14.67 per foot as compared to $14.47 in 2015, and the annual contract rent for tenants who moved out increased 4.1% to $15.66 per foot as compared to $15.05 per foot for 2015.
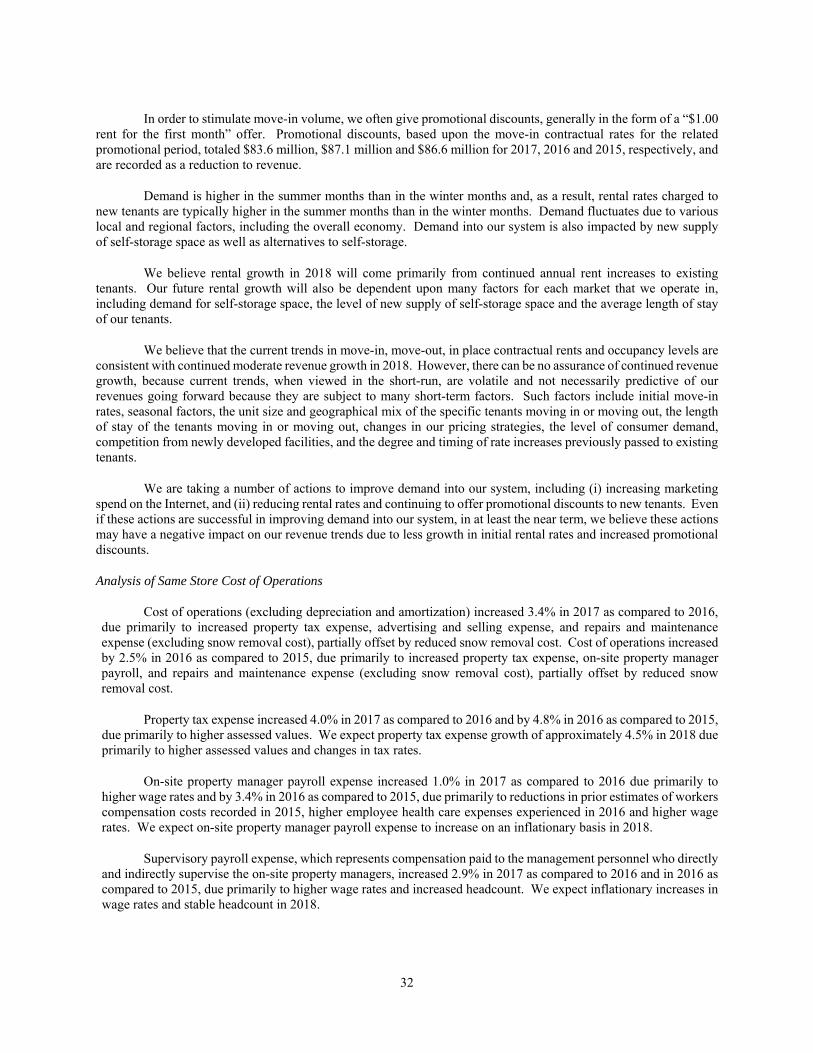
32
In order to stimulate move-in volume, we often give promotional discounts, generally in the form of a “$1.00 rent for the first month” offer. Promotional discounts, based upon the move-in contractual rates for the related promotional period, totaled $83.6 million, $87.1 million and $86.6 million for 2017, 2016 and 2015, respectively, and are recorded as a reduction to revenue.
Demand is higher in the summer months than in the winter months and, as a result, rental rates charged to new tenants are typically higher in the summer months than in the winter months. Demand fluctuates due to various local and regional factors, including the overall economy. Demand into our system is also impacted by new supply of self-storage space as well as alternatives to self-storage.
We believe rental growth in 2018 will come primarily from continued annual rent increases to existing tenants. Our future rental growth will also be dependent upon many factors for each market that we operate in, including demand for self-storage space, the level of new supply of self-storage space and the average length of stay of our tenants.
We believe that the current trends in move-in, move-out, in place contractual rents and occupancy levels are consistent with continued moderate revenue growth in 2018. However, there can be no assurance of continued revenue growth, because current trends, when viewed in the short-run, are volatile and not necessarily predictive of our revenues going forward because they are subject to many short-term factors. Such factors include initial move-in rates, seasonal factors, the unit size and geographical mix of the specific tenants moving in or moving out, the length of stay of the tenants moving in or moving out, changes in our pricing strategies, the level of consumer demand, competition from newly developed facilities, and the degree and timing of rate increases previously passed to existing tenants.
We are taking a number of actions to improve demand into our system, including (i) increasing marketing spend on the Internet, and (ii) reducing rental rates and continuing to offer promotional discounts to new tenants. Even if these actions are successful in improving demand into our system, in at least the near term, we believe these actions may have a negative impact on our revenue trends due to less growth in initial rental rates and increased promotional discounts.
Analysis of Same Store Cost of Operations
Cost of operations (excluding depreciation and amortization) increased 3.4% in 2017 as compared to 2016, due primarily to increased property tax expense, advertising and selling expense, and repairs and maintenance expense (excluding snow removal cost), partially offset by reduced snow removal cost. Cost of operations increased by 2.5% in 2016 as compared to 2015, due primarily to increased property tax expense, on-site property manager payroll, and repairs and maintenance expense (excluding snow removal cost), partially offset by reduced snow removal cost.
Property tax expense increased 4.0% in 2017 as compared to 2016 and by 4.8% in 2016 as compared to 2015, due primarily to higher assessed values. We expect property tax expense growth of approximately 4.5% in 2018 due primarily to higher assessed values and changes in tax rates.
On-site property manager payroll expense increased 1.0% in 2017 as compared to 2016 due primarily to higher wage rates and by 3.4% in 2016 as compared to 2015, due primarily to reductions in prior estimates of workers compensation costs recorded in 2015, higher employee health care expenses experienced in 2016 and higher wage rates. We expect on-site property manager payroll expense to increase on an inflationary basis in 2018.
Supervisory payroll expense, which represents compensation paid to the management personnel who directly and indirectly supervise the on-site property managers, increased 2.9% in 2017 as compared to 2016 and in 2016 as compared to 2015, due primarily to higher wage rates and increased headcount. We expect inflationary increases in wage rates and stable headcount in 2018.
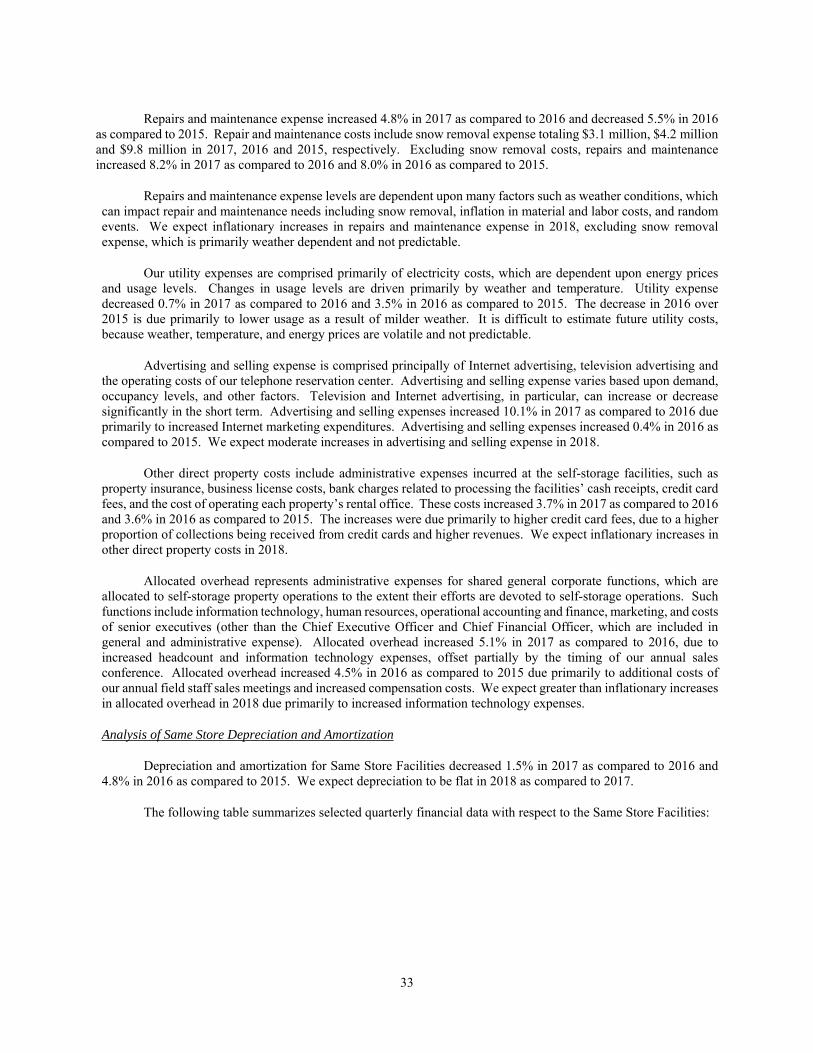
33
Repairs and maintenance expense increased 4.8% in 2017 as compared to 2016 and decreased 5.5% in 2016 as compared to 2015. Repair and maintenance costs include snow removal expense totaling $3.1 million, $4.2 million and $9.8 million in 2017, 2016 and 2015, respectively. Excluding snow removal costs, repairs and maintenance increased 8.2% in 2017 as compared to 2016 and 8.0% in 2016 as compared to 2015.
Repairs and maintenance expense levels are dependent upon many factors such as weather conditions, which can impact repair and maintenance needs including snow removal, inflation in material and labor costs, and random events. We expect inflationary increases in repairs and maintenance expense in 2018, excluding snow removal expense, which is primarily weather dependent and not predictable.
Our utility expenses are comprised primarily of electricity costs, which are dependent upon energy prices and usage levels. Changes in usage levels are driven primarily by weather and temperature. Utility expense decreased 0.7% in 2017 as compared to 2016 and 3.5% in 2016 as compared to 2015. The decrease in 2016 over 2015 is due primarily to lower usage as a result of milder weather. It is difficult to estimate future utility costs, because weather, temperature, and energy prices are volatile and not predictable.
Advertising and selling expense is comprised principally of Internet advertising, television advertising and the operating costs of our telephone reservation center. Advertising and selling expense varies based upon demand, occupancy levels, and other factors. Television and Internet advertising, in particular, can increase or decrease significantly in the short term. Advertising and selling expenses increased 10.1% in 2017 as compared to 2016 due primarily to increased Internet marketing expenditures. Advertising and selling expenses increased 0.4% in 2016 as compared to 2015. We expect moderate increases in advertising and selling expense in 2018.
Other direct property costs include administrative expenses incurred at the self-storage facilities, such as property insurance, business license costs, bank charges related to processing the facilities’ cash receipts, credit card fees, and the cost of operating each property’s rental office. These costs increased 3.7% in 2017 as compared to 2016 and 3.6% in 2016 as compared to 2015. The increases were due primarily to higher credit card fees, due to a higher proportion of collections being received from credit cards and higher revenues. We expect inflationary increases in other direct property costs in 2018.
Allocated overhead represents administrative expenses for shared general corporate functions, which are allocated to self-storage property operations to the extent their efforts are devoted to self-storage operations. Such functions include information technology, human resources, operational accounting and finance, marketing, and costs of senior executives (other than the Chief Executive Officer and Chief Financial Officer, which are included in general and administrative expense). Allocated overhead increased 5.1% in 2017 as compared to 2016, due to increased headcount and information technology expenses, offset partially by the timing of our annual sales conference. Allocated overhead increased 4.5% in 2016 as compared to 2015 due primarily to additional costs of our annual field staff sales meetings and increased compensation costs. We expect greater than inflationary increases in allocated overhead in 2018 due primarily to increased information technology expenses.
Analysis of Same Store Depreciation and Amortization
Depreciation and amortization for Same Store Facilities decreased 1.5% in 2017 as compared to 2016 and 4.8% in 2016 as compared to 2015. We expect depreciation to be flat in 2018 as compared to 2017.
The following table summarizes selected quarterly financial data with respect to the Same Store Facilities:
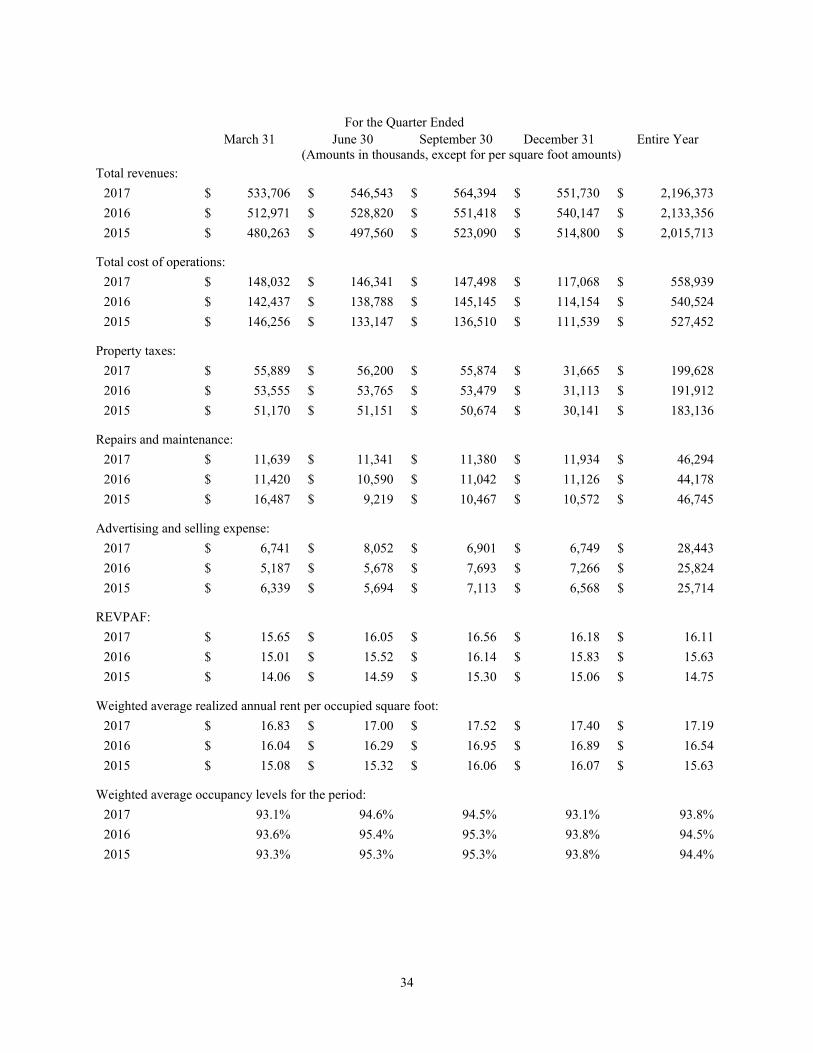
34
For the Quarter Ended March 31 June 30 September 30 December 31 Entire Year (Amounts in thousands, except for per square foot amounts)
Total revenues:
2017 $ 533,706 $ 546,543 $ 564,394 $ 551,730 $ 2,196,373
2016 $ 512,971 $ 528,820 $ 551,418 $ 540,147 $ 2,133,356
2015 $ 480,263 $ 497,560 $ 523,090 $ 514,800 $ 2,015,713 Total cost of operations:
2017 $ 148,032 $ 146,341 $ 147,498 $ 117,068 $ 558,939
2016 $ 142,437 $ 138,788 $ 145,145 $ 114,154 $ 540,524
2015 $ 146,256 $ 133,147 $ 136,510 $ 111,539 $ 527,452 Property taxes:
2017 $ 55,889 $ 56,200 $ 55,874 $ 31,665 $ 199,628
2016 $ 53,555 $ 53,765 $ 53,479 $ 31,113 $ 191,912
2015 $ 51,170 $ 51,151 $ 50,674 $ 30,141 $ 183,136 Repairs and maintenance:
2017 $ 11,639 $ 11,341 $ 11,380 $ 11,934 $ 46,294
2016 $ 11,420 $ 10,590 $ 11,042 $ 11,126 $ 44,178
2015 $ 16,487 $ 9,219 $ 10,467 $ 10,572 $ 46,745 Advertising and selling expense:
2017 $ 6,741 $ 8,052 $ 6,901 $ 6,749 $ 28,443
2016 $ 5,187 $ 5,678 $ 7,693 $ 7,266 $ 25,824
2015 $ 6,339 $ 5,694 $ 7,113 $ 6,568 $ 25,714 REVPAF:
2017 $ 15.65 $ 16.05 $ 16.56 $ 16.18 $ 16.11
2016 $ 15.01 $ 15.52 $ 16.14 $ 15.83 $ 15.63
2015 $ 14.06 $ 14.59 $ 15.30 $ 15.06 $ 14.75 Weighted average realized annual rent per occupied square foot:
2017 $ 16.83 $ 17.00 $ 17.52 $ 17.40 $ 17.19
2016 $ 16.04 $ 16.29 $ 16.95 $ 16.89 $ 16.54
2015 $ 15.08 $ 15.32 $ 16.06 $ 16.07 $ 15.63 Weighted average occupancy levels for the period:
2017 93.1% 94.6% 94.5% 93.1% 93.8%
2016 93.6% 95.4% 95.3% 93.8% 94.5%
2015 93.3% 95.3% 95.3% 93.8% 94.4%

35
Analysis of Market Trends
The following table sets forth selected market trends in our Same Store Facilities:
Same Store Facilities Operating Trends by Market Year Ended December 31, Year Ended December 31, 2017 2016 Change 2016 2015 Change (Amounts in thousands, except for weighted average data) Revenues:
Los Angeles (201 facilities) $ 333,020 $ 315,958 5.4% $ 315,958 $ 294,027 7.5%San Francisco (123 facilities) 183,969 177,075 3.9% 177,075 165,907 6.7%New York (84 facilities) 141,535 138,055 2.5% 138,055 133,213 3.6%Chicago (129 facilities) 120,500 120,344 0.1% 120,344 117,848 2.1%Washington DC (84 facilities) 107,096 105,602 1.4% 105,602 102,529 3.0%Miami (76 facilities) 102,509 101,350 1.1% 101,350 95,587 6.0%Atlanta (98 facilities) 82,052 79,840 2.8% 79,840 73,861 8.1%Seattle-Tacoma (69 facilities) 81,327 77,575 4.8% 77,575 71,201 9.0%Houston (74 facilities) 67,798 69,061 (1.8)% 69,061 67,843 1.8%Dallas-Ft. Worth (81 facilities) 67,098 66,277 1.2% 66,277 61,851 7.2%Philadelphia (56 facilities) 54,087 51,908 4.2% 51,908 49,275 5.3%Orlando-Daytona (62 facilities) 51,123 48,556 5.3% 48,556 45,143 7.6%West Palm Beach (41 facilities) 50,096 48,069 4.2% 48,069 44,196 8.8%Minneapolis-St Paul
(44 facilities) 44,514 43,300 2.8% 43,300 41,425 4.5%Portland (40 facilities) 38,529 37,410 3.0% 37,410 34,559 8.2%All other markets
(780 facilities) 671,120 652,976 2.8% 652,976 617,248 5.8%Total revenues $ 2,196,373 $ 2,133,356 3.0% $ 2,133,356 $ 2,015,713 5.8% Net operating income:
Los Angeles $ 277,084 $ 261,287 6.0% $ 261,287 $ 240,762 8.5%San Francisco 150,483 144,860 3.9% 144,860 134,913 7.4%New York 102,579 99,886 2.7% 99,886 96,222 3.8%Chicago 70,445 71,264 (1.1)% 71,264 68,433 4.1%Washington DC 80,674 80,684 (0.0)% 80,684 78,339 3.0%Miami 78,112 77,667 0.6% 77,667 72,264 7.5%Atlanta 60,724 59,360 2.3% 59,360 53,723 10.5%Seattle-Tacoma 64,139 61,393 4.5% 61,393 55,750 10.1%Houston 44,712 46,698 (4.3)% 46,698 46,876 (0.4)%Dallas-Ft. Worth 47,662 47,300 0.8% 47,300 43,292 9.3%Philadelphia 38,290 36,866 3.9% 36,866 33,856 8.9%Orlando-Daytona 37,847 35,457 6.7% 35,457 32,277 9.9%West Palm Beach 37,196 35,927 3.5% 35,927 32,591 10.2%Minneapolis-St. Paul 30,969 30,221 2.5% 30,221 28,679 5.4%Portland 30,174 29,351 2.8% 29,351 26,890 9.2%All other markets 486,344 474,611 2.5% 474,611 443,394 7.0%
Total net operating income $ 1,637,434 $ 1,592,832 2.8% $ 1,592,832 $ 1,488,261 7.0%
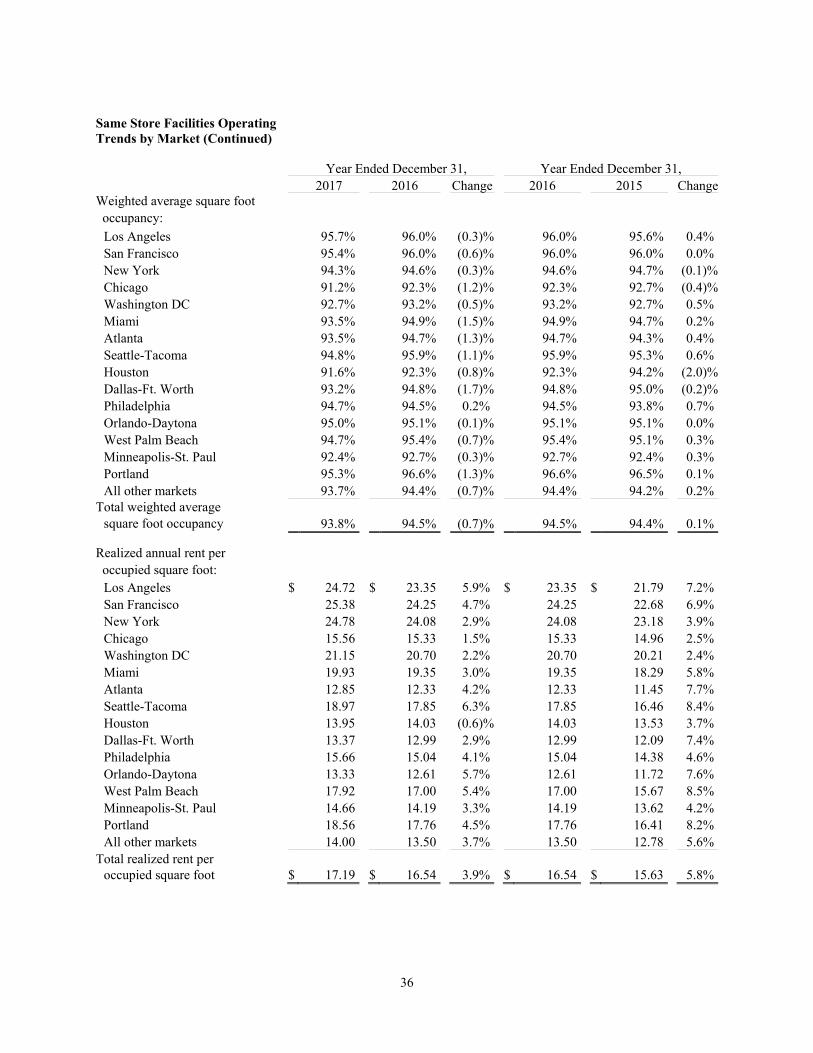
36
Same Store Facilities Operating Trends by Market (Continued)
Year Ended December 31, Year Ended December 31,
2017 2016 Change 2016 2015 ChangeWeighted average square foot occupancy:
Los Angeles 95.7% 96.0% (0.3)% 96.0% 95.6% 0.4%San Francisco 95.4% 96.0% (0.6)% 96.0% 96.0% 0.0%New York 94.3% 94.6% (0.3)% 94.6% 94.7% (0.1)%Chicago 91.2% 92.3% (1.2)% 92.3% 92.7% (0.4)%Washington DC 92.7% 93.2% (0.5)% 93.2% 92.7% 0.5%Miami 93.5% 94.9% (1.5)% 94.9% 94.7% 0.2%Atlanta 93.5% 94.7% (1.3)% 94.7% 94.3% 0.4%Seattle-Tacoma 94.8% 95.9% (1.1)% 95.9% 95.3% 0.6%Houston 91.6% 92.3% (0.8)% 92.3% 94.2% (2.0)%Dallas-Ft. Worth 93.2% 94.8% (1.7)% 94.8% 95.0% (0.2)%Philadelphia 94.7% 94.5% 0.2% 94.5% 93.8% 0.7%Orlando-Daytona 95.0% 95.1% (0.1)% 95.1% 95.1% 0.0%West Palm Beach 94.7% 95.4% (0.7)% 95.4% 95.1% 0.3%Minneapolis-St. Paul 92.4% 92.7% (0.3)% 92.7% 92.4% 0.3%Portland 95.3% 96.6% (1.3)% 96.6% 96.5% 0.1%All other markets 93.7% 94.4% (0.7)% 94.4% 94.2% 0.2%
Total weighted average square foot occupancy 93.8% 94.5% (0.7)% 94.5% 94.4% 0.1%
Realized annual rent per occupied square foot:
Los Angeles $ 24.72 $ 23.35 5.9% $ 23.35 $ 21.79 7.2%San Francisco 25.38 24.25 4.7% 24.25 22.68 6.9%New York 24.78 24.08 2.9% 24.08 23.18 3.9%Chicago 15.56 15.33 1.5% 15.33 14.96 2.5%Washington DC 21.15 20.70 2.2% 20.70 20.21 2.4%Miami 19.93 19.35 3.0% 19.35 18.29 5.8%Atlanta 12.85 12.33 4.2% 12.33 11.45 7.7%Seattle-Tacoma 18.97 17.85 6.3% 17.85 16.46 8.4%Houston 13.95 14.03 (0.6)% 14.03 13.53 3.7%Dallas-Ft. Worth 13.37 12.99 2.9% 12.99 12.09 7.4%Philadelphia 15.66 15.04 4.1% 15.04 14.38 4.6%Orlando-Daytona 13.33 12.61 5.7% 12.61 11.72 7.6%West Palm Beach 17.92 17.00 5.4% 17.00 15.67 8.5%Minneapolis-St. Paul 14.66 14.19 3.3% 14.19 13.62 4.2%Portland 18.56 17.76 4.5% 17.76 16.41 8.2%All other markets 14.00 13.50 3.7% 13.50 12.78 5.6%
Total realized rent per occupied square foot $ 17.19 $ 16.54 3.9% $ 16.54 $ 15.63 5.8%
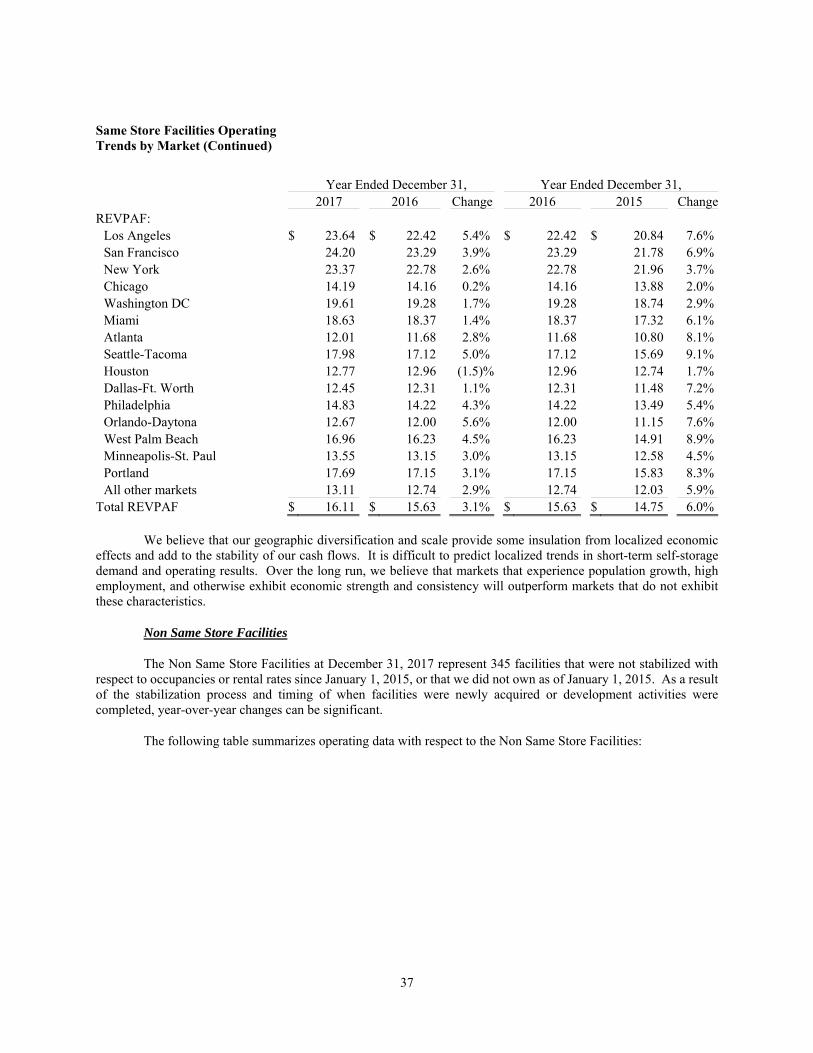
37
Same Store Facilities Operating Trends by Market (Continued) Year Ended December 31, Year Ended December 31, 2017 2016 Change 2016 2015 ChangeREVPAF:
Los Angeles $ 23.64 $ 22.42 5.4% $ 22.42 $ 20.84 7.6%San Francisco 24.20 23.29 3.9% 23.29 21.78 6.9%New York 23.37 22.78 2.6% 22.78 21.96 3.7%Chicago 14.19 14.16 0.2% 14.16 13.88 2.0%Washington DC 19.61 19.28 1.7% 19.28 18.74 2.9%Miami 18.63 18.37 1.4% 18.37 17.32 6.1%Atlanta 12.01 11.68 2.8% 11.68 10.80 8.1%Seattle-Tacoma 17.98 17.12 5.0% 17.12 15.69 9.1%Houston 12.77 12.96 (1.5)% 12.96 12.74 1.7%Dallas-Ft. Worth 12.45 12.31 1.1% 12.31 11.48 7.2%Philadelphia 14.83 14.22 4.3% 14.22 13.49 5.4%Orlando-Daytona 12.67 12.00 5.6% 12.00 11.15 7.6%West Palm Beach 16.96 16.23 4.5% 16.23 14.91 8.9%Minneapolis-St. Paul 13.55 13.15 3.0% 13.15 12.58 4.5%Portland 17.69 17.15 3.1% 17.15 15.83 8.3%All other markets 13.11 12.74 2.9% 12.74 12.03 5.9%
Total REVPAF $ 16.11 $ 15.63 3.1% $ 15.63 $ 14.75 6.0%
We believe that our geographic diversification and scale provide some insulation from localized economic effects and add to the stability of our cash flows. It is difficult to predict localized trends in short-term self-storage demand and operating results. Over the long run, we believe that markets that experience population growth, high employment, and otherwise exhibit economic strength and consistency will outperform markets that do not exhibit these characteristics.
Non Same Store Facilities
The Non Same Store Facilities at December 31, 2017 represent 345 facilities that were not stabilized with respect to occupancies or rental rates since January 1, 2015, or that we did not own as of January 1, 2015. As a result of the stabilization process and timing of when facilities were newly acquired or development activities were completed, year-over-year changes can be significant.
The following table summarizes operating data with respect to the Non Same Store Facilities:

38
NON SAME STORE Year Ended December 31, Year Ended December 31, FACILITIES 2017 2016 Change 2016 2015 Change (Dollar amounts in thousands, except square foot amounts) Revenues:
2017 acquisitions $ 5,577 $ - $ 5,577 $ - $ - $ -2016 acquisitions 36,336 18,174 18,162 18,174 - 18,1742015 acquisitions 16,935 15,574 1,361 15,574 6,255 9,319Developed facilities 42,301 23,405 18,896 23,405 9,460 13,945Other facilities 214,911 215,319 (408) 215,319 204,097 11,222
Total revenues 316,060 272,472 43,588 272,472 219,812 52,660
Cost of operations: 2017 acquisitions 2,006 - 2,006 - - -2016 acquisitions 13,693 6,455 7,238 6,455 - 6,4552015 acquisitions 5,298 5,010 288 5,010 2,067 2,943Developed facilities 19,526 10,932 8,594 10,932 3,934 6,998Other facilities 58,171 54,984 3,187 54,984 53,243 1,741
Total cost of operations 98,694 77,381 21,313 77,381 59,244 18,137
Net operating income: 2017 acquisitions 3,571 - 3,571 - - -2016 acquisitions 22,643 11,719 10,924 11,719 - 11,7192015 acquisitions 11,637 10,564 1,073 10,564 4,188 6,376Developed facilities 22,775 12,473 10,302 12,473 5,526 6,947Other facilities 156,740 160,335 (3,595) 160,335 150,854 9,481
Net operating income 217,366 195,091 22,275 195,091 160,568 34,523Depreciation and
amortization expense (102,489) (76,074) (26,415) (76,074) (50,593) (25,481)Net income $ 114,877 $ 119,017 $ (4,140) $ 119,017 $ 109,975 $ 9,042
At December 31: Square foot occupancy:
2017 acquisitions 87.3% - - - - -2016 acquisitions 85.9% 82.9% 3.6% 82.9% - -2015 acquisitions 92.4% 90.8% 1.8% 90.8% 85.3% 6.4%Developed facilities 63.5% 58.6% 8.4% 58.6% 70.0% (16.3)%Other facilities 82.8% 89.0% (7.0)% 89.0% 90.3% (1.4)%
79.9% 82.8% (3.5)% 82.8% 87.7% (5.6)%
Annual contract rent per occupied square foot:
2017 acquisitions $ 14.63 $ - - $ - $ - -2016 acquisitions 10.23 9.99 2.4% 9.99 - -2015 acquisitions 14.17 13.73 3.2% 13.73 12.87 6.7%Developed facilities 13.33 13.51 (1.3)% 13.51 12.45 8.5%Other facilities 17.16 16.89 1.6% 16.89 16.17 4.5%
$ 15.03 $ 15.07 (0.3)% $ 15.07 $ 15.61 (3.5)%

39
NON SAME STORE Year Ended December 31, Year Ended December 31, FACILITIES (Continued) 2017 2016 Change 2016 2015 Change
Number of facilities: 2017 acquisitions 34 - 34 - - -2016 acquisitions 55 55 - 55 - 552015 acquisitions 17 17 - 17 17 -Developed facilities 52 36 16 36 20 16Other facilities 187 187 - 187 187 -
345 295 50 295 224 71
Net rentable square feet (in thousands): 2017 acquisitions 2,114 - 2,114 - - -2016 acquisitions 4,177 4,121 56 4,121 - 4,1212015 acquisitions 1,285 1,285 - 1,285 1,285 -Developed facilities 6,059 4,019 2,040 4,019 1,878 2,141Other facilities 14,677 14,069 608 14,069 13,935 134
28,312 23,494 4,818 23,494 17,098 6,396
The facilities included above under “2017 acquisitions” include 22 facilities acquired from third parties in 2017 at an aggregate cost of $149.8 million, and 12 stabilized facilities previously owned by a legacy institutional partnership. We began consolidating the 12 facilities effective December 31, 2017 when we acquired the remaining 74.25% interest that we did not own in the partnership for $135.5 million. For periods prior to December 31, 2017, our existing 25.75% interest in the partnership was reflected as Equity in Earnings of Real Estate Entities, and fees for managing these properties were included in Interest and Other Income on our income statements.
The facilities under “2016 acquisitions” and “2015 acquisitions” were acquired from third parties at a cost of $429.1 million and $168.8 million, respectively.
For the year ended December 31, 2017, the weighted average annualized yield on cost, based upon net operating income, for the facilities acquired in each of 2016 and 2015 was 5.3% and 6.9%, respectively. The yields for the facilities acquired in the year ended December 31, 2017 were not meaningful due to our limited ownership period.
We believe that our management and operating infrastructure allows us to generate higher net operating income from newly acquired facilities than was achieved by the previous owners. However, it can take 24 or more months for us to fully achieve the higher net operating income, and the ultimate levels of net operating income to be achieved can be affected by changes in general economic conditions. As a result, there can be no assurance that we will achieve our expectations with respect to these newly acquired facilities.
Since the beginning of 2013, we have opened newly developed facilities with a total cost of $678.6 million and redeveloped existing facilities, expanding their square footage, for a total cost of $208.8 million. The newly developed facilities are included in “Developed facilities” and the redeveloped facilities are included in “Other facilities” in the table above. We believe that our real estate development activities are beneficial to our business over the long run. However, in the short run, development activities dilute our earnings due to the three to four year period to reach a stabilized level of cash flows and the cost of capital to fund development, combined with general and administrative expenses associated with development. We believe this dilution will increase in 2018 because of an increased level of net rentable square feet being added to our portfolio.
We expect the Non Same Store Facilities to continue to provide increased net operating income in 2018 as these facilities approach stabilized occupancy levels and the earnings of the 2017 acquisitions are reflected in our operations for a longer period in 2018 as compared to 2017.

40
We also expect to increase the number and net rentable square feet of Non Same Store Facilities through development of new self-storage facilities, redevelopment of existing facilities and acquisitions of facilities.
As of December 31, 2017, we had development and redevelopment projects which will add approximately 4.6 million net rentable square feet of storage space at a total cost of approximately $613.8 million. Some of these projects are subject to significant contingencies such as entitlement approval. We expect to continue to seek additional development projects; however, the level of future development may be limited due to various constraints such as difficulty in finding projects that meet our risk-adjusted yield expectations and challenges in obtaining building permits for self-storage activities in certain municipalities.
Subsequent to December 31, 2017, we acquired or were under contract to acquire (subject to customary closing conditions) two self-storage facilities for $18.3 million. We will continue to seek to acquire properties; however, there is significant competition to acquire existing facilities and therefore the dollar value of acquisitions is unpredictable.
Depreciation and amortization with respect to the Non Same Store Facilities totaled $102.5 million, $76.1 million and $50.6 million in 2017, 2016 and 2015, respectively. These amounts include i) depreciation of the buildings acquired or developed, which is recorded generally on a straight line basis, and ii) amortization of cost allocated to the tenants in place upon acquisition of a facility, which is recorded based upon the benefit of such existing tenants to each period and thus is highest when the facility is first acquired and declines as such tenants vacate. With respect to Non Same Store Facilities owned at December 31, 2017, depreciation of buildings and amortization of tenant intangibles is expected to total $100.8 million and $12.0 million, respectively, in 2018. The level of future depreciation and amortization will also depend upon the level of acquisitions of facilities and the level of newly developed storage space.
Ancillary Operations
Ancillary revenues and expenses include amounts associated with the reinsurance of policies against losses to goods stored by tenants in our self-storage facilities in the U.S. and the sale of merchandise at our self-storage facilities. The following table sets forth our ancillary operations:
Year Ended December 31, Year Ended December 31, 2017 2016 Change 2016 2015 Change (Amounts in thousands)Revenues:
Tenant reinsurance premiums $ 122,852 $ 118,911 $ 3,941 $ 118,911 $ 109,836 $ 9,075Merchandise 33,243 35,810 (2,567) 35,810 36,335 (525)
Total revenues 156,095 154,721 1,374 154,721 146,171 8,550
Cost of Operations: Tenant reinsurance 30,554 29,145 1,409 29,145 25,997 3,148Merchandise 19,791 22,033 (2,242) 22,033 22,809 (776)
Total cost of operations 50,345 51,178 (833) 51,178 48,806 2,372
Net income Tenant reinsurance 92,298 89,766 2,532 89,766 83,839 5,927Merchandise 13,452 13,777 (325) 13,777 13,526 251
Total net income $ 105,750 $ 103,543 $ 2,207 $ 103,543 $ 97,365 $ 6,178
Tenant reinsurance operations: Our tenants have the option of purchasing insurance from a non-affiliated insurance company to cover certain losses to their goods stored at our facilities. A wholly-owned, consolidated subsidiary of Public Storage fully reinsures such policies, and thereby assumes all risk of losses under these policies
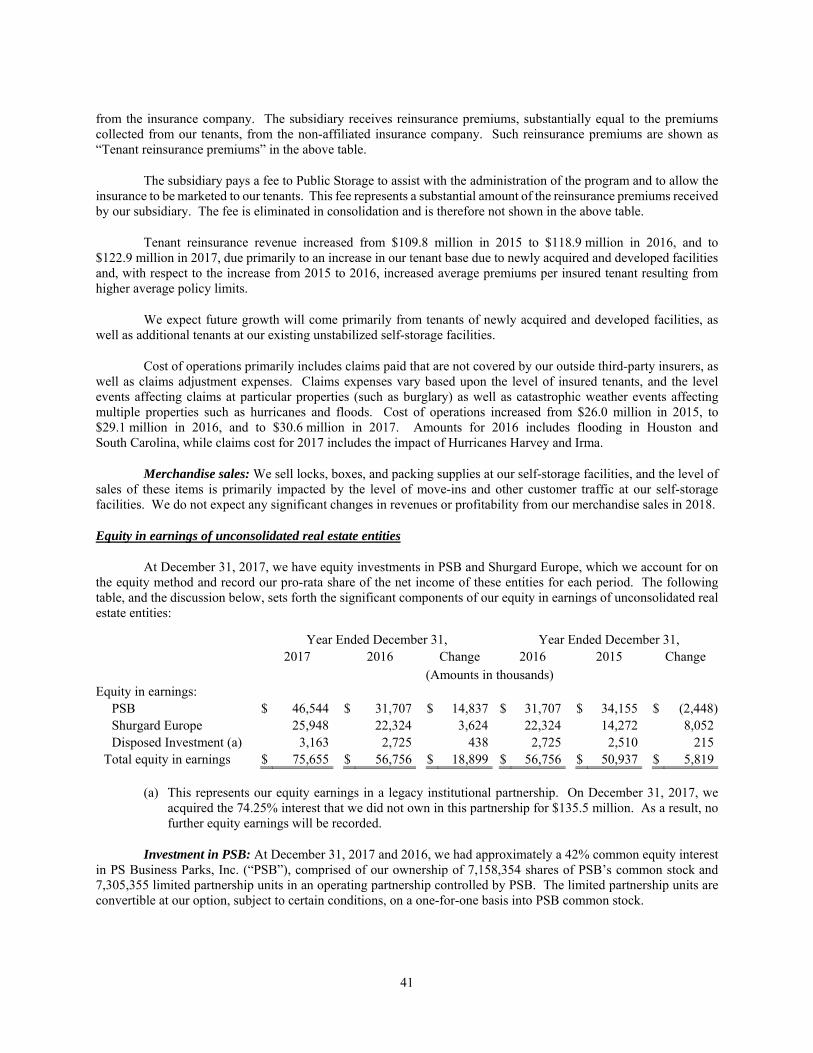
41
from the insurance company. The subsidiary receives reinsurance premiums, substantially equal to the premiums collected from our tenants, from the non-affiliated insurance company. Such reinsurance premiums are shown as “Tenant reinsurance premiums” in the above table.
The subsidiary pays a fee to Public Storage to assist with the administration of the program and to allow the insurance to be marketed to our tenants. This fee represents a substantial amount of the reinsurance premiums received by our subsidiary. The fee is eliminated in consolidation and is therefore not shown in the above table.
Tenant reinsurance revenue increased from $109.8 million in 2015 to $118.9 million in 2016, and to $122.9 million in 2017, due primarily to an increase in our tenant base due to newly acquired and developed facilities and, with respect to the increase from 2015 to 2016, increased average premiums per insured tenant resulting from higher average policy limits.
We expect future growth will come primarily from tenants of newly acquired and developed facilities, as well as additional tenants at our existing unstabilized self-storage facilities.
Cost of operations primarily includes claims paid that are not covered by our outside third-party insurers, as well as claims adjustment expenses. Claims expenses vary based upon the level of insured tenants, and the level events affecting claims at particular properties (such as burglary) as well as catastrophic weather events affecting multiple properties such as hurricanes and floods. Cost of operations increased from $26.0 million in 2015, to $29.1 million in 2016, and to $30.6 million in 2017. Amounts for 2016 includes flooding in Houston and South Carolina, while claims cost for 2017 includes the impact of Hurricanes Harvey and Irma.
Merchandise sales: We sell locks, boxes, and packing supplies at our self-storage facilities, and the level of sales of these items is primarily impacted by the level of move-ins and other customer traffic at our self-storage facilities. We do not expect any significant changes in revenues or profitability from our merchandise sales in 2018.
Equity in earnings of unconsolidated real estate entities
At December 31, 2017, we have equity investments in PSB and Shurgard Europe, which we account for on the equity method and record our pro-rata share of the net income of these entities for each period. The following table, and the discussion below, sets forth the significant components of our equity in earnings of unconsolidated real estate entities:
Year Ended December 31, Year Ended December 31, 2017 2016 Change 2016 2015 Change (Amounts in thousands)Equity in earnings:
PSB $ 46,544 $ 31,707 $ 14,837 $ 31,707 $ 34,155 $ (2,448)Shurgard Europe 25,948 22,324 3,624 22,324 14,272 8,052Disposed Investment (a) 3,163 2,725 438 2,725 2,510 215
Total equity in earnings $ 75,655 $ 56,756 $ 18,899 $ 56,756 $ 50,937 $ 5,819
(a) This represents our equity earnings in a legacy institutional partnership. On December 31, 2017, we acquired the 74.25% interest that we did not own in this partnership for $135.5 million. As a result, no further equity earnings will be recorded.
Investment in PSB: At December 31, 2017 and 2016, we had approximately a 42% common equity interest in PS Business Parks, Inc. (“PSB”), comprised of our ownership of 7,158,354 shares of PSB’s common stock and 7,305,355 limited partnership units in an operating partnership controlled by PSB. The limited partnership units are convertible at our option, subject to certain conditions, on a one-for-one basis into PSB common stock.

42
At December 31, 2017, PSB wholly-owned approximately 28 million rentable square feet of commercial space and had an interest in 395 apartments. PSB also manages commercial space that we own pursuant to property management agreements.
Equity in earnings from PSB increased $14.8 million in 2017, as compared to 2016, due primarily to improved real estate facility operating results, reduced depreciation expense, a gain on sale of real estate in 2017, and lower interest expense due to the repayment of debt. Equity in earnings from PSB decreased $2.4 million in 2016 as compared to 2015, due primarily to our $11.3 million equity share of gains on dispositions recorded by PSB in 2015, offset partially by our equity share of improved property operations. See Note 4 to our December 31, 2017 financial statements for selected financial information on PSB, as well as PSB’s filings and selected financial information that can be accessed through the SEC, and on PSB’s website, www.psbusinessparks.com.
Investment in Shurgard Europe: We have a 49% equity share in Shurgard Europe’s net income. At December 31, 2017, Shurgard Europe’s operations are comprised of 221 wholly-owned facilities with 12 million net rentable square feet. See Note 4 to our December 31, 2017 financial statements for selected financial data on Shurgard Europe for the years ended December 31, 2017, 2016 and 2015. As described in more detail in Note 4, we receive trademark license fees from Shurgard Europe.
Our equity in earnings from Shurgard Europe increased $3.6 million in 2017 as compared to 2016, and $8.1 million in 2016 as compared to 2015, due primarily to improved same-store operating results and increased earnings from newly acquired properties.
In 2017, Shurgard Europe opened two newly developed facilities in the United Kingdom with an aggregate total cost of $28.8 million. In 2016, Shurgard Europe opened a newly developed facility in the United Kingdom with a total cost of $12.9 million and in 2015, Shurgard Europe opened three newly developed facilities in the United Kingdom with a total cost of $39.4 million.
In June 2015, Shurgard Europe acquired 21 facilities in the Netherlands (0.9 million net rentable square feet), for approximately $146 million (€132 million).
In each of July 2014 and June 2015, Shurgard Europe issued €300 million of unsecured senior notes in various tranches due between July 2021 and June 2030, with an average interest rate of approximately 2.9%.
Unlike our operations in the U.S., Shurgard Europe operates through taxable corporations in each of the countries in which it does business and incurs tax expense. Our equity share of such income tax expense was approximately $8.6 million, $5.2 million and $5.3 million in 2017, 2016 and 2015, respectively.
For purposes of recording our equity in earnings from Shurgard Europe, the Euro was translated at exchange rates of approximately 1.198 U.S. Dollars per Euro at December 31, 2017 (1.052 at December 31, 2016), and average exchange rates of 1.129 for 2017, 1.107 for 2016 and 1.110 for 2015.
Our future earnings from Shurgard Europe will be affected primarily by the operating results of its existing facilities, the exchange rate between the U.S. Dollar and currencies in the countries in which Shurgard Europe conducts its business (principally the Euro), the impact of income taxes, and the degree to which Shurgard Europe reinvests the cash it generates from operations into real estate investments or distributes the amounts to its shareholders.

43
Analysis of items not allocated to segments
General and administrative expense: The following table sets forth our general and administrative expense:
Year Ended December 31, Year Ended December 31, 2017 2016 Change 2016 2015 Change
(Amounts in thousands)
Share-based compensation expense $ 37,548 $ 37,483 $ 65 $ 37,483 $ 32,570 $ 4,913Costs of senior executives 5,872 6,052 (180) 6,052 5,552 500Development and acquisition costs 8,193 9,721 (1,528) 9,721 10,006 (285)Tax compliance costs and taxes paid 4,795 3,859 936 3,859 5,372 (1,513)Legal costs 6,995 7,305 (310) 7,305 18,366 (11,061)Public company costs 4,145 3,768 377 3,768 3,632 136Other costs 15,334 15,468 (134) 15,468 12,679 2,789
Total $ 82,882 $ 83,656 $ (774) $ 83,656 $ 88,177 $ (4,521)
Share-based compensation expense includes the amortization of restricted share units and stock options granted to employees and trustees, as well as related employer taxes. Share-based compensation expense varies based upon the level of grants and their related vesting and amortization periods, forfeitures, as well as the Company’s common share price on the date of grant. Share-based compensation costs in 2017 include a $5.4 million reversal of previously amortized costs, due to the forfeiture of share-based compensation resulting from the retirement of certain senior executives in the quarter ended June 30, 2017.
We expect a $23.6 million increase in share-based compensation expense in 2018 with respect to share-based grants to our Chief Executive Officer ("CEO") and Chief Financial Officer ("CFO") as of December 31, 2017, who are expected to retire at the end of 2018 and then serve as Trustees of the Company for the foreseeable future. While the actual vesting of such share-based compensation will not accelerate, and will continue to vest under the original schedule only if they continue to serve as trustees, GAAP indicates that the respective service periods for their previous grants while CEO and CFO effectively end on the date of their retirement as CEO and CFO. As a result, the remaining unamortized expense on outstanding grants at December 31, 2017 will be recognized through December 31, 2018, increasing 2018 expense $23.6 million above what it would have been without the acceleration of amortization. Any additional grants to our CEO and CFO in 2018 will also be amortized through December 31, 2018 and further increase our share-based compensation expense for 2018. See Note 10 to our December 31, 2017 financial statements for further information on our share-based compensation.
Costs of senior executives represent the cash compensation paid to our chief executive officer and chief financial officer.
Development and acquisition costs primarily represent internal and external expenses related to our development activities and the acquisition of real estate facilities and varies primarily based upon the level of development activities undertaken. The amounts in the above table are net of $9.4 million, $8.5 million and $8.1 million for 2017, 2016 and 2015, respectively, in development costs that were capitalized to newly developed and redeveloped self-storage facilities. Development and acquisition costs are expected to increase modestly in 2018.
Tax compliance costs and taxes paid include taxes paid to various state and local authorities, the internal and external costs of filing tax returns, costs associated with complying with federal and state tax laws, and maintaining our compliance with Internal Revenue Service REIT rules. Such costs vary primarily based upon the tax rates of the various states in which we do business.
Legal costs include internal personnel as well as fees paid to legal firms and other third parties with respect to general corporate legal matters and risk management, and varies based upon the level of legal activity. The decrease of $11.1 million in 2016 as compared to 2015, is due primarily to legal fees and expenses associated with certain
44
litigated matters in 2015, including $3.5 million accrued in 2015 in connection with the settlement of a legal matter. The future level of legal costs is not determinable.
Public company costs represent the incremental costs of operating as a publicly-traded company, such as internal and external investor relations expenses, stock listing and transfer agent fees, board of trustees’ (our “Board”) costs, and costs associated with maintaining compliance with applicable laws and regulations, including the Dodd-Frank Wall Street Reform and Consumer Protection Act and Sarbanes-Oxley Act of 2002.
Other costs represent professional and consulting fees, payroll and overhead that are not directly attributable to our property operations. Such costs vary depending upon the level of corporate activities and initiatives and, as such, are not predictable.
Our future general and administrative expenses are difficult to estimate, due to their dependence upon many factors, including those noted above.
Interest and other income: Interest and other income is comprised primarily of the net income from our commercial operations and property management operations and to a lesser extent interest earned on cash balances, trademark license fees received from Shurgard Europe, as well as sundry other income items that are received from time to time in varying amounts. Amounts attributable to our commercial operations and property management operations totaled $10.9 million, $10.6 million and $12.0 million in 2017, 2016 and 2015, respectively. We do not expect any significant changes in interest and other income in 2018.
Interest expense: For 2017, 2016 and 2015, we incurred $17.1 million, $9.4 million, and $3.3 million, respectively, of interest on our outstanding debt. In determining interest expense, these amounts were offset by capitalized interest of $4.4 million, $5.1 million and $2.7 million during 2017, 2016, and 2015, respectively, associated with our development activities. On September 18, 2017, we completed a public offering of $1.0 billion notes (the “U.S. Dollar Notes”) bearing an average annual interest rate of 2.732%. At December 31, 2017, we had $1.4 billion of debt outstanding, with an average interest rate of 2.6%. See Note 6 to our December 31, 2017 financial statements for further information on our debt balances. Future interest expense will be dependent upon the level of outstanding debt and the amount of in-process development costs.
Foreign Exchange Gain (Loss): For 2017, we recorded a foreign currency translation loss of $50.0 million representing the change in the U.S. Dollar equivalent of our Euro-denominated unsecured notes due to fluctuations in exchange rates (gains of $17.6 million and $306,000 for 2016 and 2015, respectively). The Euro was translated at exchange rates of approximately 1.198 U.S. Dollars per Euro at December 31, 2017, 1.052 at December 31, 2016 and 1.091 at December 31, 2015. Future gains and losses on foreign currency translation will be dependent upon changes in the relative value of the Euro to the U.S. Dollar, and the level of Euro-denominated debt outstanding.
Casualty Loss: During 2017, we incurred a $7.8 million casualty loss with respect to damage to several of our facilities caused by Hurricanes Harvey and Irma.
Gain on Real Estate Investment Sales: In 2017, 2016 and 2015, we recorded gains totaling $1.4 million, $689,000 and $18.5 million, respectively, primarily in connection with the partial sale of real estate facilities pursuant to eminent domain proceedings.
Net Income Allocable to Preferred Shareholders: Net income allocable to preferred shareholders based upon distributions decreased in 2017 as compared to 2016 and in 2016 as compared to 2015, due primarily to lower average rates offset partially by higher weighted average preferred shares outstanding. We also allocated $29.3 million, $26.9 million and $8.9 million of income from our common shareholders to the holders of our preferred shares in 2017, 2016 and 2015, respectively, in connection with the redemption of our preferred shares. Based upon our preferred shares outstanding at December 31, 2017, our quarterly distribution to our preferred shareholders is expected to be approximately $54.1 million.
45
Liquidity and Capital Resources
Financing Strategy: As a REIT, we generally distribute 100% of our taxable income to our shareholders, which relative to a taxable C corporation, limits the amount of cash flow from operations that we can retain for investments. As a result, in order to grow our asset base, access to capital is important. Historically we have primarily financed our cash investment activities with retained operating cash flow combined with the proceeds from the issuance of preferred securities. Over the past two years, we have diversified our capital sources by issuing medium term debt.
Our financial profile is characterized by strong credit metrics, including low leverage relative to our total capitalization and operating cash flows. We are one of the highest rated REITs, as rated by major rating agencies Moody’s and Standard & Poor’s. Our unsecured debt has an “A” credit rating by Standard & Poor’s and “A2” by Moody’s. Our credit ratings on each of our series of preferred shares are “A3” by Moody’s and “BBB+” by Standard & Poor’s. Our credit profile and ratings enables us to effectively access both the public and private capital markets to raise capital.
We have a $500.0 million revolving line of credit which we occasionally use as temporary “bridge” financing until we are able to raise longer term capital. As of December 31, 2017 and February 28, 2018, there were no borrowings outstanding on the revolving line of credit, however, we do have approximately $16.1 million of outstanding letters of credit which limits our borrowing capacity to $483.9 million.
Over the long-term, we expect to fund our capital requirements with retained operating cash flow, the issuance of additional medium or long term debt, and proceeds from the issuance of common and preferred securities. We will select among these sources of capital based upon availability, relative cost, the desire for leverage, refinancing risk, and considering potential constraints caused by certain features of capital sources, such as debt covenants.
Liquidity and Capital Resource Analysis: We believe that our net cash provided by our operating activities will continue to be sufficient to enable us to meet our ongoing requirements for principal payments on debt, maintenance capital expenditures, and distributions to our shareholders for the foreseeable future.
As of December 31, 2017, our capital resources over the next year are expected to be approximately $1.2 billion which exceeds our current planned capital needs over the next year of approximately $378.9 million. Our capital resources include: (i) $433.4 million of cash as of December 31, 2017, (ii) $483.9 million of available borrowing capacity on our revolving line of credit, and (iii) approximately $200 million to $300 million of expected retained operating cash flow for the next twelve months. Retained operating cash flow represents our expected cash flow provided by operating activities, less shareholder distributions and capital expenditures to maintain our real estate facilities.
Our planned capital needs over the next year consist of (i) $349.4 million of remaining spend on our current development pipeline, (ii) $18.3 million in property acquisitions currently under contract, and (iii) $11.2 million in principal repayments on existing debt. Our capital needs may increase over the next year as we expect to increase our development pipeline and acquire additional properties. In addition to other investment activities, we may also redeem outstanding preferred securities or repurchase shares of our common stock in the future.
To the extent our retained operating cash flow, cash on hand, and line of credit are insufficient to fund our activities, we believe we have a variety of possibilities to raise additional capital including issuing common or preferred securities, issuing debt, or entering into joint venture arrangements to acquire or develop facilities.
Required Debt Repayments: As of December 31, 2017, our outstanding debt totaled approximately $1.4 billion, consisting of $29.2 million of secured debt, $409.7 million of Euro-denominated unsecured debt and $1.0 billion of U.S. Dollar denominated unsecured debt. Approximate principal maturities are as follows (amounts in thousands):
46
2018 $ 11,2412019 1,5052020 1,5852021 1,5032022 502,071Thereafter 921,024 $ 1,438,929
Capital Expenditure Requirements: Capital expenditures include general maintenance, major repairs or replacements to elements of our facilities to keep our facilities in good operating condition and maintain their visual appeal. Capital expenditures do not include costs relating to the development of new facilities or redevelopment of existing facilities to increase their available rentable square footage.
Capital expenditures totaled $124.8 million in 2017 and are expected to be approximately $100 million in 2018. However, we are evaluating the potential upgrade of climate control, offices, lighting, and elevator units in certain facilities, which could result in additional capital expenditure amounts in 2018. For the last four years, capital expenditures have ranged between approximately $0.45 and $0.75 per net rentable square foot per year.
Requirement to Pay Distributions: For all periods presented herein, we have elected to be treated as a REIT, as defined in the Code. As a REIT, we do not incur federal income tax on our REIT taxable income (generally, net rents and gains from real property, dividends, and interest) that is fully distributed each year (for this purpose, certain distributions paid in a subsequent year may be considered), and if we meet certain organizational and operational rules. We believe we have met these requirements in all periods presented herein, and we expect to continue to elect and qualify as a REIT.
Distributions paid during 2017 totaled $1.6 billion, consisting of $236.5 million to preferred shareholders and $1.4 billion to common shareholders and restricted share unitholders. All of these distributions were REIT qualifying distributions.
We estimate the annual distribution requirements with respect to our Preferred Shares outstanding at December 31, 2017, to be approximately $216.3 million per year.
On February 20, 2018, our Board declared a regular common quarterly dividend of $2.00 per common share. Our consistent, long-term dividend policy has been to distribute only our taxable income. Future quarterly distributions with respect to the common shares will continue to be determined based upon our REIT distribution requirements after taking into consideration distributions to the preferred shareholders and will be funded with cash provided by operating activities.
We estimate we will pay approximately $8.0 million per year in distributions to noncontrolling interests outstanding at December 31, 2017.
Real Estate Investment Activities: Subsequent to December 31, 2017, we acquired or were under contract to acquire (subject to customary closing conditions) two self-storage facilities for $18.3 million. We will continue to seek to acquire properties; however, there is significant competition to acquire existing facilities and there can be no assurance as to the level of facilities we may acquire.
As of December 31, 2017 we had development and redevelopment projects at a total cost of approximately $613.8 million. A total of $264.4 million of these costs were incurred through December 31, 2017, with the remaining cost to complete of $349.4 million expected to be incurred primarily in the next 18 months. Some of these projects are subject to significant contingencies such as entitlement approval. We expect to continue to seek additional projects; however, the level of future development and redevelopment may be limited due to various constraints such
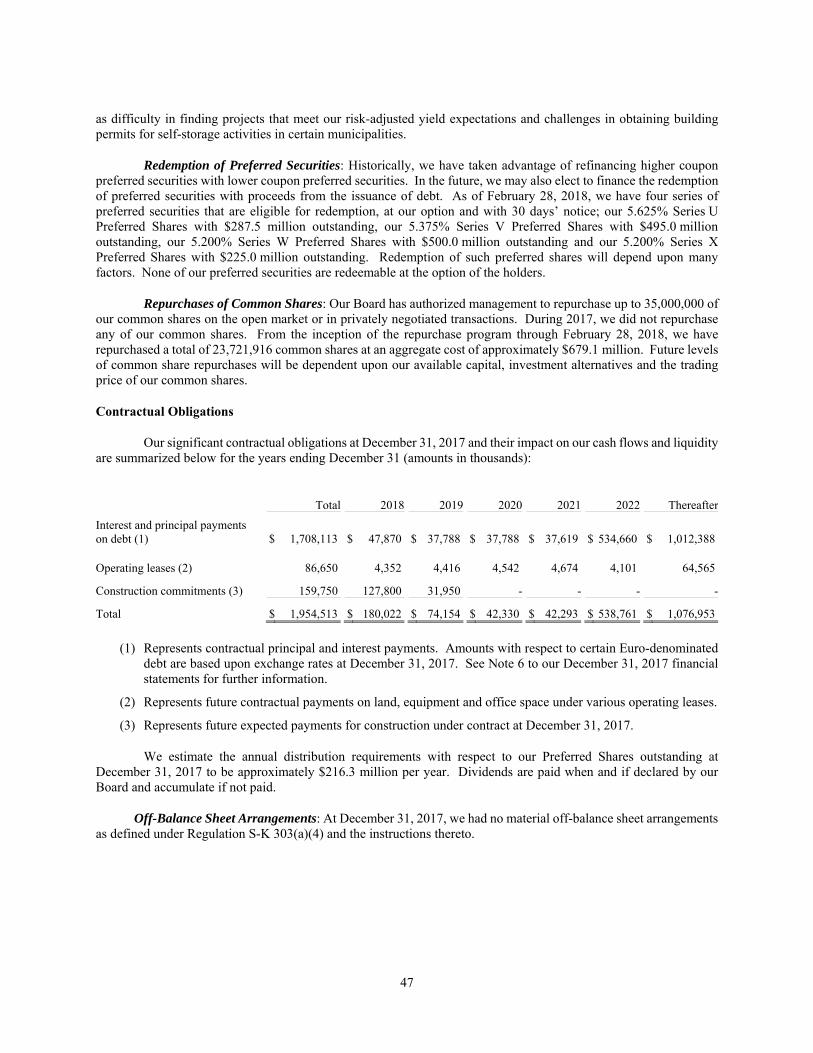
47
as difficulty in finding projects that meet our risk-adjusted yield expectations and challenges in obtaining building permits for self-storage activities in certain municipalities.
Redemption of Preferred Securities: Historically, we have taken advantage of refinancing higher coupon preferred securities with lower coupon preferred securities. In the future, we may also elect to finance the redemption of preferred securities with proceeds from the issuance of debt. As of February 28, 2018, we have four series of preferred securities that are eligible for redemption, at our option and with 30 days’ notice; our 5.625% Series U Preferred Shares with $287.5 million outstanding, our 5.375% Series V Preferred Shares with $495.0 million outstanding, our 5.200% Series W Preferred Shares with $500.0 million outstanding and our 5.200% Series X Preferred Shares with $225.0 million outstanding. Redemption of such preferred shares will depend upon many factors. None of our preferred securities are redeemable at the option of the holders.
Repurchases of Common Shares: Our Board has authorized management to repurchase up to 35,000,000 of our common shares on the open market or in privately negotiated transactions. During 2017, we did not repurchase any of our common shares. From the inception of the repurchase program through February 28, 2018, we have repurchased a total of 23,721,916 common shares at an aggregate cost of approximately $679.1 million. Future levels of common share repurchases will be dependent upon our available capital, investment alternatives and the trading price of our common shares.
Contractual Obligations
Our significant contractual obligations at December 31, 2017 and their impact on our cash flows and liquidity are summarized below for the years ending December 31 (amounts in thousands):
Total 2018 2019 2020 2021 2022 Thereafter
Interest and principal payments on debt (1) $ 1,708,113 $ 47,870 $ 37,788 $ 37,788 $ 37,619 $ 534,660 $ 1,012,388
Operating leases (2) 86,650 4,352 4,416 4,542 4,674 4,101 64,565
Construction commitments (3) 159,750 127,800 31,950 - - - -
Total $ 1,954,513 $ 180,022 $ 74,154 $ 42,330 $ 42,293 $ 538,761 $ 1,076,953
(1) Represents contractual principal and interest payments. Amounts with respect to certain Euro-denominated debt are based upon exchange rates at December 31, 2017. See Note 6 to our December 31, 2017 financial statements for further information.
(2) Represents future contractual payments on land, equipment and office space under various operating leases.
(3) Represents future expected payments for construction under contract at December 31, 2017.
We estimate the annual distribution requirements with respect to our Preferred Shares outstanding at December 31, 2017 to be approximately $216.3 million per year. Dividends are paid when and if declared by our Board and accumulate if not paid.
Off-Balance Sheet Arrangements: At December 31, 2017, we had no material off-balance sheet arrangements as defined under Regulation S-K 303(a)(4) and the instructions thereto.
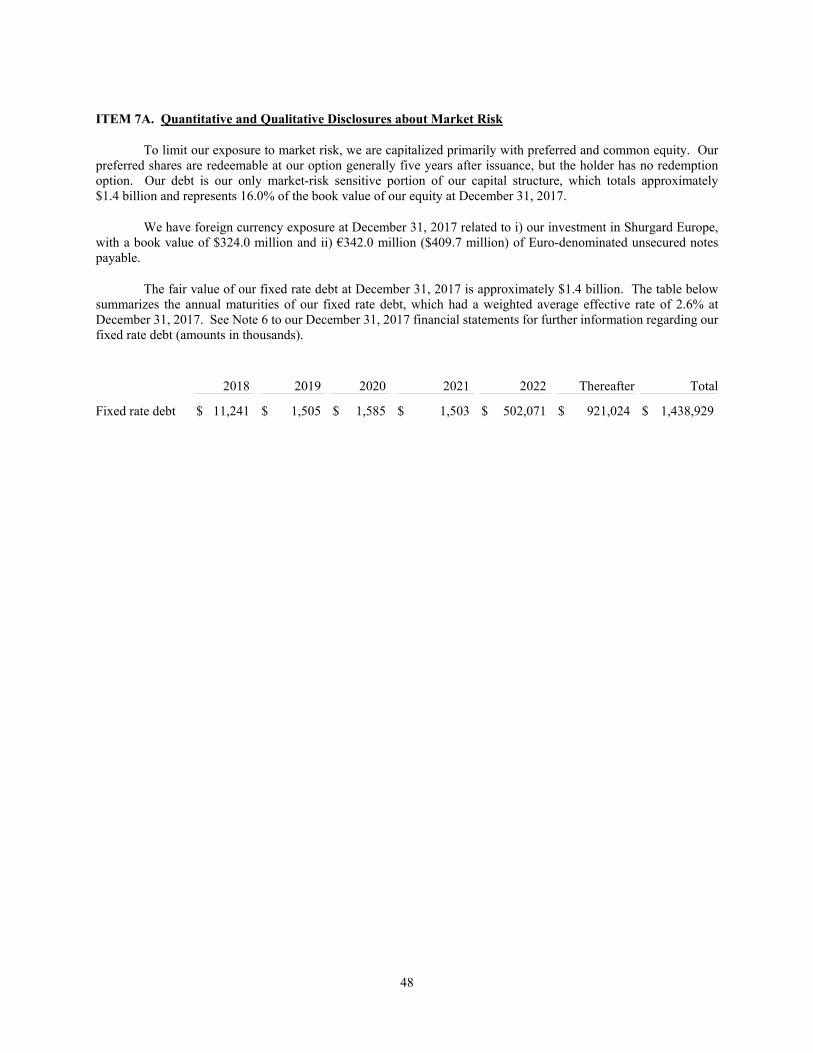
48
ITEM 7A. Quantitative and Qualitative Disclosures about Market Risk
To limit our exposure to market risk, we are capitalized primarily with preferred and common equity. Our preferred shares are redeemable at our option generally five years after issuance, but the holder has no redemption option. Our debt is our only market-risk sensitive portion of our capital structure, which totals approximately $1.4 billion and represents 16.0% of the book value of our equity at December 31, 2017.
We have foreign currency exposure at December 31, 2017 related to i) our investment in Shurgard Europe, with a book value of $324.0 million and ii) €342.0 million ($409.7 million) of Euro-denominated unsecured notes payable.
The fair value of our fixed rate debt at December 31, 2017 is approximately $1.4 billion. The table below summarizes the annual maturities of our fixed rate debt, which had a weighted average effective rate of 2.6% at December 31, 2017. See Note 6 to our December 31, 2017 financial statements for further information regarding our fixed rate debt (amounts in thousands).
2018 2019 2020 2021 2022 Thereafter Total
Fixed rate debt $ 11,241 $ 1,505 $ 1,585 $ 1,503 $ 502,071 $ 921,024 $ 1,438,929
49
ITEM 9A. Controls and Procedures
Conclusion Regarding the Effectiveness of Disclosure Controls and Procedures
We maintain disclosure controls and procedures that are designed to ensure that information required to be disclosed in reports we file and submit under the Securities Exchange Act of 1934, as amended (the “Exchange Act”) is recorded, processed, summarized and reported within the time periods specified in accordance with SEC guidelines and that such information is communicated to our management, including our Chief Executive Officer and Chief Financial Officer, to allow timely decisions regarding required disclosure based on the definition of "disclosure controls and procedures" in Rules 13a-15(e) and 15d-15(e) of the Exchange Act. In designing and evaluating the disclosure controls and procedures, management recognized that any controls and procedures, no matter how well designed and operated, can provide only reasonable assurance of achieving the desired control objectives and management necessarily was required to apply its judgment in evaluating the cost-benefit relationship of possible controls and procedures in reaching that level of reasonable assurance. We also have investments in certain unconsolidated real estate entities and because we do not control these entities, our disclosure controls and procedures with respect to such entities are substantially more limited than those we maintain with respect to our consolidated subsidiaries.
As of December 31, 2017, we carried out an evaluation, under the supervision and with the participation of management, including our Chief Executive Officer and Chief Financial Officer, of the effectiveness of the design and operation of our disclosure controls and procedures (as such term is defined in Rules 13a-15(e) and 15d-15(e) of the Exchange Act). Based on that evaluation, our Chief Executive Officer and Chief Financial Officer concluded that our disclosure controls and procedures were effective as of December 31, 2017, at a reasonable assurance level.
Management’s Report on Internal Control Over Financial Reporting
Our management is responsible for establishing and maintaining adequate internal control over financial reporting, as such term is defined in Rules 13a-15(f) and 15d-15(f) of the Exchange Act. Under the supervision and with the participation of our management, including our Chief Executive Officer and Chief Financial Officer, we conducted an evaluation of the effectiveness of our internal control over financial reporting based on the framework in Internal Control-Integrated Framework issued by the Committee on Sponsoring Organizations of the Treadway Commission (2013 Framework). Based on our evaluation under the framework in Internal Control-Integrated Framework, our management concluded that our internal control over financial reporting was effective as of December 31, 2017.
The effectiveness of internal control over financial reporting as of December 31, 2017, has been audited by Ernst & Young LLP, an independent registered public accounting firm. Ernst & Young LLP’s report on our internal control over financial reporting appears below.
Changes in Internal Control Over Financial Reporting
There have not been any changes in our internal control over financial reporting (as such term is defined in Rules 13a-15(f) and 15d-15(f) under the Exchange Act) during the fourth quarter of 2017 to which this report relates that have materially affected, or are reasonable likely to materially affect, our internal control over financial reporting.
50
Report of Independent Registered Public Accounting Firm To the Shareholders and Board of Trustees of Public Storage Opinion on Internal Control over Financial Reporting We have audited Public Storage’s internal control over financial reporting as of December 31, 2017, based on criteria established in Internal Control—Integrated Framework issued by the Committee of Sponsoring Organizations of the Treadway Commission (2013 framework) (the COSO criteria). In our opinion, Public Storage (the Company) maintained, in all material aspects, effective internal control over financial reporting as of December 31, 2017, based on the COSO criteria. We also have audited, in accordance with the standards of the Public Company Accounting Oversight Board (United States) (PCAOB), the consolidated balance sheets of Public Storage as of December 31, 2017 and 2016, and the related consolidated statements of income, comprehensive income, equity and cash flows, for each of the three years in the period ended December 31, 2017 and the related notes and financial statement schedule listed in the Index at Item 15(a) of the Company and our report dated February 28, 2018 expressed an unqualified opinion thereon. Basis for Opinion The Company’s management is responsible for maintaining effective internal control over financial reporting, and for its assessment of the effectiveness of internal control over financial reporting included in the accompanying Management’s Report on Internal Control Over Financial Reporting. Our responsibility is to express an opinion on the Company’s internal control over financial reporting based on our audit. We are a public accounting firm registered with the PCAOB and are required to be independent with respect to the Company in accordance with the U.S. federal securities laws and the applicable rules and regulations of the Security and Exchange Commission and the PCAOB. We conducted our audit in accordance with the standards of the PCAOB. Those standards require that we plan and perform the audit to obtain reasonable assurance about whether effective internal control over financial reporting was maintained in all material respects. Our audit included obtaining an understanding of internal control over financial reporting, assessing the risk that a material weakness exists, testing and evaluating the design and operating effectiveness of internal control based on the assessed risk, and performing such other procedures as we considered necessary in the circumstances. We believe that our audit provides a reasonable basis for our opinion. Definition and Limitations of Internal Control Over Financial Reporting A company’s internal control over financial reporting is a process designed to provide reasonable assurance regarding the reliability of financial reporting and the preparation of financial statements for external purposes in accordance with generally accepted accounting principles. A company’s internal control over financial reporting includes those policies and procedures that (1) pertain to the maintenance of records that, in reasonable detail, accurately and fairly reflect the transactions and dispositions of the assets of the company; (2) provide reasonable assurance that transactions are recorded as necessary to permit preparation of financial statements in accordance with generally accepted accounting principles, and that receipts and expenditures of the company are being made only in accordance with authorizations of management and directors of the company; and (3) provide reasonable assurance regarding prevention or timely detection of unauthorized acquisition, use, or disposition of the company’s assets that could have a material effect on the financial statements.

51
Because of its inherent limitations, internal control over financial reporting may not prevent or detect misstatements. Also, projections of any evaluation of effectiveness to future periods are subject to the risk that controls may become inadequate because of changes in conditions, or that the degree of compliance with the policies or procedures may deteriorate. /s/ Ernst & Young LLP Los Angeles, California February 28, 2018

52
ITEM 9B. Other Information
None.
53
PART III
ITEM 10. Trustees, Executive Officers and Corporate Governance
The following is a biographical summary of the current executive officers of the Company:
Ronald L. Havner, Jr., age 60, has been Chairman and Chief Executive Officer of Public Storage since August 2011 and November 2002, respectively. Mr. Havner joined Public Storage in 1986 and has held a variety of senior management positions. Mr. Havner has been Chairman of the Board of Public Storage’s affiliate, PS Business Parks, Inc. (“PSB”) since March 1998. As previously disclosed, effective January 1, 2019, Mr. Havner will step down from his position as CEO. He will remain Chairman of the Board.
John Reyes, age 57, has served as Senior Vice President and Chief Financial Officer of Public Storage since 1996, having joined the Company in 1990. Effective January 1, 2019, Mr. Reyes will step down as CFO and will join the Board as a trustee.
Joseph D. Russell, Jr., age 58, has been President of Public Storage since July 2016. Prior to joining Public Storage, Mr. Russell was Chief Executive Officer of PS Business Parks, Inc. from August 2003 to July 2016. Mr. Russell was President of PS Business Parks, Inc. from September 2003 until August 2015. Mr. Russell has also served as a director of PS Business Parks, Inc. since August 2003. Effective January 1, 2019, Mr. Russell will be appointed CEO and will join the Board as a trustee, in addition to his role as President.
Lily Y. Hughes, age 54, became Senior Vice President, Chief Legal Officer and Corporate Secretary in January 2015. Prior to joining Public Storage, Ms. Hughes was Vice President and Associate General Counsel-Corporate, M&A and Finance at Ingram Micro Inc., a Fortune 100 NYSE company with operations in 39 countries, which she joined in 1997.
Other information required by this item is hereby incorporated by reference to the material appearing in the Notice and Proxy Statement for the 2016 Annual Meeting of Shareholders, to be filed pursuant to Regulation 14A under the Exchange Act.
ITEM 11. Executive Compensation
The information required by this item is hereby incorporated by reference to the material appearing in the Notice and Proxy Statement for the 2018 Annual Meeting of Shareholders, to be filed pursuant to Regulation 14A under the Exchange Act.
54
ITEM 12. Security Ownership of Certain Beneficial Owners and Management and Related Shareholder Matters
The following table sets forth information as of December 31, 2017 on the Company’s equity compensation plans:
Number of securities to be
issued upon exercise of outstanding
options, warrants and
rights
Weighted average
exercise price of outstanding
options, warrants and
rights
Number of securities
remaining available for future issuance
under equity compensation plans
Equity compensation plans approved by security holders (a) .................. 3,208,046 (b) $192.12 (d) 1,556,829 Equity compensation plans not approved by security holders (c) ... - - -
a) The Company’s stock option and stock incentive plans are described more fully in Note 10 to the December 31, 2017 financial statements. All plans were approved by the Company’s shareholders.
b) Includes 799,129 restricted share units that, if and when vested, will be settled in common shares of the Company on a one for one basis.
c) There are no securities available for future issuance or currently outstanding under plans not approved by the Company’s shareholders as of December 31, 2017.
d) Represents the average exercise price of 2,408,917 stock options outstanding at December 31, 2017. We also have 799,129 restricted share units outstanding at December 31, 2017 that vest for no consideration.
Other information required by this item is hereby incorporated by reference to the material appearing in the Notice and Proxy Statement for the 2018 Annual Meeting of Shareholders, to be filed pursuant to Regulation 14A under the Exchange Act.
ITEM 13. Certain Relationships and Related Transactions and Trustee Independence
The information required by this item is hereby incorporated by reference to the material appearing in the Notice and Proxy Statement for the 2018 Annual Meeting of Shareholders, to be filed pursuant to Regulation 14A under the Exchange Act.
ITEM 14. Principal Accountant Fees and Services
The information required by this item is hereby incorporated by reference to the material appearing in the Notice and Proxy Statement for the 2018 Annual Meeting of Shareholders, to be filed pursuant to Regulation 14A under the Exchange Act of 1934.

55
PART IV
ITEM 15. Exhibits and Financial Statement Schedules
a. 1. Financial Statements
The financial statements listed in the accompanying Index to Financial Statements and Schedules hereof are filed as part of this report.
2. Financial Statement Schedules
The financial statements schedules listed in the accompanying Index to Financial Statements and Schedules are filed as part of this report.
3. Exhibits
See Index to Exhibits contained herein.
b. Exhibits:
See Index to Exhibits contained herein.
c. Financial Statement Schedules
Not applicable.

56
PUBLIC STORAGE
INDEX TO EXHIBITS (1)
(Items 15(a)(3) and 15(c))
3.1 Articles of Amendment and Restatement of Declaration of Trust of Public Storage, a Maryland real estate investment trust. Filed with the Registrant’s Annual Report on Form 10-K for the year ended December 31, 2009 and incorporated by reference herein.
3.2 Bylaws of Public Storage, a Maryland real estate investment trust. Filed with the Registrant’s Current
Report on Form 8-K dated May 6, 2010 and incorporated by reference herein. 3.3 Articles Supplementary for Public Storage 5.625% Cumulative Preferred Shares, Series U. Filed with
the Registrant’s Current Report on Form 8-K dated June 6, 2012 and incorporated by reference herein. 3.4 Articles Supplementary for Public Storage 5.375% Cumulative Preferred Shares, Series V. Filed with
the Registrant’s Current Report on Form 8-K dated September 11, 2012 and incorporated by reference herein.
3.5 Articles Supplementary for Public Storage 5.20% Cumulative Preferred Shares, Series W. Filed with the
Registrant’s Current Report on Form 8-K dated January 7, 2013 and incorporated by reference herein. 3.6 Articles Supplementary for Public Storage 5.20% Cumulative Preferred Shares, Series X. Filed with the
Registrant’s Current Report on Form 8-K dated March 4, 2013 and incorporated by reference herein. 3.7 Articles Supplementary for Public Storage 6.375% Cumulative Preferred Shares, Series Y. Filed with
the Registrant’s Current Report on Form 8-K dated March 10, 2014 and incorporated by reference herein. 3.8 Articles Supplementary for Public Storage 6.375% Cumulative Preferred Shares, Series Y. Filed with
the Registrant’s Current Report on Form 8-K dated April 9, 2014 and incorporated by reference herein. 3.9 Articles Supplementary for Public Storage 6.00% Cumulative Preferred Shares, Series Z. Filed with the
Registrant’s Current Report on Form 8-K dated May 28, 2014 and incorporated by reference herein. 3.10 Articles Supplementary for Public Storage 5.875% Cumulative Preferred Shares, Series A. Filed with
the Registrant’s Current Report on Form 8-K/A dated November 24, 2014 and incorporated by reference herein.
3.11 Articles Supplementary for Public Storage 5.400% Cumulative Preferred Shares, Series B. Filed with
the Registrant’s Current Report on Form 8-K dated January 12, 2016 and incorporated by reference herein.
3.12 Articles Supplementary for Public Storage 5.125% Cumulative Preferred Shares, Series C. Filed with
the Registrant’s Current Report on Form 8-K dated May 10, 2016 and incorporated by reference herein. 3.13 Articles Supplementary for Public Storage 4.950% Cumulative Preferred Shares, Series D. Filed with
the Registrant’s Current Report on Form 8-K dated July 13, 2016 and incorporated by reference herein.

57
3.14 Articles Supplementary for Public Storage 4.900% Cumulative Preferred Shares, Series E. Filed with the Registrant’s Current Report on Form 8-K dated October 6, 2016 and incorporated by reference herein.
3.15 Articles Supplementary for Public Storage 5.150% Cumulative Preferred Shares, Series F. Filed with
the Registrant’s Current Report on Form 8-K dated May 23, 2017 and incorporated by reference herein. 3.16 Articles Supplementary for Public Storage 5.05% Cumulative Preferred Shares, Series G. Filed with the
Registrant’s Current Report on Form 8-K dated July 31, 2017 and incorporated by reference herein. 4.1 Master Deposit Agreement, dated as of May 31, 2007. Filed with the Registrant’s Current Report on
Form 8-K dated June 6, 2007 and incorporated by reference herein. 10.1 Amended Management Agreement between Registrant and Public Storage Commercial Properties
Group, Inc. dated as of February 21, 1995. Filed with Public Storage Inc.’s (“PSI”) Annual Report on Form 10-K for the year ended December 31, 1994 (SEC File No. 001-0839) and incorporated herein by reference.
10.2 Second Amended and Restated Management Agreement by and among Registrant and the entities listed
therein dated as of November 16, 1995. Filed with PS Partners, Ltd.’s Annual Report on Form 10-K for the year ended December 31, 1996 (SEC File No. 001-11186) and incorporated herein by reference.
10.3 Agreement of Limited Partnership of PS Business Parks, L.P. Filed with PS Business Parks, Inc.’s
Quarterly Report on Form 10-Q for the quarterly period ended June 30, 1998 (SEC File No. 001-10709) and incorporated herein by reference.
10.4 Amended and Restated Agreement of Limited Partnership of Storage Trust Properties, L.P. (March 12,
1999). Filed with PSI’s Quarterly Report on Form 10-Q for the quarterly period ended June 30, 1999 (SEC File No. 001-0839) and incorporated herein by reference.
10.5 Amended and Restated Credit Agreement by and among Registrant, Wells Fargo Securities, LLC and
Merrill Lynch, Pierce, Fenner & Smith Incorporated as joint lead arrangers, Wells Fargo Bank, National Association, as administrative agent, and the other financial institutions party thereto, dated as of March 21, 2012. Filed with PSI’s Current Report on Form 8-K on March 27, 2012 (SEC File No. 001-0839) and incorporated herein by reference.
10.5.1 Second Amendment to Amended and Restated Credit Agreement, dated as of July 17, 2013, by and
among Public Storage, the Lenders party thereto and Wells Fargo Bank, National Association. Filed with the Registrant’s Current Report on Form 8-K on July 18, 2013 and incorporated herein by reference.
10.5.2 Third Amendment to the Amended and Restated Credit Agreement, dated as of March 31, 2015, among
Public Storage, the lenders party thereto and Wells Fargo Bank, National Association, as agent. Filed as Exhibit 10.1 to the Company’s Current Report on Form 8-K on April 2, 2015 (“April 2015 8-K”) and incorporated herein by reference.
10.5.3 Copy of the Amended and Restated Credit Agreement dated as of March 21, 2012, consolidating all
amendments made by the Letter Agreement, dated as of April 12, 2012, the Second Amendment to Amended and Restated Credit Agreement, dated as of July 17, 2013, and the Third Amendment to Amended and Restated Credit Agreement, dated as of March 31, 2015. This conformed copy was filed as Exhibit 10.2 to the April 2015 8-K for ease of reference and was qualified in its entirety by reference to the Third Amendment and incorporated herein by reference.
10.5.4 Fourth Amendment to the Amended and Restated Credit Agreement, dated as of December 22, 2015,
among Public Storage, the lenders party thereto and Wells Fargo Bank, National Association, as agent. Filed as Exhibit 10.5.4 to the Company’s Annual Report on Form 10-K for the year ended December 31, 2015 and incorporated herein by reference.
58
10.6* Shurgard Storage Centers, Inc. 2004 Long Term Incentive Compensation Plan. Filed as Appendix A of
Definitive Proxy Statement dated June 7, 2004 filed by Shurgard (SEC File No. 001-11455) and incorporated herein by reference.
10.7* Public Storage, Inc. 2001 Stock Option and Incentive Plan (the “2001 Plan”). Filed with PSI’s
Registration Statement on Form S-8 (SEC File No. 333-59218) and incorporated herein by reference. 10.8* Form of 2001 Plan Non-qualified Stock Option Agreement. Filed with PSI’s Quarterly Report on
Form 10-Q for the quarterly period ended September 30, 2004 (SEC File No. 001-0839) and incorporated herein by reference.
10.9* Form of 2001 Plan Restricted Share Unit Agreement. Filed with PSI’s Quarterly Report on Form 10-Q
for the quarterly period ended September 30, 2004 (SEC File No. 001-0839) and incorporated herein by reference.
10.10* Form of 2001 Plan Non-Qualified Outside Director Stock Option Agreement. Filed with PSI’s Quarterly
Report on Form 10-Q for the quarterly period ended September 30, 2004 (SEC File No. 001-0839) and incorporated herein by reference.
10.11* Form of 2007 Plan Restricted Stock Unit Agreement. Filed as Exhibit 10.11 to the Company’s Annual
Report on Form 10-K for the year ended December 31, 2015 and incorporated herein by reference. 10.12* Form of 2007 Plan Restricted Stock Unit Agreement – deferral of receipt of shares. Filed as
Exhibit 10.12 to the Company’s Annual Report on Form 10-K for the year ended December 31, 2015 and incorporated herein by reference.
10.13* Form of 2007 Plan Stock Option Agreement. Filed as Exhibit 10.13 to the Company’s Annual Report
on Form 10-K for the year ended December 31, 2015 and incorporated herein by reference. 10.14* Form of 2007 Plan Trustee Stock Option Agreement. Filed as Exhibit 10.14 to the Company’s Annual
Report on Form 10-K for the year ended December 31, 2015 and incorporated herein by reference. 10.15* Form of 2016 Plan Restricted Stock Unit Agreement. Filed as Exhibit 10.15 to the Company’s Annual
Report on Form 10-K for the year ended December 31, 2016 and incorporated herein by reference. 10.16* Form of 2016 Plan Restricted Stock Unit Agreement – deferral of receipt of shares. Filed as Exhibit
10.16 to the Company’s Annual Report on Form 10-K for the year ended December 31, 2016 and incorporated herein by reference.
10.17* Form of 2016 Plan Non-Qualified Stock Option Agreement. Filed as Exhibit 10.17 to the Company’s
Annual Report on Form 10-K for the year ended December 31, 2016 and incorporated herein by reference.
10.18* Form of 2016 Plan Trustee Non-Qualified Stock Option Agreement. Filed as Exhibit 10.18 to the
Company’s Annual Report on Form 10-K for the year ended December 31, 2016 and incorporated herein by reference.
10.19 Form of Trustee and Officer Indemnification Agreement. Filed as Exhibit 10.19 to the Company’s
Annual Report on Form 10-K for the year ended December 31, 2016 and incorporated herein by reference.

59
10.20 Term Loan Agreement, by and among Public Storage, Wells Fargo Securities, LLC as Lead Arranger and Wells Fargo National Bank N.A. as Administrative Agent, dated as of December 2, 2013. Filed with Registrant’s Current Report on Form 8-K dated December 2, 2013 and incorporated herein by reference.
10.21* Public Storage 2007 Equity and Performance-Based Incentive Compensation Plan, as Amended. Filed
with Registrant’s Current Report on Form 8-K dated May 1, 2014 and incorporated herein by reference. 10.22* Public Storage 2016 Equity and Performance-Based Incentive Compensation Plan. Filed as Appendix
A to the Company’s 2016 Proxy Statement dated March 16, 2016 and incorporated herein by reference. 10.23 Note Purchase Agreement, dated as of November 3, 2015, by and among Public Storage and the
signatories thereto. Filed with Registrant’s Current Report on Form 8-K dated November 3, 2015 and incorporated herein by reference.
10.24 Note Purchase Agreement, dated as of April 12, 2016, by and among Public Storage and the signatories
thereto. Filed with Registrant’s Current Report on Form 8-K dated April 12, 2016 and incorporated herein by reference.
10.25 Indenture, dated as of September 18, 2017, between Public Storage and Wells Fargo Bank, National
Association, as trustee (filed as Exhibit 4.1 to the Company’s Current Report on Form 8-K filed on September 18, 2017 and incorporated herein by reference).
10.26 First Supplemental Indenture, dated as of September 18, 2017, between Public Storage and Wells Fargo
Bank, National Association, as trustee, including the form of Global Note representing the 2022 Notes and the form of Global Note representing the 2027 Notes (filed as Exhibit 4.2 to the Company’s Current Report on Form 8-K filed on September 18, 2017 and incorporated herein by reference).
12 Statement Re: Computation of Ratio of Earnings to Fixed Charges and Ratio of Earnings to Combined
Fixed Charges and Preferred Share Income Allocations. Filed herewith. 21 Listing of Subsidiaries. Filed herewith.
23.1 Consent of Ernst & Young LLP. Filed herewith.
31.1 Rule 13a – 14(a) Certification. Filed herewith.
31.2 Rule 13a – 14(a) Certification. Filed herewith.
32 Section 1350 Certifications. Filed herewith.
101 .INS XBRL Instance Document. Filed herewith.
101 .SCH XBRL Taxonomy Extension Schema. Filed herewith.
101 .CAL XBRL Taxonomy Extension Calculation Linkbase. Filed herewith.
101 .DEF XBRL Taxonomy Extension Definition Linkbase. Filed herewith.
101 .LAB XBRL Taxonomy Extension Label Linkbase. Filed herewith.
101 .PRE XBRL Taxonomy Extension Presentation Link. Filed herewith.
_ (1) SEC File No. 001-33519 unless otherwise indicated.
* Denotes management compensatory plan agreement or arrangement.
60
SIGNATURES
Pursuant to the requirements of Section 13 or 15(d) of the Securities Exchange Act of 1934, as amended, the Registrant has duly caused this report to be signed on its behalf by the undersigned, thereunto duly authorized.
4
PUBLIC STORAGE Date: February 28, 2018 By: /s/ Ronald L. Havner, Jr. Ronald L. Havner, Jr., Chairman and
Chief Executive Officer
Pursuant to the requirements of Section 13 or 15(d) of the Securities Exchange Act of 1934, this report has been signed below by the following persons on behalf of the Registrant and in the capacities and on the dates indicated.
Signature Title Date
/s/ Ronald L. Havner, Jr. Chairman, Chief Executive Officer and Trustee (principal executive officer)
February 28, 2018
Ronald L. Havner, Jr.
/s/ John Reyes Senior Vice President and Chief Financial Officer February 28, 2018
John Reyes (principal financial officer and principal accounting officer)
/s/ Tamara Hughes Gustavson
Trustee February 28, 2018
Tamara Hughes Gustavson
/s/ Uri P. Harkham Trustee February 28, 2018
Uri P. Harkham
/s/ Leslie Stone Heisz Trustee February 28, 2018Leslie Stone Heisz
/s/ B. Wayne Hughes, Jr. Trustee February 28, 2018
B. Wayne Hughes, Jr.
/s/ Avedick B. Poladian Trustee February 28, 2018
Avedick B. Poladian /s/ Gary E. Pruitt Trustee February 28, 2018
Gary E. Pruitt
/s/ Ronald P. Spogli Trustee February 28, 2018
Ronald P. Spogli
/s/ Daniel C. Staton Trustee February 28, 2018 Daniel C. Staton

61
PUBLIC STORAGE INDEX TO FINANCIAL STATEMENTS
AND SCHEDULES
(Item 15 (a))
Page References
Report of Independent Registered Public Accounting Firm ............................................................. F-1 Balance sheets as of December 31, 2017 and 2016 .......................................................................... F-2 For the years ended December 31, 2017, 2016 and 2015: Statements of income ....................................................................................................................... F-3 Statements of comprehensive income .............................................................................................. F-4 Statements of equity ........................................................................................................................ F-5 – F-6 Statements of cash flows .................................................................................................................. F-7 – F-8 Notes to financial statements ............................................................................................................ F-9 – F-32 Schedule: III – Real estate and accumulated depreciation ................................................................................ F-33 – F-35
All other schedules have been omitted since the required information is not present or not present in amounts sufficient to require submission of the schedule, or because the information required is included in the financial statements or notes thereto.

F-1
Report of Independent Registered Public Accounting Firm
To the Shareholders and Board of Trustees of Public Storage
Opinion on the Financial Statements
We have audited the accompanying consolidated balance sheets of Public Storage (the Company) as of December 31, 2017 and 2016, and the related consolidated statements of income, comprehensive income, equity and cash flows for each of the three years in the period ended December 31, 2017, and the related notes and financial statement schedule listed in the Index at Item 15(a) (collectively referred to as the “consolidated financial statements”). In our opinion, the consolidated financial statements referred to above present fairly, in all material respects, the consolidated financial position of the Company at December 31, 2017 and 2016, and the consolidated results of its operations and its cash flows for each of the three years in the period ended December 31, 2017, in conformity with U.S. generally accepted accounting principles.
We also have audited, in accordance with the standards of the Public Company Accounting Oversight Board (United States) (PCAOB), the Company’s internal control over financial reporting as of December 31, 2017, based on criteria established in Internal Control-Integrated Framework issued by the Committee of Sponsoring Organizations of the Treadway Commission (2013 framework), and our report dated February 28, 2018 expressed an unqualified opinion thereon.
Basis for Opinion
These financial statements are the responsibility of the Company's management. Our responsibility is to express an opinion on the Company’s financial statements based on our audits. We are a public accounting firm registered with the PCAOB and are required to be independent with respect to the Company in accordance with the U.S. federal securities laws and the applicable rules and regulations of the Security and Exchange Commission and the PCAOB. We conducted our audits in accordance with the standards of the PCAOB. Those standards require that we plan and perform the audit to obtain reasonable assurance about whether the financial statements are free of material misstatement, whether due to error or fraud. Our audits included performing procedures to assess the risks of material misstatement of the financial statements, whether due to error or fraud, and performing procedures that respond to those risks. Such procedures include examining, on a test basis, evidence regarding the amounts and disclosures in the financial statements. Our audits also included evaluating the accounting principles used and significant estimates made by management, as well as evaluating the overall presentation of the financial statements. We believe that our audits provide a reasonable basis for our opinion.
/s/ Ernst & Young LLP We have served as the Company’s auditor since 1980. Los Angeles, California February 28, 2018
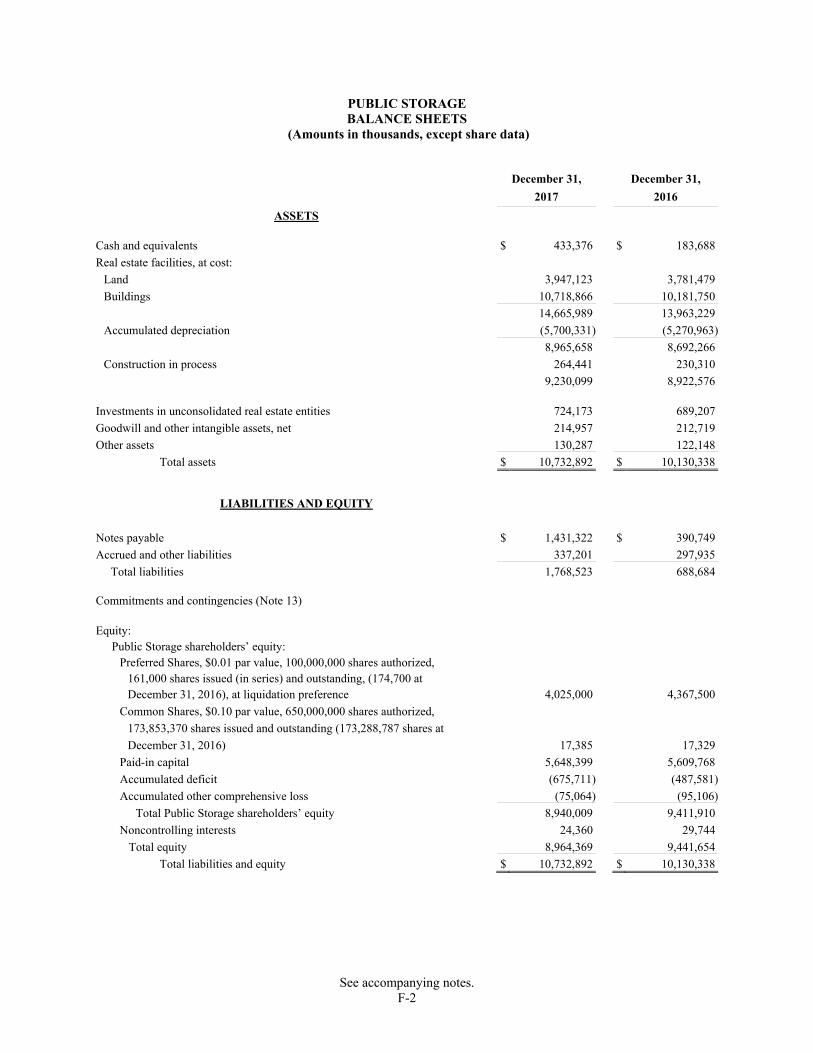
PUBLIC STORAGE BALANCE SHEETS
(Amounts in thousands, except share data)
See accompanying notes. F-2
December 31, December 31,
2017 2016
ASSETS Cash and equivalents $ 433,376 $ 183,688
Real estate facilities, at cost:
Land 3,947,123 3,781,479
Buildings 10,718,866 10,181,750
14,665,989 13,963,229
Accumulated depreciation (5,700,331) (5,270,963)
8,965,658 8,692,266
Construction in process 264,441 230,310
9,230,099 8,922,576 Investments in unconsolidated real estate entities 724,173 689,207
Goodwill and other intangible assets, net 214,957 212,719
Other assets 130,287 122,148
Total assets $ 10,732,892 $ 10,130,338
LIABILITIES AND EQUITY
Notes payable $ 1,431,322 $ 390,749
Accrued and other liabilities 337,201 297,935
Total liabilities 1,768,523 688,684 Commitments and contingencies (Note 13) Equity:
Public Storage shareholders’ equity: Preferred Shares, $0.01 par value, 100,000,000 shares authorized,
161,000 shares issued (in series) and outstanding, (174,700 at December 31, 2016), at liquidation preference 4,025,000 4,367,500
Common Shares, $0.10 par value, 650,000,000 shares authorized,
173,853,370 shares issued and outstanding (173,288,787 shares at
December 31, 2016) 17,385 17,329
Paid-in capital 5,648,399 5,609,768
Accumulated deficit (675,711) (487,581)
Accumulated other comprehensive loss (75,064) (95,106)
Total Public Storage shareholders’ equity 8,940,009 9,411,910
Noncontrolling interests 24,360 29,744
Total equity 8,964,369 9,441,654
Total liabilities and equity $ 10,732,892 $ 10,130,338

PUBLIC STORAGE STATEMENTS OF INCOME
(Amounts in thousands, except per share amounts)
See accompanying notes. F-3
For the Years Ended December 31, 2017 2016 2015
Revenues:
Self-storage facilities $ 2,512,433 $ 2,405,828 $ 2,235,525 Ancillary operations 156,095 154,721 146,171
2,668,528 2,560,549 2,381,696 Expenses:
Self-storage cost of operations 657,633 617,905 586,696 Ancillary cost of operations 50,345 51,178 48,806 Depreciation and amortization 454,526 433,314 426,008 General and administrative 82,882 83,656 88,177
1,245,386 1,186,053 1,149,687 Operating income 1,423,142 1,374,496 1,232,009 Interest and other income 18,771 15,138 16,544 Interest expense (12,690) (4,210) (610)
Equity in earnings of unconsolidated real estate entities 75,655 56,756 50,937 Foreign currency exchange (loss) gain (50,045) 17,570 306 Casualty loss (7,789) - -
Gain on real estate investment sales 1,421 689 18,503 Net income 1,448,465 1,460,439 1,317,689
Allocation to noncontrolling interests (6,248) (6,863) (6,445)Net income allocable to Public Storage shareholders 1,442,217 1,453,576 1,311,244 Allocation of net income to:
Preferred shareholders - distributions (236,535) (238,214) (245,097)Preferred shareholders - redemptions (Note 8) (29,330) (26,873) (8,897)Restricted share units (4,743) (4,610) (4,200)
Net income allocable to common shareholders $ 1,171,609 $ 1,183,879 $ 1,053,050
Net income per common share:
Basic $ 6.75 $ 6.84 $ 6.10
Diluted $ 6.73 $ 6.81 $ 6.07
Basic weighted average common shares outstanding 173,613 173,091 172,699
Diluted weighted average common shares outstanding 174,151 173,878 173,510

PUBLIC STORAGE STATEMENTS OF COMPREHENSIVE INCOME
(Amounts in thousands)
See accompanying notes. F-4
For the Years Ended December 31, 2017 2016 2015
Net income $ 1,448,465 $ 1,460,439 $ 1,317,689 Other comprehensive income (loss):
Aggregate foreign currency exchange loss (30,003) (8,047) (20,086)Adjust for aggregate foreign currency exchange
gain in equity in earnings of unconsolidated real estate entities - (941) -
Adjust for aggregate foreign currency exchange
loss (gain) included in net income 50,045 (17,570) (306)Other comprehensive income (loss) 20,042 (26,558) (20,392)
Total comprehensive income 1,468,507 1,433,881 1,297,297 Allocation to noncontrolling interests (6,248) (6,863) (6,445)
Comprehensive income allocable to Public Storage shareholders $ 1,462,259 $ 1,427,018 $ 1,290,852
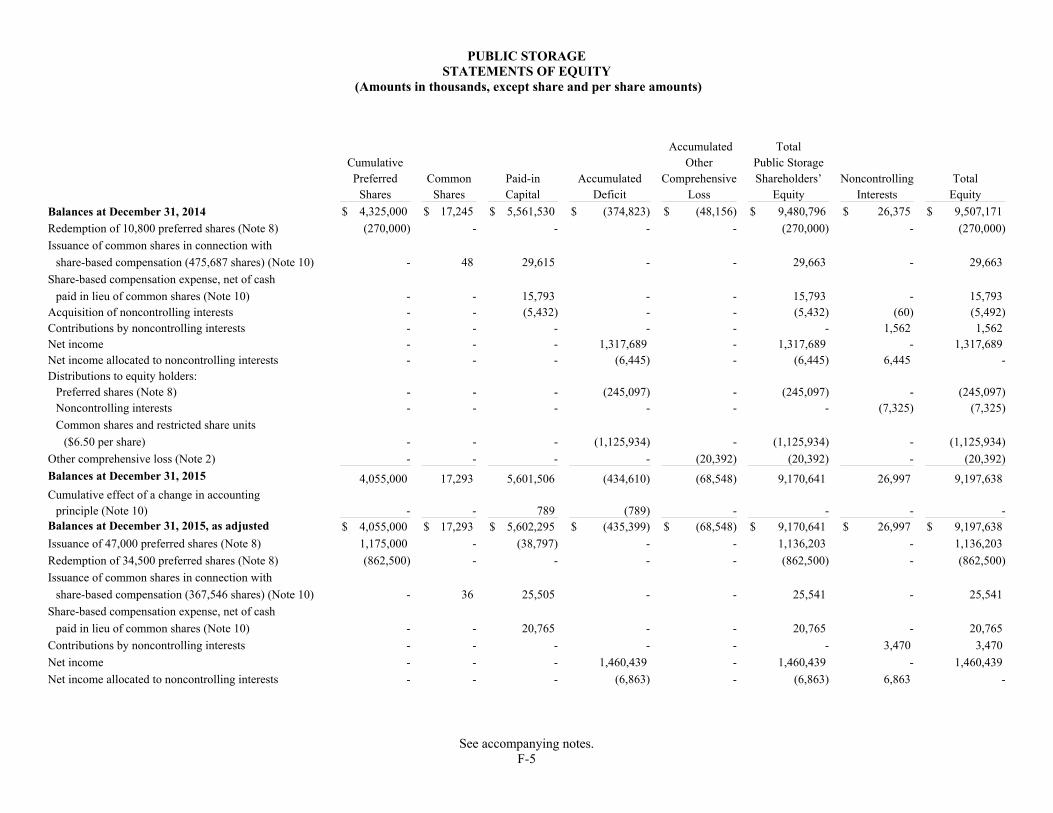
PUBLIC STORAGE STATEMENTS OF EQUITY
(Amounts in thousands, except share and per share amounts)
See accompanying notes. F-5
Accumulated Total Cumulative Other Public Storage Preferred Common Paid-in Accumulated Comprehensive Shareholders’ Noncontrolling Total Shares Shares Capital Deficit Loss Equity Interests Equity
Balances at December 31, 2014 $ 4,325,000 $ 17,245 $ 5,561,530 $ (374,823) $ (48,156) $ 9,480,796 $ 26,375 $ 9,507,171
Redemption of 10,800 preferred shares (Note 8) (270,000) - - - - (270,000) - (270,000)
Issuance of common shares in connection with
share-based compensation (475,687 shares) (Note 10) - 48 29,615 - - 29,663 - 29,663
Share-based compensation expense, net of cash
paid in lieu of common shares (Note 10) - - 15,793 - - 15,793 - 15,793 Acquisition of noncontrolling interests - - (5,432) - - (5,432) (60) (5,492)Contributions by noncontrolling interests - - - - - - 1,562 1,562 Net income - - - 1,317,689 - 1,317,689 - 1,317,689 Net income allocated to noncontrolling interests - - - (6,445) - (6,445) 6,445 -Distributions to equity holders:
Preferred shares (Note 8) - - - (245,097) - (245,097) - (245,097)Noncontrolling interests - - - - - - (7,325) (7,325)
Common shares and restricted share units
($6.50 per share) - - - (1,125,934) - (1,125,934) - (1,125,934)
Other comprehensive loss (Note 2) - - - - (20,392) (20,392) - (20,392)
Balances at December 31, 2015 4,055,000 17,293 5,601,506 (434,610) (68,548) 9,170,641 26,997 9,197,638 Cumulative effect of a change in accounting
principle (Note 10) - - 789 (789) - - - -Balances at December 31, 2015, as adjusted $ 4,055,000 $ 17,293 $ 5,602,295 $ (435,399) $ (68,548) $ 9,170,641 $ 26,997 $ 9,197,638
Issuance of 47,000 preferred shares (Note 8) 1,175,000 - (38,797) - - 1,136,203 - 1,136,203
Redemption of 34,500 preferred shares (Note 8) (862,500) - - - - (862,500) - (862,500)
Issuance of common shares in connection with
share-based compensation (367,546 shares) (Note 10) - 36 25,505 - - 25,541 - 25,541
Share-based compensation expense, net of cash
paid in lieu of common shares (Note 10) - - 20,765 - - 20,765 - 20,765
Contributions by noncontrolling interests - - - - - - 3,470 3,470
Net income - - - 1,460,439 - 1,460,439 - 1,460,439
Net income allocated to noncontrolling interests - - - (6,863) - (6,863) 6,863 -
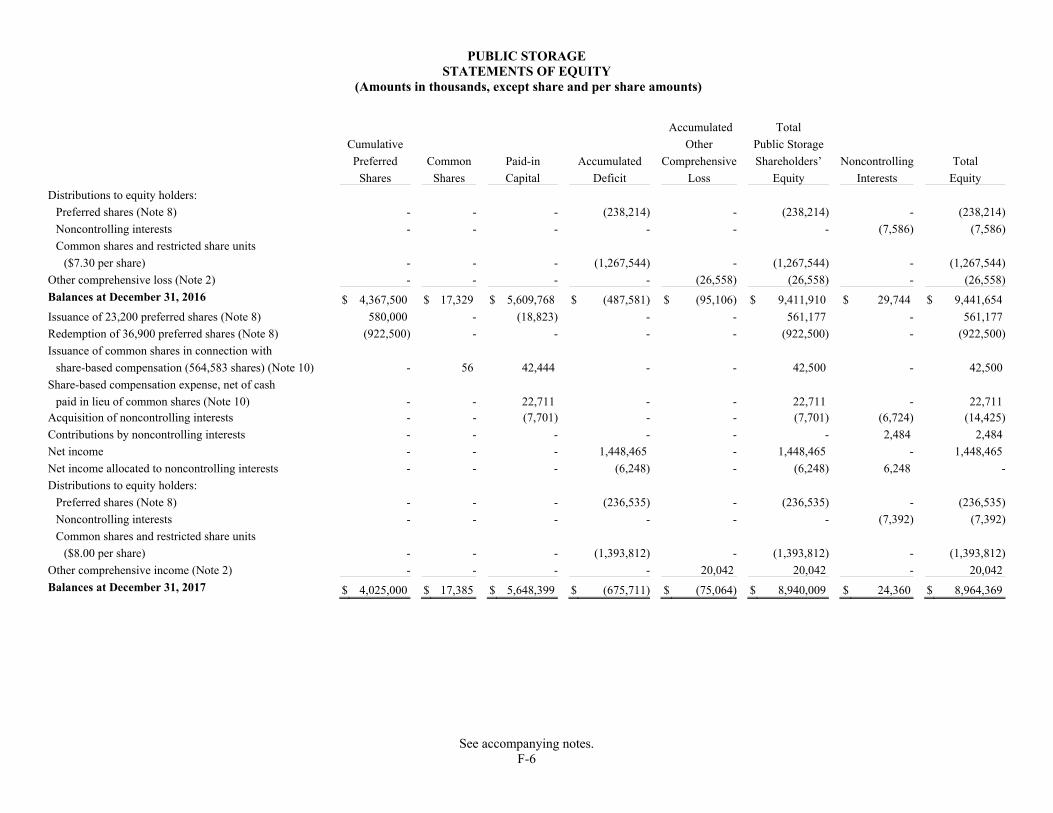
PUBLIC STORAGE STATEMENTS OF EQUITY
(Amounts in thousands, except share and per share amounts)
See accompanying notes. F-6
Accumulated Total
Cumulative Other Public Storage
Preferred Common Paid-in Accumulated Comprehensive Shareholders’ Noncontrolling Total
Shares Shares Capital Deficit Loss Equity Interests Equity
Distributions to equity holders:
Preferred shares (Note 8) - - - (238,214) - (238,214) - (238,214)
Noncontrolling interests - - - - - - (7,586) (7,586)
Common shares and restricted share units
($7.30 per share) - - - (1,267,544) - (1,267,544) - (1,267,544)
Other comprehensive loss (Note 2) - - - - (26,558) (26,558) - (26,558)
Balances at December 31, 2016 $ 4,367,500 $ 17,329 $ 5,609,768 $ (487,581) $ (95,106) $ 9,411,910 $ 29,744 $ 9,441,654
Issuance of 23,200 preferred shares (Note 8) 580,000 - (18,823) - - 561,177 - 561,177
Redemption of 36,900 preferred shares (Note 8) (922,500) - - - - (922,500) - (922,500)
Issuance of common shares in connection with
share-based compensation (564,583 shares) (Note 10) - 56 42,444 - - 42,500 - 42,500
Share-based compensation expense, net of cash
paid in lieu of common shares (Note 10) - - 22,711 - - 22,711 - 22,711 Acquisition of noncontrolling interests - - (7,701) - - (7,701) (6,724) (14,425)
Contributions by noncontrolling interests - - - - - - 2,484 2,484
Net income - - - 1,448,465 - 1,448,465 - 1,448,465
Net income allocated to noncontrolling interests - - - (6,248) - (6,248) 6,248 -
Distributions to equity holders:
Preferred shares (Note 8) - - - (236,535) - (236,535) - (236,535)
Noncontrolling interests - - - - - - (7,392) (7,392)
Common shares and restricted share units
($8.00 per share) - - - (1,393,812) - (1,393,812) - (1,393,812)
Other comprehensive income (Note 2) - - - - 20,042 20,042 - 20,042
Balances at December 31, 2017 $ 4,025,000 $ 17,385 $ 5,648,399 $ (675,711) $ (75,064) $ 8,940,009 $ 24,360 $ 8,964,369

PUBLIC STORAGE STATEMENTS OF CASH FLOWS
(Amounts in thousands)
See accompanying notes. F-7
For the Years Ended December 31,
2017 2016 2015
Cash flows from operating activities:
Net income $ 1,448,465 $ 1,460,439 $ 1,317,689
Adjustments to reconcile net income to net cash provided
by operating activities:
Gain on real estate investment sales (1,421) (689) (18,503)
Assets damaged due to hurricanes 3,286 - -
Depreciation and amortization 454,526 433,314 426,008
Equity in earnings of unconsolidated real estate entities (75,655) (56,756) (50,937)
Distributions from retained earnings of unconsolidated real estate entities 53,749 84,397 35,695
Foreign currency exchange loss (gain) 50,045 (17,570) (306)
Share-based compensation expense 37,548 37,483 32,570
Other 5,136 4,718 6,063
Total adjustments 527,214 484,897 430,590
Net cash provided by operating activities 1,975,679 1,945,336 1,748,279
Cash flows from investing activities:
Capital expenditures to maintain real estate facilities (122,199) (81,435) (65,594)
Construction in process (338,479) (269,916) (228,478)
Acquisition of real estate facilities and intangible assets (285,279) (416,178) (177,076)
Distributions in excess of retained earnings from
unconsolidated real estate entities - 67,420 -
Proceeds from sale of real estate investments 6,103 998 15,013
Net cash used in investing activities (739,854) (699,111) (456,135)
Cash flows from financing activities:
Repayments on notes payable (1,701) (36,459) (17,237)
Issuance of notes payable 992,077 113,620 264,255
Issuance of preferred shares 561,177 1,136,203 -
Issuance of common shares 42,500 25,541 29,663
Redemption of preferred shares (922,500) (862,500) (270,000)
Cash paid upon vesting of restricted share units (14,092) (15,357) (15,678)
Acquisition of noncontrolling interests (14,425) - (5,492)
Contributions by noncontrolling interests 2,484 3,470 1,562
Distributions paid to Public Storage shareholders (1,630,347) (1,505,758) (1,371,031)
Distributions paid to noncontrolling interests (7,392) (7,586) (7,325)
Net cash used in financing activities (992,219) (1,148,826) (1,391,283)
Net increase (decrease) in cash, equivalents, and restricted cash 243,606 97,399 (99,139)
Net effect of foreign exchange translation (126) (381) (318)
Cash, equivalents, and restricted cash at beginning of the period 212,573 115,555 215,012
Cash, equivalents, and restricted cash at end of the period $ 456,053 $ 212,573 $ 115,555

PUBLIC STORAGE STATEMENTS OF CASH FLOWS
(Amounts in thousands)
See accompanying notes. F-8
For the Years Ended December 31, 2017 2016 2015
Supplemental schedule of non-cash investing and
financing activities:
Foreign currency translation adjustment:
Real estate facilities, net of accumulated depreciation $ (659) $ 1,317 $ 500
Investments in unconsolidated real estate entities (19,370) 24,099 19,583
Notes payable 49,906 (17,750) (315)
Accumulated other comprehensive loss (30,003) (8,047) (20,086)
Reclassification of existing investment to real estate in connection with property acquisition (Note 3):
Real estate facilities (6,310) - -Investments in unconsolidated real estate entities 6,310 - -
Real estate acquired in exchange for assumption of notes payable - (12,945) (8,311)
Notes payable assumed in connection with acquisition of real estate - 12,945 8,311
Accrued development costs and capital expenditures:
Capital expenditures to maintain real estate facilities (2,581) (4,612) 2,525
Construction in process (11,233) (18,238) (9,623)
Accrued and other liabilities 13,814 22,850 7,098
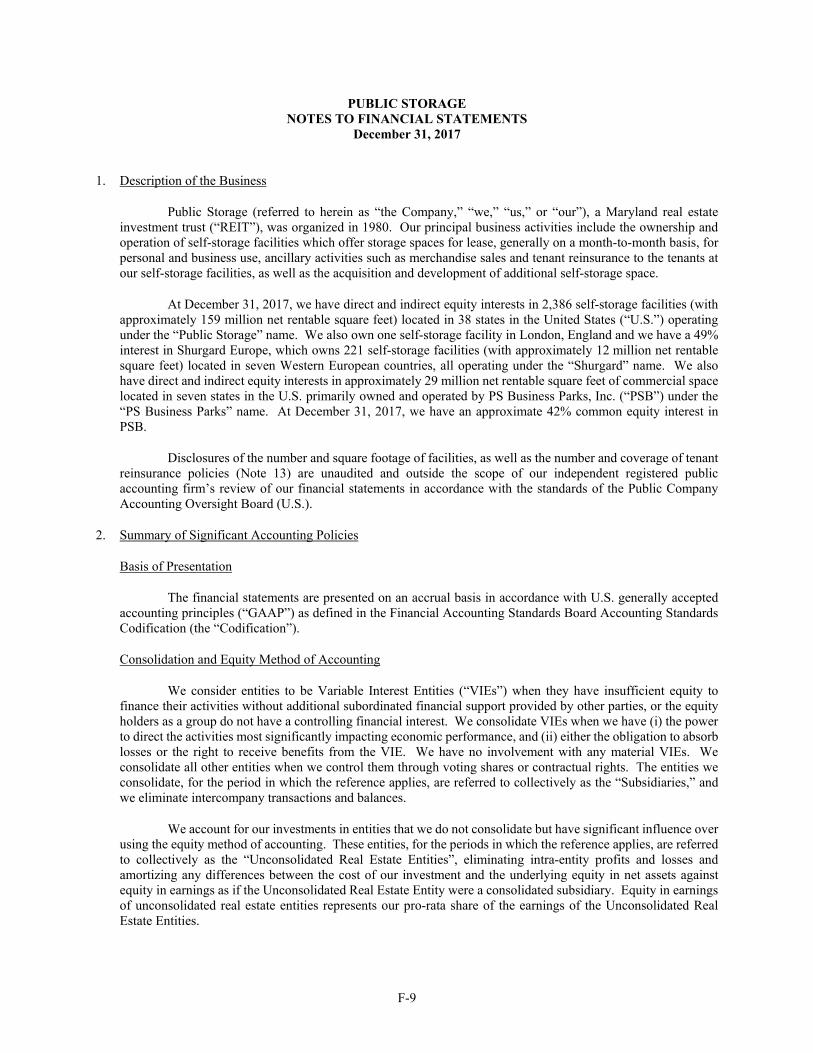
PUBLIC STORAGE NOTES TO FINANCIAL STATEMENTS
December 31, 2017
F-9
1. Description of the Business
Public Storage (referred to herein as “the Company,” “we,” “us,” or “our”), a Maryland real estate investment trust (“REIT”), was organized in 1980. Our principal business activities include the ownership and operation of self-storage facilities which offer storage spaces for lease, generally on a month-to-month basis, for personal and business use, ancillary activities such as merchandise sales and tenant reinsurance to the tenants at our self-storage facilities, as well as the acquisition and development of additional self-storage space.
At December 31, 2017, we have direct and indirect equity interests in 2,386 self-storage facilities (with approximately 159 million net rentable square feet) located in 38 states in the United States (“U.S.”) operating under the “Public Storage” name. We also own one self-storage facility in London, England and we have a 49% interest in Shurgard Europe, which owns 221 self-storage facilities (with approximately 12 million net rentable square feet) located in seven Western European countries, all operating under the “Shurgard” name. We also have direct and indirect equity interests in approximately 29 million net rentable square feet of commercial space located in seven states in the U.S. primarily owned and operated by PS Business Parks, Inc. (“PSB”) under the “PS Business Parks” name. At December 31, 2017, we have an approximate 42% common equity interest in PSB.
Disclosures of the number and square footage of facilities, as well as the number and coverage of tenant reinsurance policies (Note 13) are unaudited and outside the scope of our independent registered public accounting firm’s review of our financial statements in accordance with the standards of the Public Company Accounting Oversight Board (U.S.).
2. Summary of Significant Accounting Policies
Basis of Presentation
The financial statements are presented on an accrual basis in accordance with U.S. generally accepted accounting principles (“GAAP”) as defined in the Financial Accounting Standards Board Accounting Standards Codification (the “Codification”).
Consolidation and Equity Method of Accounting
We consider entities to be Variable Interest Entities (“VIEs”) when they have insufficient equity to finance their activities without additional subordinated financial support provided by other parties, or the equity holders as a group do not have a controlling financial interest. We consolidate VIEs when we have (i) the power to direct the activities most significantly impacting economic performance, and (ii) either the obligation to absorb losses or the right to receive benefits from the VIE. We have no involvement with any material VIEs. We consolidate all other entities when we control them through voting shares or contractual rights. The entities we consolidate, for the period in which the reference applies, are referred to collectively as the “Subsidiaries,” and we eliminate intercompany transactions and balances.
We account for our investments in entities that we do not consolidate but have significant influence over using the equity method of accounting. These entities, for the periods in which the reference applies, are referred to collectively as the “Unconsolidated Real Estate Entities”, eliminating intra-entity profits and losses and amortizing any differences between the cost of our investment and the underlying equity in net assets against equity in earnings as if the Unconsolidated Real Estate Entity were a consolidated subsidiary. Equity in earnings of unconsolidated real estate entities represents our pro-rata share of the earnings of the Unconsolidated Real Estate Entities.
PUBLIC STORAGE NOTES TO FINANCIAL STATEMENTS
December 31, 2017
F-10
When we begin consolidating an entity, we include the book value of our preexisting equity interest as part of the acquisition cost. All changes in consolidation status are reflected prospectively.
Collectively, at December 31, 2017, the Company and the Subsidiaries own 2,386 self-storage facilities in the U.S., one self-storage facility in London, England and three commercial facilities in the U.S. At December 31, 2017, the Unconsolidated Real Estate Entities are comprised of PS and Shurgard Europe.
Use of Estimates
The financial statements and accompanying notes reflect our estimates and assumptions. Actual results could differ from those estimates and assumptions.
Income Taxes
We have elected to be treated as a REIT, as defined in the Internal Revenue Code of 1986, as amended (the “Code”). As a REIT, we do not incur U.S. federal income tax if we distribute 100% of our REIT taxable income each year, and if we meet certain organizational and operational rules. We believe we have met these REIT requirements for all periods presented herein. Accordingly, we have recorded no U.S. federal income tax expense related to our REIT taxable income.
Our merchandise and tenant reinsurance operations are subject to corporate income tax and such taxes are included in ancillary cost of operations. We also incur income and other taxes in certain states, which are included in general and administrative expense.
We recognize tax benefits of uncertain income tax positions that are subject to audit only if we believe it is more likely than not that the position would ultimately be sustained assuming the relevant taxing authorities had full knowledge of the relevant facts and circumstances of our positions. As of December 31, 2017, we had no tax benefits that were not recognized.
Real Estate Facilities
Real estate facilities are recorded at cost. We capitalize all costs incurred to acquire, develop, construct, renovate and improve facilities, including interest and property taxes incurred during the construction period and, effective October 1, 2016, the external transaction costs associated with acquisitions of real estate. Prior to October 1, 2016, transaction costs for acquisitions were included in general and administrative expense on our income statements. This change was made due to a change in GAAP, which results in real estate facility acquisitions generally being considered acquisitions of assets rather than business combinations. We allocate the net acquisition cost of acquired real estate facilities to the underlying land, buildings, and identified intangible assets based upon their respective individual estimated fair values.
Costs associated with dispositions of real estate, as well as repairs and maintenance costs, are expensed as incurred. We depreciate buildings and improvements on a straight-line basis over estimated useful lives ranging generally between 5 to 25 years.
Other Assets
Other assets primarily consist of rents receivable from our tenants, prepaid expenses and restricted cash.

PUBLIC STORAGE NOTES TO FINANCIAL STATEMENTS
December 31, 2017
F-11
Accrued and Other Liabilities
Accrued and other liabilities consist primarily of rents prepaid by our tenants, trade payables, accrued interest, property tax accruals, accrued payroll, accrued tenant reinsurance losses, and accruals for probable and estimable contingent losses. We believe the fair value of our accrued and other liabilities approximates book value, due to the short period until repayment. We disclose the nature of significant unaccrued losses that are reasonably possible of occurring and, if estimable, a range of exposure.
Cash Equivalents, Restricted Cash, Marketable Securities and Other Financial Instruments
Cash equivalents represent highly liquid financial instruments such as money market funds with daily liquidity or short-term commercial paper or treasury securities maturing within three months of acquisition. Cash and equivalents which are restricted from general corporate use are included in other assets. We believe that the book value of all such financial instruments for all periods presented approximates fair value, due to the short period to maturity.
Cash, equivalents, and restricted cash presented on our statements of cash flows totaling $456.1 million, $212.6 million, $115.6 million, and $215.0 million at December 31, 2017, 2016, 2015, and 2014, respectively, include $433.4 million, $183.7 million, $104.3 million, and $187.7 million in cash and equivalents, and $22.7 million, $28.9 million, $11.3 million, and $27.3 million in restricted cash included in other assets.
Fair Value
As used herein, the term “fair value” is the price that would be received to sell an asset or paid to transfer a liability in an orderly transaction between market participants. Our estimates of fair value involve considerable judgment and are not necessarily indicative of the amounts that could be realized in current market exchanges.
We estimate the fair value of our cash and equivalents, marketable securities, other assets, debt, and other liabilities by applying a discount rate to the future cash flows of the financial instrument. The discount rate is based upon quoted interest rates for securities that have similar characteristics such as credit quality and time to maturity; such quoted interest rates are referred to generally as “Level 2” inputs.
Currency and Credit Risk
Financial instruments that are exposed to credit risk consist primarily of cash and equivalents, certain portions of other assets including rents receivable from our tenants and restricted cash. Cash equivalents we invest in are either money market funds with a rating of at least AAA by Standard & Poor’s, commercial paper that is rated A1 by Standard & Poor’s or deposits with highly rated commercial banks.
At December 31, 2017, due primarily to our investment in Shurgard Europe (Note 4) and our notes payable denominated in Euros (Note 6), our operating results and financial position are affected by fluctuations in currency exchange rates between the Euro, and to a lesser extent, other European currencies, against the U.S. Dollar.
Goodwill and Other Intangible Assets
Intangible assets are comprised of goodwill, the “Shurgard” trade name, acquired customers in place, and leasehold interests in land.

PUBLIC STORAGE NOTES TO FINANCIAL STATEMENTS
December 31, 2017
F-12
Goodwill totaled $174.6 million at December 31, 2017 and 2016. The “Shurgard” trade name, which is used by Shurgard Europe pursuant to a fee-based licensing agreement, has a book value of $18.8 million at December 31, 2017 and 2016. Goodwill and the “Shurgard” trade name have indefinite lives and are not amortized.
Acquired customers in place and leasehold interests in land are finite-lived assets and are amortized relative to the benefit of the customers in place or the benefit to land lease expense to each period. At December 31, 2017, these intangibles had a net book value of $21.5 million ($19.3 million at December 31, 2016). Accumulated amortization totaled $31.0 million at December 31, 2017 ($54.0 million at December 31, 2016), and amortization expense of $15.0 million, $21.7 million and $26.1 million was recorded in 2017, 2016 and 2015, respectively. The estimated future amortization expense for our finite-lived intangible assets at December 31, 2017 is approximately $12.5 million in 2018, $3.5 million in 2019 and $5.5 million thereafter. During 2017, 2016 and 2015, intangibles increased $17.2 million, $23.0 million and $8.9 million, respectively, in connection with the acquisition of self-storage facilities (Note 3).
Evaluation of Asset Impairment
We evaluate our real estate and finite-lived intangible assets for impairment each quarter. If there are indicators of impairment and we determine that the asset is not recoverable from future undiscounted cash flows to be received through the asset’s remaining life (or, if earlier, the expected disposal date), we record an impairment charge to the extent the carrying amount exceeds the asset’s estimated fair value or net proceeds from expected disposal.
We evaluate our investments in unconsolidated real estate entities for impairment on a quarterly basis. We record an impairment charge to the extent the carrying amount exceeds estimated fair value, when we believe any such shortfall is other than temporary.
We evaluate goodwill for impairment annually and whenever relevant events, circumstances and other related factors indicate that fair value of the related reporting unit may be less than the carrying amount. If we determine that the fair value of the reporting unit exceeds the aggregate carrying amount, no impairment charge is recorded. Otherwise, we record an impairment charge to the extent the carrying amount of the goodwill exceeds the amount that would be allocated to goodwill if the reporting unit were acquired for estimated fair value.
We evaluate other indefinite-lived intangible assets, such as the “Shurgard” trade name for impairment at least annually and whenever relevant events, circumstances and other related factors indicate that the fair value is less than the carrying amount. When we conclude that it is likely that the asset is not impaired, we do not record an impairment charge and no further analysis is performed. Otherwise, we record an impairment charge to the extent the carrying amount exceeds the asset’s estimated fair value.
No impairments were recorded in any of our evaluations for any period presented herein.
Casualty Loss
We record casualty losses for i) the book value of assets destroyed and ii) incremental repair, clean-up, and other costs associated with the casualty. Insurance proceeds are recorded as a reduction in casualty loss when all uncertainties of collection are satisfied. During 2017, we incurred casualty losses totaling $7.8 million, comprised of $3.3 million in book value of assets damaged and $4.5 million in repairs and maintenance incurred in connection with Hurricanes Harvey and Irma.
PUBLIC STORAGE NOTES TO FINANCIAL STATEMENTS
December 31, 2017
F-13
Revenue and Expense Recognition
Revenues from self-storage facilities, which are primarily composed of rental income earned pursuant to month-to-month leases, as well as associated late charges and administrative fees, are recognized as earned. Promotional discounts reduce rental income over the promotional period, which is generally one month. Ancillary revenues and interest and other income are recognized when earned.
We accrue for property tax expense based upon actual amounts billed and, in some circumstances, estimates when bills or assessments have not been received from the taxing authorities. If these estimates are incorrect, the timing and amount of expense recognition could be incorrect. Cost of operations (including advertising expenditures), general and administrative expense, and interest expense are expensed as incurred.
Foreign Currency Exchange Translation
The local currency (primarily the Euro) is the functional currency for our interests in foreign operations. The related balance sheet amounts are translated into U.S. Dollars at the exchange rates at the respective financial statement date, while amounts on our statements of income are translated at the average exchange rates during the respective period. When financial instruments denominated in a currency other than the U.S. Dollar are expected to be settled in cash in the foreseeable future, the impact of changes in the U.S. Dollar equivalent are reflected in current earnings. The Euro was translated at exchange rates of approximately 1.198 U.S. Dollars per Euro at December 31, 2017 (1.052 at December 31, 2016), and average exchange rates of 1.129, 1.107 and 1.110 for the years ended December 31, 2017, 2016 and 2015, respectively. Cumulative translation adjustments, to the extent not included in cumulative net income, are included in equity as a component of accumulated other comprehensive income (loss).
Comprehensive Income
Total comprehensive income represents net income, adjusted for changes in other comprehensive income (loss) for the applicable period. The aggregate foreign currency exchange gains and losses reflected on our statements of comprehensive income are comprised primarily of foreign currency exchange gains and losses on our investment in Shurgard Europe and our notes payable denominated in Euros.
Net Income per Common Share
Net income is allocated to (i) noncontrolling interests based upon their share of the net income of the Subsidiaries, (ii) preferred shareholders, to the extent redemption cost exceeds the related original net issuance proceeds (an “EITF D-42 allocation”), and (iii) the remaining net income is allocated to each of our equity securities based upon the dividends declared or accumulated during the period, combined with participation rights in undistributed earnings.
Basic and diluted net income per common share are each calculated based upon net income allocable to common shareholders presented on the face of our income statement, divided by (i) in the case of basic net income per common share, weighted average common shares, and (ii) in the case of diluted income per share, weighted average common shares adjusted for the impact, if dilutive, of stock options outstanding (Note 10). The following table reconciles from basic to diluted common shares outstanding:

PUBLIC STORAGE NOTES TO FINANCIAL STATEMENTS
December 31, 2017
F-14
For the Years Ended December 31, 2017 2016 2015 Weighted average common shares and equivalents outstanding: Basic weighted average common shares outstanding 173,613 173,091 172,699 Net effect of dilutive stock options - based on treasury stock method 538 787 811 Diluted weighted average common shares outstanding 174,151 173,878 173,510
3. Real Estate Facilities
Activity in real estate facilities during 2017, 2016 and 2015 is as follows:
For the Years Ended December 31, 2017 2016 2015 (Amounts in thousands) Operating facilities, at cost: Beginning balance $ 13,963,229 $ 13,205,261 $ 12,863,235 Capital expenditures to maintain real estate facilities 124,780 86,047 63,069 Acquisitions 274,115 406,154 176,444 Dispositions (1,092) - (19,970) Assets damaged due to hurricanes (8,226) - - Developed or redeveloped facilities opened for operation 311,559 268,905 123,484 Impact of foreign exchange rate changes 1,624 (3,138) (1,001) Ending balance 14,665,989 13,963,229 13,205,261 Accumulated depreciation: Beginning balance (5,270,963) (4,866,738) (4,482,520) Depreciation expense (433,466) (406,046) (393,605) Dispositions 123 - 8,886 Assets damaged due to hurricanes 4,940 - - Impact of foreign exchange rate changes (965) 1,821 501 Ending balance (5,700,331) (5,270,963) (4,866,738) Construction in process: Beginning balance 230,310 219,190 104,573 Current development 349,712 288,154 238,101 Developed or redeveloped facilities opened for operation (311,559) (268,905) (123,484) Dispositions and transfers to other assets (4,022) (8,129) - Ending balance 264,441 230,310 219,190 Total real estate facilities at December 31, 2017 $ 9,230,099 $ 8,922,576 $ 8,557,713
During 2017, we acquired 22 self-storage facilities from third parties (1,365,000 net rentable square feet), for a total cost of $149.8 million, in cash. Approximately $8.2 million of the total cost was allocated to
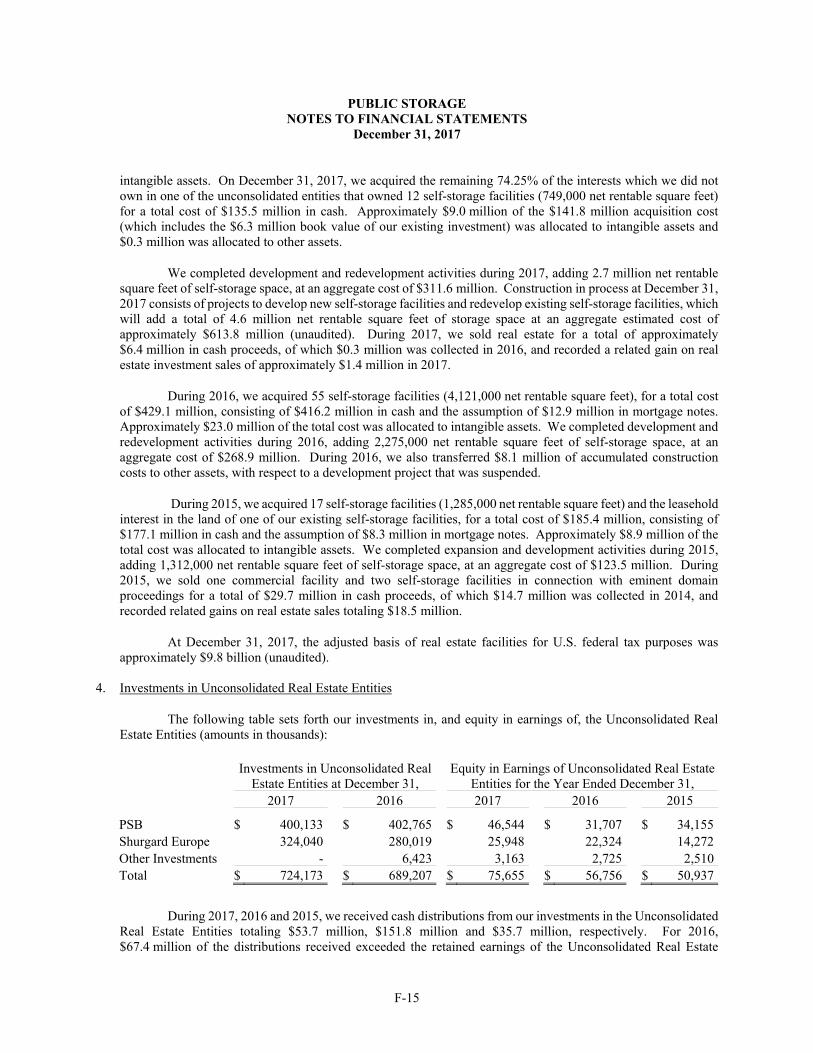
PUBLIC STORAGE NOTES TO FINANCIAL STATEMENTS
December 31, 2017
F-15
intangible assets. On December 31, 2017, we acquired the remaining 74.25% of the interests which we did not own in one of the unconsolidated entities that owned 12 self-storage facilities (749,000 net rentable square feet) for a total cost of $135.5 million in cash. Approximately $9.0 million of the $141.8 million acquisition cost (which includes the $6.3 million book value of our existing investment) was allocated to intangible assets and $0.3 million was allocated to other assets.
We completed development and redevelopment activities during 2017, adding 2.7 million net rentable square feet of self-storage space, at an aggregate cost of $311.6 million. Construction in process at December 31, 2017 consists of projects to develop new self-storage facilities and redevelop existing self-storage facilities, which will add a total of 4.6 million net rentable square feet of storage space at an aggregate estimated cost of approximately $613.8 million (unaudited). During 2017, we sold real estate for a total of approximately $6.4 million in cash proceeds, of which $0.3 million was collected in 2016, and recorded a related gain on real estate investment sales of approximately $1.4 million in 2017.
During 2016, we acquired 55 self-storage facilities (4,121,000 net rentable square feet), for a total cost of $429.1 million, consisting of $416.2 million in cash and the assumption of $12.9 million in mortgage notes. Approximately $23.0 million of the total cost was allocated to intangible assets. We completed development and redevelopment activities during 2016, adding 2,275,000 net rentable square feet of self-storage space, at an aggregate cost of $268.9 million. During 2016, we also transferred $8.1 million of accumulated construction costs to other assets, with respect to a development project that was suspended.
During 2015, we acquired 17 self-storage facilities (1,285,000 net rentable square feet) and the leasehold interest in the land of one of our existing self-storage facilities, for a total cost of $185.4 million, consisting of $177.1 million in cash and the assumption of $8.3 million in mortgage notes. Approximately $8.9 million of the total cost was allocated to intangible assets. We completed expansion and development activities during 2015, adding 1,312,000 net rentable square feet of self-storage space, at an aggregate cost of $123.5 million. During 2015, we sold one commercial facility and two self-storage facilities in connection with eminent domain proceedings for a total of $29.7 million in cash proceeds, of which $14.7 million was collected in 2014, and recorded related gains on real estate sales totaling $18.5 million.
At December 31, 2017, the adjusted basis of real estate facilities for U.S. federal tax purposes was approximately $9.8 billion (unaudited).
4. Investments in Unconsolidated Real Estate Entities
The following table sets forth our investments in, and equity in earnings of, the Unconsolidated Real Estate Entities (amounts in thousands):
Investments in Unconsolidated Real
Estate Entities at December 31, Equity in Earnings of Unconsolidated Real Estate
Entities for the Year Ended December 31, 2017 2016 2017 2016 2015
PSB $ 400,133 $ 402,765 $ 46,544 $ 31,707 $ 34,155 Shurgard Europe 324,040 280,019 25,948 22,324 14,272 Other Investments - 6,423 3,163 2,725 2,510 Total $ 724,173 $ 689,207 $ 75,655 $ 56,756 $ 50,937
During 2017, 2016 and 2015, we received cash distributions from our investments in the Unconsolidated Real Estate Entities totaling $53.7 million, $151.8 million and $35.7 million, respectively. For 2016, $67.4 million of the distributions received exceeded the retained earnings of the Unconsolidated Real Estate
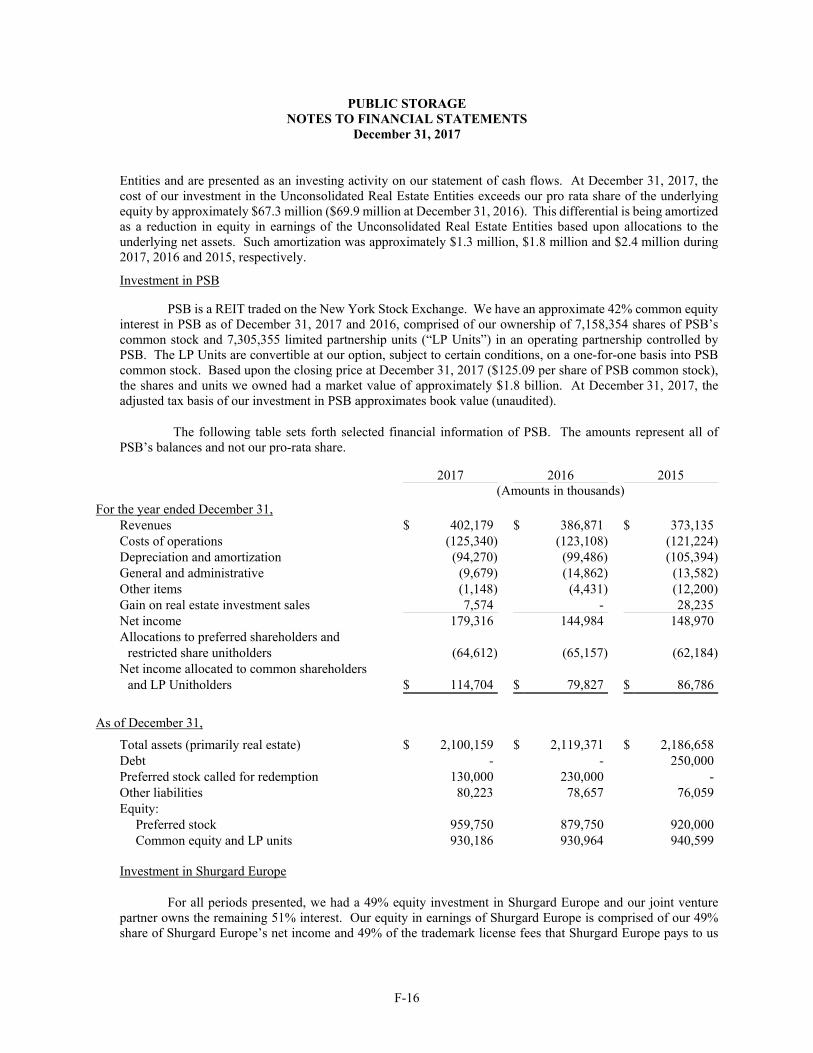
PUBLIC STORAGE NOTES TO FINANCIAL STATEMENTS
December 31, 2017
F-16
Entities and are presented as an investing activity on our statement of cash flows. At December 31, 2017, the cost of our investment in the Unconsolidated Real Estate Entities exceeds our pro rata share of the underlying equity by approximately $67.3 million ($69.9 million at December 31, 2016). This differential is being amortized as a reduction in equity in earnings of the Unconsolidated Real Estate Entities based upon allocations to the underlying net assets. Such amortization was approximately $1.3 million, $1.8 million and $2.4 million during 2017, 2016 and 2015, respectively.
Investment in PSB
PSB is a REIT traded on the New York Stock Exchange. We have an approximate 42% common equity interest in PSB as of December 31, 2017 and 2016, comprised of our ownership of 7,158,354 shares of PSB’s common stock and 7,305,355 limited partnership units (“LP Units”) in an operating partnership controlled by PSB. The LP Units are convertible at our option, subject to certain conditions, on a one-for-one basis into PSB common stock. Based upon the closing price at December 31, 2017 ($125.09 per share of PSB common stock), the shares and units we owned had a market value of approximately $1.8 billion. At December 31, 2017, the adjusted tax basis of our investment in PSB approximates book value (unaudited).
The following table sets forth selected financial information of PSB. The amounts represent all of PSB’s balances and not our pro-rata share.
2017 2016 2015 (Amounts in thousands)
For the year ended December 31, Revenues $ 402,179 $ 386,871 $ 373,135Costs of operations (125,340) (123,108) (121,224)Depreciation and amortization (94,270) (99,486) (105,394)General and administrative (9,679) (14,862) (13,582)Other items (1,148) (4,431) (12,200)Gain on real estate investment sales 7,574 - 28,235Net income 179,316 144,984 148,970Allocations to preferred shareholders and
restricted share unitholders (64,612) (65,157) (62,184)Net income allocated to common shareholders
and LP Unitholders $ 114,704 $ 79,827 $ 86,786
As of December 31,
Total assets (primarily real estate) $ 2,100,159 $ 2,119,371 $ 2,186,658Debt - - 250,000Preferred stock called for redemption 130,000 230,000 -Other liabilities 80,223 78,657 76,059Equity:
Preferred stock 959,750 879,750 920,000Common equity and LP units 930,186 930,964 940,599
Investment in Shurgard Europe
For all periods presented, we had a 49% equity investment in Shurgard Europe and our joint venture partner owns the remaining 51% interest. Our equity in earnings of Shurgard Europe is comprised of our 49% share of Shurgard Europe’s net income and 49% of the trademark license fees that Shurgard Europe pays to us
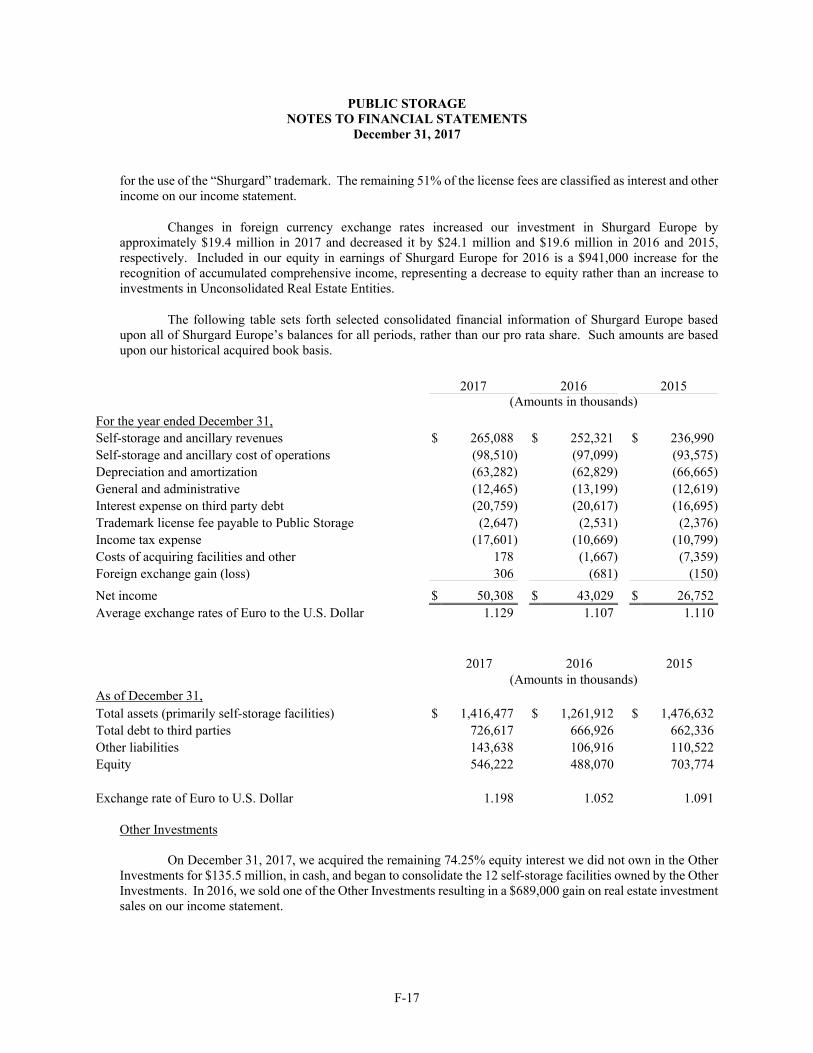
PUBLIC STORAGE NOTES TO FINANCIAL STATEMENTS
December 31, 2017
F-17
for the use of the “Shurgard” trademark. The remaining 51% of the license fees are classified as interest and other income on our income statement.
Changes in foreign currency exchange rates increased our investment in Shurgard Europe by approximately $19.4 million in 2017 and decreased it by $24.1 million and $19.6 million in 2016 and 2015, respectively. Included in our equity in earnings of Shurgard Europe for 2016 is a $941,000 increase for the recognition of accumulated comprehensive income, representing a decrease to equity rather than an increase to investments in Unconsolidated Real Estate Entities.
The following table sets forth selected consolidated financial information of Shurgard Europe based upon all of Shurgard Europe’s balances for all periods, rather than our pro rata share. Such amounts are based upon our historical acquired book basis.
2017 2016 2015 (Amounts in thousands)
For the year ended December 31,
Self-storage and ancillary revenues $ 265,088 $ 252,321 $ 236,990Self-storage and ancillary cost of operations (98,510) (97,099) (93,575)Depreciation and amortization (63,282) (62,829) (66,665)General and administrative (12,465) (13,199) (12,619)Interest expense on third party debt (20,759) (20,617) (16,695)Trademark license fee payable to Public Storage (2,647) (2,531) (2,376)Income tax expense (17,601) (10,669) (10,799)Costs of acquiring facilities and other 178 (1,667) (7,359)Foreign exchange gain (loss) 306 (681) (150)
Net income $ 50,308 $ 43,029 $ 26,752Average exchange rates of Euro to the U.S. Dollar 1.129 1.107 1.110
2017 2016 2015 (Amounts in thousands) As of December 31, Total assets (primarily self-storage facilities) $ 1,416,477 $ 1,261,912 $ 1,476,632Total debt to third parties 726,617 666,926 662,336Other liabilities 143,638 106,916 110,522Equity 546,222 488,070 703,774 Exchange rate of Euro to U.S. Dollar 1.198 1.052 1.091
Other Investments
On December 31, 2017, we acquired the remaining 74.25% equity interest we did not own in the Other Investments for $135.5 million, in cash, and began to consolidate the 12 self-storage facilities owned by the Other Investments. In 2016, we sold one of the Other Investments resulting in a $689,000 gain on real estate investment sales on our income statement.

PUBLIC STORAGE NOTES TO FINANCIAL STATEMENTS
December 31, 2017
F-18
5. Credit Facility
We have a revolving credit agreement (the “Credit Facility”) with a $500 million borrowing limit, which expires on March 31, 2020. Amounts drawn on the Credit Facility bear annual interest at rates ranging from LIBOR plus 0.850% to LIBOR plus 1.450% depending upon the ratio of our Total Indebtedness to Gross Asset Value (as defined in the Credit Facility) (LIBOR plus 0.850% at December 31, 2017). We are also required to pay a quarterly facility fee ranging from 0.080% per annum to 0.250% per annum depending upon the ratio of our Total Indebtedness to our Gross Asset Value (0.080% per annum at December 31, 2017). At December 31, 2017 and February 28, 2018, we had no outstanding borrowings under this Credit Facility. We had undrawn standby letters of credit, which reduce our borrowing capacity, totaling $16.1 million at December 31, 2017 ($15.2 million at December 31, 2016). The Credit Facility has various customary restrictive covenants, all of which we were in compliance with at December 31, 2017.
6. Notes Payable
Our notes payable at December 31, 2017 and 2016 are set forth in the table below:
Amounts at December 31, 2017
Coupon Effective Unamortized Book Fair Book Value at Rate Rate Principal Costs Value Value December 31, 2016 ($ amounts in thousands) U.S. Dollar Denominated Unsecured Debt Notes due September 2022 2.370% 2.483% $ 500,000 $ (2,475) $ 497,525 $ 492,088 $ -Notes due September 2027 3.094% 3.218% 500,000 (5,132) 494,868 493,946 - 1,000,000 (7,607) 992,393 986,034 - Euro Denominated Unsecured Debt Notes due April 2024 1.540% 1.540% 119,795 - 119,795 125,367 105,203 Notes due November 2025 2.175% 2.175% 289,921 - 289,921 305,445 254,607 409,716 - 409,716 430,812 359,810 Mortgage Debt, secured by 30 real facilities with a net book value of $118.3 million 4.054% 3.997% 29,213 - 29,213 30,355 30,939 $ 1,438,929 $ (7,607) $ 1,431,322 $ 1,447,201 $ 390,749
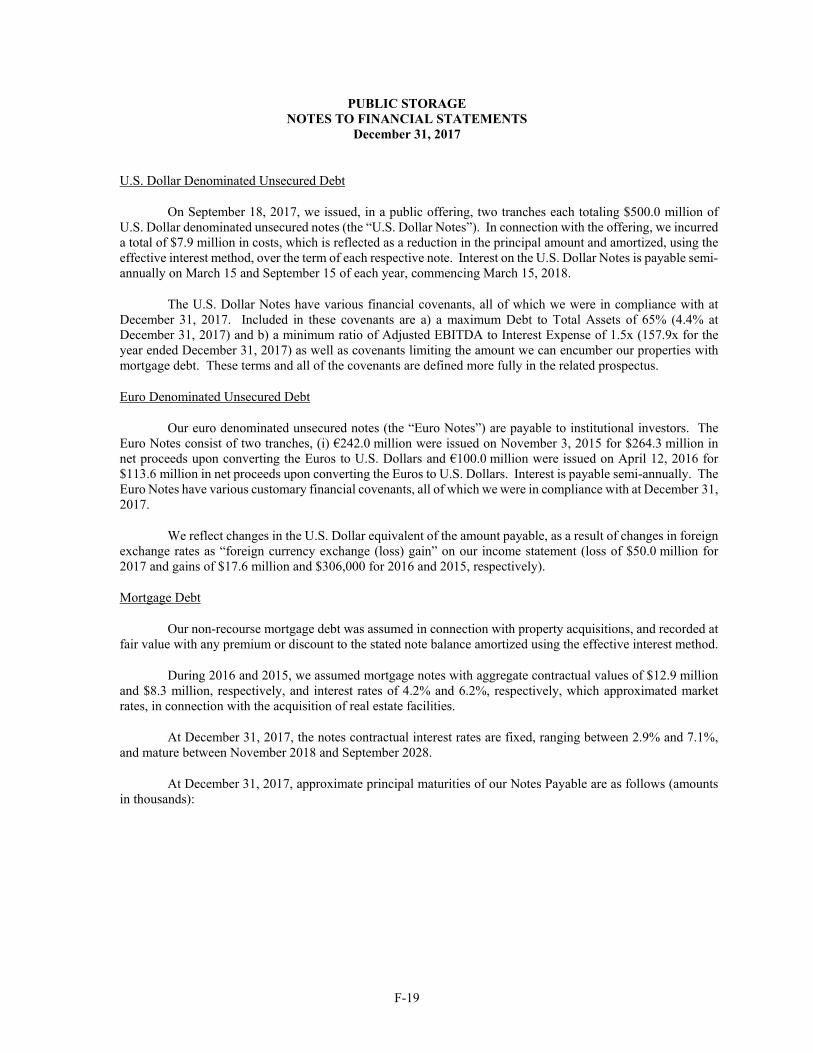
PUBLIC STORAGE NOTES TO FINANCIAL STATEMENTS
December 31, 2017
F-19
U.S. Dollar Denominated Unsecured Debt
On September 18, 2017, we issued, in a public offering, two tranches each totaling $500.0 million of U.S. Dollar denominated unsecured notes (the “U.S. Dollar Notes”). In connection with the offering, we incurred a total of $7.9 million in costs, which is reflected as a reduction in the principal amount and amortized, using the effective interest method, over the term of each respective note. Interest on the U.S. Dollar Notes is payable semi-annually on March 15 and September 15 of each year, commencing March 15, 2018.
The U.S. Dollar Notes have various financial covenants, all of which we were in compliance with at December 31, 2017. Included in these covenants are a) a maximum Debt to Total Assets of 65% (4.4% at December 31, 2017) and b) a minimum ratio of Adjusted EBITDA to Interest Expense of 1.5x (157.9x for the year ended December 31, 2017) as well as covenants limiting the amount we can encumber our properties with mortgage debt. These terms and all of the covenants are defined more fully in the related prospectus.
Euro Denominated Unsecured Debt
Our euro denominated unsecured notes (the “Euro Notes”) are payable to institutional investors. The Euro Notes consist of two tranches, (i) €242.0 million were issued on November 3, 2015 for $264.3 million in net proceeds upon converting the Euros to U.S. Dollars and €100.0 million were issued on April 12, 2016 for $113.6 million in net proceeds upon converting the Euros to U.S. Dollars. Interest is payable semi-annually. The Euro Notes have various customary financial covenants, all of which we were in compliance with at December 31, 2017.
We reflect changes in the U.S. Dollar equivalent of the amount payable, as a result of changes in foreign exchange rates as “foreign currency exchange (loss) gain” on our income statement (loss of $50.0 million for 2017 and gains of $17.6 million and $306,000 for 2016 and 2015, respectively).
Mortgage Debt
Our non-recourse mortgage debt was assumed in connection with property acquisitions, and recorded at fair value with any premium or discount to the stated note balance amortized using the effective interest method.
During 2016 and 2015, we assumed mortgage notes with aggregate contractual values of $12.9 million and $8.3 million, respectively, and interest rates of 4.2% and 6.2%, respectively, which approximated market rates, in connection with the acquisition of real estate facilities.
At December 31, 2017, the notes contractual interest rates are fixed, ranging between 2.9% and 7.1%, and mature between November 2018 and September 2028.
At December 31, 2017, approximate principal maturities of our Notes Payable are as follows (amounts in thousands):
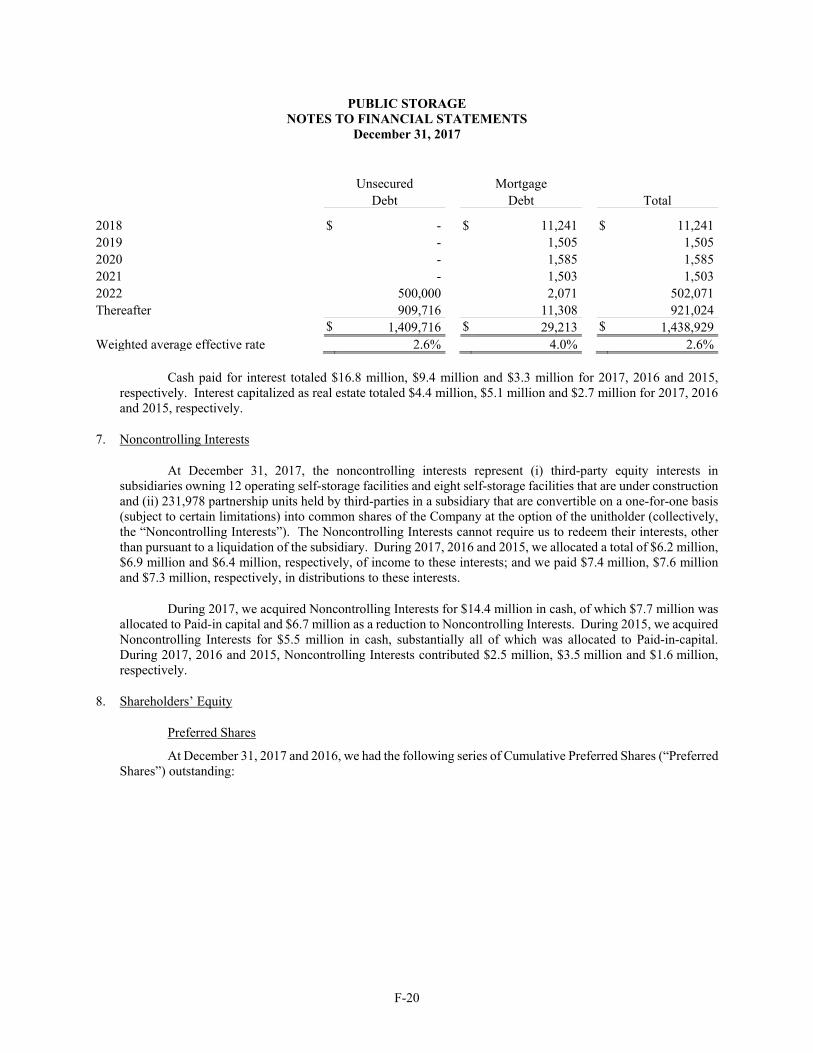
PUBLIC STORAGE NOTES TO FINANCIAL STATEMENTS
December 31, 2017
F-20
Unsecured Mortgage Debt Debt Total
2018 $ - $ 11,241 $ 11,2412019 - 1,505 1,5052020 - 1,585 1,5852021 - 1,503 1,5032022 500,000 2,071 502,071Thereafter 909,716 11,308 921,024 $ 1,409,716 $ 29,213 $ 1,438,929Weighted average effective rate 2.6% 4.0% 2.6%
Cash paid for interest totaled $16.8 million, $9.4 million and $3.3 million for 2017, 2016 and 2015, respectively. Interest capitalized as real estate totaled $4.4 million, $5.1 million and $2.7 million for 2017, 2016 and 2015, respectively.
7. Noncontrolling Interests
At December 31, 2017, the noncontrolling interests represent (i) third-party equity interests in subsidiaries owning 12 operating self-storage facilities and eight self-storage facilities that are under construction and (ii) 231,978 partnership units held by third-parties in a subsidiary that are convertible on a one-for-one basis (subject to certain limitations) into common shares of the Company at the option of the unitholder (collectively, the “Noncontrolling Interests”). The Noncontrolling Interests cannot require us to redeem their interests, other than pursuant to a liquidation of the subsidiary. During 2017, 2016 and 2015, we allocated a total of $6.2 million, $6.9 million and $6.4 million, respectively, of income to these interests; and we paid $7.4 million, $7.6 million and $7.3 million, respectively, in distributions to these interests.
During 2017, we acquired Noncontrolling Interests for $14.4 million in cash, of which $7.7 million was allocated to Paid-in capital and $6.7 million as a reduction to Noncontrolling Interests. During 2015, we acquired Noncontrolling Interests for $5.5 million in cash, substantially all of which was allocated to Paid-in-capital. During 2017, 2016 and 2015, Noncontrolling Interests contributed $2.5 million, $3.5 million and $1.6 million, respectively.
8. Shareholders’ Equity
Preferred Shares
At December 31, 2017 and 2016, we had the following series of Cumulative Preferred Shares (“Preferred Shares”) outstanding:

PUBLIC STORAGE NOTES TO FINANCIAL STATEMENTS
December 31, 2017
F-21
At December 31, 2017 At December 31, 2016
Series
Earliest Redemption
Dividend Rate
Shares Outstanding
Liquidation Preference
Shares Outstanding
Liquidation Preference
(Dollar amounts in thousands)
Series S 1/12/2017 5.900% - $ - 18,400 $ 460,000
Series T 3/13/2017 5.750% - - 18,500 462,500
Series U 6/15/2017 5.625% 11,500 287,500 11,500 287,500
Series V 9/20/2017 5.375% 19,800 495,000 19,800 495,000
Series W 1/16/2018 5.200% 20,000 500,000 20,000 500,000
Series X 3/13/2018 5.200% 9,000 225,000 9,000 225,000
Series Y 3/17/2019 6.375% 11,400 285,000 11,400 285,000
Series Z 6/4/2019 6.000% 11,500 287,500 11,500 287,500
Series A 12/2/2019 5.875% 7,600 190,000 7,600 190,000
Series B 1/20/2021 5.400% 12,000 300,000 12,000 300,000
Series C 5/17/2021 5.125% 8,000 200,000 8,000 200,000
Series D 7/20/2021 4.950% 13,000 325,000 13,000 325,000
Series E 10/14/2021 4.900% 14,000 350,000 14,000 350,000
Series F 6/2/2022 5.150% 11,200 280,000 - -
Series G 8/9/2022 5.050% 12,000 300,000 - -
Total Preferred Shares 161,000 $ 4,025,000 174,700 $ 4,367,500
The holders of our Preferred Shares have general preference rights with respect to liquidation, quarterly distributions and any accumulated unpaid distributions. Except under certain conditions and as noted below, holders of the Preferred Shares will not be entitled to vote on most matters. In the event of a cumulative arrearage equal to six quarterly dividends, holders of all outstanding series of preferred shares (voting as a single class without regard to series) will have the right to elect two additional members to serve on our board of trustees (our “Board”) until the arrearage has been cured. At December 31, 2017, there were no dividends in arrears.
Except under certain conditions relating to the Company’s qualification as a REIT, the Preferred Shares are not redeemable prior to the dates indicated on the table above. On or after the respective dates, each of the series of Preferred Shares is redeemable at our option, in whole or in part, at $25.00 per depositary share, plus accrued and unpaid dividends. Holders of the Preferred Shares cannot require us to redeem such shares.
Upon issuance of our Preferred Shares, we classify the liquidation value as preferred equity on our balance sheet with any issuance costs recorded as a reduction to Paid-in capital.
In 2017, we redeemed our Series S and Series T Preferred Shares, at par, for a total of $922.5 million in cash, before payment of accrued dividends.
In 2017, we issued an aggregate 23.2 million depositary shares, each representing 1/1,000 of a share of our Series F and Series G Preferred Shares, at an issuance price of $25.00 per depositary share, for a total of $580.0 million in gross proceeds, and we incurred $18.8 million in issuance costs.

PUBLIC STORAGE NOTES TO FINANCIAL STATEMENTS
December 31, 2017
F-22
In 2016, we redeemed our Series Q and Series R Preferred Shares at par, for a total of $862.5 million in cash, before payment of accrued dividends.
In 2016, we issued an aggregate 47.0 million depositary shares, each representing 1/1,000 of a share of our Series B, Series C, Series D and Series E Preferred Shares, at an issuance price of $25.00 per depositary share, for a total of $1,175.0 million in gross proceeds, and we incurred $38.8 million in issuance costs.
In 2015, we redeemed our Series O and Series P Preferred Shares at par, for a total of $270.0 million in cash, before payment of accrued dividends.
In 2017, 2016 and 2015, we recorded $29.3 million, $26.9 million $8.9 million, respectively, in EITF D-42 allocations of income from our common shareholders to the holders of our Preferred Shares in connection with redemptions of Preferred Shares.
Common Shares
During 2017, 2016 and 2015, activity with respect to the issuance of our common shares was as follows (dollar amounts in thousands):
2017 2016 2015
Shares Amount Shares Amount Shares Amount
Employee stock-based compensation and exercise of stock options (Note 10) 564,583 $ 42,500 367,546 $ 25,541 475,687 $ 29,663
Our Board previously authorized the repurchase from time to time of up to 35.0 million of our common shares on the open market or in privately negotiated transactions. Through December 31, 2017, we repurchased approximately 23.7 million shares pursuant to this authorization; none of which were repurchased during the three years ended December 31, 2017.
At December 31, 2017 and 2016, we had 3,208,046 and 2,692,081, respectively, of common shares reserved in connection with our share-based incentive plans (see Note 10), and 231,978 shares reserved for the conversion of partnership units owned by Noncontrolling Interests.
The unaudited characterization of dividends for U.S. federal income tax purposes is made based upon earnings and profits of the Company, as defined by the Code. Common share dividends including amounts paid to our common shareholders and our restricted share unitholders totaled $1.394 billion ($8.00 per share), $1.268 billion ($7.30 per share) and $1.126 billion ($6.50 per share) for the years ended December 31, 2017, 2016 and 2015, respectively. Preferred share dividends totaled $236.5 million, $238.2 million and $245.1 million for the years ended December 31, 2017, 2016 and 2015, respectively.
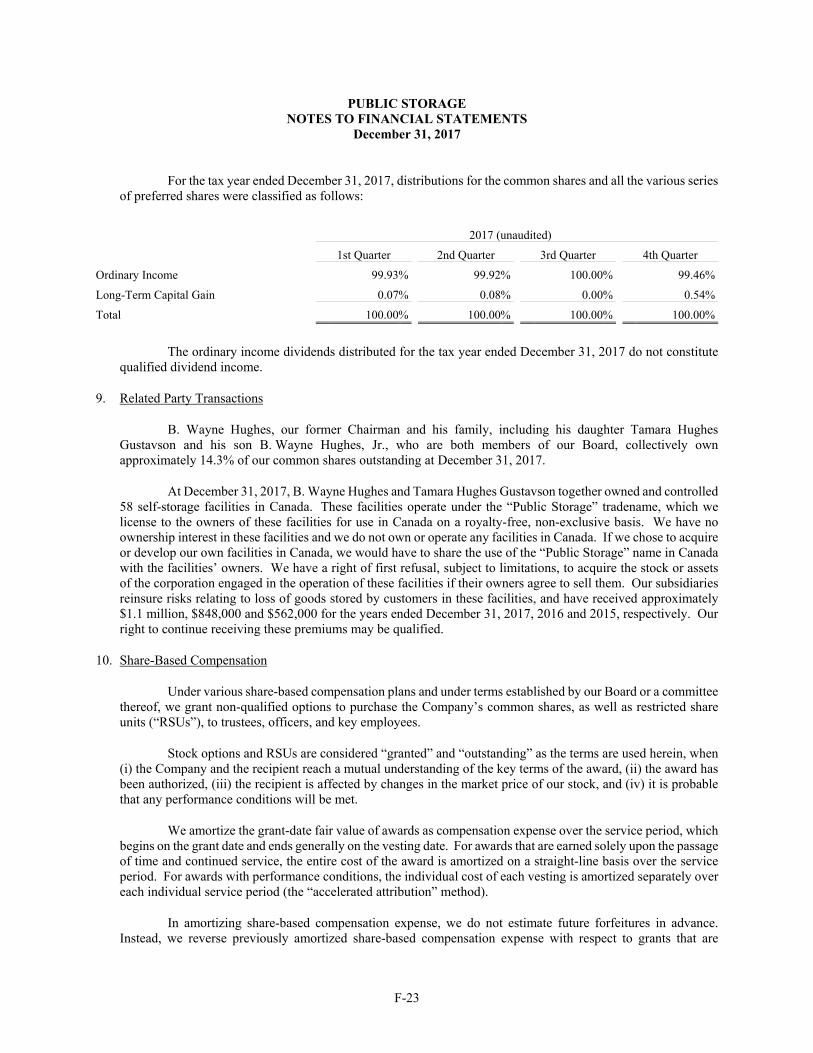
PUBLIC STORAGE NOTES TO FINANCIAL STATEMENTS
December 31, 2017
F-23
For the tax year ended December 31, 2017, distributions for the common shares and all the various series of preferred shares were classified as follows:
2017 (unaudited)
1st Quarter 2nd Quarter 3rd Quarter 4th Quarter
Ordinary Income 99.93% 99.92% 100.00% 99.46%
Long-Term Capital Gain 0.07% 0.08% 0.00% 0.54%
Total 100.00% 100.00% 100.00% 100.00%
The ordinary income dividends distributed for the tax year ended December 31, 2017 do not constitute qualified dividend income.
9. Related Party Transactions
B. Wayne Hughes, our former Chairman and his family, including his daughter Tamara Hughes Gustavson and his son B. Wayne Hughes, Jr., who are both members of our Board, collectively own approximately 14.3% of our common shares outstanding at December 31, 2017.
At December 31, 2017, B. Wayne Hughes and Tamara Hughes Gustavson together owned and controlled 58 self-storage facilities in Canada. These facilities operate under the “Public Storage” tradename, which we license to the owners of these facilities for use in Canada on a royalty-free, non-exclusive basis. We have no ownership interest in these facilities and we do not own or operate any facilities in Canada. If we chose to acquire or develop our own facilities in Canada, we would have to share the use of the “Public Storage” name in Canada with the facilities’ owners. We have a right of first refusal, subject to limitations, to acquire the stock or assets of the corporation engaged in the operation of these facilities if their owners agree to sell them. Our subsidiaries reinsure risks relating to loss of goods stored by customers in these facilities, and have received approximately $1.1 million, $848,000 and $562,000 for the years ended December 31, 2017, 2016 and 2015, respectively. Our right to continue receiving these premiums may be qualified.
10. Share-Based Compensation
Under various share-based compensation plans and under terms established by our Board or a committee thereof, we grant non-qualified options to purchase the Company’s common shares, as well as restricted share units (“RSUs”), to trustees, officers, and key employees.
Stock options and RSUs are considered “granted” and “outstanding” as the terms are used herein, when (i) the Company and the recipient reach a mutual understanding of the key terms of the award, (ii) the award has been authorized, (iii) the recipient is affected by changes in the market price of our stock, and (iv) it is probable that any performance conditions will be met.
We amortize the grant-date fair value of awards as compensation expense over the service period, which begins on the grant date and ends generally on the vesting date. For awards that are earned solely upon the passage of time and continued service, the entire cost of the award is amortized on a straight-line basis over the service period. For awards with performance conditions, the individual cost of each vesting is amortized separately over each individual service period (the “accelerated attribution” method).
In amortizing share-based compensation expense, we do not estimate future forfeitures in advance. Instead, we reverse previously amortized share-based compensation expense with respect to grants that are

PUBLIC STORAGE NOTES TO FINANCIAL STATEMENTS
December 31, 2017
F-24
forfeited in the period the employee terminates employment. We recorded a cumulative-effect adjustment of $789,000 to increase accumulated deficit and increase paid-in capital as of January 1, 2016, representing the impact of estimated forfeitures at December 31, 2015.
Our Chief Executive Officer ("CEO") and Chief Financial Officer ("CFO") are expected to retire at the end of 2018 and then serve as Trustees of the Company for the foreseeable future. While the actual vesting of such share-based compensation will not accelerate, and will continue to vest under the original schedule only if they continue to serve as Trustees, their respective service periods for their previous grants while CEO and CFO effectively end on the date of their retirement as CEO and CFO. As a result, the remaining unamortized expense on outstanding grants at December 31, 2017 will be recognized through their expected retirement dates, increasing 2018 expense $23.6 million above what it would have been without the acceleration of amortization. Any additional grants to our CEO and CFO in 2018 will also be amortized through December 31, 2018 and further increase our share-based compensation expense for 2018.
See also “net income per common share” in Note 2 for further discussion regarding the impact of RSUs and stock options on our net income per common share and income allocated to common shareholders.
Stock Options
Stock options vest over a three to five-year period, expire ten years after the grant date, and the exercise price is equal to the closing trading price of our common shares on the grant date. Employees cannot require the Company to settle their award in cash. We use the Black-Scholes option valuation model to estimate the fair value of our stock options.
Outstanding stock option grants are included on a one-for-one basis in our diluted weighted average shares, to the extent dilutive, after applying the treasury stock method (based upon the average common share price during the period) to assumed exercise proceeds and measured but unrecognized compensation.
The stock options outstanding at December 31, 2017 have an aggregate intrinsic value (the excess, if any, of each option’s market value over the exercise price) of approximately $65.1 million and remaining average contractual lives of approximately seven years. The aggregate intrinsic value of exercisable stock options at December 31, 2017 amounted to approximately $57.6 million. Approximately 1,361,000 of the stock options outstanding at December 31, 2017, have an exercise price of more than $200. We have 195,750 stock options exercisable at December 31, 2017, which expire through June 30, 2019, with an average exercise price per share of $54.87.
Additional information with respect to stock options during 2017, 2016 and 2015 is as follows:
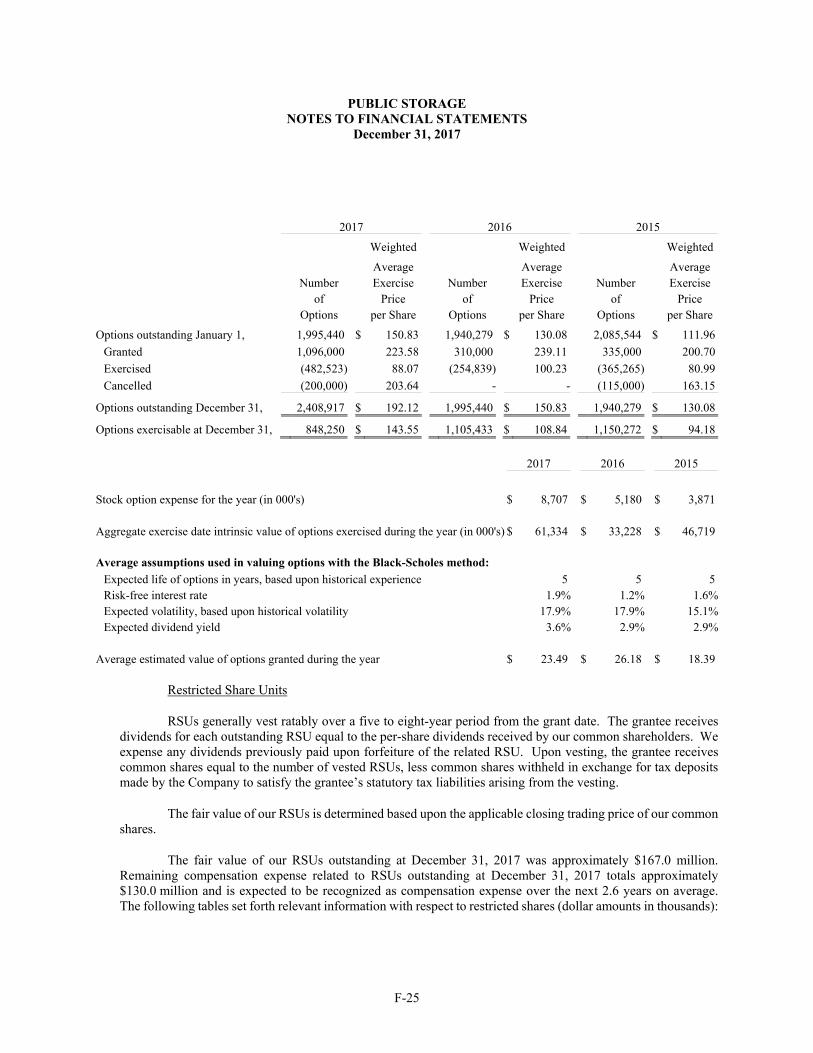
PUBLIC STORAGE NOTES TO FINANCIAL STATEMENTS
December 31, 2017
F-25
2017 2016 2015
Weighted Weighted Weighted
Average Average Average Number Exercise Number Exercise Number Exercise of Price of Price of Price Options per Share Options per Share Options per Share
Options outstanding January 1, 1,995,440 $ 150.83 1,940,279 $ 130.08 2,085,544 $ 111.96
Granted 1,096,000 223.58 310,000 239.11 335,000 200.70
Exercised (482,523) 88.07 (254,839) 100.23 (365,265) 80.99
Cancelled (200,000) 203.64 - - (115,000) 163.15
Options outstanding December 31, 2,408,917 $ 192.12 1,995,440 $ 150.83 1,940,279 $ 130.08
Options exercisable at December 31, 848,250 $ 143.55 1,105,433 $ 108.84 1,150,272 $ 94.18
2017 2016 2015
Stock option expense for the year (in 000's) $ 8,707 $ 5,180 $ 3,871 Aggregate exercise date intrinsic value of options exercised during the year (in 000's) $ 61,334 $ 33,228 $ 46,719 Average assumptions used in valuing options with the Black-Scholes method:
Expected life of options in years, based upon historical experience 5 5 5 Risk-free interest rate 1.9% 1.2% 1.6%Expected volatility, based upon historical volatility 17.9% 17.9% 15.1%Expected dividend yield 3.6% 2.9% 2.9%
Average estimated value of options granted during the year $ 23.49 $ 26.18 $ 18.39
Restricted Share Units
RSUs generally vest ratably over a five to eight-year period from the grant date. The grantee receives dividends for each outstanding RSU equal to the per-share dividends received by our common shareholders. We expense any dividends previously paid upon forfeiture of the related RSU. Upon vesting, the grantee receives common shares equal to the number of vested RSUs, less common shares withheld in exchange for tax deposits made by the Company to satisfy the grantee’s statutory tax liabilities arising from the vesting.
The fair value of our RSUs is determined based upon the applicable closing trading price of our common shares.
The fair value of our RSUs outstanding at December 31, 2017 was approximately $167.0 million. Remaining compensation expense related to RSUs outstanding at December 31, 2017 totals approximately $130.0 million and is expected to be recognized as compensation expense over the next 2.6 years on average. The following tables set forth relevant information with respect to restricted shares (dollar amounts in thousands):
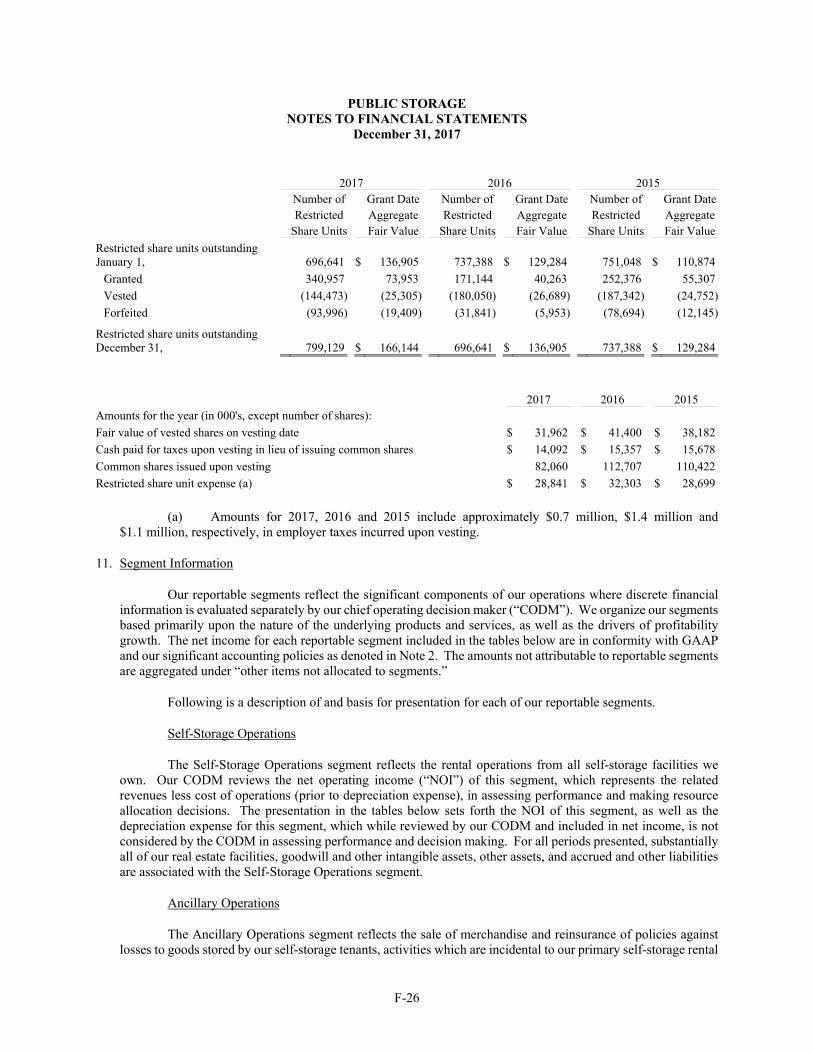
PUBLIC STORAGE NOTES TO FINANCIAL STATEMENTS
December 31, 2017
F-26
2017 2016 2015 Number of Grant Date Number of Grant Date Number of Grant Date Restricted Aggregate Restricted Aggregate Restricted Aggregate Share Units Fair Value Share Units Fair Value Share Units Fair Value
Restricted share units outstanding January 1, 696,641 $ 136,905 737,388 $ 129,284 751,048 $ 110,874
Granted 340,957 73,953 171,144 40,263 252,376 55,307
Vested (144,473) (25,305) (180,050) (26,689) (187,342) (24,752)
Forfeited (93,996) (19,409) (31,841) (5,953) (78,694) (12,145)
Restricted share units outstanding December 31, 799,129 $ 166,144 696,641 $ 136,905 737,388 $ 129,284
2017 2016 2015 Amounts for the year (in 000's, except number of shares): Fair value of vested shares on vesting date $ 31,962 $ 41,400 $ 38,182
Cash paid for taxes upon vesting in lieu of issuing common shares $ 14,092 $ 15,357 $ 15,678
Common shares issued upon vesting 82,060 112,707 110,422
Restricted share unit expense (a) $ 28,841 $ 32,303 $ 28,699
(a) Amounts for 2017, 2016 and 2015 include approximately $0.7 million, $1.4 million and $1.1 million, respectively, in employer taxes incurred upon vesting.
11. Segment Information
Our reportable segments reflect the significant components of our operations where discrete financial information is evaluated separately by our chief operating decision maker (“CODM”). We organize our segments based primarily upon the nature of the underlying products and services, as well as the drivers of profitability growth. The net income for each reportable segment included in the tables below are in conformity with GAAP and our significant accounting policies as denoted in Note 2. The amounts not attributable to reportable segments are aggregated under “other items not allocated to segments.”
Following is a description of and basis for presentation for each of our reportable segments.
Self-Storage Operations
The Self-Storage Operations segment reflects the rental operations from all self-storage facilities we own. Our CODM reviews the net operating income (“NOI”) of this segment, which represents the related revenues less cost of operations (prior to depreciation expense), in assessing performance and making resource allocation decisions. The presentation in the tables below sets forth the NOI of this segment, as well as the depreciation expense for this segment, which while reviewed by our CODM and included in net income, is not considered by the CODM in assessing performance and decision making. For all periods presented, substantially all of our real estate facilities, goodwill and other intangible assets, other assets, and accrued and other liabilities are associated with the Self-Storage Operations segment.
Ancillary Operations
The Ancillary Operations segment reflects the sale of merchandise and reinsurance of policies against losses to goods stored by our self-storage tenants, activities which are incidental to our primary self-storage rental

PUBLIC STORAGE NOTES TO FINANCIAL STATEMENTS
December 31, 2017
F-27
activities. Our CODM reviews the NOI of these operations in assessing performance and making resource allocation decisions.
Investment in PSB
This segment represents our 42% equity interest in PSB, a publicly-traded REIT that owns, operates, acquires and develops commercial properties, primarily multi-tenant flex, office, and industrial space. PSB has a separate management team that makes its financing, capital allocation, and other significant decisions. In making resource allocation decisions with respect to our investment in PSB, the CODM reviews PSB’s net income, which is detailed in PSB’s periodic filings with the SEC, and is included in Note 4. The segment presentation in the tables below includes our equity earnings from PSB.
Investment in Shurgard Europe
This segment represents our 49% equity interest in Shurgard Europe, which owns and operates self-storage facilities located in seven countries in Western Europe. Shurgard Europe has a separate management team reporting to our CODM and our joint venture partner. In making resource allocation decisions with respect to our investment in Shurgard Europe, the CODM reviews Shurgard Europe’s net income, which is detailed in Note 4. The segment presentation below includes our equity earnings from Shurgard Europe.
Presentation of Segment Information
The following tables reconcile NOI (as applicable) and net income of each segment to our consolidated net income (amounts in thousands):

PUBLIC STORAGE NOTES TO FINANCIAL STATEMENTS
December 31, 2017
F-28
For the year ended December 31, 2017
Self-Storage Operations
Ancillary Operations
Investment in PSB
Investment in
Shurgard Europe
Other Items Not
Allocated to Segments Total
(Amounts in thousands)
Revenues:
Self-storage operations $ 2,512,433 $ - $ - $ - $ - $ 2,512,433
Ancillary operations - 156,095 - - - 156,095
2,512,433 156,095 - - - 2,668,528
Cost of operations:
Self-storage operations 657,633 - - - - 657,633
Ancillary operations - 50,345 - - - 50,345
657,633 50,345 - - - 707,978
Net operating income:
Self-storage operations 1,854,800 - - - - 1,854,800
Ancillary operations - 105,750 - - - 105,750
1,854,800 105,750 - - - 1,960,550
Other components of net income (loss):
Depreciation and amortization (454,526) - - - - (454,526)
General and administrative - - - - (82,882) (82,882)
Interest and other income - - - - 18,771 18,771
Interest expense - - - - (12,690) (12,690)
Equity in earnings of
unconsolidated real estate entities - - 46,544 25,948 3,163 75,655
Foreign currency exchange loss - - - - (50,045) (50,045)
Casualty loss - - - - (7,789) (7,789)
Gain on real estate investment sales - - - - 1,421 1,421
Net income (loss) $ 1,400,274 $ 105,750 $ 46,544 $ 25,948 $ (130,051) $ 1,448,465
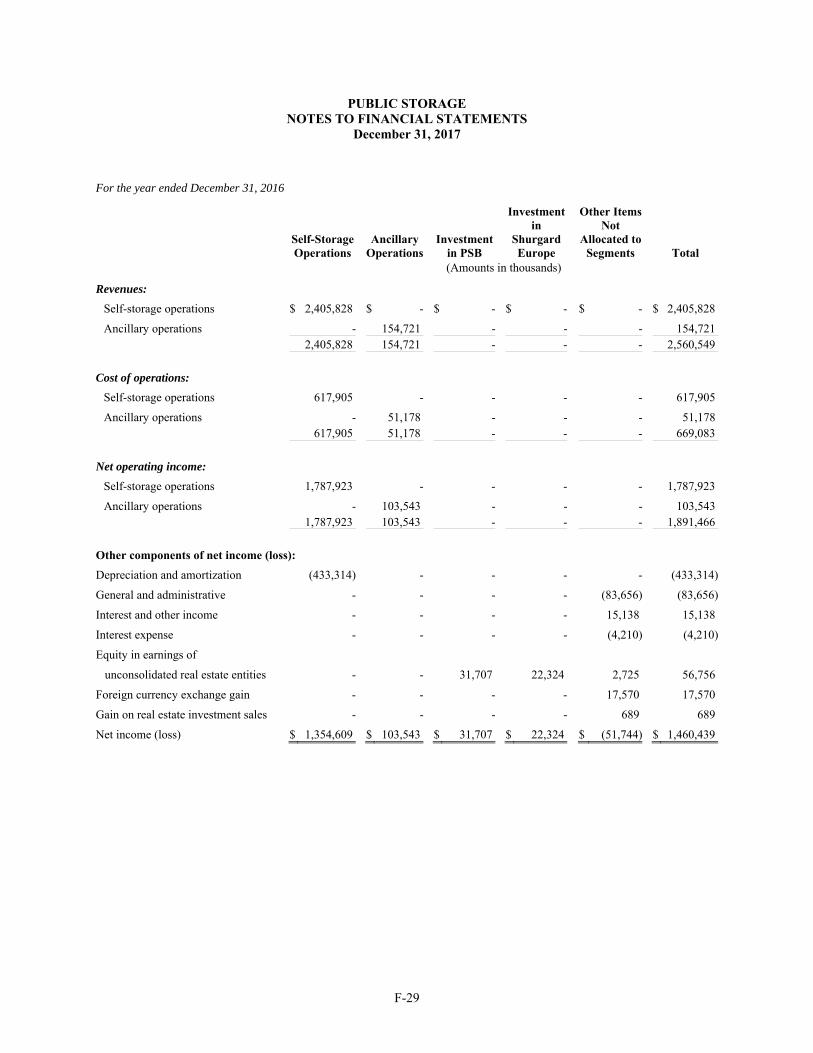
PUBLIC STORAGE NOTES TO FINANCIAL STATEMENTS
December 31, 2017
F-29
For the year ended December 31, 2016
Self-Storage Operations
Ancillary Operations
Investment in PSB
Investment in
Shurgard Europe
Other Items Not
Allocated to Segments Total
(Amounts in thousands)
Revenues:
Self-storage operations $ 2,405,828 $ - $ - $ - $ - $ 2,405,828
Ancillary operations - 154,721 - - - 154,721 2,405,828 154,721 - - - 2,560,549
Cost of operations:
Self-storage operations 617,905 - - - - 617,905
Ancillary operations - 51,178 - - - 51,178 617,905 51,178 - - - 669,083
Net operating income:
Self-storage operations 1,787,923 - - - - 1,787,923
Ancillary operations - 103,543 - - - 103,543 1,787,923 103,543 - - - 1,891,466
Other components of net income (loss):
Depreciation and amortization (433,314) - - - - (433,314)
General and administrative - - - - (83,656) (83,656)
Interest and other income - - - - 15,138 15,138
Interest expense - - - - (4,210) (4,210)
Equity in earnings of
unconsolidated real estate entities - - 31,707 22,324 2,725 56,756
Foreign currency exchange gain - - - - 17,570 17,570
Gain on real estate investment sales - - - - 689 689
Net income (loss) $ 1,354,609 $ 103,543 $ 31,707 $ 22,324 $ (51,744) $ 1,460,439

PUBLIC STORAGE NOTES TO FINANCIAL STATEMENTS
December 31, 2017
F-30
For the year ended December 31, 2015
Self-Storage Operations
Ancillary Operations
Investment in PSB
Investment in
Shurgard Europe
Other Items Not
Allocated to Segments Total
(Amounts in thousands)
Revenues:
Self-storage operations $ 2,235,525 $ - $ - $ - $ - $ 2,235,525
Ancillary operations - 146,171 - - - 146,171
2,235,525 146,171 - - - 2,381,696
Cost of operations:
Self-storage operations 586,696 - - - - 586,696
Ancillary operations - 48,806 - - - 48,806
586,696 48,806 - - - 635,502
Net operating income:
Self-storage operations 1,648,829 - - - - 1,648,829
Ancillary operations - 97,365 - - - 97,365
1,648,829 97,365 - - - 1,746,194
Other components of net income (loss):
Depreciation and amortization (426,008) - - - - (426,008)
General and administrative - - - - (88,177) (88,177)
Interest and other income - - - - 16,544 16,544
Interest expense - - - - (610) (610)
Equity in earnings of
unconsolidated real estate entities - - 34,155 14,272 2,510 50,937
Foreign currency exchange gain - - - - 306 306
Gain on real estate investment sales - - - - 18,503 18,503
Net income (loss) $ 1,222,821 $ 97,365 $ 34,155 $ 14,272 $ (50,924) $ 1,317,689
12. Recent Accounting Pronouncements and Guidance
In May 2014, the FASB issued Accounting Standards Update (“ASU”) 2014-09, Revenue from Contracts with Customers (Topic 606), which requires revenue to be based upon the consideration expected from customers for promised goods or services. The FASB also added guidance with respect to the sale of our real estate facilities. The new standards, effective on January 1, 2018, permit either the retrospective or cumulative effects transition method and allowed for early adoption on January 1, 2017. We did not early adopt these new standards. We plan to adopt the new standards in the first quarter of 2018 utilizing the modified retrospective transition method applied to open contracts. We do not believe the new standards will have a material impact on our results of operations or financial condition, primarily because most of our revenue is from rental revenue, which the new standards do not cover, and because we do not provide any material products and services to our customers or sell material amounts of our real estate facilities.

PUBLIC STORAGE NOTES TO FINANCIAL STATEMENTS
December 31, 2017
F-31
In February 2016, the FASB issued ASU 2016-02, Leases, which amends the existing accounting standards for lease accounting, including requiring lessees to recognize most leases on their balance sheets and making targeted changes to lessor accounting. The new standard, effective on January 1, 2019, requires a modified retrospective transition approach for all leases existing at, or entered into after, the date of initial application, with an option to use certain transition relief and allows for early adoption on January 1, 2016. The Company is currently assessing the impact of the guidance on our financial statements. However, we do not believe this standard will have a material impact on our results of operations or financial condition, because substantially all of our lease revenues are derived from month-to-month self-storage leases, and we do not have material amounts of lease expense.
In August 2016, the FASB issued ASU No. 2016-15, Statement of Cash Flows – Classification of Certain Cash Receipts and Cash Payments. The new standard provides guidance on certain specific cash flow issues, including the treatment of distributions received from equity method investees. The standard is effective for periods beginning after December 15, 2017, with early adoption permitted and shall be applied retrospectively where practicable. We adopted the new guidance effective January 1, 2017 and elected to use the cumulative earnings approach, whereby distributions up to the amount of cumulative equity in earnings recognized are treated as returns on investment and amounts in excess are reflected as returns of investment. The adoption of the cumulative earnings approach had no impact on our consolidated financial statements for the periods presented.
In November 2016, the FASB issued ASU No. 2016-18, Statement of Cash Flows (Topic 230) - Restricted Cash, which primarily requires the statement of cash flows to explain not only the change in cash and equivalents, but also the change in restricted cash. The standard is effective on January 1, 2018, with early adoption permitted and requires the use of the retrospective transition method. The Company early adopted the new guidance during the fourth quarter of 2017 and, accordingly, net cash used in investing activities was adjusted from $716.7 million and $440.1 million in the years ended December 31, 2016 and 2015, respectively, in the previous presentation, to $699.1 million and $456.1 million, respectively, in the current presentation.
13. Commitments and Contingencies
Contingent Losses
We are a party to various legal proceedings and subject to various claims and complaints; however, we believe that the likelihood of these contingencies resulting in a material loss to the Company, either individually or in the aggregate, is remote.
Insurance and Loss Exposure
We have historically carried property, earthquake, general liability, employee medical insurance and workers compensation coverage through internationally recognized insurance carriers, subject to deductibles. Our deductible for general liability is $2.0 million per occurrence. Our annual deductibles for property losses are $25.0 million for first occurrence with an aggregate of $35.0 million for multiple occurrences and $5.0 million per occurrence thereafter. Insurance carriers’ aggregate limits on these policies of $75.0 million for property losses and $102.0 million for general liability losses are higher than estimates of maximum probable losses that could occur from individual catastrophic events determined in recent engineering and actuarial studies; however, in case of multiple catastrophic events, these limits could be exceeded.
We reinsure a program that provides insurance to our customers from an independent third-party insurer. This program covers tenant claims for losses to goods stored at our facilities as a result of specific named perils (earthquakes are not covered by this program), up to a maximum limit of $5,000 per storage unit. We reinsure all risks in this program, but purchase insurance to cover this exposure for a limit of $15.0 million for losses in

PUBLIC STORAGE NOTES TO FINANCIAL STATEMENTS
December 31, 2017
F-32
excess of $5.0 million per occurrence. We are subject to licensing requirements and regulations in several states. Customers participate in the program at their option. At December 31, 2017, there were approximately 900,000 certificates held by our self-storage customers, representing aggregate coverage of approximately $2.8 billion.
Construction Commitments
We have construction commitments representing future expected payments for construction under contract totaling $159.8 million at December 31, 2017. We expect to pay approximately $127.8 million in 2018 and $32.0 million in 2019 for these construction commitments.
14. Supplementary Quarterly Financial Data (unaudited)
Three Months Ended March 31, June 30, September 30, December 31, 2017 2017 2017 2017 (Amounts in thousands, except per share data)
Self-storage and ancillary revenues $ 645,547 $ 664,312 $ 686,361 $ 672,308
Self-storage and ancillary cost of operations $ 182,902 $ 182,578 $ 190,619 $ 151,879
Depreciation and amortization $ 110,929 $ 110,177 $ 113,320 $ 120,100
Net Income $ 344,021 $ 355,207 $ 358,274 $ 390,963
Per Common Share Net income - Basic $ 1.62 $ 1.59 $ 1.61 $ 1.92
Net income - Diluted $ 1.62 $ 1.59 $ 1.61 $ 1.92
Three Months Ended March 31, June 30, September 30, December 31, 2016 2016 2016 2016 (Amounts in thousands, except per share data)
Self-storage and ancillary revenues $ 611,786 $ 634,188 $ 663,148 $ 651,427
Self-storage and ancillary cost of operations $ 173,286 $ 172,004 $ 178,627 $ 145,166
Depreciation and amortization $ 105,128 $ 107,013 $ 109,432 $ 111,741
Net Income $ 317,349 $ 358,359 $ 369,050 $ 415,681
Per Common Share Net income - Basic $ 1.40 $ 1.62 $ 1.78 $ 2.04
Net income - Diluted $ 1.39 $ 1.61 $ 1.78 $ 2.03
15. Subsequent Events
Subsequent to December 31, 2017, we acquired or were under contract to acquire two self-storage facilities (one each in Tennessee and Nebraska) with 181,000 net rentable square feet, for $18.3 million.
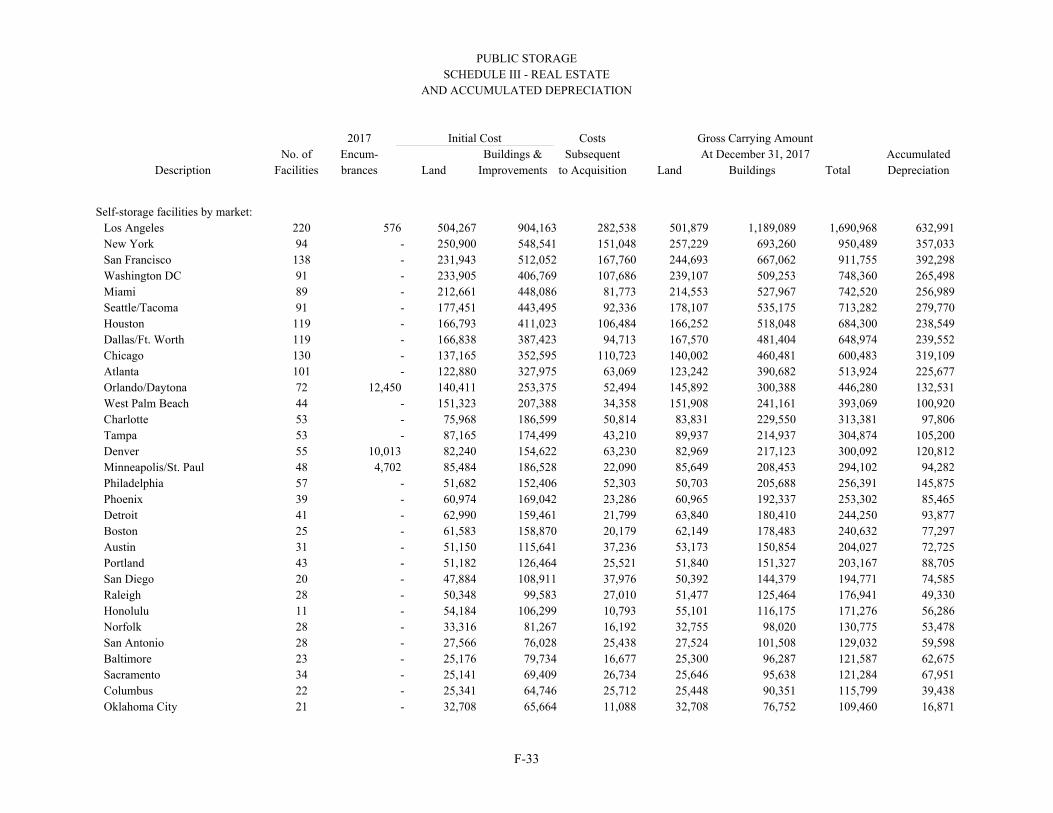
PUBLIC STORAGE SCHEDULE III - REAL ESTATE
AND ACCUMULATED DEPRECIATION 2017 Initial Cost Costs Gross Carrying Amount No. of Encum- Buildings & Subsequent At December 31, 2017 Accumulated
Description Facilities brances Land Improvements to Acquisition Land Buildings Total Depreciation
F-33
Self-storage facilities by market: Los Angeles 220 576 504,267 904,163 282,538 501,879 1,189,089 1,690,968 632,991 New York 94 - 250,900 548,541 151,048 257,229 693,260 950,489 357,033 San Francisco 138 - 231,943 512,052 167,760 244,693 667,062 911,755 392,298 Washington DC 91 - 233,905 406,769 107,686 239,107 509,253 748,360 265,498 Miami 89 - 212,661 448,086 81,773 214,553 527,967 742,520 256,989 Seattle/Tacoma 91 - 177,451 443,495 92,336 178,107 535,175 713,282 279,770 Houston 119 - 166,793 411,023 106,484 166,252 518,048 684,300 238,549 Dallas/Ft. Worth 119 - 166,838 387,423 94,713 167,570 481,404 648,974 239,552 Chicago 130 - 137,165 352,595 110,723 140,002 460,481 600,483 319,109 Atlanta 101 - 122,880 327,975 63,069 123,242 390,682 513,924 225,677 Orlando/Daytona 72 12,450 140,411 253,375 52,494 145,892 300,388 446,280 132,531 West Palm Beach 44 - 151,323 207,388 34,358 151,908 241,161 393,069 100,920 Charlotte 53 - 75,968 186,599 50,814 83,831 229,550 313,381 97,806 Tampa 53 - 87,165 174,499 43,210 89,937 214,937 304,874 105,200 Denver 55 10,013 82,240 154,622 63,230 82,969 217,123 300,092 120,812 Minneapolis/St. Paul 48 4,702 85,484 186,528 22,090 85,649 208,453 294,102 94,282 Philadelphia 57 - 51,682 152,406 52,303 50,703 205,688 256,391 145,875 Phoenix 39 - 60,974 169,042 23,286 60,965 192,337 253,302 85,465 Detroit 41 - 62,990 159,461 21,799 63,840 180,410 244,250 93,877 Boston 25 - 61,583 158,870 20,179 62,149 178,483 240,632 77,297 Austin 31 - 51,150 115,641 37,236 53,173 150,854 204,027 72,725 Portland 43 - 51,182 126,464 25,521 51,840 151,327 203,167 88,705 San Diego 20 - 47,884 108,911 37,976 50,392 144,379 194,771 74,585 Raleigh 28 - 50,348 99,583 27,010 51,477 125,464 176,941 49,330 Honolulu 11 - 54,184 106,299 10,793 55,101 116,175 171,276 56,286 Norfolk 28 - 33,316 81,267 16,192 32,755 98,020 130,775 53,478 San Antonio 28 - 27,566 76,028 25,438 27,524 101,508 129,032 59,598 Baltimore 23 - 25,176 79,734 16,677 25,300 96,287 121,587 62,675 Sacramento 34 - 25,141 69,409 26,734 25,646 95,638 121,284 67,951 Columbus 22 - 25,341 64,746 25,712 25,448 90,351 115,799 39,438 Oklahoma City 21 - 32,708 65,664 11,088 32,708 76,752 109,460 16,871
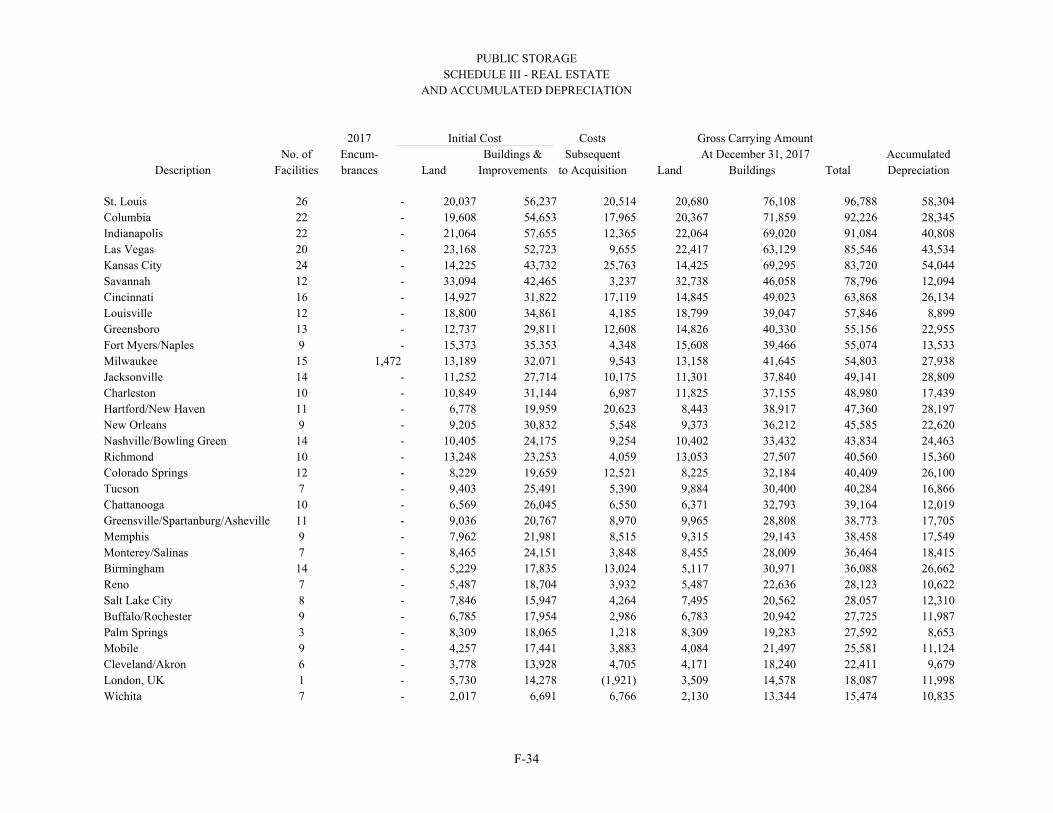
PUBLIC STORAGE SCHEDULE III - REAL ESTATE
AND ACCUMULATED DEPRECIATION 2017 Initial Cost Costs Gross Carrying Amount No. of Encum- Buildings & Subsequent At December 31, 2017 Accumulated
Description Facilities brances Land Improvements to Acquisition Land Buildings Total Depreciation
F-34
St. Louis 26 - 20,037 56,237 20,514 20,680 76,108 96,788 58,304 Columbia 22 - 19,608 54,653 17,965 20,367 71,859 92,226 28,345 Indianapolis 22 - 21,064 57,655 12,365 22,064 69,020 91,084 40,808 Las Vegas 20 - 23,168 52,723 9,655 22,417 63,129 85,546 43,534 Kansas City 24 - 14,225 43,732 25,763 14,425 69,295 83,720 54,044 Savannah 12 - 33,094 42,465 3,237 32,738 46,058 78,796 12,094 Cincinnati 16 - 14,927 31,822 17,119 14,845 49,023 63,868 26,134 Louisville 12 - 18,800 34,861 4,185 18,799 39,047 57,846 8,899 Greensboro 13 - 12,737 29,811 12,608 14,826 40,330 55,156 22,955 Fort Myers/Naples 9 - 15,373 35,353 4,348 15,608 39,466 55,074 13,533 Milwaukee 15 1,472 13,189 32,071 9,543 13,158 41,645 54,803 27,938 Jacksonville 14 - 11,252 27,714 10,175 11,301 37,840 49,141 28,809 Charleston 10 - 10,849 31,144 6,987 11,825 37,155 48,980 17,439 Hartford/New Haven 11 - 6,778 19,959 20,623 8,443 38,917 47,360 28,197 New Orleans 9 - 9,205 30,832 5,548 9,373 36,212 45,585 22,620 Nashville/Bowling Green 14 - 10,405 24,175 9,254 10,402 33,432 43,834 24,463 Richmond 10 - 13,248 23,253 4,059 13,053 27,507 40,560 15,360 Colorado Springs 12 - 8,229 19,659 12,521 8,225 32,184 40,409 26,100 Tucson 7 - 9,403 25,491 5,390 9,884 30,400 40,284 16,866 Chattanooga 10 - 6,569 26,045 6,550 6,371 32,793 39,164 12,019 Greensville/Spartanburg/Asheville 11 - 9,036 20,767 8,970 9,965 28,808 38,773 17,705 Memphis 9 - 7,962 21,981 8,515 9,315 29,143 38,458 17,549 Monterey/Salinas 7 - 8,465 24,151 3,848 8,455 28,009 36,464 18,415 Birmingham 14 - 5,229 17,835 13,024 5,117 30,971 36,088 26,662 Reno 7 - 5,487 18,704 3,932 5,487 22,636 28,123 10,622 Salt Lake City 8 - 7,846 15,947 4,264 7,495 20,562 28,057 12,310 Buffalo/Rochester 9 - 6,785 17,954 2,986 6,783 20,942 27,725 11,987 Palm Springs 3 - 8,309 18,065 1,218 8,309 19,283 27,592 8,653 Mobile 9 - 4,257 17,441 3,883 4,084 21,497 25,581 11,124 Cleveland/Akron 6 - 3,778 13,928 4,705 4,171 18,240 22,411 9,679 London, UK 1 - 5,730 14,278 (1,921) 3,509 14,578 18,087 11,998 Wichita 7 - 2,017 6,691 6,766 2,130 13,344 15,474 10,835

PUBLIC STORAGE SCHEDULE III - REAL ESTATE
AND ACCUMULATED DEPRECIATION 2017 Initial Cost Costs Gross Carrying Amount No. of Encum- Buildings & Subsequent At December 31, 2017 Accumulated
Description Facilities brances Land Improvements to Acquisition Land Buildings Total Depreciation
F-35
Santa Barbara 2 - 5,733 9,106 338 5,733 9,444 15,177 4,730 Providence 3 - 995 11,206 2,684 995 13,890 14,885 5,252 Dayton 5 - 1,074 8,975 4,642 1,073 13,618 14,691 6,073 Evansville 4 - 1,826 8,445 1,093 1,798 9,566 11,364 2,690 Augusta 4 - 1,793 5,990 2,242 1,793 8,232 10,025 5,235 Huntsville/Decatur 3 - 1,024 3,321 2,963 971 6,337 7,308 5,822 Fort Wayne 3 - 349 3,594 3,073 349 6,667 7,016 5,733 Springfield/Holyoke 2 - 1,428 3,380 1,709 1,427 5,090 6,517 4,121 Shreveport 2 - 817 3,030 2,221 741 5,327 6,068 4,184 Rochester 2 - 1,047 2,246 1,695 980 4,008 4,988 3,571 Lansing 2 - 556 2,882 806 556 3,688 4,244 1,887 Flint 1 - 543 3,068 180 542 3,249 3,791 1,579 Topeka 2 - 225 1,419 1,756 225 3,175 3,400 2,737 Roanoke 1 - 819 1,776 569 819 2,345 3,164 2,058 Syracuse 1 - 545 1,279 744 545 2,023 2,568 1,818 Omaha 1 - 109 806 1,398 109 2,204 2,313 1,779 Joplin 1 - 264 904 939 264 1,843 2,107 1,468 Modesto/Fresno/Stockton 1 - 44 206 962 193 1,019 1,212 648
Commercial and non-operating real estate - 11,517 26,939 24,091 12,545 50,002 62,547 39,773 $29,213 $3,886,388 $8,544,627 $2,234,974 $3,947,123 $10,718,866 $14,665,989 $5,700,331 Note: Buildings and improvements are depreciated on a straight-line basis over estimated useful lives ranging generally between 5 to 25 years.
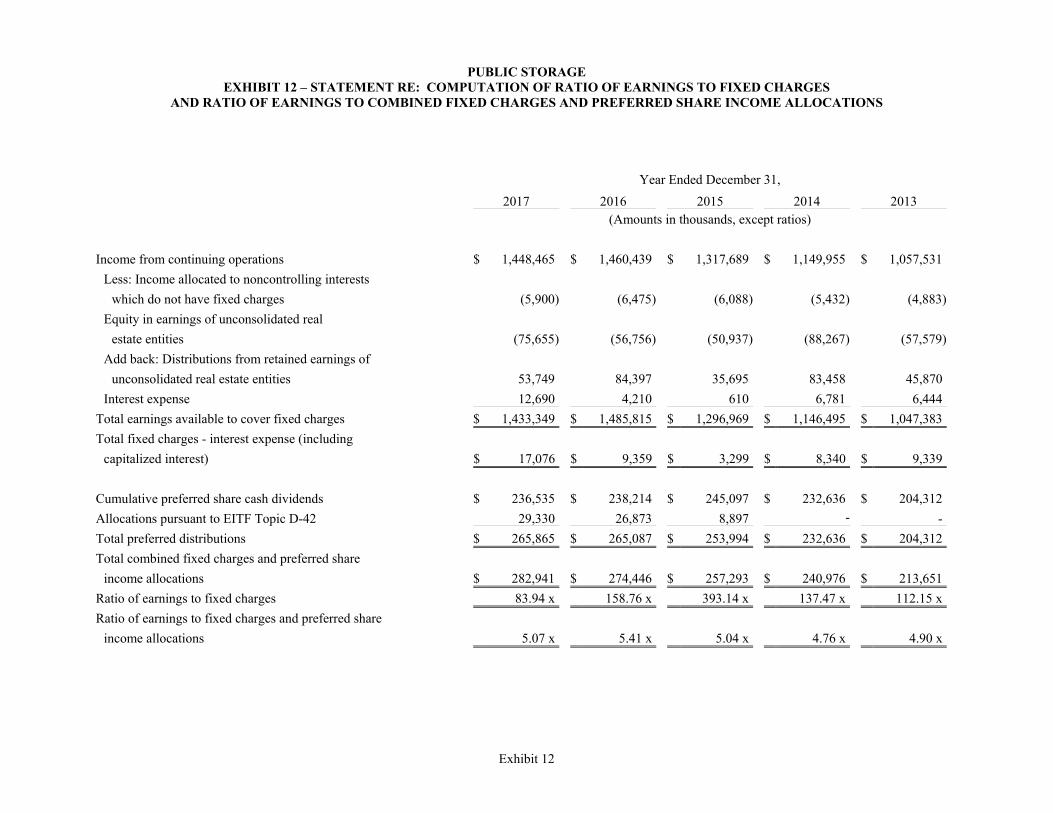
PUBLIC STORAGE EXHIBIT 12 – STATEMENT RE: COMPUTATION OF RATIO OF EARNINGS TO FIXED CHARGES
AND RATIO OF EARNINGS TO COMBINED FIXED CHARGES AND PREFERRED SHARE INCOME ALLOCATIONS
Exhibit 12
Year Ended December 31,
2017 2016 2015 2014 2013 (Amounts in thousands, except ratios)
Income from continuing operations $ 1,448,465 $ 1,460,439 $ 1,317,689 $ 1,149,955 $ 1,057,531
Less: Income allocated to noncontrolling interests
which do not have fixed charges (5,900) (6,475) (6,088) (5,432) (4,883)
Equity in earnings of unconsolidated real
estate entities (75,655) (56,756) (50,937) (88,267) (57,579)
Add back: Distributions from retained earnings of
unconsolidated real estate entities 53,749 84,397 35,695 83,458 45,870
Interest expense 12,690 4,210 610 6,781 6,444
Total earnings available to cover fixed charges $ 1,433,349 $ 1,485,815 $ 1,296,969 $ 1,146,495 $ 1,047,383
Total fixed charges - interest expense (including
capitalized interest) $ 17,076 $ 9,359 $ 3,299 $ 8,340 $ 9,339
Cumulative preferred share cash dividends $ 236,535 $ 238,214 $ 245,097 $ 232,636 $ 204,312
Allocations pursuant to EITF Topic D-42 29,330 26,873 8,897 ‐ -
Total preferred distributions $ 265,865 $ 265,087 $ 253,994 $ 232,636 $ 204,312
Total combined fixed charges and preferred share
income allocations $ 282,941 $ 274,446 $ 257,293 $ 240,976 $ 213,651
Ratio of earnings to fixed charges 83.94 x 158.76 x 393.14 x 137.47 x 112.15 x
Ratio of earnings to fixed charges and preferred share
income allocations 5.07 x 5.41 x 5.04 x 4.76 x 4.90 x
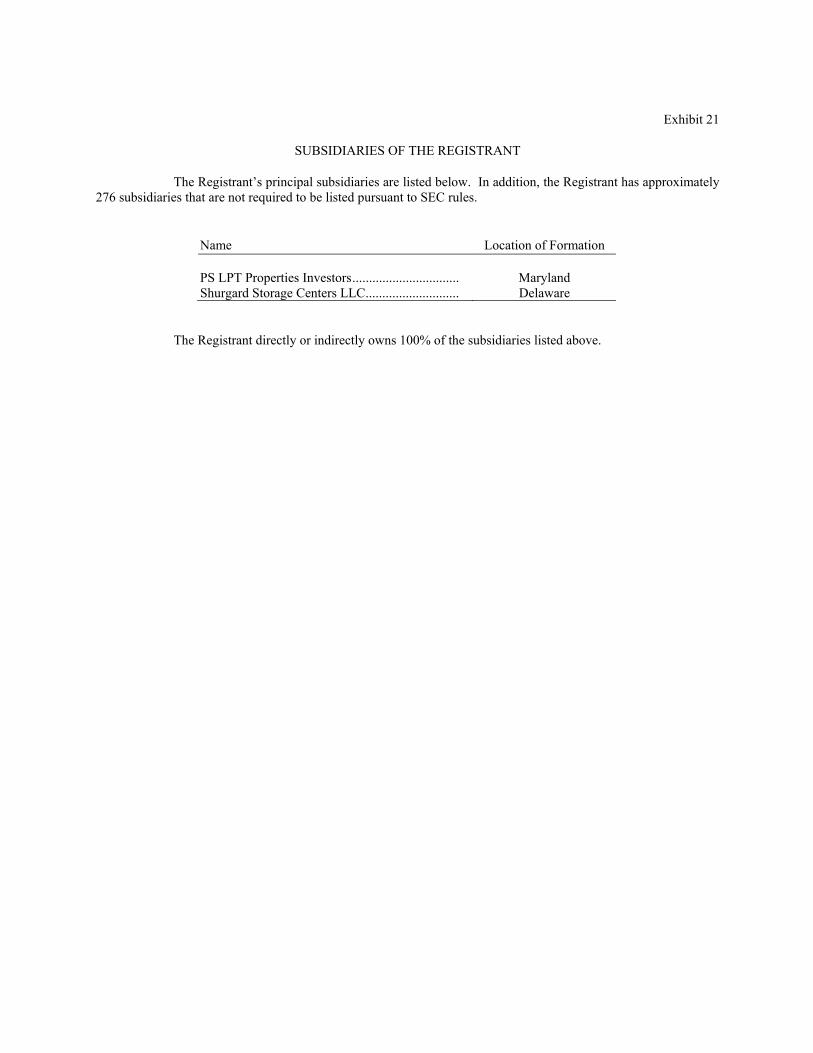
Exhibit 21
SUBSIDIARIES OF THE REGISTRANT
The Registrant’s principal subsidiaries are listed below. In addition, the Registrant has approximately 276 subsidiaries that are not required to be listed pursuant to SEC rules.
Name Location of Formation PS LPT Properties Investors ................................ Maryland Shurgard Storage Centers LLC ............................ Delaware
The Registrant directly or indirectly owns 100% of the subsidiaries listed above.

Exhibit 23.1
Consent of Independent Registered Public Accounting Firm
We consent to the incorporation by reference in the following Registration Statements:
(1) Registration Statement on Form S-3ASR, as amended, (No. 333-211758) and related prospectus,
(2) Registration Statement on Form S-8 (No. 333-210937) and related prospectus of Public Storage for the registration of common shares of beneficial interest pertaining to the Public Storage 2016 Equity and Performance-Based Incentive Compensation Plan,
(3) Registration Statement on Form S-8 (No. 333-195646) and related prospectus of Public Storage for the registration of common shares of beneficial interest pertaining to the Public Storage 2007 Equity and Performance-Based Incentive Compensation Plan as Amended, and
(4) Registration Statement on Form S-8 (No.333-144907) and related prospectus of Public Storage for the registration of common shares of beneficial interest pertaining to the Public Storage 2007 Equity and Performance-Based Incentive Compensation Plan;
of our reports dated February 28, 2018, with respect to the consolidated financial statements and schedule of Public Storage and the effectiveness of internal control over financial reporting of Public Storage included in this Annual Report (Form 10-K) of Public Storage for the year ended December 31, 2017.
/s/ ERNST & YOUNG LLP
February 28, 2018 Los Angeles, California
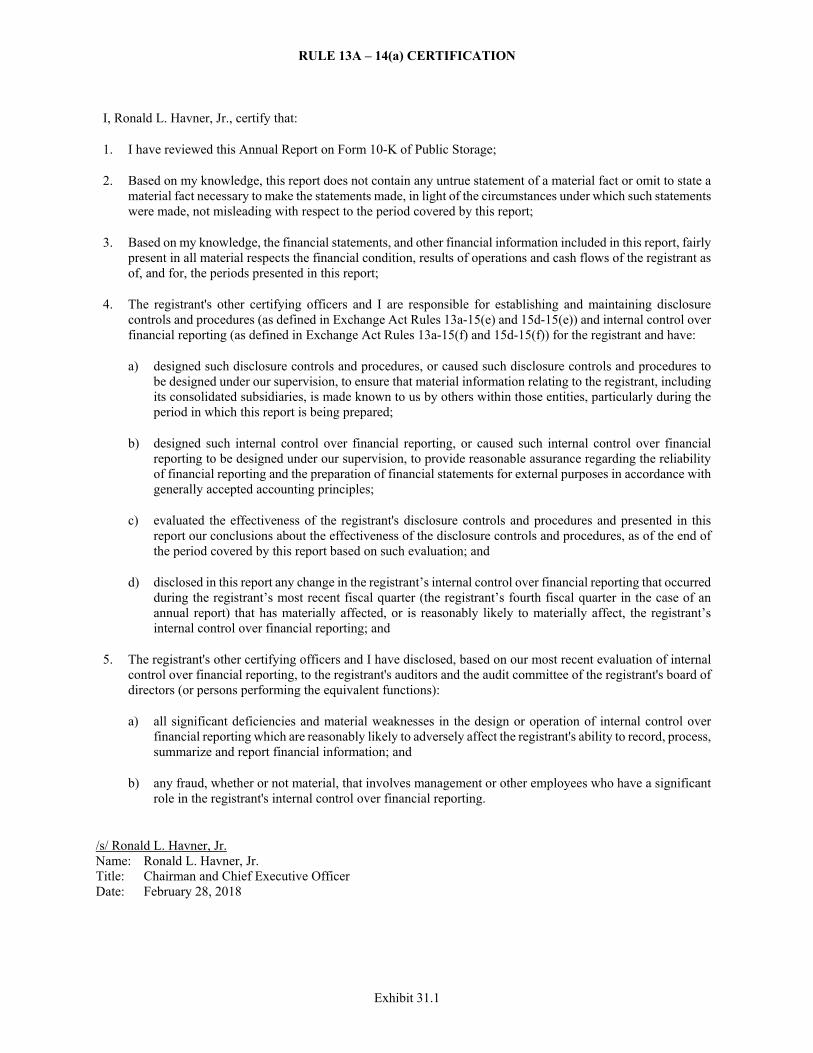
RULE 13A – 14(a) CERTIFICATION
Exhibit 31.1
I, Ronald L. Havner, Jr., certify that:
1. I have reviewed this Annual Report on Form 10-K of Public Storage;
2. Based on my knowledge, this report does not contain any untrue statement of a material fact or omit to state a material fact necessary to make the statements made, in light of the circumstances under which such statements were made, not misleading with respect to the period covered by this report;
3. Based on my knowledge, the financial statements, and other financial information included in this report, fairly present in all material respects the financial condition, results of operations and cash flows of the registrant as of, and for, the periods presented in this report;
4. The registrant's other certifying officers and I are responsible for establishing and maintaining disclosure controls and procedures (as defined in Exchange Act Rules 13a-15(e) and 15d-15(e)) and internal control over financial reporting (as defined in Exchange Act Rules 13a-15(f) and 15d-15(f)) for the registrant and have:
a) designed such disclosure controls and procedures, or caused such disclosure controls and procedures to be designed under our supervision, to ensure that material information relating to the registrant, including its consolidated subsidiaries, is made known to us by others within those entities, particularly during the period in which this report is being prepared;
b) designed such internal control over financial reporting, or caused such internal control over financial reporting to be designed under our supervision, to provide reasonable assurance regarding the reliability of financial reporting and the preparation of financial statements for external purposes in accordance with generally accepted accounting principles;
c) evaluated the effectiveness of the registrant's disclosure controls and procedures and presented in this report our conclusions about the effectiveness of the disclosure controls and procedures, as of the end of the period covered by this report based on such evaluation; and
d) disclosed in this report any change in the registrant’s internal control over financial reporting that occurred during the registrant’s most recent fiscal quarter (the registrant’s fourth fiscal quarter in the case of an annual report) that has materially affected, or is reasonably likely to materially affect, the registrant’s internal control over financial reporting; and
5. The registrant's other certifying officers and I have disclosed, based on our most recent evaluation of internal control over financial reporting, to the registrant's auditors and the audit committee of the registrant's board of directors (or persons performing the equivalent functions):
a) all significant deficiencies and material weaknesses in the design or operation of internal control over financial reporting which are reasonably likely to adversely affect the registrant's ability to record, process, summarize and report financial information; and
b) any fraud, whether or not material, that involves management or other employees who have a significant
role in the registrant's internal control over financial reporting.
/s/ Ronald L. Havner, Jr. Name: Ronald L. Havner, Jr. Title: Chairman and Chief Executive Officer Date: February 28, 2018

RULE 13A – 14(a) CERTIFICATION
Exhibit 31.2
I, John Reyes, certify that:
1. I have reviewed this Annual Report on Form 10-K of Public Storage;
2. Based on my knowledge, this report does not contain any untrue statement of a material fact or omit to state a material fact necessary to make the statements made, in light of the circumstances under which such statements were made, not misleading with respect to the period covered by this report;
3. Based on my knowledge, the financial statements, and other financial information included in this report, fairly present in all material respects the financial condition, results of operations and cash flows of the registrant as of, and for, the periods presented in this report;
4. The registrant's other certifying officers and I are responsible for establishing and maintaining disclosure controls and procedures (as defined in Exchange Act Rules 13a-15(e) and 15d-15(e)) and internal control over financial reporting (as defined in Exchange Act Rules 13a-15(f) and 15d-15(f)) for the registrant and have:
a) designed such disclosure controls and procedures, or caused such disclosure controls and procedures to be designed under our supervision, to ensure that material information relating to the registrant, including its consolidated subsidiaries, is made known to us by others within those entities, particularly during the period in which this report is being prepared;
b) designed such internal control over financial reporting, or caused such internal control over financial reporting to be designed under our supervision, to provide reasonable assurance regarding the reliability of financial reporting and the preparation of financial statements for external purposes in accordance with generally accepted accounting principles;
c) evaluated the effectiveness of the registrant's disclosure controls and procedures and presented in this report our conclusions about the effectiveness of the disclosure controls and procedures, as of the end of the period covered by this report based on such evaluation; and
d) disclosed in this report any change in the registrant’s internal control over financial reporting that occurred during the registrant’s most recent fiscal quarter (the registrant’s fourth fiscal quarter in the case of an annual report) that has materially affected, or is reasonably likely to materially affect, the registrant’s internal control over financial reporting; and
5. The registrant's other certifying officers and I have disclosed, based on our most recent evaluation of internal control over financial reporting, to the registrant's auditors and the audit committee of the registrant's board of directors (or persons performing the equivalent functions):
a) all significant deficiencies and material weaknesses in the design or operation of internal control over financial reporting which are reasonably likely to adversely affect the registrant's ability to record, process, summarize and report financial information; and
b) any fraud, whether or not material, that involves management or other employees who have a significant role in the registrant's internal control over financial reporting.
/s/ John Reyes Name: John Reyes Title: Chief Financial Officer Date: February 28, 2018
SECTION 1350 CERTIFICATION
Exhibit 32
In connection with the Annual Report on Form 10-K of Public Storage (the “Company”) for the year ended December 31, 2017, as filed with the Securities and Exchange Commission (the “SEC”) on the date hereof (the “Report”), Ronald L. Havner, Jr., as Chairman and Chief Executive Officer of the Company and John Reyes, as Chief Financial Officer of the Company, each hereby certifies, pursuant to 18 U.S.C. §1350, as adopted pursuant to §906 of the Sarbanes-Oxley Act of 2002 (“Sarbanes-Oxley”), that:
(1) The Report fully complies with the requirements of Section 13(a) of the Securities Exchange Act of 1934, as amended (the “Exchange Act”); and
(2) The information contained in the Report fairly presents, in all material respects, the financial condition and results of operations of the Company.
/s/ Ronald L. Havner, Jr. Name: Ronald L. Havner, Jr. Title: Chairman and Chief Executive Officer Date: February 28, 2018
/s/ John Reyes Name: John Reyes Title: Chief Financial Officer Date: February 28, 2018
This certification accompanies the Report pursuant to §906 of Sarbanes-Oxley and shall not, except to the extent required by Sarbanes-Oxley, be deemed filed by the Company for purposes of §18 of the Exchange Act.
A signed original of this written statement required by §906 of Sarbanes-Oxley has been provided to the Company, and will be retained and furnished to the SEC or its staff upon request.