form 10-k walgreen co. - securities and exchange commission
TRANSCRIPT
United StatesSecurities and Exchange Commission
Washington, D.C. 20549
FORM 10-K
For the fiscal year ended August 31, 2007.
For the Transition Period From ____________ to ___________
Commission file number 1-604.
Registrant's telephone number, including area code: (847) 914-2500 Securities registered pursuant to Section 12(b) of the Act:
Securities registered pursuant to section 12(g) of the Act: NoneIndicate by check mark if the registrant is a well-known seasoned issuer, as defined in Rule 405 of the Securities Act. Yes xNo o
Indicate by check mark if the registrant is not required to file reports pursuant to Section 13 or Section 15(d) of the Act. Yes oNo x
Indicate by check mark whether the registrant (1) has filed all reports required to be filed by Section 13 or 15(d) of the Securities Exchange Act of 1934 during the preceding 12 months and (2) has been subject to such filing requirements for the past 90 days.Yes xNo o
Indicate by check mark if disclosure of delinquent filers pursuant to Item 405 of Regulation S-K is not contained herein, and will not be contained, to the best of registrant's knowledge, in definitive proxy or information statements incorporated by reference in Part III of this Form 10-K or any amendment to this Form 10-K. o
Indicate by check mark whether the registrant is a large accelerated filer, an accelerated filer, or a non-accelerated filer. See definition of "accelerated filer and large accelerated filer" in Rule 12b-2 of the Exchange Act. (Check one): Large accelerated filer x Accelerated filer o Non-accelerated filer o
Indicate by check mark whether the registrant is a shell company (as defined in Rule 12b-2 of the Exchange Act).Yes oNo x
As of February 28, 2007, the aggregate market value of Walgreen Co. common stock, par value $.078125 per share, held by non-affiliates (based upon the closing transaction price on the New York Stock Exchange) was approximately $44,357,869,000. As of September 30, 2007, there were 991,615,851 shares of Walgreen Co. common stock outstanding.
DOCUMENTS INCORPORATED BY REFERENCEPortions of the Annual Report to Shareholders for the year ended August 31, 2007, only to the extent expressly so stated herein, are
incorporated by reference into parts I, II and IV of Form 10-K. Portions of the registrant's proxy statement for its 2007 annual meeting of shareholders to be held January 9, 2008, are incorporated by reference into part III of Form 10-K.
x ANNUAL REPORT PURSUANT TO SECTION 13 OR 15(d) OF THE SECURITIES EXCHANGE ACT OF 1934
o TRANSITION REPORT PURSUANT TO SECTION 13 OR 15(d) OF THE SECURITIES EXCHANGE ACT OF 1934
WALGREEN CO.(Exact name of registrant as specified in its charter)
Illinois 36-1924025 (State of incorporation) (I.R.S. Employer Identification No.)
200 Wilmot Road, Deerfield, Illinois 60015(Address of principal executive offices) (Zip Code)
Title of each class Name of each exchange on which registeredCommon Stock ($.078125 Par Value) New York Stock Exchange
The NASDAQ Stock Market LLC Chicago Stock Exchange
PART I
Walgreen Co. (The "company" or "Walgreens") was incorporated as an Illinois corporation in 1909 as a successor to a business founded in 1901. Walgreens is the nation's largest drugstore chain (based on sales) and recorded its 33rd year of consecutive sales and earnings growth. During the year, the company opened or acquired 563 stores for a net increase of 478 stores after relocations and closings, not including 58 locations acquired from Option Care, Inc. The total number of locations at August 31, 2007 was 5,997 located in 48 states and Puerto Rico. Aggressive growth will continue as the company anticipates operating more than 7,000 locations in 2010.
Retail organic growth continues to be our primary growth vehicle, but we carefully consider unique acquisition opportunities when they are a good fit with the existing store base. In 2007, for example, the company acquired Option Care, Inc., a specialty pharmacy and home infusion services provider.
Prescription sales continue to become a larger portion of the company's business. This year prescriptions accounted for 65.0% of sales compared to 64.3% last year. Third party sales, where reimbursement is received from managed care organizations, government and private insurance, were 94.8% of prescription sales compared to 93.1% a year ago. Overall, Walgreens filled approximately 583 million prescriptions in 2007, an increase of 10% from the previous year.
Walgreens pharmacy sales are expected to continue to grow due, in part, to the aging population, the introduction of lower priced generics and the continued development of innovative drugs that improve quality of life and control healthcare costs. Also, the increase in generic introductions continues to boost the number of prescriptions filled. Although generics reduce sales dollars, they save both patients and payors money and generally offer higher gross profit than brand name drugs.
During fiscal 2007, Walgreens' market share in 59 of the top 60 front-end categories increased, as compared to all food, drug and mass
merchandise competitors. Today, 139.1 million people live within two miles of a Walgreens and 5.0 million shoppers walk into a Walgreens store daily.
During fiscal year 2007 the company added $1.8 billion to property and equipment, which included approximately $1.425 billion related to stores, $184.2 million for distribution centers, and $176.5 million related to other corporate items. Capital expenditures for fiscal 2008 are expected to be more than $2.0 billion, excluding acquisitions.
In fiscal 2007, the company opened a distribution center located in Anderson, South Carolina. This is the first of a new-generation of distribution centers, which will increase productivity 20% from the last generation. A second new-generation center in Windsor, Connecticut is planned to open in fiscal 2009.
Walgreens plans to increase business by investing in prime locations, new technology and customer service initiatives in fiscal 2008.
The company is principally in the retail drugstore business and its operations are within one reportable segment.
The drugstores are engaged in the retail sale of prescription and non-prescription drugs and general merchandise. General merchandise includes, among other things, beauty care, personal care, household items, candy, photofinishing, greeting cards, seasonal items and convenience foods. Customers can have prescriptions filled at the drugstore counter, as well as through the mail, by telephone and via the Internet.
Item 1. Business
(a) General development of business.
(b) Financial information about industry segments.
(c) Narrative description of business.
(i) Principal products produced and services rendered.
- 2 -

The estimated contributions of various product classes to sales for each of the last three fiscal years are as follows:
Not applicable.
Inventories are purchased from numerous domestic and foreign suppliers. The loss of any one supplier or group of suppliers under common control would not have a material effect on the business.
Walgreens markets products under various trademarks, trade dress and trade names and holds assorted business licenses (pharmacy, occupational, liquor, etc.) having various lives, which are necessary for the normal operation of business. The company also has filed various patent applications relating to its business and products, eight of which have been issued.
The business is seasonal in nature, with Christmas generating a higher proportion of front-end sales and earnings than other periods. Both prescription and non-prescription drug sales are affected by the timing and severity of the cold/flu season. See the caption "Summary of Quarterly Results (Unaudited)" on page 34 of the Annual Report to Shareholders for the year ended August 31, 2007 ("2007 Annual Report"), which section is incorporated herein by reference.
The company generally finances its inventory and expansion needs with internally generated funds. In 2007, we supplemented cash provided by operations with short-term borrowings. See Note 7, "Short-Term Borrowings" on page 30 and "Management's Discussion and Analysis of Financial Condition" on pages 20 through 23 of the 2007 Annual Report, which sections are incorporated herein by reference.
Due to the nature of the retail drugstore business 94.8% of all prescription sales are now covered by third party payors. Prescription sales represent 65.0% of total store sales. The remainder of store sales are principally for cash, credit and debit cards. Customer returns are immaterial.
Sales are to numerous customers which include various managed care organizations; therefore, the loss of any one customer or a group of customers under common control would not have a material effect on the business. No customer accounts for ten percent or more of the company's consolidated sales.
Product Class Percentage 2007 2006 2005Prescription Drugs 65 64 64Non-prescription Drugs 10 11 11General Merchandise 25 25 25Total Sales 100 100 100
(ii) Status of a product or segment.
(iii) Sources and availability of raw materials.
(iv) Patents, trademarks, licenses, franchises and concessions held.
(v) Seasonal variations in business.
(vi) Working capital practices.
(vii) Dependence upon limited number of customers.
- 3 -

Not applicable.
The company fills prescriptions for many state public assistance plans. Revenues from all such plans are approximately 5.2% of total sales.
The drug store industry is highly competitive. As a volume leader in the retail drug industry, Walgreens competes with various retailers, including chain and independent drugstores, mail order prescription providers, grocery stores, convenient stores, mass merchants and dollar stores. Competition remained keen during the fiscal year with the company competing on the basis of service, convenience, variety and price. The company's geographic dispersion tends to offset the impact of temporary economic and competitive conditions in individual markets. The number and location of the company's drugstores appears under Item 2 - "Properties" in this 10-K.
The company does not engage in any material research activities.
Federal, state and local environmental protection requirements have no material effect upon capital expenditures, earnings or the competitive position of the company.
The company employs approximately 226,000 persons, about 69,300 of whom are part-time employees working less than 30 hours per week.
All the company sales occurred within the continental United States and Puerto Rico. There are no export sales.
The company maintains a website at investor.walgreens.com. The company makes copies of its Annual Reports on Form 10-K, quarterly reports on Form 10-Q, Current Reports on Form 8-K and any amendments to those reports filed with or furnished to the SEC available to investors on or through its website free of charge as soon as reasonably practicable after the company electronically files them with or furnishes them to the SEC. The contents of the company's website are not, however, a part of this report. In addition, charters of all committees of the company's Board of Directors, as well as the company's Corporate Governance Guidelines and Ethics Policy Statement, are available on the company's website at investor.walgreens.com or, upon written request, in printed hardcopy form. Written requests should be sent to Walgreen Co., Attention: Shareholder Relations, Mail Stop #2261, 200 Wilmot Road, Deerfield, Illinois 60015. Changes to or waivers, if any, of the company's Ethics Policy Statement for directors and executive officers would be promptly disclosed on the company's website.
The company has also adopted a Code of Ethics for Financial Executives. This Code applies to and has been signed by the Chief Executive Officer, the Chief Financial Officer and the Controller. The full text of the Code of Ethics for Financial Executives is available at the company's website, investor.walgreens.com. Changes to or waivers, if any, of the company's Code of Ethics for Financial Executives would be promptly disclosed on the company's website.
(viii) Backlog orders.
(ix) Government contracts.
(x) Competitive conditions.
(xi) Research and development activities.
(xii) Environmental disclosures.
(xiii) Number of employees.
(d) Financial information about foreign and domestic operations and export sales.
(e) Available information
- 4 -
Cautionary Note Regarding Forward Looking Statements
Certain information in this annual report, as well as in other public filings, the company website, press releases and oral statements made by our representatives, is forward-looking information based on current expectations and plans that involve risks and uncertainties. Forward-looking information includes statements concerning pharmacy sales trends, prescription margins, number and location of new store openings, outcomes of litigation, the level of capital expenditures, demographic trends; as well as those that include or are preceded by the words "expects," "estimates," "believes," "plans," "anticipates" or similar language. For such statements, we claim the protection of the safe harbor provisions of the Private Securities Litigation Reform Act of 1995.
Forward-looking statements may involve risks and uncertainties, known or unknown to the company, that could cause results to differ materially from management expectations as projected in such forward-looking statements. These risks and uncertainties are discussed in Item 1A below. Unless otherwise required by applicable securities laws, the company assumes no obligation to update its forward-looking statements to reflect subsequent events or circumstances.
Item 1A. Risk Factors
The risks described below could materially and adversely affect our business, financial condition and results of operations. These risks are not the only risks that we face. Our business operations could also be affected by additional factors that are not presently known to us or that we currently consider to be immaterial to our operations. The retail drug store and pharmacy benefit services industries are highly competitive and further increases in competition could adversely affect us.
We face intense competition with local, regional and national companies, including other drug store chains, independent drug stores, mail-order prescription providers and various other retailers such as grocery stores, convenience stores, mass merchants and dollar stores, many of which are aggressively expanding in markets we serve. In the pharmacy benefit services industry, our competitors include large national and regional pharmacy benefit managers and insurance companies and managed care providers, some of which are owned by or have affiliations with our retail drug store competitors. As competition increases in the markets in which we operate, a significant increase in general pricing pressures could occur, which could require us to reevaluate our pricing structures to remain competitive. Our failure to reduce prices could result in decreased revenue, and reducing prices without also reducing costs could negatively affect profits.
Reductions in third-party reimbursement levels, from private or government plans, for prescription drugs could reduce our margin on pharmacy sales and could have a significant effect on our retail drug store profits.
The continued efforts of health maintenance organizations, managed care organizations, pharmacy benefit management companies, government entities, and other third-party payors to reduce prescription drug costs and pharmacy reimbursement rates may impact our profitability. Certain provisions of the Deficit Reduction Act of 2005 seek to reduce federal spending by altering the Medicaid reimbursement formula for multi-source (i.e., generic) drugs. These changes are expected to result in reduced Medicaid reimbursement rates for retail pharmacies. Reduced reimbursement rates could adversely affect our revenues and profits.
- 5 -
We are subject to governmental regulations and procedures and other legal requirements. A significant change in, or noncompliance with, these regulations, procedures and requirements could have a material adverse effect on profitability.
Our retail drug store and pharmacy benefit services businesses are subject to numerous federal, state and local regulations. Changes in these regulations may require extensive system and operating changes that may be difficult to implement. Untimely compliance or noncompliance with applicable regulations could result in the imposition of civil and criminal penalties that could adversely affect the continued operation of our business, including: suspension of payments from government programs; loss of required government certifications; loss of authorizations to participate in or exclusion from government reimbursement programs, such as the Medicare and Medicaid programs; loss of licenses; or significant fines or monetary penalties, and could adversely affect the continued operation of our business. The regulations to which we are subject include, but are not limited to: federal, state and local registration and regulation of pharmacies; applicable Medicare and Medicaid regulations; the Health Insurance Portability and Accountability Act, or HIPAA; accounting standards; tax laws and regulations; laws and regulations relating to the protection of the environment and health and safety matters, including those governing exposure to, and the management and disposal of, hazardous substances; regulations of the U.S. Food and Drug Administration, the U.S. Federal Trade Commission, the Drug Enforcement Administration, and the Consumer Product Safety Commission, as well as state regulatory authorities, governing the sale, advertisement and promotion of products we sell; anti-kickback laws; false claims laws; and federal and state laws governing the practice of the profession of pharmacy. Furthermore, the frequency and rate of FDA approval of new brand name and generic prescription drugs or of additional existing prescription drugs for over-the-counter sales could have an impact on our revenues and profitability. We are also governed by federal and state laws of general applicability, including laws regulating matters of working conditions, health and safety and equal employment opportunity. In addition, we could have exposure if we are found to have infringed another party's intellectual property rights.
Our ability to hire and retain pharmacy personnel is important to the continued success of our business.
As our business expands, we believe that our future success will depend greatly on our continued ability to attract and retain skilled and qualified pharmacists. The retail drug store industry is experiencing an ongoing shortage of licensed pharmacists. This has resulted in continued upward pressure on pharmacist compensation packages. Although we generally have been able to meet our pharmacist staffing requirements in the past, any future inability to do so could limit our ability to offer extended pharmacy hours and negatively impact our revenue and our ability to deliver high levels of customer service. Should a product liability issue or personal injury issue arise, inadequate product or other liability insurance coverage or our inability to maintain such insurance may result in a material adverse effect on our business and financial condition.
Products that we sell could become subject to contamination, product tampering, mislabeling or other damage. In addition, errors in the dispensing and packaging of pharmaceuticals could lead to serious injury. Product liability or personal injury claims may be asserted against us with respect to any of the products or pharmaceuticals we sell or services we provide. Should a product or other liability issue arise, the coverage limits under our insurance programs and the indemnification amounts available to us may not be adequate to protect us against claims. We also may not be able to maintain this insurance on acceptable terms in the future. Damage to our reputation in the event of a product liability or personal injury issue or judgment against us or a product recall could have an adverse effect on our business, financial condition or results of operations.
Our ability to grow our business may be constrained by our inability to find suitable new store locations at acceptable prices or by the expiration of our current leases.
Our ability to grow our business may be constrained if suitable new store locations cannot be identified with lease terms or purchase prices that are acceptable to us. We compete with other retailers and businesses for suitable locations for our stores. Local land use and other regulations applicable to the types of stores we desire to construct may impact our ability to find suitable locations and influence the cost of constructing our stores. The expiration of leases at existing store locations may adversely affect us if the renewal terms of those leases are unacceptable to us and we are forced to close or relocate stores. Further, changing local demographics at existing store locations may adversely affect revenue and profitability levels at those stores.
- 6 -

Changes in economic conditions could adversely affect consumer buying practices and reduce our revenues and profitability.
Our performance may be negatively influenced by changes in national, regional or local economic conditions and consumer confidence. External factors that affect consumer confidence and over which we exercise no influence include unemployment rates, levels of personal disposable income, national, regional or local economic conditions, the introduction of new merchandise or brand and generic prescription drugs, and acts of war or terrorism. Changes in economic conditions and consumer confidence could adversely affect consumer preferences, purchasing power and spending patterns. A decrease in overall consumer spending as a result of changes in economic conditions could adversely affect our front-end sales. Profit margins are greater on front-end sales than on pharmacy sales, and any decrease in sales of front-end products would have a negative impact on our profitability. Acts of war or terrorism may cause damage to our facilities, disrupt the supply of the products and services we offer in our stores or adversely impact consumer demand. All these factors could impact our revenues, operating results and financial condition.
There are a number of business risks which could adversely affect our financial results.
Our success depends on our ability to establish effective advertising, marketing and promotional programs. If we are unsuccessful in our advertising and merchandising strategies, sales could be negatively affected. Our success also depends on our continued ability to attract and retain store and management personnel, and the loss of key personnel could have an adverse effect on the results of our operations, financial condition or cash flow. Our results may be affected by our ability to successfully integrate acquired businesses into our company. The process of integrating acquired businesses may prove disruptive to our operations, may distract management from overseeing our existing operations and may take longer than anticipated. We also may not be able to successfully and timely implement new computer systems and technology, or may experience system disruptions or delays, which could adversely impact our operations and our ability to attract and retain customers. Furthermore, the products we sell are sourced from a wide variety of domestic and international vendors, and any future inability to find qualified vendors and access products in a timely and efficient manner could adversely impact our business.
There are no unresolved staff comments outstanding with the Securities and Exchange Commission at this time.
The number and location of the company's stores appear in the listing of stores by state for fiscal 2007 and 2006 is listed below.
Item 1B. Unresolved Staff Comments
Item 2. Properties
State 2007 2006 State 2007 2006 State 2007 2006 Alabama 67 56 Maryland 38 31 Oregon 47 44 Arizona 234 229 Massachusetts 126 111 Pennsylvania 83 65 Arkansas 45 36 Michigan 190 174 Rhode Island 20 16
California 476 438 Minnesota 111 103 South Carolina 66 52
Colorado 130 113 Mississippi 51 41 South Dakota 13 9 Connecticut 71 59 Missouri 165 152 Tennessee 213 199 Delaware 59 59 Montana 9 2 Texas 587 550 Florida 736 697 Nebraska 49 43 Utah 27 27 Georgia 125 111 Nevada 63 59 Vermont 2 2
Idaho 20 17 New Hampshire 20 14 Virginia 72 56
Illinois 528 511 New Jersey 101 90 Washington 106 95 Indiana 181 167 New Mexico 54 53 West Virginia 1 1 Iowa 59 55 New York 117 84 Wisconsin 195 185 Kansas 57 50 North Carolina 113 91 Wyoming 8 7 Kentucky 69 65 North Dakota 1 1 Puerto Rico 73 69 Louisiana 109 99 Ohio 223 198 Maine 1 - Oklahoma 86 75 TOTAL 5,997 5,461
- 7 -

Most of the company's stores are leased. The leases are for various terms and periods. See Note 3, "Leases" on page 29 of the 2007 Annual Report, which section is incorporated herein by reference. The company owns approximately 19.1% of the retail stores open at August 31, 2007. The company has an aggressive expansion program of adding new stores and remodeling and relocating existing stores. Net retail selling space was increased from 60.6 million square feet at August 31, 2006, to 66.2 million square feet at August 31, 2007. Approximately 41.5% of company stores have been opened or remodeled during the past five years.
The company's retail store operations are supported by thirteen major distribution centers with a total of approximately 9.7 million square feet of space in all distribution centers, of which 7.0 million square feet is owned. The remaining space is leased. All distribution centers are served by modern systems for order processing control, operating efficiencies and rapid merchandise delivery to stores. In addition, the company uses public warehouses to handle certain distribution needs. A new distribution in Anderson, South Carolina opened in fiscal 2007. A new distribution center is scheduled to open in Windsor, Connecticut in fiscal 2009.
There are twenty principal office facilities containing approximately 2.3 million square feet of which approximately 2.0 million square feet is owned and the remainder is leased. The company operates three mail service facilities containing approximately 252,000 square feet of which approximately 133,000 square feet is owned and the remainder is leased.
The company also owns 22 strip shopping malls containing approximately 886,000 square feet of which approximately 609,000 square feet is leased to others.
The information in response to this item is incorporated herein by reference to Note 8 "Contingencies" on page 31 of the 2007 Annual Report.
No matters were submitted to a vote of security holders during the fourth quarter of the fiscal year.
Item 3. Legal Proceedings
Item 4. Submission of Matters to a Vote of Security Holders
- 8 -
PART II
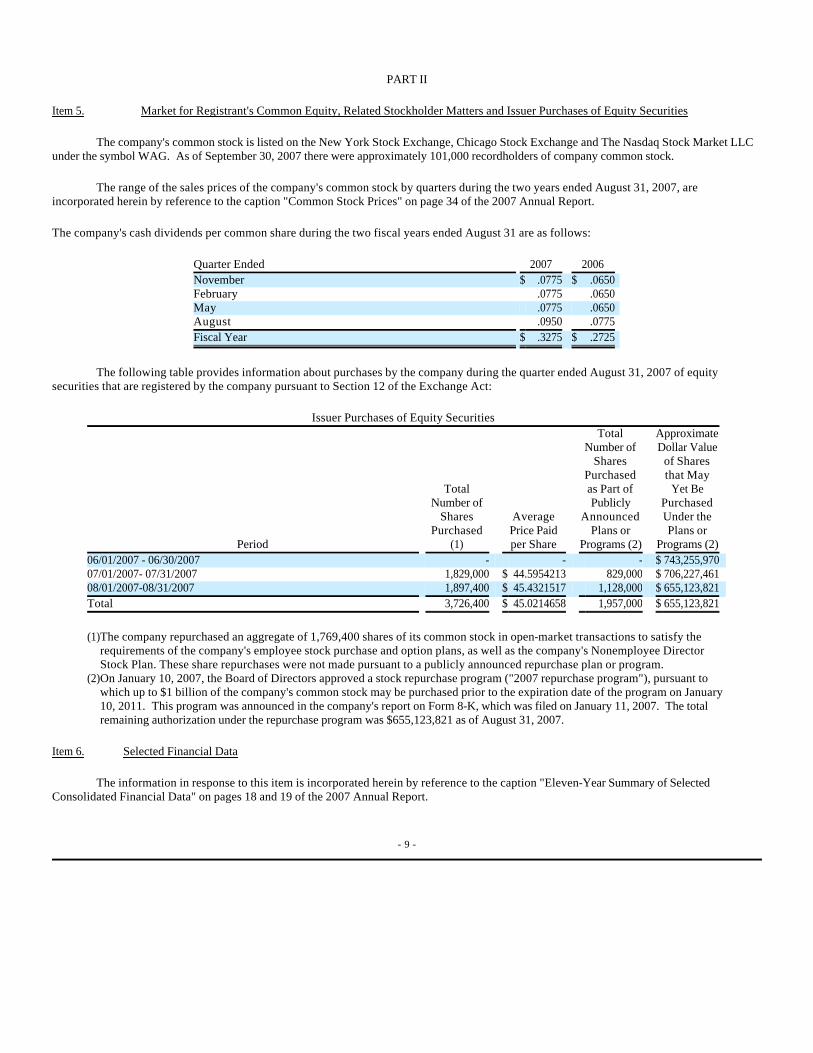
The company's common stock is listed on the New York Stock Exchange, Chicago Stock Exchange and The Nasdaq Stock Market LLC under the symbol WAG. As of September 30, 2007 there were approximately 101,000 recordholders of company common stock.
The range of the sales prices of the company's common stock by quarters during the two years ended August 31, 2007, are incorporated herein by reference to the caption "Common Stock Prices" on page 34 of the 2007 Annual Report.
The company's cash dividends per common share during the two fiscal years ended August 31 are as follows:
The following table provides information about purchases by the company during the quarter ended August 31, 2007 of equity securities that are registered by the company pursuant to Section 12 of the Exchange Act:
The information in response to this item is incorporated herein by reference to the caption "Eleven-Year Summary of Selected Consolidated Financial Data" on pages 18 and 19 of the 2007 Annual Report.
Item 5. Market for Registrant's Common Equity, Related Stockholder Matters and Issuer Purchases of Equity Securities
Quarter Ended 2007 2006 November $ .0775 $ .0650 February .0775 .0650 May .0775 .0650 August .0950 .0775 Fiscal Year $ .3275 $ .2725
Issuer Purchases of Equity Securities
Period
Total Number of
Shares Purchased
(1)
Average Price Paid per Share
Total Number of
Shares Purchased as Part of Publicly
Announced Plans or
Programs (2)
Approximate Dollar Value
of Shares that May
Yet Be Purchased Under the Plans or
Programs (2) 06/01/2007 - 06/30/2007 - - - $ 743,255,970 07/01/2007- 07/31/2007 1,829,000 $ 44.5954213 829,000 $ 706,227,461 08/01/2007-08/31/2007 1,897,400 $ 45.4321517 1,128,000 $ 655,123,821 Total 3,726,400 $ 45.0214658 1,957,000 $ 655,123,821
(1)The company repurchased an aggregate of 1,769,400 shares of its common stock in open-market transactions to satisfy the requirements of the company's employee stock purchase and option plans, as well as the company's Nonemployee Director Stock Plan. These share repurchases were not made pursuant to a publicly announced repurchase plan or program.
(2)On January 10, 2007, the Board of Directors approved a stock repurchase program ("2007 repurchase program"), pursuant to which up to $1 billion of the company's common stock may be purchased prior to the expiration date of the program on January 10, 2011. This program was announced in the company's report on Form 8-K, which was filed on January 11, 2007. The total remaining authorization under the repurchase program was $655,123,821 as of August 31, 2007.
Item 6. Selected Financial Data
- 9 -

The information in response to this item is incorporated herein by reference to the caption "Management's Discussion and Analysis of Results of Operations and Financial Condition" on pages 20 through 23 of the 2007 Annual Report.
Management does not believe that there is any material market risk exposure with respect to derivative or other financial instruments that would require disclosure under this item.
See Item 15.
None
Based on their evaluation as of August 31, 2007 pursuant to Exchange Act Rule 13a-15(b), the company's management, including its Chief Executive Officer and Chief Financial Officer, believe the company's disclosure controls and procedures (as defined in Exchange Act Rule 13a-15(e)) are effective.
Management's report on internal control and the attestation report of Deloitte & Touche LLP, the company's independent registered public accounting firm, are included in our Annual Report to Shareholders for the year ended August 31, 2007 and are incorporated in this Item 9A by reference. Our Annual Report to Shareholders is included as an Exhibit to this Annual Report on Form 10-K.
In connection with the evaluation pursuant to Exchange Act Rule 13a-15(d) of the company's internal control over financial reporting (as defined in Exchange Act Rule 13a-15(f)) by the company's management, including its Chief Executive Officer and Chief Financial Officer, no changes during the quarter ended August 31, 2007 were identified that have materially affected, or are reasonably likely to materially affect, the company's internal control over financial reporting.
Item 7. Management's Discussion and Analysis of Financial Condition and Results of Operations
Item 7A. Qualitative and Quantitative Disclosures about Market Risk
Item 8. Financial Statements and Supplementary Data
Item 9. Changes in and Disagreements with Accountants on Accounting and Financial Disclosure
Item 9A. Controls and Procedures
- 10 -
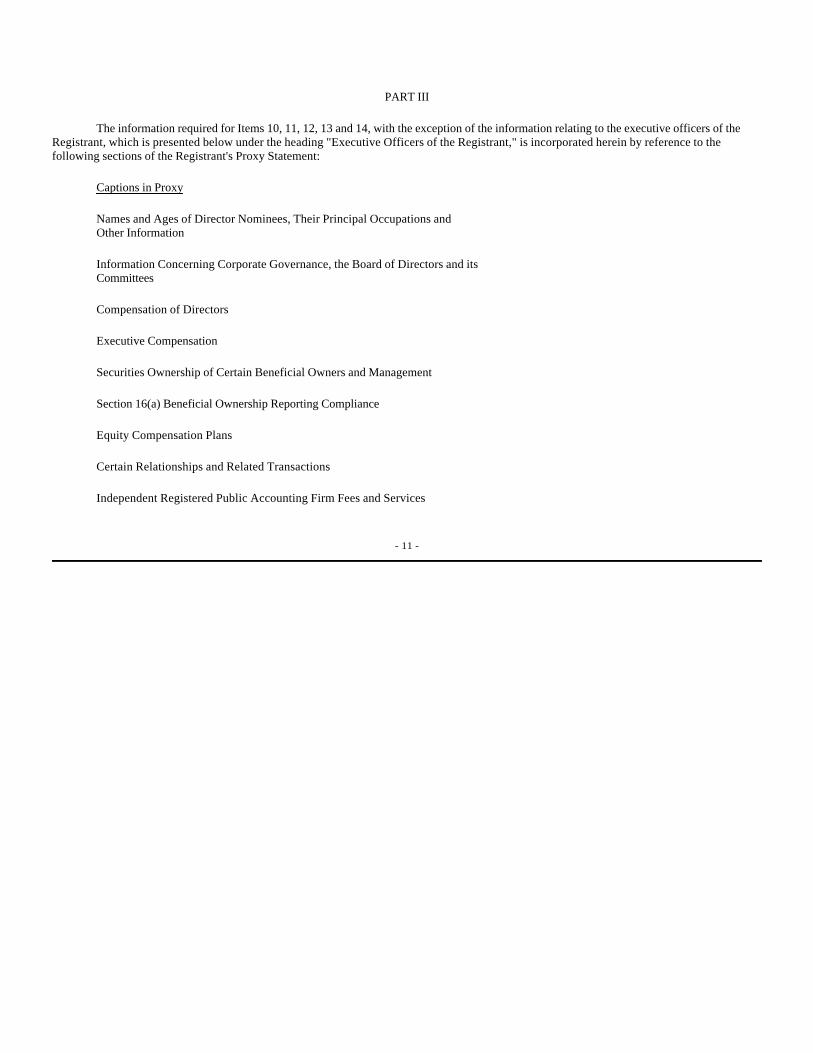
PART III
The information required for Items 10, 11, 12, 13 and 14, with the exception of the information relating to the executive officers of the Registrant, which is presented below under the heading "Executive Officers of the Registrant," is incorporated herein by reference to the following sections of the Registrant's Proxy Statement:
Captions in Proxy
Names and Ages of Director Nominees, Their Principal Occupations andOther Information
Information Concerning Corporate Governance, the Board of Directors and itsCommittees Compensation of Directors Executive Compensation
Securities Ownership of Certain Beneficial Owners and Management
Section 16(a) Beneficial Ownership Reporting Compliance
Equity Compensation Plans
Certain Relationships and Related Transactions
Independent Registered Public Accounting Firm Fees and Services
- 11 -

EXECUTIVE OFFICERS OF THE REGISTRANT
The following information is furnished with respect to each executive officer of the company as of October 15, 2007:
NAME AND BUSINESS EXPERIENCE AGE OFFICE HELDJeffrey A. Rein 55 Chairman of the Board and Chief Executive Officer Chairman of the Board since July 2007 Chief Executive Officer since July 2006 President January 2003 to May 2007 Chief Operating Officer January 2003 to July 2006 Executive Vice President February 2001 to January
2003
Director since January 2003 Gregory D. Wasson 49 President and Chief Operating Officer President and Chief Operating Officer since May
2007
Executive Vice President from October 2005 to April 2007
Senior Vice President February 2004 to October 2005
Vice President October 2001 to February 2004 President, Walgreens Health Initiatives, Inc. March
2002 to April 2007
Executive Vice President, Walgreens Health Initiatives, Inc. October 2001 to March 2002
Operations Vice President February 1999 to October 2001
George J. Riedl 47 Executive Vice President Executive Vice President since January 2006 Senior Vice President January 2003 to
January 2006
Divisional Vice President December 2001 to January 2003
General Merchandise Manager January 2000 to December 2001
Trent E. Taylor 50 Executive Vice President President, Walgreens Health Initiatives, Inc. since
May 2007
Executive Vice President since October 2005 Senior Vice President January 2002 to October 2005 Chief Information Officer January 1999 to April
2007
Mark A. Wagner 46 Executive Vice President Executive Vice President since March 2006 Senior Vice President February 2002 to
March 2006
Treasurer February 2000 to February 2002
- 12 -
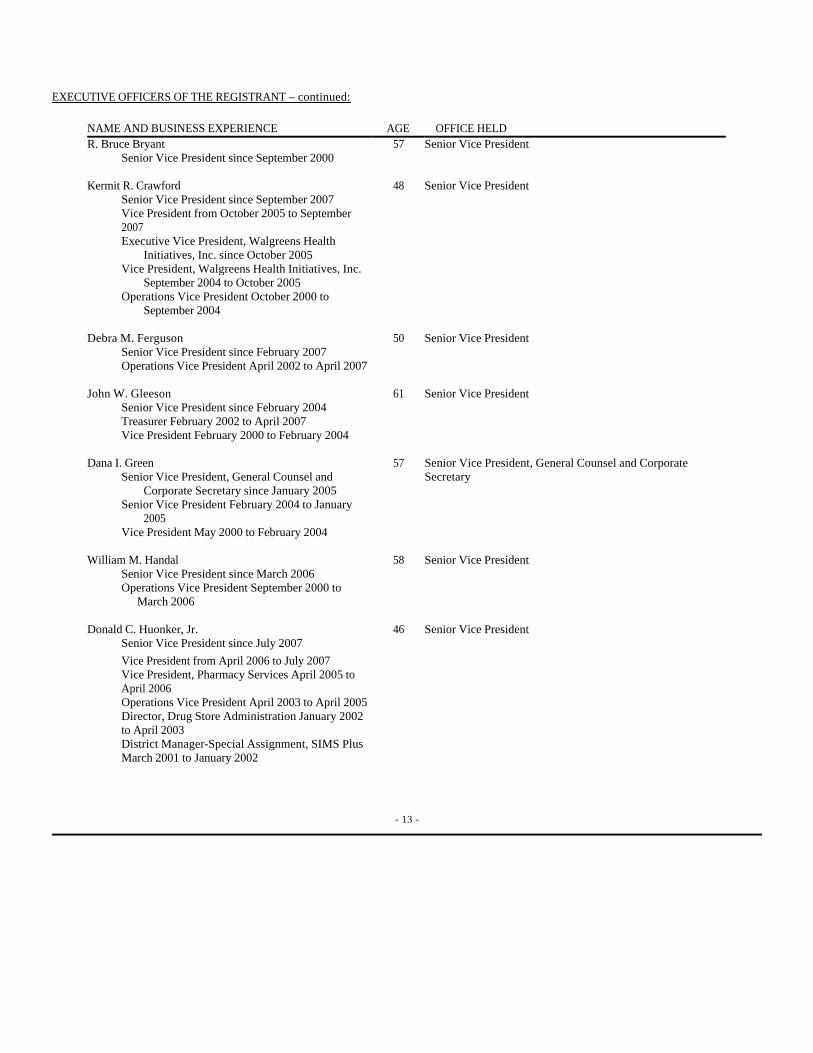
EXECUTIVE OFFICERS OF THE REGISTRANT – continued:
NAME AND BUSINESS EXPERIENCE AGE OFFICE HELDR. Bruce Bryant 57 Senior Vice President Senior Vice President since September 2000 Kermit R. Crawford 48 Senior Vice President Senior Vice President since September 2007 Vice President from October 2005 to September
2007
Executive Vice President, Walgreens Health Initiatives, Inc. since October 2005
Vice President, Walgreens Health Initiatives, Inc. September 2004 to October 2005
Operations Vice President October 2000 to September 2004
Debra M. Ferguson 50 Senior Vice President Senior Vice President since February 2007 Operations Vice President April 2002 to April 2007 John W. Gleeson 61 Senior Vice President Senior Vice President since February 2004 Treasurer February 2002 to April 2007 Vice President February 2000 to February 2004 Dana I. Green 57 Senior Vice President, General Counsel and Corporate Senior Vice President, General Counsel and
Corporate Secretary since January 2005 Secretary
Senior Vice President February 2004 to January 2005
Vice President May 2000 to February 2004 William M. Handal 58 Senior Vice President Senior Vice President since March 2006 Operations Vice President September 2000 to
March 2006
Donald C. Huonker, Jr. 46 Senior Vice President Senior Vice President since July 2007
Vice President from April 2006 to July 2007 Vice President, Pharmacy Services April 2005 to
April 2006
Operations Vice President April 2003 to April 2005 Director, Drug Store Administration January 2002
to April 2003
District Manager-Special Assignment, SIMS Plus March 2001 to January 2002
- 13 -
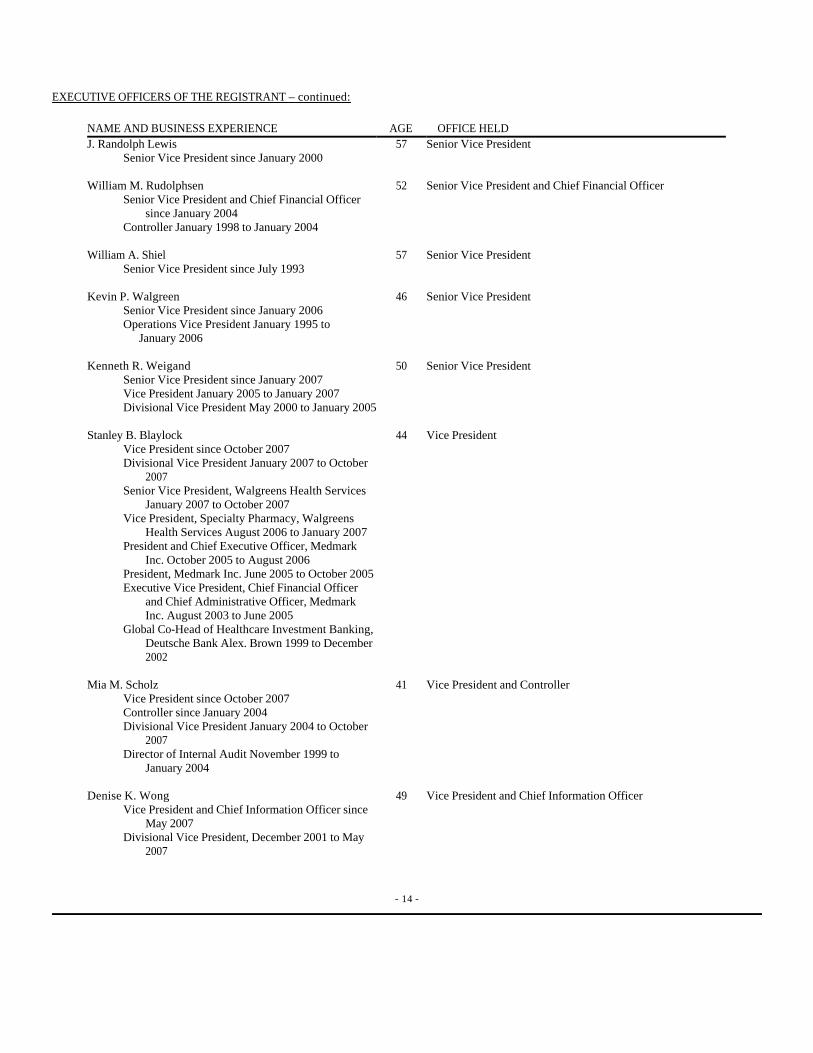
EXECUTIVE OFFICERS OF THE REGISTRANT – continued:
NAME AND BUSINESS EXPERIENCE AGE OFFICE HELDJ. Randolph Lewis 57 Senior Vice President Senior Vice President since January 2000 William M. Rudolphsen 52 Senior Vice President and Chief Financial Officer Senior Vice President and Chief Financial Officer
since January 2004
Controller January 1998 to January 2004 William A. Shiel 57 Senior Vice President Senior Vice President since July 1993 Kevin P. Walgreen 46 Senior Vice President Senior Vice President since January 2006 Operations Vice President January 1995 to
January 2006
Kenneth R. Weigand 50 Senior Vice President Senior Vice President since January 2007 Vice President January 2005 to January 2007 Divisional Vice President May 2000 to January 2005 Stanley B. Blaylock 44 Vice President Vice President since October 2007 Divisional Vice President January 2007 to October
2007
Senior Vice President, Walgreens Health Services January 2007 to October 2007
Vice President, Specialty Pharmacy, Walgreens Health Services August 2006 to January 2007
President and Chief Executive Officer, Medmark Inc. October 2005 to August 2006
President, Medmark Inc. June 2005 to October 2005 Executive Vice President, Chief Financial Officer
and Chief Administrative Officer, Medmark Inc. August 2003 to June 2005
Global Co-Head of Healthcare Investment Banking, Deutsche Bank Alex. Brown 1999 to December 2002
Mia M. Scholz 41 Vice President and Controller Vice President since October 2007 Controller since January 2004 Divisional Vice President January 2004 to October
2007
Director of Internal Audit November 1999 to January 2004
Denise K. Wong 49 Vice President and Chief Information Officer Vice President and Chief Information Officer since
May 2007
Divisional Vice President, December 2001 to May 2007
- 14 -

EXECUTIVE OFFICERS OF THE REGISTRANT – continued:
Kevin P. Walgreen is the son of Charles R. Walgreen III, who is a director of the company.
NAME AND BUSINESS EXPERIENCE AGE OFFICE HELDRobert G. Zimmerman 55 Vice President Vice President since April 2006 Chief Administration and Finance Officer,
Walgreens Health Initiatives, Inc. since April 2006
Divisional Vice President, Walgreens Health Initiatives, Inc. September 2001 to April 2006
John W. Spina 48 Treasurer Treasurer since April 2007 Operations Vice President April 2005 to April 2007 Director, Drug Store Administration April 2003 to
April 2005
District Manager February 1996 to April 2003 Chester G. Young 62 General Auditor Divisional Vice President since January 1995 General Auditor since June 1988
- 15 -
PART IV
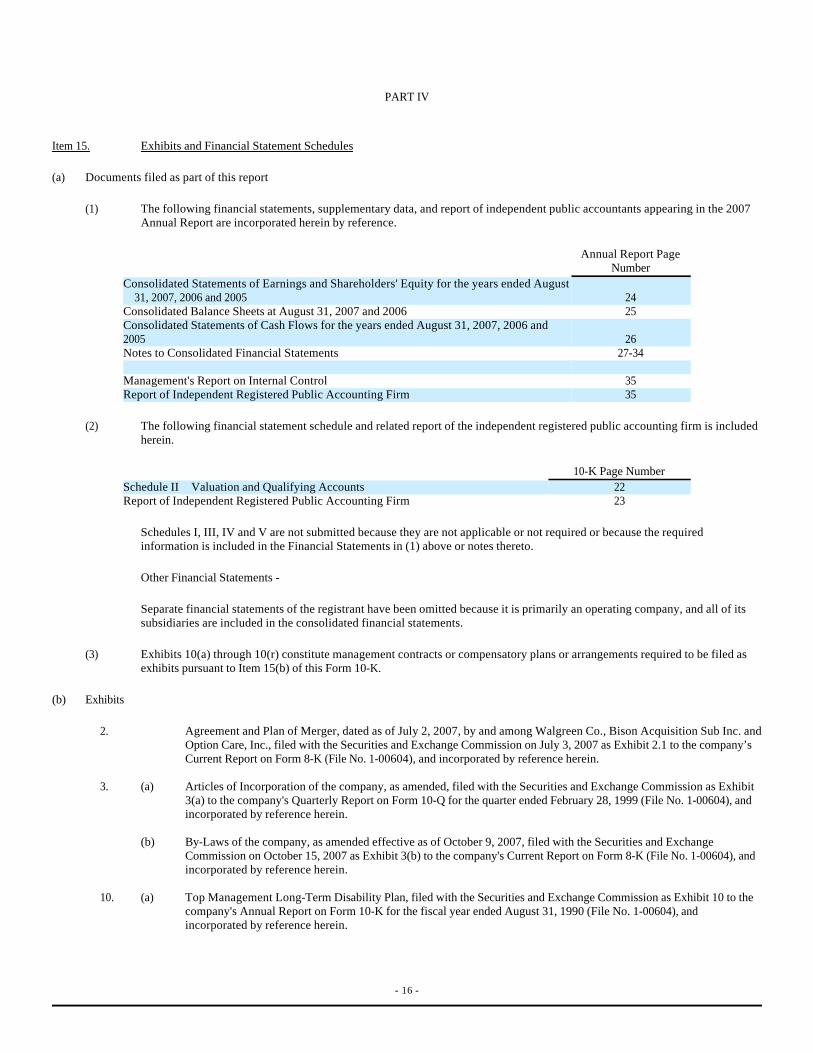
Schedules I, III, IV and V are not submitted because they are not applicable or not required or because the required information is included in the Financial Statements in (1) above or notes thereto.
Other Financial Statements -
Separate financial statements of the registrant have been omitted because it is primarily an operating company, and all of its subsidiaries are included in the consolidated financial statements.
Item 15. Exhibits and Financial Statement Schedules
(a) Documents filed as part of this report
(1) The following financial statements, supplementary data, and report of independent public accountants appearing in the 2007 Annual Report are incorporated herein by reference.
Annual Report Page
NumberConsolidated Statements of Earnings and Shareholders' Equity for the years ended August
31, 2007, 2006 and 2005 24Consolidated Balance Sheets at August 31, 2007 and 2006 25Consolidated Statements of Cash Flows for the years ended August 31, 2007, 2006 and 2005 26Notes to Consolidated Financial Statements 27-34 Management's Report on Internal Control 35Report of Independent Registered Public Accounting Firm 35
(2) The following financial statement schedule and related report of the independent registered public accounting firm is included herein.
10-K Page Number Schedule II Valuation and Qualifying Accounts 22Report of Independent Registered Public Accounting Firm 23
(3) Exhibits 10(a) through 10(r) constitute management contracts or compensatory plans or arrangements required to be filed as exhibits pursuant to Item 15(b) of this Form 10-K.
(b) Exhibits
2. Agreement and Plan of Merger, dated as of July 2, 2007, by and among Walgreen Co., Bison Acquisition Sub Inc. and Option Care, Inc., filed with the Securities and Exchange Commission on July 3, 2007 as Exhibit 2.1 to the company’s Current Report on Form 8-K (File No. 1-00604), and incorporated by reference herein.
3. (a) Articles of Incorporation of the company, as amended, filed with the Securities and Exchange Commission as Exhibit
3(a) to the company's Quarterly Report on Form 10-Q for the quarter ended February 28, 1999 (File No. 1-00604), and incorporated by reference herein.
(b) By-Laws of the company, as amended effective as of October 9, 2007, filed with the Securities and Exchange
Commission on October 15, 2007 as Exhibit 3(b) to the company's Current Report on Form 8-K (File No. 1-00604), and incorporated by reference herein.
10. (a) Top Management Long-Term Disability Plan, filed with the Securities and Exchange Commission as Exhibit 10 to the
company's Annual Report on Form 10-K for the fiscal year ended August 31, 1990 (File No. 1-00604), and incorporated by reference herein.
- 16 -

10. (b) Executive Short-Term Disability Plan Description, filed with the Securities and Exchange Commission as Exhibit 10 to the company's Annual Report on Form 10-K for the fiscal year ended August 31, 1990 (File No. 1-00604), and incorporated by reference herein.
(c) Walgreen Co. Management Incentive Plan (as restated effective September 1, 2003), filed with the Securities and
Exchange Commission as Exhibit 10(c) to the company's Annual Report on Form 10-K for the fiscal year ended August 31, 2003 (File No. 1-00604), and incorporated by reference herein.
(d) (i) Walgreen Co. Restricted Performance Share Plan, as amended, filed with the Securities and Exchange
Commission as Exhibit 10(a) to the company's Quarterly Report on Form 10-Q for the quarter ended February 28, 1997 (File No. 1-00604), and incorporated by reference herein.
(ii) Walgreen Co. Restricted Performance Share Plan Amendment No. 5 (effective October 9, 1996), filed with the
Securities and Exchange Commission as Exhibit 10(a) to the company's Quarterly Report on Form 10-Q for the quarter ended November 30, 2003 (File No. 1-00604), and incorporated by reference herein.
(iii) Walgreen Co. Restricted Performance Share Plan Amendment No. 6 (effective October 11, 2006), filed with
the Securities and Exchange Commission as Exhibit 10(c) to the company's Quarterly Report on Form 10-Q for the quarter ended November 30, 2006 (File No. 1-00604), and incorporated by reference herein.
(iv) Walgreen Co. Long-Term Performance Incentive Plan (amendment and restatement of the Walgreen Co.
Restricted Performance Share Plan), filed with the Securities and Exchange Commission on January 11, 2007 as Exhibit 10.1 to the company's Current Report on Form 8-K (File No. 1-00604), and incorporated by reference herein.
(v) Walgreen Co. Long-Term Performance Incentive Plan Amendment No. 1 (effective January 10, 2007), filed
with the Securities and Exchange Commission as Exhibit 10.2 to the company's Quarterly Report on Form 10-Q for the quarter ended February 28, 2007 (File No. 1-00604), and incorporated by reference herein.
(e) (i) Walgreen Co. Executive Stock Option Plan (effective January 11, 2006), as amended and restated, filed with
the Securities and Exchange Commission on January 17, 2006 as Exhibit 10.1 to the company's Current Report on Form 8-K (File No. 1-00604), and incorporated by reference herein.
(ii) Walgreen Co. Executive Stock Option Plan Amendment No. 1 (effective October 11, 2006), filed with the
Securities and Exchange Commission as Exhibit 10(a) to the company's Quarterly Report on Form 10-Q for the quarter ended November 30, 2006 (File No. 1-00604), and incorporated by reference herein.
(iii) Walgreen Co. Executive Stock Option Plan Amendment No. 2 (effective September 1, 2007), filed with the
Securities and Exchange Commission as Exhibit 10(e)(iii) to the company's Annual Report on Form 10-K for the fiscal year ended August 31, 2007.
(iv) Form of Stock Option Agreement (Grades 12 through 17), filed with the Securities and Exchange Commission
as Exhibit 10(e)(ii) to the company's Annual Report on Form 10-K for the fiscal year ended August 31, 2004 (File No. 1-00604), and incorporated by reference herein.
(v) Form of Stock Option Agreement (Grades 18 and above), filed with the Securities and Exchange Commission
as Exhibit 10(e)(iii) to the company's annual Report on Form 10-K for the fiscal year ended August 31, 2004 (File No. 1-00604), and incorporated by reference herein.
(f) (i) Walgreen Co. 1986 Director's Deferred Fee/Capital Accumulation Plan, filed with the Securities and Exchange
Commission as Exhibit 10 to the company's Annual Report on Form 10-K for the fiscal year ended August 31, 1986 (File No. 1-00604), and incorporated by reference herein.
- 17 -
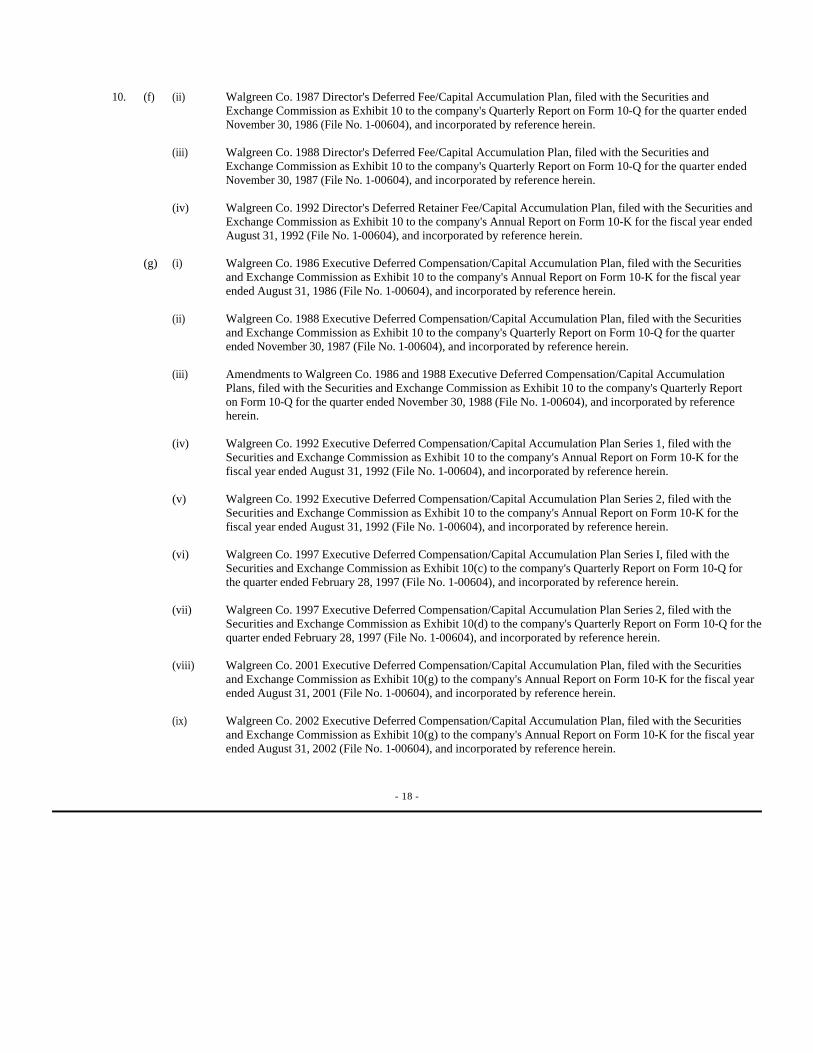
10. (f) (ii) Walgreen Co. 1987 Director's Deferred Fee/Capital Accumulation Plan, filed with the Securities and Exchange Commission as Exhibit 10 to the company's Quarterly Report on Form 10-Q for the quarter ended November 30, 1986 (File No. 1-00604), and incorporated by reference herein.
(iii) Walgreen Co. 1988 Director's Deferred Fee/Capital Accumulation Plan, filed with the Securities and
Exchange Commission as Exhibit 10 to the company's Quarterly Report on Form 10-Q for the quarter ended November 30, 1987 (File No. 1-00604), and incorporated by reference herein.
(iv) Walgreen Co. 1992 Director's Deferred Retainer Fee/Capital Accumulation Plan, filed with the Securities and
Exchange Commission as Exhibit 10 to the company's Annual Report on Form 10-K for the fiscal year ended August 31, 1992 (File No. 1-00604), and incorporated by reference herein.
(g) (i) Walgreen Co. 1986 Executive Deferred Compensation/Capital Accumulation Plan, filed with the Securities
and Exchange Commission as Exhibit 10 to the company's Annual Report on Form 10-K for the fiscal year ended August 31, 1986 (File No. 1-00604), and incorporated by reference herein.
(ii) Walgreen Co. 1988 Executive Deferred Compensation/Capital Accumulation Plan, filed with the Securities
and Exchange Commission as Exhibit 10 to the company's Quarterly Report on Form 10-Q for the quarter ended November 30, 1987 (File No. 1-00604), and incorporated by reference herein.
(iii) Amendments to Walgreen Co. 1986 and 1988 Executive Deferred Compensation/Capital Accumulation
Plans, filed with the Securities and Exchange Commission as Exhibit 10 to the company's Quarterly Report on Form 10-Q for the quarter ended November 30, 1988 (File No. 1-00604), and incorporated by reference herein.
(iv) Walgreen Co. 1992 Executive Deferred Compensation/Capital Accumulation Plan Series 1, filed with the
Securities and Exchange Commission as Exhibit 10 to the company's Annual Report on Form 10-K for the fiscal year ended August 31, 1992 (File No. 1-00604), and incorporated by reference herein.
(v) Walgreen Co. 1992 Executive Deferred Compensation/Capital Accumulation Plan Series 2, filed with the
Securities and Exchange Commission as Exhibit 10 to the company's Annual Report on Form 10-K for the fiscal year ended August 31, 1992 (File No. 1-00604), and incorporated by reference herein.
(vi) Walgreen Co. 1997 Executive Deferred Compensation/Capital Accumulation Plan Series I, filed with the
Securities and Exchange Commission as Exhibit 10(c) to the company's Quarterly Report on Form 10-Q for the quarter ended February 28, 1997 (File No. 1-00604), and incorporated by reference herein.
(vii) Walgreen Co. 1997 Executive Deferred Compensation/Capital Accumulation Plan Series 2, filed with the
Securities and Exchange Commission as Exhibit 10(d) to the company's Quarterly Report on Form 10-Q for the quarter ended February 28, 1997 (File No. 1-00604), and incorporated by reference herein.
(viii) Walgreen Co. 2001 Executive Deferred Compensation/Capital Accumulation Plan, filed with the Securities
and Exchange Commission as Exhibit 10(g) to the company's Annual Report on Form 10-K for the fiscal year ended August 31, 2001 (File No. 1-00604), and incorporated by reference herein.
(ix) Walgreen Co. 2002 Executive Deferred Compensation/Capital Accumulation Plan, filed with the Securities
and Exchange Commission as Exhibit 10(g) to the company's Annual Report on Form 10-K for the fiscal year ended August 31, 2002 (File No. 1-00604), and incorporated by reference herein.
- 18 -
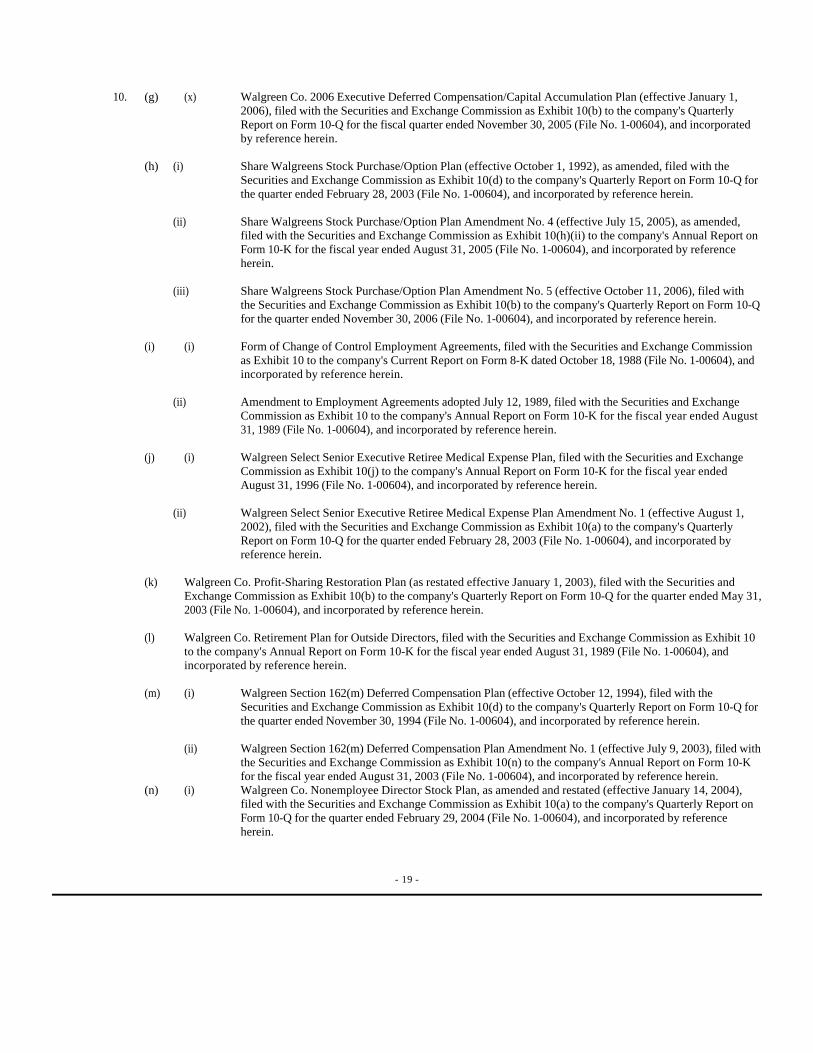
10. (g) (x) Walgreen Co. 2006 Executive Deferred Compensation/Capital Accumulation Plan (effective January 1, 2006), filed with the Securities and Exchange Commission as Exhibit 10(b) to the company's Quarterly Report on Form 10-Q for the fiscal quarter ended November 30, 2005 (File No. 1-00604), and incorporated by reference herein.
(h) (i) Share Walgreens Stock Purchase/Option Plan (effective October 1, 1992), as amended, filed with the
Securities and Exchange Commission as Exhibit 10(d) to the company's Quarterly Report on Form 10-Q for the quarter ended February 28, 2003 (File No. 1-00604), and incorporated by reference herein.
(ii) Share Walgreens Stock Purchase/Option Plan Amendment No. 4 (effective July 15, 2005), as amended,
filed with the Securities and Exchange Commission as Exhibit 10(h)(ii) to the company's Annual Report on Form 10-K for the fiscal year ended August 31, 2005 (File No. 1-00604), and incorporated by reference herein.
(iii) Share Walgreens Stock Purchase/Option Plan Amendment No. 5 (effective October 11, 2006), filed with
the Securities and Exchange Commission as Exhibit 10(b) to the company's Quarterly Report on Form 10-Q for the quarter ended November 30, 2006 (File No. 1-00604), and incorporated by reference herein.
(i) (i) Form of Change of Control Employment Agreements, filed with the Securities and Exchange Commission
as Exhibit 10 to the company's Current Report on Form 8-K dated October 18, 1988 (File No. 1-00604), and incorporated by reference herein.
(ii) Amendment to Employment Agreements adopted July 12, 1989, filed with the Securities and Exchange
Commission as Exhibit 10 to the company's Annual Report on Form 10-K for the fiscal year ended August 31, 1989 (File No. 1-00604), and incorporated by reference herein.
(j) (i) Walgreen Select Senior Executive Retiree Medical Expense Plan, filed with the Securities and Exchange
Commission as Exhibit 10(j) to the company's Annual Report on Form 10-K for the fiscal year ended August 31, 1996 (File No. 1-00604), and incorporated by reference herein.
(ii) Walgreen Select Senior Executive Retiree Medical Expense Plan Amendment No. 1 (effective August 1,
2002), filed with the Securities and Exchange Commission as Exhibit 10(a) to the company's Quarterly Report on Form 10-Q for the quarter ended February 28, 2003 (File No. 1-00604), and incorporated by reference herein.
(k) Walgreen Co. Profit-Sharing Restoration Plan (as restated effective January 1, 2003), filed with the Securities and
Exchange Commission as Exhibit 10(b) to the company's Quarterly Report on Form 10-Q for the quarter ended May 31, 2003 (File No. 1-00604), and incorporated by reference herein.
(l) Walgreen Co. Retirement Plan for Outside Directors, filed with the Securities and Exchange Commission as Exhibit 10
to the company's Annual Report on Form 10-K for the fiscal year ended August 31, 1989 (File No. 1-00604), and incorporated by reference herein.
(m) (i) Walgreen Section 162(m) Deferred Compensation Plan (effective October 12, 1994), filed with the
Securities and Exchange Commission as Exhibit 10(d) to the company's Quarterly Report on Form 10-Q for the quarter ended November 30, 1994 (File No. 1-00604), and incorporated by reference herein.
(ii) Walgreen Section 162(m) Deferred Compensation Plan Amendment No. 1 (effective July 9, 2003), filed with
the Securities and Exchange Commission as Exhibit 10(n) to the company's Annual Report on Form 10-K for the fiscal year ended August 31, 2003 (File No. 1-00604), and incorporated by reference herein.
(n) (i) Walgreen Co. Nonemployee Director Stock Plan, as amended and restated (effective January 14, 2004), filed with the Securities and Exchange Commission as Exhibit 10(a) to the company's Quarterly Report on Form 10-Q for the quarter ended February 29, 2004 (File No. 1-00604), and incorporated by reference herein.
- 19 -
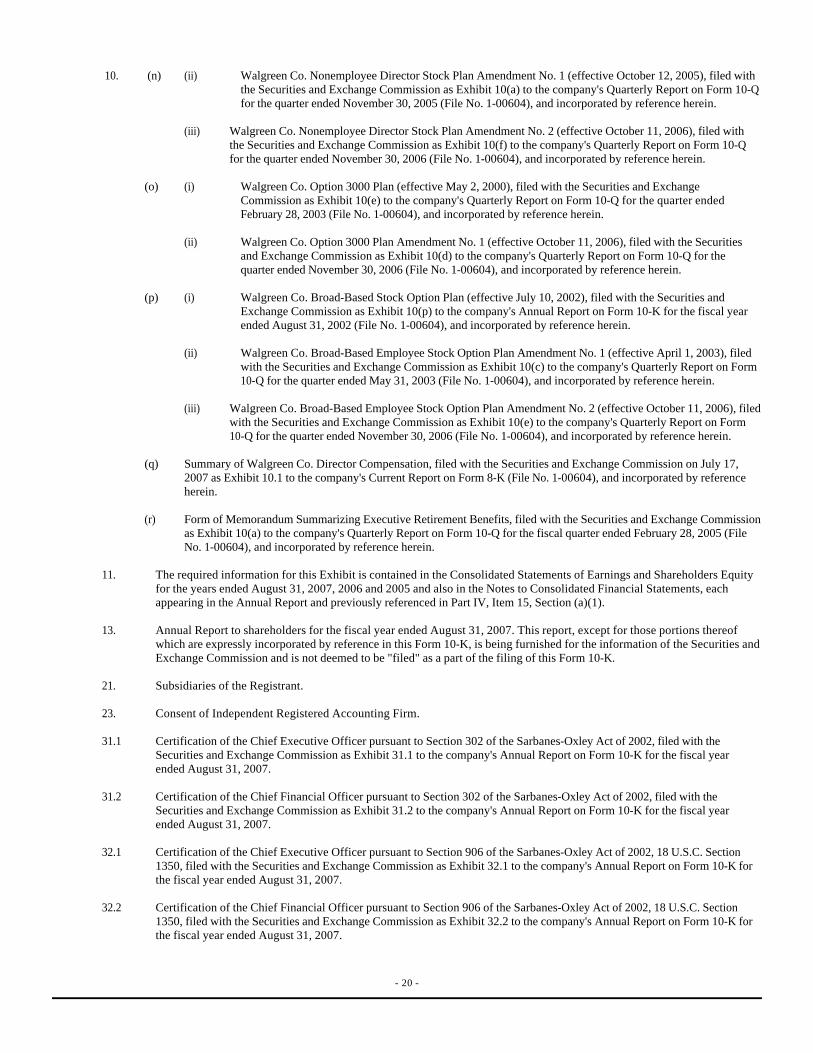
10. (n) (ii) Walgreen Co. Nonemployee Director Stock Plan Amendment No. 1 (effective October 12, 2005), filed with
the Securities and Exchange Commission as Exhibit 10(a) to the company's Quarterly Report on Form 10-Q for the quarter ended November 30, 2005 (File No. 1-00604), and incorporated by reference herein.
(iii) Walgreen Co. Nonemployee Director Stock Plan Amendment No. 2 (effective October 11, 2006), filed with
the Securities and Exchange Commission as Exhibit 10(f) to the company's Quarterly Report on Form 10-Q for the quarter ended November 30, 2006 (File No. 1-00604), and incorporated by reference herein.
(o) (i) Walgreen Co. Option 3000 Plan (effective May 2, 2000), filed with the Securities and Exchange
Commission as Exhibit 10(e) to the company's Quarterly Report on Form 10-Q for the quarter ended February 28, 2003 (File No. 1-00604), and incorporated by reference herein.
(ii) Walgreen Co. Option 3000 Plan Amendment No. 1 (effective October 11, 2006), filed with the Securities
and Exchange Commission as Exhibit 10(d) to the company's Quarterly Report on Form 10-Q for the quarter ended November 30, 2006 (File No. 1-00604), and incorporated by reference herein.
(p) (i) Walgreen Co. Broad-Based Stock Option Plan (effective July 10, 2002), filed with the Securities and
Exchange Commission as Exhibit 10(p) to the company's Annual Report on Form 10-K for the fiscal year ended August 31, 2002 (File No. 1-00604), and incorporated by reference herein.
(ii) Walgreen Co. Broad-Based Employee Stock Option Plan Amendment No. 1 (effective April 1, 2003), filed
with the Securities and Exchange Commission as Exhibit 10(c) to the company's Quarterly Report on Form 10-Q for the quarter ended May 31, 2003 (File No. 1-00604), and incorporated by reference herein.
(iii) Walgreen Co. Broad-Based Employee Stock Option Plan Amendment No. 2 (effective October 11, 2006), filed
with the Securities and Exchange Commission as Exhibit 10(e) to the company's Quarterly Report on Form 10-Q for the quarter ended November 30, 2006 (File No. 1-00604), and incorporated by reference herein.
(q) Summary of Walgreen Co. Director Compensation, filed with the Securities and Exchange Commission on July 17,
2007 as Exhibit 10.1 to the company's Current Report on Form 8-K (File No. 1-00604), and incorporated by reference herein.
(r) Form of Memorandum Summarizing Executive Retirement Benefits, filed with the Securities and Exchange Commission
as Exhibit 10(a) to the company's Quarterly Report on Form 10-Q for the fiscal quarter ended February 28, 2005 (File No. 1-00604), and incorporated by reference herein.
11. The required information for this Exhibit is contained in the Consolidated Statements of Earnings and Shareholders Equity
for the years ended August 31, 2007, 2006 and 2005 and also in the Notes to Consolidated Financial Statements, each appearing in the Annual Report and previously referenced in Part IV, Item 15, Section (a)(1).
13. Annual Report to shareholders for the fiscal year ended August 31, 2007. This report, except for those portions thereof
which are expressly incorporated by reference in this Form 10-K, is being furnished for the information of the Securities and Exchange Commission and is not deemed to be "filed" as a part of the filing of this Form 10-K.
21. Subsidiaries of the Registrant. 23. Consent of Independent Registered Accounting Firm. 31.1 Certification of the Chief Executive Officer pursuant to Section 302 of the Sarbanes-Oxley Act of 2002, filed with the
Securities and Exchange Commission as Exhibit 31.1 to the company's Annual Report on Form 10-K for the fiscal year ended August 31, 2007.
31.2 Certification of the Chief Financial Officer pursuant to Section 302 of the Sarbanes-Oxley Act of 2002, filed with the
Securities and Exchange Commission as Exhibit 31.2 to the company's Annual Report on Form 10-K for the fiscal year ended August 31, 2007.
32.1 Certification of the Chief Executive Officer pursuant to Section 906 of the Sarbanes-Oxley Act of 2002, 18 U.S.C. Section
1350, filed with the Securities and Exchange Commission as Exhibit 32.1 to the company's Annual Report on Form 10-K for the fiscal year ended August 31, 2007.
32.2 Certification of the Chief Financial Officer pursuant to Section 906 of the Sarbanes-Oxley Act of 2002, 18 U.S.C. Section
1350, filed with the Securities and Exchange Commission as Exhibit 32.2 to the company's Annual Report on Form 10-K for the fiscal year ended August 31, 2007.
- 20 -
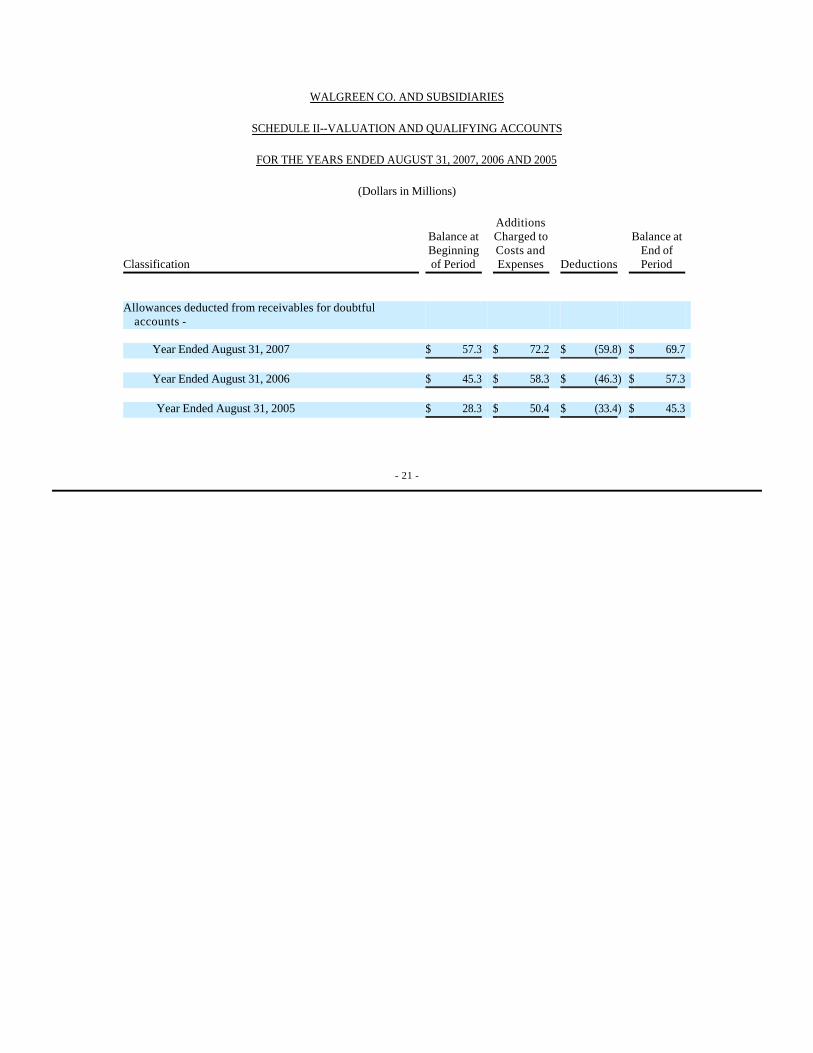
WALGREEN CO. AND SUBSIDIARIES
SCHEDULE II--VALUATION AND QUALIFYING ACCOUNTS
FOR THE YEARS ENDED AUGUST 31, 2007, 2006 AND 2005
(Dollars in Millions)
Classification
Balance at Beginning of Period
Additions Charged to Costs and Expenses Deductions
Balance at End of Period
Allowances deducted from receivables for doubtful
accounts - Year Ended August 31, 2007 $ 57.3 $ 72.2 $ (59.8) $ 69.7 Year Ended August 31, 2006 $ 45.3 $ 58.3 $ (46.3) $ 57.3
Year Ended August 31, 2005 $ 28.3 $ 50.4 $ (33.4) $ 45.3
- 21 -
REPORT OF INDEPENDENT REGISTERED PUBLIC ACCOUNTING FIRM
To the Board of Directors and Shareholders of Walgreen Co.:
We have audited the consolidated financial statements of Walgreen Co. and Subsidiaries (the “Company”) as of August 31, 2007 and 2006, and for each of the three years in the period ended August 31, 2007, and the Company’s internal control over financial reporting as of August 31, 2007, and have issued our report thereon dated October 26, 2007 (which report expresses an unqualified opinion and includes an explanatory paragraph related to the adoption of Statement of Financial Accounting Standards No. 158, Employers’ Accounting for Defined Benefit Pension and Other Retirement Plans – an amendment of FASB Statements No. 87, 88, 106, and 132 (R), and Statement of Financial Accounting Standards No. 123(R), Share-Based Payment); such consolidated financial statements and report are included in your 2007 Annual Report to Shareholders and are incorporated herein by reference. Our audits also included the consolidated financial statement schedule of the Company listed in Item 15. This consolidated financial statement schedule is the responsibility of the Company’s management. Our responsibility is to express an opinion based on our audits. In our opinion, such consolidated financial statement schedule, when considered in relation to the basic consolidated financial statements taken as a whole, presents fairly, in all material respects, the information set forth therein.
/s/ DELOITTE & TOUCHE LLP
Chicago, IllinoisOctober 26, 2007
- 22 -
SIGNATURES
Pursuant to the requirements of Section 13 or 15(d) of the Securities Exchange Act of 1934, the registrant has duly caused this report to be signed on its behalf by the undersigned, thereunto duly authorized.
WALGREEN CO.(Registrant)
By /s/ William M. Rudolphsen Senior Vice President and Date: October 26, 2007 William M. Rudolphsen Chief Financial Officer
- 23 -
SIGNATURES
Pursuant to the requirements of the Securities and Exchange Act of 1934 this report has been signed below by the following persons on
behalf of the Registrant and in the capacities and on the dates indicated.
Name Title Date/s/ Jeffrey A. Rein Chairman of the Board and October 26, 2007 Jeffrey A. Rein Chief Executive Officer (Principal Executive Officer) /s/ William M. Rudolphsen Senior Vice President and October 26, 2007 William M. Rudolphsen Chief Financial Officer (Principal Financial Officer) /s/ Mia M. Scholz Vice President and Controller October 26, 2007 Mia M. Scholz (Principal Accounting Officer) /s/ William C. Foote Director October 26, 2007 William C. Foote /s/ James J. Howard Director October 26, 2007 James J. Howard /s/ Alan G. McNally Director October 26, 2007 Alan G. McNally /s/ Cordell Reed Director October 26, 2007 Cordell Reed /s/ Nancy M. Schlichting Director October 26, 2007 Nancy M. Schlichting /s/ David Y. Schwartz Director October 26, 2007 David Y. Schwartz /s/ James A. Skinner Director October 26, 2007 James A. Skinner /s/ Marilou M. von Ferstel Director October 26, 2007 Marilou M. von Ferstel /s/ C.R. Walgreen III Director October 26, 2007 C.R. Walgreen III
- 24 -


Exhibit 10(e)(iii)
AMENDMENT NUMBER TWO TO THE WALGREEN CO. EXECUTIVE STOCK OPTION PLAN
Effective September 1, 2007, Section 5.4 of the Plan is amended in its entirety to read as follows:
“5.4. Option Price. The Option price per Share under each Option shall be reflected in the Option Agreement. The Option price shall not be less than 100% of the fair market value, and in any event not less than the par value, of a Share on the designated grant date for such Option. For purposes of this Section 5.4 and the remaining provisions of this Plan, fair market value means the closing price on the New York Stock Exchange Composite Transaction Tape on the relevant valuation date (i.e., the designated grant date for purposes of the Option Price) or on the next preceding date on which a closing price was quoted.”

EXHIBIT 13
WALGREEN CO. AND SUBSIDIARIES
ANNUAL REPORT
FOR THE YEAR ENDED AUGUST 31, 2007
TABLE OF CONTENTS
Eleven-Year Summary of Selected Consolidated Financial Data Management's Discussion and Analysis of Results of Operations and Financial Condition Consolidated Statement of Earnings Consolidated Statement of Shareholders' Equity Consolidated Balance Sheets Consolidated Statements of Cash Flows Notes to Consolidated Financial Statements Common Stock Prices Comparison of Five-Year Cumulative Total Return
Eleven-Year Summary of Selected Consolidated Financial Data Walgreen Co. and Subsidiaries
(Dollars in Millions, except per share amounts)
Table of Contents
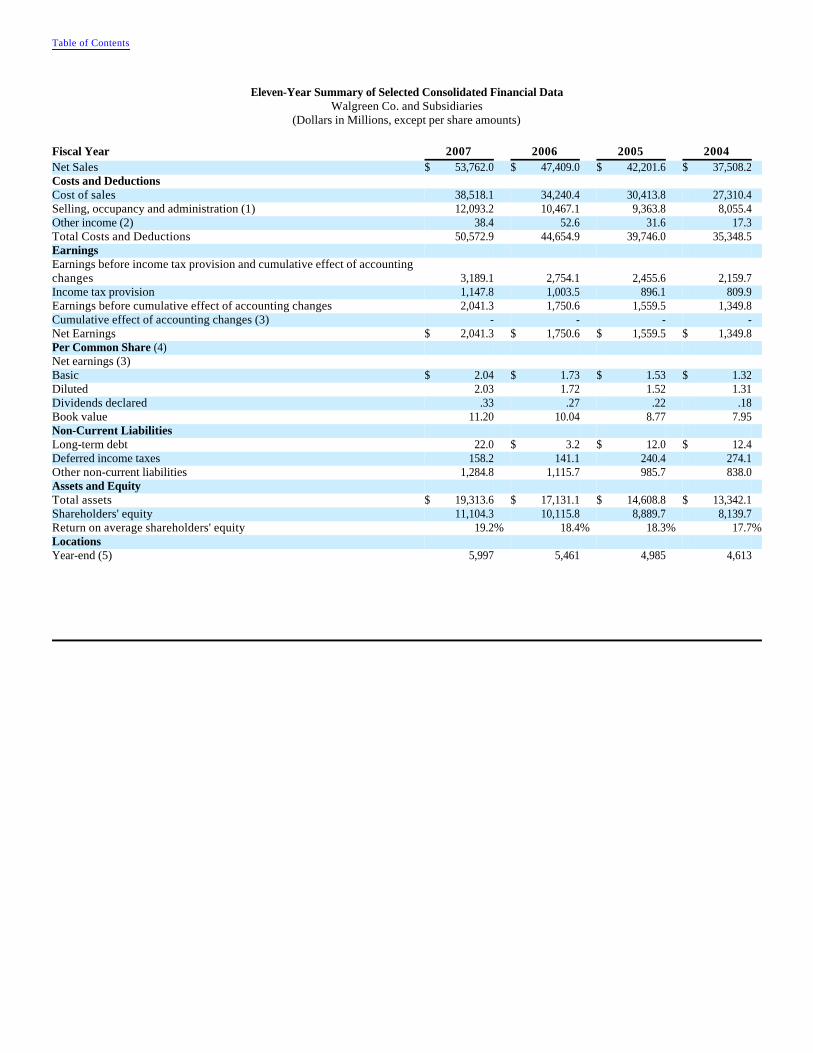
Fiscal Year 2007 2006 2005 2004 Net Sales $ 53,762.0 $ 47,409.0 $ 42,201.6 $ 37,508.2 Costs and Deductions Cost of sales 38,518.1 34,240.4 30,413.8 27,310.4 Selling, occupancy and administration (1) 12,093.2 10,467.1 9,363.8 8,055.4 Other income (2) 38.4 52.6 31.6 17.3 Total Costs and Deductions 50,572.9 44,654.9 39,746.0 35,348.5 Earnings Earnings before income tax provision and cumulative effect of accounting changes 3,189.1 2,754.1 2,455.6 2,159.7 Income tax provision 1,147.8 1,003.5 896.1 809.9 Earnings before cumulative effect of accounting changes 2,041.3 1,750.6 1,559.5 1,349.8 Cumulative effect of accounting changes (3) - - - - Net Earnings $ 2,041.3 $ 1,750.6 $ 1,559.5 $ 1,349.8 Per Common Share (4) Net earnings (3) Basic $ 2.04 $ 1.73 $ 1.53 $ 1.32 Diluted 2.03 1.72 1.52 1.31 Dividends declared .33 .27 .22 .18 Book value 11.20 10.04 8.77 7.95 Non-Current Liabilities Long-term debt 22.0 $ 3.2 $ 12.0 $ 12.4 Deferred income taxes 158.2 141.1 240.4 274.1 Other non-current liabilities 1,284.8 1,115.7 985.7 838.0 Assets and Equity Total assets $ 19,313.6 $ 17,131.1 $ 14,608.8 $ 13,342.1 Shareholders' equity 11,104.3 10,115.8 8,889.7 8,139.7 Return on average shareholders' equity 19.2% 18.4% 18.3% 17.7%Locations Year-end (5) 5,997 5,461 4,985 4,613

Table of Contents
2003 2002 2001 2000 1999 1998 1997 $ 32,505.4 $ 28,681.1 $ 24,623.0 $ 21,206.9 $ 17,838.8 $ 15,306.6 $ 13,363.0 23,706.2 21,076.1 18,048.9 15,465.9 12,978.6 11,139.4 9,681.8 6,938.3 5,992.5 5,171.0 4,501.2 3,859.6 3,341.6 2,979.6 10.8 6.9 2.3 5.7 11.9 41.9 3.9 30,633.7 27,061.7 23,217.6 19,961.4 16,826.3 14,439.1 12,657.5 1,871.7 1,619.4 1,405.4 1,245.5 1,012.5 867.5 705.5 706.6 611.3 530.6 479.5 397.4 336.2 273.4 1,165.1 1,008.1 874.8 766.0 615.1 531.3 432.1 - - - - - (26.4) - $ 1,165.1 $ 1,008.1 $ 874.8 $ 766.0 $ 615.1 $ 504.9 $ 432.1 $ 1.14 $ .99 $ .86 $ .76 $ .61 $ .50 $ .43 1.13 .98 .85 .75 .61 .50 .43 .16 .15 .14 .14 .13 .13 .12 6.94 6.01 5.05 4.14 3.44 2.83 2.38 $ 9.4 $ 11.2 $ 20.8 $ 18.2 $ 18.0 $ 13.6 $ 3.3 180.7 135.6 102.9 74.0 54.1 74.2 101.6 677.5 613.9 547.5 519.2 461.0 410.3 310.0 $ 11,656.8 $ 10,117.2 $ 9,042.3 $ 7,103.7 $ 5,906.7 $ 4,901.6 $ 4,207.1 7,117.8 6,162.9 5,151.0 4,188.6 3,449.8 2,823.4 2,353.7 17.5% 17.8% 18.7% 20.1% 19.6% 19.5% 19.7% 4,252 3,899 3,536 3,181 2,830 2,556 2,366
(1) Fiscal 2007 had insignificant pre-tax income from litigation settlement gains. Fiscal 2006, 2005, 2004, 2003, 2002, 2001 and 2000 included pre-tax income of $7.3 million ($.005 per share, diluted), $26.3 million ($.016 per share, diluted), $16.3 million ($.010 per share, diluted), $29.6 million ($.018 per share, diluted), $6.2 million ($.004 per share, diluted), $22.1 million ($.013 per share, diluted) and $33.5 million ($.021 per share, diluted), respectively, from litigation settlements. Fiscal 2006 included a $12.3 million ($.008 per share, diluted) downward adjustment of the fiscal 2005 pre-tax expenses of $54.7 million ($.033 per share, diluted) related to Hurricane Katrina.
(2) Fiscal 1998 includes a pre-tax gain of $37.4 million ($.023 per share, diluted) from the sale of the company's long-term care pharmacy business.
(3) Fiscal 1998 includes an after-tax $26.4 million ($.026 per share, diluted) charge from the cumulative effect of accounting change for system development costs.
(4) Per share amounts have been adjusted for two-for-one stock splits in 1999 and 1997. (5) Locations include stores, mail service facilities, home care facilities and specialty pharmacies.

MANAGEMENT'S DISCUSSION AND ANALYSISOF RESULTS OF OPERATIONS AND FINANCIAL CONDITION
Introduction
Walgreens is principally a retail drugstore chain that sells prescription and non-prescription drugs and general merchandise. General merchandise includes, among other things, beauty care, personal care, household items, candy, photofinishing, greeting cards, seasonal items and convenience food. Customers can have prescriptions filled at the drugstore counter, as well as through the mail, by telephone and via the Internet. As of August 31, 2007, we operated 5,997 locations (including three mail service facilities, 101 home care facilities and eight specialty pharmacies) located in 48 states and Puerto Rico. The total location count of 5,997 does not include the 62 convenient care clinics operated by Take Care Health Systems, Inc.
The drugstore industry is highly competitive. In addition to other drugstore chains, independent drugstores and mail order prescription providers, we also compete with various other retailers including grocery stores, convenience stores, mass merchants and dollar stores.
Prescription sales continue to become a larger portion of the company's business. The long-term outlook for prescription sales is strong due in part to the aging population, the introduction of lower priced generics and the continued development of innovative drugs that improve quality of life and control healthcare costs. Certain provisions relating to Medicaid reimbursement rates for generic drugs from the Deficit Reduction Act of 2005 become effective during fiscal 2008 and are expected to reduce our reimbursement.
Front-end sales have continued to grow due to strengthening core categories, such as over-the-counter non-prescription drugs, beauty care and personal care products. Walgreens strong name recognition continues to drive private brand sales, which are included in these core categories.
We continue to expand into new markets and increase penetration in existing markets. To support our growth, we are investing significantly in prime locations, technology and customer service initiatives. Retail organic growth continues to be our primary growth vehicle; however, consideration is given to acquisitions that provide a unique opportunity and strategic fit for our business. Fiscal 2007 acquisitions included Option Care, Inc. and affiliated companies, a specialty pharmacy and home infusion services provider; Take Care Health Systems, Inc. and LLC, a convenient care clinic operator; selected assets from Familymeds Group, Inc., a pharmacy chain; the remaining minority interest in SeniorMed LLC and selected other assets (primarily prescription files).
Operating Statistics
Table of Contents
Percentage Increases Fiscal Year 2007 2006 2005 Net Sales 13.4 12.3 12.5 Net Earnings 16.6 12.3 15.5 Comparable Drugstore Sales 8.1 7.7 8.2 Prescription Sales 14.7 13.3 13.4 Comparable Drugstore Prescription Sales 9.5 9.2 9.8 Front-End Sales 12.2 10.9 11.1 Comparable Drugstore Front-End Sales 5.8 5.3 5.5
Results of Operations
Fiscal 2007 was our 33rd consecutive year of record sales and earnings. Fiscal year net earnings increased 16.6% to $2.041 billion, or $2.03 per share (diluted), versus last year's earnings of $1.751 billion, or $1.72 per share (diluted). Net earnings increases resulted from improved sales and higher gross margins, partially offset by higher expense ratios.
Fiscal 2007 included insignificant pre-tax litigation settlement gains. There were pre-tax litigation settlement gains of $7.3 million (less than $.01 per share, diluted) in fiscal 2006 and $26.3 million ($.02 per share, diluted) in fiscal 2005. Fiscal 2006 included a $12.3 million (less than $.01 per share, diluted) downward adjustment of the fiscal 2005 pre-tax expenses of $54.7 million ($.03 per share, diluted) related to Hurricane Katrina.
Net sales increased by 13.4% to $53.762 billion in fiscal 2007 compared to increases of 12.3% in 2006 and 12.5% in 2005. Drugstore sales increases resulted from sales gains in existing stores and added sales from new stores, each of which includes an indeterminate amount of market-driven price changes. Sales in comparable drugstores were up 8.1% in 2007, 7.7% in 2006 and 8.2% in 2005. Comparable drugstores are defined as those that have been open for at least twelve consecutive months without closure for seven or more consecutive days and without a major remodel or a natural disaster in the past twelve months. Relocated and acquired stores are not included as comparable stores for the first twelve months after the relocation or acquisition. We operated 5,997 locations at August 31, 2007, compared to 5,461 at August 31, 2006, and 4,985 at August 31, 2005.
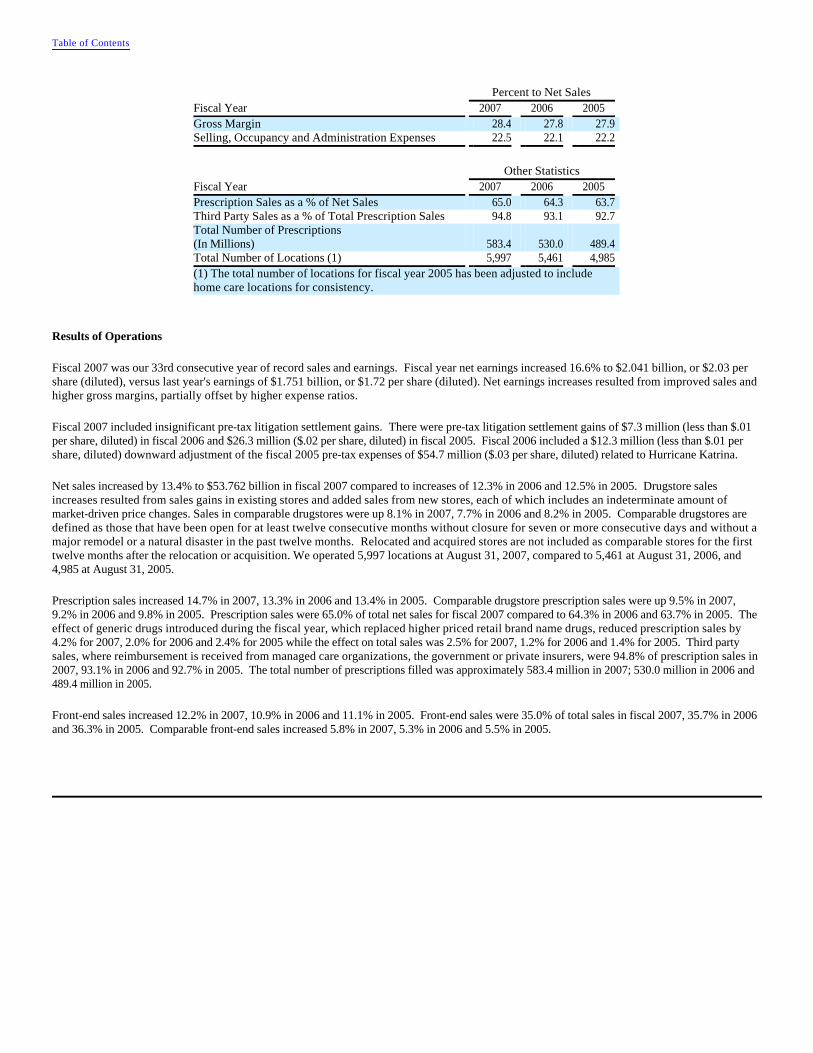
Prescription sales increased 14.7% in 2007, 13.3% in 2006 and 13.4% in 2005. Comparable drugstore prescription sales were up 9.5% in 2007, 9.2% in 2006 and 9.8% in 2005. Prescription sales were 65.0% of total net sales for fiscal 2007 compared to 64.3% in 2006 and 63.7% in 2005. The effect of generic drugs introduced during the fiscal year, which replaced higher priced retail brand name drugs, reduced prescription sales by 4.2% for 2007, 2.0% for 2006 and 2.4% for 2005 while the effect on total sales was 2.5% for 2007, 1.2% for 2006 and 1.4% for 2005. Third party sales, where reimbursement is received from managed care organizations, the government or private insurers, were 94.8% of prescription sales in 2007, 93.1% in 2006 and 92.7% in 2005. The total number of prescriptions filled was approximately 583.4 million in 2007; 530.0 million in 2006 and 489.4 million in 2005.
Front-end sales increased 12.2% in 2007, 10.9% in 2006 and 11.1% in 2005. Front-end sales were 35.0% of total sales in fiscal 2007, 35.7% in 2006 and 36.3% in 2005. Comparable front-end sales increased 5.8% in 2007, 5.3% in 2006 and 5.5% in 2005.
Table of Contents
Percent to Net Sales Fiscal Year 2007 2006 2005 Gross Margin 28.4 27.8 27.9 Selling, Occupancy and Administration Expenses 22.5 22.1 22.2
Other Statistics Fiscal Year 2007 2006 2005 Prescription Sales as a % of Net Sales 65.0 64.3 63.7 Third Party Sales as a % of Total Prescription Sales 94.8 93.1 92.7 Total Number of Prescriptions(In Millions) 583.4 530.0 489.4 Total Number of Locations (1) 5,997 5,461 4,985 (1) The total number of locations for fiscal year 2005 has been adjusted to include home care locations for consistency.
Gross margins as a percent of total net sales were 28.4% in 2007, 27.8% in 2006 and 27.9% in 2005. Pharmacy margins, as well as front-end margins, increased for the year. Pharmacy margins increased with the growth in generic drug sales. Some of that benefit was offset by growth in Medicare Part D and third party pharmacy sales, which typically have lower margins than cash prescriptions, and a continued sales shift toward the pharmacy business, which carries lower margins than front-end merchandise. Margins for the front-end increased as a result of a shift in sales mix to higher margin items.
We use the last-in, first-out (LIFO) method of inventory valuation. The LIFO provision is dependent upon inventory levels, inflation rates and merchandise mix. The effective LIFO inflation rates were 1.04% in 2007, 1.53% in 2006 and 1.26% in 2005, which resulted in charges to cost of sales of $69.3 million in 2007, $95.3 million in 2006 and $67.8 million in 2005. Inflation on prescription inventory was .71% in 2007, 2.37% in 2006 and 2.18% in 2005. In all three fiscal years, we experienced deflation in some non-prescription inventories.
Selling, occupancy and administration expenses were 22.5% of sales in fiscal 2007, 22.1% in fiscal 2006 and 22.2% in fiscal 2005. The increase in fiscal 2007 was principally caused by higher store level salaries and expenses, provisions for legal matters and higher intangible asset amortization and administrative costs related to acquisitions. In addition, the impact of the introduction of new generic drugs, which tempers the rate of sales growth, continues to adversely affect expense ratios.
Interest income decreased in 2007 as cash was used for business acquisitions and stock repurchases, reducing the level of short-term investments. Interest income is also reported net of an insignificant level of interest expense. Average net investment levels were approximately $805.9 million in 2007, $1.225 billion in 2006 and $1.307 billion in 2005.
The effective income tax rate was 36.0% for fiscal 2007, 36.4% for 2006 and 36.5% for 2005. Fiscal 2007 reflects the resolution of a multiyear state tax matter and a lower effective state tax rate, while 2006 reflects the settlement of prior years' Internal Revenue Service matters and 2005 reflects foreign tax credit adjustments.
Critical Accounting Policies
The consolidated financial statements are prepared in accordance with accounting principles generally accepted in the United States of America and include amounts based on management's prudent judgments and estimates. Actual results may differ from these estimates. Management believes that any reasonable deviation from those judgments and estimates would not have a material impact on our consolidated financial position or results of operations. To the extent that the estimates used differ from actual results, however, adjustments to the statement of earnings and corresponding balance sheet accounts would be necessary. These adjustments would be made in future statements. Some of the more significant estimates include goodwill and other intangible asset impairment, allowance for doubtful accounts, vendor allowances, liability for closed locations, liability for insurance claims and cost of sales. We use the following methods to determine our estimates:
Goodwill and other intangible asset impairment – Goodwill and other indefinite-lived intangible assets are not amortized, but are evaluated for impairment annually or whenever events or changes in circumstances indicate that the value of a certain asset may be impaired. The process of evaluating goodwill for impairment involves the determination of fair value. Inherent in such fair value determinations are certain judgments and estimates, including the interpretation of economic indicators and market valuations and assumptions about our business plans. We have not made any material changes to the method of evaluating goodwill and intangible asset impairments during the last three years. Based on current knowledge, we do not believe there is a reasonable likelihood that there will be a material change in the estimate or assumptions used to determine impairment.
Table of Contents

Allowance for doubtful accounts – The provision for bad debt is based on both specific receivables and historic write-off percentages. We have not made any material changes to the method of estimating our allowance for doubtful accounts during the last three years. Based on current knowledge, we do not believe there is a reasonable likelihood that there will be a material change in the estimate or assumptions used to determine the allowance.
Vendor allowances – Vendor allowances are principally received as a result of purchase levels, sales or promotion of vendors' products. Allowances are generally recorded as a reduction of inventory and are recognized as a reduction of cost of sales when the related merchandise is sold. Those allowances received for promoting vendors' products are offset against advertising expense and result in a reduction of selling, occupancy and administration expense to the extent of advertising incurred, with the excess treated as a reduction of inventory costs. We have not made any material changes to the method of estimating our vendor allowances during the last three years. Based on current knowledge, we do not believe there is a reasonable likelihood that there will be a material change in the estimate or assumptions used to determine vendor allowances.
Liability for closed locations – The liability is based on the present value of future rent obligations and other related costs (net of estimated sublease rent) to the first lease option date. We have not made any material changes to the method of estimating our liability for closed locations during the last three years. Based on current knowledge, we do not believe there is a reasonable likelihood that there will be a material change in the estimate or assumptions used to determine the liability.
Liability for insurance claims – The liability for insurance claims is recorded based on estimates for claims incurred. The provisions are estimated in part by considering historical claims experience, demographic factors and other actuarial assumptions and are not discounted. We have not made any material changes to the method of estimating our liability for insurance claims during the last three years. Based on current knowledge, we do not believe there is a reasonable likelihood that there will be a material change in the estimate or assumptions used to determine the liability.
Cost of sales – Drugstore cost of sales is derived based on point-of-sale scanning information with an estimate for shrinkage and adjusted based on periodic inventories. Inventories are valued at the lower of cost or market determined by the last-in, first-out (LIFO) method. We have not made any material changes to the method of estimating cost of sales during the last three years. Based on current knowledge, we do not believe there is a reasonable likelihood that there will be a material change in the estimate or assumptions used to determine cost of sales.
Liquidity and Capital Resources
Cash and cash equivalents were $254.8 million at August 31, 2007, compared to $919.9 million at August 31, 2006. Short-term investment objectives are to minimize risk, maintain liquidity and maximize after-tax yields. To attain these objectives, investment limits are placed on the amount, type and issuer of securities. Investments are principally in top-tier money market funds and commercial paper.
Net cash provided by operating activities was $2.357 billion in fiscal 2007 and $2.440 billion in fiscal 2006. The change between periods was primarily caused by increased net earnings, offset by inventory levels. The lower rate of increase in accounts receivable, as well as the decrease in accounts payable, reflect the loss of the UnitedHealth Group's Ovations unit contract in our pharmacy benefit management business as of December 31, 2006. Cash provided by operations is the principal source of funds for expansion, acquisitions, remodeling programs, dividends to shareholders and stock repurchases. In fiscal 2007, we supplemented cash provided by operations with short-term borrowings.
Table of Contents
Net cash used for investing activities was $2.396 billion versus $1.684 billion last year. Proceeds from the sale of auction rate securities exceeded purchases of such securities by $429.1 million in fiscal 2007 compared to $106.0 million in fiscal 2006. Our participation in auction rate securities has included investing in municipal bonds and student obligations, with purchases of these securities at par. While the underlying security is issued as a long-term investment, they typically can be purchased and sold every 7, 28 and 35 days. The trading of auction rate securities takes place through a descending price auction with the interest rate reset at the beginning of each holding period. At the end of each holding period the interest is paid to the investor. At August 31, 2007, there were no holdings of auction rate securities compared to $415.1 million in fiscal 2006.
Additions to property and equipment were $1.785 billion compared to $1.338 billion last year. In total there were 563 new or relocated locations (net 478) in fiscal 2007, not including 58 locations acquired from Option Care, Inc. and affiliated companies. This compared to 570 last year (net 476). New locations are owned or leased. There were 170 owned locations added during the year and 62 under construction at August 31, 2007, versus 136 owned locations added and 62 under construction as of August 31, 2006.
Business acquisitions this year were $1.086 billion versus $485.4 million in fiscal 2006. Acquisitions in fiscal 2007 included the purchase of Option Care, Inc. and affiliated companies, a specialty pharmacy and home infusion services provider; Take Care Health Systems, Inc. and LLC, a convenient care clinic operator; selected assets from Familymeds Group, Inc., a pharmacy chain; the remaining minority interest in SeniorMed LLC and selected other assets (primarily prescription files). Business acquisitions in fiscal 2006 included a merger with Delaware-based Happy Harry's pharmacy chain and the purchase of Medmark Inc., a specialty pharmacy; Schraft's A Specialty Pharmacy; a controlling interest in SeniorMed LLC, an institutional pharmacy; Home Pharmacy of California, which provides home infusion services; Canadian Valley Medical Solutions, which provides home care services; selected assets from the 23-store Medic drugstore chain and selected other assets (primarily prescription files).
Capital expenditures for fiscal 2008 are expected to be more than $2.0 billion, excluding business acquisitions. We expect to open 550 new stores in fiscal 2008, with a net increase of more than 475 stores, and anticipate having a total of more than 7,000 locations in 2010. We are continuing to relocate stores to more convenient and profitable freestanding locations. In addition to new stores, expenditures are planned for distribution centers and technology. A new distribution center opened in Anderson, South Carolina, in fiscal 2007; another in Windsor, Connecticut, has an anticipated opening date in fiscal 2009.
Net cash used for financing activities was $626.1 million compared to $413.0 million last year. During the fiscal year, we purchased $1.064 billion of company shares. Of this amount, $343.2 million related to the stock repurchase program announced on July 14, 2004 ("2004 repurchase program") and finalized in the first quarter of fiscal 2007. On January 10, 2007, a new stock repurchase program ("2007 repurchase program") of up to $1 billion was announced, to be executed over the next four years. Purchases of company shares relating to the 2007 repurchase program were made in the second, third and fourth quarters in the amount of $344.9 million. An additional $375.4 million of shares were purchased to support the needs of the employee stock plans. Comparable amounts in fiscal 2006 were purchases of $289.7 million relating to the 2004 repurchase program and purchases of $379.1 million to support the needs of the employee stock plans. We had proceeds related to employee stock plans of $266.1 million in fiscal 2007 versus $319.1 million in fiscal 2006. We do not anticipate executing stock repurchases under the 2007 repurchase program while having short-term debt outstanding; however, we will continue to repurchase shares to support the needs of the employee stock plans.
Table of Contents
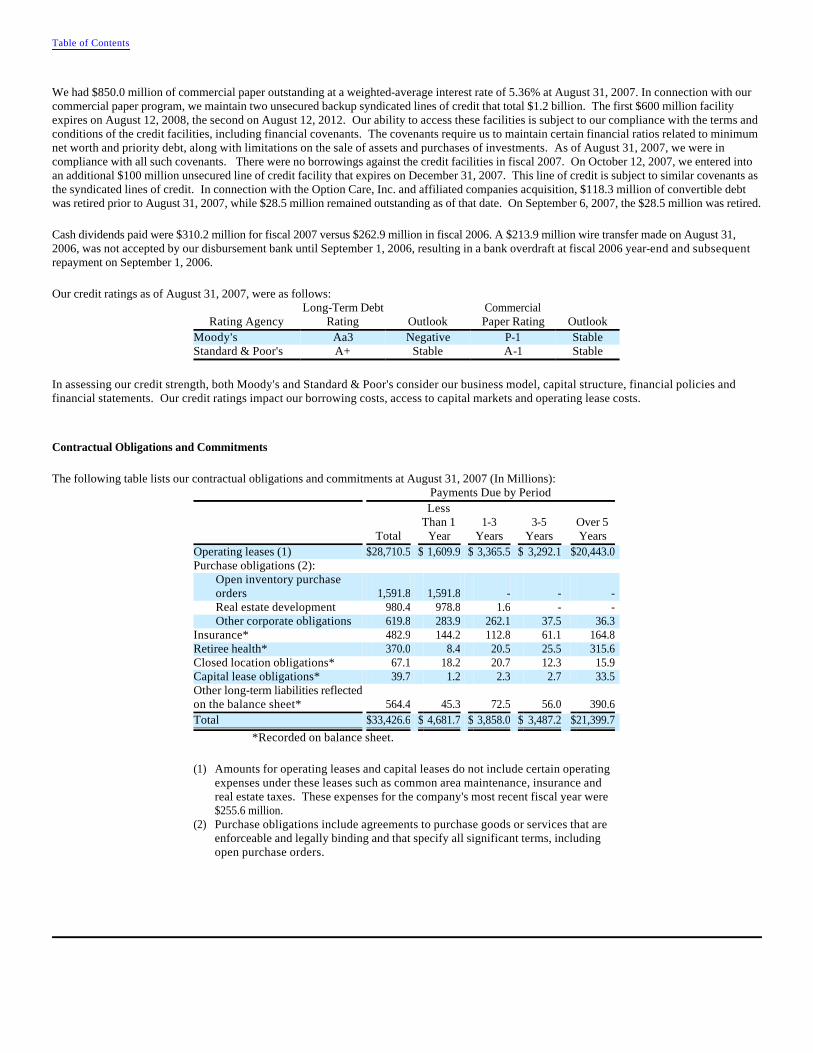
We had $850.0 million of commercial paper outstanding at a weighted-average interest rate of 5.36% at August 31, 2007. In connection with our commercial paper program, we maintain two unsecured backup syndicated lines of credit that total $1.2 billion. The first $600 million facility expires on August 12, 2008, the second on August 12, 2012. Our ability to access these facilities is subject to our compliance with the terms and conditions of the credit facilities, including financial covenants. The covenants require us to maintain certain financial ratios related to minimum net worth and priority debt, along with limitations on the sale of assets and purchases of investments. As of August 31, 2007, we were in compliance with all such covenants. There were no borrowings against the credit facilities in fiscal 2007. On October 12, 2007, we entered into an additional $100 million unsecured line of credit facility that expires on December 31, 2007. This line of credit is subject to similar covenants as the syndicated lines of credit. In connection with the Option Care, Inc. and affiliated companies acquisition, $118.3 million of convertible debt was retired prior to August 31, 2007, while $28.5 million remained outstanding as of that date. On September 6, 2007, the $28.5 million was retired.
Cash dividends paid were $310.2 million for fiscal 2007 versus $262.9 million in fiscal 2006. A $213.9 million wire transfer made on August 31, 2006, was not accepted by our disbursement bank until September 1, 2006, resulting in a bank overdraft at fiscal 2006 year-end and subsequent repayment on September 1, 2006.
Our credit ratings as of August 31, 2007, were as follows:
In assessing our credit strength, both Moody's and Standard & Poor's consider our business model, capital structure, financial policies and financial statements. Our credit ratings impact our borrowing costs, access to capital markets and operating lease costs.
Contractual Obligations and Commitments
The following table lists our contractual obligations and commitments at August 31, 2007 (In Millions):
*Recorded on balance sheet.
Table of Contents
Rating AgencyLong-Term Debt
Rating OutlookCommercial Paper Rating Outlook
Moody's Aa3 Negative P-1 StableStandard & Poor's A+ Stable A-1 Stable
Payments Due by Period
Total
Less Than 1
Year 1-3
Years 3-5
Years Over 5 Years
Operating leases (1) $28,710.5 $ 1,609.9 $ 3,365.5 $ 3,292.1 $20,443.0 Purchase obligations (2):
Open inventory purchase orders 1,591.8 1,591.8 - - - Real estate development 980.4 978.8 1.6 - - Other corporate obligations 619.8 283.9 262.1 37.5 36.3
Insurance* 482.9 144.2 112.8 61.1 164.8 Retiree health* 370.0 8.4 20.5 25.5 315.6 Closed location obligations* 67.1 18.2 20.7 12.3 15.9 Capital lease obligations* 39.7 1.2 2.3 2.7 33.5 Other long-term liabilities reflected on the balance sheet* 564.4 45.3 72.5 56.0 390.6 Total $33,426.6 $ 4,681.7 $ 3,858.0 $ 3,487.2 $21,399.7
(1) Amounts for operating leases and capital leases do not include certain operating expenses under these leases such as common area maintenance, insurance and real estate taxes. These expenses for the company's most recent fiscal year were $255.6 million.
(2) Purchase obligations include agreements to purchase goods or services that are enforceable and legally binding and that specify all significant terms, including open purchase orders.

Off-Balance Sheet Arrangements
Letters of credit are issued to support purchase obligations and commitments (as reflected on the Contractual Obligations and Commitments table) as follows (In Millions):
We have no other off-balance sheet arrangements other than those disclosed on the Contractual Obligations and Commitments table and a credit agreement guaranty on behalf of SureScripts, LLC. This agreement is described more fully in Note 8 in the Notes to Consolidated Financial Statements.
Both on-balance sheet and off-balance sheet financing are considered when targeting debt to equity ratios to balance the interests of equity and debt (including real estate) investors. This balance allows us to lower our cost of capital while maintaining a prudent level of financial risk.
Recent Accounting Pronouncements
In July 2006, the Financial Accounting Standards Board (FASB) issued FASB Interpretation (FIN) No. 48, "Accounting for Uncertainty in Income Taxes - an Interpretation of FASB Statement No. 109." This interpretation clarifies the accounting and disclosure for uncertain income tax positions, including how income tax positions should be reflected in the financial statements before they are resolved with the tax authorities. This interpretation will be effective first quarter of fiscal 2008. Had this pronouncement been effective as of August 31, 2007, the adjustment to Retained Earnings would have been immaterial.
In September 2006, the FASB issued Statement of Financial Accounting Standards (SFAS) No. 157, "Fair Value Measurements." This statement defines and provides guidance when applying fair value measurements to accounting pronouncements that require or permit such measurements. This statement, which will be effective first quarter of fiscal 2009, is not expected to have a material impact on our consolidated financial position or results of operations.
In February 2007, the FASB issued SFAS No. 159, “The Fair Value Option for Financial Assets and Financial Liabilities.” This statement gives entities the option to carry most financial assets and liabilities at fair value, with changes in fair value recorded in earnings. We are currently evaluating whether we intend to adopt this voluntary statement, which would be effective first quarter of fiscal 2009.
In June 2007, the Emerging Issues Task Force (EITF) reached a consensus on Issue No. 06-11, “Accounting for Income Tax Benefits of Dividends on Share-Based Payment Awards.” EITF 06-11 states that an entity should recognize a realized tax benefit associated with dividends on certain nonvested equity shares and options as an increase in additional paid-in capital. The benefit should be included in the pool of excess tax benefits available to absorb potential future tax liabilities. This issue should be applied prospectively for share-based awards declared beginning in fiscal 2009. The company does not expect the adoption of EITF 06-11 to have a material impact on its consolidated financial position or results of operations.
Cautionary Note Regarding Forward-Looking Statements
Certain statements and projections of future results made in this report constitute forward-looking information that is based on current market, competitive and regulatory expectations that involve risks and uncertainties. Please see Walgreen Co.'s Form 10-K for the period ended August 31, 2007, for a discussion of important factors as they relate to forward-looking statements. Actual results could differ materially.
Table of Contents
Inventory obligations $ 76.9 Real estate development 12.2 Insurance 276.8
Total $ 365.9

Consolidated Statements of EarningsWalgreen Co. and Subsidiaries
For the Years Ended August 31, 2007, 2006 and 2005(In Millions, except shares and per share amounts)
The accompanying Notes to Consolidated Financial Statements are integral parts of these statements.
Table of Contents
Earnings 2007 2006 2005 Net Sales $ 53,762.0 $ 47,409.0 $ 42,201.6 Costs and Deductions: Cost of sales 38,518.1 34,240.4 30,413.8 Selling, occupancy and administration 12,093.2 10,467.1 9,363.8 50,611.3 44,707.5 39,777.6 Other Income: Interest income, net 38.4 52.6 31.6 Earnings: Earnings before income tax provision 3,189.1 2,754.1 2,455.6 Income tax provision 1,147.8 1,003.5 896.1 Net Earnings $ 2,041.3 $ 1,750.6 $ 1,559.5 Net Earnings per Common Share: Basic $ 2.04 $ 1.73 $ 1.53 Diluted 2.03 1.72 1.52 Average shares outstanding 998,633,559 1,010,252,562 1,019,669,630 Dilutive effect of stock options 7,706,509 9,148,162 8,664,212 Average shares outstanding assuming dilution 1,006,340,068 1,019,400,724 1,028,333,842
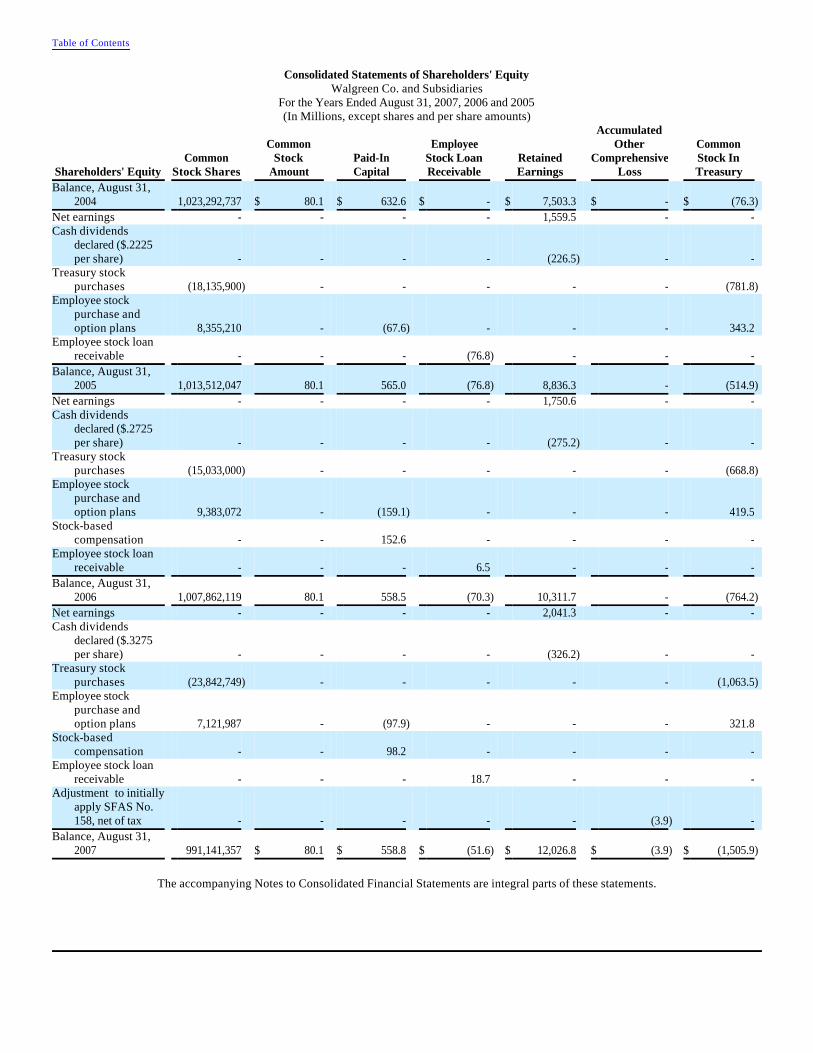
Consolidated Statements of Shareholders' EquityWalgreen Co. and Subsidiaries
For the Years Ended August 31, 2007, 2006 and 2005(In Millions, except shares and per share amounts)
The accompanying Notes to Consolidated Financial Statements are integral parts of these statements.
Table of Contents
Shareholders' Equity Common
Stock Shares
Common Stock
Amount Paid-In Capital
Employee Stock Loan Receivable
Retained Earnings
Accumulated Other
Comprehensive Loss
Common Stock In Treasury
Balance, August 31, 2004 1,023,292,737 $ 80.1 $ 632.6 $ - $ 7,503.3 $ - $ (76.3)
Net earnings - - - - 1,559.5 - - Cash dividends
declared ($.2225 per share) - - - - (226.5) - -
Treasury stock purchases (18,135,900) - - - - - (781.8)
Employee stock purchase and option plans 8,355,210 - (67.6) - - - 343.2
Employee stock loan receivable - - - (76.8) - - -
Balance, August 31, 2005 1,013,512,047 80.1 565.0 (76.8) 8,836.3 - (514.9)
Net earnings - - - - 1,750.6 - - Cash dividends
declared ($.2725 per share) - - - - (275.2) - -
Treasury stock purchases (15,033,000) - - - - - (668.8)
Employee stock purchase and option plans 9,383,072 - (159.1) - - - 419.5
Stock-based compensation - - 152.6 - - - -
Employee stock loan receivable - - - 6.5 - - -
Balance, August 31, 2006 1,007,862,119 80.1 558.5 (70.3) 10,311.7 - (764.2)
Net earnings - - - - 2,041.3 - - Cash dividends
declared ($.3275 per share) - - - - (326.2) - -
Treasury stock purchases (23,842,749) - - - - - (1,063.5)
Employee stock purchase and option plans 7,121,987 - (97.9) - - - 321.8
Stock-based compensation - - 98.2 - - - -
Employee stock loan receivable - - - 18.7 - - -
Adjustment to initially apply SFAS No. 158, net of tax - - - - - (3.9) -
Balance, August 31, 2007 991,141,357 $ 80.1 $ 558.8 $ (51.6) $ 12,026.8 $ (3.9) $ (1,505.9)
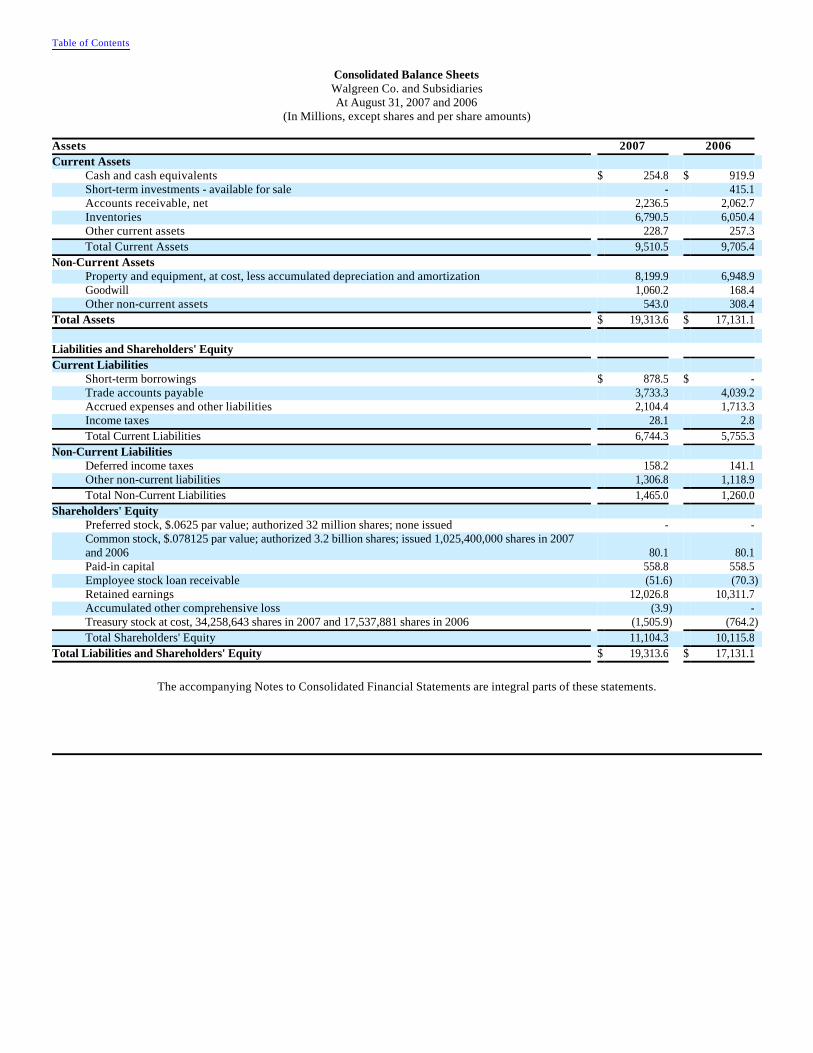
Consolidated Balance SheetsWalgreen Co. and SubsidiariesAt August 31, 2007 and 2006
(In Millions, except shares and per share amounts)
The accompanying Notes to Consolidated Financial Statements are integral parts of these statements.
Table of Contents
Assets 2007 2006 Current Assets
Cash and cash equivalents $ 254.8 $ 919.9 Short-term investments - available for sale - 415.1 Accounts receivable, net 2,236.5 2,062.7 Inventories 6,790.5 6,050.4 Other current assets 228.7 257.3 Total Current Assets 9,510.5 9,705.4
Non-Current Assets Property and equipment, at cost, less accumulated depreciation and amortization 8,199.9 6,948.9 Goodwill 1,060.2 168.4 Other non-current assets 543.0 308.4
Total Assets $ 19,313.6 $ 17,131.1 Liabilities and Shareholders' Equity Current Liabilities
Short-term borrowings $ 878.5 $ - Trade accounts payable 3,733.3 4,039.2 Accrued expenses and other liabilities 2,104.4 1,713.3 Income taxes 28.1 2.8 Total Current Liabilities 6,744.3 5,755.3
Non-Current Liabilities Deferred income taxes 158.2 141.1 Other non-current liabilities 1,306.8 1,118.9 Total Non-Current Liabilities 1,465.0 1,260.0
Shareholders' Equity Preferred stock, $.0625 par value; authorized 32 million shares; none issued - - Common stock, $.078125 par value; authorized 3.2 billion shares; issued 1,025,400,000 shares in 2007 and 2006 80.1 80.1 Paid-in capital 558.8 558.5 Employee stock loan receivable (51.6) (70.3)Retained earnings 12,026.8 10,311.7 Accumulated other comprehensive loss (3.9) - Treasury stock at cost, 34,258,643 shares in 2007 and 17,537,881 shares in 2006 (1,505.9) (764.2)Total Shareholders' Equity 11,104.3 10,115.8
Total Liabilities and Shareholders' Equity $ 19,313.6 $ 17,131.1
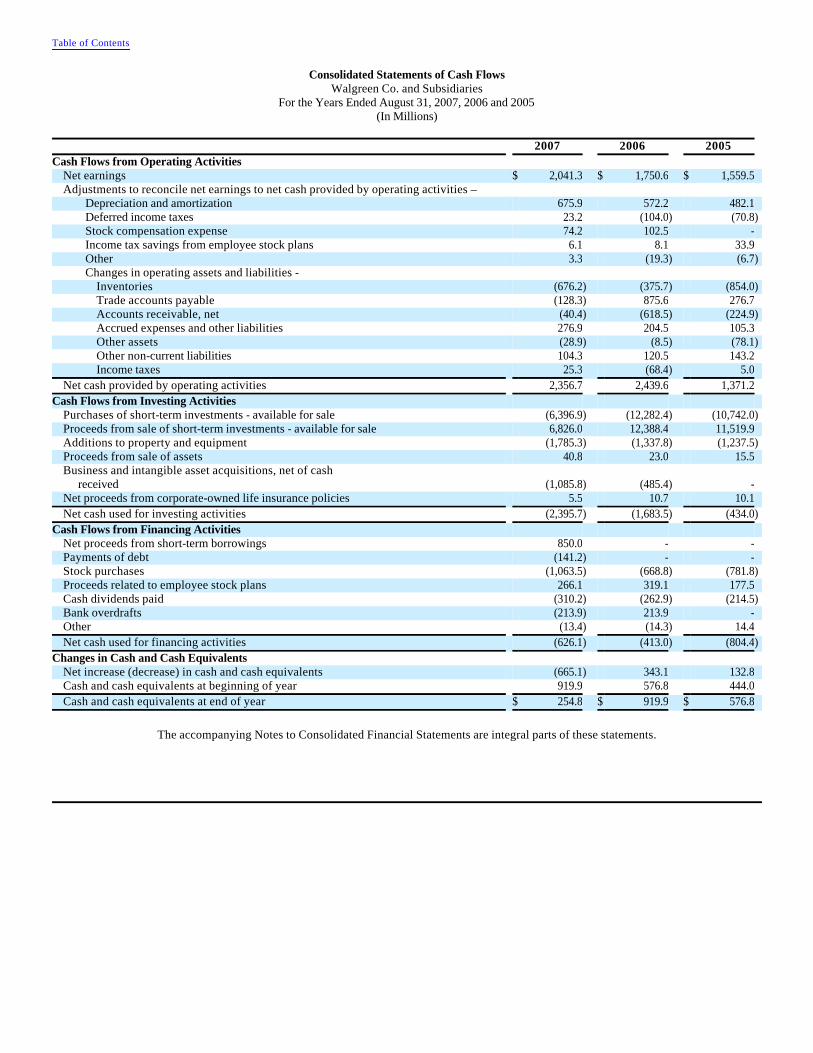
Consolidated Statements of Cash FlowsWalgreen Co. and Subsidiaries
For the Years Ended August 31, 2007, 2006 and 2005(In Millions)
The accompanying Notes to Consolidated Financial Statements are integral parts of these statements.
Table of Contents
2007 2006 2005 Cash Flows from Operating Activities
Net earnings $ 2,041.3 $ 1,750.6 $ 1,559.5 Adjustments to reconcile net earnings to net cash provided by operating activities –
Depreciation and amortization 675.9 572.2 482.1 Deferred income taxes 23.2 (104.0) (70.8)Stock compensation expense 74.2 102.5 - Income tax savings from employee stock plans 6.1 8.1 33.9 Other 3.3 (19.3) (6.7)Changes in operating assets and liabilities -
Inventories (676.2) (375.7) (854.0)Trade accounts payable (128.3) 875.6 276.7 Accounts receivable, net (40.4) (618.5) (224.9)Accrued expenses and other liabilities 276.9 204.5 105.3 Other assets (28.9) (8.5) (78.1)Other non-current liabilities 104.3 120.5 143.2 Income taxes 25.3 (68.4) 5.0
Net cash provided by operating activities 2,356.7 2,439.6 1,371.2 Cash Flows from Investing Activities
Purchases of short-term investments - available for sale (6,396.9) (12,282.4) (10,742.0)Proceeds from sale of short-term investments - available for sale 6,826.0 12,388.4 11,519.9 Additions to property and equipment (1,785.3) (1,337.8) (1,237.5)Proceeds from sale of assets 40.8 23.0 15.5 Business and intangible asset acquisitions, net of cash received (1,085.8) (485.4) - Net proceeds from corporate-owned life insurance policies 5.5 10.7 10.1 Net cash used for investing activities (2,395.7) (1,683.5) (434.0)
Cash Flows from Financing Activities Net proceeds from short-term borrowings 850.0 - - Payments of debt (141.2) - - Stock purchases (1,063.5) (668.8) (781.8)Proceeds related to employee stock plans 266.1 319.1 177.5 Cash dividends paid (310.2) (262.9) (214.5)Bank overdrafts (213.9) 213.9 - Other (13.4) (14.3) 14.4 Net cash used for financing activities (626.1) (413.0) (804.4)
Changes in Cash and Cash Equivalents Net increase (decrease) in cash and cash equivalents (665.1) 343.1 132.8 Cash and cash equivalents at beginning of year 919.9 576.8 444.0 Cash and cash equivalents at end of year $ 254.8 $ 919.9 $ 576.8

Notes to Consolidated Financial Statements
Description of BusinessThe company is principally in the retail drugstore business and its operations are within one reportable segment. At August 31, 2007, there were 5,997 locations in 48 states and Puerto Rico. Prescription sales were 65.0% of total sales for fiscal 2007 compared to 64.3% in 2006 and 63.7% in 2005.
Basis of PresentationThe consolidated statements include the accounts of the company and its subsidiaries. All intercompany transactions have been eliminated. The consolidated financial statements are prepared in accordance with accounting principles generally accepted in the United States of America and include amounts based on management's prudent judgments and estimates. Actual results may differ from these estimates.
The balance sheet reflects the reclassification of goodwill from other non-current assets. The cash flow statement contains reclassifications of previously condensed lines within the operating activity section.
Cash and Cash EquivalentsCash and cash equivalents include cash on hand and all highly liquid investments with an original maturity of three months or less. Included in cash and cash equivalents are credit card and debit card receivables from banks, which generally settle within two business days, of $67.0 million at August 31, 2007, and $54.7 million at August 31, 2006. The company's cash management policy provides for controlled disbursement. As a result, the company had outstanding checks in excess of funds on deposit at certain banks. These amounts, which were $302.6 million as of August 31, 2007, and $575.3 million as of August 31, 2006, are included in trade accounts payable in the accompanying consolidated balance sheets.
Short-Term Investments - Available for Sale The company's short-term investments - available for sale are principally auction rate securities. The company invests in municipal bonds and student obligations and purchases these securities at par. While the underlying security is issued as a long-term investment, they typically can be purchased and sold every 7, 28 and 35 days. The trading of auction rate securities takes place through a descending price auction with the interest rate reset at the beginning of each holding period. At the end of each holding period the interest is paid to the investor. At August 31, 2007, there were no holdings of auction rate securities compared to $415.1 million in fiscal 2006. There were no significant unrealized gains on these securities at August 31, 2006.
Financial InstrumentsThe company had $76.9 million and $105.1 million of outstanding letters of credit at August 31, 2007 and 2006, respectively, which guarantee foreign trade purchases. Additional outstanding letters of credit of $276.8 million and $282.2 million at August 31, 2007 and 2006, respectively, guarantee payments of casualty claims. The casualty claim letters of credit are annually renewable and will remain in place until the casualty claims are paid in full. Letters of credit of $12.2 million and $1.7 million were outstanding at August 31, 2007, and August 31, 2006, respectively, to guarantee performance of construction contracts. The company pays a facility fee to the financing bank to keep these letters of credit active. The company had real estate development purchase commitments of $980.4 million and $782.8 million at August 31, 2007 and 2006, respectively.
There were no investments in derivative financial instruments during fiscal 2007 and 2006 except for the embedded derivative contained with the conversion features of the $28.5 million of convertible debt acquired in the Option Care, Inc. and affiliated companies acquisition. The value of such derivative is not material and the debt was retired on September 6, 2007.
Table of Contents
(1) Summary of Major Accounting Policies

InventoriesInventories are valued on a lower of last-in, first-out (LIFO) cost or market basis. At August 31, 2007 and 2006, inventories would have been greater by $968.8 million and $899.5 million, respectively, if they had been valued on a lower of first-in, first-out (FIFO) cost or market basis. Inventory includes product cost, inbound freight, warehousing costs and vendor allowances not included as a reduction of advertising expense.
Cost of SalesCost of sales is derived based upon point-of-sale scanning information with an estimate for shrinkage and is adjusted based on periodic inventories. In addition to merchandise cost, cost of sales includes warehousing costs, purchasing costs, freight costs, cash discounts and vendor allowances not included as a reduction of advertising expense.
Vendor AllowancesVendor allowances are principally received as a result of purchase levels, sales or promotion of vendors' products. Allowances are generally recorded as a reduction of inventory and are recognized as a reduction of cost of sales when the related merchandise is sold. Those allowances received for promoting vendors' products are offset against advertising expense and result in a reduction of selling, occupancy and administration expenses to the extent of advertising costs incurred, with the excess treated as a reduction of inventory costs.
Property and EquipmentDepreciation is provided on a straight-line basis over the estimated useful lives of owned assets. Leasehold improvements and leased properties under capital leases are amortized over the estimated physical life of the property or over the term of the lease, whichever is shorter. Estimated useful lives range from 12 1/2 to 39 years for land improvements, buildings and building improvements and 3 to 12 1/2 years for equipment. Major repairs, which extend the useful life of an asset, are capitalized in the property and equipment accounts. Routine maintenance and repairs are charged against earnings. The majority of the business uses the composite method of depreciation for equipment; therefore, gains and losses on retirement or other disposition of such assets are included in earnings only when an operating location is closed, completely remodeled or impaired. Fully depreciated property and equipment are removed from the cost and related accumulated depreciation and amortization accounts. Property and equipment consists of (In Millions):
The company capitalizes application stage development costs for significant internally developed software projects, including "Patient Logix," a home care operating system; "Ad Planning," an advertising system and "Capacity Management Logistics Enhancements," upgrades to merchandise ordering systems. These costs are amortized over a five-year period. Amortization was $29.3 million in 2007, $24.2 million in 2006 and $20.4 million in 2005. Unamortized costs as of August 31, 2007 and 2006, were $143.5 million and $109.6 million, respectively.
Table of Contents
2007 2006 Land and land improvements
Owned locations $ 2,011.8 $ 1,667.4 Distribution centers 102.7 94.2 Other locations 211.9 93.5
Buildings and building improvements Owned locations 2,244.9 1,824.6 Leased locations (leasehold improvements only) 581.5 537.6 Distribution centers 553.2 483.4 Other locations 269.9 229.0
Equipment Locations 3,604.2 3,157.7 Distribution centers 879.2 773.3 Other locations 266.0 214.4
Capitalized system development costs 207.9 171.7 Capital lease properties 43.3 40.2 10,976.5 9,287.0 Less: accumulated depreciation and amortization 2,776.6 2,338.1 $ 8,199.9 $ 6,948.9

Goodwill and Other Intangible AssetsGoodwill represents the excess of the purchase price over the fair value of assets acquired and liabilities assumed. The company accounts for goodwill and intangibles under Statement of Financial Accounting Standards (SFAS) No. 142, “Goodwill and Other Intangible Assets,” which does not permit amortization, but requires the company to test goodwill and other indefinite-lived assets for impairment annually or whenever events or circumstances indicate there may be an impairment.
Revenue RecognitionThe company recognizes revenue at the time the customer takes possession of the merchandise. Customer returns are immaterial. Sales taxes are not included in revenue.
Gift CardsThe company sells Walgreens gift cards to our customers in our retail stores and through our website. We do not charge administrative fees on unused gift cards and our gift cards do not have an expiration date. We recognize income from gift cards when (1) the gift card is redeemed by the customer; or (2) the likelihood of the gift card being redeemed by the customer is remote ("gift card breakage") and we determine that we do not have a legal obligation to remit the value of unredeemed gift cards to the relevant jurisdictions. We determine our gift card breakage rate based upon historical redemption patterns. Gift card breakage income was not significant in fiscal 2007, 2006 or 2005.
Impaired Assets and Liabilities for Store ClosingsThe company tests long-lived assets for impairment whenever events or circumstances indicate that a certain asset may be impaired. Store locations that have been open at least five years are reviewed for impairment indicators at least annually. Once identified, the amount of the impairment is computed by comparing the carrying value of the assets to the fair value, which is based on the discounted estimated future cash flows. Impairment charges included in selling, occupancy and administration expense were $9.6 million in 2007, $22.1 million in 2006 and $14.5 million in 2005.
The company also provides for future costs related to closed locations. The liability is based on the present value of future rent obligations and other related costs (net of estimated sublease rent) to the first lease option date.
InsuranceThe company obtains insurance coverage for catastrophic exposures as well as those risks required by law to be insured. It is the company's policy to retain a significant portion of certain losses related to workers' compensation; property losses, as well as business interruption relating from such losses; and comprehensive general, pharmacist and vehicle liability. Provisions for these losses are not discounted and are recorded based upon the company's estimates for claims incurred. The provisions are estimated in part by considering historical claims experience, demographic factors and other actuarial assumptions.
Pre-Opening Expenses Non-capital expenditures incurred prior to the opening of a new or remodeled store are expensed as incurred.
Advertising CostsAdvertising costs, which are reduced by the portion funded by vendors, are expensed as incurred. Net advertising expenses, which are included in selling, occupancy and administration expense, were $355.9 million in 2007, $306.9 million in 2006 and $260.3 million in 2005. Included in net advertising expenses were vendor advertising allowances of $169.8 million in 2007, $174.8 million in 2006 and $180.2 million in 2005.
Stock-Based Compensation Plans As of September 1, 2005, the company adopted SFAS No. 123(R), "Share-Based Payment," using the modified prospective transition method. Under this method, compensation expense is recognized for new grants beginning with fiscal 2006 and any unvested grants prior to the adoption of SFAS No. 123(R). The company recognizes compensation expense on a straight-line basis over the employee's vesting period or to the employee's retirement eligible date, if earlier. In accordance with the modified prospective transition method, the financial statements for prior periods have not been restated.
Table of Contents
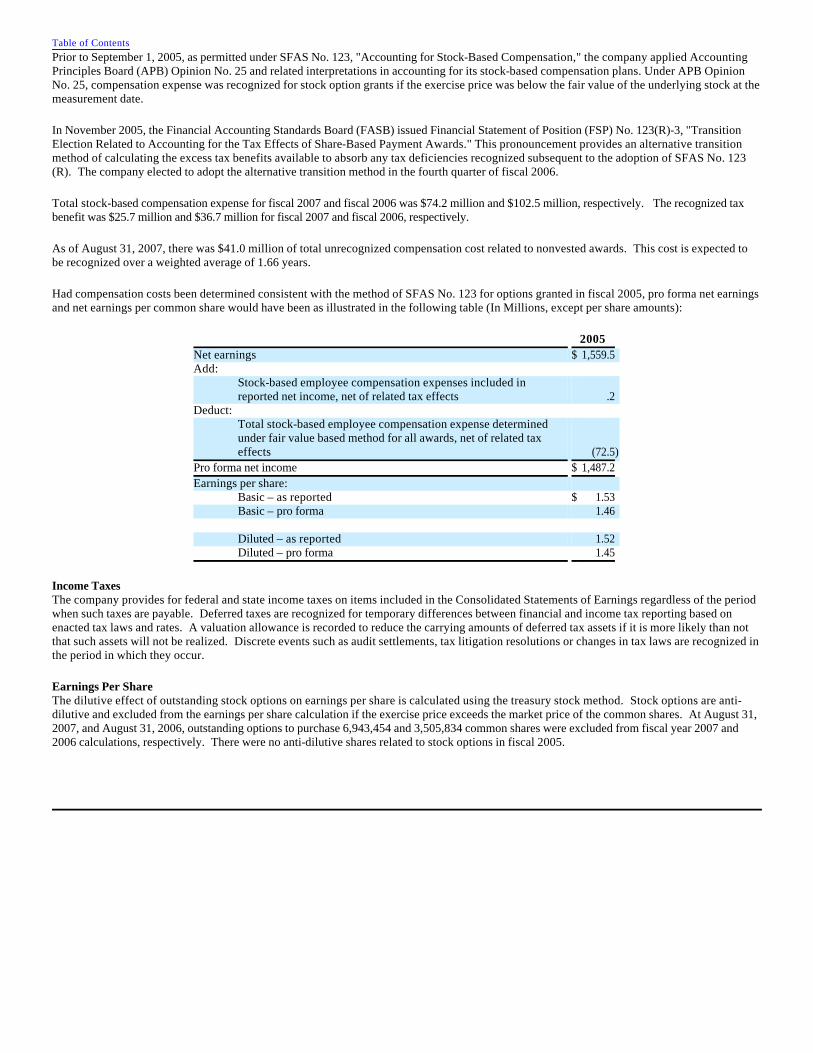
Prior to September 1, 2005, as permitted under SFAS No. 123, "Accounting for Stock-Based Compensation," the company applied Accounting Principles Board (APB) Opinion No. 25 and related interpretations in accounting for its stock-based compensation plans. Under APB Opinion No. 25, compensation expense was recognized for stock option grants if the exercise price was below the fair value of the underlying stock at the measurement date.
In November 2005, the Financial Accounting Standards Board (FASB) issued Financial Statement of Position (FSP) No. 123(R)-3, "Transition Election Related to Accounting for the Tax Effects of Share-Based Payment Awards." This pronouncement provides an alternative transition method of calculating the excess tax benefits available to absorb any tax deficiencies recognized subsequent to the adoption of SFAS No. 123(R). The company elected to adopt the alternative transition method in the fourth quarter of fiscal 2006.
Total stock-based compensation expense for fiscal 2007 and fiscal 2006 was $74.2 million and $102.5 million, respectively. The recognized tax benefit was $25.7 million and $36.7 million for fiscal 2007 and fiscal 2006, respectively.
As of August 31, 2007, there was $41.0 million of total unrecognized compensation cost related to nonvested awards. This cost is expected to be recognized over a weighted average of 1.66 years.
Had compensation costs been determined consistent with the method of SFAS No. 123 for options granted in fiscal 2005, pro forma net earnings and net earnings per common share would have been as illustrated in the following table (In Millions, except per share amounts):
Income TaxesThe company provides for federal and state income taxes on items included in the Consolidated Statements of Earnings regardless of the period when such taxes are payable. Deferred taxes are recognized for temporary differences between financial and income tax reporting based on enacted tax laws and rates. A valuation allowance is recorded to reduce the carrying amounts of deferred tax assets if it is more likely than not that such assets will not be realized. Discrete events such as audit settlements, tax litigation resolutions or changes in tax laws are recognized in the period in which they occur.
Earnings Per ShareThe dilutive effect of outstanding stock options on earnings per share is calculated using the treasury stock method. Stock options are anti-dilutive and excluded from the earnings per share calculation if the exercise price exceeds the market price of the common shares. At August 31, 2007, and August 31, 2006, outstanding options to purchase 6,943,454 and 3,505,834 common shares were excluded from fiscal year 2007 and 2006 calculations, respectively. There were no anti-dilutive shares related to stock options in fiscal 2005.
Table of Contents
2005 Net earnings $ 1,559.5 Add:
Stock-based employee compensation expenses included in reported net income, net of related tax effects .2
Deduct: Total stock-based employee compensation expense determined under fair value based method for all awards, net of related tax effects (72.5)
Pro forma net income $ 1,487.2 Earnings per share:
Basic – as reported $ 1.53 Basic – pro forma 1.46
Diluted – as reported 1.52 Diluted – pro forma 1.45
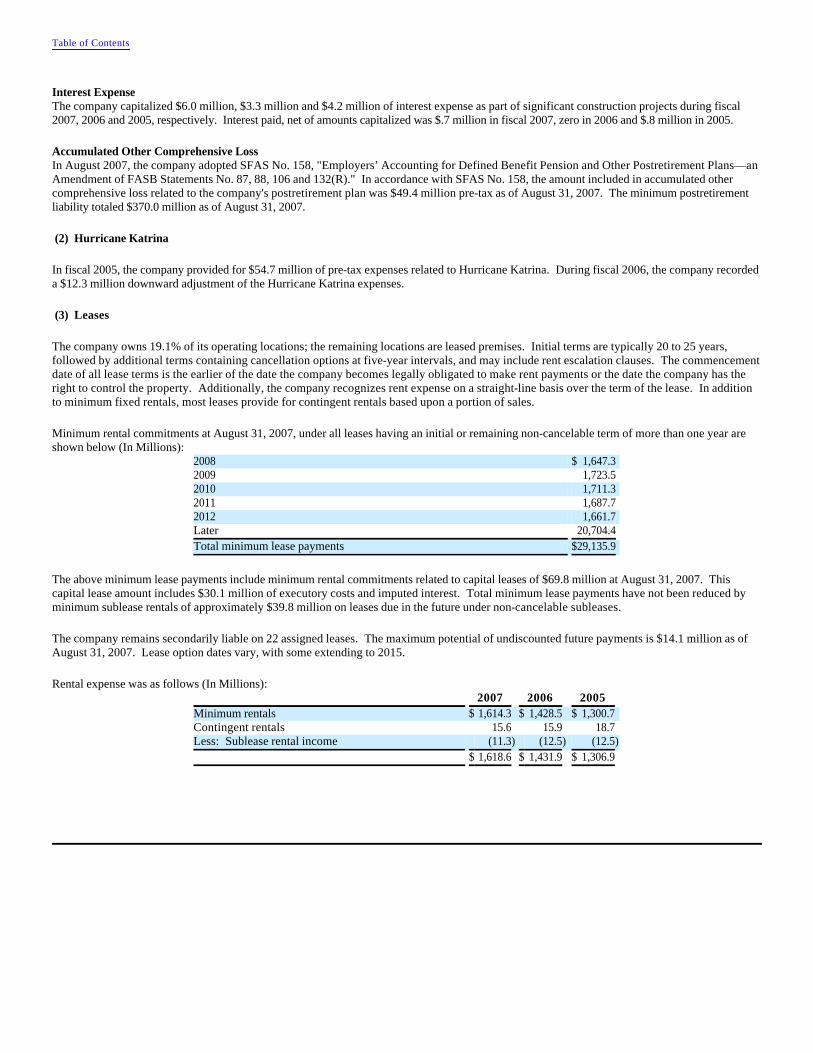
Interest ExpenseThe company capitalized $6.0 million, $3.3 million and $4.2 million of interest expense as part of significant construction projects during fiscal 2007, 2006 and 2005, respectively. Interest paid, net of amounts capitalized was $.7 million in fiscal 2007, zero in 2006 and $.8 million in 2005.
Accumulated Other Comprehensive LossIn August 2007, the company adopted SFAS No. 158, "Employers’ Accounting for Defined Benefit Pension and Other Postretirement Plans—an Amendment of FASB Statements No. 87, 88, 106 and 132(R)." In accordance with SFAS No. 158, the amount included in accumulated other comprehensive loss related to the company's postretirement plan was $49.4 million pre-tax as of August 31, 2007. The minimum postretirement liability totaled $370.0 million as of August 31, 2007.
In fiscal 2005, the company provided for $54.7 million of pre-tax expenses related to Hurricane Katrina. During fiscal 2006, the company recorded a $12.3 million downward adjustment of the Hurricane Katrina expenses.
The company owns 19.1% of its operating locations; the remaining locations are leased premises. Initial terms are typically 20 to 25 years, followed by additional terms containing cancellation options at five-year intervals, and may include rent escalation clauses. The commencement date of all lease terms is the earlier of the date the company becomes legally obligated to make rent payments or the date the company has the right to control the property. Additionally, the company recognizes rent expense on a straight-line basis over the term of the lease. In addition to minimum fixed rentals, most leases provide for contingent rentals based upon a portion of sales.
Minimum rental commitments at August 31, 2007, under all leases having an initial or remaining non-cancelable term of more than one year are shown below (In Millions):
The above minimum lease payments include minimum rental commitments related to capital leases of $69.8 million at August 31, 2007. This capital lease amount includes $30.1 million of executory costs and imputed interest. Total minimum lease payments have not been reduced by minimum sublease rentals of approximately $39.8 million on leases due in the future under non-cancelable subleases.
The company remains secondarily liable on 22 assigned leases. The maximum potential of undiscounted future payments is $14.1 million as of August 31, 2007. Lease option dates vary, with some extending to 2015.
Rental expense was as follows (In Millions):
Table of Contents
(2) Hurricane Katrina
(3) Leases
2008 $ 1,647.3 2009 1,723.5 2010 1,711.3 2011 1,687.7 2012 1,661.7 Later 20,704.4 Total minimum lease payments $29,135.9
2007 2006 2005 Minimum rentals $ 1,614.3 $ 1,428.5 $ 1,300.7 Contingent rentals 15.6 15.9 18.7 Less: Sublease rental income (11.3) (12.5) (12.5) $ 1,618.6 $ 1,431.9 $ 1,306.9
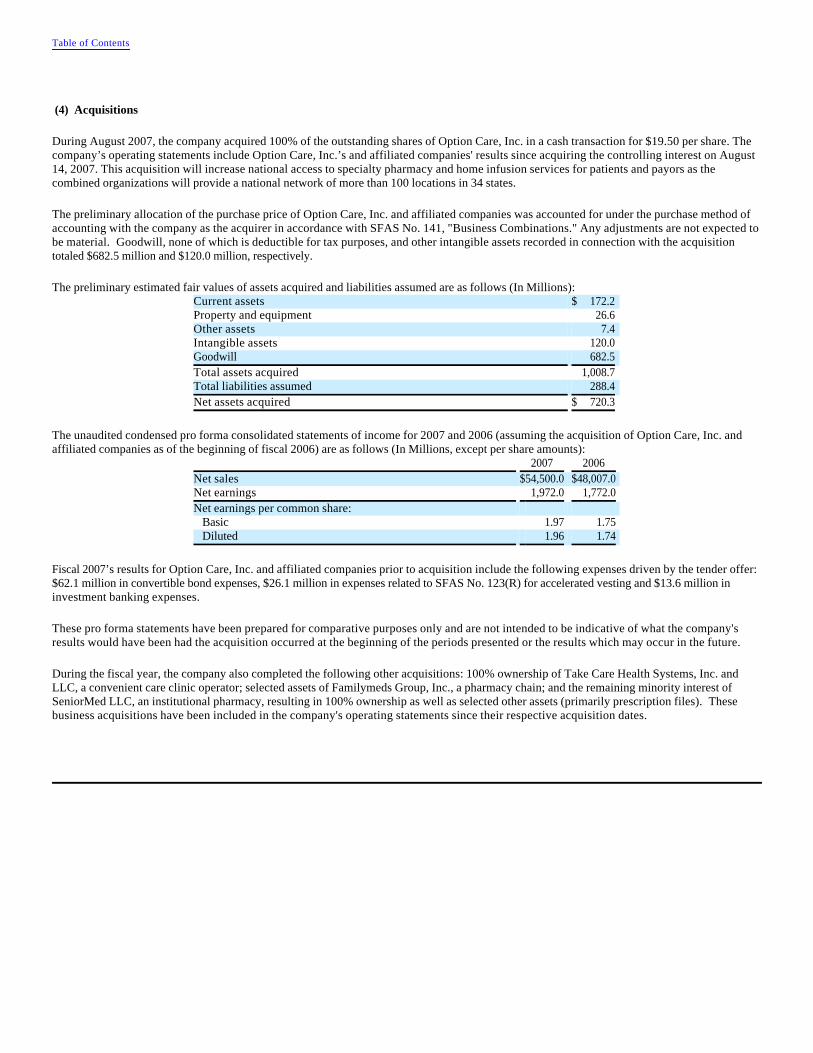
During August 2007, the company acquired 100% of the outstanding shares of Option Care, Inc. in a cash transaction for $19.50 per share. The company’s operating statements include Option Care, Inc.’s and affiliated companies' results since acquiring the controlling interest on August 14, 2007. This acquisition will increase national access to specialty pharmacy and home infusion services for patients and payors as the combined organizations will provide a national network of more than 100 locations in 34 states.
The preliminary allocation of the purchase price of Option Care, Inc. and affiliated companies was accounted for under the purchase method of accounting with the company as the acquirer in accordance with SFAS No. 141, "Business Combinations." Any adjustments are not expected to be material. Goodwill, none of which is deductible for tax purposes, and other intangible assets recorded in connection with the acquisition totaled $682.5 million and $120.0 million, respectively.
The preliminary estimated fair values of assets acquired and liabilities assumed are as follows (In Millions):
The unaudited condensed pro forma consolidated statements of income for 2007 and 2006 (assuming the acquisition of Option Care, Inc. and affiliated companies as of the beginning of fiscal 2006) are as follows (In Millions, except per share amounts):
Fiscal 2007’s results for Option Care, Inc. and affiliated companies prior to acquisition include the following expenses driven by the tender offer: $62.1 million in convertible bond expenses, $26.1 million in expenses related to SFAS No. 123(R) for accelerated vesting and $13.6 million in investment banking expenses.
These pro forma statements have been prepared for comparative purposes only and are not intended to be indicative of what the company's results would have been had the acquisition occurred at the beginning of the periods presented or the results which may occur in the future.
During the fiscal year, the company also completed the following other acquisitions: 100% ownership of Take Care Health Systems, Inc. and LLC, a convenient care clinic operator; selected assets of Familymeds Group, Inc., a pharmacy chain; and the remaining minority interest of SeniorMed LLC, an institutional pharmacy, resulting in 100% ownership as well as selected other assets (primarily prescription files). These business acquisitions have been included in the company's operating statements since their respective acquisition dates.
Table of Contents
(4) Acquisitions
Current assets $ 172.2 Property and equipment 26.6 Other assets 7.4 Intangible assets 120.0 Goodwill 682.5 Total assets acquired 1,008.7 Total liabilities assumed 288.4 Net assets acquired $ 720.3
2007 2006 Net sales $54,500.0 $48,007.0 Net earnings 1,972.0 1,772.0 Net earnings per common share: Basic 1.97 1.75 Diluted 1.96 1.74

The aggregate purchase price of all business and intangible asset acquisitions, excluding Option Care, Inc. and affiliated companies, was $370.7 million. These acquisitions added $93.8 million to prescription files, $44.8 million to other amortizable intangibles, $9.5 million to trade name and $172.8 million to goodwill ($14.8 million is expected to be deductible for tax purposes). The remaining fair value relates to tangible assets less liabilities assumed. The results of operations of the company for fiscal years 2007, 2006 and 2005 would not be materially different as a result of the other acquisitions and are therefore not presented.
Goodwill is evaluated annually during the fourth quarter of the company's fiscal year. The impairment calculation compares the implied fair value of reporting unit goodwill with the carrying amount of that goodwill. If the carrying amount of reporting unit goodwill exceeds the implied fair value of that goodwill, an impairment loss is recognized in an amount equal to that excess. No impairment related to goodwill occurred in either fiscal 2007 or fiscal 2006.
The carrying amount and accumulated amortization of goodwill and intangible assets consists of the following (In Millions):
Changes to goodwill for fiscal 2007 of $891.8 million and fiscal 2006 of $158.1 million were all additions related to acquisitions.
Amortization expense for intangible assets was $61.9 million in 2007, $45.6 million in 2006 and $18.5 million in 2005. The weighted-average amortization period for purchased prescription files was six years for fiscal 2007 and fiscal 2006. The weighted-average amortization period for purchasing and payor contracts was ten years for fiscal 2007 and fiscal 2006. The weighted-average amortization period for trade names was revised to three years for fiscal 2007 from a preliminary estimate of ten years for fiscal 2006. The weighted-average amortization period for other intangible assets was eleven years for fiscal 2007 and nine years for fiscal 2006.
Expected amortization expense for intangible assets recorded at August 31, 2007, is as follows (In Millions):
Table of Contents
(5) Goodwill and Other Intangible Assets
2007 2006 Purchased prescription files $ 302.4 $ 224.0 Purchasing and payor contracts 175.1 55.0 Trade name 25.9 31.3 Other amortizable intangible assets 86.9 26.1 Goodwill 1,060.2 168.4
Gross carrying amount 1,650.5 504.8 Accumulated amortization - prescription files (83.3) (55.4)Purchasing and payor contracts (8.4) (3.4)Trade name (5.8) (1.1)Accumulated amortization - other (16.4) (10.2)
Total accumulated amortization (113.9) (70.1)Total intangible assets, net $ 1,536.6 $ 434.7
2008 2009 2010 2011 2012 $ 86.3 $ 81.5 $ 68.7 $ 54.4 $ 36.6

The provision for income taxes consists of the following (In Millions):
The deferred tax assets and liabilities included in the Consolidated Balance Sheets consist of the following (In Millions):
Income taxes paid were $1.204 billion, $1.111 billion and $928.2 million during the fiscal years ended August 31, 2007, 2006 and 2005, respectively.
The differences between the statutory federal income tax rate of 35% and the effective tax rates of 36.0%, 36.4% and 36.5% are principally due to state income tax provisions of 2.5%, 2.9% and 2.9% in fiscal years 2007, 2006 and 2005, respectively. Other differences include the resolution of a multistate tax matter in fiscal 2007, the settlement of prior year's Internal Revenue Service matters in fiscal 2006, foreign tax credits in fiscal 2005, and other insignificant matters.
The company had no short-term borrowings in fiscal 2006. In fiscal 2007, the company issued commercial paper to support working capital needs. In connection with the purchase of Option Care, Inc. and affiliated companies, $146.8 million of convertible debt was acquired. Prior to year-end, $118.3 million of convertible debt was retired while $28.5 million remained outstanding at August 31, 2007. On September 6, 2007, the $28.5 million was retired. The short-term debt under the commercial paper program was as follows (In Millions):
The carrying value of the debt approximates the fair value.
Table of Contents
(6) Income Taxes
2007 2006 2005 Current provision -
Federal $ 1,027.9 $ 970.1 $ 841.4 State 96.7 137.4 125.5
1,124.6 1,107.5 966.9 Deferred provision -
Federal 18.3 (88.8) (57.8)State 4.9 (15.2) (13.0)
23.2 (104.0) (70.8) $ 1,147.8 $ 1,003.5 $ 896.1
2007 2006 Deferred tax assets -
Compensation and benefits $ 203.7 $ 177.8 Insurance 191.5 178.4 Postretirement benefits 179.4 126.1 Accrued rent 135.3 130.5 Inventory 44.7 41.0 Legal 44.1 18.8 Other 159.7 103.0
958.4 775.6 Deferred tax liabilities -
Accelerated depreciation 702.6 643.7 Inventory 199.0 142.1 Intangible assets 85.5 - Other 72.2 30.9
1,059.3 816.7 Net deferred tax liabilities $ 100.9 $ 41.1
(7) Short-Term Borrowings
2007 2006 Balance outstanding at fiscal year-end $ 850.0 $ - Maximum outstanding at any month-end 850.0 - Average daily short-term borrowings 32.1 - Weighted-average interest rate 5.36% -%

Related to our commercial paper program, we maintain two unsecured backup syndicated lines of credit that total $1.2 billion. The first $600 million facility expires on August 12, 2008, the second on August 12, 2012. Our ability to access these facilities is subject to our compliance with the terms and conditions of the credit facilities, including financial covenants. The covenants require us to maintain certain financial ratios related to minimum net worth and priority debt, along with limitations on the sale of assets and purchases of investments. As of August 31, 2007, we were in compliance with all such covenants. There were no borrowings against the credit facilities in fiscal 2007. On October 12, 2007, we entered into an additional $100 million unsecured line of credit facility that expires on December 31, 2007. This line of credit is subject to similar covenants as the syndicated lines of credit. The company pays a facility fee to the financing bank to keep this line of credit facility active.
The company is involved in various legal proceedings incidental to the normal course of business and is subject to various investigations, inspections, audits, inquiries and similar actions by governmental authorities responsible for enforcing the laws and regulations to which the company is subject. These include a lawsuit for which a $31 million judgment was entered against the company in October 2006. The company has appealed the judgment and management is of the opinion, based upon the advice of General Counsel, that although the outcome of this and other litigation and investigations cannot be forecast with certainty, the final disposition should not have a material adverse effect on the company's consolidated financial position or results of operations.
The company guarantees a credit agreement on behalf of SureScripts, LLC which provides electronic prescription data services. This credit agreement, for which SureScripts, LLC is primarily liable, has an expiration date of February 16, 2010. The liability was $3.3 million at August 31, 2007, compared to no liability at August 31, 2006. The maximum amount of future payments that could be required to be paid under the guaranty is $25.0 million, of which $12.5 million may be recoverable from another guarantor.
On January 10, 2007, the Board of Directors approved a new stock repurchase program ("2007 repurchase program"), pursuant to which up to $1 billion of the company's common stock may be purchased prior to the expiration date of the program on January 10, 2011. This program was announced in the company's report on Form 8-K, which was filed on January 11, 2007. During fiscal 2007, the company purchased $344.9 million of shares related to the 2007 repurchase program, with a total remaining authorization under the 2007 repurchase program of $655.1 million.
On July 14, 2004, the Board of Directors announced a stock repurchase program ("2004 repurchase program") of up to $1 billion, which has been completely executed in three years. During fiscal 2007, the company purchased $343.2 million of shares related to the 2004 repurchase program, which compares to $289.7 million of shares purchased in fiscal 2006. An additional $375.4 million of shares were purchased to support the long-term needs of the employee stock plans, which compares to $379.1 million in fiscal 2006.
At August 31, 2007, 68,485,634 shares of common stock were reserved for future stock issuances under the company's various employee benefit plans.
The Walgreen Co. Stock Purchase/Option Plan (Share Walgreens) provides for the granting of options to purchase common stock over a ten-year period to eligible non-executive employees upon the purchase of company shares, subject to certain restrictions. Employees may purchase the company shares through cash purchases or loans. For options granted on or after October 1, 2005, the option price is the closing price of a share of common stock on the grant date. Options may be granted under this Plan until September 30, 2012, for an aggregate of 42,000,000 shares of common stock. At August 31, 2007, there were 31,244,546 shares available for future grants. The options granted during fiscal 2007, 2006 and 2005 have a two-year vesting period.
Table of Contents
(8) Contingencies
(9) Capital Stock
(10) Stock Compensation Plans
The Walgreen Co. Executive Stock Option Plan provides for the granting of options to eligible key employees to purchase common stock over a ten-year period, at a price not less than the fair market value on the date of the grant. Under this Plan, options may be granted until January 11, 2016, for an aggregate of 38,400,000 shares of common stock. As of August 31, 2007, 14,571,522 shares were available for future grants. The options granted during fiscal 2007, 2006 and 2005 have a three-year vesting period.
The Walgreen Co. Option 3000 Plan offered a stock option award to all non-executive employees who were employed on May 11, 2000. Each eligible employee, in conjunction with opening the company’s 3,000th store, received a stock option award to purchase from 75 to 500 shares, based on years of service. The Plan authorized the grant of options, issued at fair market value on May 11, 2000, to purchase up to an aggregate of 15,500,000 shares of common stock and 14,891,400 shares were granted. The options vested and became exercisable on May 11, 2003, and any unexercised options will expire on May 10, 2010, subject to earlier termination if the optionee’s employment ends.
The Walgreen Co. Broad Based Employee Stock Option Plan provides for the granting of options to eligible non-executive employees to purchase common stock over a ten-year period, at a price not less than the fair market value on the date of the grant, in connection with the achievement of store opening milestones. Under this Plan, on March 11, 2003, substantially all non-executive employees, in conjunction with the opening of the company's 4,000th store, were granted a stock option to purchase 100 shares. The Plan authorized the grant of an aggregate of 15,000,000 shares of common stock. As of August 31, 2007, 7,242,755 shares were available for future grants. The options vested and became exercisable on March 11, 2006, and any unexercised options will expire on March 10, 2013, subject to earlier termination if the optionee’s employment ends.
The Walgreen Co. 1982 Employees Stock Purchase Plan permits eligible employees to purchase common stock at 90% of the fair market value at the date of purchase. Employees may purchase shares through cash purchases, loans or payroll deductions up to certain limits. The aggregate number of shares that may be purchased under this Plan is 74,000,000. At August 31, 2007, 5,442,611 shares were available for future purchase.
The Walgreen Co. Long-Term Performance Incentive Plan (amended and restated Restricted Performance Share Plan) was approved by the shareholders on January 10, 2007. The Plan offers performance-based incentive awards and equity-based awards to key employees. The fiscal 2007 awards are subject to restrictions as to continuous employment except in the case of death, normal retirement or total and permanent disability. Restrictions generally lapse over a multiyear period from the date of grant. The Long-Term Performance Incentive Plan was authorized to grant an aggregate of 10,000,000 shares of common stock (which constituted a significant reduction from the then remaining authorized shares under the Restricted Performance Share Plan). At August 31, 2007, 9,984,200 shares were available for future issuance under the Long-Term Performance Incentive Plan. Compensation expense is recognized in the year of grant. Compensation expense related to the Plan was $11.7 million in fiscal 2007, $8.8 million in fiscal 2006 and $11.1 million in fiscal 2005.
The Walgreen Co. Nonemployee Director Stock Plan provides that each nonemployee director receives an equity grant of shares each year on November 1. Through fiscal year 2007, the Plan determined the number of shares granted by dividing $100,000 by the price of a share of common stock on November 1. Each nonemployee director may elect to receive this annual share grant in the form of shares or deferred stock units. During the term of the Plan, each nonemployee director will also receive 50% of his or her quarterly retainer in the form of shares, which may be deferred into an equal number of stock units. In addition, a nonemployee director may elect to defer all or a portion of the cash component of his or her quarterly retainer, meeting fees and committee chair retainer in the form of deferred stock units or to have such amounts placed in a deferred cash compensation account. Each nonemployee director received a grant of 2,375 shares in fiscal 2007, 1,771 shares in fiscal 2006 and 2,211 shares in fiscal 2005. New directors in any of the fiscal years were given a prorated amount.
Table of Contents
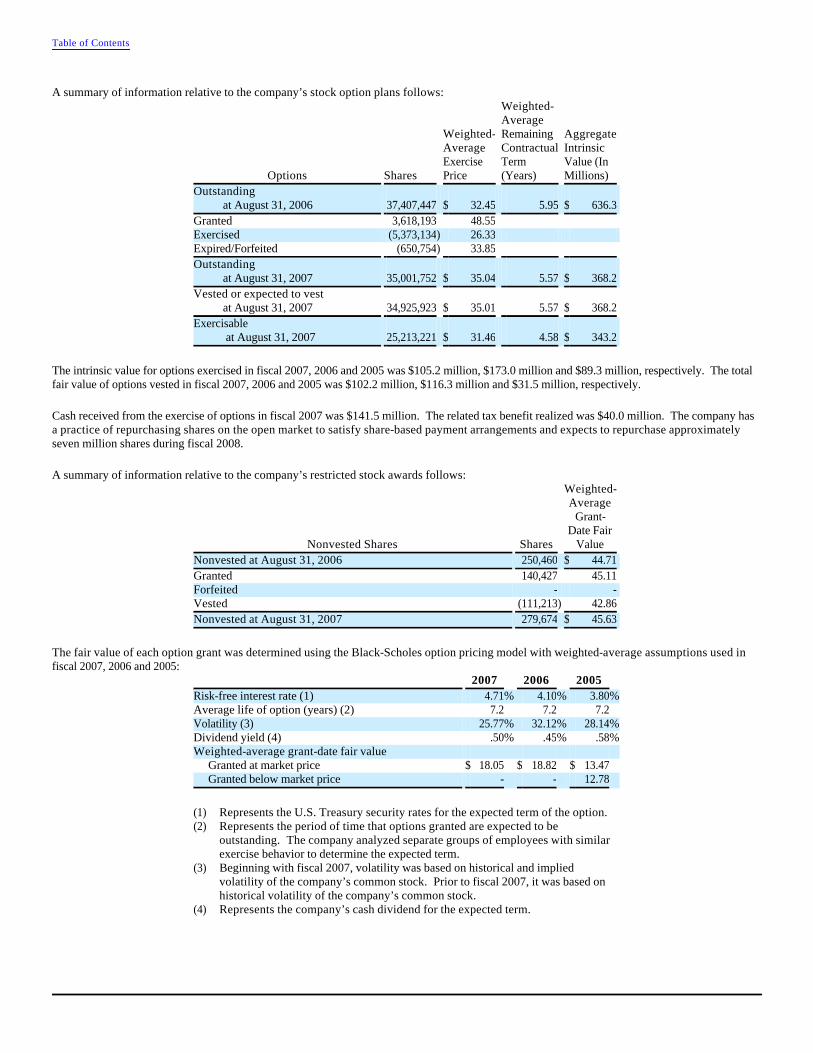
A summary of information relative to the company’s stock option plans follows:
The intrinsic value for options exercised in fiscal 2007, 2006 and 2005 was $105.2 million, $173.0 million and $89.3 million, respectively. The total fair value of options vested in fiscal 2007, 2006 and 2005 was $102.2 million, $116.3 million and $31.5 million, respectively.
Cash received from the exercise of options in fiscal 2007 was $141.5 million. The related tax benefit realized was $40.0 million. The company has a practice of repurchasing shares on the open market to satisfy share-based payment arrangements and expects to repurchase approximately seven million shares during fiscal 2008.
A summary of information relative to the company’s restricted stock awards follows:
The fair value of each option grant was determined using the Black-Scholes option pricing model with weighted-average assumptions used in fiscal 2007, 2006 and 2005:
Table of Contents
Options Shares
Weighted-Average Exercise Price
Weighted-Average Remaining Contractual Term (Years)
Aggregate Intrinsic Value (In Millions)
Outstanding at August 31, 2006 37,407,447 $ 32.45 5.95 $ 636.3 Granted 3,618,193 48.55 Exercised (5,373,134) 26.33 Expired/Forfeited (650,754) 33.85 Outstanding at August 31, 2007 35,001,752 $ 35.04 5.57 $ 368.2 Vested or expected to vest at August 31, 2007 34,925,923 $ 35.01 5.57 $ 368.2 Exercisable at August 31, 2007 25,213,221 $ 31.46 4.58 $ 343.2
Nonvested Shares Shares
Weighted-Average
Grant-Date Fair
Value Nonvested at August 31, 2006 250,460 $ 44.71 Granted 140,427 45.11 Forfeited - - Vested (111,213) 42.86 Nonvested at August 31, 2007 279,674 $ 45.63
2007 2006 2005 Risk-free interest rate (1) 4.71% 4.10% 3.80%Average life of option (years) (2) 7.2 7.2 7.2 Volatility (3) 25.77% 32.12% 28.14%Dividend yield (4) .50% .45% .58%Weighted-average grant-date fair value Granted at market price $ 18.05 $ 18.82 $ 13.47 Granted below market price - - 12.78
(1) Represents the U.S. Treasury security rates for the expected term of the option.(2) Represents the period of time that options granted are expected to be
outstanding. The company analyzed separate groups of employees with similar exercise behavior to determine the expected term.
(3) Beginning with fiscal 2007, volatility was based on historical and implied volatility of the company’s common stock. Prior to fiscal 2007, it was based on historical volatility of the company’s common stock.
(4) Represents the company’s cash dividend for the expected term.

The principal retirement plan for employees is the Walgreen Profit-Sharing Retirement Plan to which both the company and the employees contribute. The company's contribution, which is determined annually at the discretion of the Board of Directors, has historically related to pre-tax income. The profit-sharing provision was $283.7 million in 2007, $245.0 million in 2006 and $218.5 million in 2005. The company's contributions were $253.0 million for 2007, $216.1 million for 2006 and $262.3 million for 2005.
The company provides certain health insurance benefits for retired employees who meet eligibility requirements, including age, years of service and date of hire. The costs of these benefits are accrued over the period earned. The company's postretirement health benefit plans are not funded.
In August 2007, the company adopted SFAS No. 158. SFAS No. 158 requires companies to reflect the plans' funded status on their balance sheet. The difference between the plans' funded status and the balance sheet position is recognized, net of tax, as a component of Accumulated Other Comprehensive Loss as of the measurement date of August 31, 2007.
The following table reflects the effect of the initial adoption of SFAS No. 158 on the company’s balance sheet (In Millions):
The deferred tax asset computed for the adoption of SFAS No. 158 excludes the Medicare Part D federal retiree subsidy that is non-taxable.
Components of net periodic benefit costs (In Millions):
Change in benefit obligation (In Millions):
Table of Contents
(11) Retirement Benefits
Before Adoption of SFAS No. 158
SFAS No. 158
Adjustment
After Adoption of SFAS No. 158
Total Assets $ 19,313.6 $ - $ 19,313.6 Deferred income taxes 203.7 (45.5) 158.2 Other non-current liabilities 1,257.4 49.4 1,306.8 Accumulated other comprehensive loss - (3.9) (3.9) Total Shareholders’ Equity 11,108.2 (3.9) 11,104.3
Total Liabilities and Shareholders' Equity $ 19,313.6 $ - $ 19,313.6
2007 2006 2005 Service cost $ 13.7 $ 18.3 $ 22.0 Interest cost 22.0 21.4 23.6 Amortization of actuarial loss 5.7 8.8 10.6 Amortization of prior service cost (4.4) (4.1) (3.6)Transition obligation - - 4.9 Total postretirement benefit cost $ 37.0 $ 44.4 $ 57.5
2007 2006 Benefit obligation at September 1 $ 356.0 $ 391.8 Service cost 13.7 18.3 Interest cost 22.0 21.4 Amendments (.1) (5.0)Actuarial gain (13.9) (62.7)Benefit payments (10.5) (8.8)Participants contributions 2.8 1.0 Benefit obligation at August 31 $ 370.0 $ 356.0
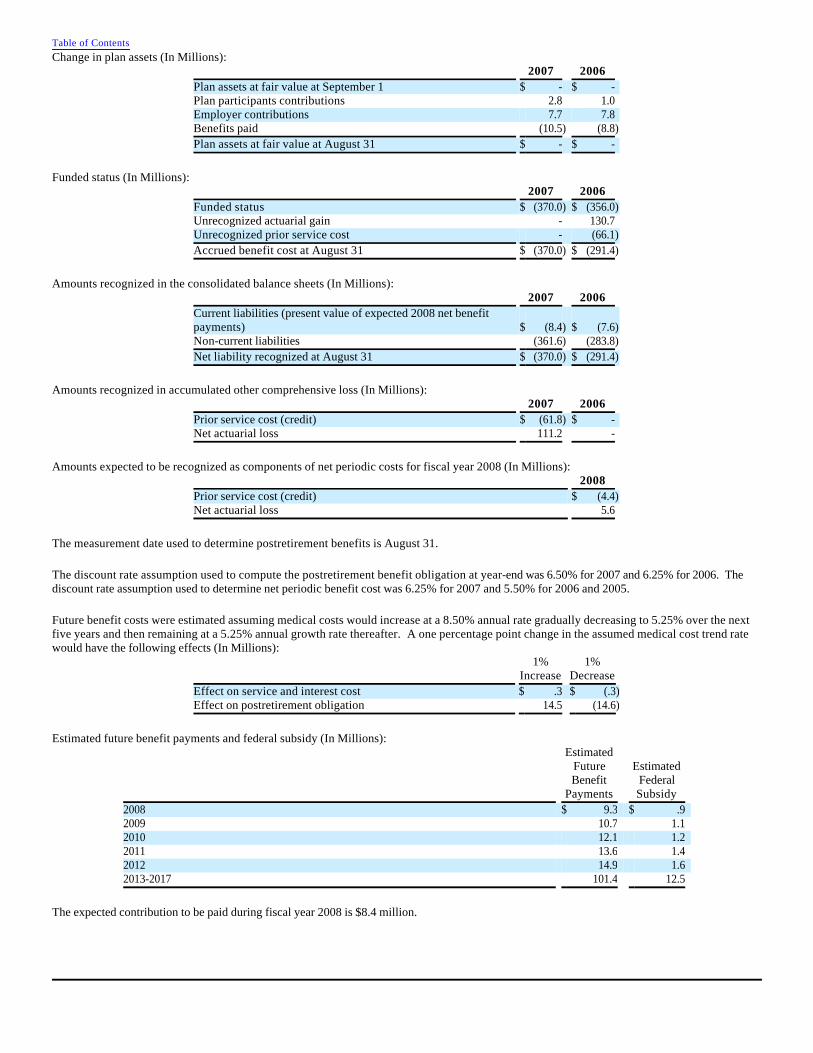
Change in plan assets (In Millions):
Funded status (In Millions):
Amounts recognized in the consolidated balance sheets (In Millions):
Amounts recognized in accumulated other comprehensive loss (In Millions):
Amounts expected to be recognized as components of net periodic costs for fiscal year 2008 (In Millions):
The measurement date used to determine postretirement benefits is August 31.
The discount rate assumption used to compute the postretirement benefit obligation at year-end was 6.50% for 2007 and 6.25% for 2006. The discount rate assumption used to determine net periodic benefit cost was 6.25% for 2007 and 5.50% for 2006 and 2005.
Future benefit costs were estimated assuming medical costs would increase at a 8.50% annual rate gradually decreasing to 5.25% over the next five years and then remaining at a 5.25% annual growth rate thereafter. A one percentage point change in the assumed medical cost trend rate would have the following effects (In Millions):
Estimated future benefit payments and federal subsidy (In Millions):
The expected contribution to be paid during fiscal year 2008 is $8.4 million.
Table of Contents
2007 2006 Plan assets at fair value at September 1 $ - $ - Plan participants contributions 2.8 1.0 Employer contributions 7.7 7.8 Benefits paid (10.5) (8.8)Plan assets at fair value at August 31 $ - $ -
2007 2006 Funded status $ (370.0) $ (356.0)Unrecognized actuarial gain - 130.7 Unrecognized prior service cost - (66.1)Accrued benefit cost at August 31 $ (370.0) $ (291.4)
2007 2006 Current liabilities (present value of expected 2008 net benefit payments) $ (8.4) $ (7.6)Non-current liabilities (361.6) (283.8)Net liability recognized at August 31 $ (370.0) $ (291.4)
2007 2006 Prior service cost (credit) $ (61.8) $ - Net actuarial loss 111.2 -
2008 Prior service cost (credit) $ (4.4)Net actuarial loss 5.6
1%
Increase 1%
Decrease Effect on service and interest cost $ .3 $ (.3)Effect on postretirement obligation 14.5 (14.6)
Estimated Future Benefit
Payments
Estimated Federal Subsidy
2008 $ 9.3 $ .9 2009 10.7 1.1 2010 12.1 1.2 2011 13.6 1.4 2012 14.9 1.6 2013-2017 101.4 12.5

Non-cash transactions in fiscal 2007 included the identification of $85.5 million of deferred taxes associated with amortizable intangible assets related to acquisitions; $49.4 million in postretirement benefit liabilities related to the adoption of SFAS No. 158; $83.1 million in accrued liabilities related to the purchase of property and equipment; $5.2 million of incurred direct acquisition costs; $4.4 million related to a leasehold interest and $16.0 million in dividends declared.
Included in the Consolidated Balance Sheets captions are the following assets and liabilities (In Millions):
Summary of Quarterly Results (Unaudited)(In Millions, except per share amounts)
Comments on Quarterly Results: In further explanation of and supplemental to the quarterly results, the 2007 fourth quarter LIFO adjustment was a charge of $32.0 million compared to a 2006 charge of $26.1 million.
Table of Contents
(12) Supplementary Financial Information
2007 2006 Accounts receivable -
Accounts receivable $ 2,306.2 $ 2,120.0 Allowance for doubtful accounts (69.7) (57.3)
$ 2,236.5 $ 2,062.7 Accrued expenses and other liabilities -
Accrued salaries $ 651.7 $ 598.2 Taxes other than income taxes 358.8 279.3 Profit sharing 184.8 164.8 Insurance 144.2 145.1 Other 764.9 525.9
$ 2,104.4 $ 1,713.3 Other non-current liabilities -
Postretirement healthcare benefits $ 361.6 $ 283.8 Insurance 338.8 304.8 Other 606.4 530.3
$ 1,306.8 $ 1,118.9
Quarter Ended
November February May August Fiscal Year
Fiscal 2007 Net sales $ 12,708.5 $ 13,933.7 $ 13,698.3 $ 13,421.5 $ 53,762.0 Gross profit 3,575.6 4,035.8 3,877.2 3,755.3 15,243.9 Net earnings 431.7 651.9 561.2 396.5 2,041.3
Per Common Share - Basic $ .43 $ .65 $ .56 $ .40 $ 2.04 Diluted .43 .65 .56 .40 2.03
Cash Dividends Declared Per Common Share $ .0775 $ .0775 $ .0775 $ .0950 $ .3275 Fiscal 2006
Net sales $ 10,900.4 $ 12,163.1 $ 12,175.2 $ 12,170.3 $ 47,409.0 Gross profit 3,002.5 3,459.3 3,343.2 3,363.6 13,168.6 Net earnings 345.6 523.5 469.2 412.3 1,750.6
Per Common Share - Basic $ .34 $ .52 $ .46 $ .41 $ 1.73 Diluted .34 .51 .46 .41 1.72
Cash Dividends Declared Per Common Share $ .0650 $ .0650 $ .0650 $ .0775 $ .2725
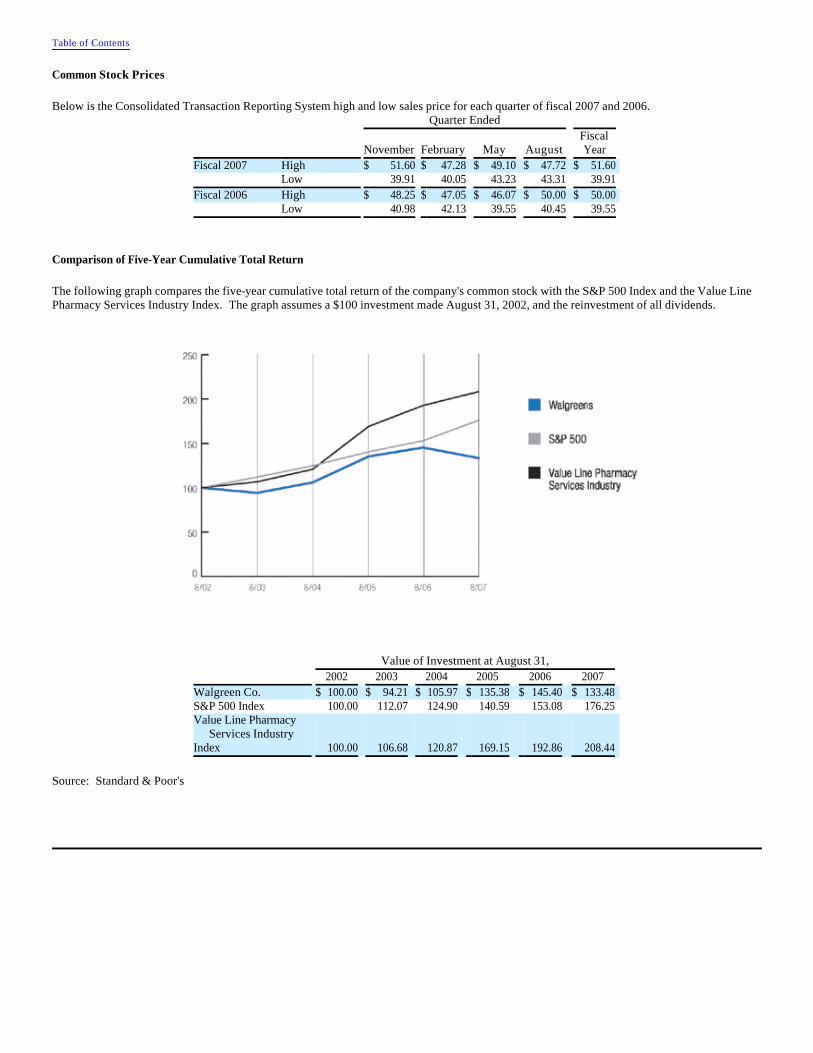
Common Stock Prices
Below is the Consolidated Transaction Reporting System high and low sales price for each quarter of fiscal 2007 and 2006.
Comparison of Five-Year Cumulative Total Return
The following graph compares the five-year cumulative total return of the company's common stock with the S&P 500 Index and the Value Line Pharmacy Services Industry Index. The graph assumes a $100 investment made August 31, 2002, and the reinvestment of all dividends.
Source: Standard & Poor's
Table of Contents
Quarter Ended
November February May August Fiscal Year
Fiscal 2007 High $ 51.60 $ 47.28 $ 49.10 $ 47.72 $ 51.60 Low 39.91 40.05 43.23 43.31 39.91 Fiscal 2006 High $ 48.25 $ 47.05 $ 46.07 $ 50.00 $ 50.00 Low 40.98 42.13 39.55 40.45 39.55
Value of Investment at August 31, 2002 2003 2004 2005 2006 2007 Walgreen Co. $ 100.00 $ 94.21 $ 105.97 $ 135.38 $ 145.40 $ 133.48 S&P 500 Index 100.00 112.07 124.90 140.59 153.08 176.25 Value Line Pharmacy Services Industry Index 100.00 106.68 120.87 169.15 192.86 208.44
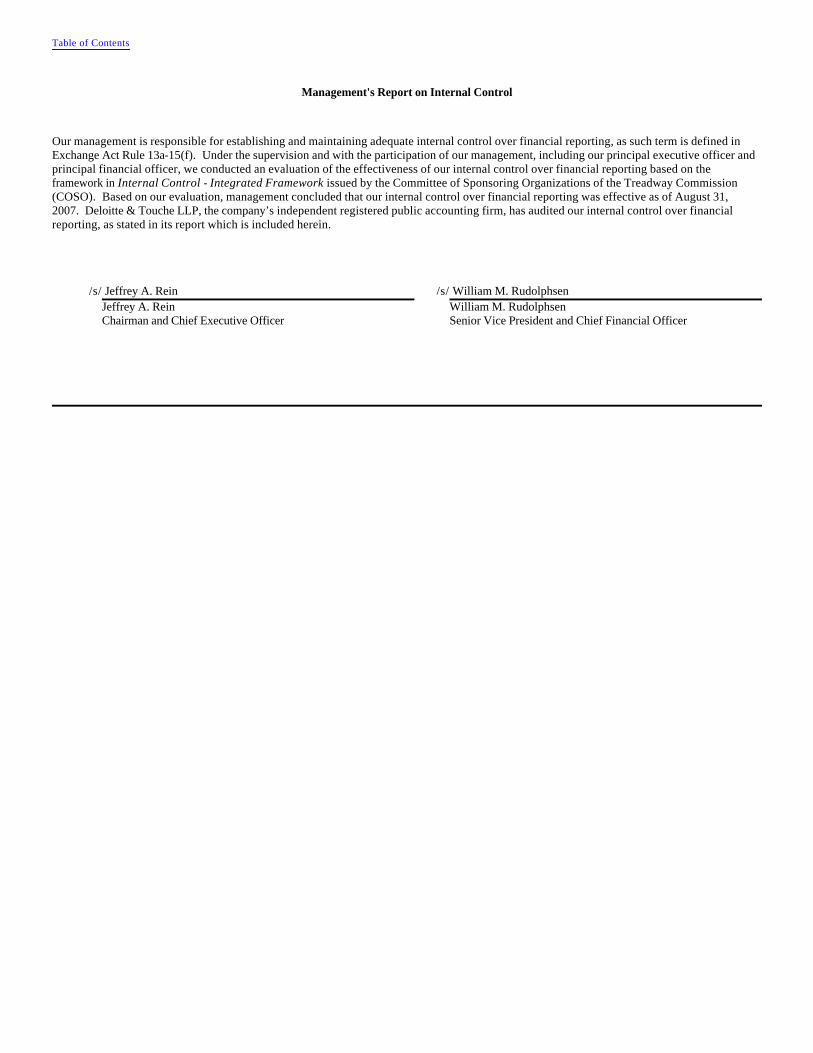
Management's Report on Internal Control
Our management is responsible for establishing and maintaining adequate internal control over financial reporting, as such term is defined in Exchange Act Rule 13a-15(f). Under the supervision and with the participation of our management, including our principal executive officer and principal financial officer, we conducted an evaluation of the effectiveness of our internal control over financial reporting based on the framework in Internal Control - Integrated Framework issued by the Committee of Sponsoring Organizations of the Treadway Commission (COSO). Based on our evaluation, management concluded that our internal control over financial reporting was effective as of August 31, 2007. Deloitte & Touche LLP, the company’s independent registered public accounting firm, has audited our internal control over financial reporting, as stated in its report which is included herein.
Table of Contents
/s/ Jeffrey A. Rein /s/ William M. Rudolphsen Jeffrey A. Rein William M. Rudolphsen Chairman and Chief Executive Officer Senior Vice President and Chief Financial Officer

Report of Independent Registered Public Accounting Firm
To the Board of Directors and Shareholders of Walgreen Co.:
We have audited the accompanying consolidated balance sheets of Walgreen Co. and Subsidiaries (the “Company”) as of August 31, 2007 and 2006, and the related consolidated statements of earnings, shareholders’ equity, and cash flows for each of the three years in the period ended August 31, 2007. We also have audited the Company’s internal control over financial reporting as of August 31, 2007, based on criteria established in Internal Control – Integrated Framework issued by the Committee of Sponsoring Organizations of the Treadway Commission. The Company’s management is responsible for these financial statements, for maintaining effective internal control over financial reporting, and for its assessment of the effectiveness of internal control over financial reporting, included in the accompanying Management’s Report on Internal Control. Our responsibility is to express an opinion on these financial statements and an opinion on the Company’s internal control over financial reporting based on our audits.
We conducted our audits in accordance with the standards of the Public Company Accounting Oversight Board (United States). Those standards require that we plan and perform the audit to obtain reasonable assurance about whether the financial statements are free of material misstatement and whether effective internal control over financial reporting was maintained in all material respects. Our audits of the financial statements included examining, on a test basis, evidence supporting the amounts and disclosures in the financial statements, assessing the accounting principles used and significant estimates made by management, and evaluating the overall financial statement presentation. Our audit of internal control over financial reporting included obtaining an understanding of internal control over financial reporting, assessing the risk that a material weakness exists, and testing and evaluating the design and operating effectiveness of internal control based on the assessed risk. Our audits also included performing such other procedures as we considered necessary in the circumstances. We believe that our audits provide a reasonable basis for our opinions.
A company’s internal control over financial reporting is a process designed by, or under the supervision of, the company’s principal executive and principal financial officers, or persons performing similar functions, and effected by the company’s board of directors, management, and other personnel to provide reasonable assurance regarding the reliability of financial reporting and the preparation of financial statements for external purposes in accordance with generally accepted accounting principles. A company’s internal control over financial reporting includes those policies and procedures that (1) pertain to the maintenance of records that, in reasonable detail, accurately and fairly reflect the transactions and dispositions of the assets of the company; (2) provide reasonable assurance that transactions are recorded as necessary to permit preparation of financial statements in accordance with generally accepted accounting principles, and that receipts and expenditures of the company are being made only in accordance with authorizations of management and directors of the company; and (3) provide reasonable assurance regarding prevention or timely detection of unauthorized acquisition, use, or disposition of the company’s assets that could have a material effect on the financial statements.
Because of the inherent limitations of internal control over financial reporting, including the possibility of collusion or improper management override of controls, material misstatements due to error or fraud may not be prevented or detected on a timely basis. Also, projections of any evaluation of the effectiveness of the internal control over financial reporting of future periods are subject to the risk that the controls may become inadequate because of changes in conditions, or that the degree of compliance with the policies or procedures may deteriorate.
In our opinion, the consolidated financial statements referred to above present fairly, in all material respects, the financial position of Walgreen Co. and Subsidiaries as of August 31, 2007 and 2006, and the results of their operations and their cash flows for each of the three years in the period ended August 31, 2007, in conformity with accounting principles generally accepted in the United States of America. Also, in our opinion, the Company maintained, in all material respects, effective internal control over financial reporting as of August 31, 2007, based on the criteria established in Internal Control – Integrated Framework issued by the Committee of Sponsoring Organizations of the Treadway Commission.
Table of Contents

As discussed in Note 1 to the consolidated financial statements, effective August 31, 2007, the Company adopted the recognition and disclosure provisions of Statement of Financial Accounting Standards No. 158, Employers’ Accounting for Defined Benefit Pension and Other Postretirement Plans—an amendment of FASBStatements No. 87, 88, 106, and 132(R), and effective September 1, 2005, the Company changed its method of accounting for share-based payments to adopt Statement of Financial Accounting Standards No. 123(R), Share-Based Payment.
/s/ DELOITTE & TOUCHE LLP
Chicago, IllinoisOctober 26, 2007
Table of Contents
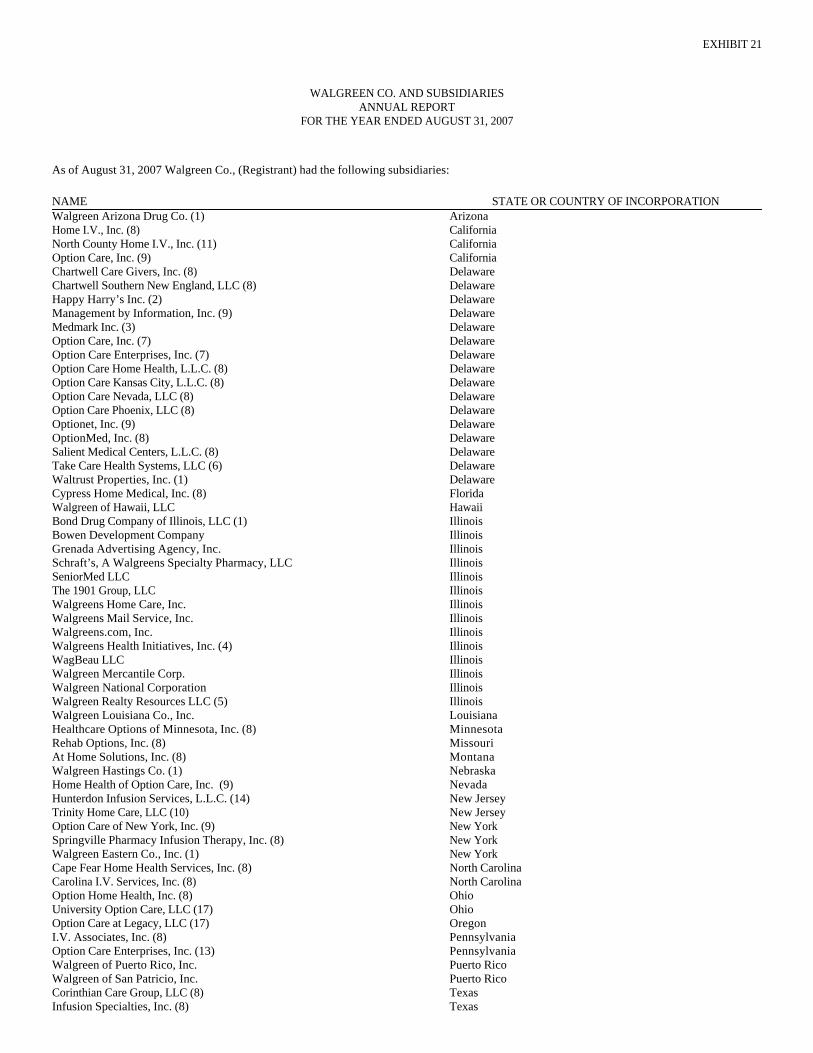
EXHIBIT 21
WALGREEN CO. AND SUBSIDIARIESANNUAL REPORT
FOR THE YEAR ENDED AUGUST 31, 2007
As of August 31, 2007 Walgreen Co., (Registrant) had the following subsidiaries:
NAME STATE OR COUNTRY OF INCORPORATIONWalgreen Arizona Drug Co. (1) ArizonaHome I.V., Inc. (8) CaliforniaNorth County Home I.V., Inc. (11) CaliforniaOption Care, Inc. (9) CaliforniaChartwell Care Givers, Inc. (8) DelawareChartwell Southern New England, LLC (8) DelawareHappy Harry’s Inc. (2) DelawareManagement by Information, Inc. (9) DelawareMedmark Inc. (3) DelawareOption Care, Inc. (7) DelawareOption Care Enterprises, Inc. (7) DelawareOption Care Home Health, L.L.C. (8) DelawareOption Care Kansas City, L.L.C. (8) DelawareOption Care Nevada, LLC (8) DelawareOption Care Phoenix, LLC (8) DelawareOptionet, Inc. (9) DelawareOptionMed, Inc. (8) DelawareSalient Medical Centers, L.L.C. (8) DelawareTake Care Health Systems, LLC (6) DelawareWaltrust Properties, Inc. (1) DelawareCypress Home Medical, Inc. (8) FloridaWalgreen of Hawaii, LLC HawaiiBond Drug Company of Illinois, LLC (1) IllinoisBowen Development Company IllinoisGrenada Advertising Agency, Inc. IllinoisSchraft’s, A Walgreens Specialty Pharmacy, LLC IllinoisSeniorMed LLC IllinoisThe 1901 Group, LLC IllinoisWalgreens Home Care, Inc. IllinoisWalgreens Mail Service, Inc. IllinoisWalgreens.com, Inc. IllinoisWalgreens Health Initiatives, Inc. (4) IllinoisWagBeau LLC IllinoisWalgreen Mercantile Corp. IllinoisWalgreen National Corporation IllinoisWalgreen Realty Resources LLC (5) IllinoisWalgreen Louisiana Co., Inc. LouisianaHealthcare Options of Minnesota, Inc. (8) MinnesotaRehab Options, Inc. (8) MissouriAt Home Solutions, Inc. (8) MontanaWalgreen Hastings Co. (1) NebraskaHome Health of Option Care, Inc. (9) NevadaHunterdon Infusion Services, L.L.C. (14) New JerseyTrinity Home Care, LLC (10) New JerseyOption Care of New York, Inc. (9) New YorkSpringville Pharmacy Infusion Therapy, Inc. (8) New YorkWalgreen Eastern Co., Inc. (1) New YorkCape Fear Home Health Services, Inc. (8) North CarolinaCarolina I.V. Services, Inc. (8) North CarolinaOption Home Health, Inc. (8) OhioUniversity Option Care, LLC (17) OhioOption Care at Legacy, LLC (17) OregonI.V. Associates, Inc. (8) PennsylvaniaOption Care Enterprises, Inc. (13) PennsylvaniaWalgreen of Puerto Rico, Inc. Puerto RicoWalgreen of San Patricio, Inc. Puerto RicoCorinthian Care Group, LLC (8) TexasInfusion Specialties, Inc. (8) Texas

The registrant also wholly owns inactive subsidiaries which are not included in the above list. All wholly owned subsidiaries are included in the consolidated financial statements.
Excel Healthcare, L.L.C. (8) VirginiaOption Care Home Health, L.L.C. (12) WashingtonFull Road Holdings, Ltd. (15) MauritiusSalient Business Solutions, Ltd. (16) Mauritius
(1) Walgreens Hastings Co. is a direct parent of Walgreen Arizona Drug Co. Walgreen Arizona Drug Co. is a direct parent of Walgreen Eastern Co. Walgreen Eastern Co is a direct parent of Bond Drug Company of Illinois, LLC. Bond Drug Company of Illinois, LLC is a direct parent of Waltrust Properties, Inc. Waltrust Properties, Inc. is a real estate investment trust. A minority interest in Waltrust Properties, Inc. is held by outside preferred shareholders.
(2) Happy Harry’s Discount Drug Stores, Inc. (a Delaware corporation) is a direct parent of Happy Harry’s Inc. Happy Harry’s Inc. is a direct parent of HHDH Corp. (a Delaware corporation).
(3) Medmark Holdings, Inc. (a Delaware corporation) is a direct parent of Medmark Inc. Medmark Inc. is a direct parent of Medmark Data Management, Inc. (A Delaware corporation).
(4) Walgreen Health Initiatives, Inc. is a direct parent of a New York inactive subsidiary.(5) Walgreen Realty Resources LLC is a direct parent of Walgreen Market Strategies LLC (an Illinois corporation).(6) Take Care Health Systems, Inc. (a Delaware corporation) is a direct parent of Take Care Health Systems, LLC.(7) Option Care, Inc. (a Delaware corporation) is a direct parent of Option Care Enterprises, Inc. (a Delaware corporation). Option Care
Enterprises, Inc. (a Delaware corporation) is a direct parent of various subsidiaries (see footnote #8). Option Care, Inc. (a Delaware corporation) is a direct parent of various subsidiaries (see footnote # 9).
(8) Subsidiary of Options Care Enterprises, Inc. (a Delaware corporation)(9) Subsidiary of Option Care, Inc. (a Delaware corporation)(10) Option Care Home Health LLC (a Delaware LLC ) is a direct subsidiary of Option Care of New York, Inc. (a New York corporation). (11) 13% of North County Home I.V., Inc is owned by Option Care Enterprises, Inc. (a Delaware corporation) and 87% by Rehab Options,
Inc.(12) 50% owned by Options Care Enterprises, Inc. (a Delaware corporation) and 50% owned by Option Care, Inc. (a California
corporation)(13) 80% owned by Option Care Enterprises, Inc. (a Delaware corporation)(14) 50% owned by Option Care Enterprises, Inc. (a Pennsylvania corporation)(15) Foreign subsidiary of Option Care, Inc. (a Delaware corporation)(16) 30% owned by Full Road Holdings, Ltd. (a Mauritius entity)(17) 50% owned by Option Care Enterprises, Inc. (a Delaware corporation)
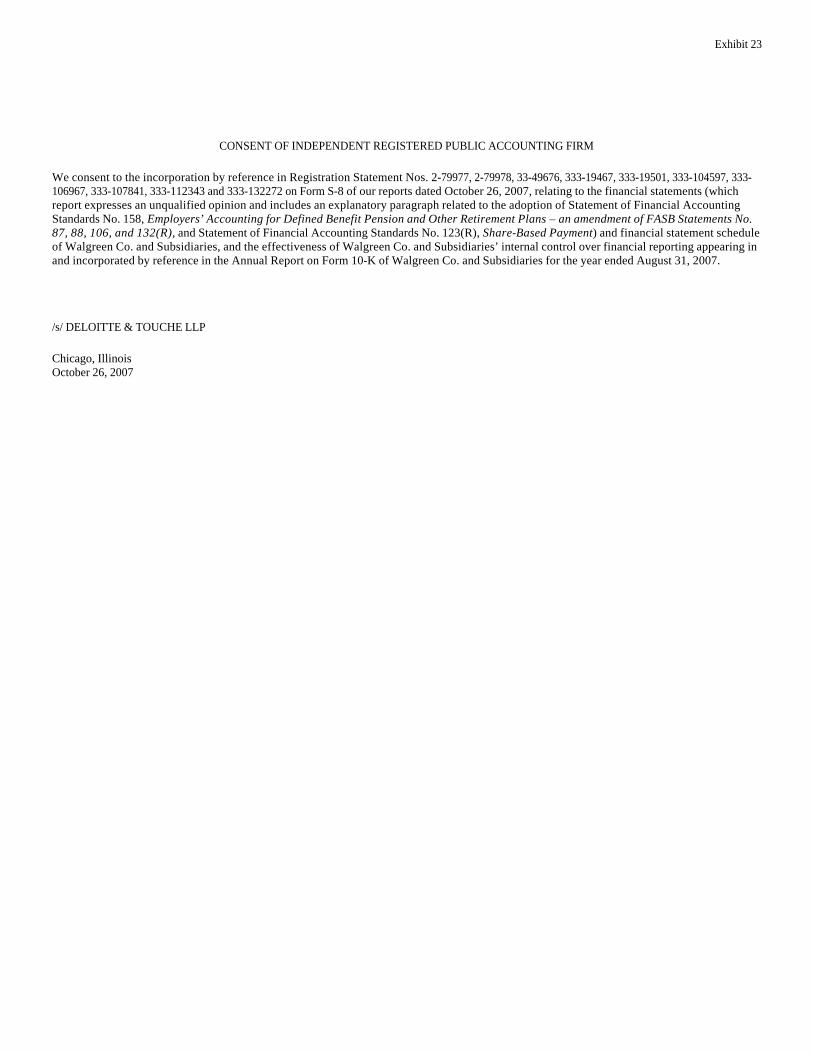
Exhibit 23
CONSENT OF INDEPENDENT REGISTERED PUBLIC ACCOUNTING FIRM
We consent to the incorporation by reference in Registration Statement Nos. 2-79977, 2-79978, 33-49676, 333-19467, 333-19501, 333-104597, 333-106967, 333-107841, 333-112343 and 333-132272 on Form S-8 of our reports dated October 26, 2007, relating to the financial statements (which report expresses an unqualified opinion and includes an explanatory paragraph related to the adoption of Statement of Financial Accounting Standards No. 158, Employers’ Accounting for Defined Benefit Pension and Other Retirement Plans – an amendment of FASB Statements No. 87, 88, 106, and 132(R), and Statement of Financial Accounting Standards No. 123(R), Share-Based Payment) and financial statement schedule of Walgreen Co. and Subsidiaries, and the effectiveness of Walgreen Co. and Subsidiaries’ internal control over financial reporting appearing in and incorporated by reference in the Annual Report on Form 10-K of Walgreen Co. and Subsidiaries for the year ended August 31, 2007.
/s/ DELOITTE & TOUCHE LLP
Chicago, IllinoisOctober 26, 2007
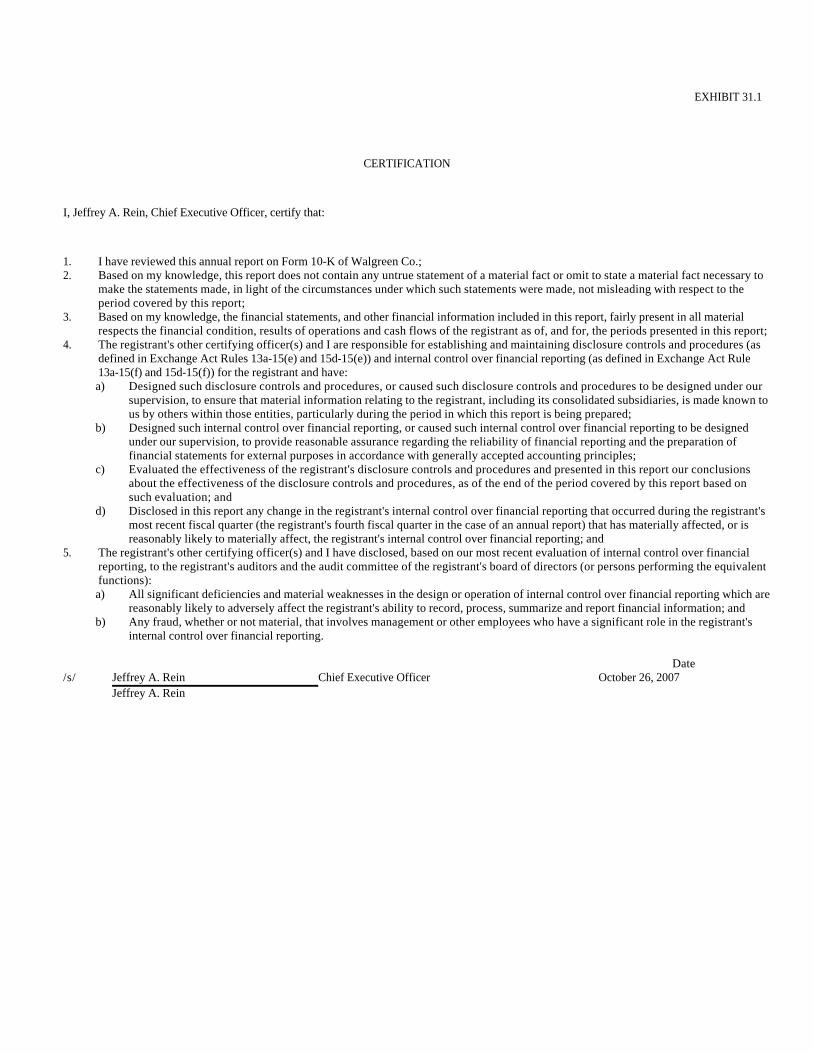
EXHIBIT 31.1
CERTIFICATION
I, Jeffrey A. Rein, Chief Executive Officer, certify that:
1. I have reviewed this annual report on Form 10-K of Walgreen Co.; 2. Based on my knowledge, this report does not contain any untrue statement of a material fact or omit to state a material fact necessary to
make the statements made, in light of the circumstances under which such statements were made, not misleading with respect to the period covered by this report;
3. Based on my knowledge, the financial statements, and other financial information included in this report, fairly present in all material respects the financial condition, results of operations and cash flows of the registrant as of, and for, the periods presented in this report;
4. The registrant's other certifying officer(s) and I are responsible for establishing and maintaining disclosure controls and procedures (as defined in Exchange Act Rules 13a-15(e) and 15d-15(e)) and internal control over financial reporting (as defined in Exchange Act Rule 13a-15(f) and 15d-15(f)) for the registrant and have:
a) Designed such disclosure controls and procedures, or caused such disclosure controls and procedures to be designed under our supervision, to ensure that material information relating to the registrant, including its consolidated subsidiaries, is made known to us by others within those entities, particularly during the period in which this report is being prepared;
b) Designed such internal control over financial reporting, or caused such internal control over financial reporting to be designed under our supervision, to provide reasonable assurance regarding the reliability of financial reporting and the preparation of financial statements for external purposes in accordance with generally accepted accounting principles;
c) Evaluated the effectiveness of the registrant's disclosure controls and procedures and presented in this report our conclusions about the effectiveness of the disclosure controls and procedures, as of the end of the period covered by this report based on such evaluation; and
d) Disclosed in this report any change in the registrant's internal control over financial reporting that occurred during the registrant's most recent fiscal quarter (the registrant's fourth fiscal quarter in the case of an annual report) that has materially affected, or is reasonably likely to materially affect, the registrant's internal control over financial reporting; and
5. The registrant's other certifying officer(s) and I have disclosed, based on our most recent evaluation of internal control over financial reporting, to the registrant's auditors and the audit committee of the registrant's board of directors (or persons performing the equivalent functions):
a) All significant deficiencies and material weaknesses in the design or operation of internal control over financial reporting which are reasonably likely to adversely affect the registrant's ability to record, process, summarize and report financial information; and
b) Any fraud, whether or not material, that involves management or other employees who have a significant role in the registrant's internal control over financial reporting.
Date/s/ Jeffrey A. Rein Chief Executive Officer October 26, 2007 Jeffrey A. Rein

EXHIBIT 31.2
CERTIFICATION
I, William M. Rudolphsen, Chief Financial Officer, certify that:
1. I have reviewed this annual report on Form 10-K of Walgreen Co.; 2. Based on my knowledge, this report does not contain any untrue statement of a material fact or omit to state a material fact necessary to
make the statements made, in light of the circumstances under which such statements were made, not misleading with respect to the period covered by this report;
3. Based on my knowledge, the financial statements, and other financial information included in this report, fairly present in all material respects the financial condition, results of operations and cash flows of the registrant as of, and for, the periods presented in this report;
4. The registrant's other certifying officer(s) and I are responsible for establishing and maintaining disclosure controls and procedures (as defined in Exchange Act Rules 13a-15(e) and 15d-15(e)) and internal control over financial reporting (as defined in Exchange Act Rules 13a-15(f) and 15d-15(f)) for the registrant and have:
a) Designed such disclosure controls and procedures, or caused such disclosure controls and procedures to be designed under our supervision, to ensure that material information relating to the registrant, including its consolidated subsidiaries, is made known to us by others within those entities, particularly during the period in which this report is being prepared;
b) Designed such internal control over financial reporting, or caused such internal control over financial reporting to be designed under our supervision, to provide reasonable assurance regarding the reliability of financial reporting and the preparation of financial statements for external purposes in accordance with generally accepted accounting principles;
c) Evaluated the effectiveness of the registrant's disclosure controls and procedures and presented in this report our conclusions about the effectiveness of the disclosure controls and procedures, as of the end of the period covered by this report based on such evaluation; and
d) Disclosed in this report any change in the registrant's internal control over financial reporting that occurred during the registrant's most recent fiscal quarter (the registrant's fourth fiscal quarter in the case of an annual report) that has materially affected, or is reasonably likely to materially affect, the registrant's internal control over financial reporting; and
5. The registrant's other certifying officer(s) and I have disclosed, based on our most recent evaluation of internal control over financial reporting, to the registrant's auditors and the audit committee of the registrant's board of directors (or persons performing the equivalent functions):
a) All significant deficiencies and material weaknesses in the design or operation of internal control over financial reporting which are reasonably likely to adversely affect the registrant's ability to record, process, summarize and report financial information; and
b) Any fraud, whether or not material, that involves management or other employees who have a significant role in the registrant's internal control over financial reporting.
Date/s/ William M. Rudolphsen Chief Financial Officer October 26, 2007 William M. Rudolphsen
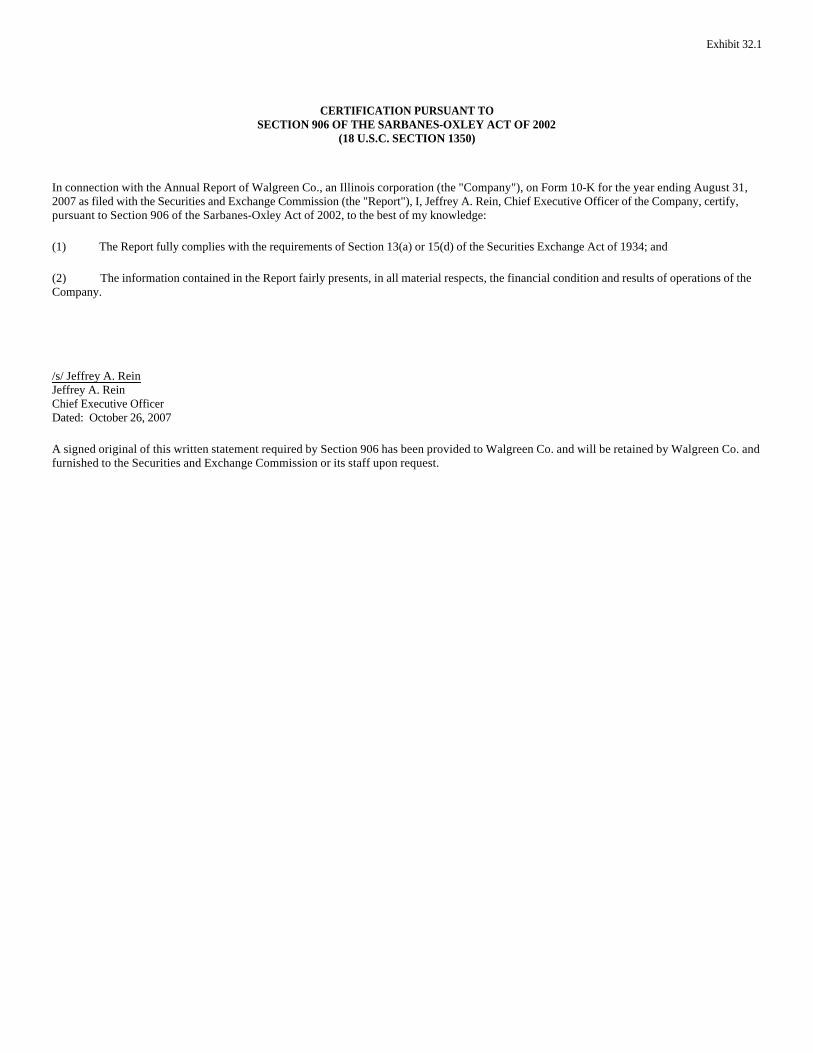
Exhibit 32.1
CERTIFICATION PURSUANT TOSECTION 906 OF THE SARBANES-OXLEY ACT OF 2002
(18 U.S.C. SECTION 1350)
In connection with the Annual Report of Walgreen Co., an Illinois corporation (the "Company"), on Form 10-K for the year ending August 31, 2007 as filed with the Securities and Exchange Commission (the "Report"), I, Jeffrey A. Rein, Chief Executive Officer of the Company, certify, pursuant to Section 906 of the Sarbanes-Oxley Act of 2002, to the best of my knowledge:
(1) The Report fully complies with the requirements of Section 13(a) or 15(d) of the Securities Exchange Act of 1934; and
(2) The information contained in the Report fairly presents, in all material respects, the financial condition and results of operations of the Company.
/s/ Jeffrey A. ReinJeffrey A. ReinChief Executive OfficerDated: October 26, 2007
A signed original of this written statement required by Section 906 has been provided to Walgreen Co. and will be retained by Walgreen Co. and furnished to the Securities and Exchange Commission or its staff upon request.


Exhibit 32.2
CERTIFICATION PURSUANT TOSECTION 906 OF THE SARBANES-OXLEY ACT OF 2002
(18 U.S.C. SECTION 1350)
In connection with the Annual Report of Walgreen Co., an Illinois corporation (the "Company"), on Form 10-K for the year ending August 31, 2007 as filed with the Securities and Exchange Commission (the "Report"), I, William M. Rudolphsen, Chief Financial Officer of the Company, certify, pursuant to Section 906 of the Sarbanes-Oxley Act of 2002, to the best of my knowledge:
(1) The Report fully complies with the requirements of Section 13(a) or 15(d) of the Securities Exchange Act of 1934; and
(2) The information contained in the Report fairly presents, in all material respects, the financial condition and results of operations of the Company.
/s/ William M. RudolphsenWilliam M. RudolphsenChief Financial OfficerDated: October 26, 2007
A signed original of this written statement required by Section 906 has been provided to Walgreen Co. and will be retained by Walgreen Co. and furnished to the Securities and Exchange Commission or its staff upon request.