form 10-q - general electric€¦ · united states securities and exchange commission washington,...
TRANSCRIPT

FORM 10-QGENERAL ELECTRIC CO - GEFiled: November 02, 2009 (period: September 30, 2009)
Quarterly report which provides a continuing view of a company's financial position

Table of Contents
10-Q
Part I
Item 1. Financial Statements Item 2. Management s Discussion and Analysis of Financial Condition and
Results of Operations.
Item 3. Quantitative and Qualitative Disclosures About Market Risk. Item 4. Controls and Procedures. Part II.
Item 1. Legal Proceedings. Item 2. Purchases of Equity Securities by the Issuer and Affiliated
Purchasers.
Item 5. Other Information. Item 6. Exhibits. Signatures
EX-12.A
EX-12.B
EX-31.A
EX-31.B
EX-32 (Certifications required under Section 906 of the Sarbanes-Oxley Act of2002)
EX-99 (Exhibits not specifically designated by another number and by investmentcompanies)
XBRL Content

UNITED STATES SECURITIES AND EXCHANGE COMMISSION
WASHINGTON, D.C. 20549
FORM 10-Q (Mark One)
� QUARTERLY REPORT PURSUANT TO SECTION 13 OR 15(d) OF THE SECURITIES EXCHANGE ACT OF 1934
For the quarterly period ended September 30, 2009
OR � TRANSITION REPORT PURSUANT TO SECTION 13 OR 15(d) OF THE SECURITIES EXCHANGE ACT OF 1934
For the transition period from ____ to ____
Commission file number 001-00035
GENERAL ELECTRIC COMPANY
(Exact name of registrant as specified in its charter)
New York 14-0689340
(State or other jurisdiction of incorporation or organization) (I.R.S. Employer Identification No.)
3135 Easton Turnpike, Fairfield, CT 06828-0001(Address of principal executive offices) (Zip Code)
(Registrant’s telephone number, including area code) (203) 373-2211
_______________________________________________
(Former name, former address and former fiscal year,if changed since last report)
Indicate by check mark whether the registrant (1) has filed all reports required to be filed by Section 13 or 15(d) of the SecuritiesExchange Act of 1934 during the preceding 12 months (or for such shorter period that the registrant was required to file such reports),and (2) has been subject to such filing requirements for the past 90 days. Yes � No � Indicate by check mark whether the registrant has submitted electronically and posted on its corporate Web site, if any, everyInteractive Data File required to be submitted and posted pursuant to Rule 405 of Regulation S-T (§232.405 of this chapter) during thepreceding 12 months (or for such shorter period that the registrant was required to submit and post such files). Yes � No � Indicate by check mark whether the registrant is a large accelerated filer, an accelerated filer, a non-accelerated filer, or a smallerreporting company. See the definitions of “large accelerated filer,” “accelerated filer” and “smaller reporting company” in Rule 12b-2 ofthe Exchange Act. (Check one):
Large accelerated filer � Accelerated filer �Non-accelerated filer � Smaller reporting company �
Indicate by check mark whether the registrant is a shell company (as defined in Rule 12b-2 of the Exchange Act). Yes � No � There were 10,647,495,000 shares of common stock with a par value of $0.06 per share outstanding at September 25, 2009.
(1)
Source: GENERAL ELECTRIC CO, 10-Q, November 02, 2009

General Electric Company
Page
Part I − Financial Information
Item 1. Financial Statements
Condensed Statement of Earnings
Three Months Ended September 30, 2009 3
Nine Months Ended September 30, 2009 4
Condensed Statement of Financial Position 5
Condensed Statement of Cash Flows 6
Summary of Operating Segments 7
Notes to Condensed, Consolidated Financial Statements (Unaudited) 8
Item 2. Management’s Discussion and Analysis of Financial Condition and Results of Operations 51
Item 3. Quantitative and Qualitative Disclosures About Market Risk 75
Item 4. Controls and Procedures 75
Part II − Other Information Item 1. Legal Proceedings 75
Item 2. Purchases of Equity Securities by the Issuer and Affiliated Purchasers 77
Item 5. Other Information 77
Item 6. Exhibits 78
Signatures 79
Forward-Looking Statements This document contains “forward-looking statements” – that is, statements related to future, not past, events. In this context,forward-looking statements often address our expected future business and financial performance and financial condition, and oftencontain words such as “expect,” “anticipate,” “intend,” “plan,” “believe,” “seek,” “see,” or “will.” Forward-looking statements by theirnature address matters that are, to different degrees, uncertain. For us, particular uncertainties that could cause our actual results to bematerially different than those expressed in our forward-looking statements include: the severity and duration of current economic andfinancial conditions, including volatility in interest and exchange rates, commodity and equity prices and the value of financial assets;the impact of U.S. and foreign government programs to restore liquidity and stimulate national and global economies; the impact ofconditions in the financial and credit markets on the availability and cost of GE Capital’s funding and on our ability to reduce GECapital’s asset levels as planned; the impact of conditions in the housing market and unemployment rates on the level of commercialand consumer credit defaults; our ability to maintain our current credit rating and the impact on our funding costs and competitiveposition if we do not do so; the soundness of other financial institutions with which GE Capital does business; the adequacy of our cashflow and earnings and other conditions which may affect our ability to maintain our quarterly dividend at the current level; the level ofdemand and financial performance of the major industries we serve, including, without limitation, air and rail transportation, energygeneration, network television, real estate and healthcare; the impact of regulation and regulatory, investigative and legal proceedingsand legal compliance risks, including the impact of proposed financial services regulation; strategic actions, including acquisitions anddispositions and our success in integrating acquired businesses; and numerous other matters of national, regional and global scale,including those of a political, economic, business and competitive nature. These uncertainties may cause our actual future results to bematerially different than those expressed in our forward-looking statements. We do not undertake to update our forward-lookingstatements.
(2)
Source: GENERAL ELECTRIC CO, 10-Q, November 02, 2009

Part I. Financial Information Item 1. Financial Statements. General Electric Company and consolidated affiliates Condensed Statement of Earnings Three months ended September 30, 2009 (Unaudited) Consolidated GE(a) Financial Services (GECS)(In millions; except share amounts) 2009 2008 2009 2008 2009 2008 Revenues Sales of goods $ 14,627 $ 17,924 $ 14,486 $ 17,473 $ 213 $ 579 Sales of services 10,516 11,236 10,639 11,395 – – Other income 438 544 476 659 – – GECS earnings from continuing operations – – 133 2,010 – – GECS revenues from services 12,218 17,530 – – 12,533 17,852 Total revenues 37,799 47,234 25,734 31,537 12,746 18,431 Costs and expenses Cost of goods sold 11,775 14,184 11,666 13,826 181 486 Cost of services sold 6,773 7,953 6,897 8,112 – – Interest and other financial charges 4,322 6,955 352 525 4,128 6,723 Investment contracts, insurance losses and insurance annuity benefits 732 787 – – 785 839 Provision for losses on financing receivables 2,868 1,641 – – 2,868 1,641 Other costs and expenses 9,354 10,542 3,714 3,541 5,781 7,093 Total costs and expenses 35,824 42,062 22,629 26,004 13,743 16,782 Earnings (loss) from continuing operations before income taxes 1,975 5,172 3,105 5,533 (997) 1,649 Benefit (provision) for income taxes 484 (539) (654) (996) 1,138 457 Earnings from continuing operations 2,459 4,633 2,451 4,537 141 2,106 Earnings (loss) from discontinued operations, net of taxes 40 (165) 40 (165) 40 (170)Net earnings 2,499 4,468 2,491 4,372 181 1,936 Less net earnings (loss) attributable to noncontrolling interests 5 156 (3) 60 8 96 Net earnings attributable to the Company 2,494 4,312 2,494 4,312 173 1,840 Preferred stock dividends declared (75) – (75) – – – Net earnings attributable to GE common shareowners $ 2,419 $ 4,312 $ 2,419 $ 4,312 $ 173 $ 1,840
Amounts attributable to the Company Earnings from continuing operations $ 2,454 $ 4,477 $ 2,454 $ 4,477 $ 133 $ 2,010 Earnings (loss) from discontinued operations, net of taxes 40 (165) 40 (165) 40 (170) Net earnings attributable to the Company $ 2,494 $ 4,312 $ 2,494 $ 4,312 $ 173 $ 1,840
Per-share amounts Earnings from continuing operations Diluted earnings per share $ 0.22 $ 0.45 Basic earnings per share $ 0.22 $ 0.45 Net earnings Diluted earnings per share $ 0.23 $ 0.43 Basic earnings per share $ 0.23 $ 0.43 Dividends declared per share $ 0.10 $ 0.31
Source: GENERAL ELECTRIC CO, 10-Q, November 02, 2009

(a) Represents the adding together of all affiliated companies except General Electric Capital Services, Inc. (GECS or financial services) which ispresented on a one-line basis.
See Note 3 for other-than-temporary impairment amounts. See accompanying notes. Separate information is shown for “GE” and “Financial Services (GECS).” Transactions between GE and GECS have beeneliminated from the “Consolidated” columns.
(3)
Source: GENERAL ELECTRIC CO, 10-Q, November 02, 2009
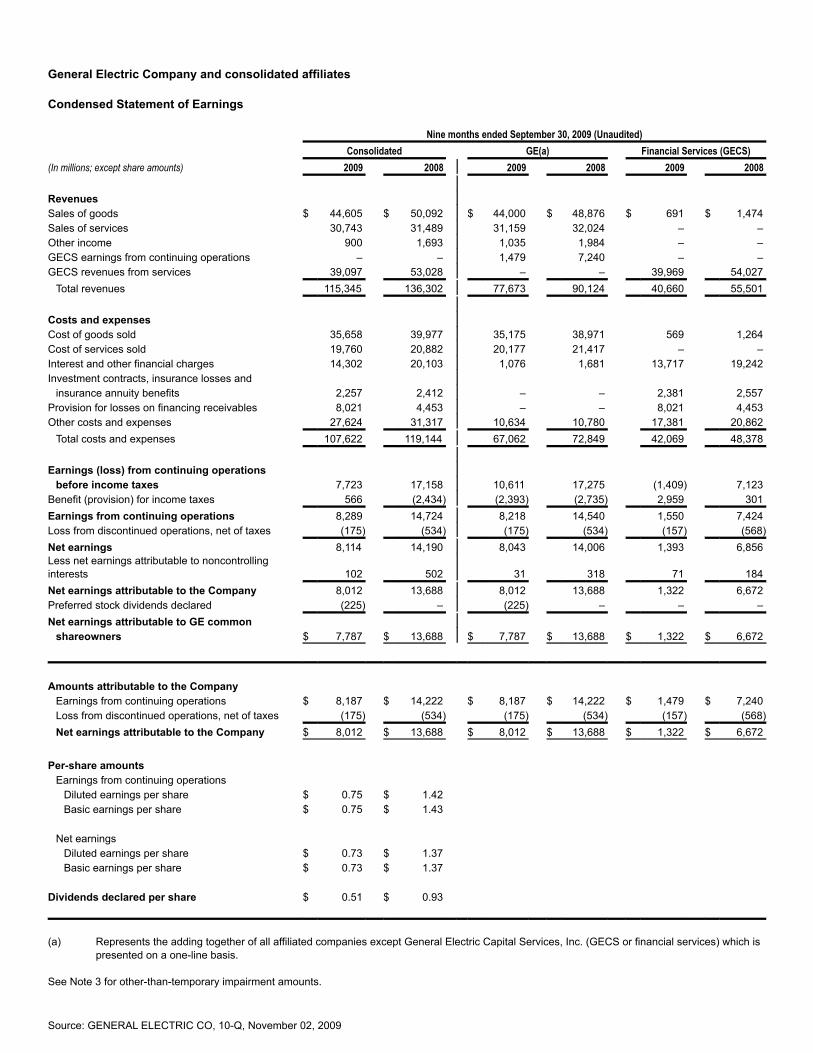
General Electric Company and consolidated affiliates Condensed Statement of Earnings Nine months ended September 30, 2009 (Unaudited) Consolidated GE(a) Financial Services (GECS)(In millions; except share amounts) 2009 2008 2009 2008 2009 2008 Revenues Sales of goods $ 44,605 $ 50,092 $ 44,000 $ 48,876 $ 691 $ 1,474 Sales of services 30,743 31,489 31,159 32,024 – – Other income 900 1,693 1,035 1,984 – – GECS earnings from continuing operations – – 1,479 7,240 – – GECS revenues from services 39,097 53,028 – – 39,969 54,027 Total revenues 115,345 136,302 77,673 90,124 40,660 55,501 Costs and expenses Cost of goods sold 35,658 39,977 35,175 38,971 569 1,264 Cost of services sold 19,760 20,882 20,177 21,417 – – Interest and other financial charges 14,302 20,103 1,076 1,681 13,717 19,242 Investment contracts, insurance losses and insurance annuity benefits 2,257 2,412 – – 2,381 2,557 Provision for losses on financing receivables 8,021 4,453 – – 8,021 4,453 Other costs and expenses 27,624 31,317 10,634 10,780 17,381 20,862 Total costs and expenses 107,622 119,144 67,062 72,849 42,069 48,378 Earnings (loss) from continuing operations before income taxes 7,723 17,158 10,611 17,275 (1,409) 7,123 Benefit (provision) for income taxes 566 (2,434) (2,393) (2,735) 2,959 301 Earnings from continuing operations 8,289 14,724 8,218 14,540 1,550 7,424 Loss from discontinued operations, net of taxes (175) (534) (175) (534) (157) (568)Net earnings 8,114 14,190 8,043 14,006 1,393 6,856 Less net earnings attributable to noncontrollinginterests 102 502 31 318 71 184 Net earnings attributable to the Company 8,012 13,688 8,012 13,688 1,322 6,672 Preferred stock dividends declared (225) – (225) – – – Net earnings attributable to GE common shareowners $ 7,787 $ 13,688 $ 7,787 $ 13,688 $ 1,322 $ 6,672
Amounts attributable to the Company Earnings from continuing operations $ 8,187 $ 14,222 $ 8,187 $ 14,222 $ 1,479 $ 7,240 Loss from discontinued operations, net of taxes (175) (534) (175) (534) (157) (568) Net earnings attributable to the Company $ 8,012 $ 13,688 $ 8,012 $ 13,688 $ 1,322 $ 6,672
Per-share amounts Earnings from continuing operations Diluted earnings per share $ 0.75 $ 1.42 Basic earnings per share $ 0.75 $ 1.43 Net earnings Diluted earnings per share $ 0.73 $ 1.37 Basic earnings per share $ 0.73 $ 1.37 Dividends declared per share $ 0.51 $ 0.93
(a) Represents the adding together of all affiliated companies except General Electric Capital Services, Inc. (GECS or financial services) which ispresented on a one-line basis.
See Note 3 for other-than-temporary impairment amounts.
Source: GENERAL ELECTRIC CO, 10-Q, November 02, 2009

See accompanying notes. Separate information is shown for “GE” and “Financial Services (GECS).” Transactions between GE and GECS have beeneliminated from the “Consolidated” columns.
(4)
Source: GENERAL ELECTRIC CO, 10-Q, November 02, 2009

General Electric Company and consolidated affiliates Condensed Statement of Financial Position Consolidated GE(a) Financial Services (GECS) September 30, December 31, September 30, December 31, September 30, December 31,(In millions; except share amounts) 2009 2008 2009 2008 2009 2008 (Unaudited) (Unaudited) (Unaudited) Assets Cash and equivalents $ 61,374 $ 48,187 $ 5,207 $ 12,090 $ 56,898 $ 37,486 Investment securities 52,761 41,446 40 213 52,723 41,236 Current receivables 19,613 21,411 12,872 15,064 – – Inventories 13,092 13,674 13,013 13,597 79 77 Financing receivables – net 340,688 365,168 – – 348,518 372,456 Other GECS receivables 14,339 13,439 – – 18,625 18,636 Property, plant and equipment (including equipment leased to others) – net 72,993 78,530 14,281 14,433 58,712 64,097 Investment in GECS – – 70,658 53,279 – – Goodwill 84,880 81,759 56,696 56,394 28,184 25,365 Other intangible assets – net 15,010 14,977 11,172 11,364 3,838 3,613 All other assets 110,235 106,899 23,787 22,435 87,941 85,721 Assets of businesses held for sale 1,263 10,556 – – 1,263 10,556 Assets of discontinued operations 1,598 1,723 65 64 1,533 1,659 Total assets $ 787,846 $ 797,769 $ 207,791 $ 198,933 $ 658,314 $ 660,902
Liabilities and equity Short-term borrowings $ 160,115 $ 193,695 $ 565 $ 2,375 $ 160,938 $ 193,533 Accounts payable, principally trade accounts 18,931 20,819 10,391 11,699 12,501 13,882 Progress collections and price adjustments accrued 12,511 12,536 13,232 13,058 – – Other GE current liabilities 19,229 21,560 19,229 21,624 – – Long-term borrowings 358,092 330,067 11,683 9,827 347,415 321,068 Investment contracts, insurance liabilities and insurance annuity benefits 32,549 34,032 – – 32,948 34,369 All other liabilities 53,708 64,796 32,813 32,767 21,021 32,090 Deferred income taxes 5,308 4,584 (4,126) (3,949) 9,434 8,533 Liabilities of businesses held for sale 143 636 – – 143 636 Liabilities of discontinued operations 1,451 1,432 172 189 1,279 1,243 Total liabilities 662,037 684,157 83,959 87,590 585,679 605,354
Preferred stock (30,000 shares outstanding at both September 30, 2009 and December 31,2008)
– – – – – –
Common stock (10,647,495,000 and10,536,897,000
shares outstanding at September 30, 2009and December 31, 2008, respectively) 702 702 702 702 1 1 Accumulated other comprehensive income –net(b)
Investment securities (479) (3,094) (479) (3,094) (478) (3,097) Currency translation adjustments 4,043 (299) 4,043 (299) 1,409 (1,258) Cash flow hedges (1,856) (3,332) (1,856) (3,332) (1,894) (3,134) Benefit plans (14,469) (15,128) (14,469) (15,128) (374) (367)Other capital 37,861 40,390 37,861 40,390 27,578 18,079 Retained earnings 124,530 122,123 124,530 122,123 44,416 43,055 Less common stock held in treasury (32,803) (36,697) (32,803) (36,697) – –
Total GE shareowners’ equity 117,529 104,665 117,529 104,665 70,658 53,279 Noncontrolling interests(c) 8,280 8,947 6,303 6,678 1,977 2,269 Total equity 125,809 113,612 123,832 111,343 72,635 55,548
Total liabilities and equity $ 787,846 $ 797,769 $ 207,791 $ 198,933 $ 658,314 $ 660,902
Source: GENERAL ELECTRIC CO, 10-Q, November 02, 2009

(a) Represents the adding together of all affiliated companies except General Electric Capital Services, Inc. (GECS or financial services) which ispresented on a one-line basis.
(b) The sum of accumulated other comprehensive income - net was $(12,761) million and $(21,853) million at September 30, 2009 and December
31, 2008, respectively. (c) Included accumulated other comprehensive income attributable to noncontrolling interests of $(83) million and $(194) million at September 30,
2009 and December 31, 2008, respectively. See accompanying notes. Separate information is shown for “GE” and “Financial Services (GECS).” Transactions between GE and GECS have beeneliminated from the “Consolidated” columns.
(5)
Source: GENERAL ELECTRIC CO, 10-Q, November 02, 2009
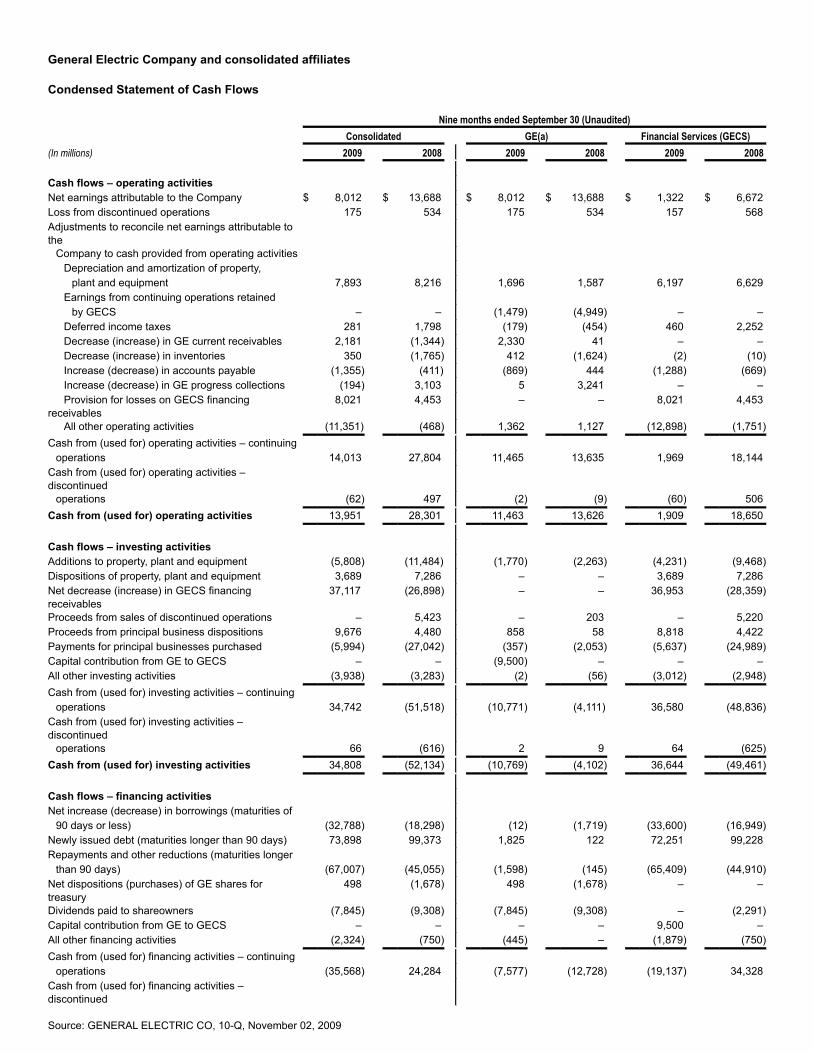
General Electric Company and consolidated affiliates Condensed Statement of Cash Flows Nine months ended September 30 (Unaudited) Consolidated GE(a) Financial Services (GECS)(In millions) 2009 2008 2009 2008 2009 2008 Cash flows – operating activities Net earnings attributable to the Company $ 8,012 $ 13,688 $ 8,012 $ 13,688 $ 1,322 $ 6,672 Loss from discontinued operations 175 534 175 534 157 568 Adjustments to reconcile net earnings attributable tothe
Company to cash provided from operating activities Depreciation and amortization of property, plant and equipment 7,893 8,216 1,696 1,587 6,197 6,629 Earnings from continuing operations retained by GECS – – (1,479) (4,949) – – Deferred income taxes 281 1,798 (179) (454) 460 2,252 Decrease (increase) in GE current receivables 2,181 (1,344) 2,330 41 – – Decrease (increase) in inventories 350 (1,765) 412 (1,624) (2) (10) Increase (decrease) in accounts payable (1,355) (411) (869) 444 (1,288) (669) Increase (decrease) in GE progress collections (194) 3,103 5 3,241 – – Provision for losses on GECS financingreceivables
8,021
4,453
–
–
8,021
4,453
All other operating activities (11,351) (468) 1,362 1,127 (12,898) (1,751)Cash from (used for) operating activities – continuing operations 14,013 27,804 11,465 13,635 1,969 18,144 Cash from (used for) operating activities –discontinued
operations (62) 497 (2) (9) (60) 506 Cash from (used for) operating activities 13,951 28,301 11,463 13,626 1,909 18,650
Cash flows – investing activities Additions to property, plant and equipment (5,808) (11,484) (1,770) (2,263) (4,231) (9,468)Dispositions of property, plant and equipment 3,689 7,286 – – 3,689 7,286 Net decrease (increase) in GECS financingreceivables
37,117
(26,898)
–
–
36,953
(28,359)
Proceeds from sales of discontinued operations – 5,423 – 203 – 5,220 Proceeds from principal business dispositions 9,676 4,480 858 58 8,818 4,422 Payments for principal businesses purchased (5,994) (27,042) (357) (2,053) (5,637) (24,989)Capital contribution from GE to GECS – – (9,500) – – – All other investing activities (3,938) (3,283) (2) (56) (3,012) (2,948)Cash from (used for) investing activities – continuing operations 34,742 (51,518) (10,771) (4,111) 36,580 (48,836)Cash from (used for) investing activities –discontinued
operations 66 (616) 2 9 64 (625)Cash from (used for) investing activities 34,808 (52,134) (10,769) (4,102) 36,644 (49,461)
Cash flows – financing activities Net increase (decrease) in borrowings (maturities of 90 days or less) (32,788) (18,298) (12) (1,719) (33,600) (16,949)Newly issued debt (maturities longer than 90 days) 73,898 99,373 1,825 122 72,251 99,228 Repayments and other reductions (maturities longer than 90 days) (67,007) (45,055) (1,598) (145) (65,409) (44,910)Net dispositions (purchases) of GE shares fortreasury
498
(1,678)
498
(1,678)
–
–
Dividends paid to shareowners (7,845) (9,308) (7,845) (9,308) – (2,291)Capital contribution from GE to GECS – – – – 9,500 – All other financing activities (2,324) (750) (445) – (1,879) (750)Cash from (used for) financing activities – continuing operations (35,568) 24,284 (7,577) (12,728) (19,137) 34,328 Cash from (used for) financing activities –discontinued
Source: GENERAL ELECTRIC CO, 10-Q, November 02, 2009
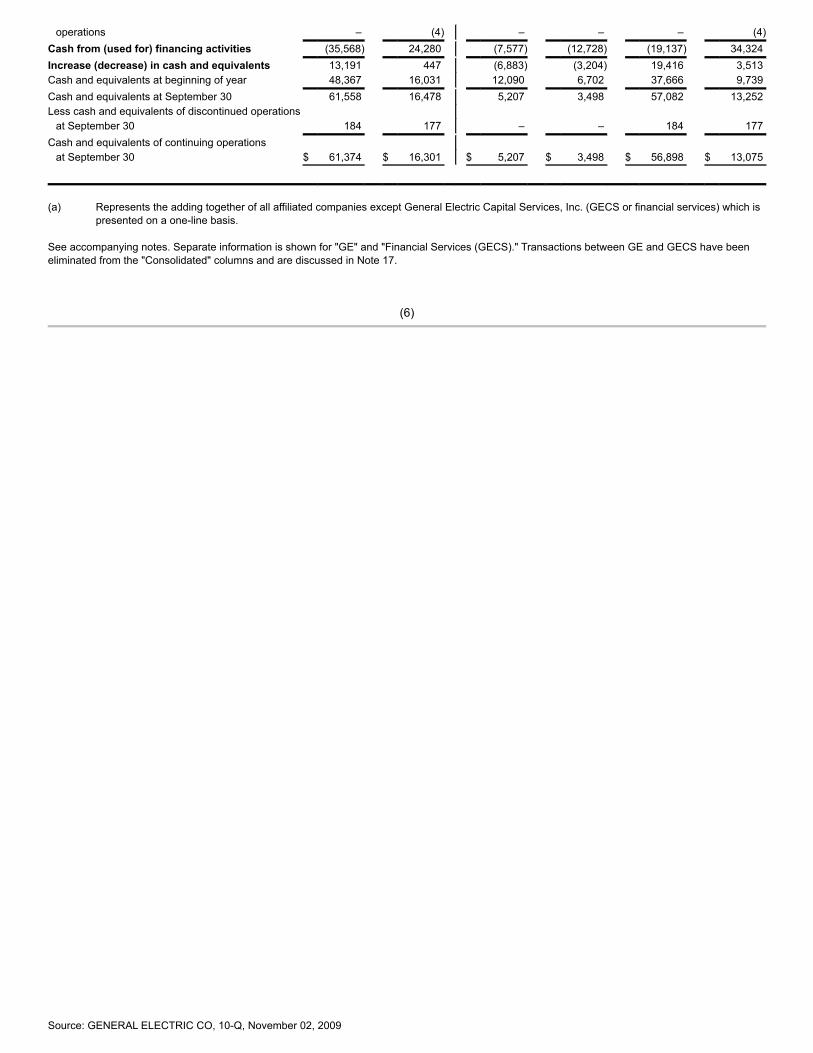
operations – (4) – – – (4)Cash from (used for) financing activities (35,568) 24,280 (7,577) (12,728) (19,137) 34,324 Increase (decrease) in cash and equivalents 13,191 447 (6,883) (3,204) 19,416 3,513 Cash and equivalents at beginning of year 48,367 16,031 12,090 6,702 37,666 9,739 Cash and equivalents at September 30 61,558 16,478 5,207 3,498 57,082 13,252 Less cash and equivalents of discontinued operations at September 30 184 177 – – 184 177 Cash and equivalents of continuing operations at September 30 $ 61,374 $ 16,301 $ 5,207 $ 3,498 $ 56,898 $ 13,075
(a) Represents the adding together of all affiliated companies except General Electric Capital Services, Inc. (GECS or financial services) which ispresented on a one-line basis.
See accompanying notes. Separate information is shown for "GE" and "Financial Services (GECS)." Transactions between GE and GECS have beeneliminated from the "Consolidated" columns and are discussed in Note 17.
(6)
Source: GENERAL ELECTRIC CO, 10-Q, November 02, 2009

Summary of Operating SegmentsGeneral Electric Company and consolidated affiliates Three months ended September 30 Nine months ended September 30 (Unaudited) (Unaudited)(In millions) 2009 2008 2009 2008 Revenues Energy Infrastructure $ 8,917 $ 9,769 $ 26,733 $ 27,164 Technology Infrastructure 10,209 11,450 31,200 33,761 NBC Universal 4,079 5,073 11,168 12,539 Capital Finance 12,161 17,292 38,100 52,242 Consumer & Industrial 2,438 2,989 7,166 8,990 Total segment revenues 37,804 46,573 114,367 134,696 Corporate items and eliminations (5) 661 978 1,606 Consolidated revenues $ 37,799 $ 47,234 $ 115,345 $ 136,302 Segment profit(a) Energy Infrastructure $ 1,582 $ 1,425 $ 4,646 $ 4,074 Technology Infrastructure 1,748 1,900 5,384 5,657 NBC Universal 732 645 1,662 2,266 Capital Finance 263 2,020 2,008 7,602 Consumer & Industrial 117 47 264 329 Total segment profit 4,442 6,037 13,964 19,928 Corporate items and eliminations (982) (39) (2,308) (1,290)GE interest and other financial charges (352) (525) (1,076) (1,681)GE provision for income taxes (654) (996) (2,393) (2,735)Earnings from continuing operations attributable to the Company 2,454 4,477 8,187 14,222 Earnings (loss) from discontinued operations, net of taxes, attributable to the Company 40 (165) (175) (534)Consolidated net earnings attributable to the Company $ 2,494 $ 4,312 $ 8,012 $ 13,688
(a) Segment profit always excludes the effects of principal pension plans, results reported as discontinued operations, earnings attributable tononcontrolling interests of consolidated subsidiaries and accounting changes, and may exclude matters such as charges for restructuring;rationalization and other similar expenses; in-process research and development and certain other acquisition-related charges and balances;technology and product development costs; certain gains and losses from acquisitions or dispositions; and litigation settlements or othercharges, responsibility for which preceded the current management team. Segment profit excludes or includes interest and other financialcharges and income taxes according to how a particular segment’s management is measured – excluded in determining segment profit, whichwe sometimes refer to as “operating profit,” for Energy Infrastructure, Technology Infrastructure, NBC Universal and Consumer & Industrial;included in determining segment profit, which we sometimes refer to as “net earnings,” for Capital Finance.
See accompanying notes to condensed, consolidated financial statements.
(7)
Source: GENERAL ELECTRIC CO, 10-Q, November 02, 2009

Notes to Condensed, Consolidated Financial Statements (Unaudited) 1. SUMMARY OF SIGNIFICANT ACCOUNTING POLICIES The accompanying condensed, consolidated financial statements represent the consolidation of General Electric Company and allcompanies that we directly or indirectly control, either through majority ownership or otherwise. See Note 1 to the consolidated financialstatements in our Annual Report on Form 10-K for the year ended December 31, 2008 (2008 Form 10-K), which discusses ourconsolidation and financial statement presentation. As used in this report on Form 10-Q (Report) and in our Annual Report on Form10-K, “GE” represents the adding together of all affiliated companies except General Electric Capital Services, Inc. (GECS or financialservices), which is presented on a one-line basis; GECS consists of General Electric Capital Services, Inc. and all of its affiliates; and“Consolidated” represents the adding together of GE and GECS with the effects of transactions between the two eliminated. GEincludes Energy Infrastructure, Technology Infrastructure, NBC Universal and Consumer & Industrial. GECS includes Capital Finance.We have reclassified certain prior-period amounts to conform to the current-period’s presentation. Unless otherwise indicated,information in these notes to condensed, consolidated financial statements relates to continuing operations. Accounting Changes The Financial Accounting Standards Board (FASB) issued FASB Accounting Standards Codification (ASC) effective for financialstatements issued for interim and annual periods ending after September 15, 2009. The ASC is an aggregation of previously issuedauthoritative U.S. generally accepted accounting principles (GAAP) in one comprehensive set of guidance organized by subject area. Inaccordance with the ASC, references to previously issued accounting standards have been replaced by ASC references. Subsequentrevisions to GAAP will be incorporated into the ASC through Accounting Standards Updates (ASU). We adopted FASB ASC 820, Fair Value Measurements and Disclosures, in two steps; effective January 1, 2008, we adopted it for allfinancial instruments and non-financial instruments accounted for at fair value on a recurring basis and effective January 1, 2009, for allnon-financial instruments accounted for at fair value on a non-recurring basis. This guidance establishes a new framework formeasuring fair value and expands related disclosures. See Note 14. On January 1, 2009, we adopted an amendment to FASB ASC 805, Business Combinations. This amendment significantly changed theaccounting for business acquisitions both during the period of the acquisition and in subsequent periods. Among the more significantchanges in the accounting for acquisitions are the following:
• Acquired in-process research and development (IPR&D) is accounted for as an asset, with the cost recognized as the researchand development is realized or abandoned. IPR&D was previously expensed at the time of the acquisition.
• Contingent consideration is recorded at fair value as an element of purchase price with subsequent adjustments recognized in
operations. Contingent consideration was previously accounted for as a subsequent adjustment of purchase price.
• Subsequent decreases in valuation allowances on acquired deferred tax assets are recognized in operations after themeasurement period. Such changes were previously considered to be subsequent changes in consideration and were recorded asdecreases in goodwill.
• Transaction costs are expensed. These costs were previously treated as costs of the acquisition.
(8)
Source: GENERAL ELECTRIC CO, 10-Q, November 02, 2009

In April 2009, the FASB amended FASB ASC 805 and changed the previous accounting for assets and liabilities arising fromcontingencies in a business combination. We adopted this amendment retrospectively effective January 1, 2009. The amendmentrequires pre-acquisition contingencies to be recognized at fair value, if fair value can be determined or reasonably estimated during themeasurement period. If fair value cannot be determined or reasonably estimated, the standard requires measurement based on therecognition and measurement criteria of FASB ASC 450, Contingencies. On January 1, 2009, we adopted an amendment to FASB ASC 810, Consolidation, which requires us to make certain changes to thepresentation of our financial statements. This amendment requires us to classify noncontrolling interests (previously referred to as“minority interest”) as part of consolidated net earnings ($5 million and $156 million for the three months ended September 30, 2009and 2008, respectively, and $102 million and $502 million for the nine months ended September 30, 2009 and 2008, respectively) andto include the accumulated amount of noncontrolling interests as part of shareowners' equity ($8,280 million and $8,947 million atSeptember 30, 2009 and December 31, 2008, respectively). The net earnings amounts we have previously reported are now presentedas "Net earnings attributable to the Company" and, as required, earnings per share continues to reflect amounts attributable only to theCompany. Similarly, in our presentation of shareowners’ equity, we distinguish between equity amounts attributable to GE shareownersand amounts attributable to the noncontrolling interests – previously classified as minority interest outside of shareowners’ equity.Beginning January 1, 2009, dividends to noncontrolling interests are classified as financing cash flows. In addition to these financialreporting changes, this guidance provides for significant changes in accounting related to noncontrolling interests; specifically,increases and decreases in our controlling financial interests in consolidated subsidiaries will be reported in equity similar to treasurystock transactions. If a change in ownership of a consolidated subsidiary results in loss of control and deconsolidation, any retainedownership interests are remeasured with the gain or loss reported in net earnings. Effective January 1, 2009, we adopted FASB ASC 808, Collaborative Arrangements, which requires gross basis presentation ofrevenues and expenses for principal participants in collaborative arrangements. Our Technology Infrastructure and EnergyInfrastructure segments enter into collaborative arrangements with manufacturers and suppliers of components used to build andmaintain certain engines, aero-derivatives, and turbines, under which GE and these participants share in risks and rewards of theseproduct programs. Adoption of the standard had no effect as our historical presentation had been consistent with the new requirements. Effective April 1, 2009, the FASB amended ASC 820 in relation to determining fair value when the volume and level of activity for anasset or liability have significantly decreased and identifying transactions that are not orderly. Adoption of this amendment had aninsignificant effect on our financial statements. Effective April 1, 2009, the FASB amended ASC 320, Investments – Debt and Equity Securities. See Note 3. This amendment modifiedthe existing model for recognition and measurement of impairment for debt securities. The two principal changes to the impairmentmodel for securities are as follows:
• Recognition of an other-than-temporary impairment charge for debt securities is required if any of these conditions are met: (1) wedo not expect to recover the entire amortized cost basis of the security, (2) we intend to sell the security or (3) it is more likely thannot that we will be required to sell the security before we recover its amortized cost basis.
• If the first condition above is met, but we do not intend to sell and it is not more likely than not that we will be required to sell the
security before recovery of its amortized cost basis, we would be required to record the difference between the security’s amortizedcost basis and its recoverable amount in earnings and the difference between the security’s recoverable amount and fair value inother comprehensive income. If either the second or third criteria are met, then we would be required to recognize the entiredifference between the security’s amortized cost basis and its fair value in earnings.
(9)
Source: GENERAL ELECTRIC CO, 10-Q, November 02, 2009

Interim Period Presentation The condensed, consolidated financial statements and notes thereto are unaudited. These statements include all adjustments(consisting of normal recurring accruals) that we considered necessary to present a fair statement of our results of operations, financialposition and cash flows. We have evaluated subsequent events that have occurred through November 2, 2009, the date of financialstatement issuance. The results reported in these condensed, consolidated financial statements should not be regarded as necessarilyindicative of results that may be expected for the entire year. It is suggested that these condensed, consolidated financial statements beread in conjunction with the financial statements and notes thereto included in our 2008 Form 10-K. We label our quarterly informationusing a calendar convention, that is, first quarter is labeled as ending on March 31, second quarter as ending on June 30, and thirdquarter as ending on September 30. It is our longstanding practice to establish interim quarterly closing dates using a fiscal calendar,which requires our businesses to close their books on either a Saturday or Sunday, depending on the business. The effects of thispractice are modest and only exist within a reporting year. The fiscal closing calendar from 1993 through 2013 is available on ourwebsite, www.ge.com/secreports. 2. DISCONTINUED OPERATIONS Discontinued operations comprised GE Money Japan (our Japanese personal loan business, Lake, and our Japanese mortgage andcard businesses, excluding our investment in GE Nissen Credit Co., Ltd.), our U.S. mortgage business (WMC), Plastics, AdvancedMaterials, GE Life, Genworth Financial, Inc. (Genworth) and most of GE Insurance Solutions Corporation (GE Insurance Solutions).Associated results of operations, financial position and cash flows are separately reported as discontinued operations for all periodspresented. GE Money Japan During the third quarter of 2007, we committed to a plan to sell Lake upon determining that, despite restructuring, Japanese regulatorylimits for interest charges on unsecured personal loans did not permit us to earn an acceptable return. During the third quarter of 2008,we completed the sale of GE Money Japan, which included Lake, along with our Japanese mortgage and card businesses, excludingour investment in GE Nissen Credit Co., Ltd. As a result, we recognized an after-tax loss of $908 million in 2007 and an incrementalloss in 2008 of $361 million. In connection with the transaction, GE Money Japan reduced the proceeds on the sale for estimatedinterest refund claims in excess of the statutory interest rate. Proceeds from the sale may be increased or decreased based on theactual claims experienced in accordance with terms specified in the agreement, and will not be adjusted unless claims exceedapproximately $3,000 million. During the second quarter of 2009, we accrued $132 million, which represents the amount by which weexpect claims to exceed those levels and is based on our historical and recent claims experience and the estimated future requests,taking into consideration the ability and likelihood of customers to make claims and other industry risk factors. Uncertainties around thestatus of laws and regulations and lack of certain information related to the individual customers make it difficult to develop ameaningful estimate of the aggregate claims exposure. We will continue to review our estimated exposure quarterly, and makeadjustments when required. GE Money Japan revenues from discontinued operations were an insignificant amount and $209 million inthe third quarters of 2009 and 2008, respectively, and an insignificant amount and $760 million in the first nine months of 2009 and2008, respectively. In total, GE Money Japan losses from discontinued operations, net of taxes, were $10 million and $160 million in thethird quarters of 2009 and 2008, respectively, and $142 million and $508 million in the first nine months of 2009 and 2008, respectively.
(10)
Source: GENERAL ELECTRIC CO, 10-Q, November 02, 2009
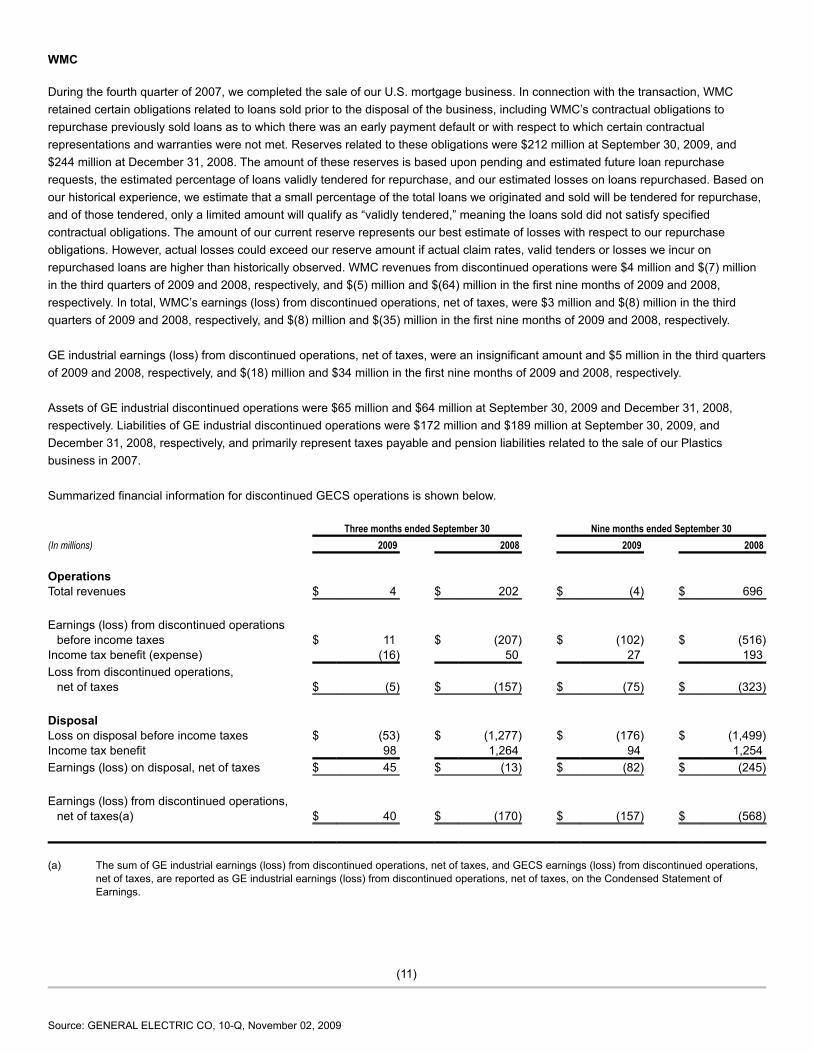
WMC During the fourth quarter of 2007, we completed the sale of our U.S. mortgage business. In connection with the transaction, WMCretained certain obligations related to loans sold prior to the disposal of the business, including WMC’s contractual obligations torepurchase previously sold loans as to which there was an early payment default or with respect to which certain contractualrepresentations and warranties were not met. Reserves related to these obligations were $212 million at September 30, 2009, and$244 million at December 31, 2008. The amount of these reserves is based upon pending and estimated future loan repurchaserequests, the estimated percentage of loans validly tendered for repurchase, and our estimated losses on loans repurchased. Based onour historical experience, we estimate that a small percentage of the total loans we originated and sold will be tendered for repurchase,and of those tendered, only a limited amount will qualify as “validly tendered,” meaning the loans sold did not satisfy specifiedcontractual obligations. The amount of our current reserve represents our best estimate of losses with respect to our repurchaseobligations. However, actual losses could exceed our reserve amount if actual claim rates, valid tenders or losses we incur onrepurchased loans are higher than historically observed. WMC revenues from discontinued operations were $4 million and $(7) millionin the third quarters of 2009 and 2008, respectively, and $(5) million and $(64) million in the first nine months of 2009 and 2008,respectively. In total, WMC’s earnings (loss) from discontinued operations, net of taxes, were $3 million and $(8) million in the thirdquarters of 2009 and 2008, respectively, and $(8) million and $(35) million in the first nine months of 2009 and 2008, respectively. GE industrial earnings (loss) from discontinued operations, net of taxes, were an insignificant amount and $5 million in the third quartersof 2009 and 2008, respectively, and $(18) million and $34 million in the first nine months of 2009 and 2008, respectively. Assets of GE industrial discontinued operations were $65 million and $64 million at September 30, 2009 and December 31, 2008,respectively. Liabilities of GE industrial discontinued operations were $172 million and $189 million at September 30, 2009, andDecember 31, 2008, respectively, and primarily represent taxes payable and pension liabilities related to the sale of our Plasticsbusiness in 2007. Summarized financial information for discontinued GECS operations is shown below. Three months ended September 30 Nine months ended September 30(In millions) 2009 2008 2009 2008 Operations Total revenues $ 4 $ 202 $ (4) $ 696 Earnings (loss) from discontinued operations before income taxes $ 11 $ (207) $ (102) $ (516)Income tax benefit (expense) (16) 50 27 193 Loss from discontinued operations, net of taxes $ (5) $ (157) $ (75) $ (323) Disposal Loss on disposal before income taxes $ (53) $ (1,277) $ (176) $ (1,499)Income tax benefit 98 1,264 94 1,254 Earnings (loss) on disposal, net of taxes $ 45 $ (13) $ (82) $ (245) Earnings (loss) from discontinued operations, net of taxes(a) $ 40 $ (170) $ (157) $ (568)
(a) The sum of GE industrial earnings (loss) from discontinued operations, net of taxes, and GECS earnings (loss) from discontinued operations,net of taxes, are reported as GE industrial earnings (loss) from discontinued operations, net of taxes, on the Condensed Statement ofEarnings.
(11)
Source: GENERAL ELECTRIC CO, 10-Q, November 02, 2009
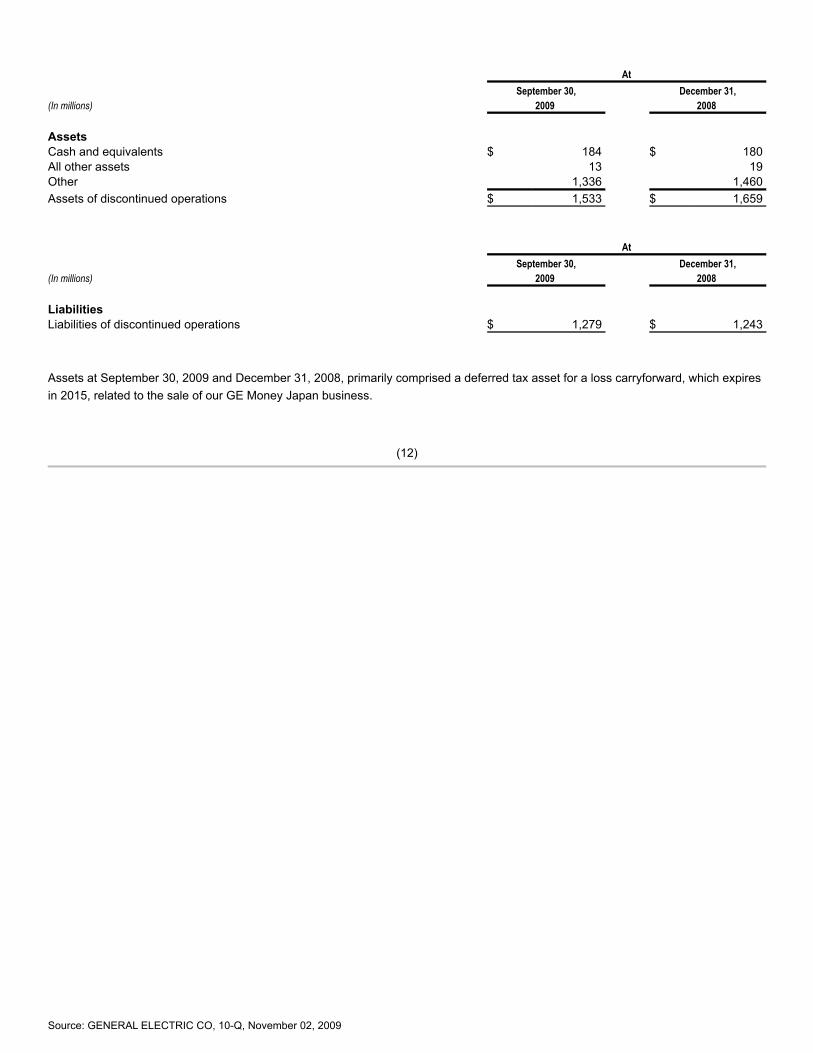
At September 30, December 31,(In millions) 2009 2008 Assets Cash and equivalents $ 184 $ 180 All other assets 13 19 Other 1,336 1,460 Assets of discontinued operations $ 1,533 $ 1,659 At September 30, December 31,(In millions) 2009 2008 Liabilities Liabilities of discontinued operations $ 1,279 $ 1,243
Assets at September 30, 2009 and December 31, 2008, primarily comprised a deferred tax asset for a loss carryforward, which expiresin 2015, related to the sale of our GE Money Japan business.
(12)
Source: GENERAL ELECTRIC CO, 10-Q, November 02, 2009

3. INVESTMENT SECURITIES The vast majority of our investment securities are classified as available-for-sale and comprise mainly investment-grade debt securitiessupporting obligations to annuitants and policyholders in our run-off insurance operations and holders of guaranteed investmentcontracts. At September 30, 2009 December 31, 2008 Gross Gross Gross Gross Amortized unrealized unrealized Estimated Amortized unrealized unrealized Estimated(In millions) cost gains losses fair value cost gains losses fair value GE Debt – U.S. corporate $ 25 $ – $ – $ 25 $ 182 $ – $ – $ 182 Equity – available-for-sale 15 1 (1) 15 32 – (1) 31
40 1 (1) 40 214 – (1) 213 GECS Debt U.S. corporate 22,909 1,435 (957) 23,387 22,183 512 (2,477) 20,218 State and municipal 2,281 71 (218) 2,134 1,556 19 (94) 1,481 Residential mortgage- backed(a) 4,223 96 (882) 3,437 5,326 70 (1,052) 4,344 Commercialmortgage-backed
3,001 83 (541) 2,543 2,910 14 (788) 2,136
Asset-backed 3,029 42 (339) 2,732 3,173 3 (691) 2,485 Corporate – non-U.S. 1,703 63 (53) 1,713 1,441 14 (166) 1,289 Government – non-U.S. 3,321 61 (12) 3,370 1,300 61 (19) 1,342 U.S. government and federal agency 3,492 66 – 3,558 739 65 (100) 704 Retained interests(b)(c) 8,245 248 (75) 8,418 6,395 113 (152) 6,356 Equity Available-for-sale 588 198 (14) 772 629 24 (160) 493 Trading 659 – – 659 388 – – 388
53,451 2,363 (3,091) 52,723 46,040 895 (5,699) 41,236 Eliminations (2) – – (2) (7) – 4 (3)Total $ 53,489 $ 2,364 $ (3,092) $ 52,761 $ 46,247 $ 895 $ (5,696) $ 41,446
(a) Substantially collateralized by U.S. mortgages. (b) Included $1,846 million and $1,752 million of retained interests at September 30, 2009 and December 31, 2008, respectively, accounted for at
fair value in accordance with FASB ASC 815, Derivatives and Hedging. See Note 16. (c) Amortized cost and estimated fair value included $23 million and $20 million of trading securities at September 30, 2009 and December 31,
2008, respectively.
(13)
Source: GENERAL ELECTRIC CO, 10-Q, November 02, 2009
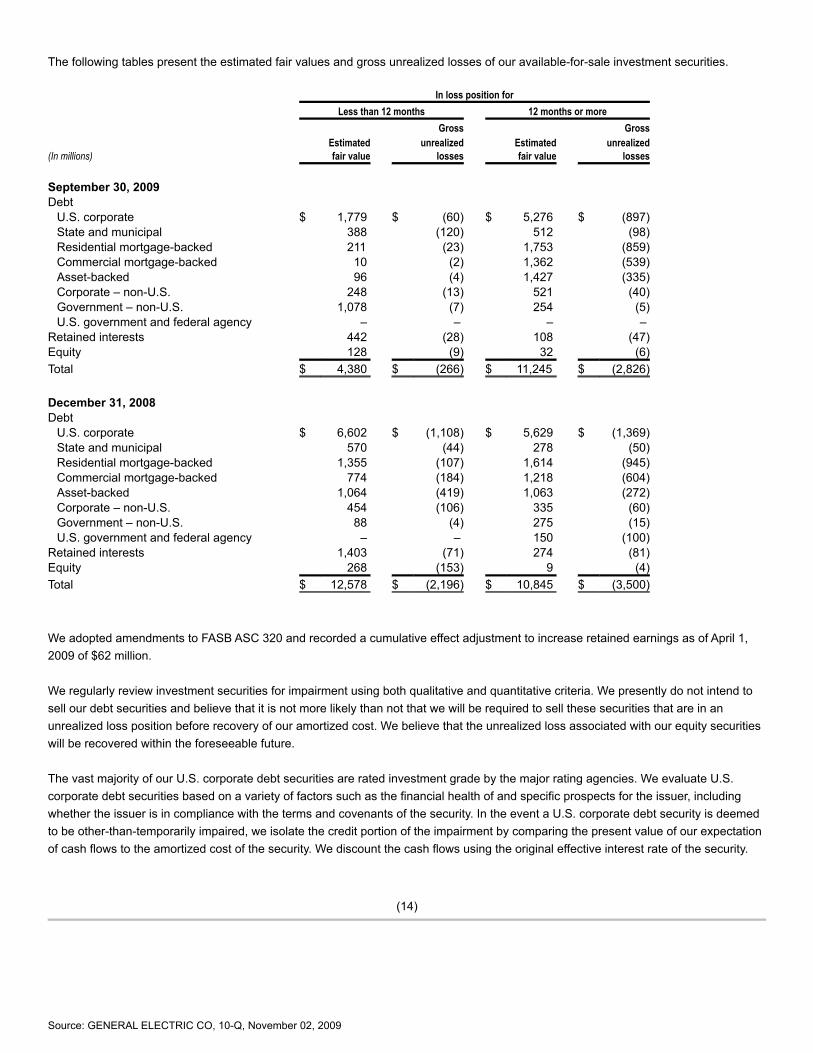
The following tables present the estimated fair values and gross unrealized losses of our available-for-sale investment securities. In loss position for Less than 12 months 12 months or more
Gross
Gross Estimated unrealized Estimated unrealized(In millions) fair value losses fair value losses September 30, 2009 Debt U.S. corporate $ 1,779 $ (60) $ 5,276 $ (897) State and municipal 388 (120) 512 (98) Residential mortgage-backed 211 (23) 1,753 (859) Commercial mortgage-backed 10 (2) 1,362 (539) Asset-backed 96 (4) 1,427 (335) Corporate – non-U.S. 248 (13) 521 (40) Government – non-U.S. 1,078 (7) 254 (5) U.S. government and federal agency – – – – Retained interests 442 (28) 108 (47)Equity 128 (9) 32 (6)Total $ 4,380 $ (266) $ 11,245 $ (2,826) December 31, 2008 Debt U.S. corporate $ 6,602 $ (1,108) $ 5,629 $ (1,369) State and municipal 570 (44) 278 (50) Residential mortgage-backed 1,355 (107) 1,614 (945) Commercial mortgage-backed 774 (184) 1,218 (604) Asset-backed 1,064 (419) 1,063 (272) Corporate – non-U.S. 454 (106) 335 (60) Government – non-U.S. 88 (4) 275 (15) U.S. government and federal agency – – 150 (100)Retained interests 1,403 (71) 274 (81)Equity 268 (153) 9 (4)Total $ 12,578 $ (2,196) $ 10,845 $ (3,500)
We adopted amendments to FASB ASC 320 and recorded a cumulative effect adjustment to increase retained earnings as of April 1,2009 of $62 million. We regularly review investment securities for impairment using both qualitative and quantitative criteria. We presently do not intend tosell our debt securities and believe that it is not more likely than not that we will be required to sell these securities that are in anunrealized loss position before recovery of our amortized cost. We believe that the unrealized loss associated with our equity securitieswill be recovered within the foreseeable future. The vast majority of our U.S. corporate debt securities are rated investment grade by the major rating agencies. We evaluate U.S.corporate debt securities based on a variety of factors such as the financial health of and specific prospects for the issuer, includingwhether the issuer is in compliance with the terms and covenants of the security. In the event a U.S. corporate debt security is deemedto be other-than-temporarily impaired, we isolate the credit portion of the impairment by comparing the present value of our expectationof cash flows to the amortized cost of the security. We discount the cash flows using the original effective interest rate of the security.
(14)
Source: GENERAL ELECTRIC CO, 10-Q, November 02, 2009
The vast majority of our residential mortgage-backed securities (RMBS) have investment-grade credit ratings from the major ratingagencies and are in a senior position in the capital structure of the deal. Of our total RMBS at September 30, 2009 and December 31,2008, approximately $984 million and $1,310 million, respectively, relate to residential subprime credit, primarily supporting ourguaranteed investment contracts. These are collateralized primarily by pools of individual, direct mortgage loans (a majority of whichwere originated in 2006 and 2005), not other structured products such as collateralized debt obligations. In addition, of the totalresidential subprime credit exposure at September 30, 2009 and December 31, 2008, approximately $840 million and $1,093 million,respectively, was insured by monoline insurers. Substantially all of our commercial mortgage-backed securities (CMBS) also have investment-grade credit ratings from the major ratingagencies and are in a senior position in the capital structure of the deal. Our CMBS investments are collateralized by both diversifiedpools of mortgages that were originated for securitization (conduit CMBS) and pools of large loans backed by high quality properties(large loan CMBS), a majority of which were originated in 2006 and 2007. For asset-backed securities, including RMBS, we estimate the portion of loss attributable to credit using a discounted cash flow modelthat considers estimates of cash flows generated from the underlying collateral. Estimates of cash flows consider internal credit risk,interest rate and prepayment assumptions that incorporate management’s best estimate of key assumptions, including default rates,loss severity and prepayment rates. For CMBS, we estimate the portion of loss attributable to credit by evaluating potential losses oneach of the underlying loans in the security. Collateral cash flows are considered in the context of our position in the capital structure ofthe deal. Assumptions can vary widely depending upon the collateral type, geographic concentrations and vintage. If there has been an adverse change in cash flows for RMBS, management considers credit enhancements such as monolineinsurance (which are features of a specific security). In evaluating the overall credit worthiness of the Monoline, we use an analysis thatis similar to the approach we use for corporate bonds, including an evaluation of the sufficiency of the Monoline’s cash reserves andcapital, ratings activity, whether the Monoline is in default or default appears imminent, and the potential for intervention by aninsurance or other regulator. During the three months ended September 30, 2009, we recorded pre-tax, other-than-temporary impairments of $325 million, of which$161 million was recorded through earnings ($26 million relates to equity securities), and $164 million was recorded in AccumulatedOther Comprehensive Income (AOCI). Previously recognized other-than-temporary impairments related to credit on securities still held at July 1, 2009 were $499 million.During the third quarter, first time and incremental credit impairments were $48 million and $55 million, respectively. Previous creditimpairments related to securities sold were $82 million. During the period April 1, 2009 through September 30, 2009, we recorded pre-tax, other-than-temporary impairments of $624 million, ofwhich $359 million was recorded through earnings ($38 million relates to equity securities), and $265 million was recorded in AOCI. Previously recognized other-than-temporary impairments related to credit on securities still held at April 1, 2009 were $324 million.During the period April 1, 2009 through September 30, 2009, first time and incremental credit impairments were $74 million and $204million, respectively. Previous credit impairments related to securities sold were $82 million.
(15)
Source: GENERAL ELECTRIC CO, 10-Q, November 02, 2009

Supplemental information about gross realized gains and losses on available-for-sale investment securities follows. Three months ended September 30 Nine months ended September 30(In millions) 2009 2008 2009 2008 GE Gains $ – $ – $ – $ – Losses, including impairments – – (172) (6) Net – – (172) (6) GECS Gains 55 26 114 180 Losses, including impairments (186) (310) (534) (610) Net (131) (284) (420) (430)Total $ (131) $ (284) $ (592) $ (436)
Although we generally do not have the intent to sell any specific securities at the end of the period, in the ordinary course of managingour investment securities portfolio, we may sell securities prior to their maturities for a variety of reasons, including diversification, creditquality, yield and liquidity requirements and the funding of claims and obligations to policyholders. Proceeds from investment securities sales and early redemptions by the issuer totaled $3,786 million and $934 million in the thirdquarters of 2009 and 2008, respectively, and $7,418 million and $2,949 million in the first nine months of 2009 and 2008, respectively,principally from the sales and maturities of short-term securities in our bank subsidiaries. We recognized pre-tax gains on trading securities of $29 million and pre-tax losses of $(164) million in the third quarters of 2009 and2008, respectively, and pre-tax gains of $273 million and $223 million in the first nine months of 2009 and 2008, respectively.Investments in retained interests increased by $210 million and $10 million during the first nine months of 2009 and 2008, respectively,reflecting changes in fair value. 4. INVENTORIES Inventories consisted of the following. At September 30, December 31,(In millions) 2009 2008 Raw materials and work in process $ 8,365 $ 8,710 Finished goods 4,693 5,109 Unbilled shipments 689 561 13,747 14,380 Less revaluation to LIFO (655) (706)Total $ 13,092 $ 13,674
(16)
Source: GENERAL ELECTRIC CO, 10-Q, November 02, 2009

5. GECS FINANCING RECEIVABLES AND ALLOWANCE FOR LOSSES ON FINANCING RECEIVABLES GECS financing receivables – net, consisted of the following. At September 30, December 31,(In millions) 2009 2008 Loans, net of deferred income $ 298,432 $ 310,203 Investment in financing leases, net of deferred income 57,446 67,578 355,878 377,781 Less allowance for losses (7,360) (5,325)Financing receivables – net(a) $ 348,518 $ 372,456
(a) Included $4,406 million and $6,461 million related to consolidated, liquidating securitization entities at September 30, 2009 andDecember 31, 2008, respectively. In addition, financing receivables at September 30, 2009 and December 31, 2008 included $2,880million and $2,736 million, respectively, relating to loans that had been acquired in a transfer but have been subject to creditdeterioration since origination per FASB ASC 310, Receivables.
(17)
Source: GENERAL ELECTRIC CO, 10-Q, November 02, 2009

Effective January 1, 2009, loans acquired in a business acquisition are recorded at fair value, which incorporates our estimate at theacquisition date of the credit losses over the remaining life of the portfolio. As a result, the allowance for loan losses is not carried overat acquisition. This may result in lower reserve coverage ratios prospectively. Details of financing receivables – net follow. At
September 30, December 31,(In millions) 2009 2008
Commercial Lending and Leasing (CLL)(a) Americas $ 92,263 $ 105,410 Europe 40,383 37,767 Asia 14,096 16,683 Other 776 786 147,518 160,646 Consumer(a) Non-U.S. residential mortgages 61,308 60,753 Non-U.S. installment and revolving credit 25,197 24,441 U.S. installment and revolving credit 22,324 27,645 Non-U.S. auto 14,366 18,168 Other 13,191 11,541 136,386 142,548 Real Estate 45,471 46,735 Energy Financial Services 8,362 8,392 GE Capital Aviation Services (GECAS)(b) 15,046 15,429 Other(c) 3,095 4,031 355,878 377,781 Less allowance for losses (7,360) (5,325)Total $ 348,518 $ 372,456
(a) During the first quarter of 2009, we transferred Artesia from CLL to Consumer. Prior-period amounts were reclassified to conform to thecurrent-period’s presentation.
(b) Included loans and financing leases of $12,927 million and $13,078 million at September 30, 2009 and December 31, 2008, respectively,
related to commercial aircraft at Aviation Financial Services. (c) Consisted of loans and financing leases related to certain consolidated, liquidating securitization entities.
(18)
Source: GENERAL ELECTRIC CO, 10-Q, November 02, 2009
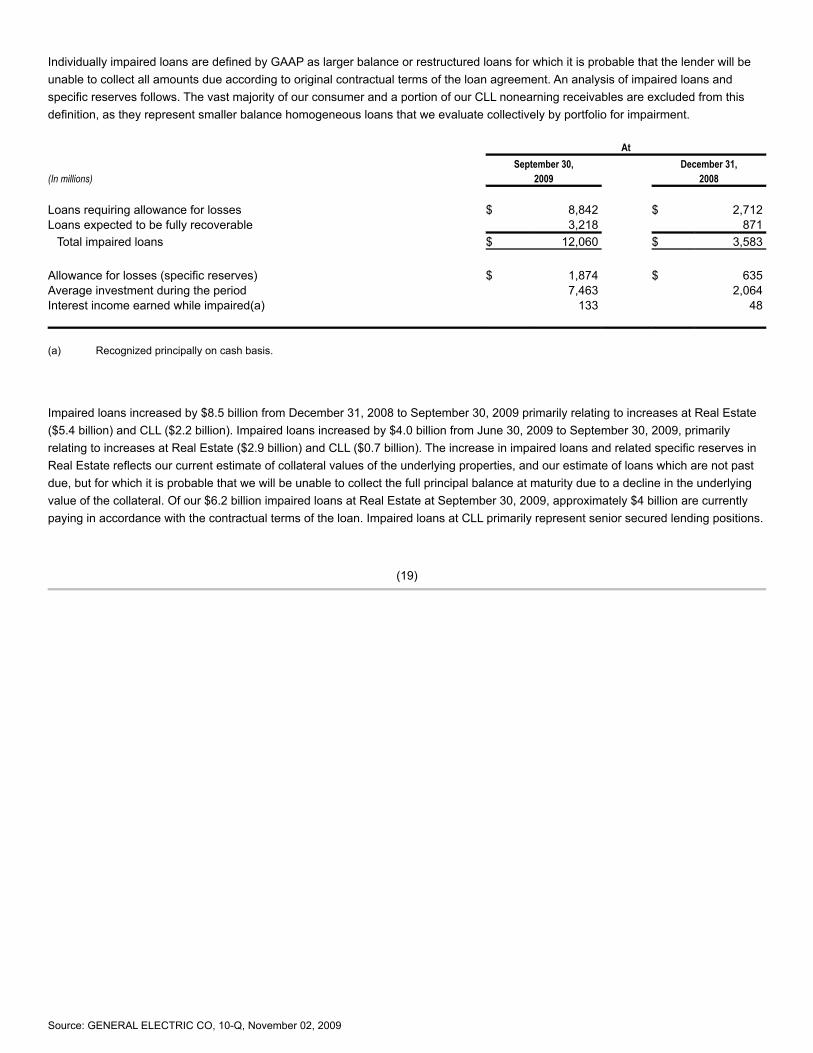
Individually impaired loans are defined by GAAP as larger balance or restructured loans for which it is probable that the lender will beunable to collect all amounts due according to original contractual terms of the loan agreement. An analysis of impaired loans andspecific reserves follows. The vast majority of our consumer and a portion of our CLL nonearning receivables are excluded from thisdefinition, as they represent smaller balance homogeneous loans that we evaluate collectively by portfolio for impairment. At September 30, December 31,(In millions) 2009 2008 Loans requiring allowance for losses $ 8,842 $ 2,712 Loans expected to be fully recoverable 3,218 871 Total impaired loans $ 12,060 $ 3,583 Allowance for losses (specific reserves) $ 1,874 $ 635 Average investment during the period 7,463 2,064 Interest income earned while impaired(a) 133 48
(a) Recognized principally on cash basis.
Impaired loans increased by $8.5 billion from December 31, 2008 to September 30, 2009 primarily relating to increases at Real Estate($5.4 billion) and CLL ($2.2 billion). Impaired loans increased by $4.0 billion from June 30, 2009 to September 30, 2009, primarilyrelating to increases at Real Estate ($2.9 billion) and CLL ($0.7 billion). The increase in impaired loans and related specific reserves inReal Estate reflects our current estimate of collateral values of the underlying properties, and our estimate of loans which are not pastdue, but for which it is probable that we will be unable to collect the full principal balance at maturity due to a decline in the underlyingvalue of the collateral. Of our $6.2 billion impaired loans at Real Estate at September 30, 2009, approximately $4 billion are currentlypaying in accordance with the contractual terms of the loan. Impaired loans at CLL primarily represent senior secured lending positions.
(19)
Source: GENERAL ELECTRIC CO, 10-Q, November 02, 2009

GECS Allowance for Losses on Financing Receivables Balance Provision Balance January 1, charged to Gross September 30,(In millions) 2009 operations Other(a) write-offs Recoveries 2009 CLL(b) Americas $ 843 $ 969 $ (34) $ (746) $ 66 $ 1,098 Europe 288 412 8 (225) 17 500 Asia 163 188 8 (136) 19 242 Other 2 4 2 (2) – 6 Consumer(b) Non-U.S. residential mortgages 383 805 81 (424) 130 975 Non-U.S. installment and revolving credit 1,051 1,347 41 (1,702) 376 1,113 U.S. installment and revolving credit 1,700 2,631 (761) (2,134) 132 1,568 Non-U.S. auto 222 351 31 (441) 138 301 Other 226 284 25 (329) 73 279 Real Estate 301 903 13 (190) 1 1,028 Energy Financial Services 58 42 1 – – 101 GECAS 60 69 – (3) – 126 Other 28 16 – (22) 1 23 Total $ 5,325 $ 8,021 $ (585) $ (6,354) $ 953 $ 7,360
(a) Other primarily included the effects of securitization activity and currency exchange. (b) During the first quarter of 2009, we transferred Artesia from CLL to Consumer. Prior-period amounts were reclassified to conform to the
current-period’s presentation.
(20)
Source: GENERAL ELECTRIC CO, 10-Q, November 02, 2009

Balance Provision Balance January 1, charged to Gross September 30,(In millions) 2008 operations Other(a) write-offs Recoveries 2008 CLL(b) Americas $ 471 $ 394 $ 157 $ (371) $ 52 $ 703 Europe 232 145 (59) (141) 23 200 Asia 226 78 (7) (188) 5 114 Other 3 2 (1) – 1 5 Consumer(b) Non-U.S. residential mortgages 246 147 (15) (135) 52 295 Non-U.S. installment and revolving credit 1,371 1,259 (57) (1,968) 722 1,327 U.S. installment and revolving credit 985 1,908 (416) (1,477) 215 1,215 Non-U.S. auto 324 260 (59) (479) 225 271 Other 167 136 25 (182) 54 200 Real Estate 168 47 4 (10) 1 210 Energy Financial Services 19 12 3 – – 34 GECAS 8 47 – (1) – 54 Other 18 18 (1) (15) – 20 Total $ 4,238 $ 4,453 $ (426) $ (4,967) $ 1,350 $ 4,648
(a) Other primarily included the effects of securitization activity, currency exchange, dispositions and acquisitions. (b) During the first quarter of 2009, we transferred Artesia from CLL to Consumer. Prior-period amounts were reclassified to conform to the
current-period’s presentation.
6. PROPERTY, PLANT AND EQUIPMENT Property, plant and equipment (including equipment leased to others) – net, consisted of the following. At September 30, December 31,(In millions) 2009 2008 Original cost $ 118,916 $ 125,671 Less accumulated depreciation and amortization (45,923) (47,141)Property, plant and equipment (including equipment leased to others) – net $ 72,993 $ 78,530
(21)
Source: GENERAL ELECTRIC CO, 10-Q, November 02, 2009

7. GOODWILL AND OTHER INTANGIBLE ASSETS Goodwill and other intangible assets – net, consisted of the following. At September 30, December 31,(In millions) 2009 2008 Goodwill $ 84,880 $ 81,759 Other intangible assets Intangible assets subject to amortization $ 12,640 $ 12,623 Indefinite-lived intangible assets(a) 2,370 2,354 Total $ 15,010 $ 14,977
(a) Indefinite-lived intangible assets principally comprised trademarks, tradenames and U.S. Federal Communications Commission licenses.
Changes in goodwill balances follow. Acquisitions/ Dispositions, Balance acquisition currency Balance January 1, accounting exchange September 30,(In millions) 2009 adjustments and other 2009 Energy Infrastructure $ 9,943 $ (146) $ 350 $ 10,147 Technology Infrastructure 26,684 413 (364) 26,733 NBC Universal 18,973 20 4 18,997 Capital Finance 25,365 2,603 216 28,184 Consumer & Industrial 794 – 25 819 Total $ 81,759 $ 2,890 $ 231 $ 84,880
Goodwill related to new acquisitions in the first nine months of 2009 was $2,743 million and included acquisitions of BAC Credomatic(BAC) ($1,309 million) and Interbanca S.p.A. (Interbanca) ($1,075 million) at Capital Finance and Airfoils Technologies International –Singapore Pte. Ltd. (ATI-Singapore) ($337 million) at Technology Infrastructure. During the first nine months of 2009, the goodwillbalance increased by $147 million related to acquisition accounting adjustments for prior-year acquisitions. The most significant ofthese adjustments was an increase of $180 million associated with the 2008 acquisition of CitiCapital at Capital Finance, partially offsetby a decrease of $139 million associated with the 2008 acquisition of Hydril Pressure Control by Energy Infrastructure. Also during thefirst nine months of 2009, goodwill balances increased $231 million, primarily as a result of the weaker U.S. dollar ($1,581 million),partially offset by the deconsolidation of Penske Truck Leasing Co., L.P. (PTL) ($634 million) at Capital Finance and the disposition ofGE Homeland Protection, Inc. ($423 million) at Technology Infrastructure. On March 20, 2009, we increased our ownership in ATI-Singapore from 49% to 100% and concurrently acquired from the same seller acontrolling financial interest in certain affiliates. We remeasured our previous equity interests to fair value, resulting in a pre-tax gain of$254 million which is reported in other income. On June 25, 2009, we increased our ownership in BAC from 49.99% to 75% for a purchase price of $623 million, in accordance withterms of a previous agreement. We remeasured our previously held equity investment to fair value, resulting in a pre-tax gain of $343million, which is reported in GECS revenues from services.
(22)
Source: GENERAL ELECTRIC CO, 10-Q, November 02, 2009
We test goodwill for impairment annually and more frequently if circumstances warrant. We determine fair values for each of thereporting units using an income approach. When available and as appropriate, we use comparative market multiples to corroboratediscounted cash flow results. For purposes of the income approach, fair value is determined based on the present value of estimatedfuture cash flows, discounted at an appropriate risk-adjusted rate. We use our internal forecasts to estimate future cash flows andinclude an estimate of long-term future growth rates based on our most recent views of the long-term outlook for each business. Actualresults may differ from those assumed in our forecasts. We derive our discount rates by applying the capital asset pricing model (i.e., toestimate the cost of equity financing) and analyzing published rates for industries relevant to our reporting units. We use discount ratesthat are commensurate with the risks and uncertainty inherent in the respective businesses and in our internally developed forecasts.Valuations using the market approach reflect prices and other relevant observable information generated by market transactionsinvolving comparable businesses. Compared to the market approach, the income approach more closely aligns the reporting unit valuation to a company’s or business’specific business model, geographic markets and product offerings, as it is based on specific projections of the business. Requiredrates of return, along with uncertainty inherent in the forecasts of future cash flows are reflected in the selection of the discount rate.Equally important, under this approach, reasonably likely scenarios and associated sensitivities can be developed for alternative futurestates that may not be reflected in an observable market price. A market approach allows for comparison to actual market transactionsand multiples. It can be somewhat more limited in its application because the population of potential comparables (or pure plays) isoften limited to publicly-traded companies where the characteristics of the comparative business and ours can be significantly different,market data is usually not available for divisions within larger conglomerates or non-public subsidiaries that could otherwise qualify ascomparable, and the specific circumstances surrounding a market transaction (e.g., synergies between the parties, terms andconditions of the transaction, etc.) may be different or irrelevant with respect to our business. It can also be difficult under the currentmarket conditions to identify orderly transactions between market participants in similar financial services businesses. We assess thevaluation methodology based upon the relevance and availability of data at the time of performing the valuation and weight themethodologies appropriately. Given the significant decline in our stock price in the first quarter of 2009 and market conditions in the financial services industry at thattime, we conducted an additional impairment analysis of the Capital Finance reporting units during the first quarter of 2009 using dataas of January 1, 2009. As a result of these tests, no goodwill impairment was recognized. We performed our annual impairment test for goodwill at all of our reporting units in the third quarter using data as of July 1, 2009. Inperforming the valuations, we used cash flows which reflected management’s forecasts and discount rates which reflect the risksassociated with the current market. Based on the results of our testing, the fair values at each of the GE Industrial reporting units andthe CLL, Consumer, Energy Financial Services and GECAS reporting units exceeded their book values; therefore, the second step ofthe impairment test (in which fair value of each of the reporting unit’s assets and liabilities are measured) was not required to beperformed and no goodwill impairment was recognized. Due to the volatility and uncertainties in the current commercial real estateenvironment, we used a range of valuations to determine the fair value for our Real Estate reporting unit. While the Real Estatereporting unit’s book value was within the range of its fair value, we further substantiated our Real Estate goodwill balance byperforming the second step analysis described above. As a result of our tests for Real Estate, no goodwill impairment was recognized.Our Real Estate reporting unit had a goodwill balance of $1,209 million at September 30, 2009. Estimating the fair value of reporting units involves the use of estimates and significant judgments that are based on a number offactors including actual operating results. If current conditions persist longer or deteriorate further than expected, it is reasonablypossible that the judgments and estimates described above could change in future periods.
(23)
Source: GENERAL ELECTRIC CO, 10-Q, November 02, 2009

Intangible Assets Subject to Amortization At September 30, 2009 December 31, 2008 Gross Gross carrying Accumulated carrying Accumulated (In millions) amount amortization Net amount amortization Net Customer-related $ 6,591 $ (1,840) $ 4,751 $ 6,341 $ (1,516) $ 4,825 Patents, licenses and trademarks 5,194 (2,163) 3,031 5,315 (2,150) 3,165 Capitalized software 7,294 (4,690) 2,604 6,872 (4,199) 2,673 Lease valuations 1,734 (730) 1,004 1,761 (594) 1,167 Present value of future profits 921 (463) 458 869 (439) 430 All other 1,329 (537) 792 680 (317) 363 Total $ 23,063 $ (10,423) $ 12,640 $ 21,838 $ (9,215) $ 12,623
Consolidated amortization related to intangible assets subject to amortization was $616 million and $445 million for the quarters endedSeptember 30, 2009 and 2008, respectively. Consolidated amortization related to intangible assets subject to amortization for the ninemonths ended September 30, 2009 and 2008, was $1,629 million and $1,469 million, respectively.
(24)
Source: GENERAL ELECTRIC CO, 10-Q, November 02, 2009

8. GECS BORROWINGS GECS borrowings are summarized in the following table. At(In millions) September 30, December 31, 2009 2008 Short-term borrowings Commercial paper U.S. Unsecured(a) $ 40,135 $ 62,768 Asset-backed(b) 2,884 3,652 Non-U.S. 9,871 9,033 Current portion of long-term debt(a)(c)(d) 69,324 69,682 Bank deposits(e) 25,738 29,634 Bank borrowings(f) 5,041 10,569 GE Interest Plus notes(g) 6,520 5,633 Other 1,425 2,562 Total 160,938 193,533 Long-term borrowings Senior notes Unsecured(a)(d) 322,280 298,665 Asset-backed(h) 4,069 5,002 Subordinated notes(i) 2,711 2,866 Subordinated debentures(j) 7,706 7,315 Bank deposits(k) 10,649 7,220 Total 347,415 321,068 Total borrowings $ 508,353 $ 514,601
(a) General Electric Capital Corporation (GE Capital) had issued and outstanding $59,110 million ($3,660 million commercial paper and $55,450million long-term borrowings) and $35,243 million ($21,823 million commercial paper and $13,420 million long-term borrowings) of senior,unsecured debt that was guaranteed by the Federal Deposit Insurance Corporation (FDIC) under the Temporary Liquidity Guarantee Programat September 30, 2009 and December 31, 2008, respectively. GE Capital and GE are parties to an Eligible Entity Designation Agreement andGE Capital is subject to the terms of a Master Agreement, each entered into with the FDIC. The terms of these agreements include, amongother things, a requirement that GE and GE Capital reimburse the FDIC for any amounts that the FDIC pays to holders of GE Capital debt thatis guaranteed by the FDIC.
(b) Consists entirely of obligations of consolidated, liquidating securitization entities. See Note 16. (c) Included $239 million and $326 million of asset-backed senior notes, issued by consolidated, liquidating securitization entities at September
30, 2009 and December 31, 2008, respectively. (d) Included $1,665 million ($74 million short-term and $1,591 million long-term) of borrowings under European government-sponsored programs
at September 30, 2009. (e) Included $20,893 million and $11,793 million of deposits in non-U.S. banks at September 30, 2009 and December 31, 2008, respectively, and
included certificates of deposits distributed by brokers of $4,845 million and $17,841 million at September 30, 2009 and December 31, 2008,respectively.
(f) Term borrowings from banks with an original term to maturity of less than 12 months. (g) Entirely variable denomination floating rate demand notes. (h) Included $895 million and $2,104 million of asset-backed senior notes, issued by consolidated, liquidating securitization entities at September
30, 2009 and December 31, 2008, respectively. See Note 16. (i) Included $417 million and $750 million of subordinated notes guaranteed by GE at September 30, 2009 and December 31, 2008, respectively. (j) Subordinated debentures receive rating agency equity credit and were hedged at issuance to the U.S. dollar equivalent of $7,725 million. (k)
Source: GENERAL ELECTRIC CO, 10-Q, November 02, 2009

Included certificates of deposits distributed by brokers with maturities greater than one year of $9,898 million and $6,699 million at September30, 2009 and December 31, 2008, respectively.
(25)
Source: GENERAL ELECTRIC CO, 10-Q, November 02, 2009

9. POSTRETIREMENT BENEFIT PLANS We sponsor a number of pension and retiree health and life insurance benefit plans. Principal pension plans include the GE PensionPlan and the GE Supplementary Pension Plan. Principal retiree benefit plans generally provide health and life insurance benefits toemployees who retire under the GE Pension Plan with 10 or more years of service. Other pension plans include the U.S. and non-U.S.pension plans with pension assets or obligations greater than $50 million. Smaller pension plans and other retiree benefit plans are notmaterial individually or in the aggregate. The effect on operations of the pension plans follows. Principal Pension Plans Three months ended September 30 Nine months ended September 30(In millions) 2009 2008 2009 2008 Expected return on plan assets $ (1,125) $ (1,075) $ (3,378) $ (3,225)Service cost for benefits earned 522 314 1,211 934 Interest cost on benefit obligation 667 663 2,001 1,988 Prior service cost amortization 81 80 242 242 Net actuarial loss amortization 86 60 259 181 Pension plans cost $ 231 $ 42 $ 335 $ 120
Other Pension Plans Three months ended September 30 Nine months ended September 30(In millions) 2009 2008 2009 2008 Expected return on plan assets $ (110) $ (135) $ (321) $ (412)Service cost for benefits earned 84 81 249 243 Interest cost on benefit obligation 117 123 338 374 Prior service cost amortization 3 3 8 9 Net actuarial loss amortization 37 21 93 64 Pension plans cost $ 131 $ 93 $ 367 $ 278
The effect on operations of principal retiree health and life insurance plans follows. Principal Retiree Health and Life Insurance Plans Three months ended September 30 Nine months ended September 30(In millions) 2009 2008 2009 2008 Expected return on plan assets $ (32) $ (32) $ (96) $ (98)Service cost for benefits earned 177 71 336 214 Interest cost on benefit obligation 177 182 531 568 Prior service cost amortization 168 168 504 504 Net actuarial gain amortization (27) (23) (81) (26)Retiree benefit plans cost $ 463 $ 366 $ 1,194 $ 1,162
10. INCOME TAXES During the first quarter of 2009, following the change in our external credit ratings, funding actions taken and review of our operations,liquidity and funding, we determined that undistributed prior-year earnings of non-U.S. subsidiaries of GECS, on which we hadpreviously provided deferred U.S. taxes, would be indefinitely reinvested outside the U.S. This change increased the amount ofprior-year earnings indefinitely reinvested outside the U.S. by approximately $2 billion to $77 billion, resulting in an income tax benefit of$700 million in the first quarter of 2009.
(26)
Source: GENERAL ELECTRIC CO, 10-Q, November 02, 2009

The balance of “unrecognized tax benefits,” the amount of related interest and penalties we have provided and what we believe to bethe range of reasonably possible changes in the next 12 months, were: At September 30, December 31,(In millions) 2009 2008 Unrecognized tax benefits $ 7,135 $ 6,692 Portion that, if recognized, would reduce tax expense and effective tax rate(a) 4,912 4,453 Accrued interest on unrecognized tax benefits 1,293 1,204 Accrued penalties on unrecognized tax benefits 102 96 Reasonably possible reduction to the balance of unrecognized tax benefits in succeeding 12 months 0-1,500 0-1,500 Portion that, if recognized, would reduce tax expense and effective tax rate(a) 0-1,400 0-1,100
(a) Some portion of such reduction might be reported as discontinued operations.
The IRS is currently auditing our consolidated income tax returns for 2003-2007. In addition, certain other U.S. tax deficiency issuesand refund claims for previous years remain unresolved. It is reasonably possible that the 2003-2005 U.S. audit cycle will be completedduring the next 12 months, which could result in a decrease in our balance of unrecognized tax benefits. We believe that there are noother jurisdictions in which the outcome of unresolved issues or claims is likely to be material to our results of operations, financialposition or cash flows. We further believe that we have made adequate provision for all income tax uncertainties. GE and GECS file a consolidated U.S. federal income tax return. The GECS provision for current tax expense includes its effect on theconsolidated return. The effect of GECS on the consolidated liability is settled in cash as GE tax payments are due. 11. SHAREOWNERS’ EQUITY A summary of increases (decreases) in GE shareowners’ equity that did not result directly from transactions with shareowners, net ofincome taxes, follows. Three months ended September 30 Nine months ended September 30(In millions) 2009 2008 2009 2008 Net earnings attributable to the Company $ 2,494 $ 4,312 $ 8,012 $ 13,688 Investment securities – net 1,697 (1,086) 2,615 (2,414)Currency translation adjustments – net 1,857 (4,912) 4,342 (3,508)Cash flow hedges – net 71 (1,622) 1,476 (1,500)Benefit plans – net 180 210 659 924 Total $ 6,299 $ (3,098) $ 17,104 $ 7,190
Changes to noncontrolling interests during the third quarter of 2009 resulted from net earnings ($5 million), dividends ($(152) million),AOCI ($14 million) and other ($20 million). Changes to the individual components of AOCI attributable to noncontrolling interests wereinsignificant. Changes to noncontrolling interests during the first nine months of 2009 resulted from net earnings ($102 million), dividends ($(444)million), the effects of deconsolidating PTL ($(331) million, including $101 million of AOCI), other AOCI ($10 million) and other ($(4)million). Changes to the individual components of AOCI attributable to noncontrolling interests were insignificant.
(27)
Source: GENERAL ELECTRIC CO, 10-Q, November 02, 2009

12. GECS REVENUES FROM SERVICES GECS revenues from services are summarized in the following table. Three months ended September 30 Nine months ended September 30(In millions) 2009 2008 2009 2008 Interest on loans $ 4,933 $ 7,198 $ 15,113 $ 20,426 Equipment leased to others 2,902 3,967 9,314 11,686 Fees 1,160 1,989 3,419 4,798 Financing leases 795 1,107 2,533 3,456 Real estate investments 410 803 1,128 3,102 Premiums earned by insurance activities 515 554 1,525 1,664 Associated companies 277 560 751 1,676 Investment income(a) 755 531 2,413 2,388 Net securitization gains 449 317 1,169 1,022 Other items(b)(c) 337 826 2,604 3,809 Total $ 12,533 $ 17,852 $ 39,969 $ 54,027
(a) Included net other-than-temporary impairments on investment securities of $161 million and $309 million in the third quarters of 2009 and
2008, respectively, and $484 million and $599 million in the first nine months of 2009 and 2008, respectively. See Note 3. (b) Included a gain on the sale of a limited partnership interest in PTL and a related gain on the remeasurement of the retained
investment to fair value totaling $296 million in the first quarter of 2009. See Note 16. (c) Included a gain of $343 million on the remeasurement to fair value of our equity method investment in BAC, following our acquisition of a
controlling interest in the second quarter of 2009. See Note 7.
(28)
Source: GENERAL ELECTRIC CO, 10-Q, November 02, 2009

13. EARNINGS PER SHARE INFORMATION GE’s authorized common stock consists of 13,200,000,000 shares having a par value of $0.06 each. Information related to thecalculation of earnings per share follows. Three months ended September 30 2009(a) 2008 (In millions; per-share amounts in dollars) Diluted Basic Diluted Basic Amounts attributable to the Company: Consolidated Earnings from continuing operations for per-share calculation $ 2,438 $ 2,438 $ 4,478 $ 4,477 Preferred stock dividends declared (75) (75) – – Earnings from continuing operations attributableto
common shareowners for per-share calculation $ 2,363 $ 2,363 $ 4,478 $ 4,477 Earnings (loss) from discontinued operations for per-share calculation 40 40 (165) (165)Net earnings attributable to GE common shareowners for per-share calculation 2,403 2,402 4,313 4,312 Average equivalent shares Shares of GE common stock outstanding 10,638 10,638 9,953 9,953 Employee compensation-related shares, including stock options – – 17 – Total average equivalent shares 10,638 10,638 9,970 9,953 Per-share amounts Earnings from continuing operations $ 0.22 $ 0.22 $ 0.45 $ 0.45 Earnings (loss) from discontinued operations – – (0.02) (0.02)Net earnings 0.23 0.23 0.43 0.43
(29)
Source: GENERAL ELECTRIC CO, 10-Q, November 02, 2009
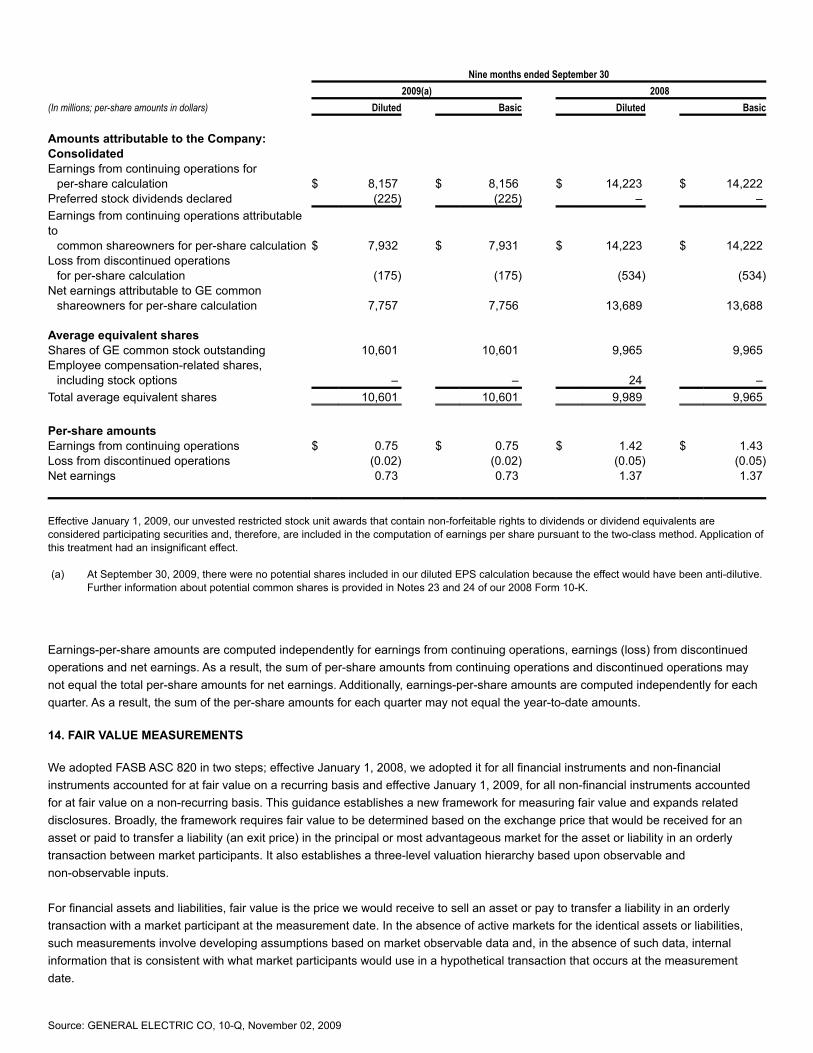
Nine months ended September 30 2009(a) 2008 (In millions; per-share amounts in dollars) Diluted Basic Diluted Basic Amounts attributable to the Company: Consolidated Earnings from continuing operations for per-share calculation $ 8,157 $ 8,156 $ 14,223 $ 14,222 Preferred stock dividends declared (225) (225) – – Earnings from continuing operations attributableto
common shareowners for per-share calculation $ 7,932 $ 7,931 $ 14,223 $ 14,222 Loss from discontinued operations for per-share calculation (175) (175) (534) (534)Net earnings attributable to GE common shareowners for per-share calculation 7,757 7,756 13,689 13,688 Average equivalent shares Shares of GE common stock outstanding 10,601 10,601 9,965 9,965 Employee compensation-related shares, including stock options – – 24 – Total average equivalent shares 10,601 10,601 9,989 9,965 Per-share amounts Earnings from continuing operations $ 0.75 $ 0.75 $ 1.42 $ 1.43 Loss from discontinued operations (0.02) (0.02) (0.05) (0.05)Net earnings 0.73 0.73 1.37 1.37
Effective January 1, 2009, our unvested restricted stock unit awards that contain non-forfeitable rights to dividends or dividend equivalents areconsidered participating securities and, therefore, are included in the computation of earnings per share pursuant to the two-class method. Application ofthis treatment had an insignificant effect. (a) At September 30, 2009, there were no potential shares included in our diluted EPS calculation because the effect would have been anti-dilutive.
Further information about potential common shares is provided in Notes 23 and 24 of our 2008 Form 10-K.
Earnings-per-share amounts are computed independently for earnings from continuing operations, earnings (loss) from discontinuedoperations and net earnings. As a result, the sum of per-share amounts from continuing operations and discontinued operations maynot equal the total per-share amounts for net earnings. Additionally, earnings-per-share amounts are computed independently for eachquarter. As a result, the sum of the per-share amounts for each quarter may not equal the year-to-date amounts. 14. FAIR VALUE MEASUREMENTS We adopted FASB ASC 820 in two steps; effective January 1, 2008, we adopted it for all financial instruments and non-financialinstruments accounted for at fair value on a recurring basis and effective January 1, 2009, for all non-financial instruments accountedfor at fair value on a non-recurring basis. This guidance establishes a new framework for measuring fair value and expands relateddisclosures. Broadly, the framework requires fair value to be determined based on the exchange price that would be received for anasset or paid to transfer a liability (an exit price) in the principal or most advantageous market for the asset or liability in an orderlytransaction between market participants. It also establishes a three-level valuation hierarchy based upon observable andnon-observable inputs. For financial assets and liabilities, fair value is the price we would receive to sell an asset or pay to transfer a liability in an orderlytransaction with a market participant at the measurement date. In the absence of active markets for the identical assets or liabilities,such measurements involve developing assumptions based on market observable data and, in the absence of such data, internalinformation that is consistent with what market participants would use in a hypothetical transaction that occurs at the measurementdate.
Source: GENERAL ELECTRIC CO, 10-Q, November 02, 2009

(30)
Source: GENERAL ELECTRIC CO, 10-Q, November 02, 2009

Observable inputs reflect market data obtained from independent sources, while unobservable inputs reflect our market assumptions.Preference is given to observable inputs. These two types of inputs create the following fair value hierarchy: Level 1 – Quoted prices for identical instruments in active markets. Level 2 – Quoted prices for similar instruments in active markets; quoted prices for identical or similar instruments in markets
that are not active; and model-derived valuations whose inputs are observable or whose significant value drivers areobservable.
Level 3 – Significant inputs to the valuation model are unobservable. We maintain policies and procedures to value instruments using the best and most relevant data available. In addition, we have riskmanagement teams that review valuation, including independent price validation for certain instruments. Further, in other instances, weretain independent pricing vendors to assist in valuing certain instruments. The following section describes the valuation methodologies we use to measure different financial instruments at fair value on arecurring basis. There has been no change to the valuation methodologies during 2009. Investments in Debt and Equity Securities When available, we use quoted market prices to determine the fair value of investment securities, and they are included in Level 1.Level 1 securities primarily include publicly-traded equity securities. When quoted market prices are unobservable, we obtain pricing information from an independent pricing vendor. The pricing vendoruses various pricing models for each asset class that are consistent with what other market participants would use. The inputs andassumptions to the model of the pricing vendor are derived from market observable sources including: benchmark yields, reportedtrades, broker/dealer quotes, issuer spreads, benchmark securities, bids, offers, and other market-related data. Since many fixedincome securities do not trade on a daily basis, the methodology of the pricing vendor uses available information as applicable such asbenchmark curves, benchmarking of like securities, sector groupings, and matrix pricing. The pricing vendor considers all availablemarket observable inputs in determining the evaluation for a security. Thus, certain securities may not be priced using quoted prices,but rather determined from market observable information. These investments are included in Level 2 and primarily comprise ourportfolio of corporate fixed income, and government, mortgage and asset-backed securities. In infrequent circumstances, our pricingvendors may provide us with valuations that are based on significant unobservable inputs, and in those circumstances we classify theinvestment securities in Level 3. Annually, we conduct reviews of our primary pricing vendor, with the assistance of an accounting firm, to validate that the inputs used inthat vendor’s pricing process are deemed to be market observable as defined in the standard. While we were not provided access toproprietary models of the vendor, our reviews have included on-site walk-throughs of the pricing process, methodologies and controlprocedures for each asset class and level for which prices are provided. Our review also included an examination of the underlyinginputs and assumptions for a sample of individual securities across asset classes, credit rating levels and various durations, a processwe continue to perform for each reporting period. In addition, the pricing vendor has an established challenge process in place for allsecurity valuations, which facilitates identification and resolution of potentially erroneous prices. We believe that the prices receivedfrom our pricing vendor are representative of prices that would be received to sell the assets at the measurement date (exit prices) andare classified appropriately in the hierarchy.
(31)
Source: GENERAL ELECTRIC CO, 10-Q, November 02, 2009

We use non-binding broker quotes as our primary basis for valuation when there is limited, or no, relevant market activity for a specificinstrument or for other instruments that share similar characteristics. We have not adjusted the prices we have obtained. Investmentsecurities priced using non-binding broker quotes are included in Level 3. As is the case with our primary pricing vendor, third-partybrokers do not provide access to their proprietary valuation models, inputs and assumptions. Accordingly, our risk managementpersonnel conduct internal reviews of pricing for all such investment securities quarterly to ensure reasonableness of valuations used inour financial statements. These reviews are designed to identify prices that appear stale, those that have changed significantly fromprior valuations, and other anomalies that may indicate that a price may not be accurate. Based on the information available, we believethat the fair values provided by the brokers are representative of prices that would be received to sell the assets at the measurementdate (exit prices). Level 3 investment securities valued using non-binding broker quotes totaled $1,059 million and $2,074 million atSeptember 30, 2009 and December 31, 2008, respectively, and were classified as available-for-sale securities. Retained interests in securitizations are valued using a discounted cash flow model that considers the underlying structure of thesecuritization and estimated net credit exposure, prepayment assumptions, discount rates and expected life. Private equity investments held in investment company affiliates are initially valued at cost. Valuations are reviewed at the end of eachquarter utilizing available market data to determine whether or not any fair value adjustments are necessary. Such market data includeany comparable public company trading multiples. Unobservable inputs include company-specific fundamentals and other third-partytransactions in that security. These investments are generally included in Level 3. Derivatives We use closing prices for derivatives included in Level 1, which are traded either on exchanges or liquid over-the-counter markets. The majority of our derivatives portfolio is valued using internal models. The models maximize the use of market observable inputsincluding interest rate curves and both forward and spot prices for currencies and commodities. Derivative assets and liabilities includedin Level 2 primarily represent interest rate swaps, cross-currency swaps and foreign currency and commodity forward and optioncontracts. Derivative assets and liabilities included in Level 3 primarily represent interest rate products that contain embedded optionality orprepayment features. The following tables present our assets and liabilities measured at fair value on a recurring basis. Included in the tables are investmentsecurities of $25,995 million and $21,967 million at September 30, 2009 and December 31, 2008, respectively, primarily supportingobligations to annuitants and policyholders in our run-off insurance operations, and $7,204 million and $8,190 million at September 30,2009 and December 31, 2008, respectively, supporting obligations to holders of guaranteed investment contracts. Such securities aremainly investment grade.
(32)
Source: GENERAL ELECTRIC CO, 10-Q, November 02, 2009

Netting (In millions) Level 1 Level 2 Level 3 adjustment(a) Net balance September 30, 2009 Assets Investment securities Debt U.S. corporate $ 75 $ 20,192 $ 3,145 $ – $ 23,412 State and municipal 185 1,702 247 – 2,134 Residential mortgage-backed – 3,380 57 – 3,437 Commercial mortgage-backed – 2,484 59 – 2,543 Asset-backed – 830 1,902 – 2,732 Corporate – non-U.S. 238 725 750 – 1,713 Government – non-U.S. 1,156 2,048 166 – 3,370 U.S. government and federal – agency 8 3,259 291 – 3,558 Retained interests – – 8,418 – 8,418 Equity – Available-for-sale 603 161 21 – 785 Trading 659 – – – 659 Derivatives(b) – 12,124 856 (4,758) 8,222 Other(c) 2 – 971 – 973 Total $ 2,926 $ 46,905 $ 16,883 $ (4,758) $ 61,956
Liabilities Derivatives $ – $ 8,891 $ 283 $ (4,784) $ 4,390 Other(d) – 804 – – 804 Total $ – $ 9,695 $ 283 $ (4,784) $ 5,194
December 31, 2008 Assets Investment securities Debt U.S. corporate $ – $ 17,191 $ 3,209 $ – $ 20,400 State and municipal – 1,234 247 – 1,481 Residential mortgage-backed 30 4,141 173 – 4,344 Commercial mortgage-backed – 2,070 66 – 2,136 Asset-backed – 880 1,605 – 2,485 Corporate – non-U.S. 69 562 658 – 1,289 Government – non-U.S. 496 422 424 – 1,342 U.S. government and federal agency 5 515 184 – 704 Retained interests – – 6,356 – 6,356 Equity Available-for-sale 475 12 34 – 521 Trading 83 305 – – 388 Derivatives(b) – 18,911 1,142 (7,411) 12,642 Other(c) 1 288 1,105 – 1,394 Total $ 1,159 $ 46,531 $ 15,203 $ (7,411) $ 55,482
Liabilities Derivatives $ 2 $ 12,643 $ 166 $ (7,575) $ 5,236 Other(d) – 1,031 – – 1,031 Total $ 2 $ 13,674 $ 166 $ (7,575) $ 6,267
(a) The netting of derivative receivables and payables is permitted when a legally enforceable master netting agreement exists. Included fair valueadjustments related to our own and counterparty credit risk.
(b) The fair value of derivatives included an adjustment for non-performance risk. At September 30, 2009 and December 31, 2008, the cumulative
adjustment was a gain of $26 million and $177 million, respectively. (c) Included private equity investments and loans designated under the fair value option.
Source: GENERAL ELECTRIC CO, 10-Q, November 02, 2009

(d) Primarily represented the liability associated with certain of our deferred incentive compensation plans.
(33)
Source: GENERAL ELECTRIC CO, 10-Q, November 02, 2009

The following tables present the changes in Level 3 instruments measured on a recurring basis for the three months ended September30, 2009 and 2008, and the nine months ended September 30, 2009 and 2008. The majority of our Level 3 balances consist ofinvestment securities classified as available-for-sale with changes in fair value recorded in shareowners’ equity. Changes in Level 3 Instruments for the Three Months Ended September 30, 2009 (In millions) Net realized/ Net change unrealized in unrealized gains (losses) gains (losses) Net realized/ included in relating to unrealized accumulated Purchases, Transfers instruments gains(losses) other issuances in and/or still held at July 1, included in comprehensive and out of September 30, September 30, 2009 earnings(a) income settlements Level 3(b) 2009 2009 (c) Investment securities Debt U.S. corporate $ 2,925 $ (33) $ 258 $ (46) $ 41 $ 3,145 $ 1 State and municipal 157 – 6 73 11 247 – Residential mortgage-backed 62 (1) 5 – (9) 57 – Commercial mortgage-backed 50 – 4 – 5 59 – Asset-backed 1,814 (10) 17 (30) 111 1,902 – Corporate –non-U.S.
639 15 72 (4) 28 750 –
Government – non-U.S. 143 – 10 14 (1) 166 – U.S. governmentand
federal agency 266 22 4 (1) – 291 – Retained interests 7,525 275 74 544 – 8,418 75 Equity Available-for-sale 18 – 2 – 1 21 1 Trading – – – – – – – Derivatives(d)(e) 789 47 27 (68) (184) 611 62 Other 1,031 (90) 21 9 – 971 (90) Total $ 15,419 $ 225 $ 500 $ 491 $ 3 $ 16,638 $ 49
(a) Earnings effects are primarily included in the “GECS revenues from services” and “Interest and other financial charges” captions in theCondensed Statement of Earnings.
(b) Transfers in and out of Level 3 are considered to occur at the beginning of the period. Transfers out of Level 3 were a result of increased use
of quotes from independent pricing vendors based on recent trading activity. (c) Represented the amount of unrealized gains or losses for the period included in earnings. (d) Earnings from derivatives were more than offset by $83 million in losses from related derivatives included in Level 2. (e) Represented derivative assets net of derivative liabilities and included cash accruals of $38 million not reflected in the fair value hierarchy
table.
(34)
Source: GENERAL ELECTRIC CO, 10-Q, November 02, 2009

Changes in Level 3 Instruments for the Three Months Ended September 30, 2008 (In millions) Net realized/ Net change unrealized in unrealized gains (losses) gains (losses) Net realized/ included in relating to unrealized accumulated Purchases, Transfers instruments gains(losses) other issuances in and/or still held at July 1, included in comprehensive and out of September 30, September 30, 2008 earnings(a) income settlements Level 3(b) 2008 2008 (c) Investmentsecurities
$ 13,830 $ 278 $ (321) $ (484) $ (291) $ 13,012 $ 128
Derivatives(d)(e) 491 414 18 (61) 9 871 359 Other 1,349 (84) (39) (5) (1) 1,220 (88) Total $ 15,670 $ 608 $ (342) $ (550) $ (283) $ 15,103 $ 399
(a) Earnings effects are primarily included in the “GECS revenues from services” and “Interest and other financial charges” captions in theCondensed Statement of Earnings.
(b) Transfers in and out of Level 3 are considered to occur at the beginning of the period. (c) Represented the amount of unrealized gains or losses for the period included in earnings. (d) Earnings from derivatives were more than offset by $190 million in losses from related derivatives included in Level 2 and $253 million in
losses from qualifying fair value hedges. (e) Represented derivative assets net of derivative liabilities and included cash accruals of $23 million not reflected in the fair value hierarchy
table.
(35)
Source: GENERAL ELECTRIC CO, 10-Q, November 02, 2009

Changes in Level 3 Instruments for the Nine Months Ended September 30, 2009 (In millions) Net realized/ Net change unrealized in unrealized gains (losses) gains (losses) Net realized/ included in relating to unrealized accumulated Purchases, Transfers instruments gains(losses) other issuances in and/or still held at January 1, included in comprehensive and out of September 30, September 30, 2009 earnings(a) income settlements Level 3(b) 2009 2009 (c) Investment securities Debt U.S. corporate $ 3,220 $ (151) $ 320 $ (106) $ (138) $ 3,145 $ 4 State and municipal 247 – (101) 65 36 247 – Residential mortgage-backed 173 (1) (10) (20) (85) 57 – Commercial mortgage-backed 66 – (4) – (3) 59 – Asset-backed 1,605 (1) 244 84 (30) 1,902 – Corporate –non-U.S.
659 2 87 31 (29) 750 –
Government – non-U.S. 424 – 6 17 (281) 166 – U.S. governmentand
federal agency 183 22 88 (2) – 291 – Retained interests 6,356 924 244 894 – 8,418 166 Equity Available-for-sale 23 (1) 5 (2) (4) 21 2 Trading – – – – – – – Derivatives(d)(e) 1,003 56 (38) (241) (169) 611 (117) Other 1,105 (227) 32 54 7 971 (298) Total $ 15,064 $ 623 $ 873 $ 774 $ (696) $ 16,638 $ (243)
(a) Earnings effects are primarily included in the “GECS revenues from services” and “Interest and other financial charges” captions in theCondensed Statement of Earnings.
(b) Transfers in and out of Level 3 are considered to occur at the beginning of the period. Transfers out of Level 3 were a result of increased use
of quotes from independent pricing vendors based on recent trading activity. (c) Represented the amount of unrealized gains or losses for the period included in earnings. (d) Earnings from derivatives were partially offset by $40 million in losses from related derivatives included in Level 2 . (e) Represented derivative assets net of derivative liabilities and included cash accruals of $38 million not reflected in the fair value hierarchy
table.
(36)
Source: GENERAL ELECTRIC CO, 10-Q, November 02, 2009

Changes in Level 3 Instruments for the Nine Months Ended September 30, 2008 (In millions) Net realized/ Net change unrealized in unrealized gains (losses) gains (losses) Net realized/ included in relating to unrealized accumulated Purchases, Transfers instruments gains(losses) other issuances in and/or still held at January 1, included in comprehensive and out of September 30, September 30, 2008 earnings(a) income settlements Level 3(b) 2008 2008 (c) Investmentsecurities
$ 12,447 $ 619 $ (503) $ 60 $ 389 $ 13,012 $ 101
Derivatives(d)(e) 265 719 40 (162) 9 871 554 Other 1,330 (110) (9) (41) 50 1,220 (54) Total $ 14,042 $ 1,228 $ (472) $ (143) $ 448 $ 15,103 $ 601
(a) Earnings effects are primarily included in the “GECS revenues from services” and “Interest and other financial charges” captions in theCondensed Statement of Earnings.
(b) Transfers in and out of Level 3 are considered to occur at the beginning of the period. (c) Represented the amount of unrealized gains or losses for the period included in earnings. (d) Earnings from derivatives were partially offset by $275 million in losses from related derivatives included in Level 2 and $309 million in losses
from qualifying fair value hedges. (e) Represented derivative assets net of derivative liabilities and included cash accruals of $23 million not reflected in the fair value hierarchy
table.
Non-Recurring Fair Value Measurements Certain assets are measured at fair value on a non-recurring basis. These assets are not measured at fair value on an ongoing basisbut are subject to fair value adjustments only in certain circumstances. These include certain loans that are written down to fair valuewhen they are held for sale or when they are written down to the fair value of their underlying collateral when deemed impaired, costand equity method investments that are written down to fair value when their declines are determined to be other-than-temporary,long-lived assets that are written down to fair value when they are held for sale or determined to be impaired and the remeasurement ofretained investments in formerly consolidated subsidiaries. Non-recurring fair value amounts (as measured at the time of the adjustment) for assets still held at September 30, 2009 and December31, 2008, totaled $744 million and $48 million, identified as Level 2, and $16,233 million and $3,145 million, identified as Level 3,respectively. Level 3 amounts at September 30, 2009 primarily included our retained investment in PTL ($5,991 million), financingreceivables and loans held for sale ($5,404 million), long-lived assets ($3,215 million), primarily real estate held for investment andequipment leased to others, and cost and equity method investments ($1,313 million). The following table represents the fair value adjustments to assets measured at fair value on a non-recurring basis and still held atSeptember 30, 2009 and September 30, 2008. Three months ended September 30 Nine months ended September 30(In millions) 2009 2008 2009 2008 Financing receivables and loans held for sale $ (658) $ (121) $ (1,339) $ (383)Cost and equity method investments (354) (199) (822) (275)Long-lived assets(a) (417) (135) (692) (210)Retained investments in formerly consolidated subsidiaries(a) – – 237 – Total $ (1,429) $ (455) $ (2,616) $ (868)
Source: GENERAL ELECTRIC CO, 10-Q, November 02, 2009

(a) FASB ASC 820 was adopted for non-financial assets valued on a non-recurring basis as of January 1, 2009.
(37)
Source: GENERAL ELECTRIC CO, 10-Q, November 02, 2009

The following describes the valuation methodologies we use to measure non-financial instruments accounted for at fair value on anon-recurring basis. There has been no change to the valuation methodologies during 2009. Loans When available, we use observable market data, including pricing on recent closed market transactions, to value loans which areincluded in Level 2. When this data is unobservable, we use valuation methodologies using current market interest rate data adjustedfor inherent credit risk, and such loans are included in Level 3. When appropriate, loans are valued using collateral values as a practicalexpedient. Long-lived Assets Long-lived assets, including aircraft and real estate, may be measured at fair value if such assets are held for sale or when there is adetermination that the asset is impaired. The determination of fair value is based on the best information available, including internalcash flow estimates discounted at an appropriate interest rate, quoted market prices when available, market prices for similar assetsand independent appraisals, as appropriate. For real estate, cash flow estimates are based on current market estimates that reflectcurrent and projected lease profiles and available industry information about expected trends in rental, occupancy and capitalizationrates. Investments in Subsidiaries and Formerly Consolidated Subsidiaries Upon a change in control that results in deconsolidation of a subsidiary, a fair value measurement may be required if we sell acontrolling interest and retain a noncontrolling stake in the entity. Such investments are valued using a discounted cash flow model,comparative market multiples or a combination of both approaches as appropriate. In applying these methodologies, we rely on anumber of factors, including actual operating results, future business plans, economic projections and market data. 15. FINANCIAL INSTRUMENTS The following table provides information about the assets and liabilities not carried at fair value in our Statement of Financial Position.Consistent with FASB ASC 825, the table excludes financing leases and non-financial assets and liabilities. Apart from certain of ourborrowings and certain marketable securities, few of the instruments identified below are actively traded and their fair values must oftenbe determined using financial models. Realization of the fair value of these instruments depends upon market forces beyond ourcontrol, including marketplace liquidity. For a description on how we estimate fair value, see Note 29 to the consolidated financialstatements in our 2008 Form 10-K.
(38)
Source: GENERAL ELECTRIC CO, 10-Q, November 02, 2009
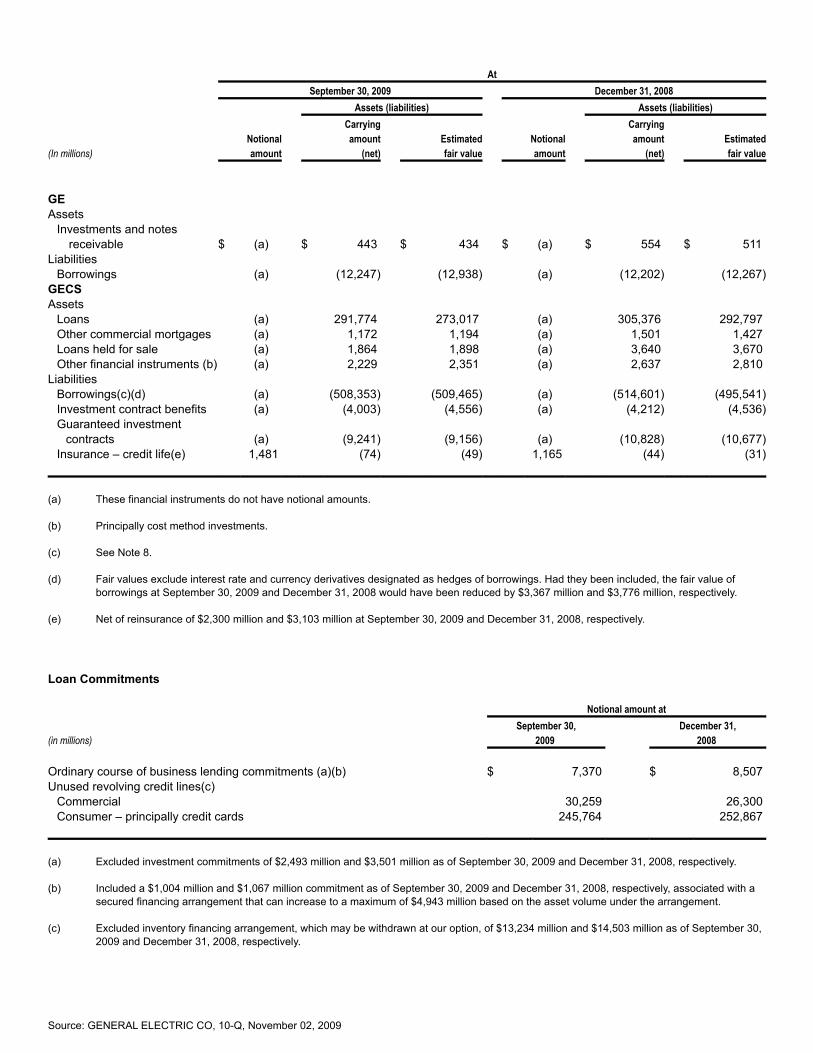
At September 30, 2009 December 31, 2008 Assets (liabilities) Assets (liabilities) Carrying Carrying Notional amount Estimated Notional amount Estimated(In millions) amount (net) fair value amount (net) fair value GE Assets Investments and notes receivable $ (a) $ 443 $ 434 $ (a) $ 554 $ 511 Liabilities Borrowings (a) (12,247) (12,938) (a) (12,202) (12,267)GECS Assets Loans (a) 291,774 273,017 (a) 305,376 292,797 Other commercial mortgages (a) 1,172 1,194 (a) 1,501 1,427 Loans held for sale (a) 1,864 1,898 (a) 3,640 3,670 Other financial instruments (b) (a) 2,229 2,351 (a) 2,637 2,810 Liabilities Borrowings(c)(d) (a) (508,353) (509,465) (a) (514,601) (495,541) Investment contract benefits (a) (4,003) (4,556) (a) (4,212) (4,536) Guaranteed investment contracts (a) (9,241) (9,156) (a) (10,828) (10,677) Insurance – credit life(e) 1,481 (74) (49) 1,165 (44) (31)
(a) These financial instruments do not have notional amounts. (b) Principally cost method investments. (c) See Note 8. (d) Fair values exclude interest rate and currency derivatives designated as hedges of borrowings. Had they been included, the fair value of
borrowings at September 30, 2009 and December 31, 2008 would have been reduced by $3,367 million and $3,776 million, respectively. (e) Net of reinsurance of $2,300 million and $3,103 million at September 30, 2009 and December 31, 2008, respectively.
Loan Commitments Notional amount at September 30, December 31,(in millions) 2009 2008 Ordinary course of business lending commitments (a)(b) $ 7,370 $ 8,507 Unused revolving credit lines(c) Commercial 30,259 26,300 Consumer – principally credit cards 245,764 252,867
(a) Excluded investment commitments of $2,493 million and $3,501 million as of September 30, 2009 and December 31, 2008, respectively. (b) Included a $1,004 million and $1,067 million commitment as of September 30, 2009 and December 31, 2008, respectively, associated with a
secured financing arrangement that can increase to a maximum of $4,943 million based on the asset volume under the arrangement. (c) Excluded inventory financing arrangement, which may be withdrawn at our option, of $13,234 million and $14,503 million as of September 30,
2009 and December 31, 2008, respectively.
Source: GENERAL ELECTRIC CO, 10-Q, November 02, 2009

(39)
Source: GENERAL ELECTRIC CO, 10-Q, November 02, 2009

Derivatives and Hedging On January 1, 2009, in accordance with FASB ASC 815, we began disclosing additional qualitative and quantitative information aboutour derivative and hedging activities. The following disclosures should be read in the context of our existing disclosure in Note 29 to theconsolidated financial statements in our 2008 Form 10-K. As a matter of policy, we use derivatives for risk management purposes. We do not use derivatives for speculative purposes. A key riskmanagement objective for our financial services businesses is to mitigate interest rate and currency risk by seeking to ensure that thecharacteristics of the debt match the assets they are funding. If the form (fixed versus floating) and currency denomination of the debtwe issue do not match the related assets, we typically execute derivatives to adjust the nature and tenor of debt funding to meet thisobjective. The determination of whether a derivative is used to achieve this objective depends on a number of factors, includingcustomer needs for specific types of financing, and market factors affecting the type of debt we can issue. Of the outstanding notional amount of $353,000 million, approximately 87%, or $305,000 million, is associated with reducing oreliminating the interest rate, currency or market risk between financial assets and liabilities in our financial services businesses. Theremaining derivatives activity primarily relates to hedging against adverse changes in currency exchange rates and commodity pricesrelated to anticipated sales and purchases. These activities are designated as hedges when practicable. When it is not possible toapply hedge accounting, or when the derivative and the hedged item are both recorded in earnings currently, the derivatives areaccounted for as economic hedges and hedge accounting is not applied. This most frequently occurs when we hedge a recognizedforeign currency transaction (e.g., a receivable or payable) with a derivative. Since the effects of changes in exchange rates arereflected currently in earnings for both the derivative and the underlying, the economic hedge does not require hedge accounting. The following table provides information about the fair value of our derivatives, by contract type, separating those accounted for ashedges and those that are not. At September 30, 2009 Fair value(In millions) Assets Liabilities Derivatives accounted for as hedges Interest rate contracts $ 5,535 $ 3,690 Currency exchange contracts 4,170 3,489 Other contracts 31 10 9,736 7,189 Derivatives not accounted for as hedges Interest rate contracts 1,125 1,022 Currency exchange contracts 1,693 856 Other contracts 426 107 3,244 1,985 Netting adjustment(a) (4,758) (4,784) Total $ 8,222 $ 4,390
Derivatives are classified in the captions “All other assets” and “All other liabilities” in our financial statements. (a) The netting of derivative receivables and payables is permitted when a legally enforceable master netting agreement exists. Amounts
included fair value adjustments related to our own and counterparty credit risk. At September 30, 2009 and December 31, 2008, thecumulative adjustment for non-performance risk was a gain of $26 million and $177 million, respectively.
(40)
Source: GENERAL ELECTRIC CO, 10-Q, November 02, 2009
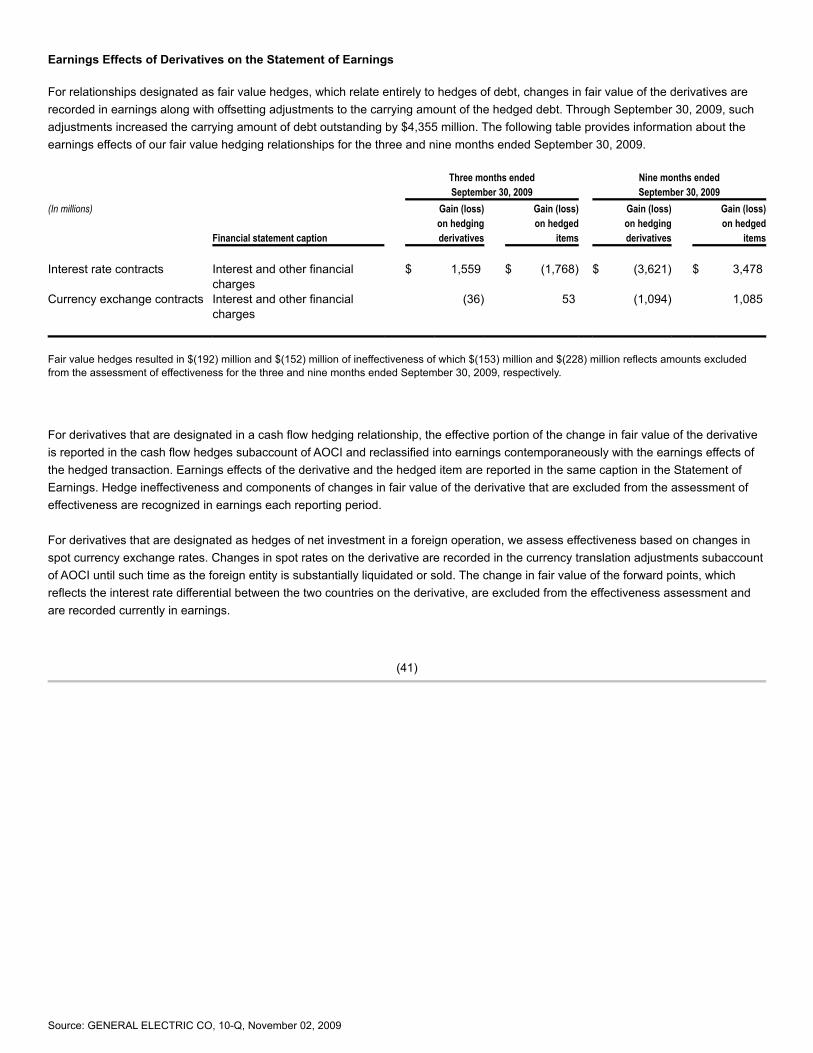
Earnings Effects of Derivatives on the Statement of Earnings For relationships designated as fair value hedges, which relate entirely to hedges of debt, changes in fair value of the derivatives arerecorded in earnings along with offsetting adjustments to the carrying amount of the hedged debt. Through September 30, 2009, suchadjustments increased the carrying amount of debt outstanding by $4,355 million. The following table provides information about theearnings effects of our fair value hedging relationships for the three and nine months ended September 30, 2009. Three months ended Nine months ended September 30, 2009 September 30, 2009(In millions) Gain (loss) Gain (loss) Gain (loss) Gain (loss) on hedging on hedged on hedging on hedged Financial statement caption derivatives items derivatives items Interest rate contracts Interest and other financial
charges $ 1,559 $ (1,768) $ (3,621) $ 3,478
Currency exchange contracts Interest and other financialcharges
(36) 53 (1,094) 1,085
Fair value hedges resulted in $(192) million and $(152) million of ineffectiveness of which $(153) million and $(228) million reflects amounts excludedfrom the assessment of effectiveness for the three and nine months ended September 30, 2009, respectively.
For derivatives that are designated in a cash flow hedging relationship, the effective portion of the change in fair value of the derivativeis reported in the cash flow hedges subaccount of AOCI and reclassified into earnings contemporaneously with the earnings effects ofthe hedged transaction. Earnings effects of the derivative and the hedged item are reported in the same caption in the Statement ofEarnings. Hedge ineffectiveness and components of changes in fair value of the derivative that are excluded from the assessment ofeffectiveness are recognized in earnings each reporting period. For derivatives that are designated as hedges of net investment in a foreign operation, we assess effectiveness based on changes inspot currency exchange rates. Changes in spot rates on the derivative are recorded in the currency translation adjustments subaccountof AOCI until such time as the foreign entity is substantially liquidated or sold. The change in fair value of the forward points, whichreflects the interest rate differential between the two countries on the derivative, are excluded from the effectiveness assessment andare recorded currently in earnings.
(41)
Source: GENERAL ELECTRIC CO, 10-Q, November 02, 2009

The following tables provide additional information about the financial statement effects related to our cash flow hedges and netinvestment hedges for the three and nine months ended September 30, 2009.
Financial statement caption
Gain (loss) reclassified Gain (loss) from AOCI recognized intoThree months ended September30, 2009
in OCI earnings
(In millions) Cash flow hedges Interest rate contracts $ 27 Interest and other financial
charges $ (495)
GECS revenues fromservices
7
Currency exchange contracts 275 Interest and other financial
charges
228
Other costs and expenses (73) GECS revenues from
services (36)
Sales of goods and services 53 Other income (2) Commodity contracts (34) GECS revenues from
services (24)
Other costs and expenses –
Total $ 268 $ (342)
Gain (loss)
Gain (loss) recognized reclassified in CTA from CTA
Net investment hedges Currency exchange contracts $ (1,702) GECS revenues from
services $ (2)
(42)
Source: GENERAL ELECTRIC CO, 10-Q, November 02, 2009

Financial statement caption
Gain (loss) reclassified Gain (loss) from AOCI recognized intoNine months ended September 30,2009
in OCI earnings
(In millions) Cash flow hedges Interest rate contracts $ 703 Interest and other financial
charges $ (1,539)
GECS revenues fromservices
7
Currency exchange contracts 2,603 Interest and other financial
charges
1,221
Other costs and expenses (181) GECS revenues from
services (98)
Sales of goods and services 115 Other income (2) Commodity contracts – GECS revenues from
services –
Other costs and expenses (3)
Total $ 3,306 $ (480)
Gain (loss)
Gain (loss) recognized reclassified in CTA from CTA
Net investment hedges Currency exchange contracts $ (4,976) GECS revenues from
services $ (32)
Of the total pre-tax amount recorded in AOCI, $3,126 million related to cash flow hedges of forecasted transactions of which we expect to transfer$1,440 million to earnings as an expense in the next 12 months contemporaneously with the earnings effects of the related forecasted transactions. Inthe first nine months of 2009, we recognized insignificant gains and losses related to hedged forecasted transactions and firm commitments that did notoccur by the end of the originally specified period. At September 30, 2009, the maximum term of derivative instruments that hedge forecastedtransactions was 26 years and related to hedges of anticipated interest payments associated with external debt.
For cash flow hedges, the amount of ineffectiveness in the hedging relationship and amount of the changes in fair value of thederivative that are not included in the measurement of ineffectiveness are both reflected in earnings each reporting period. Theseamounts totaled $9 million and $11 million for the three and nine months ended September 30, 2009, respectively, and primarily appearin GECS revenues from services. Ineffectiveness from net investment hedges was $(99) million and $(656) million for the three andnine months ended September 30, 2009, respectively, which primarily related to changes in value of the forward points that under ourhedge accounting designations are excluded from the assessment of effectiveness and recorded directly into earnings. These amountsappear in the “Interest and other financial charges” caption in the Statement of Earnings. Changes in the fair value of derivatives that are not designated as hedges are recorded in earnings each period. As discussed above,these derivatives are entered into as economic hedges of changes in interest rates, currency exchange rates, commodity prices andother market risks. Gains or losses related to the derivative are recorded in predefined captions in the Statement of Earnings, typically“GECS revenues from services” or “Other income,” based on our accounting policy. In general, the earnings effects of the item thatrepresents the economic risk exposure is recorded in the same caption as the derivative. Gains for the first nine months of 2009 onderivatives not designated as hedges, without considering the offsetting earnings effects from the item representing the economic riskexposure, were $562 million, related to interest rate contracts of $140 million, currency exchange contracts of $171 million and equity,credit and commodity derivatives of $251 million.
Source: GENERAL ELECTRIC CO, 10-Q, November 02, 2009

(43)
Source: GENERAL ELECTRIC CO, 10-Q, November 02, 2009

Counterparty Credit Risk To lower our exposure to credit risk, our standard master agreements typically contain mutual downgrade provisions that provide theability of each party to require assignment or termination if the long-term credit rating of the counterparty were to fall below A-/A3. Incertain of these master agreements, each party also has the ability to require assignment or termination if the short-term rating of thecounterparty were to fall below A-1/P-1. The net derivative liability subject to these provisions was approximately $2,687 million atSeptember 30, 2009. In addition to these provisions, in certain of these master agreements, we also have collateral arrangements thatprovide us with the right to hold collateral (cash or U.S. Treasuries or other highly-rated securities) when the current market value ofderivative contracts exceeds a specified limit. We also have a limited number of such collateral agreements under which we must postcollateral. Under these agreements and in the normal course of business, the fair value of collateral posted by counterparties atSeptember 30, 2009, was approximately $7,978 million, of which $2,500 million was held in cash and $5,478 million representedpledged securities. The fair value of collateral posted by us was approximately $1,836 million, of which $1,771 million was cash and$65 million represented securities repledged. More information regarding our counterparty credit risk and master agreements can be found in Note 29 to the consolidated financialstatements in our 2008 Form 10-K. Guarantees of Derivatives We do not sell credit default swaps; however, as part of our risk management services, we provide certain performance guarantees tothird-party financial institutions related to plain vanilla interest rate swaps on behalf of some customers related to variable rate loans wehave extended to them. The fair value of such guarantees was $28 million at September 30, 2009. The aggregate fair value ofcustomer derivative contracts in a liability position at September 30, 2009, was $314 million before consideration of any offsetting effectof collateral. At September 30, 2009, collateral value was sufficient to cover the loan amount and the fair value of the customer’sderivative, in the event we had been called upon to perform under the derivative. Given our strict underwriting criteria, we believe thelikelihood that we will be required to perform under these guarantees is remote. 16. OFF-BALANCE SHEET ARRANGEMENTS We securitize financial assets and arrange other forms of asset-backed financing in the ordinary course of business to improveshareowner returns. The securitization transactions we engage in are similar to those used by many financial institutions. Beyondimproving returns, these securitization transactions serve as funding sources for a variety of diversified lending and securitiestransactions. Historically, we have used both GE-supported and third-party Variable Interest Entities (VIEs) to execute off-balance sheetsecuritization transactions funded in the commercial paper and term markets. The largest single category of VIEs that we are involvedwith are Qualifying Special Purpose Entities (QSPEs), which meet specific characteristics defined in U.S. GAAP that exclude them fromthe scope of consolidation standards. Investors in these entities only have recourse to the assets owned by the entity and not to ourgeneral credit, unless noted below. We did not provide non-contractual support to any consolidated VIE, unconsolidated VIE or QSPEin the nine months ended September 30, 2009. We do not have implicit support arrangements with any VIE or QSPE. Variable Interest Entities When evaluating whether we are the primary beneficiary of a VIE, and must therefore consolidate the entity, we perform a qualitativeanalysis that considers the design of the VIE, the nature of our involvement and the variable interests held by other parties. If thatevaluation is inconclusive as to which party absorbs a majority of the entity’s expected losses or residual returns, a quantitative analysisis performed to determine who is the primary beneficiary.
(44)
Source: GENERAL ELECTRIC CO, 10-Q, November 02, 2009

Consolidated Variable Interest Entities For additional information about our consolidated VIEs, see Note 30 to the consolidated financial statements in our 2008 Form 10-K.Consolidated VIEs at September 30, 2009 and December 31, 2008 follow: At September 30, 2009 December 31, 2008(In millions) Assets Liabilities Assets Liabilities Consolidated, liquidating securitization entities(a) $ 2,790 $ 2,969 $ 4,000 $ 3,868 Trinity(b) 7,657 9,447 9,192 11,623 Penske Truck Leasing Co., L.P. (PTL)(c) – – 7,444 1,339 Other(d) 5,471 3,062 6,062 4,432 $ 15,918 $ 15,478 $ 26,698 $ 21,262
(a) If the short-term credit rating of GE Capital or these entities were reduced below A–1/P–1, we could be required to provide substitute liquidityfor those entities or provide funds to retire the outstanding commercial paper. The maximum net amount that we could be required to providein the event of such a downgrade is determined by contract and totaled $2,900 million at September 30, 2009. The borrowings of theseentities are reflected in our Statement of Financial Position.
(b) If the long-term credit rating of GE Capital were to fall below AA-/Aa3 or its short-term credit rating were to fall below A-1+/P-1, GE Capital
could be required to provide approximately $2,917 million to such entities as of September 30, 2009 pursuant to letters of credit issued by GECapital. To the extent that the entities’ liabilities exceed the ultimate value of the proceeds from the sale of their assets and the amount drawnunder the letters of credit, GE Capital could be required to provide such excess amount. The borrowings of these entities are reflected in ourStatement of Financial Position.
(c) In the first quarter of 2009, we sold a 1% limited partnership interest in PTL, a previously consolidated VIE, to Penske Truck Leasing
Corporation, the general partner of PTL, whose majority shareowner is a member of GE’s Board of Directors. The disposition of the shares,coupled with our resulting minority position on the PTL advisory committee and related changes in our contractual rights, resulted in thedeconsolidation of PTL. We recognized a pre-tax gain on the sale of $296 million, including a gain on the remeasurement of our retainedinvestment of $189 million. The measurement of the fair value of our retained investment in PTL was based on a methodology thatincorporated both discounted cash flow information and market data. In applying this methodology, we utilized different sources of information,including actual operating results, future business plans, economic projections and market observable pricing multiples of similar businesses.The resulting fair value reflected our position as a noncontrolling shareowner at the conclusion of the transaction.
(d) A majority of the remaining assets and liabilities of VIEs that are included in our consolidated financial statements were acquired in
transactions subsequent to January 1, 2004. Assets of these entities consist of amortizing securitizations of financial assets originated byacquirees in Australia and Japan, and real estate partnerships. We have no recourse arrangements with these entities.
Unconsolidated Variable Interest Entities Our involvement with unconsolidated VIEs consists of the following activities: assisting in the formation and financing of an entity,providing recourse and/or liquidity support, servicing the assets and receiving variable fees for services provided. The classification inour financial statements of our variable interests in these entities depends on the nature of the entity. As described below, our retainedinterests in securitization-related VIEs and QSPEs is reported in financing receivables or investment securities depending on its legalform. Variable interests in partnerships and corporate entities would be classified as either equity method or cost method investments. In the ordinary course of business, we make investments in entities in which we are not the primary beneficiary, but may hold a variableinterest such as limited partner equity interests or mezzanine debt investment. These investments are classified in two captions in ourfinancial statements: “All other assets” for investments accounted for under the equity method, and “GECS financing receivables” fordebt financing provided to these entities.
(45)
Source: GENERAL ELECTRIC CO, 10-Q, November 02, 2009
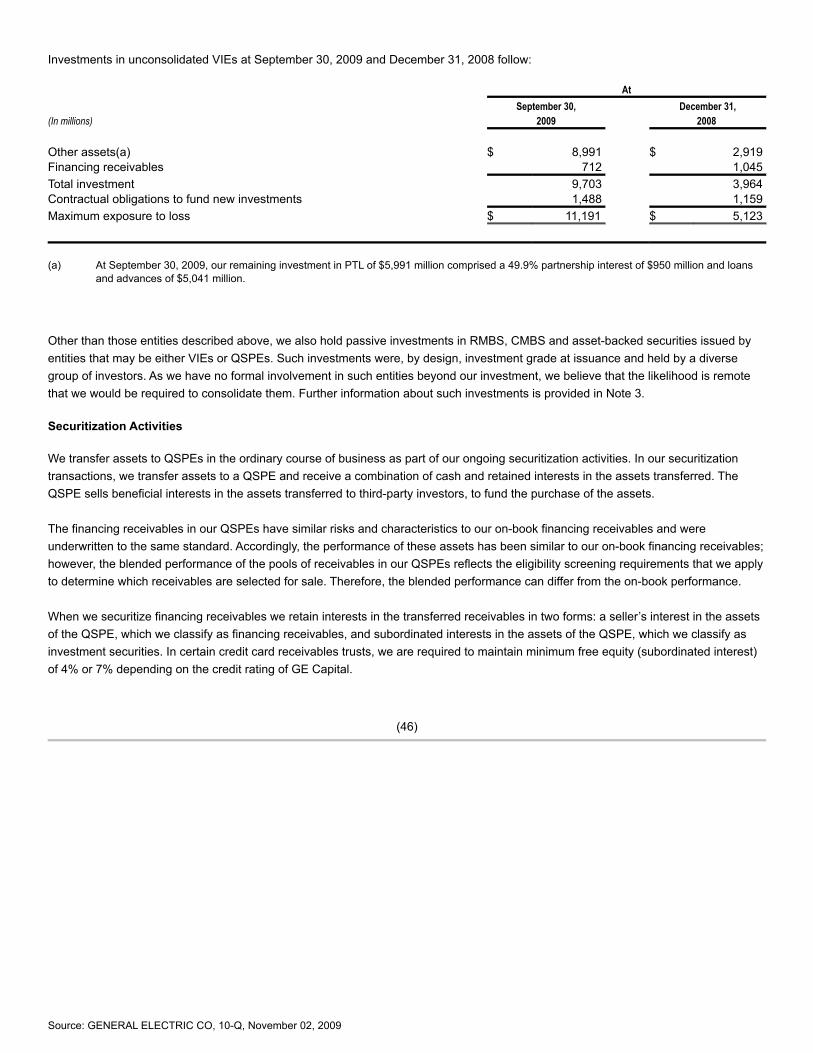
Investments in unconsolidated VIEs at September 30, 2009 and December 31, 2008 follow: At September 30, December 31,(In millions) 2009 2008 Other assets(a) $ 8,991 $ 2,919 Financing receivables 712 1,045 Total investment 9,703 3,964 Contractual obligations to fund new investments 1,488 1,159 Maximum exposure to loss $ 11,191 $ 5,123
(a) At September 30, 2009, our remaining investment in PTL of $5,991 million comprised a 49.9% partnership interest of $950 million and loansand advances of $5,041 million.
Other than those entities described above, we also hold passive investments in RMBS, CMBS and asset-backed securities issued byentities that may be either VIEs or QSPEs. Such investments were, by design, investment grade at issuance and held by a diversegroup of investors. As we have no formal involvement in such entities beyond our investment, we believe that the likelihood is remotethat we would be required to consolidate them. Further information about such investments is provided in Note 3. Securitization Activities We transfer assets to QSPEs in the ordinary course of business as part of our ongoing securitization activities. In our securitizationtransactions, we transfer assets to a QSPE and receive a combination of cash and retained interests in the assets transferred. TheQSPE sells beneficial interests in the assets transferred to third-party investors, to fund the purchase of the assets. The financing receivables in our QSPEs have similar risks and characteristics to our on-book financing receivables and wereunderwritten to the same standard. Accordingly, the performance of these assets has been similar to our on-book financing receivables;however, the blended performance of the pools of receivables in our QSPEs reflects the eligibility screening requirements that we applyto determine which receivables are selected for sale. Therefore, the blended performance can differ from the on-book performance. When we securitize financing receivables we retain interests in the transferred receivables in two forms: a seller’s interest in the assetsof the QSPE, which we classify as financing receivables, and subordinated interests in the assets of the QSPE, which we classify asinvestment securities. In certain credit card receivables trusts, we are required to maintain minimum free equity (subordinated interest)of 4% or 7% depending on the credit rating of GE Capital.
(46)
Source: GENERAL ELECTRIC CO, 10-Q, November 02, 2009

Financing receivables transferred to securitization entities that remained outstanding and our retained interests in those financingreceivables at September 30, 2009 and December 31, 2008 follow. Commercial Credit card Other Total(In millions) Equipment(a)(b)(c) real estate(b) receivables(c) assets(b) assets September 30, 2009 Asset amount outstanding $ 10,702 $ 7,533 $ 24,570 $ 4,005 $ 46,810 Included within the amount above are retained interests of: Financing receivables(d) 168 – 1,770 – 1,938 Investment securities 1,084 253 6,712 329 8,378 December 31, 2008 Asset amount outstanding $ 13,298 $ 7,970 $ 26,046 $ 5,250 $ 52,564 Included within the amount above are retained interests of: Financing receivables(d) 339 – 3,802 – 4,141 Investment securities 747 222 4,806 532 6,307
(a) Included inventory floorplan receivables. (b) In certain transactions entered into prior to December 31, 2004, we provided contractual credit and liquidity support to third parties who
purchased debt in the QSPEs. We have not entered into additional arrangements since that date. At September 30, 2009 andDecember 31, 2008, liquidity support totaled $2,098 million and $2,143 million, respectively. Credit support totaled $2,097 million and$2,164 million at September 30, 2009 and December 31, 2008, respectively.
(c) As permitted by the terms of the applicable trust documents, in the second and third quarters of 2009, we transferred $268 million of floorplan
financing receivables to the GE Dealer Floorplan Master Note Trust and $328 million of credit card receivables to the GE Capital Credit CardMaster Note Trust in exchange for additional subordinated interests. These actions had the effect of maintaining the AAA ratings of certainsecurities issued by these entities.
(d) Uncertificated seller’s interests.
Retained Interests in Securitization Transactions When we transfer financing receivables, we determine the fair value of retained interests received as part of the securitizationtransaction. Further information about how fair value is determined is presented in Note 14. Retained interests in securitizedreceivables that are classified as investment securities are reported at fair value in each reporting period. These assets decrease ascash is received on the underlying financing receivables. Retained interests classified as financing receivables are accounted for in asimilar manner to our on-book financing receivables.
(47)
Source: GENERAL ELECTRIC CO, 10-Q, November 02, 2009

Key assumptions used in measuring the fair value of retained interests classified as investment securities and the sensitivity of thecurrent fair value to changes in those assumptions related to all outstanding retained interests at September 30, 2009 and December31, 2008 follow. Commercial Credit card Other (In millions) Equipment real estate receivables assets September 30, 2009 Discount rate(a) 9.2 % 20.5 % 11.2 % 5.5 %Effect of 10% adverse change $ (13) $ (13) $ (69) $ (1) 20% adverse change (26) (25) (136) (2) Prepayment rate(a)(b) 23.5 % 10.8 % 9.4 % 54.4 %Effect of 10% adverse change $ (4) $ (2) $ (56) $ - 20% adverse change (8) (4) (103) (1) Estimate of credit losses(a) 1.8 % 3.0 % 16.0 % 0.1 %Effect of 10% adverse change $ (6) $ (3) $ (231) $ - 20% adverse change (13) (7) (459) (1) Remaining weighted average asset lives (in months) 10 53 10 3 Net credit losses for the quarter $ 113 $ 109 $ 1,333 $ 11 Delinquencies 163 175 1,561 77 December 31, 2008 Discount rate(a) 17.6 % 25.8 % 15.1 % 13.4 %Effect of 10% adverse change $ (15) $ (14) $ (53) $ (1) 20% adverse change (30) (26) (105) (3) Prepayment rate(a)(b) 19.5 % 11.3 % 9.6 % 52.0 %Effect of 10% adverse change $ (2) $ (3) $ (60) $ - 20% adverse change (5) (7) (118) (1) Estimate of credit losses(a) 0.7 % 1.3 % 16.2 % - %Effect of 10% adverse change $ (5) $ (2) $ (223) $ - 20% adverse change (10) (4) (440) - Remaining weighted average asset lives (in months) 14 55 10 4 Net credit losses for the year $ 89 $ 28 $ 1,512 $ 5 Delinquencies 123 260 1,833 80
(a) Based on weighted averages. (b) Represented a payment rate on credit card receivables, inventory financing receivables (included within equipment) and trade receivables
(included within other assets).
(48)
Source: GENERAL ELECTRIC CO, 10-Q, November 02, 2009

Activity related to retained interests classified as investment securities in our consolidated financial statements for the three and ninemonths ended September 30, 2009 and 2008 follows. Three months ended September 30 Nine months ended September 30(In millions) 2009 2008 2009 2008 Cash flows on transfers Proceeds from new transfers $ 3,724 $ 657 $ 6,924 $ 4,313 Proceeds from collections reinvested in revolving period transfers 14,770 18,155 45,798 57,210 Cash flows on retained interests recorded as investment securities 1,787 1,420 5,141 4,451 Effect on GECS revenues from services Net gain on sale $ 449 $ 317 $ 1,169 $ 1,022 Change in fair value of retained interests recorded in earnings 38 103 210 10 Other-than-temporary impairments (44) (54) (106) (197)
Derivative Activities Our QSPEs use derivatives to eliminate interest rate risk between the assets and liabilities. At inception of the transaction, the QSPEwill enter into derivative contracts to receive a floating rate of interest and pay a fixed rate with terms that effectively match those of thefinancial assets held. In some cases, we are the counterparty to such derivative contracts, in which case a second derivative isexecuted with a third party to substantially eliminate the exposure created by the first derivative. The fair value of such derivativecontracts was a net asset of $514 million and $752 million at September 30, 2009 and December 31, 2008, respectively. We have noother derivatives arrangements with QSPEs or other VIEs. Servicing Activities The amount of our servicing assets and liabilities was insignificant at September 30, 2009 and December 31, 2008. We receivedservicing fees from QSPEs of $144 million and $162 million, respectively, for the three months ended September 30, 2009 and 2008,and $447 million and $486 million, respectively, for the first nine months ended September 30, 2009 and 2008. At September 30, 2009 and December 31, 2008, accounts payable included $3,832 million and $4,446 million, respectively,representing obligations to QSPEs for collections received in our capacity as servicer from obligors of the QSPEs. Included in other GECS receivables at September 30, 2009 and December 31, 2008, were $2,802 million and $2,346 million,respectively, relating to amounts owed by QSPEs to GE, principally for the purchase of financial assets.
(49)
Source: GENERAL ELECTRIC CO, 10-Q, November 02, 2009

17. INTERCOMPANY TRANSACTIONS Effects of transactions between related companies are eliminated and consist primarily of GECS dividends to GE or capitalcontributions from GE to GECS; GE customer receivables sold to GECS; GECS services for trade receivables management andmaterial procurement; buildings and equipment (including automobiles) leased by GE from GECS; information technology (IT) andother services sold to GECS by GE; aircraft engines manufactured by GE that are installed on aircraft purchased by GECS fromthird-party producers for lease to others; medical equipment manufactured by GE that is leased by GECS to others; and variousinvestments, loans and allocations of GE corporate overhead costs. These intercompany transactions are reported in the GE and GECS columns of our financial statements (and include customerreceivables sold from GE to GECS), but are eliminated in deriving our consolidated financial statements. The effects of theseeliminations on our consolidated cash flows from operating, investing and financing activities follow. Nine months ended September 30(In millions) 2009 2008 Operating Sum of GE and GECS cash from (used for) operating activities – continuing operations $ 13,434 $ 31,779 Elimination of GECS dividend to GE – (2,291)Net increase in GE customer receivables sold to GECS (372) (1,255)Other reclassifications and eliminations 951 (429)Consolidated cash from (used for) operating activities – continuing operations $ 14,013 $ 27,804 Investing Sum of GE and GECS cash from (used for) investing activities – continuing operations $ 25,809 $ (52,947)Net increase in GE customer receivables sold to GECS 372 1,255 Capital contribution from GE to GECS 9,500 – Other reclassifications and eliminations (939) 174 Consolidated cash from (used for) investing activities – continuing operations $ 34,742 $ (51,518) Financing Sum of GE and GECS cash from (used for) financing activities – continuing operations $ (26,714) $ 21,600 Elimination of short-term intercompany borrowings(a) 824 370 Elimination of GECS dividend to GE – 2,291 Capital contribution from GE to GECS (9,500) – Other reclassifications and eliminations (178) 23 Consolidated cash from (used for) financing activities – continuing operations $ (35,568) $ 24,284
(a) Includes GE investment in GECS short-term borrowings, such as commercial paper.
In the GE and GECS columns of our Statement of Cash Flows for the year ended December 31, 2008, we properly reported a $5,500million capital contribution from GE to GECS as an investing use of cash by GE (included in the caption “All other investing activities”)and a financing source of cash to GECS (included in the caption “All other financing activities”). This intercompany transaction was noteliminated in deriving our consolidated cash flows. As a result, our consolidated cash used for investing activities and our consolidatedcash from financing activities were both overstated by the amount of the capital contribution. This item had no effect on ourconsolidated cash from operating activities or total consolidated cash flows, nor did it affect our financial position or results ofoperations. We will correct this immaterial item in our 2009 Annual Report on Form 10-K.
(50)
Source: GENERAL ELECTRIC CO, 10-Q, November 02, 2009

Item 2. Management’s Discussion and Analysis of Financial Condition and Results of Operations. A. Results of Operations General Electric Company’s consolidated financial statements represent the combination of the industrial manufacturing and productservices businesses of General Electric Company (GE) and the financial services businesses of General Electric Capital Services, Inc.(GECS or financial services). In the accompanying analysis of financial information, we sometimes use information derived from consolidated financial informationbut not presented in our financial statements prepared in accordance with U.S. generally accepted accounting principles (GAAP).Certain of these data are considered “non-GAAP financial measures” under the U.S. Securities and Exchange Commission (SEC)rules. For such measures, we have provided supplemental explanations and reconciliations in Exhibit 99(a) to this Form 10-Q Report. Unless otherwise indicated, we refer to captions such as revenues and earnings from continuing operations attributable to the Companysimply as “revenues” and “earnings” throughout this Management’s Discussion and Analysis. Similarly, discussion of other matters inour condensed, consolidated financial statements relates to continuing operations unless otherwise indicated. Overview Earnings from continuing operations attributable to the Company decreased 45% to $2.454 billion in the third quarter of 2009 comparedwith $4.477 billion in the third quarter of 2008. Earnings per share (EPS) from continuing operations were $0.22 in the third quarter of2009, down 51% compared with $0.45 in the third quarter of 2008. For the first nine months of 2009, earnings from continuing operations attributable to the Company decreased 42% to $8.187 billioncompared with $14.222 billion for the same period in 2008. EPS from continuing operations were $0.75 in the first nine months of 2009,down 47% compared with $1.42 in the first nine months of 2008. Earnings from discontinued operations, net of taxes, was an insignificant amount in the third quarter of 2009 compared with a loss of$0.2 billion in the third quarter of 2008, and included the results of GE Money Japan (our Japanese personal loan business, Lake, andJapanese mortgage and card businesses, excluding our investment in GE Nissen Credit Co., Ltd.), our U.S. mortgage business(WMC), Plastics, Advanced Materials, most of GE Insurance Solutions Corporation (GE Insurance Solutions), GE Life and GenworthFinancial, Inc. (Genworth). Loss from discontinued operations, net of taxes, was $0.2 billion for the first nine months of 2009 compared with $0.5 billion for thesame period in 2008. Net earnings attributable to GE common shareowners decreased 44% to $2.419 billion and EPS decreased 47% to $0.23 in the thirdquarter of 2009 compared with $4.312 billion and $0.43, respectively, in the third quarter of 2008. For the first nine months of 2009, net earnings attributable to GE common shareowners decreased 43% to $7.787 billion, comparedwith $13.688 billion for the same period in 2008, and EPS decreased 47% to $0.73, compared with $1.37 in the first nine months of2008. Revenues of $37.8 billion in the third quarter of 2009 were 20% lower than in the third quarter of 2008, reflecting organic revenuedeclines, the stronger U.S. dollar, the lack of a current-year counterpart to the third quarter 2008 Olympics broadcasts and the neteffects of acquisitions and dispositions, including the effect of the deconsolidation of Penske Truck Leasing Co., L.P. (PTL). Industrialsales decreased 13% to $25.1 billion, reflecting organic revenue declines, the lack of a current-year counterpart to the third quarter2008 Olympics broadcasts and the stronger U.S. dollar. Sales of product services (including sales of spare parts and related services)of $8.5 billion in the third quarter of 2009 were about the same compared with the third quarter of 2008. Financial services revenuesdecreased 31% over the comparable period of last year to $12.7 billion, reflecting organic revenue declines, the net effects ofacquisitions and dispositions and the stronger U.S. dollar.
(51)
Source: GENERAL ELECTRIC CO, 10-Q, November 02, 2009

Revenues of $115.3 billion for the first nine months of 2009 were 15% lower than revenues of $136.3 billion for the first nine months of2008, reflecting organic revenue declines, the stronger U.S. dollar, the net effects of acquisitions and dispositions (including the effectof the deconsolidation of PTL) and the lack of a current-year counterpart to the third quarter 2008 Olympics broadcasts. Industrial salesof $75.2 billion were 7% lower than in 2008 reflecting organic revenue declines, the stronger U.S. dollar and the lack of a current-yearcounterpart to the 2008 Olympics broadcasts. Financial services revenues for the first nine months of 2009 decreased 27% to $40.7billion as a result of organic revenue declines, the stronger U.S. dollar and the net effects of acquisitions and dispositions. Overall, acquisitions contributed $0.9 billion and $1.7 billion to consolidated revenues in the third quarters of 2009 and 2008,respectively. Our consolidated earnings in the third quarters of 2009 and 2008 included approximately $0.1 billion and $0.2 billion,respectively, from acquired businesses. We integrate acquisitions as quickly as possible. Only revenues and earnings from the date wecomplete the acquisition through the end of the fourth following quarter are attributed to such businesses. Dispositions also affected ouroperations through lower revenues of $1.5 billion and $0.1 billion in the third quarters of 2009 and 2008, respectively. The effect ofdispositions on earnings was an insignificant amount in both the third quarters of 2009 and 2008. Acquisitions contributed $3.5 billion and $6.1 billion to consolidated revenues in the first nine months of 2009 and 2008, respectively.Our consolidated net earnings in the first nine months of 2009 and 2008 included approximately $0.9 billion and $0.6 billion,respectively, from acquired businesses. Dispositions also affected our operations through lower revenues of $3.6 billion in the first ninemonths of 2009 and higher revenues of $0.3 billion in the first nine months of 2008. The effect of dispositions on earnings was anincrease of $0.4 billion in both the first nine months of 2009 and 2008. The most significant acquisitions affecting results in 2009 were CitiCapital, BAC Credomatic (BAC), Interbanca S.p.A. and Bank BPH atCapital Finance; Airfoils Technologies International – Singapore Pte. Ltd. (ATI-Singapore) and Vital Signs, Inc. at TechnologyInfrastructure; and Hydril Pressure Control at Energy Infrastructure. Segment Operations Operating segments comprise our five businesses focused on the broad markets they serve: Energy Infrastructure, TechnologyInfrastructure, NBC Universal, Capital Finance and Consumer & Industrial. Segment profit is determined based on internal performance measures used by the Chief Executive Officer to assess the performanceof each business in a given period. In connection with that assessment, the Chief Executive Officer may exclude matters such ascharges for restructuring; rationalization and other similar expenses; in-process research and development and certain otheracquisition-related charges and balances; technology and product development costs; certain gains and losses from acquisitions ordispositions; and litigation settlements or other charges, responsibility for which preceded the current management team. Segment profit always excludes the effects of principal pension plans, results reported as discontinued operations, earnings attributableto noncontrolling interests of consolidated subsidiaries and accounting changes. Segment profit excludes or includes interest and otherfinancial charges and income taxes according to how a particular segment’s management is measured – excluded in determiningsegment profit, which we sometimes refer to as “operating profit,” for Energy Infrastructure, Technology Infrastructure, NBC Universaland Consumer & Industrial; included in determining segment profit, which we sometimes refer to as “net earnings,” for Capital Finance. We have reclassified certain prior-period amounts to conform to the current-period’s presentation. In addition to providing informationon segments in their entirety, we have also provided supplemental information for certain businesses within the segments.
(52)
Source: GENERAL ELECTRIC CO, 10-Q, November 02, 2009

Energy Infrastructure Three months ended September 30 Nine months ended September 30(In millions) 2009 2008 2009 2008 Revenues $ 8,917 $ 9,769 $ 26,733 $ 27,164 Segment profit $ 1,582 $ 1,425 $ 4,646 $ 4,074 Revenues Energy(a) $ 7,128 $ 8,015 $ 21,872 $ 22,283 Oil & Gas 1,953 1,891 5,444 5,321 Segment profit Energy(a) $ 1,273 $ 1,143 $ 3,965 $ 3,426 Oil & Gas 338 305 800 721
(a) Effective January 1, 2009, our Water business was combined with Energy. Prior-period amounts were reclassified to conform to thecurrent-period’s presentation.
Energy Infrastructure revenues decreased 9%, or $0.9 billion, in the third quarter of 2009 as lower volume ($0.8 billion), the strongerU.S. dollar ($0.2 billion) and lower other income ($0.1 billion), primarily related to the lack of a current-year counterpart to transactiongains, were partially offset by higher prices ($0.3 billion). Lower volume at Energy related to decreases in equipment sales was partiallyoffset by higher volume at Oil & Gas, primarily related to increases in equipment sales. The effects of the stronger U.S. dollar were atboth Oil & Gas and Energy. Higher prices were primarily at Energy. Segment profit increased 11%, or $0.2 billion, as higher prices ($0.3 billion) and lower material and other costs ($0.1 billion) werepartially offset by lower other income ($0.2 billion), primarily related to the lack of a current-year counterpart to transaction gains, andlower volume ($0.1 billion). Lower material and other costs were primarily at Energy. The decrease in volume was at Energy. Energy Infrastructure revenues decreased 2%, or $0.4 billion, in the first nine months of 2009 as higher prices ($1.0 billion) and highervolume ($0.1 billion), including customer contract termination fees, were more than offset by the stronger U.S. dollar ($1.0 billion) andlower other income ($0.5 billion), primarily related to marks on foreign currency contracts and the lack of a current-year counterpart totransaction gains. The increase in price was primarily at Energy. The increase in volume reflected increased equipment sales at Oil &Gas, partially offset by decreased equipment sales at Energy. The effects of the stronger U.S. dollar were at both Oil & Gas andEnergy. Segment profit for the first nine months of 2009 increased 14%, or $0.6 billion, as higher prices ($1.0 billion), lower material and othercosts ($0.2 billion) and the effects of productivity ($0.1 billion) were partially offset by lower other income ($0.6 billion), primarily relatedto marks on foreign currency contracts and the lack of a current-year counterpart to transaction gains, and the stronger U.S. dollar ($0.1billion). Lower material and other costs were primarily at Energy, while the effects of productivity were primarily at Oil & Gas. Theeffects of the stronger U.S. dollar were at Oil & Gas. Included in segment results was a decrease of $0.2 billion to revenues and $0.1billion to segment profit related to a change in estimate of measuring progress towards long-term contract completion at Vetco Gray.
(53)
Source: GENERAL ELECTRIC CO, 10-Q, November 02, 2009

Technology Infrastructure Three months ended September 30 Nine months ended September 30(In millions) 2009 2008 2009 2008 Revenues $ 10,209 $ 11,450 $ 31,200 $ 33,761 Segment profit $ 1,748 $ 1,900 $ 5,384 $ 5,657 Revenues Aviation $ 4,542 $ 4,841 $ 13,978 $ 14,084 Enterprise Solutions 904 1,192 2,735 3,532 Healthcare 3,801 4,191 11,310 12,569 Transportation 970 1,256 3,210 3,606 Segment profit Aviation $ 970 $ 834 $ 2,973 $ 2,523 Enterprise Solutions 103 187 295 503 Healthcare 508 634 1,509 1,909 Transportation 177 255 630 750
Technology Infrastructure revenues decreased 11%, or $1.2 billion, in the third quarter of 2009 as lower volume ($1.2 billion), thestronger U.S. dollar ($0.1 billion) and lower other income ($0.1 billion) were partially offset by higher prices ($0.1 billion). The decreasein volume was across all businesses in the segment. The effects of the stronger U.S. dollar were primarily at Healthcare. Higher priceswere primarily at Aviation. Segment profit decreased 8%, or $0.2 billion, primarily from lower volume ($0.2 billion) and lower other income ($0.1 billion), partiallyoffset by higher prices ($0.1 billion). The decrease in volume was across all businesses in the segment. Technology Infrastructure revenues decreased 8%, or $2.6 billion, in the first nine months of 2009 as lower volume ($2.5 billion) and thestronger U.S. dollar ($0.7 billion) were partially offset by higher prices ($0.4 billion) and gains related to acquisitions and dispositions($0.4 billion), including the ATI-Singapore acquisition and the Times Microwave Systems disposition. The decrease in volume wasacross all businesses in the segment. The effects of the stronger U.S. dollar were at Healthcare, Enterprise Solutions and Aviation.Higher prices, primarily at Aviation, were partially offset by lower prices at Healthcare. Segment profit for the first nine months of 2009 decreased 5%, or $0.3 billion, primarily from lower volume ($0.6 billion), lowerproductivity ($0.1 billion), higher labor and other costs ($0.1 billion) and the stronger U.S. dollar ($0.1 billion), partially offset by higherprices ($0.4 billion) and gains related to acquisitions and dispositions ($0.4 billion), including the ATI-Singapore acquisition and theTimes Microwave Systems disposition. The decrease in volume was across all businesses in the segment. The effects of productivity atTransportation, Healthcare and Enterprise Solutions were partially offset by Aviation.
(54)
Source: GENERAL ELECTRIC CO, 10-Q, November 02, 2009
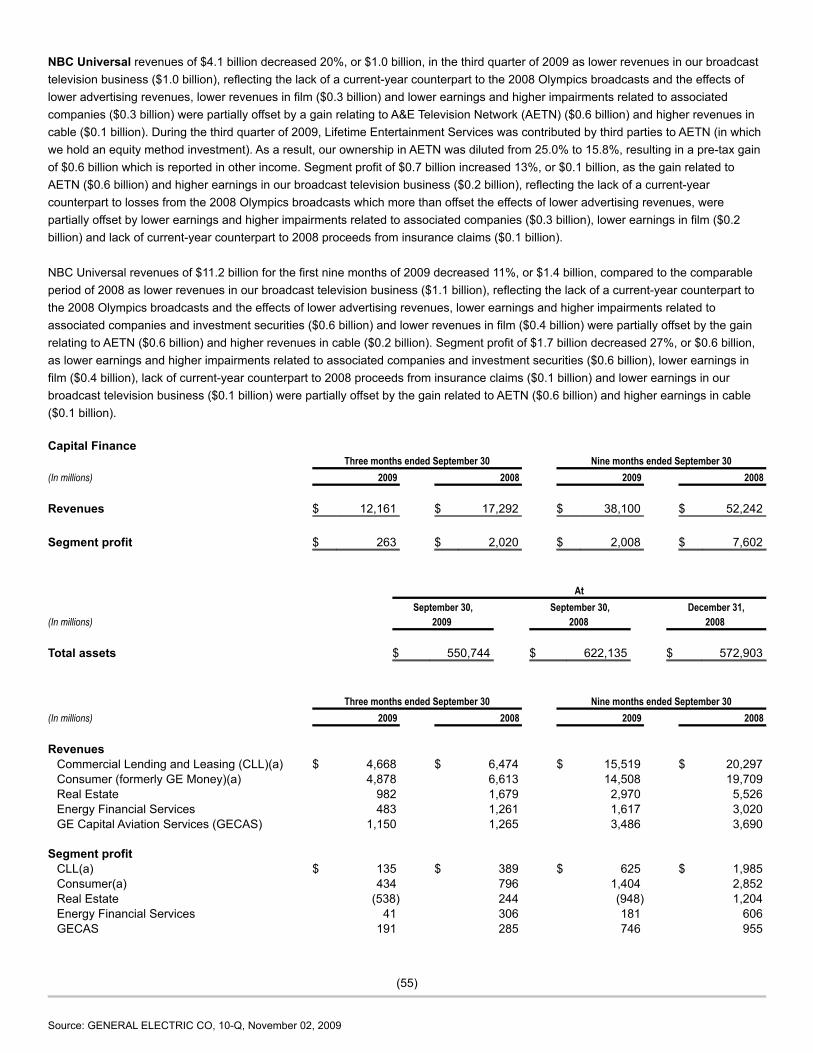
NBC Universal revenues of $4.1 billion decreased 20%, or $1.0 billion, in the third quarter of 2009 as lower revenues in our broadcasttelevision business ($1.0 billion), reflecting the lack of a current-year counterpart to the 2008 Olympics broadcasts and the effects oflower advertising revenues, lower revenues in film ($0.3 billion) and lower earnings and higher impairments related to associatedcompanies ($0.3 billion) were partially offset by a gain relating to A&E Television Network (AETN) ($0.6 billion) and higher revenues incable ($0.1 billion). During the third quarter of 2009, Lifetime Entertainment Services was contributed by third parties to AETN (in whichwe hold an equity method investment). As a result, our ownership in AETN was diluted from 25.0% to 15.8%, resulting in a pre-tax gainof $0.6 billion which is reported in other income. Segment profit of $0.7 billion increased 13%, or $0.1 billion, as the gain related toAETN ($0.6 billion) and higher earnings in our broadcast television business ($0.2 billion), reflecting the lack of a current-yearcounterpart to losses from the 2008 Olympics broadcasts which more than offset the effects of lower advertising revenues, werepartially offset by lower earnings and higher impairments related to associated companies ($0.3 billion), lower earnings in film ($0.2billion) and lack of current-year counterpart to 2008 proceeds from insurance claims ($0.1 billion). NBC Universal revenues of $11.2 billion for the first nine months of 2009 decreased 11%, or $1.4 billion, compared to the comparableperiod of 2008 as lower revenues in our broadcast television business ($1.1 billion), reflecting the lack of a current-year counterpart tothe 2008 Olympics broadcasts and the effects of lower advertising revenues, lower earnings and higher impairments related toassociated companies and investment securities ($0.6 billion) and lower revenues in film ($0.4 billion) were partially offset by the gainrelating to AETN ($0.6 billion) and higher revenues in cable ($0.2 billion). Segment profit of $1.7 billion decreased 27%, or $0.6 billion,as lower earnings and higher impairments related to associated companies and investment securities ($0.6 billion), lower earnings infilm ($0.4 billion), lack of current-year counterpart to 2008 proceeds from insurance claims ($0.1 billion) and lower earnings in ourbroadcast television business ($0.1 billion) were partially offset by the gain related to AETN ($0.6 billion) and higher earnings in cable($0.1 billion). Capital Finance Three months ended September 30 Nine months ended September 30(In millions) 2009 2008 2009 2008 Revenues $ 12,161 $ 17,292 $ 38,100 $ 52,242 Segment profit $ 263 $ 2,020 $ 2,008 $ 7,602
At September 30, September 30, December 31,(In millions) 2009 2008 2008 Total assets $ 550,744 $ 622,135 $ 572,903
Three months ended September 30 Nine months ended September 30(In millions) 2009 2008 2009 2008 Revenues Commercial Lending and Leasing (CLL)(a) $ 4,668 $ 6,474 $ 15,519 $ 20,297 Consumer (formerly GE Money)(a) 4,878 6,613 14,508 19,709 Real Estate 982 1,679 2,970 5,526 Energy Financial Services 483 1,261 1,617 3,020 GE Capital Aviation Services (GECAS) 1,150 1,265 3,486 3,690 Segment profit CLL(a) $ 135 $ 389 $ 625 $ 1,985 Consumer(a) 434 796 1,404 2,852 Real Estate (538) 244 (948) 1,204 Energy Financial Services 41 306 181 606 GECAS 191 285 746 955
(55)
Source: GENERAL ELECTRIC CO, 10-Q, November 02, 2009

At September 30, September 30, December 31,(In millions) 2009 2008 2008 Assets CLL(a) $ 213,979 $ 247,810 $ 228,176 Consumer(a) 180,070 213,889 187,927 Real Estate 83,684 88,739 85,266 Energy Financial Services 22,598 21,856 22,079 GECAS 50,413 49,841 49,455
(a) During the first quarter of 2009, we transferred Banque Artesia Nederland N.V. (Artesia) from CLL to Consumer. Prior-period amounts werereclassified to conform to the current-period’s presentation.
Capital Finance revenues decreased 30% and net earnings decreased 87% compared with the third quarter of 2008. Revenues for thethird quarters of 2009 and 2008 included $0.7 billion and $0.2 billion of revenue from acquisitions, respectively, and in 2009 werereduced by $1.5 billion as a result of dispositions, including the effect of the deconsolidation of PTL. Revenues for the quarter alsodecreased $4.2 billion compared with the third quarter of 2008 as a result of organic revenue declines, driven by a lower asset baseand a lower interest rate environment, and the stronger U.S. dollar. Net earnings decreased by $1.8 billion in the third quarter of 2009compared with the third quarter of 2008, primarily due to higher provisions for losses on financing receivables associated with thechallenging economic environment, partially offset by lower selling, general and administrative costs. Capital Finance revenues decreased 27% and net earnings decreased 74% compared with the first nine months of 2008. Revenues forthe first nine months of 2009 and 2008 included $2.6 billion and $0.4 billion of revenue from acquisitions, respectively, and in 2009 werereduced by $3.5 billion as a result of dispositions, including the effect of the deconsolidation of PTL. Revenues for the first nine monthsalso decreased $12.8 billion compared with the first nine months of 2008 as a result of organic revenue declines, primarily driven by alower asset base and a lower interest rate environment, and the stronger U.S. dollar. Net earnings decreased by $5.6 billion in the firstnine months of 2009 compared with the first nine months of 2008, primarily due to higher provisions for losses on financing receivablesassociated with the challenging economic environment, partially offset by lower selling, general and administrative costs. During the first nine months of 2009, General Electric Capital Corporation (GE Capital) provided $51 billion of new financings in theU.S. to various companies, infrastructure projects and municipalities. Additionally, we extended $54 billion of credit to approximately 49million U.S. consumers. GE Capital provided credit to approximately 19,700 new commercial customers and 26,000 new smallbusinesses during the first nine months of 2009 in the U.S. and ended the period with outstanding credit to more than 350,000commercial customers and 147,000 small businesses through retail programs in the U.S. Additional information about certain Capital Finance businesses follows. CLL revenues decreased 28% and net earnings decreased 65% compared with the third quarter of 2008. Revenues for the thirdquarters of 2009 and 2008 included $0.5 billion and $0.2 billion, respectively, from acquisitions, and were reduced by $1.1 billion fromdispositions, primarily related to the deconsolidation of PTL. Revenues for the quarter also decreased $1.0 billion compared with thethird quarter of 2008 as a result of organic revenue declines ($0.8 billion) and the stronger U.S. dollar ($0.2 billion). Net earningsdecreased by $0.3 billion in the third quarter of 2009, reflecting higher provisions for losses on financing receivables ($0.1 billion) anddeclines in lower-taxed earnings from global operations ($0.1 billion), partially offset by higher investment income ($0.1 billion) andacquisitions ($0.1 billion). Net earnings also included mark-to-market losses and other-than-temporary impairments ($0.2 billion),partially offset by the absence of the 2008 Genpact loss ($0.2 billion).
(56)
Source: GENERAL ELECTRIC CO, 10-Q, November 02, 2009

CLL revenues decreased 24% and net earnings decreased 69% compared with the first nine months of 2008. Revenues for the firstnine months of 2009 and 2008 included $1.7 billion and $0.3 billion from acquisitions, respectively, and were reduced by $2.0 billionfrom dispositions, primarily related to the deconsolidation of PTL. Revenues for the first nine months of 2009 also included $0.3 billionrelated to a gain on the partial sale of a limited partnership interest in PTL and remeasurement of our retained investment. Revenuesfor the first nine months decreased $4.2 billion compared with the first nine months of 2008 as a result of organic revenue declines($3.3 billion) and the stronger U.S. dollar ($0.9 billion). Net earnings decreased by $1.4 billion in the first nine months of 2009, reflectinghigher provisions for losses on financing receivables ($0.6 billion), lower gains ($0.4 billion), declines in lower-taxed earnings fromglobal operations ($0.3 billion) and the stronger U.S. dollar (0.1 billion), partially offset by acquisitions ($0.4 billion). Net earnings alsoincluded mark-to-market losses and other-than-temporary impairments ($0.3 billion) and the absence of the 2008 Genpact gain ($0.1billion), partially offset by the gain on PTL sale and remeasurement ($0.3 billion). Consumer revenues decreased 26% and net earnings decreased 45% compared with the third quarter of 2008. Revenues for the thirdquarter of 2009 included $0.3 billion from acquisitions and were reduced by $0.4 billion as a result of dispositions. Revenues for thequarter decreased $1.6 billion compared with the third quarter of 2008 as a result of organic revenue declines ($1.1 billion) and thestronger U.S. dollar ($0.5 billion). The decrease in net earnings resulted from core declines ($0.5 billion), partially offset by highersecuritization income ($0.1 billion). Core declines primarily resulted from lower results in the U.S. and U.K., reflecting higher provisionsfor losses on financing receivables ($0.4 billion) and the effects of mark-to-market losses and other-than-temporary impairments ($0.1billion). Consumer revenues decreased 26% and net earnings decreased 51% compared with the first nine months of 2008. Revenues for thefirst nine months of 2009 included $0.8 billion from acquisitions (including a gain of $0.3 billion on the remeasurement of our previouslyheld equity investment in BAC related to the acquisition of a controlling interest (BAC acquisition gain)) and were reduced by $1.3 billionas a result of dispositions, and the lack of a current-year counterpart to the 2008 gain on sale of our Corporate Payment Services (CPS)business ($0.4 billion). Revenues for the first nine months decreased $4.3 billion compared with the first nine months of 2008 as aresult of organic revenue declines ($2.5 billion) and the stronger U.S. dollar ($1.9 billion). The decrease in net earnings resultedprimarily from core declines ($1.7 billion) and the lack of a current-year counterpart to the 2008 gain on sale of our CPS business ($0.2billion). These decreases were partially offset by higher securitization income ($0.2 billion) and the BAC acquisition gain ($0.2 billion).Core declines primarily resulted from lower results in the U.S. & U.K., reflecting higher provisions for losses on financing receivables($1.6 billion) and the effects of mark-to-market losses and other-than-temporary impairments ($0.2 billion), partially offset by growth inlower-taxed earnings from global operations ($0.1 billion). The benefit from lower-taxed earnings from global operations included $0.5billion from the decision to indefinitely reinvest prior-year earnings outside the U.S. Real Estate revenues decreased 42% and net earnings decreased 320% compared with the third quarter of 2008. Revenues for thequarter decreased $0.7 billion compared with the third quarter of 2008 as a result of organic revenue declines ($0.6 billion), primarily asa result of a decrease in sales of properties, and the stronger U.S. dollar ($0.1 billion). Real Estate net earnings decreased $0.8 billioncompared with the third quarter of 2008, primarily from an increase in provisions for losses on financing receivables and impairments($0.5 billion) and a decrease in gains on sales of properties as compared to the prior period ($0.2 billion). Depreciation expense on realestate equity investments totaled $0.3 billion and $0.4 billion in the third quarters of 2009 and 2008, respectively. Real Estate revenues decreased 46% and net earnings decreased 179% compared with the first nine months of 2008. Revenues forthe first nine months decreased $2.6 billion compared with the first nine months of 2008 as a result of organic revenue declines ($2.3billion), primarily as a result of a decrease in sales of properties, and the stronger U.S. dollar ($0.3 billion). Real Estate net earningsdecreased $2.2 billion compared with the first nine months of 2008, primarily from a decrease in gains on sales of properties ascompared to the prior period ($1.1 billion) and an increase in provisions for losses on financing receivables and impairments ($0.8billion). Depreciation expense on real estate equity investments totaled $0.9 billion in both the first nine months of 2009 and 2008,respectively.
(57)
Source: GENERAL ELECTRIC CO, 10-Q, November 02, 2009

Energy Financial Services revenues decreased 62% and net earnings decreased 87% compared with the third quarter of 2008.Revenues for the quarter decreased $0.8 billion compared with the third quarter of 2008 as a result of organic declines ($0.8 billion),primarily as a result of the effects of lower energy commodity prices and a decrease in gains on sales of assets. The decrease in netearnings resulted primarily from core declines, including a decrease in gains on sales of assets as compared to the prior period and theeffects of lower energy commodity prices. Energy Financial Services revenues decreased 46% and net earnings decreased 70% compared with the first nine months of 2008.Revenues for the first nine months of 2009 included $0.1 billion of gains from dispositions. Revenues for the first nine months alsodecreased $1.5 billion compared with the first nine months of 2008 as a result of organic declines ($1.5 billion), primarily as a result ofthe effects of lower energy commodity prices and a decrease in gains on sales of assets. The decrease in net earnings resultedprimarily from core declines, including a decrease in gains on sales of assets as compared to the prior period and the effects of lowerenergy commodity prices. GECAS revenues decreased 9% and net earnings decreased 33% compared with the third quarter of 2008. The decrease in revenuesresulted primarily from organic revenue declines ($0.1 billion). The decrease in net earnings resulted primarily from core declines ($0.1billion) reflecting higher credit losses and impairments. GECAS revenues decreased 6% and net earnings decreased 22% compared with the first nine months of 2008. The decrease inrevenues resulted primarily from lower asset sales ($0.2 billion). The decrease in net earnings resulted primarily from lower asset sales($0.1 billion) and core declines ($0.1 billion) reflecting higher credit losses and impairments. Consumer & Industrial revenues of $2.4 billion decreased 18%, or $0.6 billion, in the third quarter of 2009 compared with the thirdquarter of 2008, primarily as a result of lower volume ($0.6 billion). The decrease in volume primarily reflected tightened consumerspending in the U.S. and European markets. Segment profit increased 149%, or $0.1 billion, in the third quarter of 2009 as a result oflower material and other costs ($0.1 billion) and higher prices. Consumer & Industrial revenues of $7.2 billion decreased 20%, or $1.8 billion, in the first nine months of 2009 compared with the firstnine months of 2008, as lower volume ($1.8 billion) and the stronger U.S. dollar ($0.1 billion) were partially offset by higher prices ($0.2billion). The decrease in volume primarily reflected tightened consumer spending in the U.S. and European markets. Segment profitdecreased 20%, or $0.1 billion, in the first nine months of 2009 as lower productivity ($0.2 billion) and lower other income ($0.1 billion)were partially offset by higher prices ($0.2 billion) and lower material costs ($0.1 billion).
(58)
Source: GENERAL ELECTRIC CO, 10-Q, November 02, 2009

Discontinued Operations Three months ended September 30 Nine months ended September 30(In millions) 2009 2008 2009 2008 Earnings (loss) from discontinued operations, net of taxes $ 40 $ (165) $ (175) $ (534)
Discontinued operations comprised GE Money Japan, WMC, Plastics, Advanced Materials, GE Insurance Solutions, GE Life, andGenworth. Results of these businesses are reported as discontinued operations for all periods presented. Earnings from discontinued operations, net of taxes, for the third quarter of 2009, primarily related to certain tax items in ourdiscontinued insurance operations. Loss from discontinued operations, net of taxes, for the first nine months of 2009, primarily reflectedthe incremental loss on disposal of GE Money Japan ($0.1 billion). Loss from discontinued operations, net of taxes, for the third quarter of 2008, primarily reflected the loss from operations ($0.2 billion) atGE Money Japan. Loss from discontinued operations, net of taxes, for the first nine months of 2008, primarily reflected loss fromoperations ($0.3 billion) and the estimated incremental loss on disposal of GE Money Japan ($0.2 billion). For additional information related to discontinued operations, see Note 2 to the condensed, consolidated financial statements. Corporate items and eliminations revenues in the third quarter of 2009 decreased by $0.7 billion due to an increase in net losses onhedging activity ($0.4 billion), lack of a current-year counterpart to a gain on termination of a derivatives contract in 2008 ($0.2 billion)and a decrease in gains on dispositions ($0.1 billion) partially offset by higher revenues from insurance activities ($0.1 billion).Corporate items and eliminations costs increased by $0.9 billion compared to the third quarter of 2008 due to an increase inrestructuring, rationalization and other charges ($0.7 billion), net losses on hedging activity ($0.2 billion) and lower net gains ondispositions ($0.1 billion), partially offset by lower losses from insurance activities ($0.1 billion). Corporate items and eliminations revenues in the first nine months of 2009 decreased by $0.6 billion compared to the first nine monthsof 2008 due to lack of a current-year counterpart to a gain on termination of a derivatives contract in 2008 ($0.2 billion), lower incomefrom guaranteed investment contracts ($0.2 billion), a decrease in net gains on hedging activity ($0.1 billion) and a decrease in gains ondispositions ($0.1 billion). Corporate items and eliminations costs increased by $1.0 billion compared to the first nine months of 2008due to an increase in restructuring, rationalization and other charges ($1.1 billion) and net losses on hedging activity ($0.3 billion),partially offset by lower corporate staff and incentive costs ($0.2 billion). Certain amounts included in Corporate items and eliminations cost are not allocated to GE operating segments because they areexcluded from the measurement of their operating performance for internal purposes. In the third quarter of 2009, these included $0.1billion at each of Technology Infrastructure and Energy Infrastructure, primarily for restructuring, rationalization and other charges. Inthe first nine months of 2009, these included $0.3 billion at Technology Infrastructure, $0.2 billion at Capital Finance and $0.1 billion atEnergy Infrastructure and Consumer & Industrial, primarily for restructuring, rationalization and other charges and $0.2 billion at NBCUniversal, primarily for restructuring, rationalization and other charges and technology and product development costs. (GECS amountson an after-tax basis).
(59)
Source: GENERAL ELECTRIC CO, 10-Q, November 02, 2009

B. Statement of Financial Position Overview of Financial Position Major changes in our financial position in the first nine months of 2009 resulted from the following:
• At GECS, collections on financing receivables exceeded originations by approximately $37 billion in the first nine months of 2009.
• We completed the exchange of our Consumer businesses in Austria and Finland, the credit card and auto businesses in the U.K.,and the credit card business in Ireland for a 100% ownership interest in Interbanca S.p.A., an Italian corporate bank;
• In order to improve tangible capital and reduce leverage, GE contributed $9.5 billion to GECS, of which $8.8 billion was
subsequently contributed to GE Capital;
• The U.S. dollar was weaker at September 30, 2009 than at December 31, 2008, increasing the translated levels of our non-U.S.dollar assets and liabilities;
• We deconsolidated PTL following our partial sale during the first quarter of 2009;
• We purchased a controlling interest in BAC in the second quarter of 2009; and
• Our investment securities balance increased primarily as a result of purchases and a reduction in unrealized losses due to
improved credit markets. Consolidated assets were $787.8 billion at September 30, 2009, a decrease of $9.9 billion from December 31, 2008. GE assetsincreased $8.9 billion, and financial services assets decreased $2.6 billion. GE assets were $207.8 billion at September 30, 2009, a $8.9 billion increase from December 31, 2008. The increase reflects a $17.4billion increase in investment in GECS and a $1.4 billion increase in all other assets, partially offset by a $6.9 billion decrease in cashand equivalents (primarily related to a $9.5 billion capital contribution to GECS during the first quarter, partially offset by cash retainedas a result of the reduction in our dividend) and a $2.2 billion decrease in current receivables. Financial Services assets were $658.3 billion at September 30, 2009. The $2.6 billion decrease from December 31, 2008 was primarilyattributable to decreases in net financing receivables of $23.9 billion, assets of businesses held for sale of $9.3 billion and property,plant and equipment – net of $5.4 billion, partially offset by increases in cash and equivalents of $19.4 billion, investment securities of$11.5 billion and goodwill of $2.8 billion. Consolidated liabilities were $662.0 billion at September 30, 2009, a $22.1 billion decrease from December 31, 2008. GE liabilitiesdecreased $3.6 billion, while financial services liabilities decreased $19.7 billion. GE liabilities were $84.0 billion at September 30, 2009. The $3.6 billion decrease from December 31, 2008 was primarily attributable todecreases in dividends payable of $2.2 billion, short-term borrowings of $1.8 billion and accounts payable of $1.3 billion, partially offsetby an increase in long-term borrowings of $1.9 billion. The ratio of borrowings to total capital invested for GE at the end of the thirdquarter was 9.0% compared with 9.9% at the end of last year and 10.8% at September 30, 2008. Financial Services liabilities decreased $19.7 billion from year-end 2008 to $585.7.billion reflecting decreases in all other liabilities of$11.1 billion (primarily cash collateral received from counterparties on derivative contracts and a reduction in taxes payable), totalborrowings of $6.2 billion, investment contracts, insurance liabilities and insurance annuity benefits of $1.4 billion, and accountspayable of $1.4 billion, partially offset by an increase in deferred income taxes of $0.9 billion.
(60)
Source: GENERAL ELECTRIC CO, 10-Q, November 02, 2009

Cash Flows Consolidated cash and equivalents were $61.4 billion at September 30, 2009, an increase of $13.2 billion during the first nine months of2009. Cash and equivalents totaled $16.3 billion at September 30, 2008, an increase of $0.6 billion during the first nine months of 2008. We evaluate our cash flow performance by reviewing our industrial (non-financial services) businesses and financial servicesbusinesses separately. Cash from operating activities (CFOA) is the principal source of cash generation for our industrial businesses.The industrial businesses also have liquidity available via the public capital markets. Our financial services businesses use a variety offinancial resources to meet our capital needs. Cash for financial services businesses is primarily provided from the issuance of termdebt and commercial paper in the public and private markets, time deposits, as well as financing receivables collections, sales andsecuritizations. GE Cash Flow GE cash and equivalents were $5.2 billion at September 30, 2009, compared with $3.5 billion at September 30, 2008. GE CFOA totaled$11.5 billion for the first nine months of 2009 compared with $13.6 billion for the first nine months of 2008. With respect to GE CFOA,we believe that it is useful to supplement our GE Condensed Statement of Cash Flows and to examine in a broader context thebusiness activities that provide and require cash. Nine months ended September 30(In billions) 2009 2008 Operating cash collections(a) $ 77.3 $ 85.0 Operating cash payments (65.8) (73.7)Cash dividends from GECS to GE – 2.3 GE cash from operating activities (GE CFOA)(a) $ 11.5 $ 13.6
(a) GE sells customer receivables to GECS in part to fund the growth of our industrial businesses. These transactions can result in cashgeneration or cash use. During any given period, GE receives cash from the sale of receivables to GECS. It also foregoes collection ofcash on receivables sold. The incremental amount of cash received from sale of receivables in excess of the cash GE would haveotherwise collected had those receivables not been sold, represents the cash generated or used in the period relating to this activity.The incremental cash generated in GE CFOA from selling these receivables to GECS increased GE CFOA by $0.2 billion and $1.3billion in the nine months ended September 30, 2009 and 2008, respectively. See Note 17 to the condensed, consolidated financialstatements for additional information about the elimination of intercompany transactions between GE and GECS.
The most significant source of cash in GE CFOA is customer-related activities, the largest of which is collecting cash following aproduct or services sale. GE operating cash collections decreased by $7.7 billion during the first nine months of 2009. This decrease isconsistent with the changes in comparable GE operating segment revenues. Analyses of operating segment revenues discussed in thepreceding Segment Operations section are the best way of understanding their customer-related CFOA. The most significant operating use of cash is to pay our suppliers, employees, tax authorities and others for a wide range of materialand services. GE operating cash payments decreased in the first nine months of 2009 by $7.9 billion, consistent with the decrease inGE total costs and expenses. GE CFOA decreased $2.2 billion compared with the first nine months of 2008, primarily reflecting the lack of a current-year dividendfrom GECS ($2.3 billion). Dividends from GECS represented the distribution of a portion of GECS retained earnings and are distinct from cash from continuingoperating activities within the financial services businesses. The amounts included in GE CFOA are the total dividends, includingnormal dividends as well as any special dividends from excess capital, primarily resulting from GECS business sales. Beginning in thefirst quarter of 2009, GECS fully suspended its normal dividend to GE.
(61)
Source: GENERAL ELECTRIC CO, 10-Q, November 02, 2009

Source: GENERAL ELECTRIC CO, 10-Q, November 02, 2009

GECS Cash Flow GECS cash and equivalents were $56.9 billion at September 30, 2009, compared with $13.1 billion at September 30, 2008. GECS cashfrom operating activities totaled $2.0 billion for the first nine months of 2009, compared with cash from operating activities of $18.1billion for the first nine months of 2008. This decrease was primarily due to an overall decline in net earnings, decreases in cashcollateral held from counterparties on derivative contracts ($6.7 billion) and declines in taxes payable ($4.7 billion). Consistent with our plan to reduce GECS asset levels, cash from investing activities was $36.6 billion during the first nine months of2009. $37.0 billion resulted from a reduction in financing receivables, primarily from collections exceeding originations and $8.8 billionresulted from proceeds from business dispositions, including the consumer businesses in Austria and Finland, the credit card and autobusinesses in the U.K., the credit card business in Ireland and a portion of our Australian residential mortgage business. These sourceswere partially offset by cash used for acquisitions of $5.6 billion, primarily for the acquisition of Interbanca S.p.A. GECS cash used for financing activities in the first nine months of 2009 of $19.1 billion related primarily to a $33.6 billion reduction inborrowings (maturities 90 days or less) and $1.9 billion of net redemptions of investment contracts, partially offset by $6.8 billion of newissuances on borrowings (maturities longer than 90 days) exceeding repayments and a capital contribution from GE to GECS of $9.5billion. Intercompany Eliminations Effects of transactions between related companies are eliminated and consist primarily of GECS dividends to GE or capitalcontributions from GE to GECS; GE customer receivables sold to GECS; GECS services for trade receivables management andmaterial procurement; buildings and equipment (including automobiles) leased by GE from GECS; information technology (IT) andother services sold to GECS by GE; aircraft engines manufactured by GE that are installed on aircraft purchased by GECS fromthird-party producers for lease to others; medical equipment manufactured by GE that is leased by GECS to others; and variousinvestments, loans and allocations of GE corporate overhead costs. See Note 17 to the condensed, consolidated financial statementsfor further information related to intercompany eliminations. Fair Value Measurements We adopted Financial Accounting Standards Board (FASB) Accounting Standards Codification (ASC) 820, Fair Value Measurementsand Disclosures, in two steps; effective January 1, 2008, we adopted it for all financial instruments and non-financial instrumentsaccounted for at fair value on a recurring basis and effective January 1, 2009, for all non-financial instruments accounted for at fairvalue on a non-recurring basis. Adoption of this did not have a material effect on our financial position or results of operations. Duringthe first nine months of 2009, there were no significant changes in our methodology for measuring fair value of financial instruments ascompared to prior quarters. Additional information about our application of this guidance is provided in Note 14 to the condensed,consolidated financial statements. At September 30, 2009, the aggregate amount of investments that are measured at fair value through earnings totaled $7.8 billion andconsisted primarily of retained interests in securitizations, equity investments, as well as various assets held for sale in the ordinarycourse of business, such as credit card receivables.
(62)
Source: GENERAL ELECTRIC CO, 10-Q, November 02, 2009
C. Financial Services Portfolio Quality Investment securities comprise mainly investment-grade debt securities supporting obligations to annuitants and policyholders in ourrun-off insurance operations and holders of guaranteed investment contracts (GICs). The fair value of investment securities totaled$52.7 billion at September 30, 2009, compared with $41.2 billion at December 31, 2008. Of the amount at September 30, 2009, we helddebt securities with an estimated fair value of $42.9 billion, which included corporate debt securities, residential mortgage-backedsecurities (RMBS) and commercial mortgage-backed securities (CMBS) with estimated fair values of $25.1 billion, $3.4 billion and $2.5billion, respectively. Unrealized losses on debt securities were $3.0 billion and $5.4 billion at September 30, 2009 and December 31,2008, respectively. This amount included unrealized losses on corporate debt securities, RMBS and CMBS of $1.0 billion, $0.9 billionand $0.5 billion, respectively, at September 30, 2009, as compared with $2.6 billion, $1.1 billion and $0.8 billion, respectively, atDecember 31, 2008. Of the $3.4 billion of RMBS, our exposure to subprime credit was approximately $1.0 billion. These securities are primarily held tosupport obligations to holders of GICs. A majority of these securities have received investment-grade credit ratings from the majorrating agencies. We purchased no such securities in the first nine months of 2009 and 2008. These investment securities arecollateralized primarily by pools of individual direct mortgage loans, and do not include structured products such as collateralized debtobligations. Additionally, a majority of exposure to residential subprime credit related to investment securities backed by mortgage loansoriginated in 2006 and 2005. We regularly review investment securities for impairment. Our review uses both qualitative and quantitative criteria. Effective April 1,2009, the FASB amended FASB ASC 320 and modified the requirements for recognizing and measuring other-than-temporaryimpairment for debt securities. This did not have a material impact on our results of operations. We presently do not intend to sell ourdebt securities and believe that it is not more likely than not that we will be required to sell these securities that are in an unrealized lossposition before recovery of our amortized cost. If we do not intend to sell the security and it is not more likely than not that we will berequired to sell the security before recovery of our amortized cost, we evaluate other qualitative criteria to determine whether a creditloss exists, such as the financial health of and specific prospects for the issuer, including whether the issuer is in compliance with theterms and covenants of the security. Quantitative criteria include determining whether there has been an adverse change in expectedfuture cash flows. With respect to corporate bonds we placed greater emphasis on the credit quality of the issuer. With respect toRMBS and CMBS, we placed greater emphasis on our expectations with respect to cash flows from the underlying collateral and withrespect to RMBS, we considered other features of the security, principally monoline insurance. For equity securities, our criteria includethe length of time and magnitude of the amount that each security is in an unrealized loss position. Our other-than-temporaryimpairment reviews involve our finance, risk and asset management functions as well as the portfolio management and researchcapabilities of our internal and third-party asset managers. Monoline insurers (Monolines) provide credit enhancement for certain of our investment securities. The credit enhancement is a featureof each specific security that guarantees the payment of all contractual cash flows, and is not purchased separately by GE. AtSeptember 30, 2009, our investment securities insured by Monolines totaled $2.7 billion, including $0.8 billion of our $1.0 billioninvestment in subprime RMBS. The Monoline industry continues to experience financial stress from increasing delinquencies anddefaults on the individual loans underlying insured securities. In evaluating whether a security with Monoline credit enhancement isother-than-temporarily impaired, we first evaluate whether there has been an adverse change in estimated cash flows. If there has beenan adverse change in estimated cash flows, we then evaluate the overall credit worthiness of the Monoline using an analysis that issimilar to the approach we use for corporate bonds. This includes an evaluation of the following factors: sufficiency of the Monoline’scash reserves and capital, ratings activity, whether the Monoline is in default or default appears imminent, and the potential forintervention by an insurance or other regulator. At September 30, 2009, the unrealized loss associated with securities subject toMonoline credit enhancement for which there is an expected loss was $0.5 billion, of which $0.3 billion relates to expected credit lossesand the remaining $0.2 billion relates to other market factors.
(63)
Source: GENERAL ELECTRIC CO, 10-Q, November 02, 2009
Total pre-tax other-than-temporary impairment losses during the three months ended September 30, 2009 were $0.3 billion of which,$0.2 billion was recognized in earnings and primarily relates to credit losses on RMBS, corporate debt securities and retained interestsin our securitization arrangements, and $0.2 billion primarily relates to non-credit related losses on RMBS and is included withinaccumulated other comprehensive income. Our qualitative review attempts to identify issuers’ securities that are “at-risk” of other-than-temporary impairment, that is, for securitiesthat we do not intend to sell and it is not more likely than not that we will be required to sell before recovery of our amortized cost,whether there is a possibility of credit loss that would result in an other-than-temporary impairment recognition in the following 12months. Securities we have identified as “at-risk” primarily relate to investments in RMBS securities and corporate debt securitiesacross a broad range of industries. The amount of associated unrealized loss on these securities at September 30, 2009 is $0.8 billion.Credit losses that would be recognized in earnings are calculated when we determine the security to be other-than-temporarilyimpaired. Continued uncertainty in the capital markets may cause increased levels of other-than-temporary impairments. At September 30, 2009, unrealized losses on investment securities totaled $3.1 billion, including $2.8 billion aged 12 months or longer,compared with unrealized losses of $5.7 billion, including $3.5 billion aged 12 months or longer, at December 31, 2008. Of the amountaged 12 months or longer at September 30, 2009, more than 70% of our debt securities were considered to be investment-grade by themajor rating agencies. In addition, of the amount aged 12 months or longer, $1.8 billion and $0.9 billion related to structured securities(mortgage-backed, asset-backed and securitization retained interests) and corporate debt securities, respectively. With respect to ourinvestment securities that are in an unrealized loss position at September 30, 2009, the vast majority relate to debt securities held tosupport obligations to annuitants and policyholders in our run-off insurance operations and holders of GICs. We presently do not intendto sell our debt securities and believe that it is not more likely than not that we will be required to sell these securities that are in anunrealized loss position before recovery of our amortized cost. The fair values used to determine these unrealized gains and losses arethose defined by relevant accounting standards and are not a forecast of future gains or losses. For additional information, see Note 3to the condensed, consolidated financial statements. Financing receivables is our largest category of assets and represents one of our primary sources of revenues. A discussion of thequality of certain elements of the financing receivables portfolio follows. For purposes of that discussion, “delinquent” receivables arethose that are 30 days or more past due based on their contractual terms; and “nonearning” receivables are those that are 90 days ormore past due (or for which collection has otherwise become doubtful). Nonearning receivables exclude loans purchased at a discount(unless they have deteriorated post acquisition). Under FASB ASC 310, these loans are initially recorded at fair value and accreteinterest income over the estimated life of the loan based on reasonably estimable cash flows even if the underlying loans arecontractually delinquent at acquisition. In addition, nonearning receivables exclude loans which are paying currently under a cashaccounting basis, but classified as impaired. Our portfolio of financing receivables is diverse and not directly comparable to major U.S. banks. Historically, we have had lessconsumer exposure, which over time has had higher loss rates than commercial exposure. Our consumer exposure is largely non-U.S.and primarily comprises mortgage, sales finance, auto and personal loans in various European and Asian countries. Our U.S.consumer financing receivables comprise 7% of our total portfolio. Of those, approximately 35% relate primarily to credit cards, whichare often subject to profit and loss sharing arrangements with the retailer (the results of which are reflected in GECS revenues), andhave a smaller average balance and lower loss severity as compared to bank cards. The remaining 65% are sales finance receivables,which provide electronics, recreation, medical and home improvement financing to customers. In 2007, we exited the U.S. mortgagebusiness and we have no U.S. auto or student loans. Our commercial portfolio primarily comprises senior, secured positions with comparatively low loss history. The secured receivables inthis portfolio are collateralized by a variety of asset classes, including industrial-related facilities and equipment; commercial andresidential real estate; vehicles, aircraft, and equipment used in many industries, including the construction, manufacturing,transportation, telecommunications and healthcare industries. Substantially all of this portfolio is secured.
(64)
Source: GENERAL ELECTRIC CO, 10-Q, November 02, 2009

Losses on financing receivables are recognized when they are incurred, which requires us to make our best estimate of probablelosses inherent in the portfolio. Such estimate requires consideration of historical loss experience, adjusted for current conditions, andjudgments about the probable effects of relevant observable data, including present economic conditions such as delinquency rates,financial health of specific customers and market sectors, collateral values (including housing price indices as applicable), and thepresent and expected future levels of interest rates. Our risk management process includes standards and policies for reviewing majorrisk exposures and concentrations, and evaluates relevant data either for individual loans or financing leases, or on a portfolio basis, asappropriate. Effective January 1, 2009, loans acquired in a business acquisition are recorded at fair value, which incorporates ourestimate at the acquisition date of the credit losses over the remaining life of the portfolio. As a result, the allowance for loan losses isnot carried over at acquisition. This may result in lower reserve coverage ratios prospectively. Financing receivables at Nonearning receivables at Allowance for losses at September 30, December 31, September 30, December 31, September 30, December 31,(In millions) 2009 2008 2009 2008 2009 2008 CLL(a) Americas $ 92,263 $ 105,410 $ 3,471 $ 1,974 $ 1,098 $ 843 Europe 40,383 37,767 1,240 345 500 288 Asia 14,096 16,683 594 306 242 163 Other 776 786 14 2 6 2 Consumer(a) Non-U.S. residential mortgages(b) 61,308 60,753 4,768 3,321 975 383 Non-U.S. installment and revolving credit 25,197 24,441 450 413 1,113 1,051 U.S. installment and revolving credit 22,324 27,645 749 758 1,568 1,700 Non-U.S. auto 14,366 18,168 75 83 301 222 Other 13,191 11,541 477 175 279 226 Real Estate(c) 45,471 46,735 1,320 194 1,028 301 Energy Financial Services 8,362 8,392 360 241 101 58 GECAS 15,046 15,429 211 146 126 60 Other(d) 3,095 4,031 78 38 23 28 Total $ 355,878 $ 377,781 $ 13,807 $ 7,996 $ 7,360 $ 5,325
(a) During the first quarter of 2009, we transferred Artesia from CLL to Consumer. Prior-period amounts were reclassified to conform to the
current-period’s presentation. (b) At September 30, 2009, net of credit insurance, approximately 25% of this portfolio comprised loans with introductory, below market rates that
are scheduled to adjust at future dates; with high loan-to-value ratios at inception; whose terms permitted interest-only payments; or whoseterms resulted in negative amortization. At origination, we underwrite loans with an adjustable rate to the reset value. 83% of these loans arein our U.K. and France portfolios, which comprise mainly loans with interest-only payments and introductory below market rates, have adelinquency rate of 18.4% and have loan-to-value ratio at origination of 74%. At September 30, 2009, 3% (based on dollar values) of theseloans in our U.K. and France portfolios have been restructured.
(c) Financing receivables included $690 million and $731 million of construction loans at September 30, 2009 and December 31, 2008,
respectively. (d) Consisted of loans and financing leases related to certain consolidated, liquidating securitization entities.
(65)
Source: GENERAL ELECTRIC CO, 10-Q, November 02, 2009

Allowance for losses as Allowance for losses as a Nonearning receivables as a a percent of nonearning percent of total financing percent of financing receivables receivables receivables September 30, December 31, September 30, December 31, September 30, December 31, 2009 2008 2009 2008 2009 2008 CLL(a) Americas 3.8 % 1.9 % 31.6 % 42.7 % 1.2 % 0.8 %Europe 3.1 0.9 40.3 83.5 1.2 0.8 Asia 4.2 1.8 40.7 53.3 1.7 1.0 Other 1.8 0.3 42.9 100.0 0.8 0.3 Consumer(a) Non-U.S. residential mortgages 7.8 5.5 20.4 11.5 1.6 0.6 Non-U.S. installment and revolving credit 1.8 1.7 247.3 254.5 4.4 4.3 U.S. installment and revolving credit 3.4 2.7 209.3 224.3 7.0 6.1 Non-U.S. auto 0.5 0.5 401.3 267.5 2.1 1.2 Other 3.6 1.5 58.5 129.1 2.1 2.0 Real Estate 2.9 0.4 77.9 155.2 2.3 0.6 Energy FinancialServices
4.3 2.9 28.1 24.1 1.2 0.7
GECAS 1.4 0.9 59.7 41.1 0.8 0.4 Other 2.5 0.9 29.5 73.7 0.7 0.7 Total 3.9 2.1 53.3 66.6 2.1 1.4
(a) During the first quarter of 2009, we transferred Artesia from CLL to Consumer. Prior-period amounts were reclassified to conform to thecurrent-period’s presentation.
Further information on the determination of the allowance for losses on financing receivables is provided in the Critical AccountingEstimates section in Management’s Discussion and Analysis of Financial Condition and Results of Operations and Note 1 to theconsolidated financial statements in our Annual Report on Form 10-K for the year ended December 31, 2008. The portfolio of financing receivables, before allowance for losses, was $355.9 billion at September 30, 2009, and $377.8 billion atDecember 31, 2008. Financing receivables, before allowance for losses, decreased $21.9 billion from December 31, 2008, primarily asa result of core declines of $43.4 billion mainly from collections exceeding originations ($37.0 billion) (which includes securitization andsales), partially offset by the weaker U.S. dollar ($16.7 billion) and acquisitions ($11.9 billion). Related nonearning receivables totaled $13.8 billion (3.9% of outstanding receivables) at September 30, 2009, compared with $8.0billion (2.1% of outstanding receivables) at December 31, 2008. Nonearning receivables increased from December 31, 2008, primarilyin connection with the challenging global economic environment, increased deterioration in the real estate markets and risingunemployment. The allowance for losses at September 30, 2009, totaled $7.4 billion compared with $5.3 billion at December 31, 2008, representing ourbest estimate of probable losses inherent in the portfolio and reflecting the then current credit and economic environment. Allowance forlosses increased $2.1 billion from December 31, 2008, primarily due to increasing delinquencies and nonearning receivables, reflectingthe continued weakened economic and credit environment.
Source: GENERAL ELECTRIC CO, 10-Q, November 02, 2009

(66)
Source: GENERAL ELECTRIC CO, 10-Q, November 02, 2009

“Impaired” loans in the table below are defined as larger balance or restructured loans for which it is probable that the lender will beunable to collect all amounts due according to original contractual terms of the loan agreement. The vast majority of our consumer anda portion of our CLL nonearning receivables are excluded from this definition, as they represent smaller balance homogenous loansthat we evaluate collectively by portfolio for impairment. Impaired loans include nonearning receivables on larger balance or restructured loans, loans which are currently paying interest underthe cash basis (but are excluded from the nonearning category), and loans paying currently but which have been previouslyrestructured. Specific reserves are recorded for individually impaired loans to the extent we judge principal to be uncollectible. Certain loansclassified as impaired may not require a reserve. In these circumstances, we believe that we will ultimately collect the unpaid balance(through collection or collateral repossession). Further information pertaining to loans classified as impaired and specific reserves is included in the table below. At September 30, December 31,(In millions) 2009 2008 Loans requiring allowance for losses $ 8,842 $ 2,712 Loans expected to be fully recoverable 3,218 871 Total impaired loans $ 12,060 $ 3,583 Allowance for losses (specific reserves) $ 1,874 $ 635 Average investment during the period 7,463 2,064 Interest income earned while impaired(a) 133 48
(a) Recognized principally on cash basis.
Impaired loans increased by $8.5 billion from December 31, 2008 to September 30, 2009 primarily relating to increases at Real Estate($5.4 billion) and CLL ($2.2 billion). Impaired loans increased by $4.0 billion from June 30, 2009 to September 30, 2009, primarilyrelating to increases at Real Estate ($2.9 billion) and CLL ($0.7 billion). The increase in impaired loans and related specific reserves inReal Estate reflects our current estimate of collateral values of the underlying properties, and our estimate of loans which are not pastdue, but for which it is probable that we will be unable to collect the full principal balance at maturity due to a decline in the underlyingvalue of the collateral. Of our $6.2 billion impaired loans at Real Estate at September 30, 2009, approximately $4 billion are currentlypaying in accordance with the contractual terms of the loan. Impaired loans at CLL primarily represent senior secured lending positions. CLL − Americas. Nonearning receivables of $3.5 billion represented 25.1% of total nonearning receivables at September 30, 2009.The ratio of allowance for losses as a percent of nonearning receivables declined from 42.7% at December 31, 2008, to 31.6% atSeptember 30, 2009, primarily from an increase in secured exposures requiring relatively lower specific reserve levels, based upon thestrength of the underlying collateral values. The ratio of nonearning receivables as a percent of financing receivables increased from1.9% at December 31, 2008, to 3.8% at September 30, 2009, primarily from an increase in nonearning receivables in our seniorsecured lending portfolio concentrated in the following industries: media, communications, corporate aircraft, auto, transportation,retail/publishing, inventory finance, and franchise finance.
(67)
Source: GENERAL ELECTRIC CO, 10-Q, November 02, 2009

CLL – Europe. Nonearning receivables of $1.2 billion represented 9.0% of total nonearning receivables at September 30, 2009. Theratio of allowance for losses as a percent of nonearning receivables declined from 83.5% at December 31, 2008, to 40.3% atSeptember 30, 2009, primarily from the increase in nonearning receivables related to the acquisition of Interbanca S.p.A. The ratio ofnonearning receivables as a percent of financing receivables increased from 0.9% at December 31, 2008, to 3.1% at September 30,2009, primarily from the increase in nonearning receivables related to the acquisition of Interbanca S.p.A. and an increase innonearning receivables in secured lending in the automotive industry, partially offset by the effect of the increase in financingreceivables from the acquisition of Interbanca S.p.A. in the first quarter of 2009. Excluding the effects of the Interbanca S.p.A.acquisition, the ratio of allowance for losses as a percent of financing receivables would have been 1.5%. CLL – Asia. Nonearning receivables of $0.6 billion represented 4.3% of total nonearning receivables at September 30, 2009. The ratioof allowance for losses as a percent of nonearning receivables declined from 53.3% at December 31, 2008, to 40.7% at September 30,2009, primarily due to an increase in nonearning receivables in secured exposures which did not require significant specific reservesbased upon the strength of the underlying collateral values. The ratio of nonearning receivables as a percent of financing receivablesincreased from 1.8% at December 31, 2008, to 4.2% at September 30, 2009, primarily from an increase in nonearning receivables atour corporate asset-based, distribution finance and corporate air secured financing businesses in Japan, Australia, New Zealand andIndia and a lower financing receivables balance. Consumer − Non-U.S. residential mortgages. Nonearning receivables of $4.8 billion represented 34.5% of total nonearningreceivables at September 30, 2009. The ratio of allowance for losses as a percent of nonearning receivables increased from 11.5% atDecember 31, 2008, to 20.4% at September 30, 2009. In the first nine months of 2009, our nonearning receivables increased primarilyas a result of the continued decline in the U.K. housing market, partially offset by increased foreclosures. Our non-U.S. mortgageportfolio has a loan-to-value ratio of approximately 75% at origination and the vast majority are first lien positions. Our U.K. and Franceportfolios, which comprise a majority of our total mortgage portfolio, have reindexed loan-to-value ratios of 85% and 67%, respectively.Less than 5% of these loans are without mortgage insurance and have a reindexed loan-to-value equal to or greater than 100%.Loan-to-value information is updated on a quarterly basis for a majority of our loans and considers economic factors such as thehousing price index. At September 30, 2009, we had in repossession stock approximately 2,000 houses in the U.K. which had a valueof approximately $0.3 billion. Consumer − Non-U.S. installment and revolving credit. Nonearning receivables of $0.5 billion represented 3.3% of total nonearningreceivables at September 30, 2009. The ratio of allowance for losses as a percent of nonearning receivables declined from 254.5% atDecember 31, 2008, to 247.3% at September 30, 2009, reflecting the effects of loan repayments and reduced originations. Allowancefor losses as a percent of financing receivables increased from 4.3% at December 31, 2008, to 4.4% at September 30, 2009, asincreases in allowance for losses, driven by the effects of increased delinquencies in Western Europe and Australia, were partiallyoffset by the effects of reclassifying assets into held for sale. Consumer − U.S. installment and revolving credit. Nonearning receivables of $0.7 billion represented 5.4% of total nonearningreceivables at September 30, 2009. The ratio of allowance for losses as a percent of nonearning receivables declined from 224.3% atDecember 31, 2008, to 209.3% at September 30, 2009, as increases in the allowance due to the effects of the continued deteriorationin our U.S. portfolio in connection with rising unemployment were more than offset by the effects of better entry rates and improved latestage collection effectiveness.
(68)
Source: GENERAL ELECTRIC CO, 10-Q, November 02, 2009
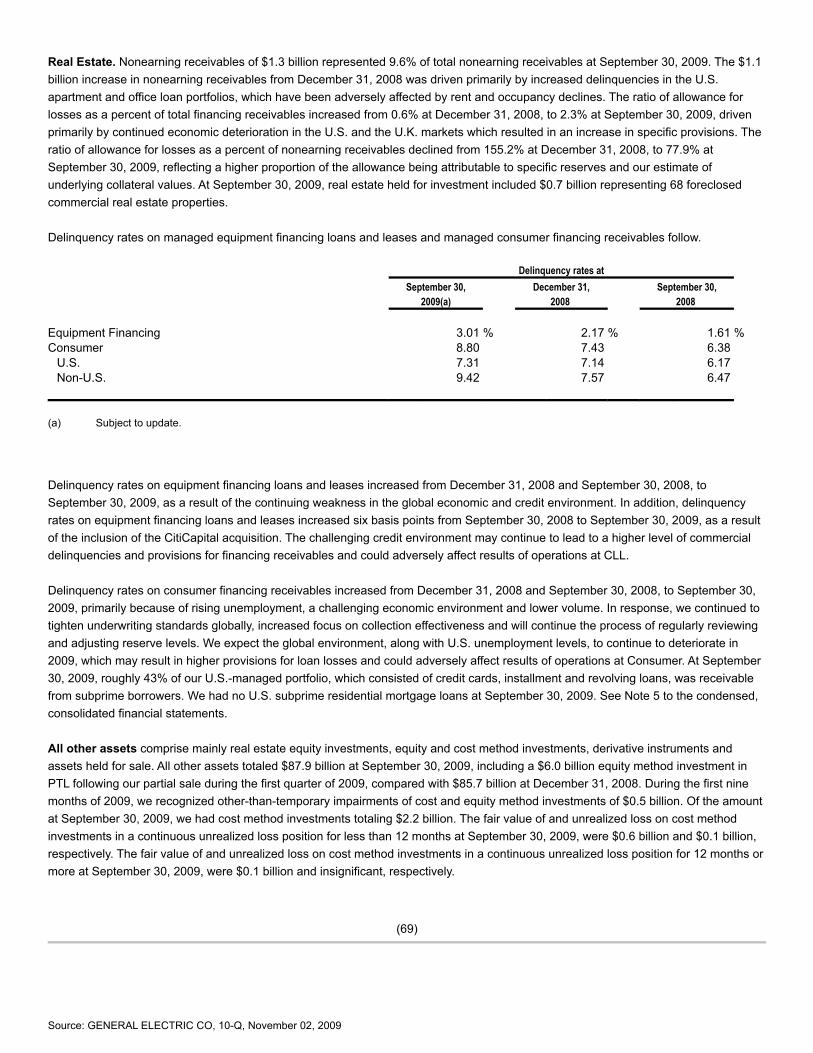
Real Estate. Nonearning receivables of $1.3 billion represented 9.6% of total nonearning receivables at September 30, 2009. The $1.1billion increase in nonearning receivables from December 31, 2008 was driven primarily by increased delinquencies in the U.S.apartment and office loan portfolios, which have been adversely affected by rent and occupancy declines. The ratio of allowance forlosses as a percent of total financing receivables increased from 0.6% at December 31, 2008, to 2.3% at September 30, 2009, drivenprimarily by continued economic deterioration in the U.S. and the U.K. markets which resulted in an increase in specific provisions. Theratio of allowance for losses as a percent of nonearning receivables declined from 155.2% at December 31, 2008, to 77.9% atSeptember 30, 2009, reflecting a higher proportion of the allowance being attributable to specific reserves and our estimate ofunderlying collateral values. At September 30, 2009, real estate held for investment included $0.7 billion representing 68 foreclosedcommercial real estate properties. Delinquency rates on managed equipment financing loans and leases and managed consumer financing receivables follow. Delinquency rates at September 30, December 31, September 30, 2009(a) 2008 2008 Equipment Financing 3.01 % 2.17 % 1.61 %Consumer 8.80 7.43 6.38 U.S. 7.31 7.14 6.17 Non-U.S. 9.42 7.57 6.47
(a) Subject to update.
Delinquency rates on equipment financing loans and leases increased from December 31, 2008 and September 30, 2008, toSeptember 30, 2009, as a result of the continuing weakness in the global economic and credit environment. In addition, delinquencyrates on equipment financing loans and leases increased six basis points from September 30, 2008 to September 30, 2009, as a resultof the inclusion of the CitiCapital acquisition. The challenging credit environment may continue to lead to a higher level of commercialdelinquencies and provisions for financing receivables and could adversely affect results of operations at CLL. Delinquency rates on consumer financing receivables increased from December 31, 2008 and September 30, 2008, to September 30,2009, primarily because of rising unemployment, a challenging economic environment and lower volume. In response, we continued totighten underwriting standards globally, increased focus on collection effectiveness and will continue the process of regularly reviewingand adjusting reserve levels. We expect the global environment, along with U.S. unemployment levels, to continue to deteriorate in2009, which may result in higher provisions for loan losses and could adversely affect results of operations at Consumer. At September30, 2009, roughly 43% of our U.S.-managed portfolio, which consisted of credit cards, installment and revolving loans, was receivablefrom subprime borrowers. We had no U.S. subprime residential mortgage loans at September 30, 2009. See Note 5 to the condensed,consolidated financial statements. All other assets comprise mainly real estate equity investments, equity and cost method investments, derivative instruments andassets held for sale. All other assets totaled $87.9 billion at September 30, 2009, including a $6.0 billion equity method investment inPTL following our partial sale during the first quarter of 2009, compared with $85.7 billion at December 31, 2008. During the first ninemonths of 2009, we recognized other-than-temporary impairments of cost and equity method investments of $0.5 billion. Of the amountat September 30, 2009, we had cost method investments totaling $2.2 billion. The fair value of and unrealized loss on cost methodinvestments in a continuous unrealized loss position for less than 12 months at September 30, 2009, were $0.6 billion and $0.1 billion,respectively. The fair value of and unrealized loss on cost method investments in a continuous unrealized loss position for 12 months ormore at September 30, 2009, were $0.1 billion and insignificant, respectively.
(69)
Source: GENERAL ELECTRIC CO, 10-Q, November 02, 2009

Included in other assets are Real Estate equity investments of $32.9 billion and $32.8 billion at September 30, 2009 and December 31,2008, respectively. Our portfolio is diversified, both geographically and by asset type. However, the global real estate market is subjectto periodic cycles that can cause significant fluctuations in market value. Over the past several months, these markets have beenincreasingly affected by rising unemployment, a slowdown in general business activity and continued challenging conditions in thecredit markets. We expect these markets will continue to be affected while the economic environment remains challenging. We review the estimated values of our real estate investments semi-annually. At December 31, 2008, the carrying value of our RealEstate investments exceeded the estimated value by about $4 billion. For additional information, see page 55 of Management’sDiscussion and Analysis of Financial Condition and Results of Operations in our 2008 Form 10-K. During the second quarter, weupdated our review and determined that the carrying value of our Real Estate investments exceeded estimated value by about $5 billionat June 30, 2009 due to a decline in the Eurozone macroeconomic forecast. Given the current and expected challenging marketconditions, there continues to be risk and uncertainty surrounding commercial real estate values and our unrealized loss on real estateequity properties may continue to increase. Declines in estimated value of real estate below carrying amount result in impairmentlosses when the aggregate undiscounted cash flow estimates used in the estimated value measurement are below the carryingamount. As such, estimated losses in the portfolio will not necessarily result in recognized impairment losses. When we recognize animpairment, the impairment is measured based upon the fair value of the underlying asset which is based upon current market data,including current capitalization rates. During the first nine months of 2009, Real Estate recognized pre-tax impairments of $0.5 billion onits real estate investments, compared with $0.1 billion for the comparable period in 2008. Continued deterioration in economic andmarket conditions may result in further impairments being recognized. D. Liquidity and Borrowings We manage our liquidity to help ensure access to sufficient funding at acceptable costs to meet our business needs and financialobligations throughout business cycles. Our obligations include principal payments on outstanding borrowings, interest on borrowings,purchase obligations for inventory and equipment and general obligations such as collateral deposits held or collateral required to beposted to counterparties, payroll and general expenses. We rely on cash generated through our operating activities as well asunsecured and secured funding sources, including commercial paper, term debt, bank deposits, bank borrowings, securitization andother retail funding products. Sources for payment of our obligations are determined through our annual financial and strategic planning processes. Our 2009 fundingplan anticipates repayment of principal on outstanding short-term borrowings ($194 billion at December 31, 2008) through commercialpaper issuances; long-term debt issuances; collections of financing receivables exceeding originations; cash on hand; and depositfunding and alternative sources of funding. Interest on borrowings is primarily funded through interest earned on existing financing receivables. During the first nine months of2009, we earned interest income on financing receivables of $17.6 billion, which more than offset interest expense of $13.7 billion.Purchase obligations and other general obligations are funded through customer sales revenues (industrial) or collection of principal onour existing portfolio of loans and leases (financial services), cash on hand and operating cash flow. Over the past 18 months, the global credit markets have experienced significant volatility, which has affected both the availability andcost of our funding sources. Throughout this period of volatility, we have been able to continue to meet our funding needs at acceptablecosts and we continue to access the commercial paper markets without interruption.
(70)
Source: GENERAL ELECTRIC CO, 10-Q, November 02, 2009

Recent Liquidity Actions We maintain a strong focus on our liquidity. Recent actions to strengthen and maintain liquidity included:
• Our cash and equivalents were $61.4 billion at September 30, 2009 and committed credit lines were $52.3 billion. We intend tomaintain committed credit lines and cash in excess of GECS commercial paper borrowings going forward;
• GECS commercial paper borrowings were $50 billion at September 30, 2009, compared with $72 billion at December 31, 2008;
• We have completed our funding related to our long-term debt funding target of $45 billion for 2009 and have issued $35
billion of our targeted long-term debt funding for 2010;
• During the first nine months of 2009, we have issued an aggregate of $20.0 billion of long-term debt (including $10.9 billion in thethird quarter) that is not guaranteed under the Federal Deposit Insurance Corporation’s (FDIC) Temporary Liquidity GuaranteeProgram (TLGP);
• At GECS, we are managing collections versus originations to help support liquidity needs. In the first nine months of 2009,
collections have exceeded originations by approximately $37 billion;
• As of September 30, 2009, we had issued notes from our securitization platforms in an aggregate amount of $10.7 billion. $3.8billion of these notes were eligible collateral under the Federal Reserve Bank of New York’s Term Asset-Backed Securities LoanFacility (TALF). Depending on market conditions and terms, we may securitize additional credit card assets, floorplan andequipment receivables, and commercial mortgage loans, including transactions for which investors can access TALF;
• In February 2009, we announced the reduction of the quarterly GE stock dividend by 68% from $0.31 per share to $0.10 per share,
effective with the second quarter dividend, which was payable in the third quarter. This reduction has the effect of saving thecompany approximately $4 billion in the second half of 2009 and will save approximately $9 billion annually thereafter;
• In September 2008, we reduced the GECS dividend to GE and suspended our stock repurchase program. Effective January 2009,
we fully suspended the GECS dividend to GE;
• In October 2008, we raised $15 billion in cash through common and preferred stock offerings and we contributed $15 billion toGECS, including $9.5 billion in the first quarter of 2009 (of which $8.8 billion was further contributed to GE Capital through capitalcontribution and share issuance), in order to improve tangible capital and reduce leverage. We do not anticipate additionalcontributions in 2009; and
• We registered in October 2008 to use the Federal Reserve’s Commercial Paper Funding Facility (CPFF) for up to $98 billion.
Although we do not anticipate further utilization of the CPFF, it remains available until February 1, 2010. Cash and Equivalents Our cash and equivalents were $61.4 billion at September 30, 2009. We anticipate that we will continue to generate cash fromoperating activities in the future, which is available to help meet our liquidity needs. We also generate substantial cash from theprincipal collections of loans and rentals from leased assets, which historically has been invested in asset growth. We have committed, unused credit lines totaling $52.3 billion that had been extended to us by 59 financial institutions at September 30,2009. These lines include $36.6 billion of revolving credit agreements under which we can borrow funds for periods exceeding oneyear. Additionally, $14.1 billion are 364-day lines that contain a term-out feature that allows us to extend borrowings for one year fromthe date of expiration of the lending agreement.
(71)
Source: GENERAL ELECTRIC CO, 10-Q, November 02, 2009

Funding Plan Our 2009 funding plan anticipates approximately $45 billion of senior, unsecured long-term debt issuance, $13.4 billion of which waspre-funded in December 2008. In the first nine months of 2009, we completed issuances of $42.0 billion of long-term debt under theTLGP and $20.0 billion in non-guaranteed senior, unsecured debt with maturities up to 30 years. Subsequent to the end of the thirdquarter, we issued an additional $4.6 billion of long-term debt under the TLGP. We have completed our anticipated 2009 long-term debtfunding plan and have pre-funded $35 billion of our 2010 long-term debt funding target of $35 to $40 billion. Under the TLGP, the FDIC guaranteed certain senior, unsecured debt issued on or before October 31, 2009. Our total senior,unsecured long-term debt issuance under the program was $60 billion (including $4.6 billion issued in October 2009). During the fourth quarter of 2008, GECS issued commercial paper into the CPFF. The last tranche of this commercial paper matured inFebruary 2009. We have incurred $2.3 billion of fees for our participation in the TLGP and CPFF programs through September 30, 2009. These feesare amortized over the terms of the related borrowings. We maintain securitization capability in most of the asset classes we have traditionally securitized. However, in 2008 and 2009 thesecapabilities have been, and continue to be, more limited than in 2007. We have continued to execute new securitizations throughoutthis period using bank administered commercial paper conduits, and more recently have executed new securitizations in both the publicterm markets and in the private markets. In the nine months ended September 30, 2009, we have completed issuances from theseplatforms in an aggregate amount of $10.7 billion. $3.8 billion of these issuances were eligible collateral under TALF. Depending onmarket conditions and terms, we may securitize additional credit card assets, floorplan and equipment receivables, and commercialmortgage loans, including transactions for which investors can access TALF. Total proceeds, including sales to revolving facilities, fromour securitizations were $18.5 billion and $52.7 billion during the three months and nine months ended September 30, 2009,respectively. Comparable amounts for 2008 were $18.8 billion and $61.5 billion, for the three months and nine months, respectively. We have deposit-taking capability at 17 banks outside of the U.S. and two banks in the U.S. – GE Money Bank, Inc., a Federal SavingsBank (FSB), and GE Capital Financial Inc., an industrial bank (IB). The FSB and IB currently issue certificates of deposit (CDs)distributed by brokers in maturity terms from three months to ten years. Bank deposits, which are a large component of our alternativefunding, were $36.8 billion at September 30, 2009, including CDs of $15.2 billion. Total alternative funding decreased from $54.9 billionto $51.9 billion during the first nine months of 2009, primarily resulting from a reduction in bank borrowings and CD balances due to thetiming of asset origination at the banks. This decline was more than offset by collections on financing receivables exceedingoriginations by approximately $37 billion in the first nine months of 2009. As we have been able to continue to successfully access the non-guaranteed debt markets and have completed our anticipated 2009long-term debt funding plan and have pre-funded $35 billion of our 2010 long-term debt funding target of $35 to $40 billion, we currentlyexpect that the expiration of the TLGP will not have a significant effect on our liquidity. If, however, the recent disruption in the creditmarkets were to return or if the challenging market conditions continue, our ability to issue unsecured long-term debt may be affected.In the event we cannot sufficiently access our normal sources of funding as a result of the ongoing credit market turmoil, we have anumber of alternative means to enhance liquidity, including:
(72)
Source: GENERAL ELECTRIC CO, 10-Q, November 02, 2009

• Controlling new originations in GE Capital to reduce capital and funding requirements;
• Using part of our available cash balance;
• Pursuing alternative funding sources, including deposits and asset-backed fundings;
• Using our bank credit lines which, with our cash, we intend to maintain in excess of our outstanding commercial paper;
· Generating additional cash from industrial operations; and
• Contributing additional capital from GE to GE Capital, including from funds retained as a result of the reduction in our dividendannounced in February 2009 or future dividend reductions.
We believe that our existing funds, combined with our alternative means to enhance liquidity, provide us with adequate liquidity tomanage through the current credit cycle. Credit Ratings The major debt rating agencies routinely evaluate our debt. This evaluation is based on a number of factors, which include financialstrength as well as transparency with rating agencies and timeliness of financial reporting. On March 12, 2009, Standard & Poor’s(S&P) downgraded GE and GE Capital’s long-term rating by one notch from “AAA” to “AA+” and, at the same time, revised the outlookfrom negative to stable. Under S&P’s definitions, an obligation rated “AAA” has the highest rating assigned by S&P. The obligor'scapacity to meet its financial commitment on the obligation is extremely strong. An obligation rated “AA” differs from an obligation rated“AAA” only to a small degree in that the obligor's capacity to meet its financial commitment on the obligation is very strong. An S&Prating outlook assesses the potential direction of a long-term credit rating over the intermediate term. In determining a rating outlook,consideration is given to any changes in the economic and/or fundamental business conditions. Stable means that a rating is not likelyto change in the next six months to two years. On March 23, 2009, Moody’s Investors Service (Moody’s) downgraded GE and GE Capital’s long-term rating by two notches from “Aaa”to “Aa2” with a stable outlook and removed us from review for possible downgrade. Under Moody’s definitions, obligations rated “Aaa”are judged to be of the highest quality, with minimal credit risk. Obligations rated “Aa” are judged to be of high quality and are subject tovery low credit risk. The short-term ratings of “A-1+/P-1” were affirmed by both rating agencies at the same time with respect to GE, GE Capital Servicesand GE Capital. We do not believe that the downgrades by S&P and Moody’s have had, or will have, a material impact on our cost of funding or liquidityas the downgrades had been widely anticipated in the market and were already reflected in the spreads on our debt. Ratio of Earnings to Fixed Charges As set forth in Exhibit 99(b) hereto, GE Capital’s ratio of earnings to fixed charges declined to 0.88:1 in the first nine months of 2009due to lower pre-tax earnings at GE Capital which were primarily driven by higher provisions for losses on financing receivables inconnection with the challenging economic environment.
(73)
Source: GENERAL ELECTRIC CO, 10-Q, November 02, 2009

Income Maintenance Agreement On March 28, 1991, GE entered into an agreement with GE Capital to make payments to GE Capital, constituting additions to pre-taxincome under the agreement, to the extent necessary to cause the ratio of earnings to fixed charges of GE Capital and consolidatedaffiliates (determined on a consolidated basis) to be not less than 1.10 for the period, as a single aggregation, of each GE Capital fiscalyear commencing with fiscal year 1991. On October 29, 2009 GE and GE Capital amended this agreement (which is filed as Exhibit 10hereto) to extend the notice period for termination from three years to five years. It was further amended to provide that any futureamendments to the agreement that could adversely affect GE Capital require the consent of the majority of the holders of the aggregateoutstanding principal amount of senior unsecured debt securities issued or guaranteed by GE Capital (with an original stated maturity inexcess of 270 days), unless the amendment does not trigger a downgrade of GE Capital’s long-term ratings. GE made a $9.5 billion capital contribution to GECS in the first quarter of 2009 (of which $8.8 billion was further contributed to GECapital through capital contribution and share issuance) to improve tangible capital and reduce leverage. This payment constitutes anaddition to pre-tax income under the agreement and therefore will increase the ratio of earnings to fixed charges of GE Capital for thefiscal year 2009 for purposes of the agreement. The payment will not affect the ratio of earnings to fixed charges as determined inaccordance with current SEC rules because it does not constitute an addition to pre-tax income under current U.S. GAAP. We do notanticipate additional capital contributions in 2009. Variable Interest Entities and Off-Balance Sheet Arrangements In the first quarter of 2009, we further reduced our investment in PTL by selling a 1% limited partnership interest in PTL, a previouslyconsolidated variable interest entity, to Penske Truck Leasing Corporation, the general partner of PTL, whose majority shareowner is amember of GE’s Board of Directors. The disposition of the shares, coupled with our resulting minority position on the PTL advisory committee and related changes in ourcontractual rights, resulted in the deconsolidation of PTL. We recognized a pre-tax gain on the sale of $296 million, including a gain onthe remeasurement of our retained investment of $189 million. The measurement of the fair value of our retained investment in PTLwas based on a methodology that incorporated both discounted cash flow information and market data. In applying this methodology,we utilized different sources of information, including actual operating results, future business plans, economic projections and marketobservable pricing multiples of similar businesses. The resulting fair value reflected our position as a noncontrolling shareowner at theconclusion of the transaction. As of September 30, 2009, our remaining equity investment in PTL was 49.9% and is accounted forunder the equity method. E. New Accounting Standards On June 12, 2009, the FASB issued amendments to existing standards on accounting for securitizations and consolidation of variableinterest entities (VIEs), which will be effective for us on January 1, 2010. The amendment to securitization accounting will eliminate thequalifying special purpose entity (QSPE) concept, and a corresponding amendment to the consolidation standard will require that allsuch entities be evaluated for consolidation as VIEs, which will likely result in our consolidating substantially all of our former QSPEs.Upon adoption, we will record assets and liabilities of these entities at carrying amounts consistent with what they would have been ifthey had always been consolidated, which will require the reversal of a portion of previously recognized securitization gains as acumulative effect adjustment to retained earnings. Alternatively, we may elect to record all qualifying financial assets and liabilities of aVIE at fair value both on the date of adoption, as an adjustment to retained earnings, and subsequently, through net earnings. Underthe revised guidance and assuming consolidation at carrying amount, at September 30, 2009, we would have recognized an increase inassets of approximately $30 billion and a reduction in equity of approximately $2 billion. The amended guidance on securitizations also modifies existing derecognition criteria in a manner that will significantly narrow thetypes of transactions that will qualify as sales. The revised criteria will apply prospectively to transfers of financial assets occurring afterDecember 31, 2009.
(74)
Source: GENERAL ELECTRIC CO, 10-Q, November 02, 2009

The amended consolidation guidance for VIEs will also replace the existing quantitative approach for identifying who should consolidatea VIE, which was based on who is exposed to a majority of the risks and rewards, with a qualitative approach, based on who has thepower to direct the economically significant activities of the entity. Under the revised guidance, more entities may meet the definition ofa VIE, and the determination about who should consolidate a VIE is required to be evaluated continuously. Upon adoption, assets andliabilities of consolidated VIEs will be recorded in the manner described above for QSPEs. If it is not practicable to determine suchcarrying amounts, assets and liabilities will be measured at their fair values on the date of adoption. We are evaluating all entities thatfall within the scope of the amended guidance to determine whether we may be required to consolidate or deconsolidate additionalentities on January 1, 2010. On September 23, 2009, the FASB issued amendments to existing standards for revenue arrangements with multiple components. Theamendments generally require the allocation of consideration to separate components based on the relative selling price of eachcomponent in a revenue arrangement. The amendments also require certain software enabled products to be accounted for under the general accounting standards formultiple component arrangements as opposed to accounting standards specifically applicable to software arrangements. We intend toadopt the amendments as of January 1, 2010 and, as a result, will apply the guidance prospectively to arrangements entered into ormaterially modified after that date. We are currently evaluating the financial statement impact of adopting these amendments; however,we expect the effect to be insignificant to our financial statements. Item 3. Quantitative and Qualitative Disclosures About Market Risk. There have been no significant changes to our market risk since December 31, 2008. For a discussion of our exposure to market risk,refer to Part II, Item 7A. “Quantitative and Qualitative Disclosures about Market Risk,” contained in our Annual Report on Form 10-K forthe year ended December 31, 2008. Item 4. Controls and Procedures. Under the direction of our Chief Executive Officer and Chief Financial Officer, we evaluated our disclosure controls and procedures andinternal control over financial reporting and concluded that (i) our disclosure controls and procedures were effective as of September30, 2009, and (ii) no change in internal control over financial reporting occurred during the quarter ended September 30, 2009, that hasmaterially affected, or is reasonably likely to materially affect, such internal control over financial reporting. Part II. Other Information Item 1. Legal Proceedings. The following information supplements and amends our discussion set forth under Part I, Item 3 “Legal Proceedings” in our AnnualReport on Form 10-K for the fiscal year ended December 31, 2008. As previously reported, in July and September 2008, shareholders filed two purported class actions under the federal securities laws inthe United States District Court for the District of Connecticut naming us as defendant, as well as our chief executive officer and chieffinancial officer. These two actions have been consolidated and in January 2009, a consolidated complaint was filed alleging that weand our chief executive officer made false and misleading statements that artificially inflated our stock price between March 12, 2008and April 10, 2008, when we announced that our results for the first quarter of 2008 would not meet our previous guidance, and we alsolowered our full year guidance for 2008. The case seeks unspecified damages. Our motion to dismiss the consolidated complaint wasfiled in March 2009 and is currently under consideration by the court. We intend to defend ourselves vigorously.
(75)
Source: GENERAL ELECTRIC CO, 10-Q, November 02, 2009
As previously reported, in October 2008, shareholders filed a purported class action under the federal securities laws in the UnitedStates District Court for the Southern District of New York naming us as defendant, as well as our chief executive officer and chieffinancial officer. The complaint alleges that during a conference call with analysts on September 25, 2008, defendants made false andmisleading statements concerning (i) the state of GE’s funding, cash flows, and liquidity and (ii) the question of issuing additional equity,which caused economic loss to those shareholders who purchased GE stock between September 25, 2008 and October 2, 2008, whenwe announced the pricing of a common stock offering. The case seeks unspecified damages. Our motion to dismiss the complaint wasfiled in April 2009 and is currently under consideration by the court. We intend to defend ourselves vigorously. As previously reported, in March and April 2009, shareholders filed purported class actions under the federal securities laws in theUnited States District Court for the Southern District of New York naming as defendants GE, a number of GE officers (including ourchief executive officer and chief financial officer) and our directors. The complaints, which have now been consolidated, seekunspecified damages based on allegations related to statements regarding the dividend and projected losses and earnings for GECapital in 2009. A shareholder derivative action has been filed in federal court in Connecticut in May 2009 making essentially the sameallegations as the New York class actions. We have moved to consolidate the Connecticut derivative action with the recentlyconsolidated New York class actions. As previously reported, on August 4, 2009, the Company announced that it had reached a settlement with the Securities and ExchangeCommission (SEC) in connection with an SEC investigation previously disclosed in our SEC reports. Consistent with standard SECpractice, we neither admitted nor denied the allegations in the SEC’s complaint. Under the terms of the settlement, the Companyconsented to the entry of a judgment requiring it to pay a civil penalty of $50 million and to comply with the federal securities laws. Thissettlement, which brought the SEC investigation of GE to a close, relates to four accounting matters arising in 2002 - 2003: theapplication of SFAS 133 to GE’s since-discontinued commercial paper hedging program and, separately, to certain swap derivativeswhere fees were paid or received at inception; a change in accounting for profits on spare parts in the commercial aviation enginebusiness; and certain year-end transactions in the Rail business. All of these items were reviewed or discussed with KPMG, whichaudited the Company’s financial statements throughout the periods in question. The Company previously corrected its prior periodfinancial statements for the effect of each of these accounting matters in SEC filings made between May 2005 and February 2008, andno further corrections were required. GE cooperated with the SEC over the course of its investigation, and GE and its Audit Committee conducted their own comprehensivereview in conjunction with the SEC investigation. The Company reviewed and produced approximately 2.9 million pages of e-mails andother documents to the SEC and incurred approximately $200 million in external legal and accounting expenses to ensure that allissues were addressed appropriately. We concluded that it was in the best interests of GE and its shareholders to resolve this matterand put it behind us on the basis described above. GE implemented a number of remedial actions and internal control enhancements, as previously described in its SEC reports, includingmeasures to strengthen our controllership and technical accounting resources and capabilities.
(76)
Source: GENERAL ELECTRIC CO, 10-Q, November 02, 2009
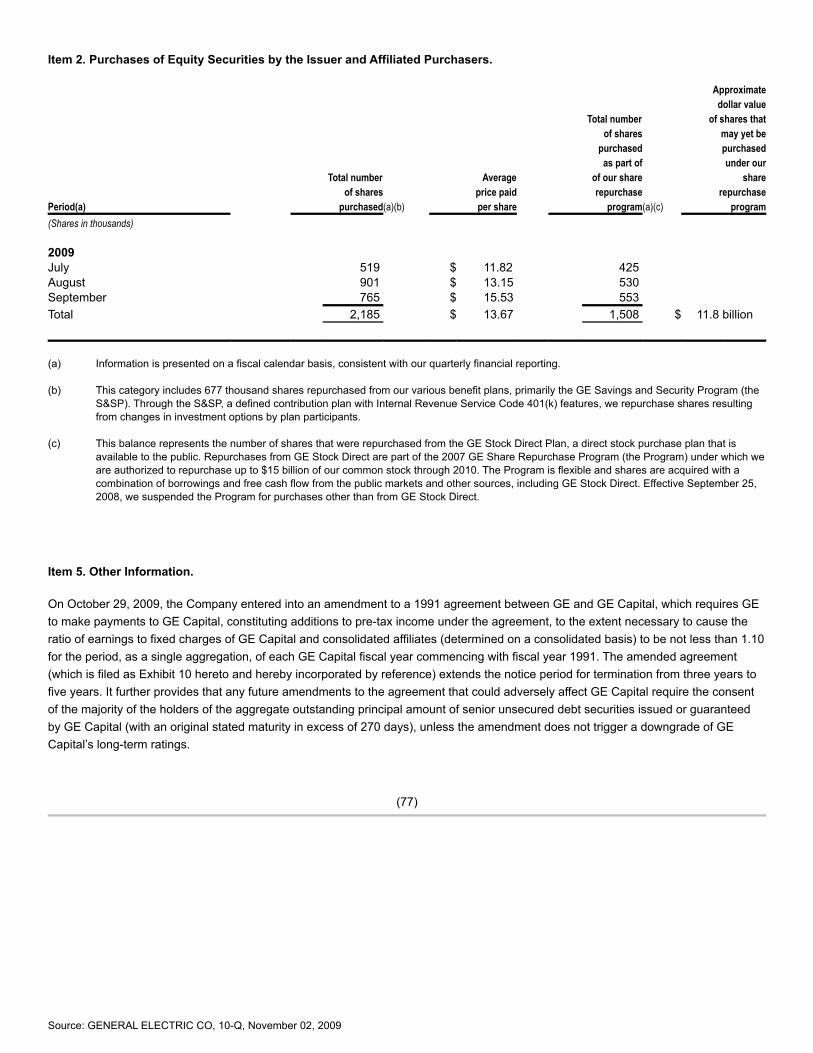
Item 2. Purchases of Equity Securities by the Issuer and Affiliated Purchasers. Approximate dollar value Total number of shares that of shares may yet be purchased purchased as part of under our Total number Average of our share share of shares price paid repurchase repurchasePeriod(a) purchased(a)(b) per share program(a)(c) program(Shares in thousands) 2009 July 519 $ 11.82 425 August 901 $ 13.15 530 September 765 $ 15.53 553 Total 2,185 $ 13.67 1,508 $ 11.8 billion
(a) Information is presented on a fiscal calendar basis, consistent with our quarterly financial reporting. (b) This category includes 677 thousand shares repurchased from our various benefit plans, primarily the GE Savings and Security Program (the
S&SP). Through the S&SP, a defined contribution plan with Internal Revenue Service Code 401(k) features, we repurchase shares resultingfrom changes in investment options by plan participants.
(c) This balance represents the number of shares that were repurchased from the GE Stock Direct Plan, a direct stock purchase plan that is
available to the public. Repurchases from GE Stock Direct are part of the 2007 GE Share Repurchase Program (the Program) under which weare authorized to repurchase up to $15 billion of our common stock through 2010. The Program is flexible and shares are acquired with acombination of borrowings and free cash flow from the public markets and other sources, including GE Stock Direct. Effective September 25,2008, we suspended the Program for purchases other than from GE Stock Direct.
Item 5. Other Information. On October 29, 2009, the Company entered into an amendment to a 1991 agreement between GE and GE Capital, which requires GEto make payments to GE Capital, constituting additions to pre-tax income under the agreement, to the extent necessary to cause theratio of earnings to fixed charges of GE Capital and consolidated affiliates (determined on a consolidated basis) to be not less than 1.10for the period, as a single aggregation, of each GE Capital fiscal year commencing with fiscal year 1991. The amended agreement(which is filed as Exhibit 10 hereto and hereby incorporated by reference) extends the notice period for termination from three years tofive years. It further provides that any future amendments to the agreement that could adversely affect GE Capital require the consentof the majority of the holders of the aggregate outstanding principal amount of senior unsecured debt securities issued or guaranteedby GE Capital (with an original stated maturity in excess of 270 days), unless the amendment does not trigger a downgrade of GECapital’s long-term ratings.
(77)
Source: GENERAL ELECTRIC CO, 10-Q, November 02, 2009

Item 6. Exhibits. Exhibit 10 Amended and Restated Income Maintenance Agreement, dated October 29, 2009, between the Registrant and
General Electric Capital Corporation (Incorporated by reference to Exhibit 10 to General Electric CapitalCorporation’s Quarterly Report on Form 10-Q for the fiscal quarter ended September 30, 2009 (File No.001-06461)).
Exhibit 11 Computation of Per Share Earnings*.Exhibit 12(a) Computation of Ratio of Earnings to Fixed Charges.Exhibit 12(b) Computation of Ratio of Earnings to Combined Fixed Charges and Preferred Stock Dividends.Exhibit 31(a) Certification Pursuant to Rules 13a-14(a) and 15d-14(a) under the Securities Exchange Act of 1934, as
Amended.Exhibit 31(b) Certification Pursuant to Rules 13a-14(a) and 15d-14(a) under the Securities Exchange Act of 1934, as
Amended.Exhibit 32 Certification Pursuant to 18 U.S.C. Section 1350.Exhibit 99(a) Financial Measures That Supplement Generally Accepted Accounting Principles.Exhibit 99(b) Computation of Ratio of Earnings to Fixed Charges (Incorporated by reference to Exhibit 12 to General Electric
Capital Corporation’s Quarterly Report on Form 10-Q for the fiscal quarter ended September 30, 2009 (File No.001-06461)).
* Data required by Financial Accounting Standards Board Accounting Standards Codification 260,Earnings Per Share, is provided in Note 13 to the condensed, consolidated financial statementsin this Report.
(78)
Source: GENERAL ELECTRIC CO, 10-Q, November 02, 2009

Signatures Pursuant to the requirements of the Securities Exchange Act of 1934, the registrant has duly caused this report to be signed on itsbehalf by the undersigned thereunto duly authorized.
General Electric Company
(Registrant)
November 2, 2009 /s/ Jamie S. Miller
Date Jamie S. Miller
Vice President and Controller
Duly Authorized Officer and Principal Accounting Officer
(79)
Source: GENERAL ELECTRIC CO, 10-Q, November 02, 2009

Source: GENERAL ELECTRIC CO, 10-Q, November 02, 2009

Exhibit 12(a)General Electric Company
Computation of Ratio of Earnings to Fixed Charges
Nine months ended September 30, 2009 (Dollars in millions) (Unaudited) General Electric Company and consolidated affiliates Earnings(a) $ 7,606 Plus: Interest and other financial charges included in expense(b) 14,302 One-third of rental expense(c) 437 Adjusted “earnings” $ 22,345 Fixed Charges: Interest and other financial charges included in expense(b) $ 14,302 Interest capitalized 32 One-third of rental expense(c) 437 Total fixed charges $ 14,771 Ratio of earnings to fixed charges 1.51
(a) Earnings before income taxes, noncontrolling interests, discontinued operations and undistributed earnings of equity investees. (b) Included interest on tax deficiencies. (c) Considered to be representative of interest factor in rental expense.
Source: GENERAL ELECTRIC CO, 10-Q, November 02, 2009

Exhibit 12(b)
General Electric Company
Computation of Ratio of Earnings to Combined Fixed Charges and Preferred Stock Dividends
Nine months ended September 30, 2009 (Dollars in millions) (Unaudited) General Electric Company and consolidated affiliates Earnings(a) $ 7,606 Plus: Interest and other financial charges included in expense(b) 14,302 One-third of rental expense(c) 437 Adjusted “earnings” $ 22,345 Fixed charges: Interest and other financial charges included in expense(b) $ 14,302 Interest capitalized 32 One-third of rental expense(c) 437 Total fixed charges $ 14,771 Ratio of earnings to fixed charges 1.51 Preferred stock dividend requirements $ 225 Ratio of earnings before provision for income taxes to earnings from continuing operations 0.93 Preferred stock dividend factor on pre-tax basis $ 209 Fixed charges 14,771 Total fixed charges and preferred stock dividend requirements $ 14,980 Ratio of earnings to combined fixed charges and preferred stock dividends 1.49
(a) Earnings before income taxes, noncontrolling interests, discontinued operations and undistributed earnings of equity investees. (b) Included interest on tax deficiencies. (c) Considered to be representative of interest factor in rental expense.
Source: GENERAL ELECTRIC CO, 10-Q, November 02, 2009

Exhibit 31(a)
Certification Pursuant toRules 13a-14(a) and 15d-14(a) under the Securities Exchange Act of 1934, as Amended
I, Jeffrey R. Immelt, certify that: 1. I have reviewed this quarterly report on Form 10-Q of General Electric Company; 2. Based on my knowledge, this report does not contain any untrue statement of a material fact or omit to state a material fact
necessary to make the statements made, in light of the circumstances under which such statements were made, not misleadingwith respect to the period covered by this report;
3. Based on my knowledge, the financial statements, and other financial information included in this report, fairly present in all
material respects the financial condition, results of operations and cash flows of the registrant as of, and for, the periodspresented in this report;
4. The registrant’s other certifying officer and I are responsible for establishing and maintaining disclosure controls and procedures
(as defined in Exchange Act Rules 13a-15(e) and 15d-15(e)) and internal control over financial reporting (as defined in ExchangeAct Rules 13a-15(f) and 15d-15(f)) for the registrant and have:
a) Designed such disclosure controls and procedures, or caused such disclosure controls and procedures to be
designed under our supervision, to ensure that material information relating to the registrant, including itsconsolidated subsidiaries, is made known to us by others within those entities, particularly during the period in whichthis report is being prepared;
b) Designed such internal control over financial reporting, or caused such internal control over financial reporting to be
designed under our supervision, to provide reasonable assurance regarding the reliability of financial reporting andthe preparation of financial statements for external purposes in accordance with generally accepted accountingprinciples;
c) Evaluated the effectiveness of the registrant’s disclosure controls and procedures and presented in this report our
conclusions about the effectiveness of the disclosure controls and procedures, as of the end of the period covered bythis report based on such evaluation; and
d) Disclosed in this report any change in the registrant’s internal control over financial reporting that occurred during the
registrant’s most recent fiscal quarter that has materially affected, or is reasonably likely to materially affect, theregistrant’s internal control over financial reporting; and
5. The registrant’s other certifying officer and I have disclosed, based on our most recent evaluation of internal control over financial
reporting, to the registrant’s auditors and the audit committee of the registrant’s board of directors: a) All significant deficiencies and material weaknesses in the design or operation of internal control over financial
reporting which are reasonably likely to adversely affect the registrant’s ability to record, process, summarize andreport financial information; and
b) Any fraud, whether or not material, that involves management or other employees who have a significant role in the
registrant’s internal control over financial reporting.
Date: November 2, 2009
/s/ Jeffrey R. Immelt Jeffrey R. Immelt Chief Executive Officer
Source: GENERAL ELECTRIC CO, 10-Q, November 02, 2009

Exhibit 31(b)
Certification Pursuant toRules 13a-14(a) and 15d-14(a) under the Securities Exchange Act of 1934, as Amended
I, Keith S. Sherin, certify that: 1. I have reviewed this quarterly report on Form 10-Q of General Electric Company; 2. Based on my knowledge, this report does not contain any untrue statement of a material fact or omit to state a material fact
necessary to make the statements made, in light of the circumstances under which such statements were made, not misleadingwith respect to the period covered by this report;
3. Based on my knowledge, the financial statements, and other financial information included in this report, fairly present in all
material respects the financial condition, results of operations and cash flows of the registrant as of, and for, the periodspresented in this report;
4. The registrant’s other certifying officer and I are responsible for establishing and maintaining disclosure controls and procedures
(as defined in Exchange Act Rules 13a-15(e) and 15d-15(e)) and internal control over financial reporting (as defined inExchange Act Rules 13a-15(f) and 15d-15(f)) for the registrant and have:
a) Designed such disclosure controls and procedures, or caused such disclosure controls and procedures to be
designed under our supervision, to ensure that material information relating to the registrant, including itsconsolidated subsidiaries, is made known to us by others within those entities, particularly during the period in whichthis report is being prepared;
b) Designed such internal control over financial reporting, or caused such internal control over financial reporting to be
designed under our supervision, to provide reasonable assurance regarding the reliability of financial reporting andthe preparation of financial statements for external purposes in accordance with generally accepted accountingprinciples;
c) Evaluated the effectiveness of the registrant’s disclosure controls and procedures and presented in this report our
conclusions about the effectiveness of the disclosure controls and procedures, as of the end of the period coveredby this report based on such evaluation; and
d) Disclosed in this report any change in the registrant’s internal control over financial reporting that occurred during the
registrant’s most recent fiscal quarter that has materially affected, or is reasonably likely to materially affect, theregistrant’s internal control over financial reporting; and
5. The registrant’s other certifying officer and I have disclosed, based on our most recent evaluation of internal control over
financial reporting, to the registrant’s auditors and the audit committee of the registrant’s board of directors: a) All significant deficiencies and material weaknesses in the design or operation of internal control over financial
reporting which are reasonably likely to adversely affect the registrant’s ability to record, process, summarize andreport financial information; and
b) Any fraud, whether or not material, that involves management or other employees who have a significant role in the
registrant’s internal control over financial reporting.
Date: November 2, 2009
/s/ Keith S. Sherin Keith S. Sherin Chief Financial Officer
Source: GENERAL ELECTRIC CO, 10-Q, November 02, 2009

Exhibit 32
Certification Pursuant to
18 U.S.C. Section 1350
In connection with the Quarterly Report of General Electric Company (the “registrant”) on Form 10-Q for the period ended September30, 2009, as filed with the Securities and Exchange Commission on the date hereof (the “report”), we, Jeffrey R. Immelt and Keith S.Sherin, Chief Executive Officer and Chief Financial Officer, respectively, of the registrant, certify, pursuant to 18 U.S.C. § 1350, that toour knowledge: (1) The report fully complies with the requirements of section 13(a) or 15(d) of the Securities Exchange Act of 1934, as
amended; and(2) The information contained in the report fairly presents, in all material respects, the financial condition and results of
operations of the registrant. November 2, 2009 /s/ Jeffrey R. Immelt
Jeffrey R. Immelt Chief Executive Officer
/s/ Keith S. Sherin
Keith S. Sherin Chief Financial Officer
Source: GENERAL ELECTRIC CO, 10-Q, November 02, 2009

Exhibit 99(a)
General Electric Company
Financial Measures That Supplement Generally Accepted Accounting Principles
We sometimes use information derived from consolidated financial information but not presented in our financial statements prepared inaccordance with U.S. generally accepted accounting principles (GAAP). Certain of these data are considered “non-GAAP financialmeasures” under the U.S. Securities and Exchange Commission rules. Specifically, we have referred to delinquency rates on managedequipment financing loans and leases and managed consumer financing receivables. The reasons we use these non-GAAP financialmeasures and their reconciliation to their most directly comparable GAAP financial measures follow. Delinquency Rates on Certain Financing Receivables Equipment Financing At September 30, December 31, September 30, 2009(a) 2008 2008 Managed 3.01 % 2.17 % 1.61 %Off-book 2.51 1.20 0.92 On-book 3.09 2.34 1.75
Consumer At September 30, December 31, September 30, 2009(a) 2008 2008 Managed 8.80 % 7.43 % 6.38 % U.S. 7.31 7.14 6.17 Non-U.S. 9.42 7.57 6.47 Off-book 6.85 8.24 7.21 U.S. 6.85 8.24 7.21 Non-U.S. (b) (b) (b) On-book 9.12 7.31 6.29 U.S. 7.74 6.39 5.58 Non-U.S. 9.42 7.57 6.47
(a) Subject to update.
(b) Not applicable.
Delinquency rates on on-book and off-book equipment financing loans and leases increased from December 31, 2008 and September30, 2008, to September 30, 2009, as a result of continuing weakness in the global economic and credit environment. In addition,delinquency rates on on-book equipment financing loans and leases increased six basis points from September 30, 2008 to September30, 2009, as a result of the inclusion of the CitiCapital acquisition. The increase in on-book delinquencies for consumer financing receivables in the U.S. from September 30, 2008 and December 31,2008, to September 30, 2009, primarily reflects the continued rise in delinquencies across the U.S. credit card receivables platforms.The increase in on-book delinquencies for consumer financing receivables outside of the U.S. from September 30, 2008 and December31, 2008, to September 30, 2009, reflects the effects of the declining U.K. housing market. The decrease in off-book delinquencies forconsumer financing receivables in the U.S. from September 30, 2008 and December 31, 2008, to September 30, 2009, reflected thereplacement of delinquent accounts in a securitization trust.
Source: GENERAL ELECTRIC CO, 10-Q, November 02, 2009

(1)
Source: GENERAL ELECTRIC CO, 10-Q, November 02, 2009

We believe that delinquency rates on managed financing receivables provide a useful perspective of our portfolio quality and are keyindicators of financial performance. We use this non-GAAP financial measure because it provides information that enablesmanagement and investors to understand the underlying operational performance and trends of certain financing receivables andfacilitates a comparison with the performance of our competitors. The same underwriting standards and ongoing risk monitoring areused for both on-book and off-book portfolios as the customer’s credit performance will affect both loans retained on the CondensedStatement of Financial Position and securitized loans. We believe that managed basis information is useful to management andinvestors, enabling them to understand both the credit risks associated with the loans reported on the Condensed Statement ofFinancial Position and our retained interests in securitized loans.
(2)
Source: GENERAL ELECTRIC CO, 10-Q, November 02, 2009

Source: GENERAL ELECTRIC CO, 10-Q, November 02, 2009

Document Information
Document Information 3 Months Ended 09/30/2009
Document type 10-QDocument period end date 2009-09-30Amendment flag false
Source: GENERAL ELECTRIC CO, 10-Q, November 02, 2009

Entity Information
Entity Information 3 Months Ended 09/30/2009
Entity registrant name General Electric CompanyEntity central index key 0000040545Entity current reporting status YesEntity voluntary filers NoCurrent fiscal year end date --12-31Entity filer category Large Accelerated FilerEntity well known seasoned issuer YesEntity common stock shares outstanding 10,626,842,000Entity public float 124,865,000,000
Source: GENERAL ELECTRIC CO, 10-Q, November 02, 2009

Condensed Statement of Earnings (Unaudited)
Condensed Statement of Earnings(Unaudited) (USD $) (in Millions except Per Share Data) 3 Months Ended 09/30/2009 3 Months Ended 09/30/2008 9 Months Ended 09/30/2009 9 Months Ended 09/30/2008
Revenues Sales of goods 14,627[5] 17,924[5] 44,605[5] 50,092[5]
Sales of services 10,516[5] 11,236[5] 30,743[5] 31,489[5]
Other income 438[2] 544[5] 900[2] 1,693[5]
GECS earnings from continuing operations [5] [5] [5] [5]
GECS revenues from services 12,218[2] 17,530[5] 39,097[2] 53,028[5]
Total revenues 37,799[5] 47,234[5] 115,345[5] 136,302[5]
Costs and expenses Cost of goods sold 11,775[5] 14,184[5] 35,658[5] 39,977[5]
Cost of services sold 6,773[5] 7,953[5] 19,760[5] 20,882[5]
Interest and other financial charges 4,322[5] 6,955[5] 14,302[5] 20,103[5]
Investment contracts, insurance losses and insuranceannuity benefits
732[5] 787[5] 2,257[5] 2,412[5]
Provision for losses on financing receivables 2,868[5] 1,641[5] 8,021[5] 4,453[5]
Other costs and expenses 9,354[5] 10,542[5] 27,624[5] 31,317[5]
Total costs and expenses 35,824[5] 42,062[5] 107,622[5] 119,144[5]
Earnings (loss) from continuing operations beforeincome taxes
1,975[5] 5,172[5] 7,723[5] 17,158[5]
Benefit (provision) for income taxes 484[5] (539)[5] 566[5] (2,434)[5]
Earnings from continuing operations 2,459[5] 4,633[5] 8,289[5] 14,724[5]
Earnings (loss) from discontinued operations, net oftaxes
40[5] (165)[5] (175)[5] (534)[5]
Net earnings 2,499[5] 4,468[5] 8,114[5] 14,190[5]
Less net earnings (loss) attributable to noncontrollinginterests
5[5] 156[5] 102[5] 502[5]
Net earnings attributable to the Company 2,494[5] 4,312[5] 8,012[5] 13,688[5]
Preferred stock dividends declared (75)[5] [5] (225)[5] [5]
Net earnings attributable to GE common shareowners 2,419[5] 4,312[5] 7,787[5] 13,688[5]
Amounts attributable to the Company Earnings from continuing operations 2,454[5] 4,477[5] 8,187[5] 14,222[5]
Earnings (loss) from discontinued operations, net oftaxes
40[5] (165)[5] (175)[5] (534)[5]
Net earnings attributable to the Company 2,494[5] 4,312[5] 8,012[5] 13,688[5]
Earnings from continuing operations Diluted earnings per share 0.22[5] 0.45[5] 0.75[5] 1.42[5]
Basic earnings per share 0.22[5] 0.45[5] 0.75[5] 1.43[5]
Net earnings Diluted earnings per share 0.23[5] 0.43[5] 0.73[5] 1.37[5]
Basic earnings per share 0.23[5] 0.43[5] 0.73[5] 1.37[5]
Dividends declared per share 0.1[5] 0.31[5] 0.51[5] 0.93[5]
SubsidiariesGECSMember Revenues Sales of goods 213 579 691 1,474
Sales of services
Other income
GECS earnings from continuing operations
GECS revenues from services 12,533[2] 17,852 39,969[2] 54,027
Total revenues 12,746 18,431 40,660 55,501
Costs and expenses Cost of goods sold 181 486 569 1,264
Cost of services sold
Interest and other financial charges 4,128 6,723 13,717 19,242
Investment contracts, insurance losses and insuranceannuity benefits
785 839 2,381 2,557
Provision for losses on financing receivables 2,868 1,641 8,021 4,453
Other costs and expenses 5,781 7,093 17,381 20,862
Total costs and expenses 13,743 16,782 42,069 48,378
Source: GENERAL ELECTRIC CO, 10-Q, November 02, 2009

Earnings (loss) from continuing operations beforeincome taxes
(997) 1,649 (1,409) 7,123
Benefit (provision) for income taxes 1,138 457 2,959 301
Earnings from continuing operations 141 2,106 1,550 7,424
Earnings (loss) from discontinued operations, net oftaxes
40 (170) (157) (568)
Net earnings 181 1,936 1,393 6,856
Less net earnings (loss) attributable to noncontrollinginterests
8 96 71 184
Net earnings attributable to the Company 173 1,840 1,322 6,672
Preferred stock dividends declared
Net earnings attributable to GE common shareowners 173 1,840 1,322 6,672
Amounts attributable to the Company Earnings from continuing operations 133 2,010 1,479 7,240
Earnings (loss) from discontinued operations, net oftaxes
40 (170) (157) (568)
Net earnings attributable to the Company 173 1,840 1,322 6,672
SubsidiariesMember Revenues Sales of goods 14,486[1] 17,473[1] 44,000[1] 48,876[1]
Sales of services 10,639[1] 11,395[1] 31,159[1] 32,024[1]
Other income 476[1] 659[1] 1,035[1] 1,984[1]
GECS earnings from continuing operations 133[1] 2,010[1] 1,479[1] 7,240[1]
GECS revenues from services [1] [1] [1] [1]
Total revenues 25,734[1] 31,537[1] 77,673[1] 90,124[1]
Costs and expenses Cost of goods sold 11,666[1] 13,826[1] 35,175[1] 38,971[1]
Cost of services sold 6,897[1] 8,112[1] 20,177[1] 21,417[1]
Interest and other financial charges 352[1] 525[1] 1,076[1] 1,681[1]
Investment contracts, insurance losses and insuranceannuity benefits
[1] [1] [1] [1]
Provision for losses on financing receivables [1] [1] [1] [1]
Other costs and expenses 3,714[1] 3,541[1] 10,634[1] 10,780[1]
Total costs and expenses 22,629[1] 26,004[1] 67,062[1] 72,849[1]
Earnings (loss) from continuing operations beforeincome taxes
3,105[1] 5,533[1] 10,611[1] 17,275[1]
Benefit (provision) for income taxes (654)[1] (996)[1] (2,393)[1] (2,735)[1]
Earnings from continuing operations 2,451[1] 4,537[1] 8,218[1] 14,540[1]
Earnings (loss) from discontinued operations, net oftaxes
40[1] (165)[1] (175)[1] (534)[1]
Net earnings 2,491[1] 4,372[1] 8,043[1] 14,006[1]
Less net earnings (loss) attributable to noncontrollinginterests
(3)[1] 60[1] 31[1] 318[1]
Net earnings attributable to the Company 2,494[1] 4,312[1] 8,012[1] 13,688[1]
Preferred stock dividends declared (75)[1] [1] (225)[1] [1]
Net earnings attributable to GE common shareowners 2,419[1] 4,312[1] 7,787[1] 13,688[1]
Amounts attributable to the Company Earnings from continuing operations 2,454[1] 4,477[1] 8,187[1] 14,222[1]
Earnings (loss) from discontinued operations, net oftaxes
40[1] (165)[1] (175)[1] (534)[1]
Net earnings attributable to the Company 2,494[1] 4,312[1] 8,012[1] 13,688[1]
[5] - See accompanying notes. Separate information is shown for GE and Financial Services (GECS). Transactions between GE and GECS have been eliminated fromthe Consolidated columns.
[2] - See Note 3 for other-than-temporary impairment amounts.
[1] - Represents the adding together of all affiliated companies except General Electric Capital Services, Inc. (GECS or financial services) which is presented on aone-line basis.
Source: GENERAL ELECTRIC CO, 10-Q, November 02, 2009

Condensed Statement of Financial Position (Unaudited)
Condensed Statement of Financial Position(Unaudited) (USD $) (in Millions) 09/30/2009 12/31/2008
Assets Cash and equivalents 61,374[5] 48,187[5]
Investment securities 52,761[5] 41,446[5]
Current receivables 19,613[5] 21,411[5]
Inventories 13,092[5] 13,674[5]
Financing receivables - net 340,688[5] 365,168[5]
Other GECS receivables 14,339[5] 13,439[5]
Property, plant and equipment (including equipment leased to others) -net
72,993[5] 78,530[5]
Investment in GECS [5] [5]
Goodwill 84,880[5] 81,759[5]
Other intangible assets - net 15,010[5] 14,977[5]
All other assets 110,235[5] 106,899[5]
Assets of businesses held for sale 1,263[5] 10,556[5]
Assets of discontinued operations 1,598[5] 1,723[5]
Total assets 787,846[5] 797,769[5]
Liabilities and equity Short-term borrowings 160,115[5] 193,695[5]
Accounts payable, principally trade accounts 18,931[5] 20,819[5]
Progress collections and price adjustments accrued 12,511[5] 12,536[5]
Other GE current liabilities 19,229[5] 21,560[5]
Long-term borrowings 358,092[5] 330,067[5]
Investment contracts, insurance liabilities and insurance annuity benefits 32,549[5] 34,032[5]
All other liabilities 53,708[5] 64,796[5]
Deferred income taxes 5,308[5] 4,584[5]
Liabilities of businesses held for sale 143[5] 636[5]
Liabilities of discontinued operations 1,451[5] 1,432[5]
Total liabilities 662,037[5] 684,157[5]
Preferred stock (30,000 shares outstanding at both September 30, 2009and December 31, 2008)
[5] [5]
Common stock (10,647,495,000 and 10,536,897,000 shares outstandingat September 30, 2009 and December 31, 2008, respectively)
702[5] 702[5]
Accumulated other comprehensive income - net Investment securities (479)[3] (3,094)[3]
Currency translation adjustments 4,043[3] (299)[3]
Cash flow hedges (1,856)[3] (3,332)[3]
Benefit plans (14,469)[3] (15,128)[3]
Other capital 37,861[5] 40,390[5]
Retained earnings 124,530[5] 122,123[5]
Less common stock held in treasury (32,803)[5] (36,697)[5]
Total GE shareowners' equity 117,529[5] 104,665[5]
Noncontrolling interests 8,280[4] 8,947[4]
Total equity 125,809[5] 113,612[5]
Total liabilities and equity 787,846[5] 797,769[5]
SubsidiariesGECSMember Assets Cash and equivalents 56,898 37,486 Investment securities 52,723 41,236 Current receivables Inventories 79 77 Financing receivables - net 348,518 372,456 Other GECS receivables 18,625 18,636 Property, plant and equipment (including equipment leased to others) -net
58,712 64,097
Source: GENERAL ELECTRIC CO, 10-Q, November 02, 2009

Investment in GECS Goodwill 28,184 25,365 Other intangible assets - net 3,838 3,613 All other assets 87,941 85,721 Assets of businesses held for sale 1,263 10,556 Assets of discontinued operations 1,533 1,659 Total assets 658,314 660,902 Liabilities and equity Short-term borrowings 160,938 193,533 Accounts payable, principally trade accounts 12,501 13,882 Progress collections and price adjustments accrued Other GE current liabilities Long-term borrowings 347,415 321,068 Investment contracts, insurance liabilities and insurance annuity benefits 32,948 34,369 All other liabilities 21,021 32,090 Deferred income taxes 9,434 8,533 Liabilities of businesses held for sale 143 636 Liabilities of discontinued operations 1,279 1,243 Total liabilities 585,679 605,354 Preferred stock (30,000 shares outstanding at both September 30, 2009and December 31, 2008)
Common stock (10,647,495,000 and 10,536,897,000 shares outstandingat September 30, 2009 and December 31, 2008, respectively)
1 1
Accumulated other comprehensive income - net Investment securities (478) (3,097) Currency translation adjustments 1,409 (1,258) Cash flow hedges (1,894) (3,134) Benefit plans (374) (367) Other capital 27,578 18,079 Retained earnings 44,416 43,055 Less common stock held in treasury Total GE shareowners' equity 70,658 53,279 Noncontrolling interests 1,977 2,269 Total equity 72,635 55,548 Total liabilities and equity 658,314 660,902 SubsidiariesMember Assets Cash and equivalents 5,207[1] 12,090[1]
Investment securities 40[1] 213[1]
Current receivables 12,872[1] 15,064[1]
Inventories 13,013[1] 13,597[1]
Financing receivables - net [1] [1]
Other GECS receivables [1] [1]
Property, plant and equipment (including equipment leased to others) -net
14,281[1] 14,433[1]
Investment in GECS 70,658[1] 53,279[1]
Goodwill 56,696[1] 56,394[1]
Other intangible assets - net 11,172[1] 11,364[1]
All other assets 23,787[1] 22,435[1]
Assets of businesses held for sale [1] [1]
Assets of discontinued operations 65[1] 64[1]
Total assets 207,791[1] 198,933[1]
Liabilities and equity Short-term borrowings 565[1] 2,375[1]
Accounts payable, principally trade accounts 10,391[1] 11,699[1]
Progress collections and price adjustments accrued 13,232[1] 13,058[1]
Other GE current liabilities 19,229[1] 21,624[1]
Source: GENERAL ELECTRIC CO, 10-Q, November 02, 2009

Long-term borrowings 11,683[1] 9,827[1]
Investment contracts, insurance liabilities and insurance annuity benefits [1] [1]
All other liabilities 32,813[1] 32,767[1]
Deferred income taxes (4,126)[1] (3,949)[1]
Liabilities of businesses held for sale [1] [1]
Liabilities of discontinued operations 172[1] 189[1]
Total liabilities 83,959[1] 87,590[1]
Preferred stock (30,000 shares outstanding at both September 30, 2009and December 31, 2008)
[1] [1]
Common stock (10,647,495,000 and 10,536,897,000 shares outstandingat September 30, 2009 and December 31, 2008, respectively)
702[1] 702[1]
Accumulated other comprehensive income - net Investment securities (479)[1] (3,094)[1]
Currency translation adjustments 4,043[1] (299)[1]
Cash flow hedges (1,856)[1] (3,332)[1]
Benefit plans (14,469)[1] (15,128)[1]
Other capital 37,861[1] 40,390[1]
Retained earnings 124,530[1] 122,123[1]
Less common stock held in treasury (32,803)[1] (36,697)[1]
Total GE shareowners' equity 117,529[1] 104,665[1]
Noncontrolling interests 6,303[1] 6,678[1]
Total equity 123,832[1] 111,343[1]
Total liabilities and equity 207,791[1] 198,933[1]
[5] - See accompanying notes. Separate information is shown for GE and Financial Services (GECS). Transactions between GE and GECS have been eliminated fromthe Consolidated columns.
[3] - The sum of accumulated other comprehensive income
[4] - Included accumulated other comprehensive income attributable to noncontrolling interests of $(83) million and $(194) million at September 30, 2009 andDecember 31, 2008, respectively.
[1] - Represents the adding together of all affiliated companies except General Electric Capital Services, Inc. (GECS or financial services) which is presented on aone-line basis.
Source: GENERAL ELECTRIC CO, 10-Q, November 02, 2009

Condensed Statement of Financial Position (Parenthetical)(Unaudited)
Condensed Statement of Financial Position(Parenthetical)(Unaudited) 09/30/2009 12/31/2008
Preferred stock, shares 30,000 30,000Common stock, shares 10,647,495,000 10,536,897,000
Source: GENERAL ELECTRIC CO, 10-Q, November 02, 2009

Condensed Statement of Cash Flows (Unaudited)
Condensed Statement of Cash Flows(Unaudited) (USD $) (in Millions) 3 Months Ended 09/30/2009 3 Months Ended 09/30/2008 9 Months Ended 09/30/2009 9 Months Ended 09/30/2008
Cash flows - operating activities Net earnings attributable to theCompany
2,494[5] 4,312[5] 8,012[5] 13,688[5]
Loss from discontinued operations (40)[5] 165[5] 175[5] 534[5]
Adjustments to reconcile netearnings attributable to theCompany to cash provided fromoperating activities
Depreciation and amortization ofproperty, plant and equipment
7,893[6] 8,216[6]
Earnings from continuing operationsretained by GECS
[6] [6]
Deferred income taxes 281[6] 1,798[6]
Decrease (increase) in GE currentreceivables
2,181[6] (1,344)[6]
Decrease (increase) in inventories 350[6] (1,765)[6]
Increase (decrease) in accountspayable
(1,355)[6] (411)[6]
Increase (decrease) in GE progresscollections
(194)[6] 3,103[6]
Provision for losses on financingreceivables
2,868[5] 1,641[5] 8,021[5] 4,453[5]
All other operating activities (11,351)[6] (468)[6]
Cash from (used for) operatingactivities - continuing operations
14,013[6] 27,804[6]
Cash from (used for) operatingactivities - discontinued operations
(62)[6] 497[6]
Cash from (used for) operatingactivities
13,951[6] 28,301[6]
Cash flows - investing activities Additions to property, plant andequipment
(5,808)[6] (11,484)[6]
Dispositions of property, plant andequipment
3,689[6] 7,286[6]
Net decrease (increase) in GECSfinancing receivables
37,117[6] (26,898)[6]
Proceeds from sales of discontinuedoperations
[6] 5,423[6]
Proceeds from principal businessdispositions
9,676[6] 4,480[6]
Payments for principal businessespurchased
(5,994)[6] (27,042)[6]
Capital contribution from GE toGECS
[6] [6]
All other investing activities (3,938)[6] (3,283)[6]
Cash from (used for) investingactivities - continuing operations
34,742[6] (51,518)[6]
Cash from (used for) investingactivities - discontinued operations
66[6] (616)[6]
Cash from (used for) investingactivities
34,808[6] (52,134)[6]
Cash flows - financing activities Net increase (decrease) inborrowings (maturities of 90 days orless)
(32,788)[6] (18,298)[6]
Newly issued debt (maturities longerthan 90 days)
73,898[6] 99,373[6]
Repayments and other reductions(maturities longer than 90 days)
(67,007)[6] (45,055)[6]
Net dispositions (purchases) of GEshares for treasury
498[6] (1,678)[6]
Dividends paid to shareowners (7,845)[6] (9,308)[6]
Source: GENERAL ELECTRIC CO, 10-Q, November 02, 2009
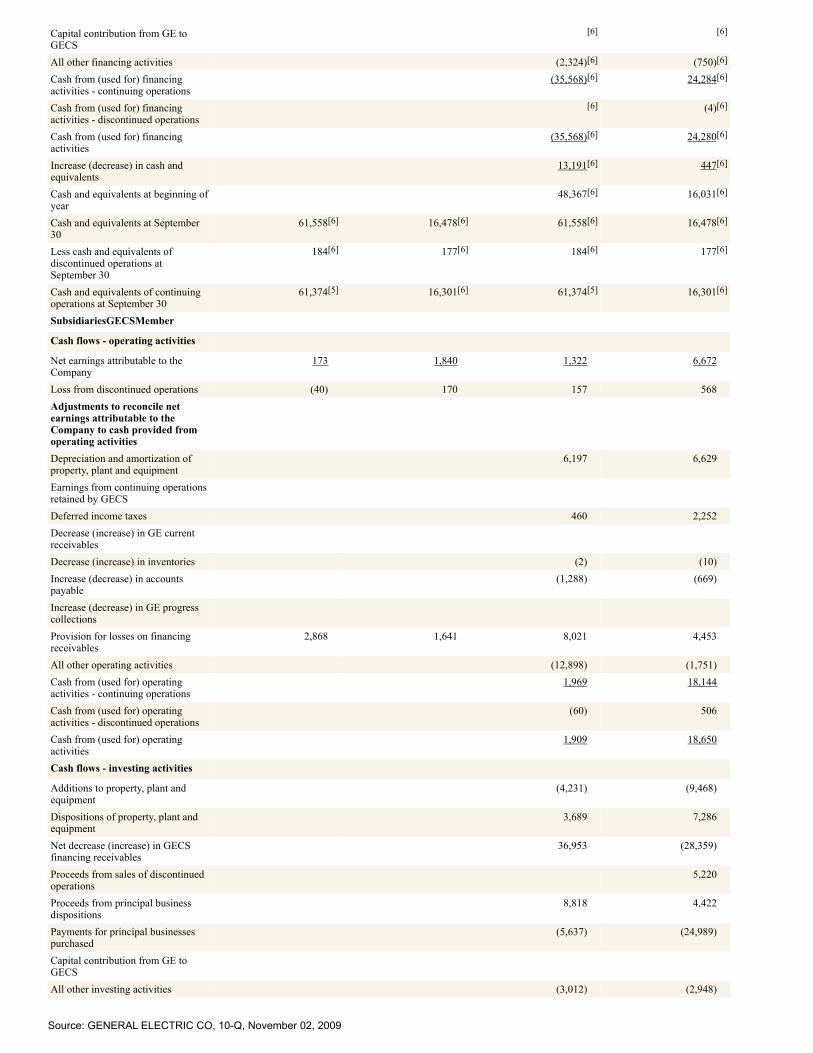
Capital contribution from GE toGECS
[6] [6]
All other financing activities (2,324)[6] (750)[6]
Cash from (used for) financingactivities - continuing operations
(35,568)[6] 24,284[6]
Cash from (used for) financingactivities - discontinued operations
[6] (4)[6]
Cash from (used for) financingactivities
(35,568)[6] 24,280[6]
Increase (decrease) in cash andequivalents
13,191[6] 447[6]
Cash and equivalents at beginning ofyear
48,367[6] 16,031[6]
Cash and equivalents at September30
61,558[6] 16,478[6] 61,558[6] 16,478[6]
Less cash and equivalents ofdiscontinued operations atSeptember 30
184[6] 177[6] 184[6] 177[6]
Cash and equivalents of continuingoperations at September 30
61,374[5] 16,301[6] 61,374[5] 16,301[6]
SubsidiariesGECSMember Cash flows - operating activities Net earnings attributable to theCompany
173 1,840 1,322 6,672
Loss from discontinued operations (40) 170 157 568 Adjustments to reconcile netearnings attributable to theCompany to cash provided fromoperating activities
Depreciation and amortization ofproperty, plant and equipment
6,197 6,629
Earnings from continuing operationsretained by GECS
Deferred income taxes 460 2,252 Decrease (increase) in GE currentreceivables
Decrease (increase) in inventories (2) (10) Increase (decrease) in accountspayable
(1,288) (669)
Increase (decrease) in GE progresscollections
Provision for losses on financingreceivables
2,868 1,641 8,021 4,453
All other operating activities (12,898) (1,751) Cash from (used for) operatingactivities - continuing operations
1,969 18,144
Cash from (used for) operatingactivities - discontinued operations
(60) 506
Cash from (used for) operatingactivities
1,909 18,650
Cash flows - investing activities Additions to property, plant andequipment
(4,231) (9,468)
Dispositions of property, plant andequipment
3,689 7,286
Net decrease (increase) in GECSfinancing receivables
36,953 (28,359)
Proceeds from sales of discontinuedoperations
5,220
Proceeds from principal businessdispositions
8,818 4,422
Payments for principal businessespurchased
(5,637) (24,989)
Capital contribution from GE toGECS
All other investing activities (3,012) (2,948)
Source: GENERAL ELECTRIC CO, 10-Q, November 02, 2009
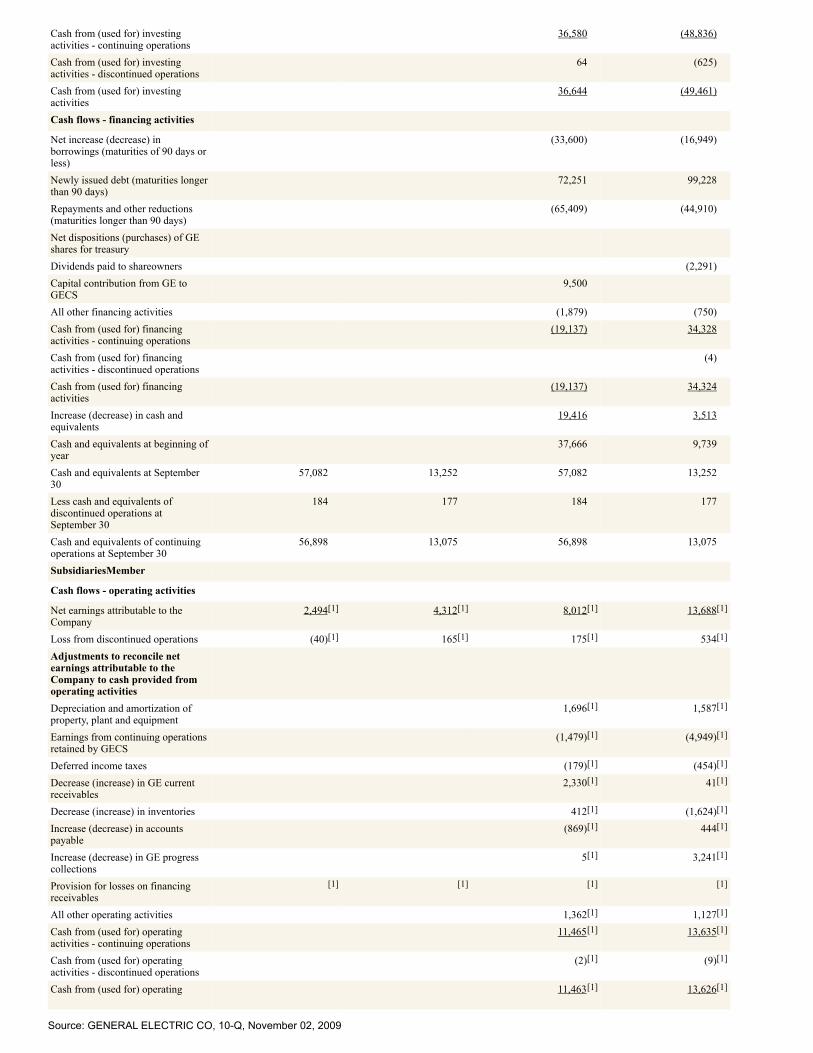
Cash from (used for) investingactivities - continuing operations
36,580 (48,836)
Cash from (used for) investingactivities - discontinued operations
64 (625)
Cash from (used for) investingactivities
36,644 (49,461)
Cash flows - financing activities Net increase (decrease) inborrowings (maturities of 90 days orless)
(33,600) (16,949)
Newly issued debt (maturities longerthan 90 days)
72,251 99,228
Repayments and other reductions(maturities longer than 90 days)
(65,409) (44,910)
Net dispositions (purchases) of GEshares for treasury
Dividends paid to shareowners (2,291) Capital contribution from GE toGECS
9,500
All other financing activities (1,879) (750) Cash from (used for) financingactivities - continuing operations
(19,137) 34,328
Cash from (used for) financingactivities - discontinued operations
(4)
Cash from (used for) financingactivities
(19,137) 34,324
Increase (decrease) in cash andequivalents
19,416 3,513
Cash and equivalents at beginning ofyear
37,666 9,739
Cash and equivalents at September30
57,082 13,252 57,082 13,252
Less cash and equivalents ofdiscontinued operations atSeptember 30
184 177 184 177
Cash and equivalents of continuingoperations at September 30
56,898 13,075 56,898 13,075
SubsidiariesMember Cash flows - operating activities Net earnings attributable to theCompany
2,494[1] 4,312[1] 8,012[1] 13,688[1]
Loss from discontinued operations (40)[1] 165[1] 175[1] 534[1]
Adjustments to reconcile netearnings attributable to theCompany to cash provided fromoperating activities
Depreciation and amortization ofproperty, plant and equipment
1,696[1] 1,587[1]
Earnings from continuing operationsretained by GECS
(1,479)[1] (4,949)[1]
Deferred income taxes (179)[1] (454)[1]
Decrease (increase) in GE currentreceivables
2,330[1] 41[1]
Decrease (increase) in inventories 412[1] (1,624)[1]
Increase (decrease) in accountspayable
(869)[1] 444[1]
Increase (decrease) in GE progresscollections
5[1] 3,241[1]
Provision for losses on financingreceivables
[1] [1] [1] [1]
All other operating activities 1,362[1] 1,127[1]
Cash from (used for) operatingactivities - continuing operations
11,465[1] 13,635[1]
Cash from (used for) operatingactivities - discontinued operations
(2)[1] (9)[1]
Cash from (used for) operating 11,463[1] 13,626[1]
Source: GENERAL ELECTRIC CO, 10-Q, November 02, 2009
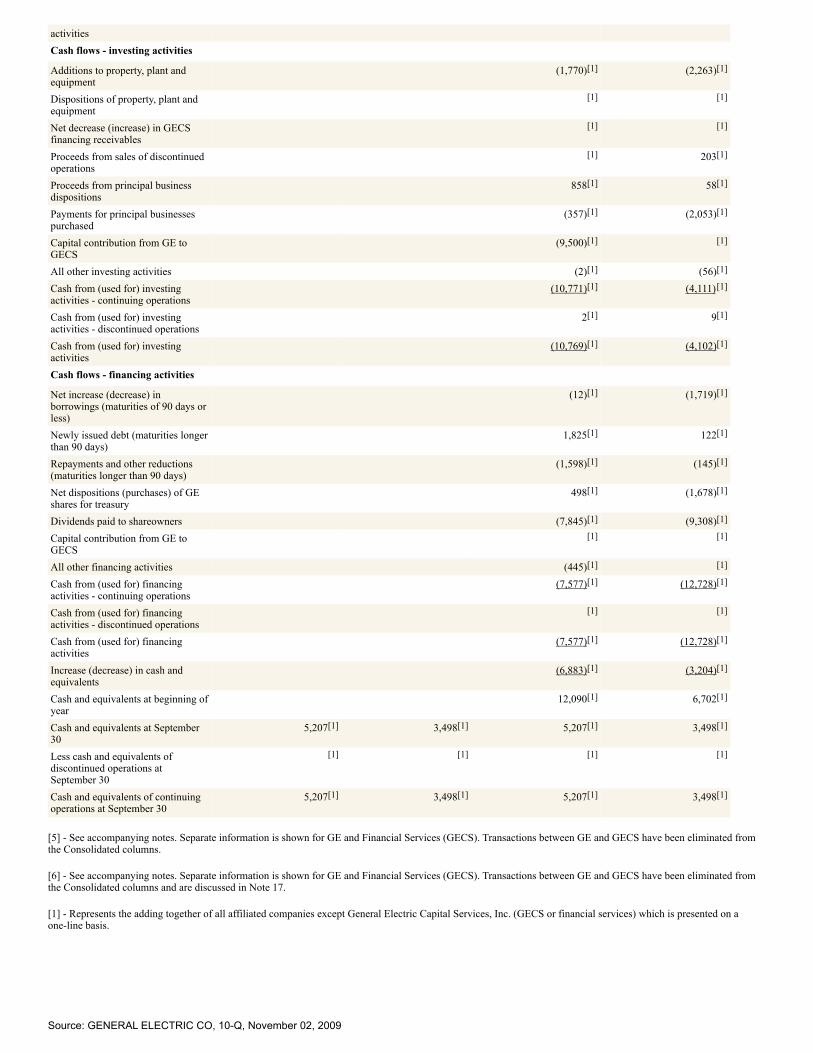
activitiesCash flows - investing activities Additions to property, plant andequipment
(1,770)[1] (2,263)[1]
Dispositions of property, plant andequipment
[1] [1]
Net decrease (increase) in GECSfinancing receivables
[1] [1]
Proceeds from sales of discontinuedoperations
[1] 203[1]
Proceeds from principal businessdispositions
858[1] 58[1]
Payments for principal businessespurchased
(357)[1] (2,053)[1]
Capital contribution from GE toGECS
(9,500)[1] [1]
All other investing activities (2)[1] (56)[1]
Cash from (used for) investingactivities - continuing operations
(10,771)[1] (4,111)[1]
Cash from (used for) investingactivities - discontinued operations
2[1] 9[1]
Cash from (used for) investingactivities
(10,769)[1] (4,102)[1]
Cash flows - financing activities Net increase (decrease) inborrowings (maturities of 90 days orless)
(12)[1] (1,719)[1]
Newly issued debt (maturities longerthan 90 days)
1,825[1] 122[1]
Repayments and other reductions(maturities longer than 90 days)
(1,598)[1] (145)[1]
Net dispositions (purchases) of GEshares for treasury
498[1] (1,678)[1]
Dividends paid to shareowners (7,845)[1] (9,308)[1]
Capital contribution from GE toGECS
[1] [1]
All other financing activities (445)[1] [1]
Cash from (used for) financingactivities - continuing operations
(7,577)[1] (12,728)[1]
Cash from (used for) financingactivities - discontinued operations
[1] [1]
Cash from (used for) financingactivities
(7,577)[1] (12,728)[1]
Increase (decrease) in cash andequivalents
(6,883)[1] (3,204)[1]
Cash and equivalents at beginning ofyear
12,090[1] 6,702[1]
Cash and equivalents at September30
5,207[1] 3,498[1] 5,207[1] 3,498[1]
Less cash and equivalents ofdiscontinued operations atSeptember 30
[1] [1] [1] [1]
Cash and equivalents of continuingoperations at September 30
5,207[1] 3,498[1] 5,207[1] 3,498[1]
[5] - See accompanying notes. Separate information is shown for GE and Financial Services (GECS). Transactions between GE and GECS have been eliminated fromthe Consolidated columns.
[6] - See accompanying notes. Separate information is shown for GE and Financial Services (GECS). Transactions between GE and GECS have been eliminated fromthe Consolidated columns and are discussed in Note 17.
[1] - Represents the adding together of all affiliated companies except General Electric Capital Services, Inc. (GECS or financial services) which is presented on aone-line basis.
Source: GENERAL ELECTRIC CO, 10-Q, November 02, 2009
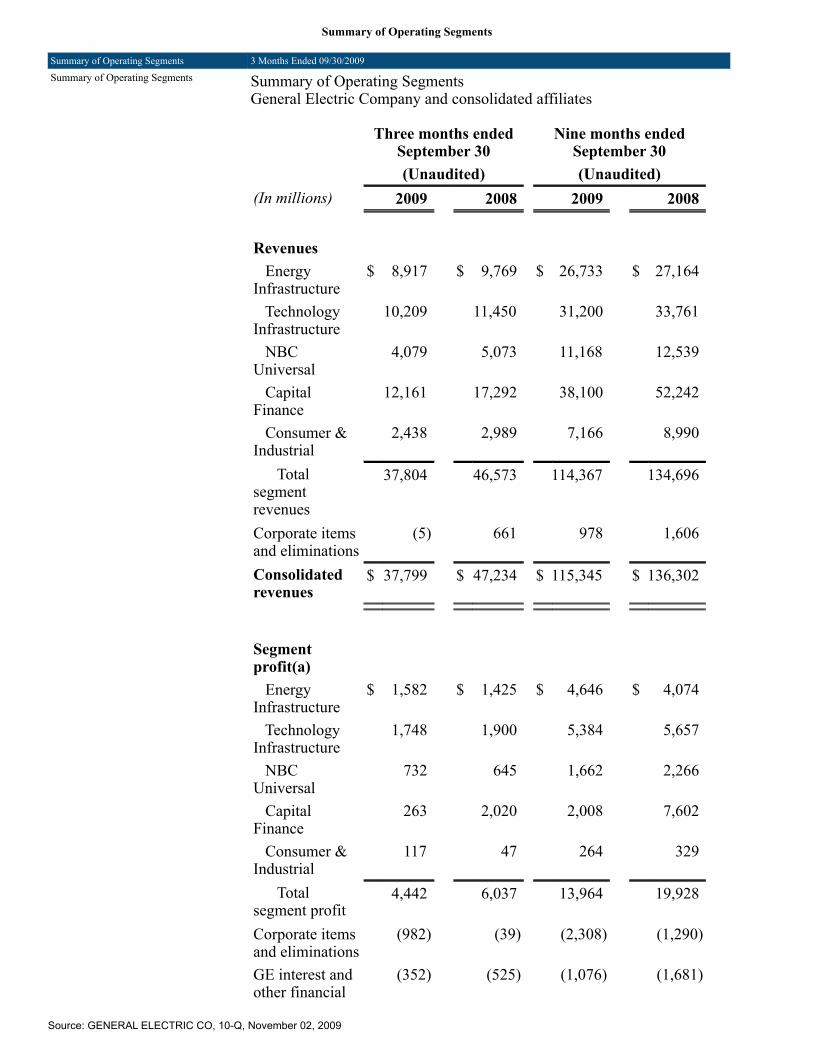
Summary of Operating Segments
Summary of Operating Segments 3 Months Ended 09/30/2009
Summary of Operating Segments Summary of Operating SegmentsGeneral Electric Company and consolidated affiliates
Three months endedSeptember 30
Nine months endedSeptember 30
(Unaudited) (Unaudited)(In millions) 2009 2008 2009 2008 Revenues EnergyInfrastructure
$ 8,917 $ 9,769 $ 26,733 $ 27,164
TechnologyInfrastructure
10,209 11,450 31,200 33,761
NBCUniversal
4,079 5,073 11,168 12,539
CapitalFinance
12,161 17,292 38,100 52,242
Consumer &Industrial
2,438 2,989 7,166 8,990
Totalsegmentrevenues
37,804 46,573 114,367 134,696
Corporate itemsand eliminations
(5) 661 978 1,606
Consolidatedrevenues
$ 37,799 $ 47,234 $ 115,345 $ 136,302
Segmentprofit(a)
EnergyInfrastructure
$ 1,582 $ 1,425 $ 4,646 $ 4,074
TechnologyInfrastructure
1,748 1,900 5,384 5,657
NBCUniversal
732 645 1,662 2,266
CapitalFinance
263 2,020 2,008 7,602
Consumer &Industrial
117 47 264 329
Totalsegment profit
4,442 6,037 13,964 19,928
Corporate itemsand eliminations
(982) (39) (2,308) (1,290)
GE interest andother financial
(352) (525) (1,076) (1,681)
Source: GENERAL ELECTRIC CO, 10-Q, November 02, 2009

chargesGE provisionfor income taxes
(654) (996) (2,393) (2,735)
Earnings fromcontinuingoperationsattributable
to theCompany
2,454 4,477 8,187 14,222
Earnings (loss)fromdiscontinuedoperations,
net of taxes,attributable tothe Company
40 (165) (175) (534)
Consolidatednet earningsattributable to
the Company $ 2,494 $ 4,312 $ 8,012 $ 13,688
(a) Segment profit always excludes the effects of principal pensionplans, results reported as discontinued operations, earnings attributable tononcontrolling interests of consolidated subsidiaries and accountingchanges, and may exclude matters such as charges for restructuring;rationalization and other similar expenses; in-process research anddevelopment and certain other acquisition-related charges and balances;technology and product development costs; certain gains and losses fromacquisitions or dispositions; and litigation settlements or other charges,responsibility for which preceded the current management team. Segmentprofit excludes or includes interest and other financial charges and incometaxes according to how a particular segment’s management is measured –excluded in determining segment profit, which we sometimes refer to as“operating profit,” for Energy Infrastructure, Technology Infrastructure,NBC Universal and Consumer & Industrial; included in determiningsegment profit, which we sometimes refer to as “net earnings,” for CapitalFinance.See accompanying notes to condensed, consolidated financial statements.
Source: GENERAL ELECTRIC CO, 10-Q, November 02, 2009

Note 1 Summary of Significant Accounting Policies
Note 1 Summary of Significant Accounting Policies 3 Months Ended 09/30/2009
SUMMARY OF SIGNIFICANT ACCOUNTING POLICIES Notes to Condensed, Consolidated FinancialStatements (Unaudited)1. Summary of Significant Accounting PoliciesThe accompanying condensed, consolidatedfinancial statements represent the consolidationof General Electric Company and all companiesthat we directly or indirectly control, eitherthrough majority ownership or otherwise. SeeNote 1 to the consolidated financial statementsin our Annual Report on Form 10-K for theyear ended December 31, 2008 (2008 Form10-K), which discusses our consolidation andfinancial statement presentation. As used in thisreport on Form 10-Q (Report) and in ourAnnual Report on Form 10-K, “GE” representsthe adding together of all affiliated companiesexcept General Electric Capital Services, Inc.(GECS or financial services), which ispresented on a one-line basis; GECS consists ofGeneral Electric Capital Services, Inc. and allof its affiliates; and “Consolidated” representsthe adding together of GE and GECS with theeffects of transactions between the twoeliminated. GE includes Energy Infrastructure,Technology Infrastructure, NBC Universal andConsumer & Industrial. GECS includes CapitalFinance. We have reclassified certainprior-period amounts to conform to thecurrent-period’s presentation. Unless otherwiseindicated, information in these notes tocondensed, consolidated financial statementsrelates to continuing operations.
Accounting ChangesThe Financial Accounting Standards Board(FASB) issued FASB Accounting StandardsCodification (ASC) effective for financialstatements issued for interim and annual periodsending after September 15, 2009. The ASC isan aggregation of previously issuedauthoritative U.S. generally acceptedaccounting principles (GAAP) in onecomprehensive set of guidance organized bysubject area. In accordance with the ASC,references to previously issued accountingstandards have been replaced by ASCreferences. Subsequent revisions to GAAP willbe incorporated into the ASC throughAccounting Standards Updates (ASU).We adopted FASB ASC 820, Fair ValueMeasurements and Disclosures, in two steps;effective January 1, 2008, we adopted it for allfinancial instruments and non-financial
Source: GENERAL ELECTRIC CO, 10-Q, November 02, 2009
instruments accounted for at fair value on arecurring basis and effective January 1, 2009,for all non-financial instruments accounted forat fair value on a non-recurring basis. Thisguidance establishes a new framework formeasuring fair value and expands relateddisclosures. See Note 14.On January 1, 2009, we adopted an amendmentto FASB ASC 805, Business Combinations.This amendment significantly changed theaccounting for business acquisitions bothduring the period of the acquisition and insubsequent periods. Among the moresignificant changes in the accounting foracquisitions are the following:
Acquired in-process research anddevelopment (IPR&D) is accounted foras an asset, with the cost recognized asthe research and development is realizedor abandoned. IPR&D was previouslyexpensed at the time of the acquisition.
•
Contingent consideration is recorded atfair value as an element of purchaseprice with subsequent adjustmentsrecognized in operations. Contingentconsideration was previously accountedfor as a subsequent adjustment ofpurchase price.
•
Subsequent decreases in valuationallowances on acquired deferred taxassets are recognized in operations afterthe measurement period. Such changeswere previously considered to besubsequent changes in consideration andwere recorded as decreases in goodwill.
•
Transaction costs are expensed. Thesecosts were previously treated as costs ofthe acquisition.
•
In April 2009, the FASB amended FASB ASC805 and changed the previous accounting forassets and liabilities arising from contingenciesin a business combination. We adopted thisamendment retrospectively effective January 1,2009. The amendment requires pre-acquisitioncontingencies to be recognized at fair value, iffair value can be determined or reasonablyestimated during the measurement period. Iffair value cannot be determined or reasonablyestimated, the standard requires measurementbased on the recognition and measurementcriteria of FASB ASC 450, Contingencies.On January 1, 2009, we adopted an amendmentto FASB ASC 810, Consolidation, which
Source: GENERAL ELECTRIC CO, 10-Q, November 02, 2009
requires us to make certain changes to thepresentation of our financial statements. Thisamendment requires us to classifynoncontrolling interests (previously referred toas “minority interest”) as part of consolidatednet earnings ($5 million and $156 million forthe three months ended September 30, 2009 and2008, respectively, and $102 million and $502million for the nine months ended September30, 2009 and 2008, respectively) and to includethe accumulated amount of noncontrollinginterests as part of shareowners' equity ($8,280million and $8,947 million at September 30,2009 and December 31, 2008, respectively).The net earnings amounts we have previouslyreported are now presented as "Net earningsattributable to the Company" and, as required,earnings per share continues to reflect amountsattributable only to the Company. Similarly, inour presentation of shareowners’ equity, wedistinguish between equity amounts attributableto GE shareowners and amounts attributable tothe noncontrolling interests – previouslyclassified as minority interest outside ofshareowners’ equity. Beginning January 1,2009, dividends to noncontrolling interests areclassified as financing cash flows. In addition tothese financial reporting changes, this guidanceprovides for significant changes in accountingrelated to noncontrolling interests; specifically,increases and decreases in our controllingfinancial interests in consolidated subsidiarieswill be reported in equity similar to treasurystock transactions. If a change in ownership of aconsolidated subsidiary results in loss of controland deconsolidation, any retained ownershipinterests are remeasured with the gain or lossreported in net earnings.Effective January 1, 2009, we adopted FASBASC 808, Collaborative Arrangements, whichrequires gross basis presentation of revenuesand expenses for principal participants incollaborative arrangements. Our TechnologyInfrastructure and Energy Infrastructuresegments enter into collaborative arrangementswith manufacturers and suppliers ofcomponents used to build and maintain certainengines, aero-derivatives, and turbines, underwhich GE and these participants share in risksand rewards of these product programs.Adoption of the standard had no effect as ourhistorical presentation had been consistent withthe new requirements.Effective April 1, 2009, the FASB amendedASC 820 in relation to determining fair value
Source: GENERAL ELECTRIC CO, 10-Q, November 02, 2009

when the volume and level of activity for anasset or liability have significantly decreasedand identifying transactions that are not orderly.Adoption of this amendment had aninsignificant effect on our financial statements.Effective April 1, 2009, the FASB amendedASC 320, Investments – Debt and EquitySecurities. See Note 3. This amendmentmodified the existing model for recognition andmeasurement of impairment for debt securities.The two principal changes to the impairmentmodel for securities are as follows:
Recognition of an other-than-temporaryimpairment charge for debt securities isrequired if any of these conditions aremet: (1) we do not expect to recover theentire amortized cost basis of thesecurity, (2) we intend to sell thesecurity or (3) it is more likely than notthat we will be required to sell thesecurity before we recover its amortizedcost basis.
•
If the first condition above is met, butwe do not intend to sell and it is notmore likely than not that we will berequired to sell the security beforerecovery of its amortized cost basis, wewould be required to record thedifference between the security’samortized cost basis and its recoverableamount in earnings and the differencebetween the security’s recoverableamount and fair value in othercomprehensive income. If either thesecond or third criteria are met, then wewould be required to recognize theentire difference between the security’samortized cost basis and its fair value inearnings.
•
Interim Period PresentationThe condensed, consolidated financialstatements and notes thereto are unaudited.These statements include all adjustments(consisting of normal recurring accruals) thatwe considered necessary to present a fairstatement of our results of operations, financialposition and cash flows. We have evaluatedsubsequent events that have occurred throughNovember 2, 2009, the date of financialstatement issuance. The results reported in thesecondensed, consolidated financial statementsshould not be regarded as necessarily indicativeof results that may be expected for the entire
Source: GENERAL ELECTRIC CO, 10-Q, November 02, 2009

year. It is suggested that these condensed,consolidated financial statements be read inconjunction with the financial statements andnotes thereto included in our 2008 Form 10-K.We label our quarterly information using acalendar convention, that is, first quarter islabeled as ending on March 31, second quarteras ending on June 30, and third quarter asending on September 30. It is our longstandingpractice to establish interim quarterly closingdates using a fiscal calendar, which requires ourbusinesses to close their books on either aSaturday or Sunday, depending on the business.The effects of this practice are modest and onlyexist within a reporting year. The fiscal closingcalendar from 1993 through 2013 is availableon our website, www.ge.com/secreports.
Source: GENERAL ELECTRIC CO, 10-Q, November 02, 2009
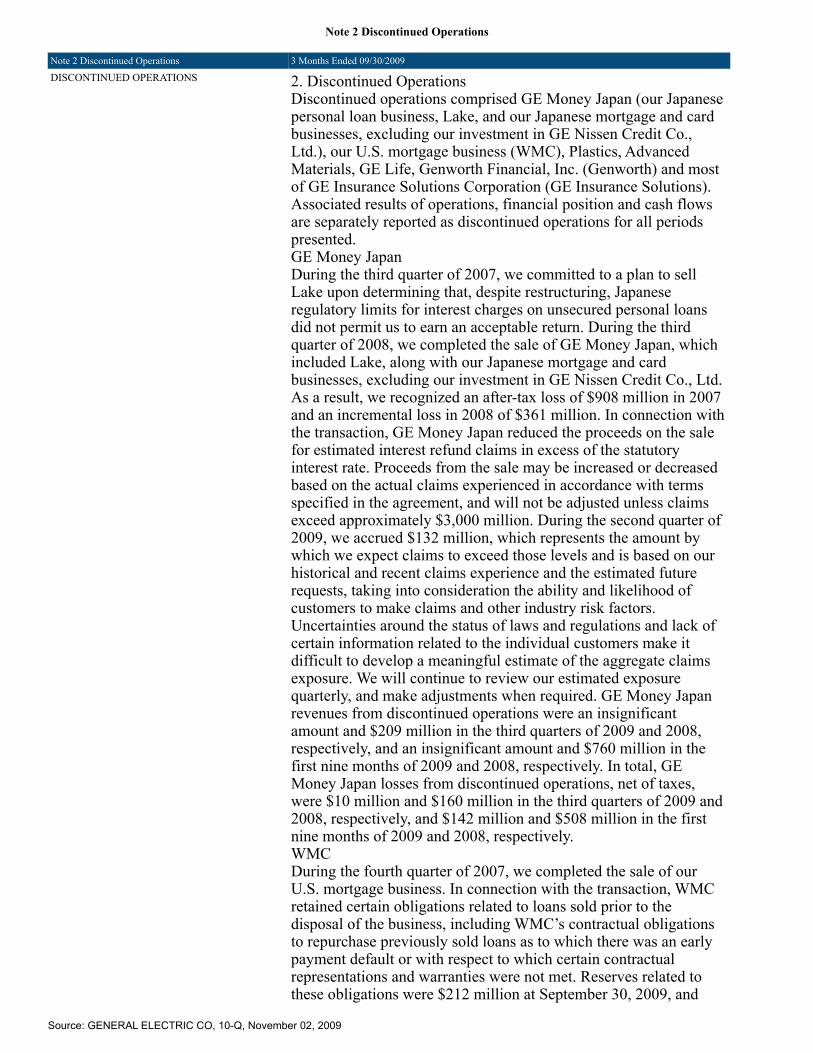
Note 2 Discontinued Operations
Note 2 Discontinued Operations 3 Months Ended 09/30/2009
DISCONTINUED OPERATIONS 2. Discontinued OperationsDiscontinued operations comprised GE Money Japan (our Japanesepersonal loan business, Lake, and our Japanese mortgage and cardbusinesses, excluding our investment in GE Nissen Credit Co.,Ltd.), our U.S. mortgage business (WMC), Plastics, AdvancedMaterials, GE Life, Genworth Financial, Inc. (Genworth) and mostof GE Insurance Solutions Corporation (GE Insurance Solutions).Associated results of operations, financial position and cash flowsare separately reported as discontinued operations for all periodspresented.GE Money JapanDuring the third quarter of 2007, we committed to a plan to sellLake upon determining that, despite restructuring, Japaneseregulatory limits for interest charges on unsecured personal loansdid not permit us to earn an acceptable return. During the thirdquarter of 2008, we completed the sale of GE Money Japan, whichincluded Lake, along with our Japanese mortgage and cardbusinesses, excluding our investment in GE Nissen Credit Co., Ltd.As a result, we recognized an after-tax loss of $908 million in 2007and an incremental loss in 2008 of $361 million. In connection withthe transaction, GE Money Japan reduced the proceeds on the salefor estimated interest refund claims in excess of the statutoryinterest rate. Proceeds from the sale may be increased or decreasedbased on the actual claims experienced in accordance with termsspecified in the agreement, and will not be adjusted unless claimsexceed approximately $3,000 million. During the second quarter of2009, we accrued $132 million, which represents the amount bywhich we expect claims to exceed those levels and is based on ourhistorical and recent claims experience and the estimated futurerequests, taking into consideration the ability and likelihood ofcustomers to make claims and other industry risk factors.Uncertainties around the status of laws and regulations and lack ofcertain information related to the individual customers make itdifficult to develop a meaningful estimate of the aggregate claimsexposure. We will continue to review our estimated exposurequarterly, and make adjustments when required. GE Money Japanrevenues from discontinued operations were an insignificantamount and $209 million in the third quarters of 2009 and 2008,respectively, and an insignificant amount and $760 million in thefirst nine months of 2009 and 2008, respectively. In total, GEMoney Japan losses from discontinued operations, net of taxes,were $10 million and $160 million in the third quarters of 2009 and2008, respectively, and $142 million and $508 million in the firstnine months of 2009 and 2008, respectively.WMCDuring the fourth quarter of 2007, we completed the sale of ourU.S. mortgage business. In connection with the transaction, WMCretained certain obligations related to loans sold prior to thedisposal of the business, including WMC’s contractual obligationsto repurchase previously sold loans as to which there was an earlypayment default or with respect to which certain contractualrepresentations and warranties were not met. Reserves related tothese obligations were $212 million at September 30, 2009, and
Source: GENERAL ELECTRIC CO, 10-Q, November 02, 2009

$244 million at December 31, 2008. The amount of these reservesis based upon pending and estimated future loan repurchaserequests, the estimated percentage of loans validly tendered forrepurchase, and our estimated losses on loans repurchased. Basedon our historical experience, we estimate that a small percentage ofthe total loans we originated and sold will be tendered forrepurchase, and of those tendered, only a limited amount willqualify as “validly tendered,” meaning the loans sold did not satisfyspecified contractual obligations. The amount of our current reserverepresents our best estimate of losses with respect to our repurchaseobligations. However, actual losses could exceed our reserveamount if actual claim rates, valid tenders or losses we incur onrepurchased loans are higher than historically observed. WMCrevenues from discontinued operations were $4 million and $(7)million in the third quarters of 2009 and 2008, respectively, and$(5) million and $(64) million in the first nine months of 2009 and2008, respectively. In total, WMC’s earnings (loss) fromdiscontinued operations, net of taxes, were $3 million and $(8)million in the third quarters of 2009 and 2008, respectively, and$(8) million and $(35) million in the first nine months of 2009 and2008, respectively.GE industrial earnings (loss) from discontinued operations, net oftaxes, were an insignificant amount and $5 million in the thirdquarters of 2009 and 2008, respectively, and $(18) million and $34million in the first nine months of 2009 and 2008, respectively.Assets of GE industrial discontinued operations were $65 millionand $64 million at September 30, 2009 and December 31, 2008,respectively. Liabilities of GE industrial discontinued operationswere $172 million and $189 million at September 30, 2009, andDecember 31, 2008, respectively, and primarily represent taxespayable and pension liabilities related to the sale of our Plasticsbusiness in 2007.Summarized financial information for discontinued GECSoperations is shown below.
Three monthsended September
30
Nine months endedSeptember 30
(In millions) 2009 2008 2009 2008 Operations Total revenues $ 4 $ 202 $ (4) $ 696
Earnings (loss)fromdiscontinuedoperations
before incometaxes
$ 11 $ (207) $ (102) $ (516)
Income taxbenefit(expense)
(16) 50 27 193
Source: GENERAL ELECTRIC CO, 10-Q, November 02, 2009

Loss fromdiscontinuedoperations,
net of taxes $ (5) $ (157) $ (75) $ (323)
Disposal Loss on disposalbefore incometaxes
$ (53) $ (1,277) $ (176) $ (1,499)
Income taxbenefit
98 1,264 94 1,254
Earnings (loss)on disposal, netof taxes
$ 45 $ (13) $ (82) $ (245)
Earnings (loss)fromdiscontinuedoperations,
net of taxes(a) $ 40 $ (170) $ (157) $ (568)
(a) The sum of GE industrial earnings (loss) from discontinuedoperations, net of taxes, and GECS earnings (loss) fromdiscontinued operations, net of taxes, are reported as GE industrialearnings (loss) from discontinued operations, net of taxes, on theCondensed Statement of Earnings.
At September
30, December
31,(In millions) 2009 2008 Assets Cash and equivalents $ 184 $ 180 All other assets 13 19 Other 1,336 1,460 Assets of discontinued operations $ 1,533 $ 1,659
At September
30, December
31,
Source: GENERAL ELECTRIC CO, 10-Q, November 02, 2009

(In millions) 2009 2008 Liabilities Liabilities of discontinuedoperations
$ 1,279 $ 1,243
Assets at September 30, 2009 and December 31, 2008, primarilycomprised a deferred tax asset for a loss carryforward, whichexpires in 2015, related to the sale of our GE Money Japanbusiness.
Source: GENERAL ELECTRIC CO, 10-Q, November 02, 2009
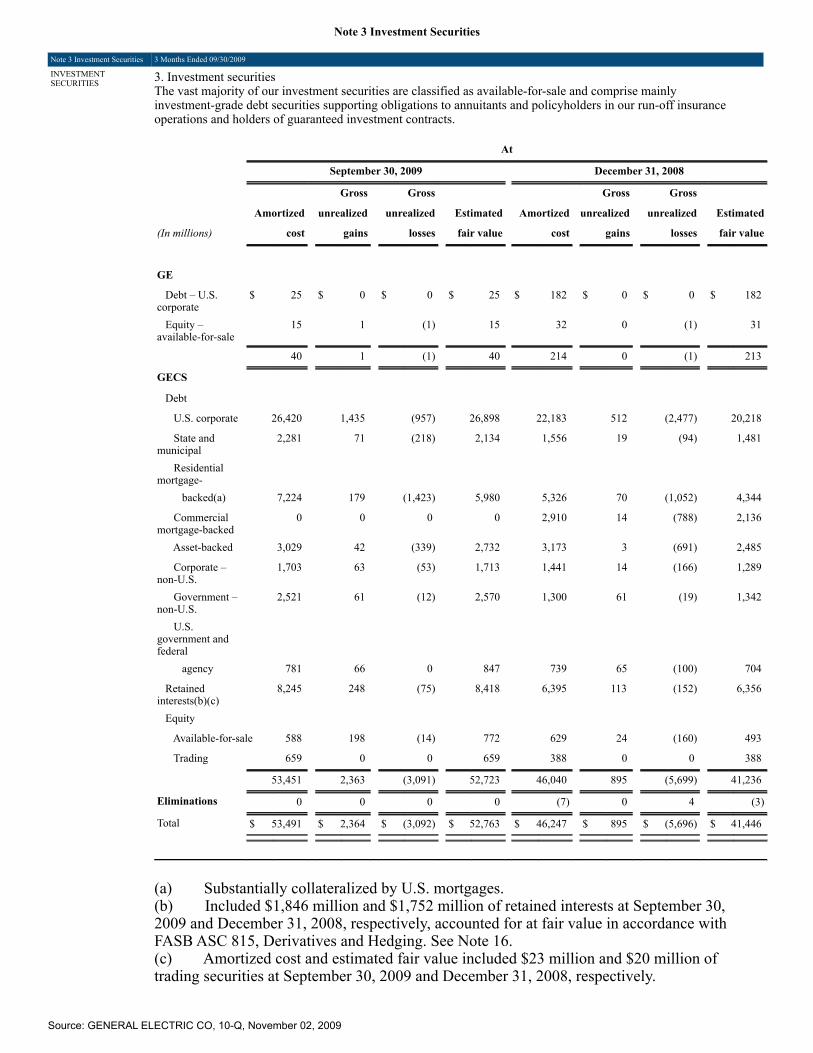
Note 3 Investment Securities
Note 3 Investment Securities 3 Months Ended 09/30/2009
INVESTMENTSECURITIES 3. Investment securities
The vast majority of our investment securities are classified as available-for-sale and comprise mainlyinvestment-grade debt securities supporting obligations to annuitants and policyholders in our run-off insuranceoperations and holders of guaranteed investment contracts.
At
September 30, 2009 December 31, 2008
Gross Gross Gross Gross
Amortized unrealized unrealized Estimated Amortized unrealized unrealized Estimated
(In millions) cost gains losses fair value cost gains losses fair value
GE
Debt – U.S.corporate
$ 25 $ 0 $ 0 $ 25 $ 182 $ 0 $ 0 $ 182
Equity –available-for-sale
15 1 (1) 15 32 0 (1) 31
40 1 (1) 40 214 0 (1) 213
GECS
Debt
U.S. corporate 26,420 1,435 (957) 26,898 22,183 512 (2,477) 20,218
State andmunicipal
2,281 71 (218) 2,134 1,556 19 (94) 1,481
Residentialmortgage-
backed(a) 7,224 179 (1,423) 5,980 5,326 70 (1,052) 4,344
Commercialmortgage-backed
0 0 0 0 2,910 14 (788) 2,136
Asset-backed 3,029 42 (339) 2,732 3,173 3 (691) 2,485
Corporate –non-U.S.
1,703 63 (53) 1,713 1,441 14 (166) 1,289
Government –non-U.S.
2,521 61 (12) 2,570 1,300 61 (19) 1,342
U.S.government andfederal
agency 781 66 0 847 739 65 (100) 704
Retainedinterests(b)(c)
8,245 248 (75) 8,418 6,395 113 (152) 6,356
Equity
Available-for-sale 588 198 (14) 772 629 24 (160) 493
Trading 659 0 0 659 388 0 0 388
53,451 2,363 (3,091) 52,723 46,040 895 (5,699) 41,236
Eliminations 0 0 0 0 (7) 0 4 (3)
Total $ 53,491 $ 2,364 $ (3,092) $ 52,763 $ 46,247 $ 895 $ (5,696) $ 41,446
(a) Substantially collateralized by U.S. mortgages.(b) Included $1,846 million and $1,752 million of retained interests at September 30,2009 and December 31, 2008, respectively, accounted for at fair value in accordance withFASB ASC 815, Derivatives and Hedging. See Note 16.(c) Amortized cost and estimated fair value included $23 million and $20 million oftrading securities at September 30, 2009 and December 31, 2008, respectively.
Source: GENERAL ELECTRIC CO, 10-Q, November 02, 2009

The following tables present the estimated fair values and gross unrealized losses of ouravailable-for-sale investment securities.
In loss position for Less than 12 months 12 months or more Gross Gross Estimated unrealized Estimated unrealized(In millions) fair value losses fair value losses
September 30, 2009 Debt U.S. corporate $ 1,779 $ (60) $ 5,276 $ (897) State and municipal 388 (120) 512 (98) Residentialmortgage-backed
211 (23) 1,753 (859)
Commercialmortgage-backed
10 (2) 1,362 (539)
Asset-backed 96 (4) 1,427 (335) Corporate – non-U.S. 248 (13) 521 (40) Government –non-U.S.
1,078 (7) 254 (5)
U.S. government andfederal agency
0 0 0 0
Retained interests 442 (28) 108 (47)Equity 128 (9) 32 (6)Total $ 4,380 $ (266) $ 11,245 $ (2,826)
December 31, 2008 Debt U.S. corporate $ 6,602 $ (1,108) $ 5,629 $ (1,369) State and municipal 570 (44) 278 (50) Residentialmortgage-backed
1,355 (107) 1,614 (945)
Commercialmortgage-backed
774 (184) 1,218 (604)
Asset-backed 1,064 (419) 1,063 (272) Corporate – non-U.S. 454 (106) 335 (60) Government –non-U.S.
88 (4) 275 (15)
U.S. government andfederal agency
0 0 150 (100)
Retained interests 1,403 (71) 274 (81)Equity 268 (153) 9 (4)Total $ 12,578 $ (2,196) $ 10,845 $ (3,500)
Source: GENERAL ELECTRIC CO, 10-Q, November 02, 2009

We adopted amendments to FASB ASC 320 and recorded a cumulative effect adjustment toincrease retained earnings as of April 1, 2009 of $62 million.We regularly review investment securities for impairment using both qualitative andquantitative criteria. We presently do not intend to sell our debt securities and believe that it isnot more likely than not that we will be required to sell these securities that are in anunrealized loss position before recovery of our amortized cost. We believe that the unrealizedloss associated with our equity securities will be recovered within the foreseeable future.The vast majority of our U.S. corporate debt securities are rated investment grade by the majorrating agencies. We evaluate U.S. corporate debt securities based on a variety of factors suchas the financial health of and specific prospects for the issuer, including whether the issuer isin compliance with the terms and covenants of the security. In the event a U.S. corporate debtsecurity is deemed to be other-than-temporarily impaired, we isolate the credit portion of theimpairment by comparing the present value of our expectation of cash flows to the amortizedcost of the security. We discount the cash flows using the original effective interest rate of thesecurity.The vast majority of our residential mortgage-backed securities (RMBS) haveinvestment-grade credit ratings from the major rating agencies and are in a senior position inthe capital structure of the deal. Of our total RMBS at September 30, 2009 and December 31,2008, approximately $984 million and $1,310 million, respectively, relate to residentialsubprime credit, primarily supporting our guaranteed investment contracts. These arecollateralized primarily by pools of individual, direct mortgage loans (a majority of whichwere originated in 2006 and 2005), not other structured products such as collateralized debtobligations. In addition, of the total residential subprime credit exposure at September 30,2009 and December 31, 2008, approximately $840 million and $1,093 million, respectively,was insured by monoline insurers.Substantially all of our commercial mortgage-backed securities (CMBS) also haveinvestment-grade credit ratings from the major rating agencies and are in a senior position inthe capital structure of the deal. Our CMBS investments are collateralized by both diversifiedpools of mortgages that were originated for securitization (conduit CMBS) and pools of largeloans backed by high quality properties (large loan CMBS), a majority of which wereoriginated in 2006 and 2007.For asset-backed securities, including RMBS, we estimate the portion of loss attributable tocredit using a discounted cash flow model that considers estimates of cash flows generatedfrom the underlying collateral. Estimates of cash flows consider internal credit risk, interestrate and prepayment assumptions that incorporate management’s best estimate of keyassumptions, including default rates, loss severity and prepayment rates. For CMBS, weestimate the portion of loss attributable to credit by evaluating potential losses on each of theunderlying loans in the security. Collateral cash flows are considered in the context of ourposition in the capital structure of the deal. Assumptions can vary widely depending upon thecollateral type, geographic concentrations and vintage.If there has been an adverse change in cash flows for RMBS, management considers creditenhancements such as monoline insurance (which are features of a specific security). Inevaluating the overall credit worthiness of the Monoline, we use an analysis that is similar tothe approach we use for corporate bonds, including an evaluation of the sufficiency of theMonoline’s cash reserves and capital, ratings activity, whether the Monoline is in default ordefault appears imminent, and the potential for intervention by an insurance or other regulator.
During the three months ended September 30, 2009, we recorded pre-tax,other-than-temporary impairments of $325 million, of which $161 million was recordedthrough earnings ($26 million relates to equity securities), and $164 million was recorded inAccumulated Other Comprehensive Income (AOCI).Previously recognized other-than-temporary impairments related to credit on securities stillheld at July 1, 2009 were $499 million. During the third quarter, first time and incrementalcredit impairments were $48 million and $55 million, respectively. Previous creditimpairments related to securities sold were $82 million.
Source: GENERAL ELECTRIC CO, 10-Q, November 02, 2009
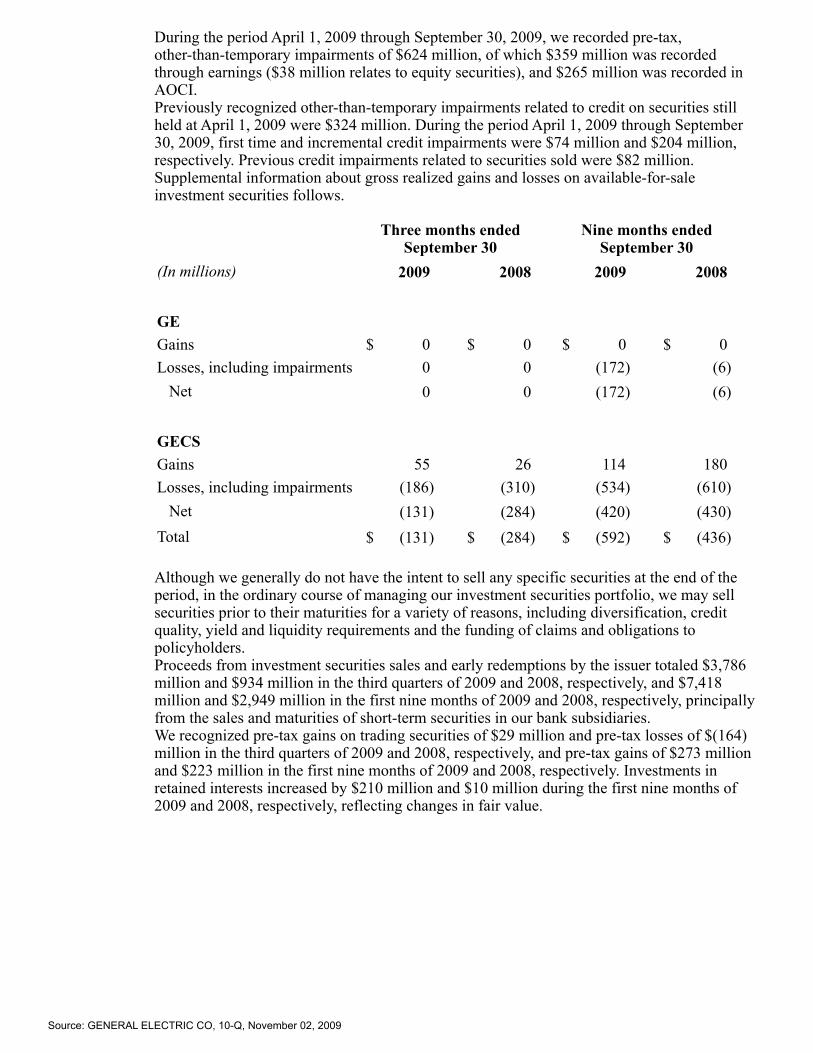
During the period April 1, 2009 through September 30, 2009, we recorded pre-tax,other-than-temporary impairments of $624 million, of which $359 million was recordedthrough earnings ($38 million relates to equity securities), and $265 million was recorded inAOCI.Previously recognized other-than-temporary impairments related to credit on securities stillheld at April 1, 2009 were $324 million. During the period April 1, 2009 through September30, 2009, first time and incremental credit impairments were $74 million and $204 million,respectively. Previous credit impairments related to securities sold were $82 million.Supplemental information about gross realized gains and losses on available-for-saleinvestment securities follows.
Three months endedSeptember 30
Nine months endedSeptember 30
(In millions) 2009 2008 2009 2008 GE Gains $ 0 $ 0 $ 0 $ 0 Losses, including impairments 0 0 (172) (6) Net 0 0 (172) (6) GECS Gains 55 26 114 180 Losses, including impairments (186) (310) (534) (610) Net (131) (284) (420) (430)Total $ (131) $ (284) $ (592) $ (436)
Although we generally do not have the intent to sell any specific securities at the end of theperiod, in the ordinary course of managing our investment securities portfolio, we may sellsecurities prior to their maturities for a variety of reasons, including diversification, creditquality, yield and liquidity requirements and the funding of claims and obligations topolicyholders.Proceeds from investment securities sales and early redemptions by the issuer totaled $3,786million and $934 million in the third quarters of 2009 and 2008, respectively, and $7,418million and $2,949 million in the first nine months of 2009 and 2008, respectively, principallyfrom the sales and maturities of short-term securities in our bank subsidiaries.We recognized pre-tax gains on trading securities of $29 million and pre-tax losses of $(164)million in the third quarters of 2009 and 2008, respectively, and pre-tax gains of $273 millionand $223 million in the first nine months of 2009 and 2008, respectively. Investments inretained interests increased by $210 million and $10 million during the first nine months of2009 and 2008, respectively, reflecting changes in fair value.
Source: GENERAL ELECTRIC CO, 10-Q, November 02, 2009

Note 4 Inventories
Note 4 Inventories 3 Months Ended 09/30/2009
INVENTORIES 4. InventoriesInventories consisted of the following.
At September
30, December
31,(In millions) 2009 2008 Raw materials and work inprocess
$ 8,365 $ 8,710
Finished goods 4,693 5,109 Unbilled shipments 689 561 13,747 14,380 Less revaluation to LIFO (655) (706)Total $ 13,092 $ 13,674
Source: GENERAL ELECTRIC CO, 10-Q, November 02, 2009
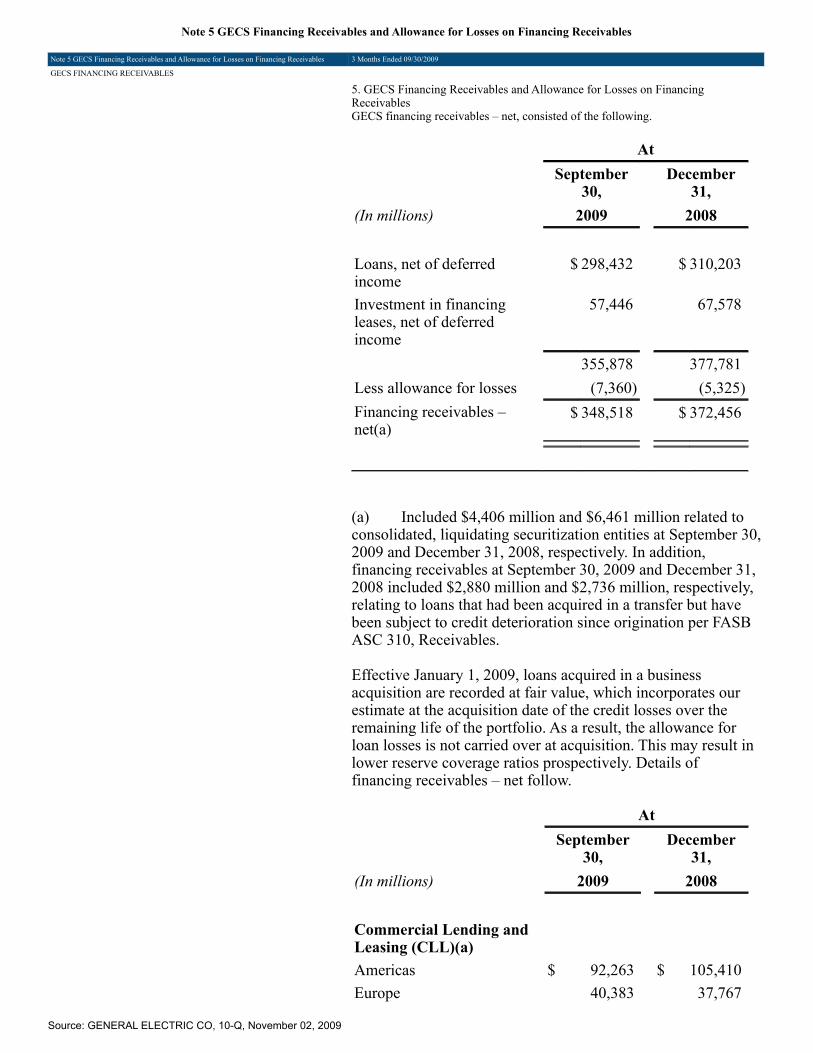
Note 5 GECS Financing Receivables and Allowance for Losses on Financing Receivables
Note 5 GECS Financing Receivables and Allowance for Losses on Financing Receivables 3 Months Ended 09/30/2009
GECS FINANCING RECEIVABLES
5. GECS Financing Receivables and Allowance for Losses on FinancingReceivablesGECS financing receivables – net, consisted of the following.
At September
30, December
31,(In millions) 2009 2008 Loans, net of deferredincome
$ 298,432 $ 310,203
Investment in financingleases, net of deferredincome
57,446 67,578
355,878 377,781 Less allowance for losses (7,360) (5,325)Financing receivables –net(a)
$ 348,518 $ 372,456
(a) Included $4,406 million and $6,461 million related toconsolidated, liquidating securitization entities at September 30,2009 and December 31, 2008, respectively. In addition,financing receivables at September 30, 2009 and December 31,2008 included $2,880 million and $2,736 million, respectively,relating to loans that had been acquired in a transfer but havebeen subject to credit deterioration since origination per FASBASC 310, Receivables.
Effective January 1, 2009, loans acquired in a businessacquisition are recorded at fair value, which incorporates ourestimate at the acquisition date of the credit losses over theremaining life of the portfolio. As a result, the allowance forloan losses is not carried over at acquisition. This may result inlower reserve coverage ratios prospectively. Details offinancing receivables – net follow.
At September
30, December
31,(In millions) 2009 2008 Commercial Lending andLeasing (CLL)(a)
Americas $ 92,263 $ 105,410 Europe 40,383 37,767
Source: GENERAL ELECTRIC CO, 10-Q, November 02, 2009

Asia 14,096 16,683 Other 776 786 147,518 160,646 Consumer(a) Non-U.S. residentialmortgages
61,308 60,753
Non-U.S. installment andrevolving credit
25,197 24,441
U.S. installment andrevolving credit
22,324 27,645
Non-U.S. auto 14,366 18,168 Other 13,191 11,541 136,386 142,548 Real Estate 45,471 46,735 Energy Financial Services 8,362 8,392 GE Capital AviationServices (GECAS)(b)
15,046 15,429
Other(c) 3,095 4,031 355,878 377,781 Less allowance for losses (7,360) (5,325)Total $ 348,518 $ 372,456
(a) During the first quarter of 2009, we transferred Artesiafrom CLL to Consumer. Prior-period amounts were reclassifiedto conform to the current-period’s presentation.(b) Included loans and financing leases of $12,927 millionand $13,078 million at September 30, 2009 and December 31,2008, respectively, related to commercial aircraft at AviationFinancial Services.(c) Consisted of loans and financing leases related tocertain consolidated, liquidating securitization entities.
Individually impaired loans are defined by GAAP as largerbalance or restructured loans for which it is probable that thelender will be unable to collect all amounts due according tooriginal contractual terms of the loan agreement. An analysis ofimpaired loans and specific reserves follows. The vast majorityof our consumer and a portion of our CLL nonearningreceivables are excluded from this definition, as they representsmaller balance homogeneous loans that we evaluatecollectively by portfolio for impairment.
Source: GENERAL ELECTRIC CO, 10-Q, November 02, 2009

At September
30, December
31,(In millions) 2009 2008 Loans requiring allowance forlosses
$ 8,842 $ 2,712
Loans expected to be fullyrecoverable
3,218 871
Total impaired loans $ 12,060 $ 3,583
Allowance for losses (specificreserves)
$ 1,874 $ 635
Average investment during theperiod
7,463 2,064
Interest income earned whileimpaired(a)
133 48
(a) Recognized principally on cash basis.
Impaired loans increased by $8.5 billion from December 31,2008 to September 30, 2009 primarily relating to increases atReal Estate ($5.4 billion) and CLL ($2.2 billion). Impairedloans increased by $4.0 billion from June 30, 2009 toSeptember 30, 2009, primarily relating to increases at RealEstate ($2.9 billion) and CLL ($0.7 billion). The increase inimpaired loans and related specific reserves in Real Estatereflects our current estimate of collateral values of theunderlying properties, and our estimate of loans which are notpast due, but for which it is probable that we will be unable tocollect the full principal balance at maturity due to a decline inthe underlying value of the collateral. Of our $6.2 billionimpaired loans at Real Estate at September 30, 2009,approximately $4 billion are currently paying in accordancewith the contractual terms of the loan. Impaired loans at CLLprimarily represent senior secured lending positions.
GECS Allowance for Losses on Financing Receivables
Balance Provision Balance January
1, charged
to Gross September
30,(Inmillions)
2009 operations Other(a) write-offs Recoveries 2009
CLL(b) Americas $ 843 $ 969 $ (34) $ (746) $ 66 $ 1,098 Europe 288 412 8 (225) 17 500 Asia 163 188 8 (136) 19 242 Other 2 4 2 (2) – 6
Source: GENERAL ELECTRIC CO, 10-Q, November 02, 2009
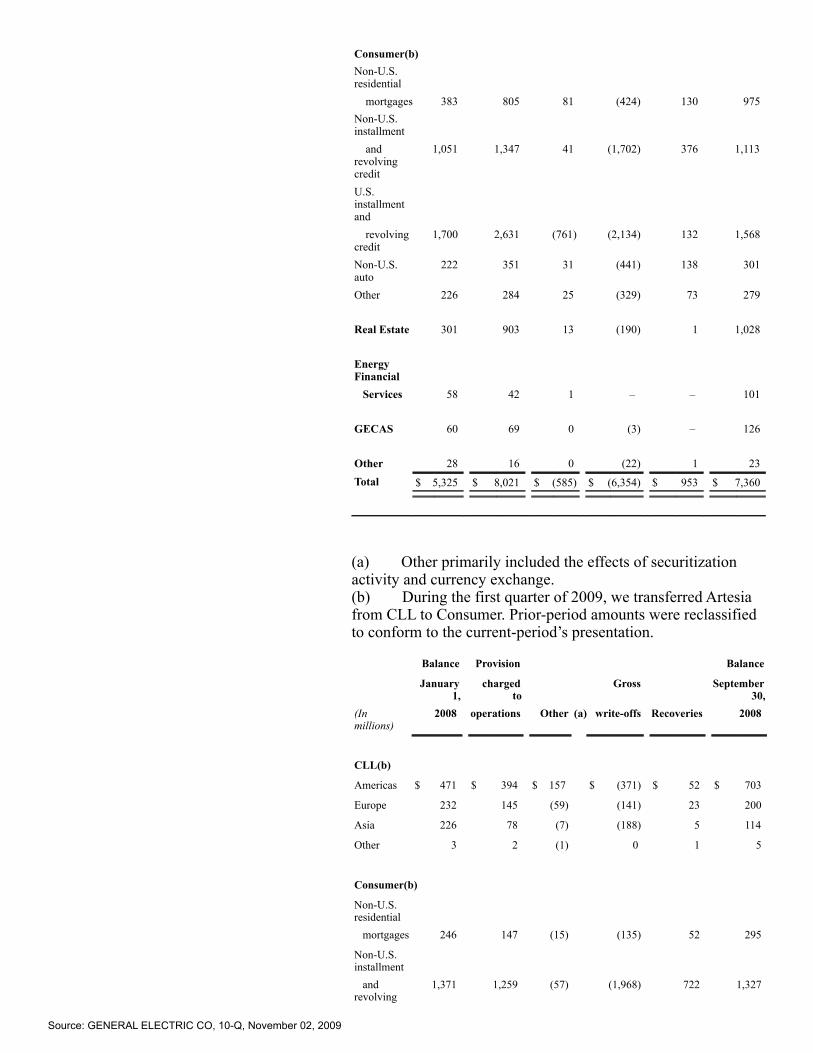
Consumer(b) Non-U.S.residential
mortgages 383 805 81 (424) 130 975 Non-U.S.installment
andrevolvingcredit
1,051 1,347 41 (1,702) 376 1,113
U.S.installmentand
revolvingcredit
1,700 2,631 (761) (2,134) 132 1,568
Non-U.S.auto
222 351 31 (441) 138 301
Other 226 284 25 (329) 73 279 Real Estate 301 903 13 (190) 1 1,028 EnergyFinancial
Services 58 42 1 – – 101 GECAS 60 69 0 (3) – 126 Other 28 16 0 (22) 1 23
Total $ 5,325 $ 8,021 $ (585) $ (6,354) $ 953 $ 7,360
(a) Other primarily included the effects of securitizationactivity and currency exchange.(b) During the first quarter of 2009, we transferred Artesiafrom CLL to Consumer. Prior-period amounts were reclassifiedto conform to the current-period’s presentation.
Balance Provision Balance
January1,
chargedto
Gross September30,
(Inmillions)
2008 operations Other (a) write-offs Recoveries 2008
CLL(b)
Americas $ 471 $ 394 $ 157 $ (371) $ 52 $ 703
Europe 232 145 (59) (141) 23 200
Asia 226 78 (7) (188) 5 114
Other 3 2 (1) 0 1 5
Consumer(b)
Non-U.S.residential
mortgages 246 147 (15) (135) 52 295
Non-U.S.installment
andrevolving
1,371 1,259 (57) (1,968) 722 1,327
Source: GENERAL ELECTRIC CO, 10-Q, November 02, 2009

creditU.S.installmentand
revolvingcredit
985 1,908 (416) (1,477) 215 1,215
Non-U.S.auto
324 260 (59) (479) 225 271
Other 167 136 25 (182) 54 200
Real Estate 168 47 4 (10) 1 210
EnergyFinancial
Services 19 12 3 0 0 34
GECAS 8 47 0 (1) 0 54
Other 18 18 (1) (15) 0 20
Total $ 4,238 $ 4,453 $ (426) $ (4,967) $ 1,350 $ 4,648
(a) Other primarily included the effects of securitizationactivity, currency exchange, dispositions and acquisitions.(b) During the first quarter of 2009, we transferred Artesiafrom CLL to Consumer. Prior-period amounts were reclassifiedto conform to the current-period’s presentation.
Source: GENERAL ELECTRIC CO, 10-Q, November 02, 2009

Note 6 Property, Plant And Equipment
Note 6 Property, Plant And Equipment 3 Months Ended 09/30/2009
PROPERTY, PLANT AND EQUIPMENT 6. Property, Plant and EquipmentProperty, plant and equipment (including equipmentleased to others) – net, consisted of the following.
At September
30, December
31,(In millions) 2009 2008 Original cost $ 118,916 $ 125,671 Less accumulateddepreciation andamortization
(45,923) (47,141)
Property, plant andequipment (includingequipment leased toothers) – net
$ 72,993 $ 78,530
Source: GENERAL ELECTRIC CO, 10-Q, November 02, 2009

Note 7 Goodwill And Other Intangible Assets
Note 7 Goodwill And Other Intangible Assets 3 Months Ended 09/30/2009
GOODWILL AND OTHER INTANGIBLEASSETS
7. Goodwill and Other Intangible AssetsGoodwill and other intangible assets – net, consisted of the following.
At September
30, December
31,(In millions) 2009 2008 Goodwill $ 84,880 $ 81,759
Other intangible assets Intangible assets subject to amortization $ 12,640 $ 12,623 Indefinite-lived intangible assets(a) 2,370 2,354 Total $ 15,010 $ 14,977
(a) Indefinite-lived intangible assets principally comprised trademarks,tradenames and U.S. Federal Communications Commission licenses.
Changes in goodwill balances follow.
Acquisitions/ Dispositions, Balance acquisition currency Balance January
1, accounting exchange September
30,(In millions) 2009 adjustments and other 2009 EnergyInfrastructure
$ 9,943 $ (146) $ 350 $ 10,147
TechnologyInfrastructure
26,684 413 (364) 26,733
NBC Universal 18,973 20 4 18,997 Capital Finance 25,365 2,603 216 28,184 Consumer &Industrial
794 0 25 819
Total $ 81,759 $ 2,890 $ 231 $ 84,880
Goodwill related to new acquisitions in the first nine months of 2009 was$2,743 million and included acquisitions of BAC Credomatic (BAC) ($1,309million) and Interbanca S.p.A. (Interbanca) ($1,075 million) at Capital Financeand Airfoils Technologies International – Singapore Pte. Ltd. (ATI-Singapore)($337 million) at Technology Infrastructure. During the first nine months of
Source: GENERAL ELECTRIC CO, 10-Q, November 02, 2009

2009, the goodwill balance increased by $147 million related to acquisitionaccounting adjustments for prior-year acquisitions. The most significant of theseadjustments was an increase of $180 million associated with the 2008acquisition of CitiCapital at Capital Finance, partially offset by a decrease of$139 million associated with the 2008 acquisition of Hydril Pressure Control byEnergy Infrastructure. Also during the first nine months of 2009, goodwillbalances increased $231 million, primarily as a result of the weaker U.S. dollar($1,581 million), partially offset by the deconsolidation of Penske TruckLeasing Co., L.P. (PTL) ($634 million) at Capital Finance and the disposition ofGE Homeland Protection, Inc. ($423 million) at Technology Infrastructure.On March 20, 2009, we increased our ownership in ATI-Singapore from 49% to100% and concurrently acquired from the same seller a controlling financialinterest in certain affiliates. We remeasured our previous equity interests to fairvalue, resulting in a pre-tax gain of $254 million which is reported in otherincome.On June 25, 2009, we increased our ownership in BAC from 49.99% to 75% fora purchase price of $623 million, in accordance with terms of a previousagreement. We remeasured our previously held equity investment to fair value,resulting in a pre-tax gain of $343 million, which is reported in GECS revenuesfrom services.We test goodwill for impairment annually and more frequently if circumstanceswarrant. We determine fair values for each of the reporting units using anincome approach. When available and as appropriate, we use comparativemarket multiples to corroborate discounted cash flow results. For purposes ofthe income approach, fair value is determined based on the present value ofestimated future cash flows, discounted at an appropriate risk-adjusted rate. Weuse our internal forecasts to estimate future cash flows and include an estimateof long-term future growth rates based on our most recent views of thelong-term outlook for each business. Actual results may differ from thoseassumed in our forecasts. We derive our discount rates by applying the capitalasset pricing model (i.e., to estimate the cost of equity financing) and analyzingpublished rates for industries relevant to our reporting units. We use discountrates that are commensurate with the risks and uncertainty inherent in therespective businesses and in our internally developed forecasts. Valuationsusing the market approach reflect prices and other relevant observableinformation generated by market transactions involving comparable businesses.Compared to the market approach, the income approach more closely aligns thereporting unit valuation to a company’s or business’ specific business model,geographic markets and product offerings, as it is based on specific projectionsof the business. Required rates of return, along with uncertainty inherent in theforecasts of future cash flows are reflected in the selection of the discount rate.Equally important, under this approach, reasonably likely scenarios andassociated sensitivities can be developed for alternative future states that maynot be reflected in an observable market price. A market approach allows forcomparison to actual market transactions and multiples. It can be somewhatmore limited in its application because the population of potential comparables(or pure plays) is often limited to publicly-traded companies where thecharacteristics of the comparative business and ours can be significantlydifferent, market data is usually not available for divisions within largerconglomerates or non-public subsidiaries that could otherwise qualify ascomparable, and the specific circumstances surrounding a market transaction(e.g., synergies between the parties, terms and conditions of the transaction, etc.)may be different or irrelevant with respect to our business. It can also bedifficult under the current market conditions to identify orderly transactionsbetween market participants in similar financial services businesses. We assess
Source: GENERAL ELECTRIC CO, 10-Q, November 02, 2009

the valuation methodology based upon the relevance and availability of data atthe time of performing the valuation and weight the methodologiesappropriately.Given the significant decline in our stock price in the first quarter of 2009 andmarket conditions in the financial services industry at that time, we conductedan additional impairment analysis of the Capital Finance reporting units duringthe first quarter of 2009 using data as of January 1, 2009. As a result of thesetests, no goodwill impairment was recognized.We performed our annual impairment test for goodwill at all of our reportingunits in the third quarter using data as of July 1, 2009. In performing thevaluations, we used cash flows which reflected management’s forecasts anddiscount rates which reflect the risks associated with the current market. Basedon the results of our testing, the fair values at each of the GE Industrial reportingunits and the CLL, Consumer, Energy Financial Services and GECAS reportingunits exceeded their book values; therefore, the second step of the impairmenttest (in which fair value of each of the reporting unit’s assets and liabilities aremeasured) was not required to be performed and no goodwill impairment wasrecognized. Due to the volatility and uncertainties in the current commercial realestate environment, we used a range of valuations to determine the fair value forour Real Estate reporting unit. While the Real Estate reporting unit’s book valuewas within the range of its fair value, we further substantiated our Real Estategoodwill balance by performing the second step analysis described above. As aresult of our tests for Real Estate, no goodwill impairment was recognized. OurReal Estate reporting unit had a goodwill balance of $1,209 million atSeptember 30, 2009.Estimating the fair value of reporting units involves the use of estimates andsignificant judgments that are based on a number of factors including actualoperating results. If current conditions persist longer or deteriorate further thanexpected, it is reasonably possible that the judgments and estimates describedabove could change in future periods.Intangible Assets Subject to Amortization
At
September 30, 2009 December 31, 2008
Gross Gross
carrying Accumulated carrying Accumulated (In millions) amount amortization Net amount amortization Net
Customer-related$ 6,591 $ (1,840) $ 4,751 $ 6,341 $ (1,516) $ 4,825 Patents,licenses andtrademarks
5,194 (2,163) 3,031 5,315 (2,150) 3,165
Capitalizedsoftware
7,294 (4,690) 2,604 6,872 (4,199) 2,673
Leasevaluations
1,734 (730) 1,004 1,761 (594) 1,167
Present valueof futureprofits
921 (463) 458 869 (439) 430
All other 1,329 (537) 792 680 (317) 363
Total $ 23,063 $ (10,423) $12,640 $ 21,838 $ (9,215) $12,623
Source: GENERAL ELECTRIC CO, 10-Q, November 02, 2009

Consolidated amortization related to intangible assets subject to amortizationwas $616 million and $445 million for the quarters ended September 30, 2009and 2008, respectively. Consolidated amortization related to intangible assetssubject to amortization for the nine months ended September 30, 2009 and2008, was $1,629 million and $1,469 million, respectively.
Source: GENERAL ELECTRIC CO, 10-Q, November 02, 2009

Note 8 GECS Borrowings
Note 8 GECS Borrowings 3 Months Ended 09/30/2009
GECS BORROWINGS 8. GECS BorrowingsGECS borrowings are summarized in the following table.
At(In millions) September
30, December
31, 2009 2008 Short-term borrowings Commercial paper U.S. Unsecured(a) $ 40,135 $ 62,768 Asset-backed(b) 2,884 3,652 Non-U.S. 9,871 9,033 Current portion of long-termdebt(a)(c)(d)
69,324 69,682
Bank deposits(e) 25,738 29,634 Bank borrowings(f) 5,041 10,569 GE Interest Plus notes(g) 6,520 5,633 Other 1,425 2,562 Total 160,938 193,533 Long-term borrowings Senior notes Unsecured(a)(d) 322,280 298,665 Asset-backed(h) 4,069 5,002 Subordinated notes(i) 2,711 2,866 Subordinated debentures(j) 7,706 7,315 Bank deposits(k) 10,649 7,220 Total 347,415 321,068 Total borrowings $ 508,353 $ 514,601
(a) General Electric Capital Corporation (GE Capital) hadissued and outstanding $59,110 million ($3,660 millioncommercial paper and $55,450 million long-term borrowings)and $35,243 million ($21,823 million commercial paper and$13,420 million long-term borrowings) of senior, unsecured debtthat was guaranteed by the Federal Deposit InsuranceCorporation (FDIC) under the Temporary Liquidity Guarantee
Source: GENERAL ELECTRIC CO, 10-Q, November 02, 2009

Program at September 30, 2009 and December 31, 2008,respectively. GE Capital and GE are parties to an Eligible EntityDesignation Agreement and GE Capital is subject to the terms ofa Master Agreement, each entered into with the FDIC. The termsof these agreements include, among other things, a requirementthat GE and GE Capital reimburse the FDIC for any amounts thatthe FDIC pays to holders of GE Capital debt that is guaranteedby the FDIC.(b) Consists entirely of obligations of consolidated,liquidating securitization entities. See Note 16.(c) Included $239 million and $326 million of asset-backedsenior notes, issued by consolidated, liquidating securitizationentities at September 30, 2009 and December 31, 2008,respectively.(d) Included $1,665 million ($74 million short-term and$1,591 million long-term) of borrowings under Europeangovernment-sponsored programs at September 30, 2009.(e) Included $20,893 million and $11,793 million of depositsin non-U.S. banks at September 30, 2009 and December 31,2008, respectively, and included certificates of depositsdistributed by brokers of $4,845 million and $17,841 million atSeptember 30, 2009 and December 31, 2008, respectively.(f) Term borrowings from banks with an original term tomaturity of less than 12 months.(g) Entirely variable denomination floating rate demandnotes.(h) Included $895 million and $2,104 million of asset-backedsenior notes, issued by consolidated, liquidating securitizationentities at September 30, 2009 and December 31, 2008,respectively. See Note 16.(i) Included $417 million and $750 million of subordinatednotes guaranteed by GE at September 30, 2009 and December31, 2008, respectively.(j) Subordinated debentures receive rating agency equitycredit and were hedged at issuance to the U.S. dollar equivalentof $7,725 million.(k) Included certificates of deposits distributed by brokerswith maturities greater than one year of $9,898 million and$6,699 million at September 30, 2009 and December 31, 2008,respectively.
Source: GENERAL ELECTRIC CO, 10-Q, November 02, 2009

Note 9 Postretirement Benefits Plans
Note 9 Postretirement Benefits Plans 3 Months Ended 09/30/2009
POSTRETIREMENT BENEFIT PLANS
9. Postretirement Benefit PlansWe sponsor a number of pension and retiree health and lifeinsurance benefit plans. Principal pension plans include the GEPension Plan and the GE Supplementary Pension Plan. Principalretiree benefit plans generally provide health and life insurancebenefits to employees who retire under the GE Pension Plan with10 or more years of service. Other pension plans include the U.S.and non-U.S. pension plans with pension assets or obligationsgreater than $50 million. Smaller pension plans and other retireebenefit plans are not material individually or in the aggregate. Theeffect on operations of the pension plans follows.
Principal Pension Plans Three months ended
September 30 Nine months ended
September 30(In millions) 2009 2008 2009 2008 Expectedreturn on planassets
$ (1,125) $ (1,075) $ (3,378) $ (3,225)
Service costfor benefitsearned
522 314 1,211 934
Interest cost onbenefitobligation
667 663 2,001 1,988
Prior servicecostamortization
81 80 242 242
Net actuariallossamortization
86 60 259 181
Pension planscost
$ 231 $ 42 $ 335 $ 120
Other Pension Plans Three months
ended September30
Nine months endedSeptember 30
(In millions) 2009 2008 2009 2008 Expected returnon plan assets
$ (110) $ (135) $ (321) $ (412)
Service cost forbenefits earned
84 81 249 243
117 123 338 374
Source: GENERAL ELECTRIC CO, 10-Q, November 02, 2009
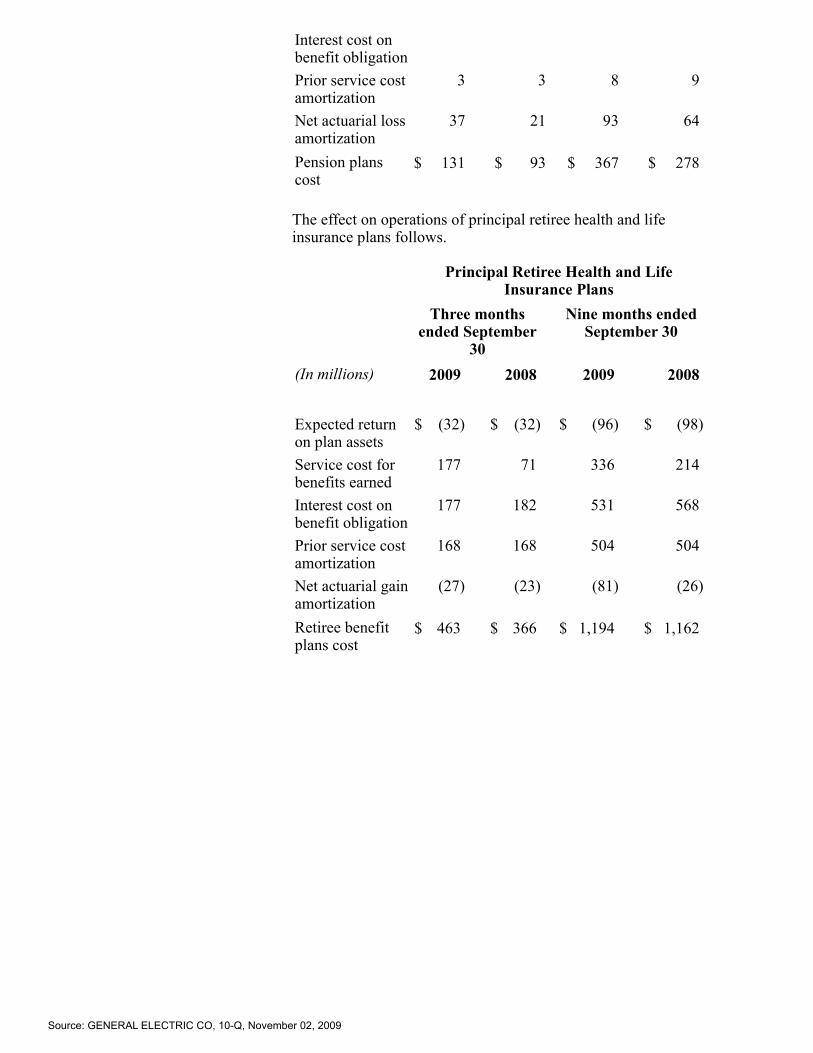
Interest cost onbenefit obligationPrior service costamortization
3 3 8 9
Net actuarial lossamortization
37 21 93 64
Pension planscost
$ 131 $ 93 $ 367 $ 278
The effect on operations of principal retiree health and lifeinsurance plans follows.
Principal Retiree Health and LifeInsurance Plans
Three monthsended September
30
Nine months endedSeptember 30
(In millions) 2009 2008 2009 2008 Expected returnon plan assets
$ (32) $ (32) $ (96) $ (98)
Service cost forbenefits earned
177 71 336 214
Interest cost onbenefit obligation
177 182 531 568
Prior service costamortization
168 168 504 504
Net actuarial gainamortization
(27) (23) (81) (26)
Retiree benefitplans cost
$ 463 $ 366 $ 1,194 $ 1,162
Source: GENERAL ELECTRIC CO, 10-Q, November 02, 2009

Note 10 Income Taxes
Note 10 Income Taxes 3 Months Ended 09/30/2009
INCOME TAXES
10. Income TaxesDuring the first quarter of 2009, following the change in ourexternal credit ratings, funding actions taken and review of ouroperations, liquidity and funding, we determined thatundistributed prior-year earnings of non-U.S. subsidiaries ofGECS, on which we had previously provided deferred U.S.taxes, would be indefinitely reinvested outside the U.S. Thischange increased the amount of prior-year earningsindefinitely reinvested outside the U.S. by approximately $2billion to $77 billion, resulting in an income tax benefit of$700 million in the first quarter of 2009.The balance of “unrecognized tax benefits,” the amount ofrelated interest and penalties we have provided and what webelieve to be the range of reasonably possible changes in thenext 12 months, were:
At September
30, December
31,(In millions) 2009 2008 Unrecognized tax benefits $ 7,135 $ 6,692 Portion that, ifrecognized, would reduce taxexpense and effective taxrate(a)
4,912 4,453
Accrued interest onunrecognized tax benefits
1,293 1,204
Accrued penalties onunrecognized tax benefits
102 96
Reasonably possiblereduction to the balance ofunrecognized tax benefits
in succeeding 12 months 0-1,500 0-1,500 Portion that, ifrecognized, would reduce taxexpense and effective taxrate(a)
0-1,400 0-1,100
(a) Some portion of such reduction might be reported asdiscontinued operations.
The IRS is currently auditing our consolidated income taxreturns for 2003-2007. In addition, certain other U.S. taxdeficiency issues and refund claims for previous years remainunresolved. It is reasonably possible that the 2003-2005 U.S.
Source: GENERAL ELECTRIC CO, 10-Q, November 02, 2009

audit cycle will be completed during the next 12 months,which could result in a decrease in our balance ofunrecognized tax benefits. We believe that there are no otherjurisdictions in which the outcome of unresolved issues orclaims is likely to be material to our results of operations,financial position or cash flows. We further believe that wehave made adequate provision for all income tax uncertainties.GE and GECS file a consolidated U.S. federal income taxreturn. The GECS provision for current tax expense includesits effect on the consolidated return. The effect of GECS onthe consolidated liability is settled in cash as GE tax paymentsare due.
Source: GENERAL ELECTRIC CO, 10-Q, November 02, 2009

Note 11 Shareowners' Equity
Note 11 Shareowners' Equity 3 Months Ended 09/30/2009
SHAREOWNERS' EQUITY 11. Shareowners’ EquityA summary of increases (decreases) in GE shareowners’ equity thatdid not result directly from transactions with shareowners, net ofincome taxes, follows.
Three months endedSeptember 30
Nine months endedSeptember 30
(In millions) 2009 2008 2009 2008 Net earningsattributable tothe Company
$ 2,494 $ 4,312 $ 8,012 $ 13,688
Investmentsecurities – net
1,697 (1,086) 2,615 (2,414)
Currencytranslationadjustments –net
1,857 (4,912) 4,342 (3,508)
Cash flowhedges – net
71 (1,622) 1,476 (1,500)
Benefit plans –net
180 210 659 924
Total $ 6,299 $ (3,098) $ 17,104 $ 7,190
Changes to noncontrolling interests during the third quarter of 2009resulted from net earnings ($5 million), dividends ($(152) million),AOCI ($14 million) and other ($20 million). Changes to theindividual components of AOCI attributable to noncontrollinginterests were insignificant.Changes to noncontrolling interests during the first nine months of2009 resulted from net earnings ($102 million), dividends ($(444)million), the effects of deconsolidating PTL ($(331) million, including$101 million of AOCI), other AOCI ($10 million) and other ($(4)million). Changes to the individual components of AOCI attributableto noncontrolling interests were insignificant.
Source: GENERAL ELECTRIC CO, 10-Q, November 02, 2009

Note 12 GECS Revenues From Services
Note 12 GECS Revenues From Services 3 Months Ended 09/30/2009
GECS REVENUES FROM SERVICES 12. GECS Revenues from ServicesGECS revenues from services are summarized in the followingtable.
Three months endedSeptember 30
Nine months endedSeptember 30
(In millions) 2009 2008 2009 2008 Interest onloans
$ 4,933 $ 7,198 $ 15,113 $ 20,426
Equipmentleased toothers
2,902 3,967 9,314 11,686
Fees 1,160 1,989 3,419 4,798 Financingleases
795 1,107 2,533 3,456
Real estateinvestments
410 803 1,128 3,102
Premiumsearned byinsuranceactivities
515 554 1,525 1,664
Associatedcompanies
277 560 751 1,676
Investmentincome(a)
755 531 2,413 2,388
Netsecuritizationgains
449 317 1,169 1,022
Otheritems(b)(c)
337 826 2,604 3,809
Total $ 12,533 $ 17,852 $ 39,969 $ 54,027
(a) Included net other-than-temporary impairments oninvestment securities of $161 million and $309 million in thethird quarters of 2009 and 2008, respectively, and $484 millionand $599 million in the first nine months of 2009 and 2008,respectively. See Note 3.(b) Included a gain on the sale of a limited partnershipinterest in PTL and a related gain on the remeasurement of theretained investment to fair value totaling $296 million in the firstquarter of 2009. See Note 16.(c) Included a gain of $343 million on the remeasurement tofair value of our equity method investment in BAC, followingour acquisition of a controlling interest in the second quarter of
Source: GENERAL ELECTRIC CO, 10-Q, November 02, 2009

2009. See Note 7.
Source: GENERAL ELECTRIC CO, 10-Q, November 02, 2009

Note 13 Earnings Per Share Information
Note 13 Earnings Per Share Information 3 Months Ended 09/30/2009
EARNINGS PER SHARE INFORMATION
13. Earnings Per Share InformationGE’s authorized common stock consists of 13,200,000,000 shareshaving a par value of $0.06 each. Information related to thecalculation of earnings per share follows.
Three months ended September 30 2009(a) 2008
(In millions;per-share amountsin dollars)
Diluted Basic Diluted Basic
Amountsattributable to theCompany:
Consolidated Earnings fromcontinuingoperations for
per-sharecalculation
$ 2,438 $ 2,438 $ 4,478 $ 4,477
Preferred stockdividends declared
(75) (75) 0 0
Earnings fromcontinuingoperationsattributable to
commonshareowners forper-sharecalculation
$ 2,363 $ 2,363 $ 4,478 $ 4,477
Earnings (loss)from discontinuedoperations
for per-sharecalculation
40 40 (165) (165)
Net earningsattributable to GEcommon
shareowners forper-sharecalculation
2,403 2,402 4,313 4,312
Averageequivalent shares
Shares of GEcommon stockoutstanding
10,638 10,638 9,953 9,953
Employee
Source: GENERAL ELECTRIC CO, 10-Q, November 02, 2009

compensation-relatedshares, including stockoptions
0 0 17 0
Total averageequivalent shares
10,638 10,638 9,970 9,953
Per-shareamounts
Earnings fromcontinuingoperations
$ 0.22 $ 0.22 $ 0.45 $ 0.45
Earnings (loss)from discontinuedoperations
0 0 (0.02) (0.02)
Net earnings 0.23 0.23 0.43 0.43
Nine months ended September 30 2009(a) 2008
(In millions;per-share amountsin dollars)
Diluted Basic Diluted Basic
Amountsattributable to theCompany:
Consolidated Earnings fromcontinuingoperations for
per-sharecalculation
$ 8,157 $ 8,156 $ 14,223 $ 14,222
Preferred stockdividends declared
(225) (225) 0 0
Earnings fromcontinuingoperationsattributable to
commonshareowners forper-sharecalculation
$ 7,932 $ 7,931 $ 14,223 $ 14,222
Loss fromdiscontinuedoperations
for per-sharecalculation
(175) (175) (534) (534)
Net earningsattributable to GEcommon
shareowners forper-share
7,757 7,756 13,689 13,688
Source: GENERAL ELECTRIC CO, 10-Q, November 02, 2009
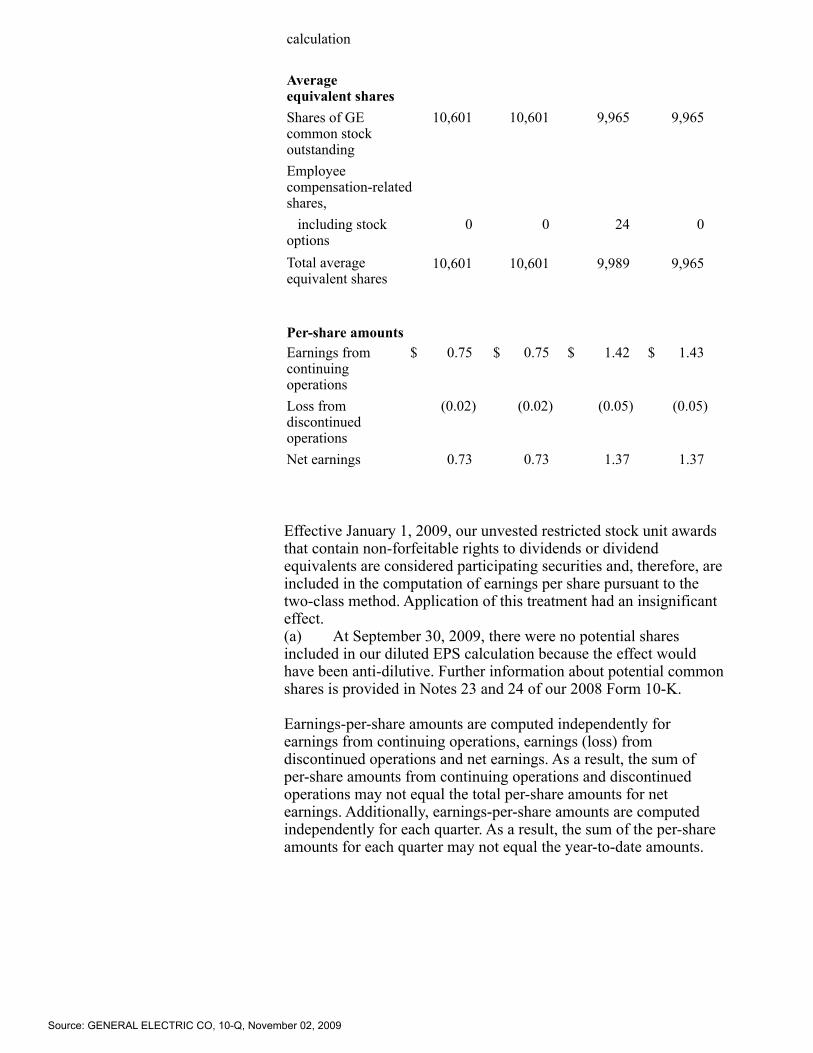
calculation Averageequivalent shares
Shares of GEcommon stockoutstanding
10,601 10,601 9,965 9,965
Employeecompensation-relatedshares,
including stockoptions
0 0 24 0
Total averageequivalent shares
10,601 10,601 9,989 9,965
Per-share amounts Earnings fromcontinuingoperations
$ 0.75 $ 0.75 $ 1.42 $ 1.43
Loss fromdiscontinuedoperations
(0.02) (0.02) (0.05) (0.05)
Net earnings 0.73 0.73 1.37 1.37
Effective January 1, 2009, our unvested restricted stock unit awardsthat contain non-forfeitable rights to dividends or dividendequivalents are considered participating securities and, therefore, areincluded in the computation of earnings per share pursuant to thetwo-class method. Application of this treatment had an insignificanteffect.(a) At September 30, 2009, there were no potential sharesincluded in our diluted EPS calculation because the effect wouldhave been anti-dilutive. Further information about potential commonshares is provided in Notes 23 and 24 of our 2008 Form 10-K.
Earnings-per-share amounts are computed independently forearnings from continuing operations, earnings (loss) fromdiscontinued operations and net earnings. As a result, the sum ofper-share amounts from continuing operations and discontinuedoperations may not equal the total per-share amounts for netearnings. Additionally, earnings-per-share amounts are computedindependently for each quarter. As a result, the sum of the per-shareamounts for each quarter may not equal the year-to-date amounts.
Source: GENERAL ELECTRIC CO, 10-Q, November 02, 2009
Note 14 Fair Value Measurements
Note 14 Fair Value Measurements 3 Months Ended 09/30/2009
FAIR VALUEMEASUREMENTS 14. Fair Value Measurements
We adopted FASB ASC 820 in two steps; effective January 1, 2008, we adopted it forall financial instruments and non-financial instruments accounted for at fair value on arecurring basis and effective January 1, 2009, for all non-financial instrumentsaccounted for at fair value on a non-recurring basis. This guidance establishes a newframework for measuring fair value and expands related disclosures. Broadly, theframework requires fair value to be determined based on the exchange price that wouldbe received for an asset or paid to transfer a liability (an exit price) in the principal ormost advantageous market for the asset or liability in an orderly transaction betweenmarket participants. It also establishes a three-level valuation hierarchy based uponobservable and non-observable inputs.For financial assets and liabilities, fair value is the price we would receive to sell anasset or pay to transfer a liability in an orderly transaction with a market participant atthe measurement date. In the absence of active markets for the identical assets orliabilities, such measurements involve developing assumptions based on marketobservable data and, in the absence of such data, internal information that is consistentwith what market participants would use in a hypothetical transaction that occurs at themeasurement date.Observable inputs reflect market data obtained from independent sources, whileunobservable inputs reflect our market assumptions. Preference is given to observableinputs. These two types of inputs create the following fair value hierarchy:Level 1 – Quoted prices for identical instruments in active markets.Level 2 – Quoted prices for similar instruments in active markets; quoted prices foridentical or similar instruments in markets that are not active; and model-derivedvaluations whose inputs are observable or whose significant value drivers areobservable.Level 3 – Significant inputs to the valuation model are unobservable.We maintain policies and procedures to value instruments using the best and mostrelevant data available. In addition, we have risk management teams that reviewvaluation, including independent price validation for certain instruments. Further, inother instances, we retain independent pricing vendors to assist in valuing certaininstruments.The following section describes the valuation methodologies we use to measuredifferent financial instruments at fair value on a recurring basis. There has been nochange to the valuation methodologies during 2009.Investments in Debt and Equity SecuritiesWhen available, we use quoted market prices to determine the fair value of investmentsecurities, and they are included in Level 1. Level 1 securities primarily includepublicly-traded equity securities.When quoted market prices are unobservable, we obtain pricing information from anindependent pricing vendor. The pricing vendor uses various pricing models for eachasset class that are consistent with what other market participants would use. The inputsand assumptions to the model of the pricing vendor are derived from market observablesources including: benchmark yields, reported trades, broker/dealer quotes, issuerspreads, benchmark securities, bids, offers, and other market-related data. Since manyfixed income securities do not trade on a daily basis, the methodology of the pricingvendor uses available information as applicable such as benchmark curves,benchmarking of like securities, sector groupings, and matrix pricing. The pricingvendor considers all available market observable inputs in determining the evaluationfor a security. Thus, certain securities may not be priced using quoted prices, but ratherdetermined from market observable information. These investments are included inLevel 2 and primarily comprise our portfolio of corporate fixed income, andgovernment, mortgage and asset-backed securities. In infrequent circumstances, our
Source: GENERAL ELECTRIC CO, 10-Q, November 02, 2009

pricing vendors may provide us with valuations that are based on significantunobservable inputs, and in those circumstances we classify the investment securities inLevel 3.Annually, we conduct reviews of our primary pricing vendor, with the assistance of anaccounting firm, to validate that the inputs used in that vendor’s pricing process aredeemed to be market observable as defined in the standard. While we were notprovided access to proprietary models of the vendor, our reviews have included on-sitewalk-throughs of the pricing process, methodologies and control procedures for eachasset class and level for which prices are provided. Our review also included anexamination of the underlying inputs and assumptions for a sample of individualsecurities across asset classes, credit rating levels and various durations, a process wecontinue to perform for each reporting period. In addition, the pricing vendor has anestablished challenge process in place for all security valuations, which facilitatesidentification and resolution of potentially erroneous prices. We believe that the pricesreceived from our pricing vendor are representative of prices that would be received tosell the assets at the measurement date (exit prices) and are classified appropriately inthe hierarchy.We use non-binding broker quotes as our primary basis for valuation when there islimited, or no, relevant market activity for a specific instrument or for other instrumentsthat share similar characteristics. We have not adjusted the prices we have obtained.Investment securities priced using non-binding broker quotes are included in Level 3.As is the case with our primary pricing vendor, third-party brokers do not provideaccess to their proprietary valuation models, inputs and assumptions. Accordingly, ourrisk management personnel conduct internal reviews of pricing for all such investmentsecurities quarterly to ensure reasonableness of valuations used in our financialstatements. These reviews are designed to identify prices that appear stale, those thathave changed significantly from prior valuations, and other anomalies that may indicatethat a price may not be accurate. Based on the information available, we believe thatthe fair values provided by the brokers are representative of prices that would bereceived to sell the assets at the measurement date (exit prices). Level 3 investmentsecurities valued using non-binding broker quotes totaled $1,059 million and $2,074million at September 30, 2009 and December 31, 2008, respectively, and wereclassified as available-for-sale securities.Retained interests in securitizations are valued using a discounted cash flow model thatconsiders the underlying structure of the securitization and estimated net creditexposure, prepayment assumptions, discount rates and expected life.Private equity investments held in investment company affiliates are initially valued atcost. Valuations are reviewed at the end of each quarter utilizing available market datato determine whether or not any fair value adjustments are necessary. Such market datainclude any comparable public company trading multiples. Unobservable inputs includecompany-specific fundamentals and other third-party transactions in that security.These investments are generally included in Level 3.DerivativesWe use closing prices for derivatives included in Level 1, which are traded either onexchanges or liquid over-the-counter markets.The majority of our derivatives portfolio is valued using internal models. The modelsmaximize the use of market observable inputs including interest rate curves and bothforward and spot prices for currencies and commodities. Derivative assets andliabilities included in Level 2 primarily represent interest rate swaps, cross-currencyswaps and foreign currency and commodity forward and option contracts.Derivative assets and liabilities included in Level 3 primarily represent interest rateproducts that contain embedded optionality or prepayment features.The following tables present our assets and liabilities measured at fair value on arecurring basis. Included in the tables are investment securities of $25,995 million and$21,967 million at September 30, 2009 and December 31, 2008, respectively, primarily
Source: GENERAL ELECTRIC CO, 10-Q, November 02, 2009

supporting obligations to annuitants and policyholders in our run-off insuranceoperations, and $7,204 million and $8,190 million at September 30, 2009 andDecember 31, 2008, respectively, supporting obligations to holders of guaranteedinvestment contracts. Such securities are mainly investment grade.
Netting (In millions) Level 1 Level 2 Level 3 adjustment (a) Net
balance
September 30,2009
Assets Investmentsecurities
Debt U.S. corporate $ 75 $ 20,192 $ 3,145 $ 0 $ 23,412 State andmunicipal
185 1,702 247 0 2,134
Residentialmortgage-backed
0 3,380 57 0 3,437
Commercialmortgage-backed
0 2,484 59 0 2,543
Asset-backed 0 830 1,902 0 2,732 Corporate –non-U.S.
238 725 750 0 1,713
Government –non-U.S.
1,156 2,048 166 0 3,370
U.S.government andfederal
0
agency 8 3,259 291 0 3,558 Retainedinterests
0 0 8,418 0 8,418
Equity 0 Available-for-sale 603 161 21 0 785 Trading 659 0 0 0 659 Derivatives(b) 0 12,124 856 (4,758) 8,222 Other(c) 2 0 971 0 973 Total $ 2,926 $ 46,905 $ 16,883 $ (4,758) $ 61,956
Liabilities Derivatives $ 0 $ 8,891 $ 283 $ (4,784) $ 4,390 Other(d) 0 804 0 0 804 Total $ 0 $ 9,695 $ 283 $ (4,784) $ 5,194
Source: GENERAL ELECTRIC CO, 10-Q, November 02, 2009

December 31,2008
Assets Investmentsecurities
Debt U.S. corporate $ 0 $ 17,191 $ 3,209 $ 0 $ 20,400 State andmunicipal
0 1,234 247 0 1,481
Residentialmortgage-backed
30 4,141 173 0 4,344
Commercialmortgage-backed
0 2,070 66 0 2,136
Asset-backed 0 880 1,605 0 2,485 Corporate –non-U.S.
69 562 658 0 1,289
Government –non-U.S.
496 422 424 0 1,342
U.S.government andfederal
agency 5 515 184 0 704 Retainedinterests
0 0 6,356 0 6,356
Equity Available-for-sale 475 12 34 0 521 Trading 83 305 0 0 388 Derivatives(b) 0 18,911 1,142 (7,411) 12,642 Other(c) 1 288 1,105 0 1,394 Total $ 1,159 $ 46,531 $ 15,203 $ (7,411) $ 55,482
Liabilities Derivatives $ 2 $ 12,643 $ 166 $ (7,575) $ 5,236 Other(d) 0 1,031 0 0 1,031 Total $ 2 $ 13,674 $ 166 $ (7,575) $ 6,267
(a) The netting of derivative receivables and payables is permitted when a legallyenforceable master netting agreement exists. Included fair value adjustments related toour own and counterparty credit risk.(b) The fair value of derivatives included an adjustment for non-performance risk.At September 30, 2009 and December 31, 2008, the cumulative adjustment was a gainof $26 million and $177 million, respectively.(c) Included private equity investments and loans designated under the fair valueoption.
Source: GENERAL ELECTRIC CO, 10-Q, November 02, 2009

(d) Primarily represented the liability associated with certain of our deferredincentive compensation plans.
The following tables present the changes in Level 3 instruments measured on arecurring basis for the three months ended September 30, 2009 and 2008, and the ninemonths ended September 30, 2009 and 2008. The majority of our Level 3 balancesconsist of investment securities classified as available-for-sale with changes in fairvalue recorded in shareowners’ equity.Changes in Level 3 Instruments for the Three Months Ended September 30, 2009
(In millions) Net realized/ Net change
unrealized inunrealized
gains (losses) gains(losses)
Netrealized/
included in relating to
unrealized accumulated Purchases, Transfers instruments
gains(losses) other issuances in and/or still held at
July 1, included in comprehensive and out of September30,
September30,
2009 earnings (a) income settlements Level 3 (b) 2009 2009 (c)
Investmentsecurities
Debt
U.S. corporate $ 2,925 $ (33) $ 258 $ (46) $ 41 $ 3,145 $ 1
State andmunicipal
157 0 6 73 11 247 0
Residential
mortgage-backed 62 (1) 5 0 (9) 57 0
Commercial
mortgage-backed 50 0 4 0 5 59 0
Asset-backed 1,814 (10) 17 (30) 111 1,902 0
Corporate –non-U.S.
639 15 72 (4) 28 750 0
Government
– non-U.S. 143 0 10 14 (1) 166 0
U.S. governmentand
federal agency 266 22 4 (1) 0 291 0
Retained interests 7,525 275 74 544 0 8,418 75
Equity
Available-for-sale 18 0 2 0 1 21 1
Trading 0 0 0 0 0 0 0
Derivatives(d)(e) 789 47 27 (68) (184) 611 62
Other 1,031 (90) 21 9 0 971 (90)
Total $ 15,419 $ 225 $ 500 $ 491 $ 3 $ 16,638 $ 49
(a) Earnings effects are primarily included in the “GECS revenues from services”and “Interest and other financial charges” captions in the Condensed Statement of
Source: GENERAL ELECTRIC CO, 10-Q, November 02, 2009

Earnings.(b) Transfers in and out of Level 3 are considered to occur at the beginning of theperiod. Transfers out of Level 3 were a result of increased use of quotes fromindependent pricing vendors based on recent trading activity.(c) Represented the amount of unrealized gains or losses for the period included inearnings.(d) Earnings from derivatives were more than offset by $83 million in losses fromrelated derivatives included in Level 2.(e) Represented derivative assets net of derivative liabilities and included cashaccruals of $38 million not reflected in the fair value hierarchy table.
Changes in Level 3 Instruments for the Three Months Ended September 30, 2008
(In millions) Net realized/ Net change
unrealized inunrealized
gains (losses) gains(losses)
Netrealized/
included in relating to
unrealized accumulated Purchases, Transfers instruments
gains(losses) other issuances in and/or still held at
July 1, included in comprehensive and out of September30,
September30,
2008 earnings (a) income settlements Level 3 (b) 2008 2008 (c)
Investmentsecurities
$ 13,830 $ 278 $ (321) $ (484) $ (291) $ 13,012 $ 128
Derivatives(d)(e) 491 414 18 (61) 9 871 359
Other 1,349 (84) (39) (5) (1) 1,220 (88)
Total $ 15,670 $ 608 $ (342) $ (550) $ (283) $ 15,103 $ 399
(a) Earnings effects are primarily included in the “GECS revenues from services”and “Interest and other financial charges” captions in the Condensed Statement ofEarnings.(b) Transfers in and out of Level 3 are considered to occur at the beginning of theperiod.(c) Represented the amount of unrealized gains or losses for the period included inearnings.(d) Earnings from derivatives were more than offset by $190 million in losses fromrelated derivatives included in Level 2 and $253 million in losses from qualifying fairvalue hedges.(e) Represented derivative assets net of derivative liabilities and included cashaccruals of $23 million not reflected in the fair value hierarchy table. Changes in Level 3 Instruments for the Nine Months Ended September 30, 2009
(In millions) Net realized/ Net change
unrealized inunrealized
gains (losses) gains(losses)
Netrealized/
included in relating to
Source: GENERAL ELECTRIC CO, 10-Q, November 02, 2009
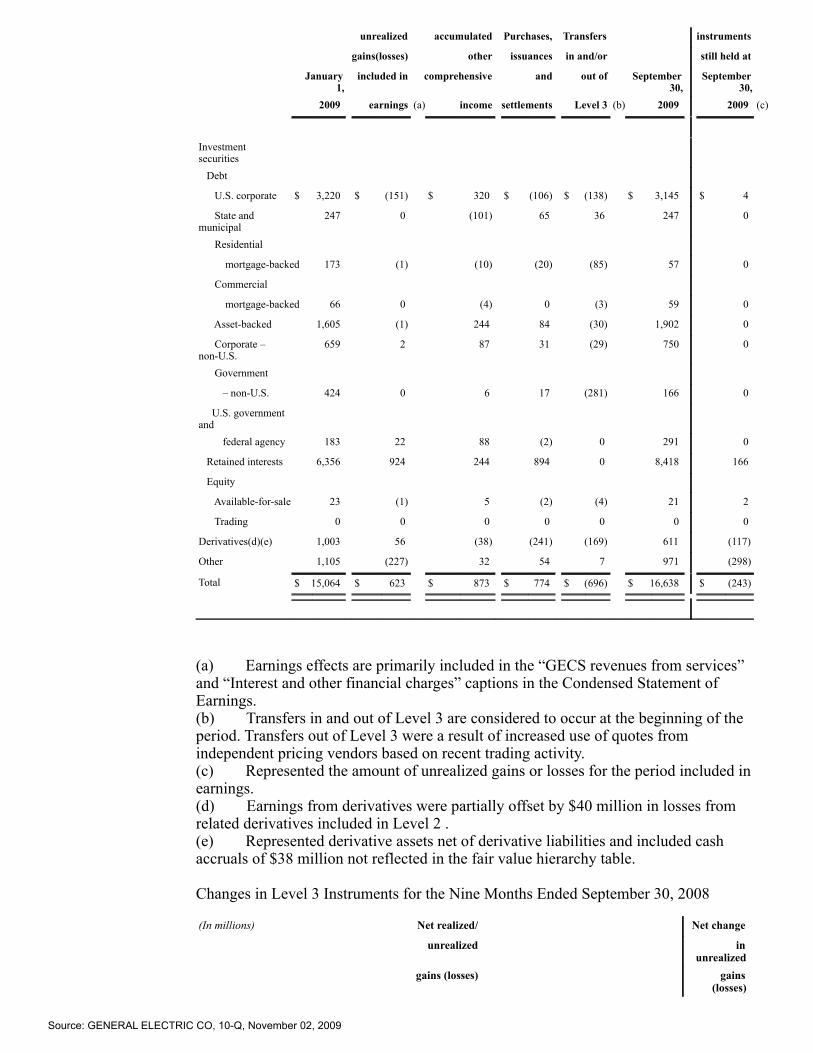
unrealized accumulated Purchases, Transfers instruments
gains(losses) other issuances in and/or still held at
January1,
included in comprehensive and out of September30,
September30,
2009 earnings (a) income settlements Level 3 (b) 2009 2009 (c)
Investmentsecurities
Debt
U.S. corporate $ 3,220 $ (151) $ 320 $ (106) $ (138) $ 3,145 $ 4
State andmunicipal
247 0 (101) 65 36 247 0
Residential
mortgage-backed 173 (1) (10) (20) (85) 57 0
Commercial
mortgage-backed 66 0 (4) 0 (3) 59 0
Asset-backed 1,605 (1) 244 84 (30) 1,902 0
Corporate –non-U.S.
659 2 87 31 (29) 750 0
Government
– non-U.S. 424 0 6 17 (281) 166 0
U.S. governmentand
federal agency 183 22 88 (2) 0 291 0
Retained interests 6,356 924 244 894 0 8,418 166
Equity
Available-for-sale 23 (1) 5 (2) (4) 21 2
Trading 0 0 0 0 0 0 0
Derivatives(d)(e) 1,003 56 (38) (241) (169) 611 (117)
Other 1,105 (227) 32 54 7 971 (298)
Total $ 15,064 $ 623 $ 873 $ 774 $ (696) $ 16,638 $ (243)
(a) Earnings effects are primarily included in the “GECS revenues from services”and “Interest and other financial charges” captions in the Condensed Statement ofEarnings.(b) Transfers in and out of Level 3 are considered to occur at the beginning of theperiod. Transfers out of Level 3 were a result of increased use of quotes fromindependent pricing vendors based on recent trading activity.(c) Represented the amount of unrealized gains or losses for the period included inearnings.(d) Earnings from derivatives were partially offset by $40 million in losses fromrelated derivatives included in Level 2 .(e) Represented derivative assets net of derivative liabilities and included cashaccruals of $38 million not reflected in the fair value hierarchy table.
Changes in Level 3 Instruments for the Nine Months Ended September 30, 2008
(In millions) Net realized/ Net change
unrealized inunrealized
gains (losses) gains(losses)
Source: GENERAL ELECTRIC CO, 10-Q, November 02, 2009

Netrealized/
included in relating to
unrealized accumulated Purchases, Transfers instruments
gains(losses) other issuances in and/or still held at
January1,
included in comprehensive and out of September30,
September30,
2008 earnings (a) income settlements Level 3 (b) 2008 2008 (c)
Investmentsecurities
$ 12,447 $ 619 $ (503) $ 60 $ 389 $ 13,012 $ 101
Derivatives(d)(e) 265 719 40 (162) 9 871 554
Other 1,330 (110) (9) (41) 50 1,220 (54)
Total $ 14,042 $ 1,228 $ (472) $ (143) $ 448 $ 15,103 $ 601
(a) Earnings effects are primarily included in the “GECS revenues from services”and “Interest and other financial charges” captions in the Condensed Statement ofEarnings.(b) Transfers in and out of Level 3 are considered to occur at the beginning of theperiod.(c) Represented the amount of unrealized gains or losses for the period included inearnings.(d) Earnings from derivatives were partially offset by $275 million in losses fromrelated derivatives included in Level 2 and $309 million in losses from qualifying fairvalue hedges.(e) Represented derivative assets net of derivative liabilities and included cashaccruals of $23 million not reflected in the fair value hierarchy table.
Non-Recurring Fair Value MeasurementsCertain assets are measured at fair value on a non-recurring basis. These assets are notmeasured at fair value on an ongoing basis but are subject to fair value adjustmentsonly in certain circumstances. These include certain loans that are written down to fairvalue when they are held for sale or when they are written down to the fair value oftheir underlying collateral when deemed impaired, cost and equity method investmentsthat are written down to fair value when their declines are determined to beother-than-temporary, long-lived assets that are written down to fair value when theyare held for sale or determined to be impaired and the remeasurement of retainedinvestments in formerly consolidated subsidiaries.Non-recurring fair value amounts (as measured at the time of the adjustment) for assetsstill held at September 30, 2009 and December 31, 2008, totaled $744 million and $48million, identified as Level 2, and $16,233 million and $3,145 million, identified asLevel 3, respectively. Level 3 amounts at September 30, 2009 primarily included ourretained investment in PTL ($5,991 million), financing receivables and loans held forsale ($5,404 million), long-lived assets ($3,215 million), primarily real estate held forinvestment and equipment leased to others, and cost and equity method investments($1,313 million).The following table represents the fair value adjustments to assets measured at fairvalue on a non-recurring basis and still held at September 30, 2009 and September 30,2008.
Three months endedSeptember 30
Nine months endedSeptember 30
(In millions) 2009 2008 2009 2008
Source: GENERAL ELECTRIC CO, 10-Q, November 02, 2009
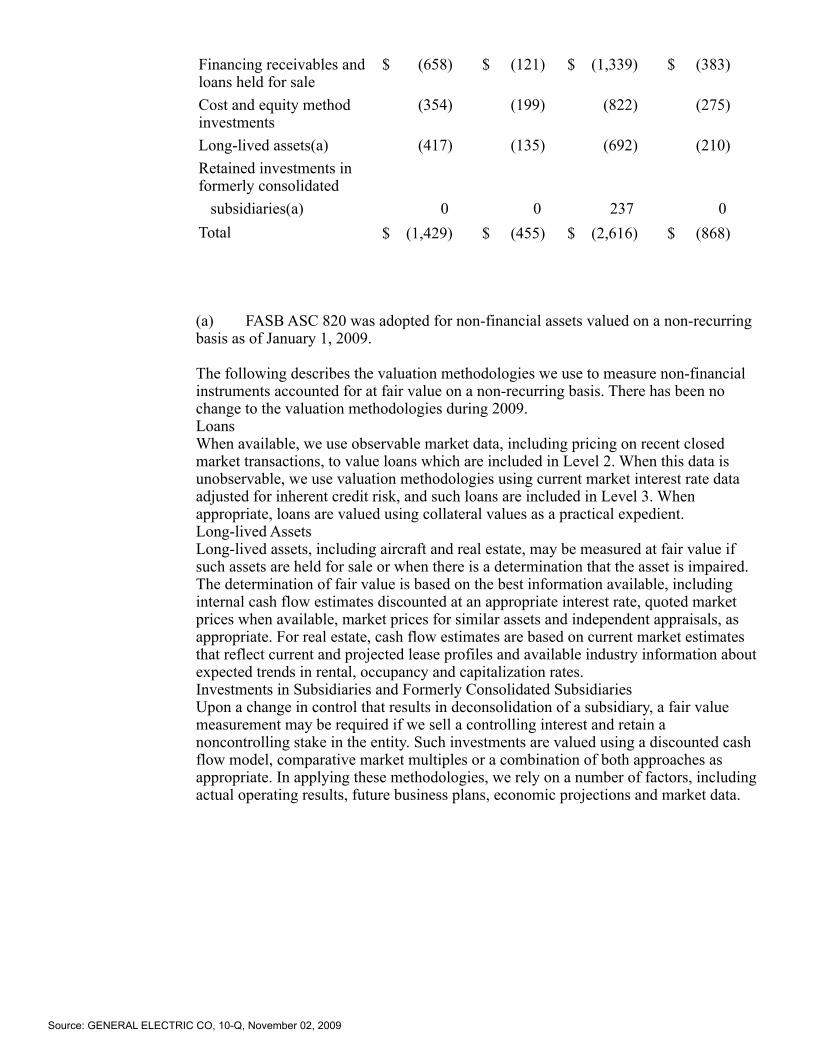
Financing receivables andloans held for sale
$ (658) $ (121) $ (1,339) $ (383)
Cost and equity methodinvestments
(354) (199) (822) (275)
Long-lived assets(a) (417) (135) (692) (210)Retained investments informerly consolidated
subsidiaries(a) 0 0 237 0 Total $ (1,429) $ (455) $ (2,616) $ (868)
(a) FASB ASC 820 was adopted for non-financial assets valued on a non-recurringbasis as of January 1, 2009.
The following describes the valuation methodologies we use to measure non-financialinstruments accounted for at fair value on a non-recurring basis. There has been nochange to the valuation methodologies during 2009.LoansWhen available, we use observable market data, including pricing on recent closedmarket transactions, to value loans which are included in Level 2. When this data isunobservable, we use valuation methodologies using current market interest rate dataadjusted for inherent credit risk, and such loans are included in Level 3. Whenappropriate, loans are valued using collateral values as a practical expedient.Long-lived AssetsLong-lived assets, including aircraft and real estate, may be measured at fair value ifsuch assets are held for sale or when there is a determination that the asset is impaired.The determination of fair value is based on the best information available, includinginternal cash flow estimates discounted at an appropriate interest rate, quoted marketprices when available, market prices for similar assets and independent appraisals, asappropriate. For real estate, cash flow estimates are based on current market estimatesthat reflect current and projected lease profiles and available industry information aboutexpected trends in rental, occupancy and capitalization rates.Investments in Subsidiaries and Formerly Consolidated SubsidiariesUpon a change in control that results in deconsolidation of a subsidiary, a fair valuemeasurement may be required if we sell a controlling interest and retain anoncontrolling stake in the entity. Such investments are valued using a discounted cashflow model, comparative market multiples or a combination of both approaches asappropriate. In applying these methodologies, we rely on a number of factors, includingactual operating results, future business plans, economic projections and market data.
Source: GENERAL ELECTRIC CO, 10-Q, November 02, 2009

Note 15 Financial Instruments
Note 15 Financial Instruments 3 Months Ended 09/30/2009
INTERIM DISCLOSUREABOUT FAIR VALUE OFFINANCIALINSTRUMENTS
15. Financial InstrumentsThe following table provides information about the assets and liabilities not carried atfair value in our Statement of Financial Position. Consistent with FASB ASC 825,the table excludes financing leases and non-financial assets and liabilities. Apart fromcertain of our borrowings and certain marketable securities, few of the instrumentsidentified below are actively traded and their fair values must often be determinedusing financial models. Realization of the fair value of these instruments dependsupon market forces beyond our control, including marketplace liquidity. For adescription on how we estimate fair value, see Note 29 to the consolidated financialstatements in our 2008 Form 10K.
At
September 30, 2009 December 31, 2008
Assets (liabilities) Assets (liabilities)
Carrying Carrying
Notional amount Estimated Notional amount Estimated(In millions) amount (net) fair value amount (net) fair value
GE Assets Investmentsand notes
receivable $ (a) $ 443 $ 434 $ (a) $ 554 $ 511 Liabilities Borrowings (a) (12,247) (12,938) (a) (12,202) (12,267)GECS Assets Loans (a) 291,774 273,017 (a) 305,376 292,797 Othercommercialmortgages
(a) 1,172 1,194 (a) 1,501 1,427
Loans held forsale
(a) 1,864 1,898 (a) 3,640 3,670
Other financialinstruments (b)
(a) 2,229 2,351 (a) 2,637 2,810
Liabilities Borrowings(c)(d) (a) (508,353) (509,465) (a) (514,601) (495,541) Investmentcontract benefits
(a) (4,003) (4,556) (a) (4,212) (4,536)
Guaranteedinvestment
contracts (a) (9,241) (9,156) (a) (10,828) (10,677) Insurance –credit life(e)
1,481 (74) (49) 1,165 (44) (31)
(a) These financial instruments do not have notional amounts.(b) Principally cost method investments.(c) See Note 8.(d) Fair values exclude interest rate and currency derivatives designated ashedges of borrowings. Had they been included, the fair value of borrowings atSeptember 30, 2009 and December 31, 2008 would have been reduced by $3,367
Source: GENERAL ELECTRIC CO, 10-Q, November 02, 2009

million and $3,776 million, respectively.(e) Net of reinsurance of $2,300 million and $3,103 million at September 30,2009 and December 31, 2008, respectively.
Loan Commitments
Notional amount at September 30, December 31,(in millions) 2009 2008 Ordinary course of business lendingcommitments (a)(b)
$ 7,370 $ 8,507
Unused revolving credit lines(c) Commercial 30,259 26,300 Consumer – principally credit cards 245,764 252,867
(a) Excluded investment commitments of $2,493 million and $3,501 million asof September 30, 2009 and December 31, 2008, respectively.(b) Included a $1,004 million and $1,067 million commitment as of September30, 2009 and December 31, 2008, respectively, associated with a secured financingarrangement that can increase to a maximum of $4,943 million based on the assetvolume under the arrangement.(c) Excluded inventory financing arrangement, which may be withdrawn at ouroption, of $13,234 million and $14,503 million as of September 30, 2009 andDecember 31, 2008, respectively.
DERIVATES ANDHEDGING Derivatives and Hedging
On January 1, 2009, in accordance with FASB ASC 815, we began disclosingadditional qualitative and quantitative information about our derivative and hedgingactivities. The following disclosures should be read in the context of our existingdisclosure in Note 29 to the consolidated financial statements in our 2008 Form10-K.As a matter of policy, we use derivatives for risk management purposes. We do notuse derivatives for speculative purposes. A key risk management objective for ourfinancial services businesses is to mitigate interest rate and currency risk by seekingto ensure that the characteristics of the debt match the assets they are funding. If theform (fixed versus floating) and currency denomination of the debt we issue do notmatch the related assets, we typically execute derivatives to adjust the nature andtenor of debt funding to meet this objective. The determination of whether aderivative is used to achieve this objective depends on a number of factors, includingcustomer needs for specific types of financing, and market factors affecting the typeof debt we can issue.Of the outstanding notional amount of $353,000 million, approximately 87%, or$305,000 million, is associated with reducing or eliminating the interest rate,currency or market risk between financial assets and liabilities in our financialservices businesses. The remaining derivatives activity primarily relates to hedgingagainst adverse changes in currency exchange rates and commodity prices related toanticipated sales and purchases. These activities are designated as hedges whenpracticable. When it is not possible to apply hedge accounting, or when the derivativeand the hedged item are both recorded in earnings currently, the derivatives areaccounted for as economic hedges and hedge accounting is not applied. This mostfrequently occurs when we hedge a recognized foreign currency transaction (e.g., a
Source: GENERAL ELECTRIC CO, 10-Q, November 02, 2009
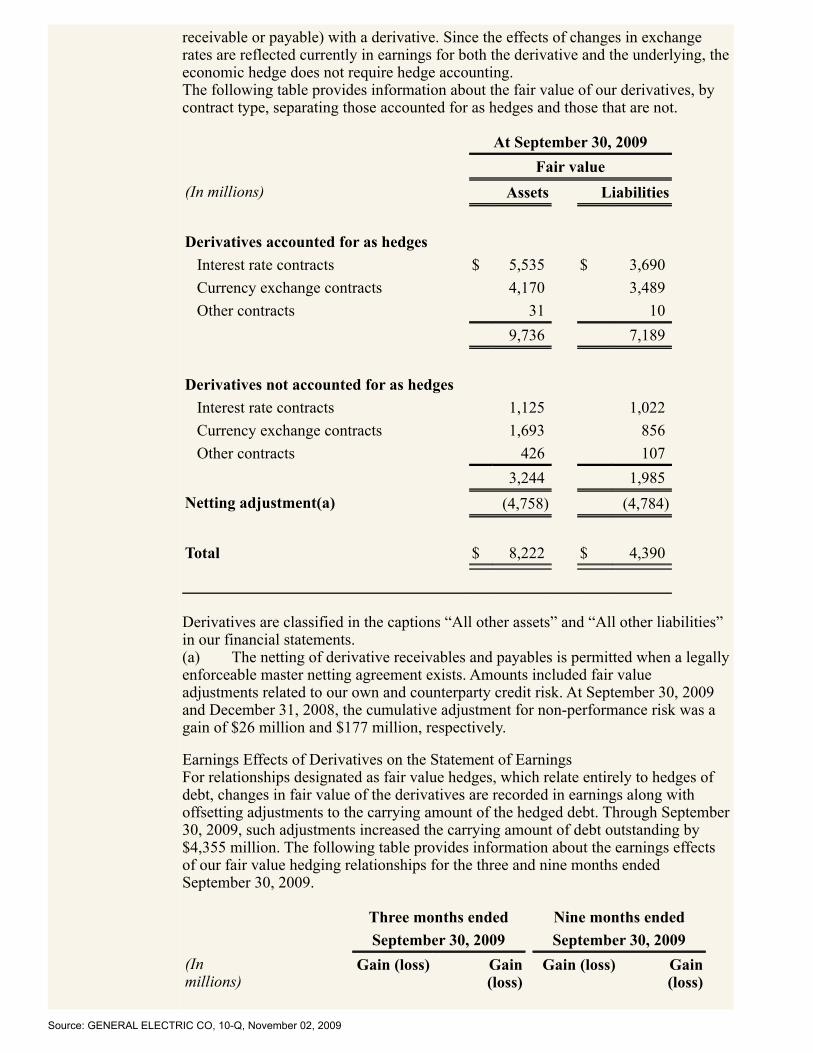
receivable or payable) with a derivative. Since the effects of changes in exchangerates are reflected currently in earnings for both the derivative and the underlying, theeconomic hedge does not require hedge accounting.The following table provides information about the fair value of our derivatives, bycontract type, separating those accounted for as hedges and those that are not.
At September 30, 2009 Fair value
(In millions) Assets Liabilities Derivatives accounted for as hedges Interest rate contracts $ 5,535 $ 3,690 Currency exchange contracts 4,170 3,489 Other contracts 31 10 9,736 7,189 Derivatives not accounted for as hedges Interest rate contracts 1,125 1,022 Currency exchange contracts 1,693 856 Other contracts 426 107 3,244 1,985 Netting adjustment(a) (4,758) (4,784) Total $ 8,222 $ 4,390
Derivatives are classified in the captions “All other assets” and “All other liabilities”in our financial statements.(a) The netting of derivative receivables and payables is permitted when a legallyenforceable master netting agreement exists. Amounts included fair valueadjustments related to our own and counterparty credit risk. At September 30, 2009and December 31, 2008, the cumulative adjustment for non-performance risk was again of $26 million and $177 million, respectively.
Earnings Effects of Derivatives on the Statement of EarningsFor relationships designated as fair value hedges, which relate entirely to hedges ofdebt, changes in fair value of the derivatives are recorded in earnings along withoffsetting adjustments to the carrying amount of the hedged debt. Through September30, 2009, such adjustments increased the carrying amount of debt outstanding by$4,355 million. The following table provides information about the earnings effectsof our fair value hedging relationships for the three and nine months endedSeptember 30, 2009.
Three months ended Nine months ended September 30, 2009 September 30, 2009(Inmillions)
Gain (loss) Gain(loss)
Gain (loss) Gain(loss)
Source: GENERAL ELECTRIC CO, 10-Q, November 02, 2009

on hedging on hedged on hedging onhedged
Financialstatementcaption
derivatives items derivatives items
Interestratecontracts
Interest andotherfinancialcharges
$ 1,559 $ (1,768) $ (3,621) $ 3,478
Currencyexchangecontracts
Interest andotherfinancialcharges
(36) 53 (1,094) 1,085
Fair value hedges resulted in $(192) million and $(152) million of ineffectiveness ofwhich $(153) million and $(228) million reflects amounts excluded from theassessment of effectiveness for the three and nine months ended September 30, 2009,respectively.
For derivatives that are designated in a cash flow hedging relationship, the effectiveportion of the change in fair value of the derivative is reported in the cash flowhedges subaccount of AOCI and reclassified into earnings contemporaneously withthe earnings effects of the hedged transaction. Earnings effects of the derivative andthe hedged item are reported in the same caption in the Statement of Earnings. Hedgeineffectiveness and components of changes in fair value of the derivative that areexcluded from the assessment of effectiveness are recognized in earnings eachreporting period.For derivatives that are designated as hedges of net investment in a foreign operation,we assess effectiveness based on changes in spot currency exchange rates. Changesin spot rates on the derivative are recorded in the currency translation adjustmentssubaccount of AOCI until such time as the foreign entity is substantially liquidated orsold. The change in fair value of the forward points, which reflects the interest ratedifferential between the two countries on the derivative, are excluded from theeffectiveness assessment and are recorded currently in earnings.The following tables provide additional information about the financial statementeffects related to our cash flow hedges and net investment hedges for the three andnine months ended September 30, 2009.
Financialstatementcaption
Gain (loss) reclassified Gain (loss) from
AOCI recognized intoThree monthsendedSeptember 30,2009
in OCI earnings
(In millions)
Source: GENERAL ELECTRIC CO, 10-Q, November 02, 2009

Cash flowhedges
Interest ratecontracts
$ 27 Interest andother financialcharges
$ (495)
GECS revenuesfrom services
7
Currencyexchangecontracts
275 Interest andother financialcharges
228
Other costs andexpenses
(73)
GECS revenuesfrom services
(36)
Sales of goodsand services
53
Other income (2) Commoditycontracts
(34) GECS revenuesfrom services
(24)
Other costs andexpenses
0
Total $ 268 $ (342)
Gain (loss) Gain (loss) recognized reclassified in CTA from CTA
Net investmenthedges
Currencyexchangecontracts
$ (1,702) GECS revenuesfrom services
$ (2)
Financialstatementcaption
Gain (loss) reclassified Gain (loss) from
AOCI recognized intoNine monthsendedSeptember 30,2009
in OCI earnings
(In millions)
Source: GENERAL ELECTRIC CO, 10-Q, November 02, 2009
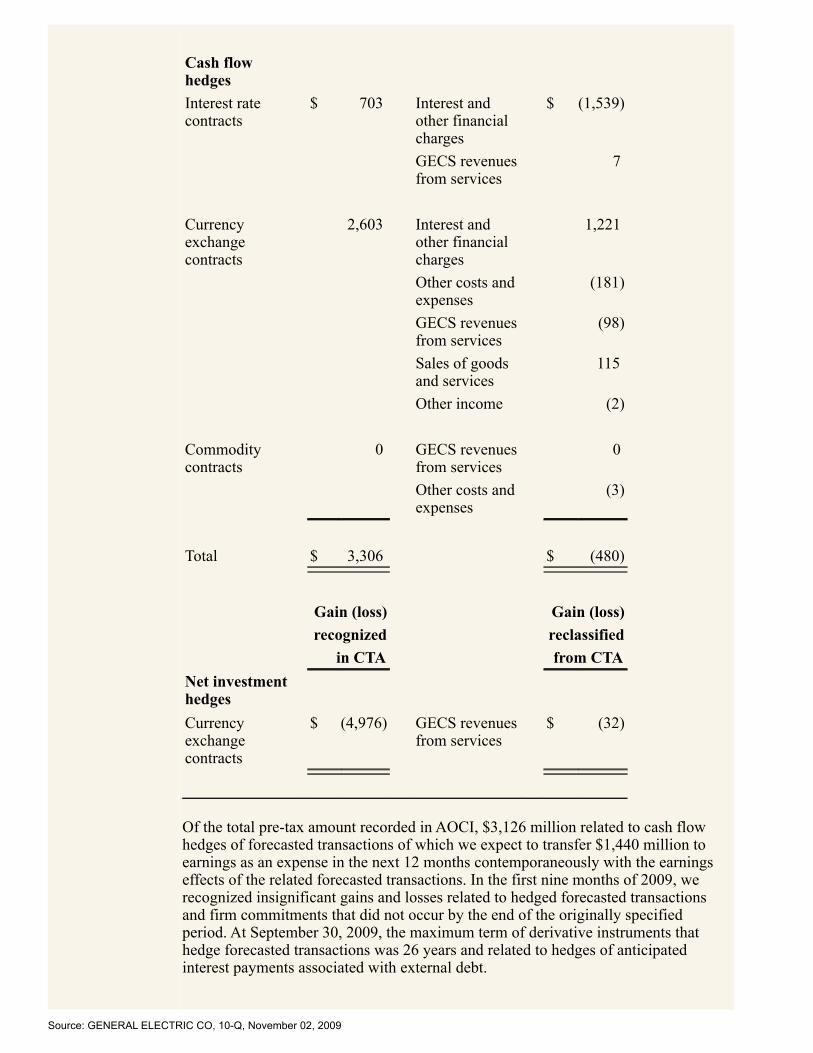
Cash flowhedges
Interest ratecontracts
$ 703 Interest andother financialcharges
$ (1,539)
GECS revenuesfrom services
7
Currencyexchangecontracts
2,603 Interest andother financialcharges
1,221
Other costs andexpenses
(181)
GECS revenuesfrom services
(98)
Sales of goodsand services
115
Other income (2) Commoditycontracts
0 GECS revenuesfrom services
0
Other costs andexpenses
(3)
Total $ 3,306 $ (480)
Gain (loss) Gain (loss) recognized reclassified in CTA from CTA
Net investmenthedges
Currencyexchangecontracts
$ (4,976) GECS revenuesfrom services
$ (32)
Of the total pre-tax amount recorded in AOCI, $3,126 million related to cash flowhedges of forecasted transactions of which we expect to transfer $1,440 million toearnings as an expense in the next 12 months contemporaneously with the earningseffects of the related forecasted transactions. In the first nine months of 2009, werecognized insignificant gains and losses related to hedged forecasted transactionsand firm commitments that did not occur by the end of the originally specifiedperiod. At September 30, 2009, the maximum term of derivative instruments thathedge forecasted transactions was 26 years and related to hedges of anticipatedinterest payments associated with external debt.
Source: GENERAL ELECTRIC CO, 10-Q, November 02, 2009
For cash flow hedges, the amount of ineffectiveness in the hedging relationship andamount of the changes in fair value of the derivative that are not included in themeasurement of ineffectiveness are both reflected in earnings each reporting period.These amounts totaled $9 million and $11 million for the three and nine monthsended September 30, 2009, respectively, and primarily appear in GECS revenuesfrom services. Ineffectiveness from net investment hedges was $(99) million and$(656) million for the three and nine months ended September 30, 2009, respectively,which primarily related to changes in value of the forward points that under ourhedge accounting designations are excluded from the assessment of effectiveness andrecorded directly into earnings. These amounts appear in the “Interest and otherfinancial charges” caption in the Statement of Earnings.Changes in the fair value of derivatives that are not designated as hedges are recordedin earnings each period. As discussed above, these derivatives are entered into aseconomic hedges of changes in interest rates, currency exchange rates, commodityprices and other market risks. Gains or losses related to the derivative are recorded inpredefined captions in the Statement of Earnings, typically “GECS revenues fromservices” or “Other income,” based on our accounting policy. In general, the earningseffects of the item that represents the economic risk exposure is recorded in the samecaption as the derivative. Gains for the first nine months of 2009 on derivatives notdesignated as hedges, without considering the offsetting earnings effects from theitem representing the economic risk exposure, were $562 million, related to interestrate contracts of $140 million, currency exchange contracts of $171 million andequity, credit and commodity derivatives of $251 million.
Counterparty Credit RiskTo lower our exposure to credit risk, our standard master agreements typicallycontain mutual downgrade provisions that provide the ability of each party to requireassignment or termination if the long-term credit rating of the counterparty were tofall below A-/A3. In certain of these master agreements, each party also has theability to require assignment or termination if the short-term rating of thecounterparty were to fall below A-1/P-1. The net derivative liability subject to theseprovisions was approximately $2,687 million at September 30, 2009. In addition tothese provisions, in certain of these master agreements, we also have collateralarrangements that provide us with the right to hold collateral (cash or U.S. Treasuriesor other highly-rated securities) when the current market value of derivative contractsexceeds a specified limit. We also have a limited number of such collateralagreements under which we must post collateral. Under these agreements and in thenormal course of business, the fair value of collateral posted by counterparties atSeptember 30, 2009, was approximately $7,978 million, of which $2,500 million washeld in cash and $5,478 million represented pledged securities. The fair value ofcollateral posted by us was approximately $1,836 million, of which $1,771 millionwas cash and $65 million represented securities repledged.More information regarding our counterparty credit risk and master agreements canbe found in Note 29 to the consolidated financial statements in our 2008 Form 10-K.
Guarantees of DerivativesWe do not sell credit default swaps; however, as part of our risk managementservices, we provide certain performance guarantees to third-party financialinstitutions related to plain vanilla interest rate swaps on behalf of some customersrelated to variable rate loans we have extended to them. The fair value of suchguarantees was $28 million at September 30, 2009. The aggregate fair value ofcustomer derivative contracts in a liability position at September 30, 2009, was $314million before consideration of any offsetting effect of collateral. At September 30,2009, collateral value was sufficient to cover the loan amount and the fair value ofthe customer’s derivative, in the event we had been called upon to perform under thederivative. Given our strict underwriting criteria, we believe the likelihood that we
Source: GENERAL ELECTRIC CO, 10-Q, November 02, 2009

will be required to perform under these guarantees is remote.
Source: GENERAL ELECTRIC CO, 10-Q, November 02, 2009
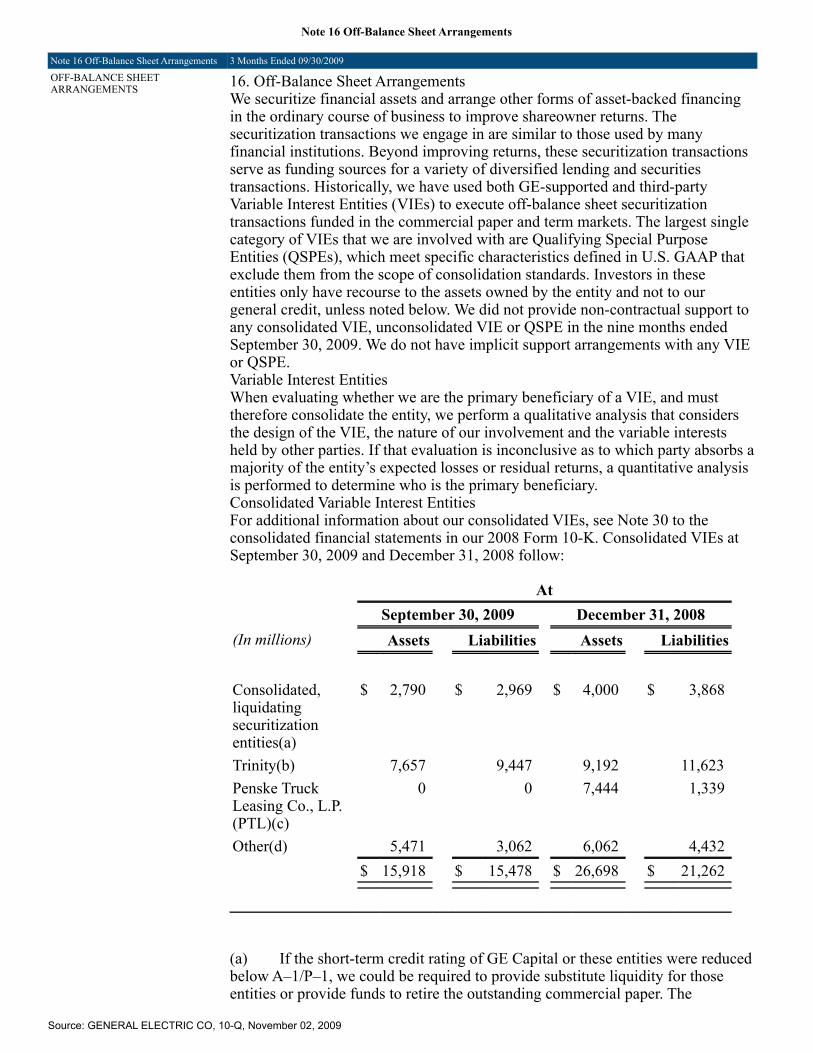
Note 16 Off-Balance Sheet Arrangements
Note 16 Off-Balance Sheet Arrangements 3 Months Ended 09/30/2009
OFF-BALANCE SHEETARRANGEMENTS 16. Off-Balance Sheet Arrangements
We securitize financial assets and arrange other forms of asset-backed financingin the ordinary course of business to improve shareowner returns. Thesecuritization transactions we engage in are similar to those used by manyfinancial institutions. Beyond improving returns, these securitization transactionsserve as funding sources for a variety of diversified lending and securitiestransactions. Historically, we have used both GE-supported and third-partyVariable Interest Entities (VIEs) to execute off-balance sheet securitizationtransactions funded in the commercial paper and term markets. The largest singlecategory of VIEs that we are involved with are Qualifying Special PurposeEntities (QSPEs), which meet specific characteristics defined in U.S. GAAP thatexclude them from the scope of consolidation standards. Investors in theseentities only have recourse to the assets owned by the entity and not to ourgeneral credit, unless noted below. We did not provide non-contractual support toany consolidated VIE, unconsolidated VIE or QSPE in the nine months endedSeptember 30, 2009. We do not have implicit support arrangements with any VIEor QSPE.Variable Interest EntitiesWhen evaluating whether we are the primary beneficiary of a VIE, and musttherefore consolidate the entity, we perform a qualitative analysis that considersthe design of the VIE, the nature of our involvement and the variable interestsheld by other parties. If that evaluation is inconclusive as to which party absorbs amajority of the entity’s expected losses or residual returns, a quantitative analysisis performed to determine who is the primary beneficiary.Consolidated Variable Interest EntitiesFor additional information about our consolidated VIEs, see Note 30 to theconsolidated financial statements in our 2008 Form 10-K. Consolidated VIEs atSeptember 30, 2009 and December 31, 2008 follow:
At September 30, 2009 December 31, 2008(In millions) Assets Liabilities Assets Liabilities Consolidated,liquidatingsecuritizationentities(a)
$ 2,790 $ 2,969 $ 4,000 $ 3,868
Trinity(b) 7,657 9,447 9,192 11,623 Penske TruckLeasing Co., L.P.(PTL)(c)
0 0 7,444 1,339
Other(d) 5,471 3,062 6,062 4,432 $ 15,918 $ 15,478 $ 26,698 $ 21,262
(a) If the short-term credit rating of GE Capital or these entities were reducedbelow A–1/P–1, we could be required to provide substitute liquidity for thoseentities or provide funds to retire the outstanding commercial paper. The
Source: GENERAL ELECTRIC CO, 10-Q, November 02, 2009

maximum net amount that we could be required to provide in the event of such adowngrade is determined by contract and totaled $2,900 million at September 30,2009. The borrowings of these entities are reflected in our Statement of FinancialPosition.(b) If the long-term credit rating of GE Capital were to fall below AA-/Aa3or its short-term credit rating were to fall below A-1+/P-1, GE Capital could berequired to provide approximately $2,917 million to such entities as of September30, 2009 pursuant to letters of credit issued by GE Capital. To the extent that theentities’ liabilities exceed the ultimate value of the proceeds from the sale of theirassets and the amount drawn under the letters of credit, GE Capital could berequired to provide such excess amount. The borrowings of these entities arereflected in our Statement of Financial Position.(c) In the first quarter of 2009, we sold a 1% limited partnership interest inPTL, a previously consolidated VIE, to Penske Truck Leasing Corporation, thegeneral partner of PTL, whose majority shareowner is a member of GE’s Boardof Directors. The disposition of the shares, coupled with our resulting minorityposition on the PTL advisory committee and related changes in our contractualrights, resulted in the deconsolidation of PTL. We recognized a pre-tax gain onthe sale of $296 million, including a gain on the remeasurement of our retainedinvestment of $189 million. The measurement of the fair value of our retainedinvestment in PTL was based on a methodology that incorporated bothdiscounted cash flow information and market data. In applying this methodology,we utilized different sources of information, including actual operating results,future business plans, economic projections and market observable pricingmultiples of similar businesses. The resulting fair value reflected our position as anoncontrolling shareowner at the conclusion of the transaction.(d) A majority of the remaining assets and liabilities of VIEs that areincluded in our consolidated financial statements were acquired in transactionssubsequent to January 1, 2004. Assets of these entities consist of amortizingsecuritizations of financial assets originated by acquirees in Australia and Japan,and real estate partnerships. We have no recourse arrangements with theseentities.
Unconsolidated Variable Interest EntitiesOur involvement with unconsolidated VIEs consists of the following activities:assisting in the formation and financing of an entity, providing recourse and/orliquidity support, servicing the assets and receiving variable fees for servicesprovided. The classification in our financial statements of our variable interests inthese entities depends on the nature of the entity. As described below, ourretained interests in securitization-related VIEs and QSPEs is reported infinancing receivables or investment securities depending on its legal form.Variable interests in partnerships and corporate entities would be classified aseither equity method or cost method investments.In the ordinary course of business, we make investments in entities in which weare not the primary beneficiary, but may hold a variable interest such as limitedpartner equity interests or mezzanine debt investment. These investments areclassified in two captions in our financial statements: “All other assets” forinvestments accounted for under the equity method, and “GECS financingreceivables” for debt financing provided to these entities.Investments in unconsolidated VIEs at September 30, 2009 and December 31,2008 follow:
At
Source: GENERAL ELECTRIC CO, 10-Q, November 02, 2009
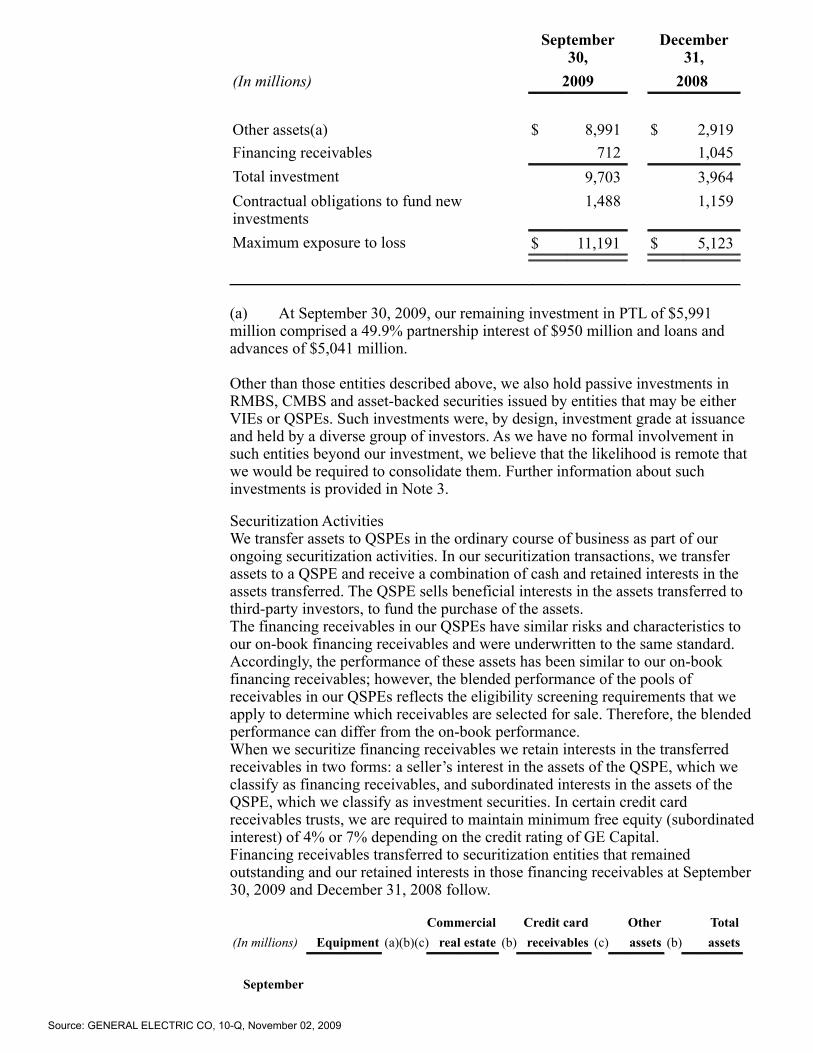
September30,
December31,
(In millions) 2009 2008 Other assets(a) $ 8,991 $ 2,919 Financing receivables 712 1,045 Total investment 9,703 3,964 Contractual obligations to fund newinvestments
1,488 1,159
Maximum exposure to loss $ 11,191 $ 5,123
(a) At September 30, 2009, our remaining investment in PTL of $5,991million comprised a 49.9% partnership interest of $950 million and loans andadvances of $5,041 million.
Other than those entities described above, we also hold passive investments inRMBS, CMBS and asset-backed securities issued by entities that may be eitherVIEs or QSPEs. Such investments were, by design, investment grade at issuanceand held by a diverse group of investors. As we have no formal involvement insuch entities beyond our investment, we believe that the likelihood is remote thatwe would be required to consolidate them. Further information about suchinvestments is provided in Note 3.
Securitization ActivitiesWe transfer assets to QSPEs in the ordinary course of business as part of ourongoing securitization activities. In our securitization transactions, we transferassets to a QSPE and receive a combination of cash and retained interests in theassets transferred. The QSPE sells beneficial interests in the assets transferred tothird-party investors, to fund the purchase of the assets.The financing receivables in our QSPEs have similar risks and characteristics toour on-book financing receivables and were underwritten to the same standard.Accordingly, the performance of these assets has been similar to our on-bookfinancing receivables; however, the blended performance of the pools ofreceivables in our QSPEs reflects the eligibility screening requirements that weapply to determine which receivables are selected for sale. Therefore, the blendedperformance can differ from the on-book performance.When we securitize financing receivables we retain interests in the transferredreceivables in two forms: a seller’s interest in the assets of the QSPE, which weclassify as financing receivables, and subordinated interests in the assets of theQSPE, which we classify as investment securities. In certain credit cardreceivables trusts, we are required to maintain minimum free equity (subordinatedinterest) of 4% or 7% depending on the credit rating of GE Capital.Financing receivables transferred to securitization entities that remainedoutstanding and our retained interests in those financing receivables at September30, 2009 and December 31, 2008 follow.
Commercial Credit card Other Total(In millions) Equipment (a)(b)(c) real estate (b) receivables (c) assets (b) assets
September
Source: GENERAL ELECTRIC CO, 10-Q, November 02, 2009
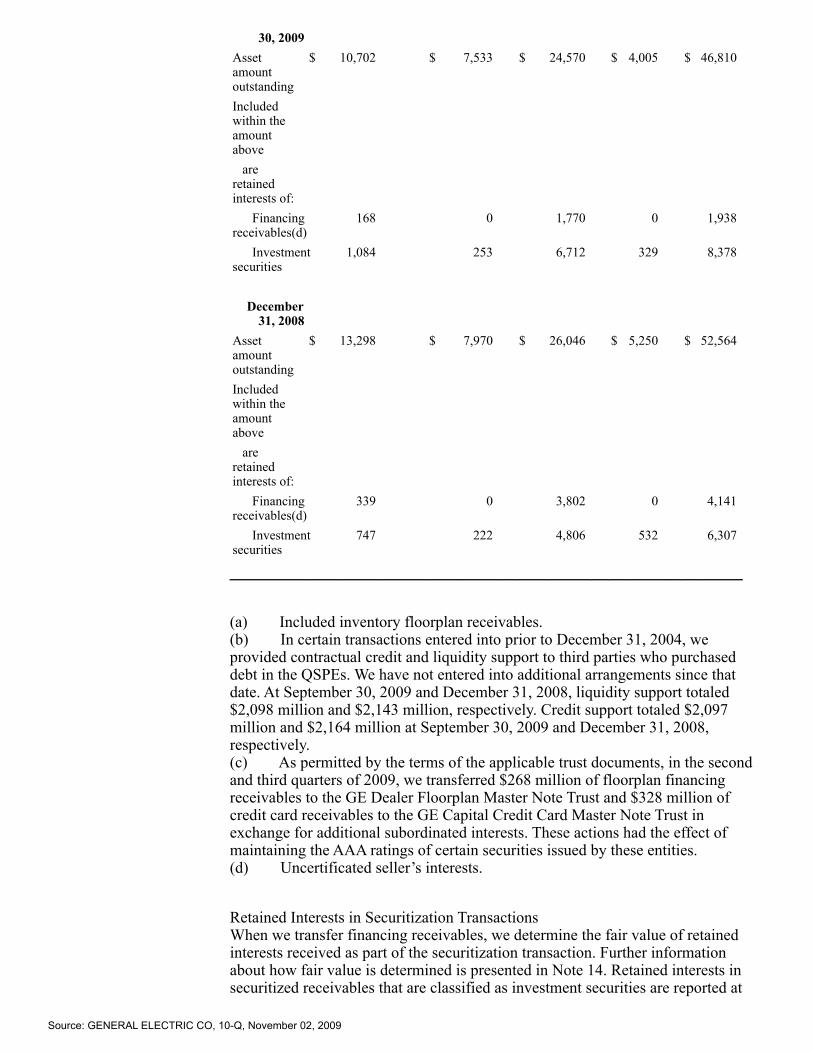
30, 2009Assetamountoutstanding
$ 10,702 $ 7,533 $ 24,570 $ 4,005 $ 46,810
Includedwithin theamountabove
areretainedinterests of:
Financingreceivables(d)
168 0 1,770 0 1,938
Investmentsecurities
1,084 253 6,712 329 8,378
December
31, 2008
Assetamountoutstanding
$ 13,298 $ 7,970 $ 26,046 $ 5,250 $ 52,564
Includedwithin theamountabove
areretainedinterests of:
Financingreceivables(d)
339 0 3,802 0 4,141
Investmentsecurities
747 222 4,806 532 6,307
(a) Included inventory floorplan receivables.(b) In certain transactions entered into prior to December 31, 2004, weprovided contractual credit and liquidity support to third parties who purchaseddebt in the QSPEs. We have not entered into additional arrangements since thatdate. At September 30, 2009 and December 31, 2008, liquidity support totaled$2,098 million and $2,143 million, respectively. Credit support totaled $2,097million and $2,164 million at September 30, 2009 and December 31, 2008,respectively.(c) As permitted by the terms of the applicable trust documents, in the secondand third quarters of 2009, we transferred $268 million of floorplan financingreceivables to the GE Dealer Floorplan Master Note Trust and $328 million ofcredit card receivables to the GE Capital Credit Card Master Note Trust inexchange for additional subordinated interests. These actions had the effect ofmaintaining the AAA ratings of certain securities issued by these entities.(d) Uncertificated seller’s interests.
Retained Interests in Securitization TransactionsWhen we transfer financing receivables, we determine the fair value of retainedinterests received as part of the securitization transaction. Further informationabout how fair value is determined is presented in Note 14. Retained interests insecuritized receivables that are classified as investment securities are reported at
Source: GENERAL ELECTRIC CO, 10-Q, November 02, 2009

fair value in each reporting period. These assets decrease as cash is received onthe underlying financing receivables. Retained interests classified as financingreceivables are accounted for in a similar manner to our on-book financingreceivables.Key assumptions used in measuring the fair value of retained interests classifiedas investment securities and the sensitivity of the current fair value to changes inthose assumptions related to all outstanding retained interests at September 30,2009 and December 31, 2008 follow.
Commercial Creditcard
Other
(In millions) Equipment real estate receivables assets
September 30,2009
Discount rate(a) 9.2 % 20.5 % 11.2 % 5.5 %Effect of 10% adversechange
$ (13) $ (13) $ (69) $ (1)
20% adversechange
(26) (25) (136) (2)
Prepaymentrate(a)(b)
23.5 % 10.8 % 9.4 % 54.4 %
Effect of 10% adversechange
$ (4) $ (2) $ (56) $ -
20% adversechange
(8) (4) (103) (1)
Estimate of creditlosses(a)
1.8 % 3.0 % 16.0 % 0.1 %
Effect of 10% adversechange
$ (6) $ (3) $ (231) $ -
20% adversechange
(13) (7) (459) (1)
Remainingweighted average
asset lives (inmonths)
10 53 10 3
Net credit lossesfor the quarter
$ 113 $ 109 $ 1,333 $ 11
Delinquencies 163 175 1,561 77
December 31,2008
Source: GENERAL ELECTRIC CO, 10-Q, November 02, 2009

Discount rate(a) 17.6 % 25.8 % 15.1 % 13.4 %Effect of 10% adversechange
$ (15) $ (14) $ (53) $ (1)
20% adversechange
(30) (26) (105) (3)
Prepaymentrate(a)(b)
19.5 % 11.3 % 9.6 % 52.0 %
Effect of 10% adversechange
$ (2) $ (3) $ (60) $ -
20% adversechange
(5) (7) (118) (1)
Estimate of creditlosses(a)
0.7 % 1.3 % 16.2 % - %
Effect of 10% adversechange
$ (5) $ (2) $ (223) $ -
20% adversechange
(10) (4) (440) -
Remainingweighted average
asset lives (inmonths)
14 55 10 4
Net credit lossesfor the year
$ 89 $ 28 $ 1,512 $ 5
Delinquencies 123 260 1,833 80
(a) Based on weighted averages.(b) Represented a payment rate on credit card receivables, inventoryfinancing receivables (included within equipment) and trade receivables (includedwithin other assets).
Activity related to retained interests classified as investment securities in ourconsolidated financial statements for the three and nine months ended September30, 2009 and 2008 follows.
Three months endedSeptember 30
Nine months endedSeptember 30
(In millions) 2009 2008 2009 2008 Cash flows ontransfers
$ 3,724 $ 657 $ 6,924 $ 4,313
Source: GENERAL ELECTRIC CO, 10-Q, November 02, 2009

Proceeds from newtransfersProceeds fromcollections reinvested inrevolving
period transfers 14,770 18,155 45,798 57,210 Cash flows on retainedinterests recorded as
investment securities 1,787 1,420 5,141 4,451 Effect on GECSrevenues from services
Net gain on sale $ 449 $ 317 $ 1,169 $ 1,022 Change in fair value ofretained interests
recorded in earnings 38 103 210 10 Other-than-temporaryimpairments
(44) (54) (106) (197)
Derivative ActivitiesOur QSPEs use derivatives to eliminate interest rate risk between the assets andliabilities. At inception of the transaction, the QSPE will enter into derivativecontracts to receive a floating rate of interest and pay a fixed rate with terms thateffectively match those of the financial assets held. In some cases, we are thecounterparty to such derivative contracts, in which case a second derivative isexecuted with a third party to substantially eliminate the exposure created by thefirst derivative. The fair value of such derivative contracts was a net asset of $514million and $752 million at September 30, 2009 and December 31, 2008,respectively. We have no other derivatives arrangements with QSPEs or otherVIEs.Servicing ActivitiesThe amount of our servicing assets and liabilities was insignificant at September30, 2009 and December 31, 2008. We received servicing fees from QSPEs of$144 million and $162 million, respectively, for the three months endedSeptember 30, 2009 and 2008, and $447 million and $486 million, respectively,for the first nine months ended September 30, 2009 and 2008.At September 30, 2009 and December 31, 2008, accounts payable included$3,832 million and $4,446 million, respectively, representing obligations toQSPEs for collections received in our capacity as servicer from obligors of theQSPEs.Included in other GECS receivables at September 30, 2009 and December 31,2008, were $2,802 million and $2,346 million, respectively, relating to amountsowed by QSPEs to GE, principally for the purchase of financial assets.
Source: GENERAL ELECTRIC CO, 10-Q, November 02, 2009
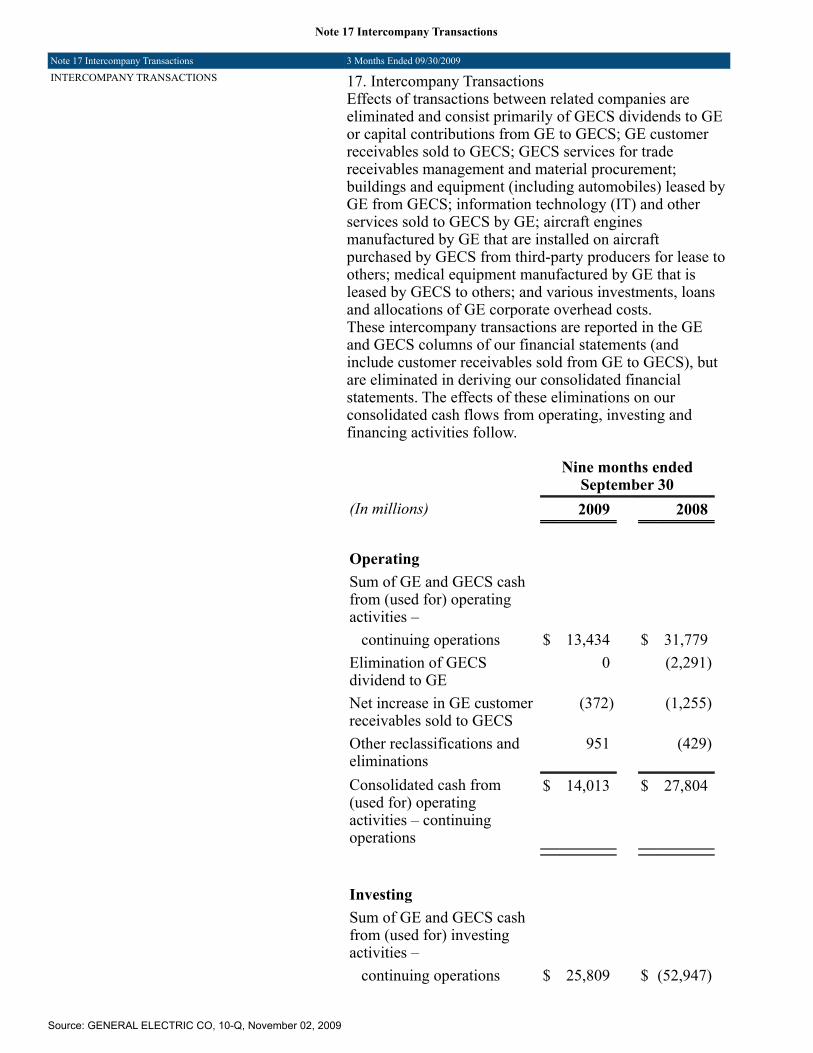
Note 17 Intercompany Transactions
Note 17 Intercompany Transactions 3 Months Ended 09/30/2009
INTERCOMPANY TRANSACTIONS 17. Intercompany TransactionsEffects of transactions between related companies areeliminated and consist primarily of GECS dividends to GEor capital contributions from GE to GECS; GE customerreceivables sold to GECS; GECS services for tradereceivables management and material procurement;buildings and equipment (including automobiles) leased byGE from GECS; information technology (IT) and otherservices sold to GECS by GE; aircraft enginesmanufactured by GE that are installed on aircraftpurchased by GECS from third-party producers for lease toothers; medical equipment manufactured by GE that isleased by GECS to others; and various investments, loansand allocations of GE corporate overhead costs.These intercompany transactions are reported in the GEand GECS columns of our financial statements (andinclude customer receivables sold from GE to GECS), butare eliminated in deriving our consolidated financialstatements. The effects of these eliminations on ourconsolidated cash flows from operating, investing andfinancing activities follow.
Nine months endedSeptember 30
(In millions) 2009 2008 Operating Sum of GE and GECS cashfrom (used for) operatingactivities –
continuing operations $ 13,434 $ 31,779 Elimination of GECSdividend to GE
0 (2,291)
Net increase in GE customerreceivables sold to GECS
(372) (1,255)
Other reclassifications andeliminations
951 (429)
Consolidated cash from(used for) operatingactivities – continuingoperations
$ 14,013 $ 27,804
Investing Sum of GE and GECS cashfrom (used for) investingactivities –
continuing operations $ 25,809 $ (52,947)
Source: GENERAL ELECTRIC CO, 10-Q, November 02, 2009

Net increase in GE customerreceivables sold to GECS
372 1,255
Capital contribution fromGE to GECS
9,500 0
Other reclassifications andeliminations
(939) 174
Consolidated cash from(used for) investing activities– continuing operations
$ 34,742 $ (51,518)
Financing Sum of GE and GECS cashfrom (used for) financingactivities –
continuing operations $ (26,714) $ 21,600 Elimination of short-termintercompany borrowings(a)
824 370
Elimination of GECSdividend to GE
0 2,291
Capital contribution fromGE to GECS
(9,500) 0
Other reclassifications andeliminations
(178) 23
Consolidated cash from(used for) financingactivities – continuingoperations
$ (35,568) $ 24,284
(a) Includes GE investment in GECS short-termborrowings, such as commercial paper.
In the GE and GECS columns of our Statement of CashFlows for the year ended December 31, 2008, we properlyreported a $5,500 million capital contribution from GE toGECS as an investing use of cash by GE (included in thecaption “All other investing activities”) and a financingsource of cash to GECS (included in the caption “All otherfinancing activities”). This intercompany transaction wasnot eliminated in deriving our consolidated cash flows. Asa result, our consolidated cash used for investing activitiesand our consolidated cash from financing activities wereboth overstated by the amount of the capital contribution.This item had no effect on our consolidated cash fromoperating activities or total consolidated cash flows, nordid it affect our financial position or results of operations.We will correct this immaterial item in our 2009 AnnualReport on Form 10-K.
Source: GENERAL ELECTRIC CO, 10-Q, November 02, 2009

_______________________________________________Created by Morningstar Document Research documentresearch.morningstar.com
Source: GENERAL ELECTRIC CO, 10-Q, November 02, 2009