form 10-q - investor.accenture.com/media/files/a/accenture-ir/... · part i — financial...
TRANSCRIPT

UNITED STATESSECURITIES AND EXCHANGE COMMISSION
Washington, D.C. 20549
FORM 10-Q(Mark One)
OR
Commission File Number: 001-34448
Accenture plc(Exact name of registrant as specified in its charter)
1 Grand Canal Square,Grand Canal Harbour,
Dublin 2, Ireland(Address of principal executive offices)
(353) (1) 646-2000(Registrant’s telephone number, including area code)
Indicate by check mark whether the registrant (1) has filed all reports required to be filed by Section 13 or 15(d) of the SecuritiesExchange Act of 1934 during the preceding 12 months (or for such shorter period that the registrant was required to file suchreports), and (2) has been subject to such filing requirements for the past 90 days. Yes þ No ¨
Indicate by check mark whether the registrant has submitted electronically and posted on its corporate Web site, if any, everyInteractive Data File required to be submitted and posted pursuant to Rule 405 of Regulation S-T (§232.405 of this chapter)during the preceding 12 months (or for such shorter period that the registrant was required to submit and post such files). Yes þNo ¨
Indicate by check mark whether the registrant is a large accelerated filer, an accelerated filer, a non-accelerated filer, smallerreporting company, or an emerging growth company. See the definitions of “large accelerated filer,” “accelerated filer,” “smallerreporting company,” and “emerging growth company” in Rule 12b-2 of the Exchange Act.
If an emerging growth company, indicate by check mark if the Registrant has elected not to use the extended transition periodfor complying with any new or revised financial accounting standards provided pursuant to Section 13(a) of the Exchange Act. ¨
Indicate by check mark whether the registrant is a shell company (as defined in Rule 12b-2 of the Exchange Act). Yes ¨ No þ
The number of shares of the registrant’s Class A ordinary shares, par value $0.0000225 per share, outstanding as of March 14, 2018 was672,353,051 (which number includes 29,265,823 issued shares held by the registrant). The number of shares of the registrant’s Class X ordinaryshares, par value $0.0000225 per share, outstanding as of March 14, 2018 was 664,761.
Large accelerated filer þ Accelerated filer ¨ Non-accelerated filer ¨Smaller reporting company ¨ Emerging growth company ¨ (Do not check if a smaller reporting company)
Ireland 98-0627530(State or other jurisdiction ofincorporation or organization)
(I.R.S. EmployerIdentification No.)
¨TRANSITION REPORT PURSUANT TO SECTION 13 OR 15(d) OF THE SECURITIESEXCHANGE ACT OF 1934FOR THE TRANSITION PERIOD FROM TO
þQUARTERLY REPORT PURSUANT TO SECTION 13 OR 15(d) OF THE SECURITIESEXCHANGE ACT OF 1934FOR THE QUARTERLY PERIOD ENDED February 28, 2018
Table of Contents

ACCENTURE PLC
INDEX
PagePart I. Financial Information 3Item 1. Financial Statements 3
Consolidated Balance Sheets as of February 28, 2018 (Unaudited) and August 31, 2017 3Consolidated Income Statements (Unaudited) for the three and six months ended February28, 2018 and 2017 4Consolidated Statements of Comprehensive Income (Unaudited) for the three and six monthsended February 28, 2018 and 2017 5Consolidated Shareholders’ Equity Statement (Unaudited) for the six months ended February28, 2018 6Consolidated Cash Flows Statements (Unaudited) for the six months ended February 28,2018 and 2017 7Notes to Consolidated Financial Statements (Unaudited) 8
Item 2. Management’s Discussion and Analysis of Financial Condition and Results of Operations 17Item 3. Quantitative and Qualitative Disclosures About Market Risk 29Item 4. Controls and Procedures 29Part II. Other Information 30Item 1. Legal Proceedings 30Item 1A. Risk Factors 30Item 2. Unregistered Sales of Equity Securities and Use of Proceeds 31Item 3. Defaults Upon Senior Securities 32Item 4. Mine Safety Disclosures 32Item 5. Other Information 32Item 6. Exhibits 33Signatures 34
Table of Contents
2
PART I — FINANCIAL INFORMATION
Table of Contents
3
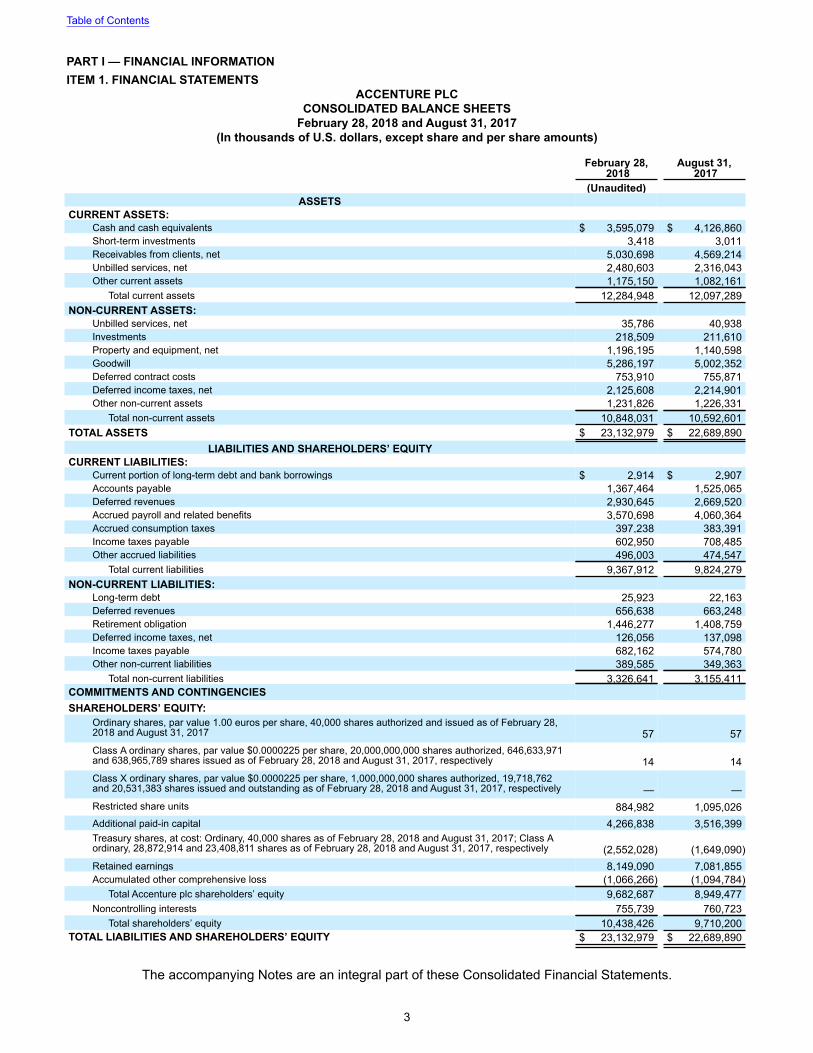
ITEM 1. FINANCIAL STATEMENTSACCENTURE PLC
CONSOLIDATED BALANCE SHEETSFebruary 28, 2018 and August 31, 2017
(In thousands of U.S. dollars, except share and per share amounts)
The accompanying Notes are an integral part of these Consolidated Financial Statements.
February 28, 2018
August 31, 2017
(Unaudited)ASSETS
CURRENT ASSETS:Cash and cash equivalents $ 3,595,079 $ 4,126,860Short-term investments 3,418 3,011Receivables from clients, net 5,030,698 4,569,214Unbilled services, net 2,480,603 2,316,043Other current assets 1,175,150 1,082,161
Total current assets 12,284,948 12,097,289NON-CURRENT ASSETS:
Unbilled services, net 35,786 40,938Investments 218,509 211,610Property and equipment, net 1,196,195 1,140,598Goodwill 5,286,197 5,002,352Deferred contract costs 753,910 755,871Deferred income taxes, net 2,125,608 2,214,901Other non-current assets 1,231,826 1,226,331
Total non-current assets 10,848,031 10,592,601TOTAL ASSETS $ 23,132,979 $ 22,689,890
LIABILITIES AND SHAREHOLDERS’ EQUITYCURRENT LIABILITIES:
Current portion of long-term debt and bank borrowings $ 2,914 $ 2,907Accounts payable 1,367,464 1,525,065Deferred revenues 2,930,645 2,669,520Accrued payroll and related benefits 3,570,698 4,060,364Accrued consumption taxes 397,238 383,391Income taxes payable 602,950 708,485Other accrued liabilities 496,003 474,547
Total current liabilities 9,367,912 9,824,279NON-CURRENT LIABILITIES:
Long-term debt 25,923 22,163Deferred revenues 656,638 663,248Retirement obligation 1,446,277 1,408,759Deferred income taxes, net 126,056 137,098Income taxes payable 682,162 574,780Other non-current liabilities 389,585 349,363
Total non-current liabilities 3,326,641 3,155,411COMMITMENTS AND CONTINGENCIESSHAREHOLDERS’ EQUITY:
Ordinary shares, par value 1.00 euros per share, 40,000 shares authorized and issued as of February 28,2018 and August 31, 2017 57 57Class A ordinary shares, par value $0.0000225 per share, 20,000,000,000 shares authorized, 646,633,971and 638,965,789 shares issued as of February 28, 2018 and August 31, 2017, respectively 14 14Class X ordinary shares, par value $0.0000225 per share, 1,000,000,000 shares authorized, 19,718,762and 20,531,383 shares issued and outstanding as of February 28, 2018 and August 31, 2017, respectively — —Restricted share units 884,982 1,095,026Additional paid-in capital 4,266,838 3,516,399Treasury shares, at cost: Ordinary, 40,000 shares as of February 28, 2018 and August 31, 2017; Class Aordinary, 28,872,914 and 23,408,811 shares as of February 28, 2018 and August 31, 2017, respectively (2,552,028) (1,649,090)Retained earnings 8,149,090 7,081,855Accumulated other comprehensive loss (1,066,266) (1,094,784)
Total Accenture plc shareholders’ equity 9,682,687 8,949,477Noncontrolling interests 755,739 760,723
Total shareholders’ equity 10,438,426 9,710,200TOTAL LIABILITIES AND SHAREHOLDERS’ EQUITY $ 23,132,979 $ 22,689,890

ACCENTURE PLCCONSOLIDATED INCOME STATEMENTS
For the Three and Six Months Ended February 28, 2018 and 2017 (In thousands of U.S. dollars, except share and per share amounts)
(Unaudited)
The accompanying Notes are an integral part of these Consolidated Financial Statements.
Three Months Ended Six Months EndedFebruary 28,
2018February 28,
2017February 28,
2018February 28,
2017REVENUES:
Revenues before reimbursements (“Net revenues”) $ 9,585,442 $ 8,317,671 $ 19,108,664 $ 16,833,188Reimbursements 482,390 444,511 1,013,661 934,597
Revenues 10,067,832 8,762,182 20,122,325 17,767,785OPERATING EXPENSES:
Cost of services:Cost of services before reimbursable expenses 6,737,048 5,813,515 13,208,010 11,599,000Reimbursable expenses 482,390 444,511 1,013,661 934,597Cost of services 7,219,438 6,258,026 14,221,671 12,533,597
Sales and marketing 999,389 871,489 2,001,178 1,760,316General and administrative costs 566,241 494,014 1,130,832 1,003,260
Total operating expenses 8,785,068 7,623,529 17,353,681 15,297,173OPERATING INCOME 1,282,764 1,138,653 2,768,644 2,470,612Interest income 9,459 8,728 20,895 17,025Interest expense (3,840) (3,976) (8,547) (7,024)Other income (expense), net (43,586) (12,546) (42,071) (18,633)Gain (loss) on sale of businesses — (12,349) — (12,349)INCOME BEFORE INCOME TAXES 1,244,797 1,118,510 2,738,921 2,449,631Provision for income taxes 325,257 231,302 630,839 502,674NET INCOME 919,540 887,208 2,108,082 1,946,957Net income attributable to noncontrolling interests inAccenture Holdings plc and Accenture Canada Holdings Inc. (37,401) (37,961) (86,534) (84,413)Net income attributable to noncontrolling interests – other (18,436) (10,495) (34,185) (19,316)NET INCOME ATTRIBUTABLE TO ACCENTURE PLC $ 863,703 $ 838,752 $ 1,987,363 $ 1,843,228Weighted average Class A ordinary shares:Basic 617,854,667 621,999,948 616,838,561 621,787,252Diluted 656,118,796 661,079,375 656,381,177 662,446,680Earnings per Class A ordinary share:Basic $ 1.40 $ 1.35 $ 3.22 $ 2.96Diluted $ 1.37 $ 1.33 $ 3.16 $ 2.91Cash dividends per share $ — $ — $ 1.33 $ 1.21
Table of Contents
4

ACCENTURE PLCCONSOLIDATED STATEMENTS OF COMPREHENSIVE INCOME
For the Three and Six Months Ended February 28, 2018 and 2017 (In thousands of U.S. dollars)
(Unaudited)
The accompanying Notes are an integral part of these Consolidated Financial Statements.
Three Months Ended Six Months EndedFebruary 28,
2018February 28,
2017February 28,
2018February 28,
2017NET INCOME $ 919,540 $ 887,208 $ 2,108,082 $ 1,946,957OTHER COMPREHENSIVE INCOME (LOSS), NET OF TAX:
Foreign currency translation 121,623 82,772 94,291 (107,919)Defined benefit plans 7,889 (6,897) 14,119 4,535Cash flow hedges (63,727) 39,992 (80,994) 25,489Marketable securities 1,102 — 1,102 264
OTHER COMPREHENSIVE INCOME (LOSS) ATTRIBUTABLETO ACCENTURE PLC 66,887 115,867 28,518 (77,631)Other comprehensive income (loss) attributable to noncontrollinginterests 9,100 1,728 6,266 (10,581)
COMPREHENSIVE INCOME $ 995,527 $ 1,004,803 $ 2,142,866 $ 1,858,745
COMPREHENSIVE INCOME ATTRIBUTABLE TOACCENTURE PLC $ 930,590 $ 954,619 $ 2,015,881 $ 1,765,597Comprehensive income attributable to noncontrolling interests 64,937 50,184 126,985 93,148COMPREHENSIVE INCOME $ 995,527 $ 1,004,803 $ 2,142,866 $ 1,858,745
Table of Contents
5

ACCENTURE PLCCONSOLIDATED SHAREHOLDERS’ EQUITY STATEMENT
For the Six Months Ended February 28, 2018(In thousands of U.S. dollars and share amounts)
(Unaudited)
The accompanying Notes are an integral part of these Consolidated Financial Statements.
OrdinaryShares
Class AOrdinaryShares
Class XOrdinaryShares
RestrictedShareUnits
AdditionalPaid-inCapital
Treasury Shares
RetainedEarnings
AccumulatedOther
ComprehensiveLoss
TotalAccenture plcShareholders’
EquityNoncontrolling
Interests
TotalShareholders’
Equity$No.
Shares $No.
Shares $No.
Shares $No.
Shares
Balance as of August 31, 2017 $ 57 40 $ 14 638,966 $ — 20,531 $ 1,095,026 $ 3,516,399 $ (1,649,090) (23,449) $ 7,081,855 $ (1,094,784) $ 8,949,477 $ 760,723 $ 9,710,200
Net income 1,987,363 1,987,363 120,719 2,108,082
Other comprehensive income (loss) 28,518 28,518 6,266 34,784
Purchases of Class A ordinaryshares 48,064 (1,284,241) (8,650) (1,236,177) (48,064) (1,284,241)
Share-based compensation expense 476,980 28,946 505,926 505,926
Purchases/redemptions of AccentureHoldings plc ordinary shares,Accenture Canada Holdings Inc.exchangeable shares and Class Xordinary shares (812) (78,006) (78,006) (4,838) (82,844)
Issuances of Class Aordinary shares:
Employee share programs 7,316 (713,863) 770,228 381,303 3,186 (68,656) 369,012 14,213 383,225
Upon redemption of AccentureHoldings plc ordinary shares 352 3,741 3,741 (3,741) —
Dividends 26,839 (844,080) (817,241) (36,373) (853,614)
Other, net (22,534) (7,392) (29,926) (53,166) (83,092)
Balance as of February 28, 2018 $ 57 40 $ 14 646,634 $ — 19,719 $ 884,982 $ 4,266,838 $ (2,552,028) (28,913) $ 8,149,090 $ (1,066,266) $ 9,682,687 $ 755,739 $ 10,438,426
Table of Contents
6

ACCENTURE PLCCONSOLIDATED CASH FLOWS STATEMENTS
For the Six Months Ended February 28, 2018 and 2017 (In thousands of U.S. dollars)
(Unaudited)
The accompanying Notes are an integral part of these Consolidated Financial Statements.
February 28,2018
February 28,2017
CASH FLOWS FROM OPERATING ACTIVITIES:Net income $ 2,108,082 $ 1,946,957Adjustments to reconcile Net income to Net cash provided by operating activities —
Depreciation, amortization and asset impairments 453,297 375,240Share-based compensation expense 505,926 402,323(Gain) loss on sale of business — 12,349Deferred income taxes, net 58,562 (60,273)Other, net 61,615 (124,788)Change in assets and liabilities, net of acquisitions —
Receivables from clients, net (372,392) (362,416)Unbilled services, current and non-current, net (95,070) 58,006Other current and non-current assets (287,588) (263,458)Accounts payable (179,438) (73,976)Deferred revenues, current and non-current 139,545 110,105Accrued payroll and related benefits (543,604) (716,926)Income taxes payable, current and non-current (27,485) (2,658)Other current and non-current liabilities 108,445 (61,900)
Net cash provided by (used in) operating activities 1,929,895 1,238,585CASH FLOWS FROM INVESTING ACTIVITIES:
Purchases of property and equipment (266,248) (188,962)Purchases of businesses and investments, net of cash acquired (344,104) (829,198)Proceeds from sales of businesses and investments, net of cash transferred (398) (22,921)Proceeds from sales of property and equipment 6,115 7,293
Net cash provided by (used in) investing activities (604,635) (1,033,788)CASH FLOWS FROM FINANCING ACTIVITIES:
Proceeds from issuance of ordinary shares 383,225 350,901Purchases of shares (1,367,085) (1,403,583)Proceeds from (repayments of) long-term debt, net 264 361Cash dividends paid (853,614) (785,127)Other, net (45,014) (6,647)
Net cash provided by (used in) financing activities (1,882,224) (1,844,095)Effect of exchange rate changes on cash and cash equivalents 25,183 (27,449)
NET INCREASE (DECREASE) IN CASH AND CASH EQUIVALENTS (531,781) (1,666,747)CASH AND CASH EQUIVALENTS, beginning of period 4,126,860 4,905,609CASH AND CASH EQUIVALENTS, end of period $ 3,595,079 $ 3,238,862SUPPLEMENTAL CASH FLOW INFORMATION:
Income taxes paid $ 666,387 $ 610,544
Table of Contents
7

Table of ContentsACCENTURE PLC
NOTES TO CONSOLIDATED FINANCIAL STATEMENTS(In thousands of U.S. dollars, except share and per share amounts or as otherwise disclosed)
(Unaudited)
8
1. BASIS OF PRESENTATIONThe accompanying unaudited interim Consolidated Financial Statements of Accenture plc and its controlled
subsidiary companies have been prepared pursuant to the rules and regulations of the Securities and ExchangeCommission (“SEC”) for quarterly reports on Form 10-Q and do not include all of the information and note disclosuresrequired by U.S. generally accepted accounting principles (“U.S. GAAP”) for complete financial statements. We usethe terms “Accenture,” “we” and “our” in the Notes to Consolidated Financial Statements to refer to Accenture plcand its subsidiaries. These Consolidated Financial Statements should therefore be read in conjunction with theConsolidated Financial Statements and Notes thereto for the fiscal year ended August 31, 2017 included in ourAnnual Report on Form 10-K filed with the SEC on October 26, 2017.
The accompanying unaudited interim Consolidated Financial Statements have been prepared in accordancewith U.S. GAAP, which requires management to make estimates and assumptions that affect amounts reported inthe Consolidated Financial Statements and accompanying disclosures. Although these estimates are based onmanagement’s best knowledge of current events and actions that we may undertake in the future, actual results maydiffer from those estimates. The Consolidated Financial Statements reflect all adjustments of a normal, recurringnature that are, in the opinion of management, necessary for a fair presentation of results for these interim periods.The results of operations for the three and six months ended February 28, 2018 are not necessarily indicative of theresults that may be expected for the fiscal year ending August 31, 2018.
Allowances for Client Receivables and Unbilled ServicesAs of February 28, 2018 and August 31, 2017, total allowances recorded for client receivables and unbilled
services were $52,236 and $74,450, respectively.
Depreciation and AmortizationDepreciation expense was $107,445 and $213,596 for the three and six months ended February 28, 2018,
respectively, and $84,639 and $169,659 for the three and six months ended February 28, 2017, respectively. As ofFebruary 28, 2018 and August 31, 2017, total accumulated depreciation was $2,042,405 and $1,912,146,respectively. Deferred transition amortization expense was $71,288 and $153,142 for the three and six months endedFebruary 28, 2018, respectively, and $69,844 and $139,129 for the three and six months ended February 28, 2017,respectively. See Note 5 (Goodwill and Intangible Assets) for intangible asset amortization balances.

New Accounting PronouncementsThe following standards, issued by the Financial Accounting Standards Board (“FASB”), will, or are expected to,result in a change in practice and/or have a financial impact to our Consolidated Financial Statements:
Standard DescriptionAccenture
Adoption DateImpact on the Financial Statements orOther Significant Matters
2016-16:Income Taxes:Intra-EntityTransfers ofAssets OtherThanInventory
The guidance requires an entity torecognize the income tax consequences ofintra-entity transfers, other than inventory,when the transfer occurs. Under currentguidance in U.S. GAAP, in the case ofdepreciable or amortizable assets, theincome tax consequences are deferred atthe time of the intra-entity transfer andrecognized as the assets are depreciated oramortized. The guidance requires modifiedretrospective transition with a cumulativecatch-up adjustment to opening retainedearnings in the period of adoption.
September 1,2018
The adoption of this AccountingStandards Update (“ASU”) will requirethat we record deferred tax assets onour Consolidated Balance Sheet at thebeginning of fiscal 2019. The deferredtax assets, which could be up to $2.1billion, represent income taxconsequences of prior intra-entitytransfers of assets, which are currentlyrecognized over the expected life of theassets. Beginning in fiscal 2019, we willrecognize incremental income taxexpense as these deferred tax assetsare utilized. Initially, this could representapproximately a 3.5 percentage pointincrease in the annual effective tax rate.However, the actual impact of adoptionwill depend on numerous factors,including activity for fiscal 2018 andmanagement’s expectations regardingrecoverability of the related deferredtaxes. Adoption will not have any impacton cash flows.
2016-02:Leases
The guidance amends existing guidance torequire lessees to recognize assets andliabilities on the balance sheet for the rightsand obligations created by leases and todisclose additional quantitative andqualitative information about leasingarrangements. The guidance requires amodified retrospective method uponadoption.
September 1,2019
While we are continuing to assess thepotential impact of this ASU, wecurrently believe the most significantimpact relates to our accounting foroffice space operating leases. Weanticipate this ASU will have a materialimpact on our Consolidated BalanceSheets but will not have a materialimpact on our other ConsolidatedFinancial Statements or footnotes.
2014-09:(AccountingStandardCodification606), Revenuefrom ContractswithCustomersand relatedupdates
The guidance replaces most existingrevenue recognition guidance in U.S.GAAP. The core principle of the ASU is thatan entity should recognize revenue for thetransfer of goods or services equal to theamount that it expects to be entitled toreceive for those goods or services. TheASU requires additional disclosure aboutthe nature, amount, timing and uncertaintyof revenue and cash flows arising fromcustomer contracts, including significantjudgments and changes in judgments. Theguidance allows for both retrospective andmodified retrospective methods ofadoption.
September 1,2018
We performed an initial assessment ofthe impact of the ASU and developed atransition plan, including necessarychanges to policies, processes, andinternal controls as well as systemenhancements to generate theinformation necessary for the newdisclosures. The project is on schedulefor adoption on September 1, 2018 andwe will apply the modified retrospectivemethod. We expect revenuerecognition across our portfolio ofservices to remain largely unchanged.However, we expect to recognizerevenue earlier than we do undercurrent guidance in a few areas,including accounting for variable feesand for certain consulting services,which will be recognized over timerather than at a point in time. While wehave not finalized our assessment ofthe impact of the ASU, based on theanalysis completed to date, we do notcurrently anticipate that the ASU willhave a material impact on ourConsolidated Financial Statements.
Table of ContentsACCENTURE PLC
NOTES TO CONSOLIDATED FINANCIAL STATEMENTS — (continued)(In thousands of U.S. dollars, except share and per share amounts or as otherwise disclosed)
(Unaudited)
9

2. EARNINGS PER SHAREBasic and diluted earnings per share were calculated as follows:
_______________
(1) Diluted earnings per share assumes the redemption of all Accenture Holdings plc ordinary shares ownedby holders of noncontrolling interests and the exchange of all Accenture Canada Holdings Inc. exchangeableshares for Accenture plc Class A ordinary shares on a one-for-one basis. The income effect does not takeinto account “Net income attributable to noncontrolling interests — other,” since those shares are notredeemable or exchangeable for Accenture plc Class A ordinary shares. See Note 11 (Subsequent Event)for additional information on Accenture Holdings plc.
Three Months Ended Six Months EndedFebruary 28,
2018February 28,
2017February 28,
2018February 28,
2017Basic Earnings per share
Net income attributable to Accenture plc $ 863,703 $ 838,752 $ 1,987,363 $ 1,843,228Basic weighted average Class A ordinary shares 617,854,667 621,999,948 616,838,561 621,787,252
Basic earnings per share $ 1.40 $ 1.35 $ 3.22 $ 2.96Diluted Earnings per share
Net income attributable to Accenture plc $ 863,703 $ 838,752 $ 1,987,363 $ 1,843,228Net income attributable to noncontrolling interests inAccenture Holdings plc and Accenture CanadaHoldings Inc. (1) 37,401 37,961 86,534 84,413Net income for diluted earnings per share calculation $ 901,104 $ 876,713 $ 2,073,897 $ 1,927,641Basic weighted average Class A ordinary shares 617,854,667 621,999,948 616,838,561 621,787,252Class A ordinary shares issuable upon redemption/exchange of noncontrolling interests (1) 26,754,491 28,180,804 27,010,093 28,451,331Diluted effect of employee compensation related toClass A ordinary shares 11,250,825 10,732,934 12,279,965 11,966,080Diluted effect of share purchase plans related to Class Aordinary shares 258,813 165,689 252,558 242,017Diluted weighted average Class A ordinary shares 656,118,796 661,079,375 656,381,177 662,446,680
Diluted earnings per share $ 1.37 $ 1.33 $ 3.16 $ 2.91
Table of ContentsACCENTURE PLC
NOTES TO CONSOLIDATED FINANCIAL STATEMENTS — (continued)(In thousands of U.S. dollars, except share and per share amounts or as otherwise disclosed)
(Unaudited)
10

3. ACCUMULATED OTHER COMPREHENSIVE LOSSThe following table summarizes the changes in the accumulated balances for each component of accumulated
other comprehensive loss attributable to Accenture plc:
_______________(1) Reclassifications into net periodic pension and post-retirement expense are recognized in Cost of services,
Sales and marketing and General and administrative costs. (2) As of February 28, 2018, $67,482 of net unrealized gains related to derivatives designated as cash flow
hedges is expected to be reclassified into Cost of services in the next 12 months.
Three Months Ended Six Months EndedFebruary 28,
2018February 28,
2017February 28,
2018February 28,
2017Foreign currency translation Beginning balance $ (797,375) $ (1,110,654) $ (770,043) $ (919,963) Foreign currency translation 134,318 84,249 103,561 (119,476) Income tax benefit (expense) (1,257) (1,247) (183) (395) Portion attributable to noncontrolling interests (11,438) (230) (9,087) 11,952 Foreign currency translation, net of tax 121,623 82,772 94,291 (107,919) Ending balance (675,752) (1,027,882) (675,752) (1,027,882)
Defined benefit plans Beginning balance (434,389) (798,072) (440,619) (809,504) Pension settlement 2,119 — 2,119 — Reclassifications into net periodic pension and post-retirement expense (1) 9,036 (6,794) 18,797 11,030 Income tax benefit (expense) (2,933) (427) (6,192) (6,290) Portion attributable to noncontrolling interests (333) 324 (605) (205) Defined benefit plans, net of tax 7,889 (6,897) 14,119 4,535 Ending balance (426,500) (804,969) (426,500) (804,969)
Cash flow hedges Beginning balance 97,368 53,508 114,635 68,011 Unrealized gain (loss) (53,710) 89,886 (45,385) 83,780 Reclassification adjustments into Cost of services (32,105) (25,319) (60,721) (47,468) Income tax benefit (expense) 19,370 (22,753) 21,639 (9,672) Portion attributable to noncontrolling interests 2,718 (1,822) 3,473 (1,151) Cash flow hedges, net of tax (63,727) 39,992 (80,994) 25,489 Ending balance (2) 33,641 93,500 33,641 93,500
Marketable securities Beginning balance 1,243 — 1,243 (264) Unrealized gain (loss) 1,454 — 1,454 462 Income tax benefit (expense) (305) — (305) (183) Portion attributable to noncontrolling interests (47) — (47) (15) Marketable securities, net of tax 1,102 — 1,102 264 Ending balance 2,345 — 2,345 —
Accumulated other comprehensive loss $ (1,066,266) $ (1,739,351) $ (1,066,266) $ (1,739,351)
Table of ContentsACCENTURE PLC
NOTES TO CONSOLIDATED FINANCIAL STATEMENTS — (continued)(In thousands of U.S. dollars, except share and per share amounts or as otherwise disclosed)
(Unaudited)
11

4. BUSINESS COMBINATIONS During the six months ended February 28, 2018, we completed individually immaterial acquisitions for total
consideration of $313,814, net of cash acquired. The pro forma effects of these acquisitions on our operations werenot material.
Table of ContentsACCENTURE PLC
NOTES TO CONSOLIDATED FINANCIAL STATEMENTS — (continued)(In thousands of U.S. dollars, except share and per share amounts or as otherwise disclosed)
(Unaudited)
12
5. GOODWILL AND INTANGIBLE ASSETS
GoodwillThe changes in the carrying amount of goodwill by reportable operating segment were as follows:
Goodwill includes immaterial adjustments related to prior period acquisitions.
Intangible AssetsOur definite-lived intangible assets by major asset class were as follows:
Total amortization related to our intangible assets was $41,931 and 86,559 for the three and six months endedFebruary 28, 2018, respectively. Total amortization related to our intangible assets was $33,324 and $66,452 for thethree and six months ended February 28, 2017, respectively. Estimated future amortization related to intangibleassets held as of February 28, 2018 is as follows:
February 28, 2018 August 31, 2017
Intangible Asset Class
GrossCarryingAmount
AccumulatedAmortization
NetCarryingAmount
GrossCarryingAmount
AccumulatedAmortization
NetCarryingAmount
Customer-related $ 856,784 $ (271,743) $ 585,041 $ 809,683 $ (235,315) $ 574,368
Technology 110,587 (54,541) 56,046 108,929 (65,453) 43,476
Patents 126,891 (64,898) 61,993 124,669 (62,543) 62,126
Other 49,755 (24,010) 25,745 52,342 (21,930) 30,412Total $ 1,144,017 $ (415,192) $ 728,825 $ 1,095,623 $ (385,241) $ 710,382
Fiscal YearEstimated
AmortizationRemainder of 2018 $ 82,332
2019 128,144
2020 112,325
2021 103,207
2022 87,273
Thereafter 215,544Total $ 728,825
August 31, 2017
Additions/Adjustments
ForeignCurrency
TranslationFebruary 28,
2018Communications, Media & Technology $ 775,802 $ 69,428 $ 14,257 $ 859,487Financial Services 1,151,024 12,723 9,480 1,173,227Health & Public Service 934,374 2,279 2,987 939,640Products 1,698,140 142,141 22,817 1,863,098Resources 443,012 3,527 4,206 450,745Total $ 5,002,352 $ 230,098 $ 53,747 $ 5,286,197

6. MATERIAL TRANSACTIONS AFFECTING SHAREHOLDERS’ EQUITY
Dividends Our dividend activity during the six months ended February 28, 2018 was as follows:
The payment of the cash dividends also resulted in the issuance of an immaterial number of additional restrictedshare units to holders of restricted share units.
Subsequent EventOn March 21, 2018, the Board of Directors of Accenture plc declared a semi-annual cash dividend of $1.33 per
share on its Class A ordinary shares for shareholders of record at the close of business on April 12, 2018 payableon May 15, 2018. The payment of the cash dividend will result in the issuance of an immaterial number of additionalrestricted share units to holders of restricted share units.
DividendPer
Share
Accenture plc Class AOrdinary Shares
Accenture Holdings plc OrdinaryShares and Accenture Canada Holdings
Inc. Exchangeable Shares Total CashOutlayDividend Payment Date Record Date Cash Outlay Record Date Cash Outlay
November 15, 2017 $ 1.33 October 19, 2017 $ 817,241 October 17, 2017 $ 36,373 $ 853,614
Table of ContentsACCENTURE PLC
NOTES TO CONSOLIDATED FINANCIAL STATEMENTS — (continued)(In thousands of U.S. dollars, except share and per share amounts or as otherwise disclosed)
(Unaudited)
13
7. DERIVATIVE FINANCIAL INSTRUMENTSIn the normal course of business, we use derivative financial instruments to manage foreign currency exchange
rate risk. Our derivative financial instruments consist of deliverable and non-deliverable foreign currency forwardcontracts.
Cash Flow HedgesFor a cash flow hedge, the effective portion of the change in estimated fair value of a hedging instrument is
recorded in Accumulated other comprehensive loss as a separate component of Shareholders’ Equity and isreclassified into Cost of services in the Consolidated Income Statements during the period in which the hedgedtransaction is recognized. For information related to derivatives designated as cash flow hedges that were reclassifiedinto Cost of services during the three and six months ended February 28, 2018 and 2017, as well as those expectedto be reclassified into Cost of services in the next 12 months, see Note 3 (Accumulated Other Comprehensive Loss)to these Consolidated Financial Statements.
Other DerivativesRealized gains or losses and changes in the estimated fair value of foreign currency forward contracts that
have not been designated as hedges were net gains of $56,316 and $46,783 for the three and six months endedFebruary 28, 2018, respectively, and a net gain of $19,780 and a net loss of $118,313 for the three and six monthsended February 28, 2017, respectively. Gains and losses on these contracts are recorded in Other income (expense),net in the Consolidated Income Statements and are offset by gains and losses on the related hedged items.

Fair Value of Derivative InstrumentsThe notional and fair values of all derivative instruments were as follows:
We utilize standard counterparty master agreements containing provisions for the netting of certain foreigncurrency transaction obligations and for the set-off of certain obligations in the event of an insolvency of one of theparties to the transaction. In the Consolidated Balance Sheets, we record derivative assets and liabilities at grossfair value. The potential effect of netting derivative assets against liabilities under the counterparty master agreementswas as follows:
February 28, 2018
August 31, 2017
AssetsCash Flow Hedges
Other current assets $ 94,232 $ 133,935Other non-current assets 31,722 82,770
Other DerivativesOther current assets 16,461 11,470
Total assets $ 142,415 $ 228,175Liabilities
Cash Flow HedgesOther accrued liabilities $ 26,750 $ 21,632Other non-current liabilities 27,182 17,244
Other DerivativesOther accrued liabilities 20,855 12,242
Total liabilities $ 74,787 $ 51,118Total fair value $ 67,628 $ 177,057Total notional value $ 9,147,399 $ 9,290,345
February 28, 2018
August 31, 2017
Net derivative assets $ 101,776 $ 189,066
Net derivative liabilities 34,148 12,009Total fair value $ 67,628 $ 177,057
Table of ContentsACCENTURE PLC
NOTES TO CONSOLIDATED FINANCIAL STATEMENTS — (continued)(In thousands of U.S. dollars, except share and per share amounts or as otherwise disclosed)
(Unaudited)
14
8. INCOME TAXES
On December 22, 2017, the U.S. enacted the Tax Cuts and Jobs Act (the “Tax Act”), which significantly changedU.S. tax law. The Tax Act lowered the U.S. statutory federal income tax rate from 35% to 21%, effective January 1,2018, resulting in a blended U.S. statutory federal income tax rate of 25.7% for our fiscal year ended August 31,2018. The Tax Act could modestly impact our ongoing effective tax rate by imposing taxes on our intercompanytransactions and limiting our ability to deduct certain expenses.
Due to the timing of the enactment and the complexity involved in applying the provisions of the Tax Act, wehave recorded provisional amounts in our financial statements as of February 28, 2018. We recognized a provisionaltax expense of $136,724 primarily to remeasure our net deferred tax assets at the new, lower rates. As we collectand analyze data, including our forecast of when we expect to realize certain deferred tax amounts, we may adjustthe provisional amounts. In addition, we have not yet made an accounting policy election to consider the taxes onour intercompany transactions in determining the amount of our valuation allowance. Those adjustments and theelection may materially impact our provision for income taxes and effective tax rate in the period in which theadjustments are made.
We apply an estimated annual effective tax rate to our year-to-date operating results to determine the interimprovision for income tax expense. In addition, we recognize taxes related to unusual or infrequent items or resulting

from a change in judgment regarding a position taken in a prior year as discrete items in the interim period in whichthe event occurs.
Our effective tax rates for the three months ended February 28, 2018 and 2017 were 26.1% and 20.7%,respectively. Our effective tax rates for the six months ended February 28, 2018 and 2017 were 23.0% and 20.5%,respectively. Excluding the provisional tax expense, described above, the effective tax rates would have been 15.1%and 18.0% for the three and six months ended February 28, 2018, respectively. The effective tax rates for the threeand six months ended February 28, 2018 benefited from lower expenses for adjustments to prior year tax liabilitiesin fiscal 2018, partially offset by lower benefits from final determinations of prior year U.S. taxes in fiscal 2018.
Table of ContentsACCENTURE PLC
NOTES TO CONSOLIDATED FINANCIAL STATEMENTS — (continued)(In thousands of U.S. dollars, except share and per share amounts or as otherwise disclosed)
(Unaudited)
15
9. COMMITMENTS AND CONTINGENCIESCommitments
We have either the right to purchase at fair value or, if certain events occur, may be required to purchase at fairvalue outstanding shares of our Avanade Inc. and SinnerSchrader AG subsidiaries. As of February 28, 2018 andAugust 31, 2017, we have reflected the fair value of $93,358 and $52,996, respectively, related to redeemablecommon stock and the intrinsic value of the options on redeemable common stock of these subsidiaries in Otheraccrued liabilities in the Consolidated Balance Sheets.
Indemnifications and GuaranteesIn the normal course of business and in conjunction with certain client engagements, we have entered into
contractual arrangements through which it may be obligated to indemnify clients with respect to certain matters.
As of February 28, 2018 and August 31, 2017, our aggregate potential liability to our clients for expressly limitedguarantees involving the performance of third parties was approximately $872,000 and $697,000, respectively, ofwhich all but approximately $154,000 and $149,000, respectively, may be recovered from the other third parties ifwe are obligated to make payments to the indemnified parties as a consequence of a performance default by theother third parties. For arrangements with unspecified limitations, we cannot reasonably estimate the aggregatemaximum potential liability, as it is inherently difficult to predict the maximum potential amount of such payments,due to the conditional nature and unique facts of each particular arrangement.
To date, we have not been required to make any significant payment under any of the arrangements describedabove. We have assessed the current status of performance/payment risk related to arrangements with limitedguarantees, warranty obligations, unspecified limitations and/or indemnification provisions and believe that anypotential payments would be immaterial to the Consolidated Financial Statements, as a whole.
Legal ContingenciesAs of February 28, 2018, we or our present personnel had been named as a defendant in various litigation
matters. We and/or our personnel also from time to time are involved in investigations by various regulatory or legalauthorities concerning matters arising in the course of our business around the world. Based on the present statusof these matters, management believes the range of reasonably possible losses in addition to amounts accrued, netof insurance recoveries, will not have a material effect on our results of operations or financial condition.

10. SEGMENT REPORTINGOur reportable operating segments are our five operating groups, which are Communications, Media &
Technology; Financial Services; Health & Public Service; Products; and Resources. Information regarding ourreportable operating segments is as follows:
Six Months EndedFebruary 28, 2018 February 28, 2017
NetRevenues
OperatingIncome
NetRevenues
OperatingIncome
Communications, Media & Technology $ 3,804,593 $ 610,528 $ 3,306,924 $ 472,582Financial Services 4,084,041 677,179 3,579,380 587,653Health & Public Service 3,276,479 378,610 3,012,338 388,342Products 5,215,361 784,503 4,584,997 772,461Resources 2,670,214 317,824 2,339,583 249,574Other 57,976 — 9,966 —Total $ 19,108,664 $ 2,768,644 $ 16,833,188 $ 2,470,612
Three Months EndedFebruary 28, 2018 February 28, 2017
NetRevenues
OperatingIncome
NetRevenues
OperatingIncome
Communications, Media & Technology $ 1,934,823 $ 315,603 $ 1,620,728 $ 214,738Financial Services 2,024,927 307,926 1,769,611 268,164Health & Public Service 1,642,368 155,420 1,511,564 189,115Products 2,631,305 374,114 2,264,828 363,762Resources 1,337,320 129,701 1,144,725 102,874Other 14,699 — 6,215 —Total $ 9,585,442 $ 1,282,764 $ 8,317,671 $ 1,138,653
Table of ContentsACCENTURE PLC
NOTES TO CONSOLIDATED FINANCIAL STATEMENTS — (continued)(In thousands of U.S. dollars, except share and per share amounts or as otherwise disclosed)
(Unaudited)
16
11. SUBSEQUENT EVENTOn March 13, 2018, Accenture Holdings plc merged with and into Accenture plc. Accenture Holdings plc
dissolved and all assets and liabilities were transferred to Accenture plc. Each ordinary shareholder of AccentureHoldings plc (other than Accenture plc and Accenture Holdings plc) received one Class A ordinary share of Accentureplc for every ordinary share in Accenture Holdings plc that they owned, and Accenture plc redeemed all Class Xordinary shares of Accenture plc held by such shareholders. The Consolidated Financial Statements reflect theownership interests in Accenture Holdings plc and Accenture Canada Holdings Inc. held by certain current and formermembers of Accenture Leadership as noncontrolling interests. Prior to the merger, a 4% non-controlling ownershipinterest percentage was held by Accenture Holdings plc and Accenture Canada Holdings Inc. and subsequent to themerger, the non-controlling ownership percentage is less than 1% held by only Accenture Canada Holdings Inc.

ITEM 2. MANAGEMENT’S DISCUSSION AND ANALYSIS OF FINANCIAL CONDITION AND RESULTS OFOPERATIONS
The following discussion and analysis should be read in conjunction with our Consolidated Financial Statementsand related Notes included elsewhere in this Quarterly Report on Form 10-Q and in our Annual Report on Form 10-K for the year ended August 31, 2017, and with the information under the heading “Management’s Discussion andAnalysis of Financial Condition and Results of Operations” in our Annual Report on Form 10-K for the year endedAugust 31, 2017.
We use the terms “Accenture,” “we,” “our” and “us” in this report to refer to Accenture plc and its subsidiaries. Allreferences to years, unless otherwise noted, refer to our fiscal year, which ends on August 31. For example, a referenceto “fiscal 2018” means the 12-month period that will end on August 31, 2018. All references to quarters, unless otherwisenoted, refer to the quarters of our fiscal year.
We use the term “in local currency” so that certain financial results may be viewed without the impact of foreigncurrency exchange rate fluctuations, thereby facilitating period-to-period comparisons of business performance.Financial results “in local currency” are calculated by restating current period activity into U.S. dollars using thecomparable prior year period’s foreign currency exchange rates. This approach is used for all results where thefunctional currency is not the U.S. dollar.
Table of Contents
17
Disclosure Regarding Forward-Looking Statements
This Quarterly Report on Form 10-Q contains forward-looking statements within the meaning of Section 27A of theSecurities Act of 1933 and Section 21E of the Securities Exchange Act of 1934 (the “Exchange Act”) relating to ouroperations, results of operations and other matters that are based on our current expectations, estimates, assumptionsand projections. Words such as “may,” “will,” “should,” “likely,” “anticipates,” “expects,” “intends,” “plans,” “projects,”“believes,” “estimates,” “positioned,” “outlook” and similar expressions are used to identify these forward-lookingstatements. These statements are not guarantees of future performance and involve risks, uncertainties andassumptions that are difficult to predict. Forward-looking statements are based upon assumptions as to future eventsthat may not prove to be accurate. Actual outcomes and results may differ materially from what is expressed or forecastin these forward-looking statements. Risks, uncertainties and other factors that might cause such differences, someof which could be material, include, but are not limited to:
• Our results of operations could be adversely affected by volatile, negative or uncertain economic and politicalconditions and the effects of these conditions on our clients’ businesses and levels of business activity.
• Our business depends on generating and maintaining ongoing, profitable client demand for our services andsolutions, including through the adaptation and expansion of our services and solutions in response to ongoingchanges in technology and offerings, and a significant reduction in such demand or an inability to respond to theevolving technological environment could materially affect our results of operations.
• If we are unable to keep our supply of skills and resources in balance with client demand around the world andattract and retain professionals with strong leadership skills, our business, the utilization rate of our professionalsand our results of operations may be materially adversely affected.
• We could have liability or our reputation could be damaged if we fail to protect client and/or Accenture data fromsecurity breaches or cyberattacks.
• The markets in which we operate are highly competitive, and we might not be able to compete effectively.
• Our profitability could materially suffer if we are unable to obtain favorable pricing for our services and solutions,if we are unable to remain competitive, if our cost-management strategies are unsuccessful or if we experiencedelivery inefficiencies.
• Changes in our level of taxes, as well as audits, investigations and tax proceedings, or changes in tax laws or intheir interpretation or enforcement, could have a material adverse effect on our effective tax rate, results ofoperations, cash flows and financial condition.
• Our results of operations could be materially adversely affected by fluctuations in foreign currency exchangerates.
• Our business could be materially adversely affected if we incur legal liability.

• Our work with government clients exposes us to additional risks inherent in the government contractingenvironment.
• We might not be successful at identifying, acquiring, investing in or integrating businesses, entering into jointventures or divesting businesses.
• Our global delivery capability is increasingly concentrated in India and the Philippines, which may expose us tooperational risks.
• As a result of our geographically diverse operations and our growth strategy to continue geographic expansion,we are more susceptible to certain risks.
• Adverse changes to our relationships with key alliance partners or in the business of our key alliance partnerscould adversely affect our results of operations.
• If we are unable to protect or enforce our intellectual property rights, or if our services or solutions infringe uponthe intellectual property rights of others or we lose our ability to utilize the intellectual property of others, ourbusiness could be adversely affected.
• Our ability to attract and retain business and employees may depend on our reputation in the marketplace.
• If we are unable to manage the organizational challenges associated with our size, we might be unable to achieveour business objectives.
• We make estimates and assumptions in connection with the preparation of our consolidated financial statements,and any changes to those estimates and assumptions could adversely affect our financial results.
• Many of our contracts include payments that link some of our fees to the attainment of performance or businesstargets and/or require us to meet specific service levels. This could increase the variability of our revenues andimpact our margins.
• Our results of operations and share price could be adversely affected if we are unable to maintain effective internalcontrols.
• We might be unable to access additional capital on favorable terms or at all. If we raise equity capital, it maydilute our shareholders’ ownership interest in us.
• We are incorporated in Ireland and a significant portion of our assets is located outside the United States. As aresult, it might not be possible for shareholders to enforce civil liability provisions of the federal or state securitieslaws of the United States. We may also be subject to criticism and negative publicity related to our incorporationin Ireland.
• Irish law differs from the laws in effect in the United States and might afford less protection to shareholders.
For a more detailed discussion of these factors, see the information under the heading “Risk Factors” in our AnnualReport on Form 10-K for the year ended August 31, 2017. Our forward-looking statements speak only as of the dateof this report or as of the date they are made, and we undertake no obligation to update any forward-looking statements.
Table of Contents
18

Overview
Revenues are driven by the ability of our executives to secure new contracts and to deliver services and solutionsthat add value relevant to our clients’ current needs and challenges. The level of revenues we achieve is based onour ability to deliver market-leading services and solutions and to deploy skilled teams of professionals quickly andon a global basis.
Our results of operations are affected by economic conditions, including macroeconomic conditions and levelsof business confidence. There continues to be significant volatility and economic and geopolitical uncertainty in manymarkets around the world, which may impact our business. We continue to monitor the impact of this volatility anduncertainty and seek to manage our costs in order to respond to changing conditions. There also continues to bevolatility in foreign currency exchange rates. The majority of our net revenues are denominated in currencies otherthan the U.S. dollar, including the Euro and the U.K. pound. Unfavorable fluctuations in foreign currency exchangerates have had and could have in the future a material effect on our financial results.
Revenues before reimbursements (“net revenues”) for the second quarter of fiscal 2018 increased 15% in U.S.dollars and 10% in local currency compared to the second quarter of fiscal 2017. Net revenues for the six monthsended February 28, 2018 increased 14% in U.S. dollars and 10% in local currency compared to the six months endedFebruary 28, 2017. Demand for our services and solutions continued to be strong, resulting in growth across all areasof our business. During the second quarter of fiscal 2018, revenue growth in local currency was very strong inCommunication, Media & Technology, Resources and Products and strong in Financial Services and Health & PublicService. We experienced very strong growth in Growth Markets and Europe and strong growth in North America.Revenue growth in local currency was very strong in consulting and strong in outsourcing during the second quarterof fiscal 2018. While the business environment remained competitive, pricing was relatively stable. We use the term“pricing” to mean the contract profitability or margin on the work that we sell.
In our consulting business, net revenues for the second quarter of fiscal 2018 increased 17% in U.S. dollars and11% in local currency compared to the second quarter of fiscal 2017. Net consulting revenues for the six months endedFebruary 28, 2018 increased 15% in U.S. dollars and 11% in local currency compared to the six months ended February28, 2017. Consulting revenue growth in local currency in the second quarter of fiscal 2018 was led by very stronggrowth in Communications, Media & Technology, Financial Services and Resources as well as strong growth in Productsand solid growth in Health & Public Service. Our consulting revenue growth continues to be driven by strong demandfor digital-, cloud- and security-related services and assisting clients with the adoption of new technologies. In addition,clients continue to be focused on initiatives designed to deliver cost savings and operational efficiency, as well asprojects to integrate their global operations and grow and transform their businesses.
In our outsourcing business, net revenues for the second quarter of fiscal 2018 increased 13% in U.S. dollarsand 8% in local currency compared to the second quarter of fiscal 2017. Net outsourcing revenues for the six monthsended February 28, 2018 increased 12% in U.S. dollars and 9% in local currency compared to the six months endedFebruary 28, 2017. Outsourcing revenue growth in local currency in the second quarter of fiscal 2018 was led by verystrong growth in Communications, Media & Technology, Products and Resources, as well as strong growth in Health& Public Service and slight growth in Financial Services. We continue to experience growing demand to assist clientswith cloud enablement and the operation and maintenance of digital-related services. In addition, clients continue tobe focused on transforming their operations to improve effectiveness and cost efficiency.
As we are a global company, our revenues are denominated in multiple currencies and may be significantlyaffected by currency exchange rate fluctuations. If the U.S. dollar weakens against other currencies, resulting infavorable currency translation, our revenues, revenue growth and results of operations in U.S. dollars may be higher.If the U.S. dollar strengthens against other currencies, resulting in unfavorable currency translation, our revenues,revenue growth and results of operations in U.S. dollars may be lower. The U.S. dollar weakened against variouscurrencies during the three and six months ended February 28, 2018 compared to the three and six months endedFebruary 28, 2017, resulting in favorable currency translation and U.S. dollar revenue growth that was approximately6% and 4% higher, respectively, than our revenue growth in local currency. Assuming that exchange rates stay withinrecent ranges for the remainder of fiscal 2018, we estimate that our full fiscal 2018 revenue growth in U.S. dollars willbe approximately 4.0% higher in U.S. dollars than our revenue growth in local currency.
The primary categories of operating expenses include Cost of services, Sales and marketing and General andadministrative costs. Cost of services is primarily driven by the cost of client-service personnel, which consists mainlyof compensation, subcontractor and other personnel costs, and non-payroll costs on outsourcing contracts. Cost ofservices includes a variety of activities such as: contract delivery; recruiting and training; software development; andintegration of acquisitions. Sales and marketing costs are driven primarily by: compensation costs for businessdevelopment activities; marketing- and advertising-related activities; and certain acquisition-related costs. General
Table of Contents
19

and administrative costs primarily include costs for non-client-facing personnel, information systems, office space andcertain acquisition-related costs.
Utilization for the second quarter of fiscal 2018 was 91%, flat with the second quarter of fiscal 2017. We continueto hire to meet current and projected future demand. We proactively plan and manage the size and composition of ourworkforce and take actions as needed to address changes in the anticipated demand for our services and solutions,given that compensation costs are the most significant portion of our operating expenses. Based on current andprojected future demand, we have increased our headcount, the majority of which serve our clients, to approximately442,000 as of February 28, 2018, compared to approximately 401,000 as of February 28, 2017. The year-over-yearincrease in our headcount reflects an overall increase in demand for our services and solutions, as well as headcountadded in connection with acquisitions. Attrition, excluding involuntary terminations, for the second quarter of fiscal2018 was 13%, up from 12% in the second quarter of fiscal 2017. We evaluate voluntary attrition, adjust levels of newhiring and use involuntary terminations as means to keep our supply of skills and resources in balance with changesin client demand. In addition, we adjust compensation in certain skill sets and geographies in order to attract and retainappropriate numbers of qualified employees. For the majority of our personnel, compensation increases becomeeffective December 1st of each fiscal year. We strive to adjust pricing and/or the mix of resources to reduce the impactof compensation increases on our gross margin. Our ability to grow our revenues and maintain or increase our margincould be adversely affected if we are unable to: keep our supply of skills and resources in balance with changes inthe types or amounts of services and solutions clients are demanding; recover increases in compensation; deploy ouremployees globally on a timely basis; manage attrition; and/or effectively assimilate and utilize new employees.
Gross margin (Net revenues less Cost of services before reimbursable expenses as a percentage of net revenues)for the second quarter of fiscal 2018 was 29.7%, compared with 30.1% for the second quarter of fiscal 2017. Grossmargin for the six months ended February 28, 2018 was 30.9%, compared with 31.1% for the six months endedFebruary 28, 2017. The decrease in gross margin for three and six months ended February 28, 2018 was principallydue to lower consulting contract profitability as well as higher acquisition-related costs, partially offset by costefficiencies.
Sales and marketing and General and administrative costs as a percentage of net revenues were 16.3% for thesecond quarter of fiscal 2018 and 16.4% for the six months ended February 28, 2018, compared with 16.4% for boththe second quarter of fiscal 2017 and six months ended February 28, 2017. We continuously monitor these costs andimplement cost-management actions, as appropriate. For the three and six months ended February 28, 2018 comparedto the same periods in fiscal 2017, Sales and marketing costs as a percentage of net revenues decreased 10 basispoints and were flat, respectively, and General and administrative costs as a percentage of net revenues were flat anddecreased 10 basis points, respectively.
Operating margin (Operating income as a percentage of Net revenues) for the second quarter of fiscal 2018 was13.4%, compared with 13.7% for the second quarter of fiscal 2017. Operating margin for the six months ended February28, 2018 was 14.5%, compared with 14.7% for the six months ended February 28, 2017.
The effective tax rates for the three and six months ended February 28, 2018 were 26.1% and 23.0%, respectively.The effective tax rates for the three and six months ended February 28, 2017 were 20.7% and 20.5%, respectively. Inthe second quarter of fiscal 2018, we recorded a $137 million charge associated with the enactment of the U.S. TaxCuts and Jobs Act (the “Tax Act”). Absent this charge, our effective tax rates for the three and six months endedFebruary 28, 2018 would have been 15.1% and 18.0%, respectively. For additional information see Note 8 (IncomeTaxes) to our Consolidated Financial Statements under Item 1, “Financial Statements”.
Diluted earnings per share were $1.37 for the second quarter of fiscal 2018, compared with $1.33 for the secondquarter of fiscal 2017. Diluted earnings per share were $3.16 for the six months ended February 28, 2018, comparedwith $2.91 for the six months ended February 28, 2017. The $137 million charge associated with the Tax Act decreaseddiluted earnings per share by $0.21 in both the second quarter of fiscal 2018 and six months ended February 28, 2018.Excluding the impact of this charge, diluted earnings per share would have been $1.58 for the second quarter of fiscal2018 and $3.37 for the six months ended February 28, 2018.
New BookingsNew bookings for the second quarter of fiscal 2018 were $10.25 billion, with consulting bookings of $5.65 billion
and outsourcing bookings of $4.60 billion. New bookings for the six months ended February 28, 2018 were $20.23billion, with consulting bookings of $11.59 billion and outsourcing bookings of $8.65 billion.
Table of Contents
20

Results of Operations for the Three Months Ended February 28, 2018 Compared to the Three Months EndedFebruary 28, 2017
Our five reportable operating segments are our operating groups, which are Communications, Media &Technology; Financial Services; Health & Public Service; Products; and Resources. Net revenues (by operating group,geographic region and type of work) and reimbursements were as follows:
_______________ n/m = not meaningful Amounts in table may not total due to rounding.
(1) Effective September 1, 2017, we revised the reporting of our geographic regions as follows: North America(the United States and Canada), Europe and Growth Markets (Asia Pacific, Latin America, Africa, the MiddleEast and Turkey). Four countries, including Russia, were previously in Growth Markets, but are now includedin Europe. Prior period amounts have been reclassified to conform to the current period presentation.
Net RevenuesThe following net revenues commentary discusses local currency net revenue changes for the second quarter
of fiscal 2018 compared to the second quarter of fiscal 2017:
Operating Groups
• Communications, Media & Technology net revenues increased 15% in local currency, driven by growth acrossall geographic regions in Software & Platforms and Communications & Media, led by Software & Platforms inNorth America. These increases were partially offset by a decline in High Tech in North America.
• Financial Services net revenues increased 7% in local currency, driven by growth across all industry groupsand geographic regions, led by Banking & Capital Markets in Europe.
• Health & Public Service net revenues increased 6% in local currency, driven by growth in both Public Serviceand Health industry groups across all geographic regions.
• Products net revenues increased 10% in local currency, driven by growth across all geographic regions inConsumer Goods, Retail & Travel Services and Industrial, partially offset by a decline in Life Sciences in NorthAmerica.
Three Months Ended PercentIncrease
U.S.Dollars
PercentIncrease
LocalCurrency
Percent of Total Net Revenuesfor the Three Months Ended
February 28,2018
February 28,2017
February 28,2018
February 28,2017
(in millions of U.S. dollars)OPERATING GROUPSCommunications, Media & Technology $ 1,935 $ 1,621 19% 15% 20% 20%Financial Services 2,025 1,770 14 7 21 21Health & Public Service 1,642 1,512 9 6 17 18Products 2,631 2,265 16 10 28 27Resources 1,337 1,145 17 11 14 14Other 15 6 n/m n/m — —TOTAL NET REVENUES 9,585 8,318 15% 10% 100% 100%
Reimbursements 482 445 9TOTAL REVENUES $ 10,068 $ 8,762 15%
GEOGRAPHIC REGIONS (1)North America $ 4,277 $ 3,956 8% 8% 45% 48%Europe 3,485 2,842 23 10 36 34Growth Markets 1,823 1,519 20 15 19 18TOTAL NET REVENUES $ 9,585 $ 8,318 15% 10% 100% 100%TYPE OF WORKConsulting $ 5,159 $ 4,406 17% 11% 54% 53%Outsourcing 4,426 3,912 13 8 46 47TOTAL NET REVENUES $ 9,585 $ 8,318 15% 10% 100% 100%
Table of Contents
21

• Resources net revenues increased 11% in local currency, led by growth in Chemicals & Natural Resourcesacross all geographic regions, as well as Energy in North America and Europe and Utilities in Europe.
Geographic Regions
• North America net revenues increased 8% in local currency, driven by the United States.
• Europe net revenues increased 10% in local currency, driven by Germany, Italy, France and Spain.
• Growth Markets net revenues increased 15% in local currency, led by Japan, as well as Australia, Brazil andSingapore.
Operating ExpensesOperating expenses for the second quarter of fiscal 2018 increased $1,162 million, or 15%, over the second
quarter of fiscal 2017, and increased as a percentage of revenues to 87.3% from 87.0% during this period. Operatingexpenses before reimbursable expenses for the second quarter of fiscal 2018 increased $1,124 million, or 16%, overthe second quarter of fiscal 2017, and increased as a percentage of net revenues to 86.6% from 86.3% during thisperiod.
Cost of ServicesCost of services for the second quarter of fiscal 2018 increased $961 million, or 15%, over the second quarter of
fiscal 2017, and increased as a percentage of revenues to 71.7% from 71.4% during this period. Cost of servicesbefore reimbursable expenses for the second quarter of fiscal 2018 increased $924 million, or 16%, over the secondquarter of fiscal 2017, and increased as a percentage of net revenues to 70.3% from 69.9% during this period. Grossmargin for the second quarter of fiscal 2018 decreased to 29.7% from 30.1% during the second quarter of fiscal 2017.The decrease in gross margin was principally due to lower consulting contract profitability as well as higher acquisition-related costs, partially offset by cost efficiencies.
Sales and MarketingSales and marketing expense for the second quarter of fiscal 2018 increased $128 million, or 15%, over the
second quarter of fiscal 2017, and decreased as a percentage of net revenues to 10.4% from 10.5% during this period.
General and Administrative Costs General and administrative costs for the second quarter of fiscal 2018 increased $72 million, or 15%, over the
second quarter of fiscal 2017, and remained flat as a percentage of net revenues at 5.9% during this period.
Operating Income and Operating MarginOperating income for the second quarter of fiscal 2018 increased $144 million, or 13%, over the second quarter
of fiscal 2017.
Operating income and operating margin for each of the operating groups were as follows:
We estimate that the aggregate percentage impact of foreign currency exchange rates on our operating incomeduring the second quarter of fiscal 2018 was similar to that disclosed for net revenue. In addition, during the secondquarter of fiscal 2018, we experienced higher acquisition-related costs compared to the second quarter of fiscal 2017.The commentary below provides insight into other factors affecting operating group performance and operating marginfor the second quarter of fiscal 2018 compared with the second quarter of fiscal 2017:
• Communications, Media & Technology operating income increased primarily due to revenue growth.
Three Months EndedFebruary 28, 2018 February 28, 2017
OperatingIncome
OperatingMargin
OperatingIncome
OperatingMargin
Increase(Decrease)
(in millions of U.S. dollars)Communications, Media & Technology $ 316 16% $ 215 13% $ 101Financial Services 308 15 268 15 40Health & Public Service 155 9 189 13 (34)Products 374 14 364 16 10Resources 130 10 103 9 27Total $ 1,283 13.4% $ 1,139 13.7% $ 144
Table of Contents
22

• Financial Services operating income increased primarily due to consulting revenue growth, partially offset bylower consulting contract profitability.
• Health & Public Service operating income decreased primarily due to lower consulting contract profitability.
• Products operating income increased primarily due to revenue growth, partially offset by lower consultingcontract profitability and higher sales and marketing costs as a percentage of net revenues.
• Resources operating income increased primarily due to revenue growth, partially offset by lower contractprofitability.
Other Income (Expense), net Other income (expense), net primarily consists of foreign currency gains and losses as well as gains and losses
associated with our investments in privately held companies. For the second quarter of fiscal 2018, other expenseincreased $31 million over the second quarter of fiscal 2017, primarily due to higher net foreign exchange losses.
Provision for Income TaxesThe effective tax rate for the second quarter of fiscal 2018 was 26.1%, compared with 20.7% for the second
quarter of fiscal 2017. In the second quarter of fiscal 2018, we recorded a $137 million charge associated with theenactment of the Tax Act. Absent this charge, our effective tax rate for the second quarter of fiscal 2018 would havebeen 15.1%. The effective tax rate for the three months ended February 28, 2018 benefited from lower expenses foradjustments to prior year tax liabilities in fiscal 2018, partially offset by lower benefits from final determinations of prioryear U.S. taxes in fiscal 2018. For additional information see Note 8 (Income Taxes) to our Consolidated FinancialStatements under Item 1, “Financial Statements”.
In addition, as described in Note 1 (Basis of Presentation), beginning in fiscal 2019 we will recognize incrementalincome tax expense as a result of adoption of ASU 2016-16.
Net Income Attributable to Noncontrolling Interests Net income attributable to noncontrolling interests for the second quarter of fiscal 2018 increased $7 million, or
15%, over the second quarter of fiscal 2017.
Earnings Per ShareDiluted earnings per share were $1.37 for the second quarter of fiscal 2018, compared with $1.33 for the second
quarter of fiscal 2017. The $0.04 increase in our diluted earnings per share included the impact of the $137 millioncharge associated with the Tax Act, which decreased diluted earnings per share for the second quarter of fiscal 2018by $0.21. Excluding the impact of this charge, diluted earnings per share for the second quarter of fiscal 2018 increased$0.25 compared with the second quarter of fiscal 2017, due to increases of $0.17 from higher revenues and operatingresults, $0.10 from a lower effective tax rate and $0.01 from lower weighted average shares outstanding. Theseincreases were partially offset by decreases of $0.02 from higher non-operating expense and $0.01 from higher netincome attributable to other non-controlling interests. For information regarding our earnings per share calculations,see Note 2 (Earnings Per Share) to our Consolidated Financial Statements under Item 1, “Financial Statements.”
Table of Contents
23

Results of Operations for the Six Months Ended February 28, 2018 Compared to the Six Months EndedFebruary 28, 2017
Our five reportable operating segments are our operating groups, which are Communications, Media &Technology; Financial Services; Health & Public Service; Products; and Resources. Net revenues (by operating group,geographic region and type of work) and reimbursements were as follows:
_______________ n/m = not meaningful Amounts in table may not total due to rounding.
(1) Effective September 1, 2017, we revised the reporting of our geographic regions as follows: North America(the United States and Canada), Europe and Growth Markets (Asia Pacific, Latin America, Africa, the MiddleEast and Turkey). Four countries, including Russia, were previously in Growth Markets, but are now includedin Europe. Prior period amounts have been reclassified to conform to the current period presentation.
Net RevenuesThe following net revenues commentary discusses local currency net revenue changes for the six months ended
February 28, 2018 compared to the six months ended February 28, 2017:
Operating Groups
• Communications, Media & Technology net revenues increased 12% in local currency, driven by growth acrossall geographic regions in Software & Platforms and Communications & Media, led by Software & Platforms inNorth America. These increases were partially offset by a decline in High Tech in North America.
• Financial Services net revenues increased 9% in local currency, driven by growth across all industry groupsand geographic regions, led by Banking & Capital Markets in Europe.
• Health & Public Service net revenues increased 7% in local currency, driven by growth in both Public Serviceand Health industry groups across all geographic regions.
Six Months Ended PercentIncrease
U.S.dollars
PercentIncrease
LocalCurrency
Percent of Total Net Revenuesfor the Six Months Ended
February 28,2018
February 28,2017
February 28,2018
February 28,2017
(in millions of U.S. dollars)OPERATING GROUPSCommunications, Media & Technology $ 3,805 $ 3,307 15% 12% 20% 20%Financial Services 4,084 3,579 14 9 22 21Health & Public Service 3,276 3,012 9 7 17 18Products 5,215 4,585 14 10 27 27Resources 2,670 2,340 14 10 14 14Other 58 10 n/m n/m — —TOTAL NET REVENUES 19,109 16,833 14% 10% 100% 100%
Reimbursements 1,014 935 8TOTAL REVENUES $ 20,122 $ 17,768 13%
GEOGRAPHIC REGIONS (1)North America $ 8,562 $ 7,937 8% 7% 45% 47%Europe 6,934 5,800 20 10 36 35Growth Markets 3,613 3,096 17 16 19 18TOTAL NET REVENUES $ 19,109 $ 16,833 14% 10% 100% 100%TYPE OF WORKConsulting $ 10,343 $ 8,999 15% 11% 54% 53%Outsourcing 8,765 7,834 12 9 46 47TOTAL NET REVENUES $ 19,109 $ 16,833 14% 10% 100% 100%
Table of Contents
24

• Products net revenues increased 10% in local currency, driven by growth across all geographic regions inConsumer Goods, Retail & Travel Services and Industrial, partially offset by a decline in Life Sciences in NorthAmerica.
• Resources net revenues increased 10% in local currency, led by growth in Chemicals & Natural Resourcesacross all geographic regions, as well as Utilities in Europe and Energy in North America and Europe.
Geographic Regions
• North America net revenues increased 7% in local currency, driven by the United States.
• Europe net revenues increased 10% in local currency, driven by Germany, France, Italy and Spain.
• Growth Markets net revenues increased 16% in local currency, led by Japan, as well as Australia, Singaporeand Brazil.
Operating ExpensesOperating expenses for the six months ended February 28, 2018 increased $2,057 million, or 13%, over the six
months ended February 28, 2017, and increased as a percentage of revenues to 86.2% from 86.1% during this period.Operating expenses before reimbursable expenses for the six months ended February 28, 2018 increased $1,977million, or 14%, over the six months ended February 28, 2017, and increased as a percentage of net revenues to85.5% from 85.3% during this period.
Cost of ServicesCost of services for the six months ended February 28, 2018 increased $1,688 million, or 13% over the six months
ended February 28, 2017, and increased as a percentage of revenues to 70.7% from 70.5% during this period. Costof services before reimbursable expenses for the six months ended February 28, 2018 increased $1,609 million or14% over the six months ended February 28, 2017, and increased as a percentage of net revenues to 69.1% from68.9% during this period. Gross margin for the six months ended February 28, 2018 decreased to 30.9% from 31.1%during the six months ended February 28, 2017. The decrease in gross margin was principally due to lower consultingcontract profitability as well as higher acquisition-related costs, partially offset by cost efficiencies.
Sales and MarketingSales and marketing expense for the six months ended February 28, 2018 increased $241 million, or 14%, over
the six months ended February 28, 2017, and remained flat as a percentage of net revenues at 10.5% during thisperiod.
General and Administrative Costs General and administrative costs for the six months ended February 28, 2018 increased $128 million, or 13%,
over the six months ended February 28, 2017, and decreased as a percentage of net revenues to 5.9% from 6.0%during this period.
Table of Contents
25
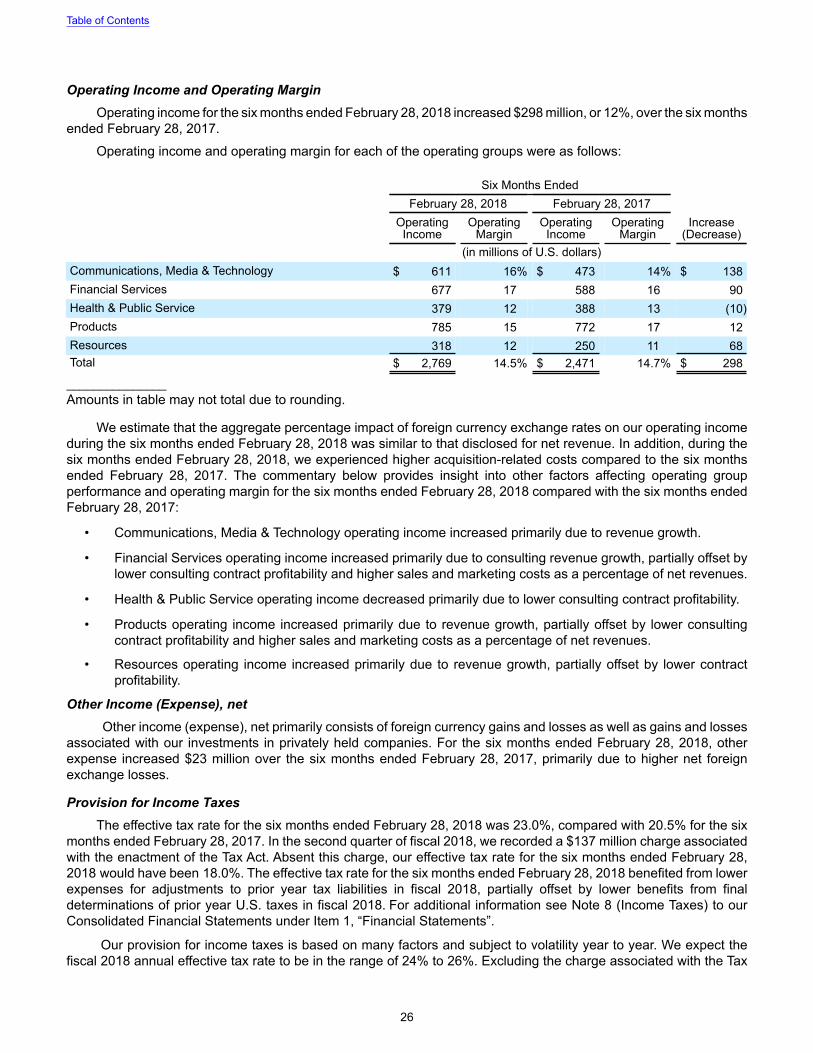
Operating Income and Operating MarginOperating income for the six months ended February 28, 2018 increased $298 million, or 12%, over the six months
ended February 28, 2017.
Operating income and operating margin for each of the operating groups were as follows:
_______________ Amounts in table may not total due to rounding.
We estimate that the aggregate percentage impact of foreign currency exchange rates on our operating incomeduring the six months ended February 28, 2018 was similar to that disclosed for net revenue. In addition, during thesix months ended February 28, 2018, we experienced higher acquisition-related costs compared to the six monthsended February 28, 2017. The commentary below provides insight into other factors affecting operating groupperformance and operating margin for the six months ended February 28, 2018 compared with the six months endedFebruary 28, 2017:
• Communications, Media & Technology operating income increased primarily due to revenue growth.
• Financial Services operating income increased primarily due to consulting revenue growth, partially offset bylower consulting contract profitability and higher sales and marketing costs as a percentage of net revenues.
• Health & Public Service operating income decreased primarily due to lower consulting contract profitability.
• Products operating income increased primarily due to revenue growth, partially offset by lower consultingcontract profitability and higher sales and marketing costs as a percentage of net revenues.
• Resources operating income increased primarily due to revenue growth, partially offset by lower contractprofitability.
Other Income (Expense), net Other income (expense), net primarily consists of foreign currency gains and losses as well as gains and losses
associated with our investments in privately held companies. For the six months ended February 28, 2018, otherexpense increased $23 million over the six months ended February 28, 2017, primarily due to higher net foreignexchange losses.
Provision for Income TaxesThe effective tax rate for the six months ended February 28, 2018 was 23.0%, compared with 20.5% for the six
months ended February 28, 2017. In the second quarter of fiscal 2018, we recorded a $137 million charge associatedwith the enactment of the Tax Act. Absent this charge, our effective tax rate for the six months ended February 28,2018 would have been 18.0%. The effective tax rate for the six months ended February 28, 2018 benefited from lowerexpenses for adjustments to prior year tax liabilities in fiscal 2018, partially offset by lower benefits from finaldeterminations of prior year U.S. taxes in fiscal 2018. For additional information see Note 8 (Income Taxes) to ourConsolidated Financial Statements under Item 1, “Financial Statements”.
Our provision for income taxes is based on many factors and subject to volatility year to year. We expect thefiscal 2018 annual effective tax rate to be in the range of 24% to 26%. Excluding the charge associated with the Tax
Six Months EndedFebruary 28, 2018 February 28, 2017
OperatingIncome
OperatingMargin
OperatingIncome
OperatingMargin
Increase(Decrease)
(in millions of U.S. dollars)Communications, Media & Technology $ 611 16% $ 473 14% $ 138Financial Services 677 17 588 16 90Health & Public Service 379 12 388 13 (10)Products 785 15 772 17 12Resources 318 12 250 11 68Total $ 2,769 14.5% $ 2,471 14.7% $ 298
Table of Contents
26
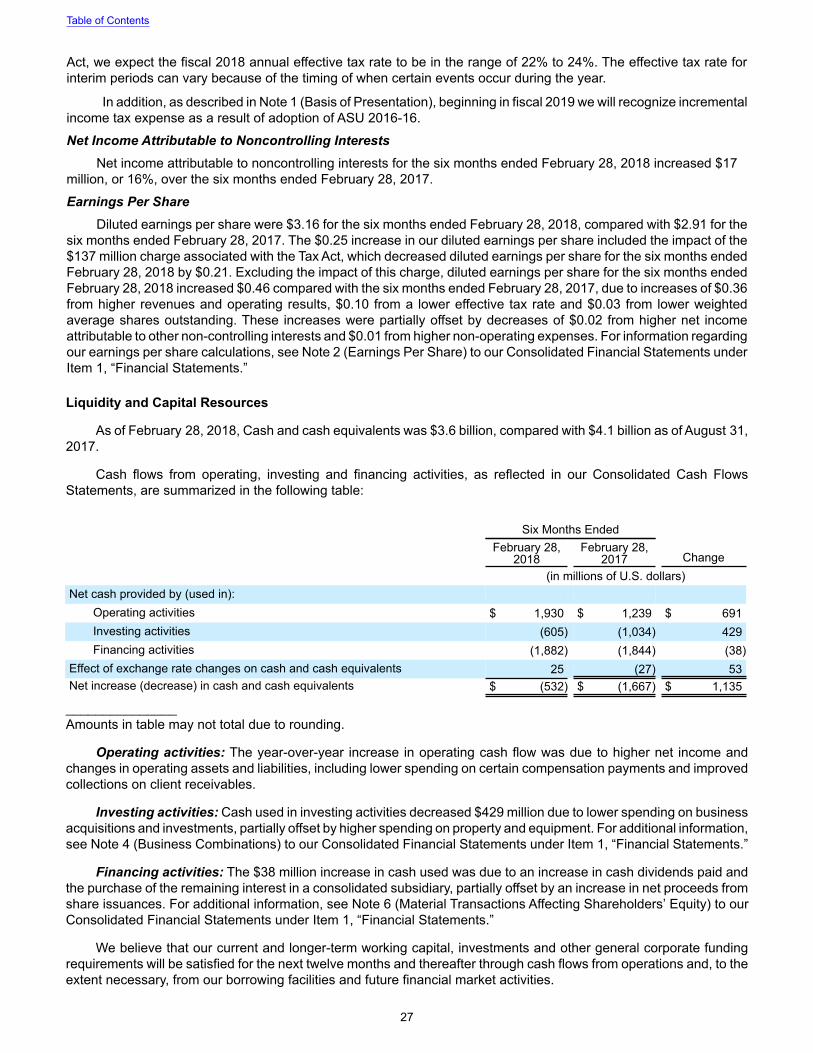
Act, we expect the fiscal 2018 annual effective tax rate to be in the range of 22% to 24%. The effective tax rate forinterim periods can vary because of the timing of when certain events occur during the year.
In addition, as described in Note 1 (Basis of Presentation), beginning in fiscal 2019 we will recognize incrementalincome tax expense as a result of adoption of ASU 2016-16.
Net Income Attributable to Noncontrolling Interests Net income attributable to noncontrolling interests for the six months ended February 28, 2018 increased $17
million, or 16%, over the six months ended February 28, 2017.
Earnings Per ShareDiluted earnings per share were $3.16 for the six months ended February 28, 2018, compared with $2.91 for the
six months ended February 28, 2017. The $0.25 increase in our diluted earnings per share included the impact of the$137 million charge associated with the Tax Act, which decreased diluted earnings per share for the six months endedFebruary 28, 2018 by $0.21. Excluding the impact of this charge, diluted earnings per share for the six months endedFebruary 28, 2018 increased $0.46 compared with the six months ended February 28, 2017, due to increases of $0.36from higher revenues and operating results, $0.10 from a lower effective tax rate and $0.03 from lower weightedaverage shares outstanding. These increases were partially offset by decreases of $0.02 from higher net incomeattributable to other non-controlling interests and $0.01 from higher non-operating expenses. For information regardingour earnings per share calculations, see Note 2 (Earnings Per Share) to our Consolidated Financial Statements underItem 1, “Financial Statements.”
Table of Contents
27
Liquidity and Capital Resources
As of February 28, 2018, Cash and cash equivalents was $3.6 billion, compared with $4.1 billion as of August 31,2017.
Cash flows from operating, investing and financing activities, as reflected in our Consolidated Cash FlowsStatements, are summarized in the following table:
_______________ Amounts in table may not total due to rounding.
Operating activities: The year-over-year increase in operating cash flow was due to higher net income andchanges in operating assets and liabilities, including lower spending on certain compensation payments and improvedcollections on client receivables.
Investing activities: Cash used in investing activities decreased $429 million due to lower spending on businessacquisitions and investments, partially offset by higher spending on property and equipment. For additional information,see Note 4 (Business Combinations) to our Consolidated Financial Statements under Item 1, “Financial Statements.”
Financing activities: The $38 million increase in cash used was due to an increase in cash dividends paid andthe purchase of the remaining interest in a consolidated subsidiary, partially offset by an increase in net proceeds fromshare issuances. For additional information, see Note 6 (Material Transactions Affecting Shareholders’ Equity) to ourConsolidated Financial Statements under Item 1, “Financial Statements.”
We believe that our current and longer-term working capital, investments and other general corporate fundingrequirements will be satisfied for the next twelve months and thereafter through cash flows from operations and, to theextent necessary, from our borrowing facilities and future financial market activities.
Six Months EndedFebruary 28,
2018February 28,
2017 Change(in millions of U.S. dollars)
Net cash provided by (used in):Operating activities $ 1,930 $ 1,239 $ 691Investing activities (605) (1,034) 429Financing activities (1,882) (1,844) (38)
Effect of exchange rate changes on cash and cash equivalents 25 (27) 53Net increase (decrease) in cash and cash equivalents $ (532) $ (1,667) $ 1,135

Substantially all of our cash is held in jurisdictions where there are no regulatory restrictions or material tax effectson the free flow of funds. Domestic cash inflows for our Irish parent, principally dividend distributions from lower-tiersubsidiaries, have been sufficient to meet our historic cash requirements, and we expect this to continue into the future.
Borrowing FacilitiesAs of February 28, 2018, we had the following borrowing facilities, including the issuance of letters of credit, to
support general working capital purposes:
Under the borrowing facilities described above, we had an aggregate of $246 million of letters of credit outstandingas of February 28, 2018. In the fourth quarter of fiscal 2017, we entered into agreements that will allow us to establisha commercial paper program for short-term borrowings of up to $1 billion, backed by our syndicated loan facility.
Share Purchases and RedemptionsThe Board of Directors of Accenture plc has authorized funding for our publicly announced open-market share
purchase program for acquiring Accenture plc Class A ordinary shares and for purchases and redemptions of Accentureplc Class A ordinary shares, Accenture Holdings plc ordinary shares and Accenture Canada Holdings Inc. exchangeableshares held by current and former members of Accenture Leadership and their permitted transferees.
Our share purchase activity during the six months ended February 28, 2018 was as follows:
_______________(1) We conduct a publicly announced open-market share purchase program for Accenture plc Class A ordinary
shares. These shares are held as treasury shares by Accenture plc and may be utilized to provide for selectemployee benefits, such as equity awards to our employees.
(2) During the six months ended February 28, 2018, as authorized under our various employee equity share plans,we acquired Accenture plc Class A ordinary shares primarily via share withholding for payroll tax obligationsdue from employees and former employees in connection with the delivery of Accenture plc Class A ordinaryshares under those plans. These purchases of shares in connection with employee share plans do not affectour aggregate available authorization for our publicly announced open-market share purchase and the othershare purchase programs.
We intend to continue to use a significant portion of cash generated from operations for share repurchases duringthe remainder of fiscal 2018. The number of shares ultimately repurchased under our open-market share purchaseprogram may vary depending on numerous factors, including, without limitation, share price and other market conditions,our ongoing capital allocation planning, the levels of cash and debt balances, other demands for cash, such asacquisition activity, general economic and/or business conditions, and board and management discretion. Additionally,as these factors may change over the course of the year, the amount of share repurchase activity during any particularperiod cannot be predicted and may fluctuate from time to time. Share repurchases may be made from time to timethrough open-market purchases, in respect of purchases and redemptions of Accenture Canada Holdings Inc.exchangeable shares, through the use of Rule 10b5-1 plans and/or by other means. The repurchase program may beaccelerated, suspended, delayed or discontinued at any time, without notice.
Accenture plc Class AOrdinary Shares
Accenture Holdings plc OrdinaryShares and Accenture Canada
Holdings Inc. Exchangeable SharesShares Amount Shares Amount
(in millions of U.S. dollars, except share amounts)
Open-market share purchases (1) 6,030,422 $ 889 — $ —
Other share purchase programs — — 557,894 83
Other purchases (2) 2,619,931 395 — —Total 8,650,353 $ 1,284 557,894 $ 83
FacilityAmount
BorrowingsUnder
Facilities(in millions of U.S. dollars)
Syndicated loan facility $ 1,000 $ —Separate, uncommitted, unsecured multicurrency revolving credit facilities 493 —Local guaranteed and non-guaranteed lines of credit 242 —Total $ 1,735 $ —
Table of Contents
28
Other Share RedemptionsDuring the six months ended February 28, 2018, we issued 351,804 Accenture plc Class A ordinary shares upon
redemptions of an equivalent number of Accenture Holdings plc ordinary shares pursuant to our registration statementon Form S-3 (the “registration statement”). The registration statement allowed us, at our option, to issue freely tradableAccenture plc Class A ordinary shares in lieu of cash upon redemptions of Accenture Holdings plc ordinary shares heldby current and former members of Accenture Leadership and their permitted transferees. In connection with the mergerof Accenture Holdings plc with and into Accenture plc, we have terminated the registration statement. For additionalinformation, see Note 11 (Subsequent Event) to our Consolidated Financial Statements under Item 1, “FinancialStatements”.
For a complete description of all share purchase and redemption activity for the second quarter of fiscal 2018,see Part II, Item 2, “Unregistered Sales of Equity Securities and Use of Proceeds.”
Off-Balance Sheet ArrangementsIn the normal course of business and in conjunction with some client engagements, we have entered into
contractual arrangements through which we may be obligated to indemnify clients with respect to certain matters.
To date, we have not been required to make any significant payment under any of the arrangements describedabove. For further discussion of these transactions, see Note 9 (Commitments and Contingencies) to our ConsolidatedFinancial Statements under Item 1, “Financial Statements.”
New Accounting PronouncementsSee Note 1 (Basis of Presentation) to our Consolidated Financial Statements under Item 1, “Financial
Statements.”
Table of Contents
29
ITEM 3. QUANTITATIVE AND QUALITATIVE DISCLOSURES ABOUT MARKET RISKDuring the six months ended February 28, 2018, there were no material changes to the information on market
risk exposure disclosed in our Annual Report on Form 10-K for the year ended August 31, 2017. For a discussion ofour market risk associated with foreign currency risk, interest rate risk and equity price risk as of August 31, 2017, see“Quantitative and Qualitative Disclosures About Market Risk” in Part II, Item 7A, of our Annual Report on Form 10-Kfor the year ended August 31, 2017.
ITEM 4. CONTROLS AND PROCEDURESEvaluation of Disclosure Controls and Procedures
Our management, with the participation of our principal executive officer and our principal financial officer, hasevaluated the effectiveness of our disclosure controls and procedures (as defined in Rule 13a-15(e) under the ExchangeAct) as of the end of the period covered by this report. Any controls and procedures, no matter how well designed andoperated, can provide only reasonable assurance of achieving the desired control objectives. Based on that evaluation,the principal executive officer and the principal financial officer of Accenture plc have concluded that, as of the end ofthe period covered by this report, our disclosure controls and procedures were effective at the reasonable assurancelevel.
Changes in Internal Control Over Financial ReportingThere has been no change in our internal control over financial reporting that occurred during the second quarter
of fiscal 2018 that has materially affected, or is reasonably likely to materially affect, our internal control over financialreporting.

PART II — OTHER INFORMATION
Table of Contents
30
ITEM 1. LEGAL PROCEEDINGSThe information set forth under “Legal Contingencies” in Note 9 (Commitments and Contingencies) to our
Consolidated Financial Statements under Part I, Item 1, “Financial Statements,” is incorporated herein by reference.
ITEM 1A. RISK FACTORSFor a discussion of our potential risks and uncertainties, see the information under the heading “Risk Factors” in
our Annual Report on Form 10-K for the year ended August 31, 2017. There have been no material changes to therisk factors disclosed in our Annual Report on Form 10-K for the year ended August 31, 2017.

ITEM 2. UNREGISTERED SALES OF EQUITY SECURITIES AND USE OF PROCEEDS
Purchases and Redemptions of Accenture plc Class A Ordinary Shares and Class X Ordinary SharesThe following table provides information relating to our purchases of Accenture plc Class A ordinary shares and
redemptions of Accenture plc Class X ordinary shares during the second quarter of fiscal 2018. In connection with themerger of Accenture Holdings plc with and into Accenture plc on March 13, 2018, the Accenture plc Class X ordinaryshares held by Accenture Holdings plc shareholders were redeemed. For additional information, see Note 11(Subsequent Event) to our Consolidated Financial Statements under Item 1, “Financial Statements”.
_______________(1) Average price paid per share reflects the total cash outlay for the period, divided by the number of shares
acquired, including those acquired by purchase or redemption for cash and any acquired by means of employeeforfeiture.
(2) Since August 2001, the Board of Directors of Accenture plc has authorized and periodically confirmed a publiclyannounced open-market share purchase program for acquiring Accenture plc Class A ordinary shares. Duringthe second quarter of fiscal 2018, we purchased 2,827,815 Accenture plc Class A ordinary shares under thisprogram for an aggregate price of $442 million. The open-market purchase program does not have an expirationdate.
(3) As of February 28, 2018, our aggregate available authorization for share purchases and redemptions was$2,147 million, which management has the discretion to use for either our publicly announced open-marketshare purchase program or the other share purchase programs. Since August 2001 and as of February 28,2018, the Board of Directors of Accenture plc has authorized an aggregate of $30,100 million for purchasesand redemptions of Accenture plc Class A ordinary shares, Accenture Holdings plc ordinary shares or AccentureCanada Holdings Inc. exchangeable shares.
(4) During the second quarter of fiscal 2018, Accenture purchased 2,075,597 Accenture plc Class A ordinaryshares in transactions unrelated to publicly announced share plans or programs. These transactions consistedof acquisitions of Accenture plc Class A ordinary shares primarily via share withholding for payroll tax obligationsdue from employees and former employees in connection with the delivery of Accenture plc Class A ordinaryshares under our various employee equity share plans. These purchases of shares in connection with employeeshare plans do not affect our aggregate available authorization for our publicly announced open-market sharepurchase and the other share purchase programs.
(5) Accenture plc Class X ordinary shares are redeemable at their par value of $0.0000225 per share.
Period
Total Numberof SharesPurchased
AveragePrice Paid
per Share (1)
Total Number ofShares Purchased as
Part of PubliclyAnnounced Plans or
Programs (2)
Approximate Dollar Valueof Shares that May Yet Be
Purchased Under the Plansor Programs (3)
(in millions of U.S. dollars)
December 1, 2017 — December 31, 2017Class A ordinary shares 1,362,893 $ 150.00 938,252 $ 2,483Class X ordinary shares 24,980 $ 0.0000225 — —
January 1, 2018 — January 31, 2018
Class A ordinary shares 2,388,427 $ 156.56 935,737 $ 2,313Class X ordinary shares 137,554 $ 0.0000225 — —
February 1, 2018 — February 28, 2018
Class A ordinary shares 1,152,092 $ 158.59 953,826 $ 2,147Class X ordinary shares 33,746 $ 0.0000225 — —
Total
Class A ordinary shares (4) 4,903,412 $ 155.21 2,827,815Class X ordinary shares (5) 196,280 $ 0.0000225 —
Table of Contents
31

Purchases and Redemptions of Accenture Holdings plc Ordinary Shares and Accenture Canada Holdings Inc.Exchangeable Shares
The following table provides additional information relating to our purchases and redemptions of AccentureHoldings plc ordinary shares and Accenture Canada Holdings Inc. exchangeable shares for cash during the secondquarter of fiscal 2018. We believe that the following table and footnotes provide useful information regarding the sharepurchase and redemption activity of Accenture. Generally, purchases and redemptions of Accenture Holdings plcordinary shares and Accenture Canada Holdings Inc. exchangeable shares for cash and employee forfeitures reduceshares outstanding for purposes of computing diluted earnings per share. However, in connection with the merger ofAccenture Holdings plc with and into Accenture plc on March 13, 2018, shareholders of Accenture Holdings plc (otherthan Accenture plc and Accenture Holdings plc) received one Class A ordinary share of Accenture plc for each shareof Accenture Holdings plc that they owned. Accordingly, as of March 13, 2018, there were no longer any ordinary sharesof Accenture Holdings plc outstanding. For additional information, see Note 11 (Subsequent Event) to our ConsolidatedFinancial Statements under Item 1, “Financial Statements”.
_______________(1) During the second quarter of fiscal 2018, we acquired a total of 265,330 Accenture Holdings plc ordinary shares
and 8,050 Accenture Canada Holdings Inc. exchangeable shares from current and former members ofAccenture Leadership and their permitted transferees by means of purchase or redemption for cash, oremployee forfeiture, as applicable. In addition, during the second quarter of fiscal 2018, we issued 152,126Accenture plc Class A ordinary shares upon redemptions of an equivalent number of Accenture Holdings plcordinary shares pursuant to a registration statement.
(2) Average price paid per share reflects the total cash outlay for the period, divided by the number of sharesacquired, including those acquired by purchase or redemption for cash and any acquired by means of employeeforfeiture.
(3) For a discussion of our aggregate available authorization for share purchases and redemptions through eitherour publicly announced open-market share purchase program or the other share purchase programs, see the“Approximate Dollar Value of Shares that May Yet Be Purchased Under the Plans or Programs” column of the“Purchases and Redemptions of Accenture plc Class A Ordinary Shares and Class X Ordinary Shares” tableabove and the applicable footnote.
Period
Total Numberof Shares
Purchased (1)
AveragePrice Paid
per Share (2)
Total Number ofShares Purchasedas Part of Publicly
Announced Plans orPrograms
Approximate Dollar Valueof Shares that May Yet Be
Purchased Under the Plansor Programs (3)
Accenture Holdings plcDecember 1, 2017 — December 31, 2017 44,464 $ 153.12 — —January 1, 2018 — January 31, 2018 125,338 $ 160.04 — —February 1, 2018 — February 28, 2018 95,528 $ 154.24 — —Total 265,330 $ 156.79 — —
Accenture Canada Holdings Inc.December 1, 2017 — December 31, 2017 — $ — — —January 1, 2018 — January 31, 2018 8,050 $ 158.02 — —February 1, 2018 — February 28, 2018 — $ — — —Total 8,050 $ 158.02 — —
Table of Contents
32
ITEM 3. DEFAULTS UPON SENIOR SECURITIESNone.
ITEM 4. MINE SAFETY DISCLOSURESNot applicable.
ITEM 5. OTHER INFORMATION(a) None.
(b) None.

ITEM 6. EXHIBITSExhibit Index:
(*) Indicates management contract or compensatory plan or arrangement.
ExhibitNumber Exhibit3.1 Amended and Restated Memorandum and Articles of Association of Accenture plc (incorporated
by reference to Exhibit 3.1 to Accenture plc’s 8-K filed on February 7, 2018)
10.1 Memorandum and Articles of Association and Deed Poll of Accenture Holdings plc (incorporatedby reference to Exhibit 3.1 to Accenture Holdings plc’s 8-K12G3 filed on August 26, 2015)
10.2* Amended and Restated Accenture plc 2010 Share Incentive Plan (incorporated by reference toExhibit 10.1 to Accenture plc’s 8-K filed on February 7, 2018)
10.3* Form of Key Executive Performance-Based Award Restricted Share Unit Agreement pursuant tothe Amended and Restated Accenture plc 2010 Share Incentive Plan (filed herewith)
10.4* Form of Accenture Leadership Performance Equity Award Restricted Share Unit Agreementpursuant to the Amended and Restated Accenture plc 2010 Share Incentive Plan (filed herewith)
10.5* Form of Voluntary Equity Investment Program Matching Grant Restricted Share Unit Agreementpursuant to the Amended and Restated Accenture plc 2010 Share Incentive Plan (filed herewith)
10.6* Form of CEO Discretionary Grant Restricted Share Unit Agreement pursuant to the Amendedand Restated Accenture plc 2010 Share Incentive Plan (filed herewith)
10.7* Form of Director Restricted Share Unit Agreement pursuant to the Amended and RestatedAccenture plc 2010 Share Incentive Plan (filed herewith)
31.1 Certification of the Chief Executive Officer pursuant to Rule 13a-14(a) or 15d-14(a) of theSecurities Exchange Act of 1934, as adopted pursuant to Section 302 of the Sarbanes-Oxley Actof 2002 (filed herewith)
31.2 Certification of the Chief Financial Officer pursuant to Rule 13a-14(a) or 15d-14(a) of theSecurities Exchange Act of 1934, as adopted pursuant to Section 302 of the Sarbanes-Oxley Actof 2002 (filed herewith)
32.1 Certification of the Chief Executive Officer pursuant to 18 U.S.C. Section 1350, as adoptedpursuant to Section 906 of the Sarbanes-Oxley Act of 2002 (furnished herewith)
32.2 Certification of the Chief Financial Officer pursuant to 18 U.S.C. Section 1350, as adoptedpursuant to Section 906 of the Sarbanes-Oxley Act of 2002 (furnished herewith)
101 The following financial information from Accenture plc’s Quarterly Report on Form 10-Q for thequarterly period ended February 28, 2018, formatted in XBRL (eXtensible Business ReportingLanguage): (i) Consolidated Balance Sheets as of February 28, 2018 (Unaudited) and August31, 2017, (ii) Consolidated Income Statements (Unaudited) for the three and six months endedFebruary 28, 2018 and 2017, (iii) Consolidated Statements of Comprehensive Income(Unaudited) for the three and six months ended February 28, 2018 and 2017, (iv) ConsolidatedShareholders’ Equity Statement (Unaudited) for the six months ended February 28, 2018, (v)Consolidated Cash Flows Statements (Unaudited) for the six months ended February 28, 2018and 2017 and (vi) the Notes to Consolidated Financial Statements (Unaudited)
Table of Contents
33
SIGNATURES
Pursuant to the requirements of the Securities Exchange Act of 1934, the registrant has duly caused thisreport to be signed on its behalf by the undersigned thereunto duly authorized.
Date: March 22, 2018
ACCENTURE PLC
By: /s/ David P. RowlandName: David P. RowlandTitle: Chief Financial Officer
(Principal Financial Officer andAuthorized Signatory)
Table of Contents
34