formal safety assessment - amazon s3s3-eu-west-1.amazonaws.com/stm-stmvalidation/... · monalisa...
TRANSCRIPT

MONALISA 2.0 — FSA: FORMAL SAFETY ASSESSMENT 1
Activity 2 – Defining Sea Traffic Management
FSA – Formal Safety Assessment of the STM concept

MONALISA 2.0 — FSA: FORMAL SAFETY ASSESSMENT 2
Document Status Authors Name Organisation Björn Forsman SSPA Sweden AB Axel Andersson SSPA Sweden AB
Review Name Organisation
Approval Name Organisation Signature Date Björn Andreasson SMA 2015-12-
28 Mikael Hägg Chalmers 2015-12-
28
Document History Version Date Status Initials Description
TEN-T PROJECT NO: 2012-EU-21007-S DISCLAIMER: THIS INFORMATION REFLECTS THE VIEW OF THE AUTHOR(S) AND THE EUROPEAN COMMISSION IS NOT LIABLE FOR ANY USE THAT MAY BE MADE OF THE INFORMATION CONTAINED THEREIN.

MONALISA 2.0 — FSA: FORMAL SAFETY ASSESSMENT 3
Table of contents 1 Summary ................................................................................................................... 5
2 Introduction ............................................................................................................... 8
2.1 Context in relation to other ML2 activities ................................................................ 8
2.2 Risk Control Measures, RCMs, addressed by the FSA. .......................................... 9
2.3 Testbed and safety related Key Performance Indicators, KPIs ............................. 10
2.4 Stepwise validation process and geo-extrapolation ............................................... 12
2.5 Ship and accident statistics of relevance for the addressed RCMs ....................... 14
3 The FSA structure .................................................................................................. 15
3.1 IMO Guidelines on FSA ......................................................................................... 15
3.2 IMO e-navigation SIP ............................................................................................. 16
3.2.1 Guidelines to support the SIP ........................................................................ 16
3.2.2 IALA Guideline No. 1107 ............................................................................... 16
3.3 E-OCVM 3.0 .......................................................................................................... 16
4 The European Maritime Simulation Network, EMSN ........................................... 17
4.1 Partners ................................................................................................................. 17
4.2 Technical set-up and communication .................................................................... 17
4.3 Simulation sessions conducted ............................................................................. 18
4.4 Testbed reliability and experienced limitations ...................................................... 19
5 Hazid - Hazard identification.................................................................................. 21
5.1 Hazid workshop ..................................................................................................... 21
5.1.1 Identified hard KPIs and simulation variables to be logged ........................... 21
5.1.2 Identified means of collecting soft KPIs ......................................................... 21
5.2 Selection of EMSN test area .................................................................................. 21
5.3 Non site-specific potential hazards associated with STM ...................................... 22
5.3.1 Information overload ...................................................................................... 23
5.3.2 Cultural-hierarchic traditions .......................................................................... 23
5.3.3 Over reliance .................................................................................................. 23
5.3.4 Preferred ship speed ...................................................................................... 23
5.3.5 Workload ........................................................................................................ 24
6 Risk analysis ........................................................................................................... 25
6.1 Potential safety benefits gained by ML2 ................................................................ 25
6.2 Potential risks associated by introduction of ML2 .................................................. 25
6.3 Results of EMSN baseline simulations at Hatter Barn ........................................... 26
6.3.1 Analysis of hard KPIs from the EMSN simulation sessions ........................... 26

MONALISA 2.0 — FSA: FORMAL SAFETY ASSESSMENT 4
6.3.2 Analysis of soft KPIs from the EMSN baseline simulation sessions .............. 28
6.4 Theoretical calculation of potential risk reduction by use of conflict resolution algorithms .............................................................................................................. 29
6.4.1 The conflict resolution algorithm .................................................................... 29
6.4.2 Results of theoretical calculations with application of CRA in Kattegat ......... 30
6.5 Evaluation of accident statistics and potential risk reduction by STM ................... 31
6.5.1 RCO workshop and estimation of potential risk reduction gains .................... 31
6.5.2 Results of the evaluation of accident statistics .............................................. 32
6.6 Risk reduction gained by flow optimisation and expected reduced number of collision candidates ............................................................................................... 33
6.6.1 Impact of flow optimisation on groundings and other accident types ............. 35
6.6.2 Enhanced monitoring for prevention of groundings ....................................... 35
6.7 Evaluation of international accident statistics and estimation of potential risk reduction by ML2 STM .......................................................................................... 37
6.7.1 European accident statistics .......................................................................... 37
6.7.2 Results of evaluation of global statistics of navigational accidents and estimations of potential risk reduction ML2 .................................................... 38
7 Risk Control Option, RCO ...................................................................................... 40
7.1 Collision risk increment induced by parallel regimes ............................................. 40
7.2 Risks related to the ML2 system quality ................................................................ 40
8 CBA – Cost Benefit Analysis ................................................................................. 41
8.1 Economic benefits gained by risk reduction .......................................................... 41
8.2 Cost of introduction of ML2 STM ........................................................................... 42
8.3 Cost of Averting a Fatality - estimation of GrossCAF and NetCAF ....................... 43
9 Uncertainties and sensitivity in assumptions and output .................................. 45
10 Conclusions and recommendations ..................................................................... 46
10.1 Safety enhancement and potential risk reduction by STM .................................... 46
10.2 Recommendations on further safety assessment and validation studies on the ML STM ....................................................................................................................... 46
10.2.1 CATS calculation ........................................................................................... 46
10.2.2 Alternative Monte-Carlo simulation models for safety assessment ................ 47
10.2.3 Wider test areas and European geo-extrapolation ........................................ 47
11 References .............................................................................................................. 48
12 Appendices ............................................................................................................. 49
Appendix 1 Minutes of meetings from Hazid Identification workshop………………………….49
Appendix 2 Notes from RCO workshop on Accident cases in Kattegat (in Swedish/Danish).59

MONALISA 2.0 — FSA: FORMAL SAFETY ASSESSMENT 5
1 Summary A number of different enabling concepts and operational services have been outlined within the MONALISA 2.0 addressing efficiency, environment, and safety aspects of Sea Traffic Management. This high level Formal Safety Assessment is based on input from European Maritime Simulation Network simulations, theoretical calculations, and analysis of accident statistics. It is focused on three different Risk Control Measures primarily aiming at prevention of human factor related navigational accidents. The preventive effect is anticipated to reduce collisions and groundings in open and coastal waters whilst accidents in ports and inland waterways are less affected. The enabling concepts of the MONALISA 2.0 comprise a number of operational services of which three are specifically addressed with regard to their potential safety enhancement effect.
• Flow Management includes services supporting both land organizations and ships in optimizing overall traffic flow through areas of dense traffic and with particular navigational challenges. Its main objective is to optimise and increase the safety of the sea traffic flow during all planning and executing phases. Flow optimisation by use of a conflict resolution algorithm is a Flow Management service enabling safe and efficient traffic flow through areas with high traffic density. Collision risks are reduced by proposing re-scheduling and/or waypoint adjustment in order to resolve traffic congestion and minimize close quarter situations. The flow synchronization also ensures that the adjusted routes are safe with respect to local depth conditions, current Maritime Safety Information, updated Marine Spatial Planning areas etc. Other Flow Management services based on enhanced monitoring and safety-two approaches for analysis of AIS data may enable early detection of anomalies from normal operational behaviour and thereby reduce grounding risks by intervention from Port Control, Vessel Traffic Service and Shore centres.
• Dynamic Voyage Management deals with route planning, route exchange and route optimization while the ship is on its way. It is an iterative process of sharing information in real-time in order to improve safety and situational awareness of the parties involved. By ship-to-ship route exchange, the ships will get each other’s updated voyage plans available in their ECDIS allowing them to plan ahead and to take adequate actions based on a common situational awareness.
The FSA results presented, indicate that implementation (in all tankers, cargo- and passenger ships) of the addressed Risk Control Measures will generate risk reductions of maritime accidents caused by human error in open and coastal waters according to estimations shown in Table 1.

MONALISA 2.0 — FSA: FORMAL SAFETY ASSESSMENT 6
Table 1 Estimated reduction (%) of expected collisions and groundings by implementation of the Risk Control Measures.
Risk reduction rate
Flow Management by flow optimisation
Flow Management by enhanced monitoring
Dynamic Voyage Management by route exchange
Weighted combined rate
Collisions 58% 5% 52% 81% Groundings 6% 64% 8% 69%
Statistical distribution of collision and grounding accidents with respect to open sea, coastal waters and port approach are derived from EMSA for 2014. The number of unique ships and ship years in European waters is based on data from AIS-Hub. Table 2 summarises FSA results of potential risk reduction in established FSA cost-benefit key figures defined by reduction in Potential Loss of Life, PLL and in index values for Gross Cost of Averting a Fatality, GCAF, and for Net Cost of Averting a Fatality, NCAF. Table 2 Summary of the FSA Cost Benefit Analysis after combining and implementing all Risk Control Measures.
Key Cost Benefit figures
Risk reduction (PLL/year)
Implementing cost (/ship)1
Reduction of Claim costs (/ship)
GCAF NCAF
By combined Risk Control Measures 5,01x10⁻⁴ 4 300 € 11 200 € 8 590 000 € Negative
The risk, measured in terms of loss of lives due to navigational accidents caused by human error, is today 0.001 per ship year and after implementing the three addressed MONALISA 2.0 Risk Control measures, the risk is estimated to decrease to about 0.0005 per ship year, i.e. one fatality every 2000 ship year. The GCAF is higher than the traditional criterion of 3.0 million USD (2.7 million €) (IMO, IMO 2000, Formal Safety Assessment, MSC 72/16, 2000) and (IMO, 2013). More recent studies (EMSAa, 2015), however, suggest a higher amount and indicates an updated criterion of 6.3 million €. The estimated GCAF is still somewhat higher than the suggested updated criterion. The estimated NCAF is, however negative indicating that the implementation of the three RCMs is economically beneficial in itself. The NCAF figure includes estimated economic benefits of reduced hull and machinery insurance claims for averted navigational accident costs at an average of 830 000 € for collisions and 910 000 € for grounding accidents. The three Risk Control Measures are basically using the same on board equipment and integrated training and introduction will therefore make parallel implementation of all three more efficient and saves costs. The cost-benefit considerations presented in this high level FSA indicate that the relation between costs for introduction of the STM concept and its expected risk reduction in terms of averted fatalities caused by collisions and groundings, justify 1 Implementing costs are extracted from the overall CBA conducted by Linköping University (Andersson|Ivehammar, 2015).
MONALISA 2.0 — FSA: FORMAL SAFETY ASSESSMENT 7
the introduction of MONALISA 2.0 It is therefore recommended to continue the validation process and system development. Depending on the number of ships adopting STM, total annual safety benefits in European waters may reach an order of 100 million € in terms of averted cost and loss of lives. By further development, elaboration and testing of the outlined STM concepts and operational services, more accurate estimations on potential risk reduction and cost savings may be derived in more detailed Formal Safety Assessment and by use of advanced simulation techniques and qualified expertise.

MONALISA 2.0 — FSA: FORMAL SAFETY ASSESSMENT 8
2 Introduction This introductory chapter defines the scope and delimitations of the Formal Safety Assessment (FSA), conducted for the Sea Traffic Management (STM) concept developed within the MONALISA 2.0 (ML2) project. The methodology, data sources, and basic assumptions are also described.
2.1 Context in relation to other ML2 activities The ML2 FSA is a high level safety assessment of the ML2 STM concept. It is part of the Activity 2 Sea Traffic Management – Definition Phase and its WP 3 Target Concept. It relies partly on input from Activity 1 Sea Traffic Management – STM operations and its WP 4 Extended test bed, producing output from simulations with the European Maritime Simulation Network (EMSN) and partly from theoretical calculations conducted within Activity 1.6 - Integration of decision support tools. In addition, national and international accident statistics have been analysed in order to derive input for estimation of potential risk reduction gained by introduction of the STM. Output from the ML2 FSA provides input on safety related cost-benefit aspects to complement the overall Cost Benefit Analysis (CBA) of the STM concept. The overall CBA, also prepared within the Activity 2.3, is primarily addressing societal cost-benefit aspects of economy, efficiency and environmental benefits. The ML2 FSA include references to other deliverables of the ML2 and output from the Hazid and RCO workshops are also included in appendices to the ML2 FSA. The structure and context of the ML2 FSA described above are schematically presented in the box diagram below.

MONALISA 2.0 — FSA: FORMAL SAFETY ASSESSMENT 9
Figure 1 Schematic description of the FSA structure and its relations to other ML2 Activities.
2.2 Risk Control Measures, RCMs, addressed by the FSA. The ML2 STM concept encompasses three main target performance areas; i) Safety, ii) Efficiency/Economy, and iii) Environment. This ML2 FSA is particularly addressing safety performance of the outlined concept. Activity 2.3 of the STM defines the following four enabling strategic concepts as crucial for reaching the target values:
• Port Collaborative Decision Making (Port CDM), in which the process for arrivals and departures is made more efficient through information sharing, common situational awareness and improved processes;
• Strategic Voyage Management (SVM), which deals with route planning, route exchange and route optimization before the voyage has started;
• Dynamic Voyage Management (DVM) which deals with route planning, route exchange and route optimization whilst the ship is on its way;
• Flow Management (FM), which includes services that will support both land organizations and ships in optimizing overall traffic flow through areas of dense traffic and areas particular navigational challenges.
These are all enabled by:
• Information sharing by Sea System Wide Information Management (Sea SWIM), which has the intention of being a common framework for information sharing and service distribution for maritime activities.
Within each of the enabling concepts a number of specific STM components or operational services have been developed and presented. Some of these are specifically designed with the aim of safety enhancement and risk reduction. In
FSA, Formal Safety Assessment The FSA addresses the following three STM operational services as primary Risk Control Measures, RCMs:
1) Flow optimisation, 2) Route exchange (ship-to-ship) 3) Enhanced monitoring
Activity 2.3 STM Target concept Enabling concepts: - Strategic Voyage Management - Flow Management - Dynamic Voyage Management - Port CDM supported by SeaSWIM concept
Activity 1.4 Extended testbed EMSN simulations in test area: - Baseline of recorded AIS data - Simulations without STM - Simulations with STM Comparative analyses of safety related hard KPIs and soft KPIs from questionnaires
Quantification of potential risk reduction gained by the combined RCMs of the STM in terms of averted fatalities and economic benefits to complement the overall CBA study.
Derivation of GCAF and NCAF figures and recommendations.
Activity 1.6 Integration of decision support tools Theoretical calculations on flow optimisation
Accident statistics
Analysis of historical cases and statistics for estimation of risk reduction potential and geo-extrapolation

MONALISA 2.0 — FSA: FORMAL SAFETY ASSESSMENT 10
this ML2 FSA three such safety related operational services are selected to be analysed as individual Risk Control Measures (RCMs) and combined to form a Risk Control Option (RCO). The three RCMs are specifically analysed with respect to their risk reduction potential for prevention of navigational accidents, primarily collision and groundings, which usually are caused by human failures. The selected STM operational services and their attributed enabling strategic concepts are summarised in Table 3. Table 3 Selected safety related operational services addressed by the FSA.
The enabling concept of Dynamic Voyage Management (DVM) also includes the service; cross-checking of own voyage plan, providing external confirmation that the voyage plan is safe and thereby has a preventive potential for reduction of navigational accidents. However, assuming that the Flow Management service with Conflict Resolution Algorithm (CRA) is fully implemented, the cross-checking function must already be included, and is therefore not analysed separately in this study. Strategic Voyage Management and route optimization services primarily aiming at shortening of sailing distances, better synchronized arrival times and reduced fuel consumption, (addressed in the first MONALISA project completed 2013) are neither analysed in the present study.
2.3 Testbed and safety related Key Performance Indicators, KPIs Within Activity 1.4, the European Maritime Simulation Network (EMSN) has been developed to provide an extended testbed for the STM concept. This testbed is intended to provide basic input for comparative quantitative performance analyses of the various STM enabling strategic concepts and operational services. With regard to safety performance indicators and quantification of risk reduction, other sources of information, however, also need to be used to derive conclusive results. Based on a hazard identification (Hazid) session, a test area for the EMSN simulations, featuring complex sea traffic, crossing routes, limited water depth etc. was selected to be the Hatter Barn in the northern part of the Danish Straits. The simulation results are compared with respect to a number of safety-related Key Performance Indicators (KPIs), like Closest Point of Approach (CPA), number of anti-collision manoeuvres etc. These “hard” KPIs are quantitatively derived from
Objective of the Risk Control Option, RCO
Prevention of navigational accidents (collision and groundings)
Risk Control Measure, RCM, operational services Enabling strategic concept
1 Flow optimisation to minimize close encounters by application of Conflict Resolution Algorithm (CRA)
Flow Management (FM)
2 Enhanced monitoring Early identification of deviations from normal operations.
Flow Management (FM)
3 Route exchange (REX) Ship to ship exchange of route segments
Dynamic Voyage Management (DVM)

MONALISA 2.0 — FSA: FORMAL SAFETY ASSESSMENT 11
logged simulation results and complemented by “soft” KPIs compiled from questionnaires completed by the navigators in the simulation sessions, specifically addressing workload aspects. The questionnaires are also subject to TLX analysis2. The hard KPI figures from simulations; a) without, and b) with the STM services are also compared with data derived for; c) the actual baseline data registered by the AIS ship data of 19 Sept 2014 and for; d) the theoretically calculated optimum routes with regard to conflict resolution and minimization of close encounters according to the Conflict Resolution Algorithm3 (CRA) outlined by SSPA. Observed differences between c) actual baseline simulations and a) simulated baseline, provide information on the test bed reliability and the range of individual distribution of navigational aspects. Differences between b) the EMSN simulation results encompassing the STM services and d) the theoretically calculated optimum routing of the traffic, indicate the level of potential achievable improvements in relation to the theoretical optimum. The figure below illustrates how comparisons between output from EMSN simulations, actual AIS registrations and theoretical calculations are combined for estimation of potential safety benefits gained by introduction of STM services. Figure 2 Basic comparative input analyses for calculation of safety benefits.
2 TLX, Task Load Index. Rating method for perceived workload developed by NASA. 3 The algorithm is basically introducing traffic synchronization by time separation and waypoint adjustments.

MONALISA 2.0 — FSA: FORMAL SAFETY ASSESSMENT 12
The results from the EMSN simulations only represent potential safety improvements in the specific test area and in order to predict the full STM potential in wider European sea areas, a geo-extrapolation process is needed.
2.4 Stepwise validation process and geo-extrapolation From the first level of EMSN tests in the Hatter Barn test area the second step of this process is made by extending the comparative analysis to the entire Kattegat area where theoretically calculated “collision safe” routes are compared with actual registered AIS data. This second step includes theoretical route calculations with CRA for one month in the Kattegat area. Results from this test area provide input on theoretical risk reduction levels and is supported by empirical data from 17 years of accident statistics from the area. The area and accident statistics are the same area as previously analysed in the first MONALISA project (2013) with respect to optimum green routes and fuel savings and therefore provide a relevant basis for comparative analysis. The sea area and the available statistics are, however, still restricted and cannot be used to derive reliable predictions of potential community wide safety benefits gained by introduction of STM services. It was therefore proposed that a third step should be included where more calculation examples in wider areas are conducted and complemented by further analysis of international accident databases. The output will facilitate extrapolation and prediction of potential safety benefits in a wider perspective of European sea areas. Further studies of international accident statistics may also provide additional empirical data for this third step and for derivation of potential global risk reduction by world-wide introduction of STM.

MONALISA 2.0 — FSA: FORMAL SAFETY ASSESSMENT 13
The stepwise process of validation test and geo-extrapolation is schematically illustrated in the figure below. Figure 3 Schematic illustration of the stepwise process of validation test and geo-extrapolation. The accuracy of the estimated potential safety benefits implied by application of the STM decreases as the range of the geo-extrapolation is increased, but is still assumed to provide reasonably conclusive indications. For the present high level FSA, the results are primarily addressing the 2015 traffic scenario and a situation with 100% adoption rate of the STM. However, when the concept design and operational services will become outlined more in detail in the STM validation, different future predicted sea traffic scenarios up to 2030 and various successive adoption rates for the STM concept may also be considered in comparative quantitative FSA approaches. The risk analysis phase of the FSA also includes an uncertainty analysis and sensitivity analysis. Proposals are also given on how to reduce the uncertainties by further validation activities, test bed trials, and fast time simulations. The potential safety benefits gained by the STM are assessed quantitatively, based on the assumption that the expected frequency of ship-ship collisions will decrease in proportion to the reduction of the number of close encounters gained by application of flow optimisation services. In addition to potential safety benefits with regard to collision prevention gained by flow optimisation and the route exchange (REX) services, potential grounding preventive benefits is also estimated for the enhanced monitoring services. In the Cost Benefit Analysis
1. EMSN simulations of 19 September 2014 at Hatter Barn test area. Comparative simulations with and without ML2
2a. Theoretical calculations for August 2014 on the application of the CRA in the Kattegat area. Comparative calculations with and without ML2 2b. Evaluation of actual accident cases in Kattegat
3. Risk reduction on collision and grounding events by the application of ML2 in EU waters based analysis of accident statistics + results from 1.and 2.
Detailed safety assessment in the next phase of STM validation project

MONALISA 2.0 — FSA: FORMAL SAFETY ASSESSMENT 14
(CBA) of the FSA, the total expected safety benefits are also converted into monetary figures to facilitate the overall CBA4 of the STM.
2.5 Ship and accident statistics of relevance for the addressed RCMs
All commercial ship types of size 300 GT and larger are considered and covered by the presented AIS analyses. Fishing vessels, naval craft, recreational boats etc. are not included. Analyses and risk reduction estimations are not separated for different ship types (cargo, tanker or passengers), and all ship types are rather represented by one generic ship type. For example, figures on recorded or calculated frequencies of navigational accidents are given per ship year for the generic commercial ship type. Baseline statistics on fleet population, ship data, and accident frequencies for the various studied areas are extracted from the following sources: Swedish Transport Agency, Danish Maritime Authority, HELCOM, EMSA, and AIS-Hub. The total number of ship year conducted in EU-waters is estimated from AIS registrations of unique ships (cargo, tankers and passenger with Length > 50 m, registrations in February 2014). The total number of registrations is 10 858 and, with regard to an assumed operational utilization rate of 270 days per year (Ramböll, 2000), a representative number of ship years in EU waters is estimated to 8 032 ship years. The three analysed RCMs are primarily aiming at prevention of human factor related navigational accidents (collisions and groundings) and hence these criteria are used for filtering of statistics. Human factor related causes include initial cause of accidents like; inattention, workload, intoxication etc. Accidents caused by technical causes or external factors are thus excluded. Further, the preventive effects by the RCMs are anticipated to reduce navigational accidents in open, coastal waters, archipelagos, and port approaches whilst accidents in ports and inland waterways, are less affected and not considered in analysis of statistics.
4 CBA, Cost-Benefit-Analysis conducted by Linköping University (Andersson|Ivehammar, 2015)

MONALISA 2.0 — FSA: FORMAL SAFETY ASSESSMENT 15
3 The FSA structure The FSA structure is based on guidelines from IMO and includes the following five main steps (IMO, 2015):
• Hazard identification
• Risk Assessment
• Risk Control Options, RCO
• Cost Benefit Assessment, CBA
• Decision Making - Recommendations These five steps are also found and reflected in this high level ML2 FSA report. Though the ML2 FSA is part of the ML2 project, an independent consultant team have prepared this report separately in order to provide un-biased and fully transparent results and recommendations. This report presents the FSA output in accordance to the format suggested by IMO guidelines. In addition to the IMO FSA guidelines, a number of other relevant guiding documents and assessment methodologies have been considered and used in applicable parts. Some of these are mentioned in section 2.2 and 2.3, below.
3.1 IMO Guidelines on FSA The IMO Guidelines on FSA were first developed as a response the Piper Alpha disaster in 1988, when an offshore platform exploded in the North Sea (167 fatalities). The FSA methodology is now regularly applied as a validation tool in the IMO rule making process. It is a rational, systematic, and proactive process for assessing the risks associated with shipping activity and for evaluating the costs and benefits of Risk Control Options (RCOs). Proposals for new RCOs are frequently accompanied by an FSA to justify its risk reduction effects. The STM concept comprises a set of operational services aiming at enhanced navigational safety and may therefore be considered as an RCO. It is thus relevant to elaborate an FSA for the STM concept if proposed and submitted to the IMO for consideration and evaluation. The different components included in the addressed STM RCO, are considered as separate STM operational services or Risk Control Measures (RCMs) and may be introduced together with a full STM or as separate services offered and provided by various commercial service providers. In some sections of this FSA, the risk reduction potential is therefore estimated separately for each of the following three STM services; Flow optimisation, Enhanced monitoring, and Route exchange.

MONALISA 2.0 — FSA: FORMAL SAFETY ASSESSMENT 16
3.2 IMO e-navigation SIP IMO´s e-navigation Strategy Implementation Plan (SIP) contains eight core elements and includes four guiding appendices (IMO, 2014). These guidelines and one guideline from International Association of Marine Aids to Navigation and Lighthouse Authorities (IALA) are briefly referred in the following sub-section
3.2.1 Guidelines to support the SIP The SIP includes the following guiding appendices of relevance for assessment of the STM concept (IMO, 2014).
• Human Centred Design HCD*
• Usability Testing Evaluation and Assessment U-TEA
• Software Quality Assurance SQA*
• Harmonization of test bed reporting
3.2.2 IALA Guideline No. 1107 In addition to No 4 above (Harmonization of test bed reporting), IALA has also issued guidelines for test bed evaluation and reporting in IALA Guideline No. 1107 (IALA_a, 2013). Relevant guidelines may also be provided in IALA´s Guideline No. 1105 on Shore-side portrayal ensuring harmonization with e-navigation related information (IALA_b, 2013).
3.3 E-OCVM 3.0 An important source of inspiration for the ML2 project development new STM concepts has been found by references to and dialogue with expertise involved in the development of new Air Traffic Management (ATM). ATM is developed following stringent testing and operational concept validation methodologies (Eurocontrol, 2010) . The E-OCVM 3.0 is an established basic framework for development of new systems and its role versus ATM may be compared to the role of the FSA methodology and e-navigation SIP versus the development of STM concepts in the shipping sector.

MONALISA 2.0 — FSA: FORMAL SAFETY ASSESSMENT 17
4 The European Maritime Simulation Network, EMSN The EMSN has been designed and implemented within ML2 Activity 1.4 Extended testbed and is a unique platform for real time simulation of complex sea traffic situations allowing navigators from various member countries to take part from various national simulator centres and to interact with other ships operated by other navigators located at simulator facilities in various member countries. The EMSN is intended to be used for testing of various operational services and functions included in the ML2 concept and also for testing how the overall STM services will function in a realistic environment with a complex interaction between navigators of various ships, land-based operational STM guidance and surveillance, and ports.
4.1 Partners The following simulations centres and ML2 partners were participating in the EMSN simulations:
• Chalmers, Göteborg, Sweden
• Swedish Maritime Administration, Göteborg, Sweden
• Centro Jovellanos, Gijon, Spain
• Aboa Mare, Turku, Finland
• Fraunhofer CML, Hamburg, Germany
• VeMarS - Venice Maritime School, Venice, Italy The six simulation centres are using the following different makes of simulators:
• Transas
• Kongsberg
• Rheinmetall
4.2 Technical set-up and communication The simulator centres of the participating partners are interconnected in a hub-spoke configuration with VPN tunnels for voice communication and exchange of synthesized AIS information on the ships controlled from the respective simulator centres. The EMSN consists of the Sea Traffic Coordination Centres (STCC) and several ship-handling simulators (SHS) in various European member states.

MONALISA 2.0 — FSA: FORMAL SAFETY ASSESSMENT 18
Figure 4 VPN Hub-spoke topology between Ship Handling Simulators (SHS) of the EMSN.
The simulators of the EMSN normally use different manufacturer-specific protocols and the widespread Distributed Interactive Simulation (DIS) protocol has therefore been introduced as a common mechanism for distribution of simulation data and to hide proprietary simulation protocols. For simulators that does not support the DIS protocol an additional DIS gateway was installed for transformation of proprietary simulation protocols to the DIS protocol and vice versa.
4.3 Simulation sessions conducted The EMSN has been used in ML2 activities during the following sessions
• 9 – 12 December 2014 - Baseline simulations.
• 13 - 17 April 2015 – On 15 and 17 April, re-run of Baseline simulations was conducted and on 13-14 and, 16 initial tests with route exchange were planned but not successfully completed.
• 22 - 26 June 2015 – Tests with route exchange and other ML2-services were planned but the new ECDIS-M with ML2-services did not transmit data as

MONALISA 2.0 — FSA: FORMAL SAFETY ASSESSMENT 19
planned in the EMSN. Route exchange tests were conducted on a centre-to-centre dialog basis with various simulator centres.
• 16-20 November 2015 – EMSN trials with route exchange (REX) service were tested together with the ML2 ECDIS device.
As a result of the delay of the original plan for the EMSN trial sessions and the technical issues encountered, the comparative analysis of safety related KPIs illustrated in Figure 1 was hampered and no conclusive comparative results on potential risk reduction from this EMSN phase alone are presented in this report.
4.4 Testbed reliability and experienced limitations The network of full mission simulator centres conducting real-time simulations with independent control of one or more ships from each centre provides a unique testbed for various types of operational services in complex traffic situations. The trial sessions conducted so far within ML2 showed that EMSN has a high potential to become an efficient and reliable testbed. During the initial trial sessions in December 2014, April 2015 and November 2015 some issues related to connectivity and inaccuracies were, however, identified and are listed below: Initial difficulties with drop-outs in transmission of ship positions Potential inconsistencies in position/distance transformations between the various simulator centres resulted in different tracks of the same ship displayed in different simulators Repeatability of simulations biased by lack of simulator navigators – navigators learn how to handle difficult situations and close encounters when baseline simulations are repeated. The ML2 ECDIS device installed in the EMSN did not ensure fully consistent route exchange services between the simulated ships. The testbed is designed to be manned by real navigators controlling the precise manoeuvres of each ship and repeated simulations will not reproduce exactly identical results. Individual differences between different navigators as well as stochastic variations by the same navigator are reflected in the result and will naturally restrict the reproducibility of results but not the reproducibility of the simulation conditions. Reproducible simulations is defined as a key function for e-navigation test beds in the guidelines (MSC, 1494) to support the IMO e-navigation SIP, but “user and stakeholder involvement” are also defined as key functions. The Guidelines further recommended that the IHO’s S-100 Universal Hydrographic Data Model is used as the framework for modelling and exchange of Geospatial Information (GI). The initially experienced issues on connectivity and transformation of track coordinates have been solved and further simulations including tests with various STM operational services is likely to provide reliable comparative results on how ML2 may influence important safety related KPIs like CPA in the selected test area of Hatter Barn.

MONALISA 2.0 — FSA: FORMAL SAFETY ASSESSMENT 20
The figure below shows a photo from the simulation coordination centre where the bridge views from two of the involved ships are duplicated side-by side allowing direct comparison how the respective navigators experience the situation. Figure 5 Photo from the EMSN coordination centre with the bridge views from two ships duplicated. The mathematical models describing the manoeuvring characteristics of the simulated ships were generally considered very realistic. The rate of realism of the ship behaviour was validated by the debriefing questionnaire and the figure below indicates that the realism of the ship behaviour tended increase during the simulation days with average score rising from 3.56 to 4.37, from the first to the sixth testing day.
Figure 6 Experienced realism of ships´ behaviour during the first EMSN simulation session.

MONALISA 2.0 — FSA: FORMAL SAFETY ASSESSMENT 21
5 Hazid - Hazard identification
5.1 Hazid workshop A Hazid workshop was prepared and conducted as an initial phase of the FSA project. Identified hazards were sorted and ranked in order to be further analysed in comparative testbed simulations within the EMSN and in theoretical calculations. A set of Key Performance Indicators, KPIs were also defined and associated simulation variables and parameters to be stored from each ship during the EMSN sessions, were identified. The KPIs comprise hard quantitative metrics as well as soft KPIs addressing qualitative human factor related issues to be registered by use of debriefing questionnaires. Minutes of meeting from the Hazid workshop are also found in Appendix 1.
5.1.1 Identified hard KPIs and simulation variables to be logged A list of relevant hard KPIs for quantification of risk reduction potential by ML2 was identified. Hard KPIs are to be analysed from all ships involved in the simulation scenario; by registration and logging of AIS data and other ship specific variables/states at reasonably high sampling rate for all ships. Based on time histories of variables like position, speed, heading, turning rate, set rudder angle, and set RPM, a number of conclusive KPIs like CPA, number of course deviations, and other safety marginal measures may then be calculated in post-analysis and compared between different simulations, and between baseline simulations without the STM introduced and with the system introduced and with various parametric variations included. For derivation of final results in the FSA, potential improvements of KPIs should be validated and extrapolated into terms of expected reduced number of collisions and provide input for cost-benefit analysis.
5.1.2 Identified means of collecting soft KPIs Soft KPIs for quantification of risk reduction potential include the following components: Analysis of individual subjectively registered data/perceptions retrieved from digital questionnaires completed by bridge team members and STCC operators after each simulation run Observations and analysis of video recording from the simulator bridges Observations and analysis of recorded VHF communication
5.2 Selection of EMSN test area The Kattegat area was selected as test area for the first EMSN trials and the initial HAZID workshop therefore specifically approached expertise and stakeholders with experience from this sea area. The HAZID workshop was conducted at SSPA
MONALISA 2.0 — FSA: FORMAL SAFETY ASSESSMENT 22
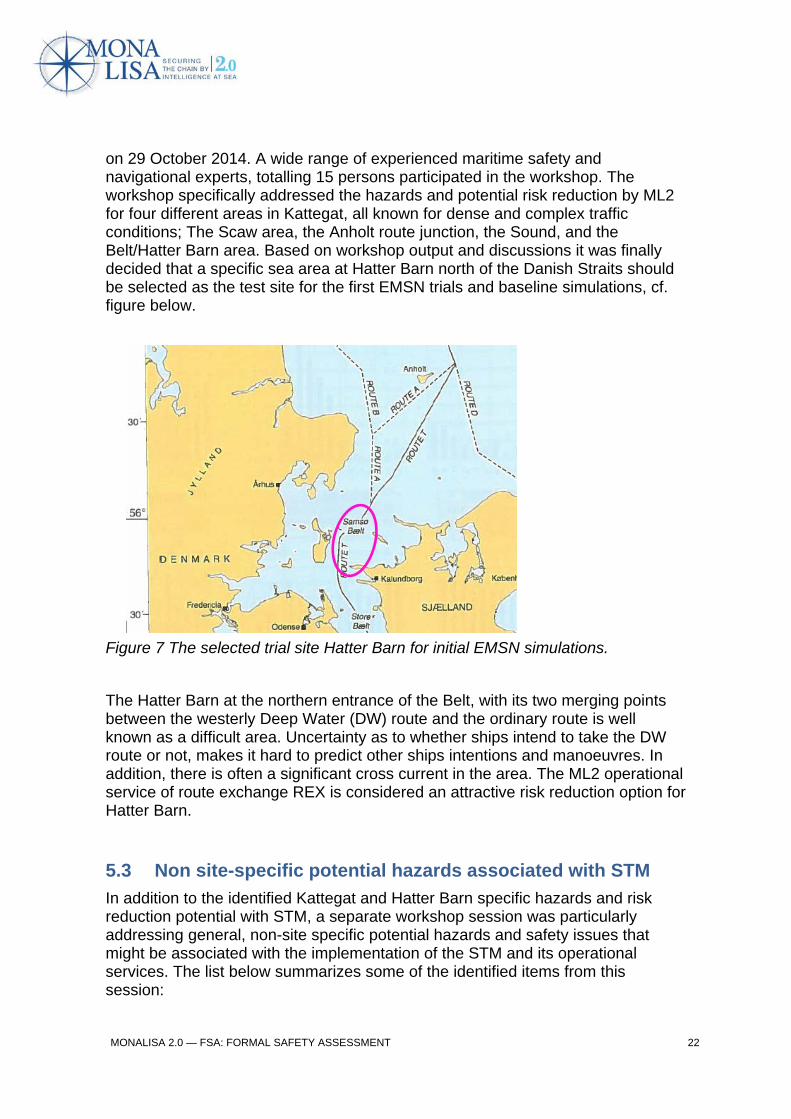
on 29 October 2014. A wide range of experienced maritime safety and navigational experts, totalling 15 persons participated in the workshop. The workshop specifically addressed the hazards and potential risk reduction by ML2 for four different areas in Kattegat, all known for dense and complex traffic conditions; The Scaw area, the Anholt route junction, the Sound, and the Belt/Hatter Barn area. Based on workshop output and discussions it was finally decided that a specific sea area at Hatter Barn north of the Danish Straits should be selected as the test site for the first EMSN trials and baseline simulations, cf. figure below. Figure 7 The selected trial site Hatter Barn for initial EMSN simulations. The Hatter Barn at the northern entrance of the Belt, with its two merging points between the westerly Deep Water (DW) route and the ordinary route is well known as a difficult area. Uncertainty as to whether ships intend to take the DW route or not, makes it hard to predict other ships intentions and manoeuvres. In addition, there is often a significant cross current in the area. The ML2 operational service of route exchange REX is considered an attractive risk reduction option for Hatter Barn.
5.3 Non site-specific potential hazards associated with STM In addition to the identified Kattegat and Hatter Barn specific hazards and risk reduction potential with STM, a separate workshop session was particularly addressing general, non-site specific potential hazards and safety issues that might be associated with the implementation of the STM and its operational services. The list below summarizes some of the identified items from this session:

MONALISA 2.0 — FSA: FORMAL SAFETY ASSESSMENT 23
5.3.1 Information overload It was noticed that additional new bridge equipment and availability of data and services might lead to information overload. Too many devices with acoustic alarm signals or warnings lamps might contribute to acoustic and visual pollution generating distraction and loss of attention on essential navigational tasks and might eventually also stimulate innovative solutions to block or override warning alarms and jeopardize the safety of the ship. Information on other ships’ voyage plans might be valuable but there was a fear that more than 4 - 5 voyage plans would be difficult to embrace and observe simultaneously. In the final STM development the service will allow various display options for selection of whose voyage plans or route sections to be displayed or hidden. ECDIS often generates too many warnings and alarms but new IMO guidelines strive to create a more adequate hierarchy identifying escalating hazards. At blackout events numerous alarms are activated simultaneously making it difficult to prioritise the best course of action. These hazards were identified at an early stage of the ML2 development and Human Machine Interface (HMI) issues will be further addressed in the STM validation project, with the aim not to introduce more bridge systems but to make relevant information more easily available on board.
5.3.2 Cultural-hierarchic traditions It was also claimed that some ships might tend to follow their assigned voyage plan exactly, no matter what, and also that differences in cultural-hierarchic behaviour might generate different ways of using the shore centres´ information on cross-checked voyage plans and STM services.
5.3.3 Over reliance There may be a risk that some officers will be too reliant to the cross-checked voyage plans provided by the shore centres, so that they do not check carefully enough or distrust their own decision making. Navigators might become less prone to plan for alternative unexpected manoeuvres from other ships if they get the others´ voyage plans presented and displayed on-board and plan their own manoeuvres, meetings, overtaking and other close encounters with smaller safety margins and thus introduce a component of increasing risks.
5.3.4 Preferred ship speed Application of the Flow Management service conflict resolution algorithm aims at reduced number of close encounters and anti- collision manoeuvres but suggested adjustments to achieve adequate “time separation” implies small speed adjustments for different legs of the voyage plan. It is, however, well known that the ships often have a number of preferred speed levels where engine RPM and power output are considered convenient and efficient. Therefore time separation recommendations should not be based on arbitrarily selected optimum speed only, but should also take into account the preferred operational speed levels of the specific ship. Information on such preferred speed levels may possibly be part

MONALISA 2.0 — FSA: FORMAL SAFETY ASSESSMENT 24
of the static ship data exchanged together with voyage plan data. It was also noted that a slowdown action from e.g. 20 knots to 12 knots might take up to 45 minutes for a large ship.
5.3.5 Workload The STM may provide valuable additional information contributing to improved safety and reduced number of accidents but it is also important that this additional information does not increase the workload burden for the bridge team. Particularly in critical situations when correct decisions have to be made under stress, it is important that the new STM services facilitates decision making rather than adding to the workload by introducing more information to be considered. Human factor related issues, MMI, and usability aspects must be carefully assessed and evaluated in the design process. It is well known that many near misses, incidents, and accidents occur during periods of stress. The workload issue was also identified as an important safety aspect at an early stage and the ML2 development strives towards reduction of workload by providing tools supporting the officer on watch (OOW) for example by single reporting.

MONALISA 2.0 — FSA: FORMAL SAFETY ASSESSMENT 25
6 Risk analysis
6.1 Potential safety benefits gained by ML2 The overall STM concept is based on four enabling concepts, cf. Chapter 1.2; Port Collaborative Decision Making (Port CDM), Strategic Voyage Management (SVM), Dynamic Voyage Management (DVM), and Flow Management (FM). In addition, these concepts are complemented by Sea System Wide Information Management (Sea SWIM) supporting the STM by providing a distributed, flexible, and secure information management architecture for sharing of information. Together these enabling strategic concepts are aiming at improved efficiency, improved environmental performance, and improved safety of sea transportation systems for cargo and passengers between ports. It is primarily the two components Flow Management and Dynamic Voyage Management that include a number of services specifically addressing maritime safety and particularly hazards for ship-ship collisions and ship grounding. It is well known that collisions and groundings are among the most frequently reported types of accidents and that an order of 65% of reported navigational accidents of these types are related to human error (NMA, 2012). The operational services included in this study are specifically addressing issues related to prevention of collisions and groundings and minimisation of hazards by human error induced navigational errors. For this phase of the risk analysis, the hazards addressed are collisions and groundings, and the STM concept is considered a Risk Control Option (RCO). The safety related operational services included in Dynamic Voyage Management, Flow Management, and Enhanced Monitoring are considered as specific Risk Control Measures, RCMs, to be addressed in terms of potential risk reduction and prevention of maritime accidents. The objective of this phase is to validate that the proposed STM concept and included safety measures will fulfil the outlined safety performance target, thus answering the question; are we building the right system? The safety performance targets of the STM outlined in STM concept is formulated as; Slight reduction of open sea and coastal incidents and accidents related to route management and traffic flow for 2020, Progressive reduction of open sea and coastal incidents and accidents for 2025, and 50% reduction by 2030 compared with the level of 2015. Todays´ risks for navigational accidents like collisions and groundings are relatively well known and documented by accident statistics and the focus of the ML2 FSA validation process is to find a model for quantification of potential risk reduction gained by introduction of STM services and risk control measures.
6.2 Potential risks associated by introduction of ML2 The validation process includes a number of components for quantification of expected risk reduction and a number of assumptions are made regarding the functions of STM operational services. In the next phase of risk analysis for the

MONALISA 2.0 — FSA: FORMAL SAFETY ASSESSMENT 26
proposed STM implementation, a number of verification analyses also need to be performed. That phase will basically answer the question; are we building the system right? and specifically address issues on system quality assurance, technical reliability, redundancy, failure mode, consequences, and procedures, Human Centred Design (HCD), and training. These types of risks and hazards are not addressed in the present high level safety assessment of the STM concept, but a few aspects related to the introduction phase and general aspects on sophisticated e-navigation systems, identified in the HAZID phase, are discussed in qualitative terms in the risk analysis section.
6.3 Results of EMSN baseline simulations at Hatter Barn
6.3.1 Analysis of hard KPIs from the EMSN simulation sessions Various hard KPIs were derived from the logged simulation variables and parameters. The format of the main quantitative hard KPI in the baseline simulations is: CPA5 in metres, for two ships during meeting or other close encounters. In complex traffic situations, with several ships in meetings and other close encounters; a statistical mean value of the three shortest CPAs for each involved ship are used as KPI. The EMSN simulation sessions at the test area encompassed in total 13 individually controlled ships. An example of tabulated CPA values for all 72 close encounter situations for the 13 ships are shown in Figure 8. The CPA is normally considered as a blunt measure of navigational safety as it is highly dependent on the type of ships and external conditions and also influenced by the situational awareness. Comparative studies from systematic simulations in the EMSN may, however, generate indications and trends when different operational services are introduced.
5 CPA, Closest Point of Approach, here measured as the minimum distance between ships´ centre positions (L/2; B/2)

MONALISA 2.0 — FSA: FORMAL SAFETY ASSESSMENT 27
Figure 8 Examples of registered CPA figures (Day 3) for the 72 ship-ship encounters of the 13 involved.
The CPA values registered during the baseline tests varied from ship to ship but also during the course of the simulation days. Registered average value of the three shortest CPA per ship and day are plotted below, see Figure 9. Figure 9 Average of the three shortest CPA values for each ship registered for the six simulation days.

MONALISA 2.0 — FSA: FORMAL SAFETY ASSESSMENT 28
During test day 1, problems with one simulator centre were encountered and data for BBC SAPHIRE, SELANDIA and SILVIAPLANNA are missing and during day 6 there was a dropout from SILVIAPLANNA so that data is also removed. No conclusive results may be derived from the scattered results shown in the diagram. It demonstrates that different navigators solve upcoming close encounter situation in different ways, with highly varying CPAs and safety margins.
6.3.2 Analysis of soft KPIs from the EMSN baseline simulation sessions All EMSN simulations were followed by a debriefing session including questionnaires in which all navigators responded subjectively by scoring various soft KPIs. For example the figure below graphically illustrates the relation between the real CPA values and the perceived safety distance.
Figure 10 Relation between CPA and rating of perceived safety distance, (R2<0.1). Figure 10 illustrates that there is a no significant correlation between how the navigator’s perceived their safety distance and the distance to the closes ships. A few navigators perceived the safety distance as quite poor (2) even though they had large margins, others perceived that they had high safe margins (5) though the actual CPA was short. This indicates that there are more factors than just the actual distance that effect how navigator perceive the distance.

MONALISA 2.0 — FSA: FORMAL SAFETY ASSESSMENT 29
6.4 Theoretical calculation of potential risk reduction by use of conflict resolution algorithms
6.4.1 The conflict resolution algorithm Comparative theoretical calculations of ship traffic situations in the Kattegat test area (August 2014), with and without flow optimisation by the use of the ML2 Conflict Resolution Algorithm (CRA) (ML2_D1.6.7, 2015) as well as with and without “greening” (route speed and distance optimization) of the assumed voyage plans, have been conducted. The objective of these comparative calculations is primarily to quantify estimations of potential safety benefits and also to check if application of the CRA influences the fuel consumption negatively. The safety benefits gained by application of the CRA are based on the assumption that the expected frequency of ship-ship collisions will decrease in proportion to the reduction of the number of close encounters and conflict candidates. The CRA can be applied on a sea traffic situations defined by; - sea area, time interval, and sea traffic scenario. The sea traffic is described by individual ship routes, each specified by its; - start/entering and end/exit positions and a number of waypoints. The waypoints (latitude; longitude; time) are connected by vectors, together describing the route. The number of waypoints for each route is minimized by a filtering approach to reduce computation time. The vectorised routes thus rather describe the route plans and not the actual sailed routes. When recorded AIS registrations are extracted and vectorised to describe a historical traffic situation, a large number of registered positions with minor deviations from straight-lined route legs will be filtered away and the modelled route represents an ideal route performed without any deviations that normally occur during manual helm or by imprecise autopilots. The CRA is checking the modelled (vectorised) traffic situation in order to identify a conflict free solution by an iterative approach including the following consecutive steps; 1) Vectorization of recorded AIS track plots or pre-defined voyage plan 2) Greening (optional) – adjust/remove waypoints (except start and end) for
minimum fuel consumption, consider speed/depth, ensure enough land clearance etc.
3) Calculate the number of conflict candidates as defined by the CRA 4) Conflict resolution – to minimise give way events, anti-collision manoeuvres
i) adjust speed (way point time) of (latest route) to fulfil the CRA criteria ii) if i) not enough; adjust waypoint position to fulfil CRA criteria
The CRA criteria include two conditions that both need to be fulfilled for all close encounters between two ships; i) No ship domain overlappings. Ship domains defined by a 4 Length Overall (LoA) long x 1.6 Length Overall (LoA) wide ellipses.

MONALISA 2.0 — FSA: FORMAL SAFETY ASSESSMENT 30
ii) No FTA (Failure to Take Action) vector ship contour overlapping the other ship´s elliptic domain. The FTA vector is defined by the shortest of the predicted position 10 minutes ahead or by the length of the previous route leg vector and the ship contour of Length Overall (LoA) x Breadth (B) with its centre in the vector tip
6.4.2 Results of theoretical calculations with application of CRA in Kattegat The format of the main quantitative KPI used in the theoretical calculation of risk reduction potential by ML2 for the Kattegat area is: - Relative reduction of number of conflict candidates, when the Conflict Resolution Algorithm is applied on actual recorded vectorised AIS traffic pattern for a specific area and time period. In addition to the main hard quantitative KPI defined above, the total fuel consumption is also calculated as hard KPI. These two KPIs are compiled and compared in Table 4, and it can be noted that application of the CRA do not noticeably increase the fuel consumption, thus the safety benefits gained by application of the CRA is not gained at the expense of higher fuel consumption. Corresponding calculations for green optimized routes (according to optimization algorithms outlined and demonstrated in the first MONALISA project) still indicate that about 10.9 % fuel savings may be gained by green optimized and CRA checked routes. Table 4 Indicative compilation of theoretically calculated KPIs; reduction of conflict candidates and fuel consumption. Table figures extracted from: (ML2_D1.6.7, 2015).
One month Aug 2014, Kattegat
Routes based on recorded AIS tracks. Planned voyage eqv. of real routes
Green optimized routes Voyage plans
Without CRA applied
With CRA applied
Without CRA applied
With CRA applied
No. conflict candidates 337 2 1708 45
Reduction conflict candidates 99.4 % 97.4 %
Fuel Consumption [tonnes] 25243 25243 22505 22506
Fuel Consumption Reduction 10.9 % (Approximately the same as in the first MONALISA project)
For the selected test area the resulting reduction rate of the conflict candidates is virtually 100 % except for the green routes where a reduction rate of 97.4 % is indicated. The greening route optimizer applied in the calculation is routing the ships relatively close in narrow passages and therefore the CRA cannot solve all conflicts. Human intervention from the ship navigators may be needed to control

MONALISA 2.0 — FSA: FORMAL SAFETY ASSESSMENT 31
these few encounters but it is still a significant reduction from today´s situation when all encounters require human intervention. Further refinement of the CRA may result in higher reduction rate also for green optimised routes. With these high figures of the theoretically calculated reduction rate of conflict candidates, it is not obvious that this figure also may be considered proportional to the expected reduction rate of real collision events. In reality there will most likely still be a few ships failing to comply with the conflict resolved voyage plan and hence experience close encounters or collision events. This is analogously with the grounding events, where all ships start with a voyage plan that is grounding safe but nevertheless, a few ships will still encounter powered grounding events.
6.5 Evaluation of accident statistics and potential risk reduction by STM
6.5.1 RCO workshop and estimation of potential risk reduction gains The first MONALISA project included a risk analysis (SSPA, 2013) addressing the accident statistics in the Kattegat area. Data was compiled from Swedish and Danish authorities and covered all registered marine accidents in the Kattegat area for the time period 1993 – 2009. From the statistics, all navigational accidents that occurred en route at sea were extracted and considered relevant with respect to potential risk reduction by the STM concept (accidents in port approaches, in inland waterways, during bunkering etc. were excluded). In total 48 accidents from the Danish and 35 from the Swedish accident registers were compiled and described. Maritime accident statistics normally include many different categories of accidents but only relatively small portions are attributed to navigational failures, which are the main safety focus for the STM concept. The pie diagrams in Figure 11 shows a representative distribution between navigational accidents like collisions and groundings and other categories of maritime accidents. In the figure from Sweden 2014, collision and groundings represents 14 % each of the total number. For EU waters and EU flagged vessels, EMSA registered 15 % as collision and 19 % as grounding in the marine casualty statistics from 2013, see Figure 11. Thus around 34 % of the maritime accidents with tankers, cargo ships and passenger ships are referred to navigational accidents, and of these about 65 % are related to human error. The statistics further shows that typically about 49 % of the navigational accidents occurs at sea, in coastal waters, archipelago or port approaches, so in total, the fraction of all maritime accidents that primarily is anticipated to be influenced by introduction of the STM operational services is about 11 % of all accidents.

MONALISA 2.0 — FSA: FORMAL SAFETY ASSESSMENT 32
Figure 11 Left: Maritime accidents recorded in Sweden 2014, distribution by accident category (Transportstyrelsen, 2015). Right: Marine casualty events recorded by EMSA 2013 (EMSAb, 2015)]. As part of the ML2 FSA project, a second workshop was arranged on 8 September 2015. Eleven maritime safety experts from the project partners, experienced navigators, and VTS-operators from the Kattegat area were invited and participated in a structured discussion in order to estimate potential hypothetic reduction of the recorded collision and grounding accidents if STM had been in place. Based on evaluation of historical accident descriptions, the basic question made to the participants was;
• Would this accident have happened if the addressed ML2 operational services had been in place?
The answers were discussed in the forum and a consensus level was found in intervals of estimated percentage of risk reduction; 0, 10, 25, 50, 75, 90, 100%
6.5.2 Results of the evaluation of accident statistics The output from the workshop is summarised in Table 5. Detailed workshop results including the accident data and descriptions from the respective Swedish and Danish authorities together with discussed aspects on potential preventive effects by different Flow Management, Dynamic Voyage Management services are presented in Appendix 2. In particular potential combined effects from the flow optimisation and route exchange services on recorded collisions were discussed and estimated but potential prevention of groundings by enhanced monitoring was also assessed. Aspects on the date of the casualties were discussed with a view on valid regulations and current ship standard versus later improvements and introduction of preventive measures like the Bridge Navigation Watch Alarm System (BNWAS) introduced from 1 July 2012. It was, however, also noted that
Injury Grounding Ship-ship collision Collision with other object Leakage Fire Engine breakdown Pollution Other
19%
15%
19%
1%
12%
9%
3%
0%
22%
Grounding/stranding
Collision
Contact
Capsizing/listing
Damage to ship or equipmet
Fire/explosion
Flooding/foundering
Hull failure
Loss of control
Europe 2013 Sweden 2014

MONALISA 2.0 — FSA: FORMAL SAFETY ASSESSMENT 33
BNWAS sometimes are disconnected and not fully effective to prevent sleeping navigators. The Danish records on grounding statistics did not include enough detailed descriptions of the accident cases and was therefore omitted in the analysis. The resulting estimated risk reduction figures in Table 5 are given in intervals depending on how many of the accident cases that were included – some of the accidents were considered to be out of the scope with regard to the location of accident. The studied preventive collision and grounding Risk Control Measures are primarily assessed with regard to the fraction of navigational accidents that occur in open sea, in coastal waters but not for collisions in ports or inland waterways. Table 5 Compilation of indicative estimations of risk reduction rates based on expert evaluation of historical accident statistics in the Kattegat test area. Indicative estimates of reduction rate
Swedish statistics (BNWAS adjusted*)
Danish statistics Compiled
Collision 54-56% 23 – 29% 37-42 %
Grounding 61% (53%*) 53 %
* Taking into account that BNWAS (Bridge Navigation Watch Alarm System) would have been compulsory today, some accidents caused by sleeping navigators were disregarded from ML2 risk reduction effect
6.6 Risk reduction gained by flow optimisation and expected reduced number of collision candidates
The EMSN simulations conducted, so far do not include comparative studies with and without flow optimisation introduced by the conflict resolution algorithm and are thus not providing any conclusive results on potential risk reduction. The theoretical calculations on the number of conflict candidates with and without the conflict resolution algorithm for the one month Kattegat case may, however, be analysed and provide indicative results on potential risk reduction. The conflict resolution algorithm is specifically addressing collision risks and hence the calculated risk reduction is referred as an expected reduction of collision frequency. For the comparative analysis it is important to distinguish between the planned route (described by a pre-defined voyage plan) and the actual route (described by (filtered) recorded AIS tracks. Todays´ voyage plans are design to be “grounding safe” but do not specifically consider collision risks except for the general “right hand” traffic rules. By coordinated validation of all current voyage plans, ML2´s CRA adds a “collision safe” dimension to the voyage plans.
MONALISA 2.0 — FSA: FORMAL SAFETY ASSESSMENT 34
Theoretically, virtually all collision conflict candidates (334 of 337 for August 2014) may be eliminated by application of the ML2 CRA as long as the maximum sea traffic capacity of the area does not restrict safe navigation. Though todays‘ voyage plans in theory are “grounding safe” it is well known from practice that some ships occasionally fail to follow the voyage plan e.g. because of unplanned anti-collision manoeuvres or human errors like lapse, slip, or mistake, resulting in grounding events. Correspondingly, also with ML2´s “collision and grounding safe” voyage plans, navigators will occasionally not follow the plan – fail to stay inside their “safe haven” - and encounter collision events. Figures on credible rates of “failure to follow validated voyage plan” have not yet been possible to derive from the EMSN simulation and indicative figures therefore need to be assumed/estimated based evaluation of accident statistics and causation factors from empiric grounding-collision models. It should be noted that “failure to follow the validated voyage plan” in this context is not to be interpreted as a navigational failure – in most cases it is necessary in order to avoid close encounters with other vessels, fishing boats etc. and required by compliance to COLREG. The accident statistics of relevant collisions and groundings in the Kattegat area show a collision rate of 0.65 collisions per year and 2.4 groundings per year. The calculation examples referred in 4.4.2 indicate that 337 conflict candidates were identified for the unchecked voyage plans (based on registered AIS tracks) in one month (August 2014), indicating a total of about 12 x 337 = 4044 annual conflict candidates in the studied Kattegat area. Assuming 60% of these conflict candidates will not follow their validated voyage plans, and cause as many conflicts as they would have done without the CRA validated route. The remaining 40% will remain on their “collision and grounding safe” routes and the total number of conflict candidates will hence be reduced according to: 0.60 x 4044 + 0.40 x (337-335) x 12 = 2426 + 10 = 2436 Assuming this reduction in number of conflict candidates is proportional to the reduction of collision, a potential reduction of expected collision frequency of about 40% is indicated. A potential collision risk reduction rate in the order of 40% was also estimated from the evaluation of description of registered collision accidents referred in Chapter 4.5. The latter estimation was, however, primarily attributed to the introduction of route exchange services. Its effect may therefore be anticipated to address only the fraction of ships failing to follow the dedicated synchronised voyage plan and hence be reduced to 24% (0.40 x 0.60 = 0.24) of additional reduction when STM is applied including flow optimisation and route exchange services. With STM implemented, the route exchange services will specifically contribute to safe solution of anti-collision manoeuvres resulting from the fraction (assumed 60%) of ships failing to follow their designated conflict checked synchronised routes. It may, however, be noted that the route exchange service primarily aims at planning facilitation in a medium time range and is not to be applied for short term decision support in close quarter situations where COLREG provides adequate actions.

MONALISA 2.0 — FSA: FORMAL SAFETY ASSESSMENT 35
The combined effect of application of flow optimisation and route exchange services is assumed to be higher than the indicated 40% contribution from each service but the figures are not considered to be fully accumulative. Taking into account the reduced figure of the route exchange, the combined risk reduction effect is assumed to be in the range of 50 – 70% for the studied type of navigational accidents caused by human errors. The assumed 60/40 relation of ships failing to follow their validated voyage plans is not very sensitive to the indicated risk reduction range and assumptions varying from 50/50 to 80/20 will still give risk reduction in the indicated 50 – 70 % range. Collision accidents caused by technical failures or by adverse external conditions like severe sea state are not considered in the analysis. The risk reduction effect of flow optimisation and route exchange services on such events is assumed to be small but may have positive effects e.g. by reducing the number of meetings in navigation fairway bends.
6.6.1 Impact of flow optimisation on groundings and other accident types Though the introduction of the flow optimisation and route exchange services are primarily addressing the collision hazards, it was concluded that stringent speed and water level adapted voyage plans would possibly prevented some of the grounding cases. There are also examples of grounding accidents caused by unexpected urgent anti-collision or give way manoeuvres and application of CRA and REX may indirectly also have a risk reducing effect on such grounding events. Technical failures (blackout, loss of propulsion, rudder failure) can occur at any time and any locations and may result in consequences like collisions and groundings irrespective of the fact that the original voyage plans have been subject to validation by ML2 CRA.
6.6.2 Enhanced monitoring for prevention of groundings With regard to grounding accidents, the evaluation of empiric accident data referred in Chapter 4.5 exemplifies that STM services with enhanced monitoring by active or passive voyage surveillance of deviations from designated synchronised routes with cross-checked voyage plans, may contribute significantly to reduction of grounding frequencies. A calculation algorithm for such a voyage monitoring tool has been outlined in parallel with this FSA and is described as a Proactive Grounding Assessment (PGA), (ML2_D4.3.3, 2015). The algorithm is based on a Safety-2 approach where stored AIS voyage data from normal sea traffic are used for early identification of ships deviating from normal behaviour. Data on average heading/course and standard deviation, speed, and draught for various ship sizes are calculated in real-time from an AIS route track database. If a ship deviates from normal behaviour an alert message will be automatically generated e.g. by displaying the predicted course in red at a shore centre. By analysis of AIS data for sea areas and time periods when real grounding accidents have occurred, SSPA has tested the PGA algorithm on

MONALISA 2.0 — FSA: FORMAL SAFETY ASSESSMENT 36
historical data and has found that the algorithm has been successful in early identification of un-normal navigational behaviour events that finally have been manifested by grounding accidents. The track plots in Figure 12 show two analysis examples of grounding/stranding accidents in the Kattegat-Sound area. In the figure the un-normal behaviour was identified by the PGA 12 minutes prior to the stranding of the 88 m long cargo vessel off Ålabodarna on the Swedish side of the Sound. Figure 12 Track plots of analysed AIS data where un-normal navigational behaviour is identified by the PCA tool and displayed by red dots instead of blue. In the left figure the un-normal and hazardous heading was identified 12 minutes prior to the stranding of the ship and in the right figure un-normal behaviour and heading was first detected 113 minutes before a190 m long bulk carrier grounded at 5 m depth on the Fladen bank in Kattegat on 19 September 2015.
The track plot to the right shows a recent spectacular grounding case where post analysis with the PGA tool identified and alerted for un-normal navigational behaviour 113 minutes before a 190 m bulk carrier ran aground on the Fladen Bank in Kattegat on 19 September 2015. It appears obvious that if this un-normal navigational behaviour had been notified/alerted by the PGA tool and observed on-board or by a nearby shore centre, a number of actions might have been taken

MONALISA 2.0 — FSA: FORMAL SAFETY ASSESSMENT 37
to contact and inform the ship about its hazardous heading and to give corrective instructions. These referred initial tests indicate that the PGA tool may contribute an effective grounding prevention tool to the STM services. The PGA tool is basically an automatic traffic monitoring system and is not likely to be associated with high operational costs and manning.
6.7 Evaluation of international accident statistics and estimation of potential risk reduction by ML2 STM
The results from the EMSN trials, the Kattegat calculations, and the evaluation of navigational accident statistics from Kattegat presented above, are not enough to provide conclusive results on potential risk reduction by STM services for all EU waters. More comparative EMSN trials, theoretical calculations in other areas and analysis of accident statistics from wider sea areas will be conducted in parallel with further development of the STM and its validation process. As an initial phase of the third step of geo-extrapolation, available EU-wide statistics on navigational accidents have been analysed with particular focus on risk reduction and prevention of collision and grounding (navigational accidents) in open water.
6.7.1 European accident statistics In order to be able to extrapolate derived results into a European perspective, accident data from the European Maritime Safety Agency, EMSA was retrieved. Some basic data from the EMSA statistics is compiled in the table below (EMSAb, 2015).
Table 6 European statistics on navigational accidents 2001 – 2010.
Total number of accidents
Loss of life
Cargo and passenger ships is involved in % all accident
% of all accident occur in open water
Number of collision events
Number of grounding events
2047 83 67.1% 49% 293 331
The STM operational services or RCMs addressed by this analysis are principally considered to have a preventive influence on collision and grounding accidents caused by human factor related failures but are not expected to reduce navigational accidents caused by technical failures or external factors. Further, the addressed RCMs are primarily considered to effect accidental events occurring at locations outside port areas i.e. in open sea and coastal areas. These restrictions with regard to direct cause and location of accidents are conservatively taken into account when potential risk reduction effects are estimated, by introduction of reduction factors given in the table below.

MONALISA 2.0 — FSA: FORMAL SAFETY ASSESSMENT 38
Table 7 Causal distribution of navigational accidents compiled by Norwegian Maritime Authority, (NMA, 2012).
Causal distribution of navigational accidents. NMA Human error 65%
Technical failure 18%
External factor 17%
Σ 100%
It is estimated that 2.54 fatalities and 63 accidents involving cargo and passenger ships in open water during 2014 were caused by human error induced collisions. For the same time period is it estimated that 2.86 fatalities and 71 accidents where caused by human error induced groundings in open waters, with cargo and passenger ships. Based on an estimated number 8 032 ship years (see Chapter 1.5) in European water, the Potential Loss of Life is calculated to 6.7 x 10⁻⁴ fatalities per year.
6.7.2 Results of evaluation of global statistics of navigational accidents and estimations of potential risk reduction ML2
For the estimation of the potential risk reduction figures from a European-wide perspective the addressed STM is assumed to be a preventive RCO combining the three RCMs:
• Flow Management by traffic synchronization and flow optimisation
• Flow Management by enhanced monitoring for detection of deviations from normal operations
• Dynamic Voyage Management by use of ship-to-ship route exchange The three RCMs are not defined and tested in detail and more theoretical calculations may be needed to predict reliable risk reduction rates. Further refinement of the algorithms and tests with historical AIS data of grounding accidents will provide a solid basis for quantitative estimations of expected risk reduction potential of the three components and their combined RCO effect. A thorough process for estimation of potential risk reduction will then be conducted by a complete FSA team including expertise from various stakeholders and professions. At the present stage of development work, indicative engineering judgements have been made and compiled for initial assessment. The FSA team made the following estimations on the potential risk reduction effects for each of the three RCMs and the two types of navigational accident categories see Table 8, showing average of estimations for each of RCMs.
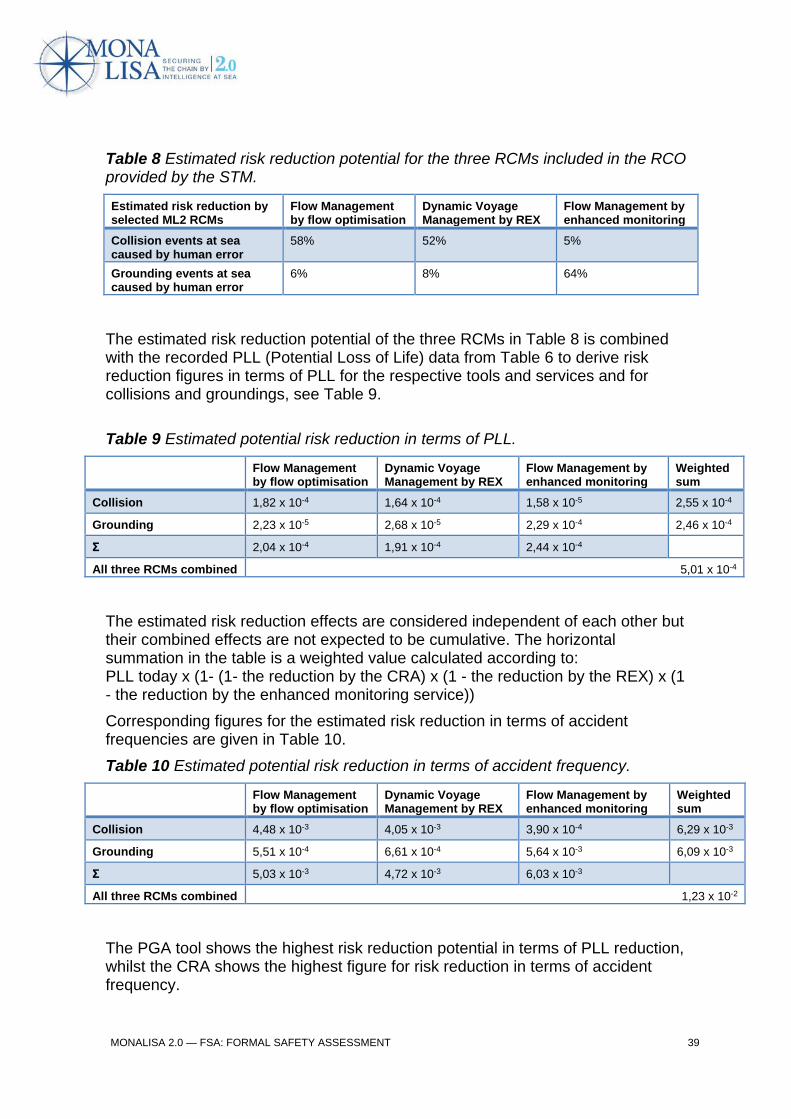
MONALISA 2.0 — FSA: FORMAL SAFETY ASSESSMENT 39
Table 8 Estimated risk reduction potential for the three RCMs included in the RCO provided by the STM.
Estimated risk reduction by selected ML2 RCMs
Flow Management by flow optimisation
Dynamic Voyage Management by REX
Flow Management by enhanced monitoring
Collision events at sea caused by human error
58% 52% 5%
Grounding events at sea caused by human error
6% 8% 64%
The estimated risk reduction potential of the three RCMs in Table 8 is combined with the recorded PLL (Potential Loss of Life) data from Table 6 to derive risk reduction figures in terms of PLL for the respective tools and services and for collisions and groundings, see Table 9. Table 9 Estimated potential risk reduction in terms of PLL.
Flow Management by flow optimisation
Dynamic Voyage Management by REX
Flow Management by enhanced monitoring
Weighted sum
Collision 1,82 x 10⁻⁴ 1,64 x 10⁻⁴ 1,58 x 10⁻⁵ 2,55 x 10⁻⁴
Grounding 2,23 x 10⁻⁵ 2,68 x 10⁻⁵ 2,29 x 10⁻⁴ 2,46 x 10⁻⁴
Σ 2,04 x 10⁻⁴ 1,91 x 10⁻⁴ 2,44 x 10⁻⁴
All three RCMs combined 5,01 x 10⁻⁴
The estimated risk reduction effects are considered independent of each other but their combined effects are not expected to be cumulative. The horizontal summation in the table is a weighted value calculated according to: PLL today x (1- (1- the reduction by the CRA) x (1 - the reduction by the REX) x (1 - the reduction by the enhanced monitoring service)) Corresponding figures for the estimated risk reduction in terms of accident frequencies are given in Table 10. Table 10 Estimated potential risk reduction in terms of accident frequency.
Flow Management by flow optimisation
Dynamic Voyage Management by REX
Flow Management by enhanced monitoring
Weighted sum
Collision 4,48 x 10⁻³ 4,05 x 10⁻³ 3,90 x 10⁻⁴ 6,29 x 10⁻³
Grounding 5,51 x 10⁻⁴ 6,61 x 10⁻⁴ 5,64 x 10⁻³ 6,09 x 10⁻³
Σ 5,03 x 10⁻³ 4,72 x 10⁻³ 6,03 x 10⁻³
All three RCMs combined 1,23 x 10⁻²
The PGA tool shows the highest risk reduction potential in terms of PLL reduction, whilst the CRA shows the highest figure for risk reduction in terms of accident frequency.

MONALISA 2.0 — FSA: FORMAL SAFETY ASSESSMENT 40
7 Risk Control Option, RCO The STM concept is analysed as the primary RCO to be addressed by the FSA. During the HAZID phase a number of hazards associated with the design and implementation of STM was also identified that may be subject for more detailed analysis in the next step of development in the STM Validation project. Even if the identified hazards are primarily associated with the technical design and implementation phases, it may though be relevant to address the issues also in this high level FSA in order to identify potential system specific RCOs to be considered in coming STM design and validation project components.
7.1 Collision risk increment induced by parallel regimes The presented theoretical STM calculations primarily describe a possible scenario when all ships have adopted the STM routing regimes. During a transition phase, the STM regime will be implemented and operated in parallel with present voyage planning and execution practices. In the Hazid process this was identified as a risk and for example misinterpretation of manoeuvres, lack of information on others´ route plans, and adjusted speed schemes may generate new conflicts and potential accidents. Some questions to be addressed in a study on the effect of parallel regimes during an implementation phase are: Can the STM concept be theoretically calculated/tested for various adoption rates and reflect the effects of a portion of the ships that do not apply the STM routeing? Will this only decrease the figure of potentially reduced number of collision candidates? Or may potential risk increment due to unsolved conflicts or mistakes be addressed as well?
7.2 Risks related to the ML2 system quality Examples of (technical, operational, managerial) issues to be addressed in the phase of verification tests of the design, include:
• Hardware system quality – system reliability, redundancy, back-up
• Sensitive components, failure safe systems
• Software system quality
• Operational reliability, skills and training of system operators; and
• Introduction phase difficulties. No complete verification is made in this study, but it is obvious that some components/operational functions are vital and that flaws in system quality may reduce the effectiveness and theoretically calculated achievable safety gains considerably. System failure may even be counterproductive if for example other ships´ voyage plan displayed by the route exchange services does not agree with the other ships´ actual voyage plan.

MONALISA 2.0 — FSA: FORMAL SAFETY ASSESSMENT 41
8 CBA – Cost Benefit Analysis The purpose of the Cost Benefit Analysis (CBA) is to identify and compare benefits and costs associated with the implementation of the addressed RCO. The costs for implementation have been estimated and quantified in the overall CBA prepared in Activity 2.3 (Andersson|Ivehammar, 2015) and the safety benefits in terms of risk reduction are estimated in previous chapters of this FSA. Further, the cost-effectiveness of the analysed RCOs in relation to safety of life are normally also assessed in the CBA phase of the FSA. The indices Gross Cost of Averting a Fatality (Gross CAF) and Net Cost of Averting a Fatality (Net CAF) are normally calculated and compared versus a criterion in monetary terms at an amount representing the value of a human life or Value of Preventing a Fatality (VPF). Various values are used to determine if proposed RCO are cost-efficient or not and 3 million USD is often displayed as an illustrative example of the criterion. More recent studies suggest a higher VPF and indicate an updated VPF figure of 6.3 million € (EMSAa, 2015) Potential risk reduction figures have been estimated at the different steps of geographical risk modelling and assessment of historical accident statistics. The figures derived from assessment of historical accident descriptions may be considered realistic with regard to the actual situation but represent too few cases in order to be statistically significant. At this stage, the risk reduction figures, derived from the evaluation of international accident statistics are therefore considered more relevant for input to the CBA.
8.1 Economic benefits gained by risk reduction In addition to the reduction of PLL, the risk reduction is also associated with benefits generated by reduced cost for material damage, repair costs, downtime, environmental impact and clean-up costs etc. which are normal consequences of collision and grounding events. These costs normally lie at the ship owner/operator and its insurance companies. Environmental damage and clean-up costs varies a lot and sometimes represent the major component of the total cost. Another significant cost component is the repair cost of the ship and based on claims statistics from marine insurance companies normal costs may be estimated. From the Swedish Club, available statistics on Hull and Machinery (H&M) indicates average claim costs of 830 000 € for collision events and 910 000 € for grounding events (Swedish_Club, 2014). It should be noted that these figures are representative average figures for navigational accidents in all locations and thus only a minor part of them represent accidents in open sea. By combining the summations from Table 9 (PLL) and Table 10 with the estimated average damage cost (hull and machinery claim costs), the following potential cost savings by introduction of the three RCMs are derived:

MONALISA 2.0 — FSA: FORMAL SAFETY ASSESSMENT 42
Table 11 Potential cost savings by reduced accident frequency per ship year.
The total sum of cost saving by averted navigational accidents, (including H&M claims and fatalities (3 million USD)) is 12 056 € / ship year by implementation of the analysed RCMs of the STM. For the entire ship population (cargo, tanker, and passenger) in EU waters (estimated to 8032 ship years) the corresponding total cost saving by averted navigational accidents amounts to 101 million € per year. If this figure is compared with the total environmental and efficiency benefits estimated in the overall CBA conducted in Activity 2 WP 3 (Andersson|Ivehammar, 2015), it is found that the safety benefit is of the same order of magnitude as the potential savings attributed to efficiency and environment gained by 1% shortened sailing distance gained by route optimization. The overall CBA of Activity 3.3 estimates potential savings per year (main scenario) in the studied Northern European waters, range from 37 million € per percentage unit of reduced steaming distance to 76 million €, if the distance saving is used for reduced speed of steaming. (Andersson|Ivehammar, 2015). For the entire EU-waters, the overall CBA indicates corresponding potential savings in the range 185 – 380 million €. The scope of the referred overall CBA is restricted to Northern EU waters (compiled by analyses of two areas in the Baltic Sea and the North Sea) and it does only include cargo and tanker vessels.
8.2 Cost of introduction of ML2 STM In the overall CBA (Andersson|Ivehammar, 2015) the following costs for implementation of the STM have been estimated for different interested entities. For the ship owners/operators the following costs are estimated:
All RCMs aggregated Frequency Cost per event Reduction of accident cost (/ship year)
Collision accident 6,29 x 10⁻³ 830 000 € 5 217 €
Grounding accident 6,09 x 10⁻³ 910 000 € 5 513 €
Σ 10730 €
PLL 5,01 x 10⁻⁴ 2 650 000 € 1 326 €
Σ 12 056 €

MONALISA 2.0 — FSA: FORMAL SAFETY ASSESSMENT 43
Table 12 Estimated costs for ship owners/operators for on-board implementation of STM extracted from (Andersson|Ivehammar, 2015).
Ship owner/operator (average amounts of “high” and “low” scenarios)
Investments in ships 1.5 k€ per ship and year
Investment in training 0.45 k€ per ship and year
Communication cost 1.7 k€ per ship and year
Governance cost 5 000 k€/8 032 = 0.62 k€ per ship and year
Total 4.3 k€ per ship and year
8.3 Cost of Averting a Fatality - estimation of GrossCAF and NetCAF
GrossCAF or shorter GCAF is a cost-effectiveness measure in terms of ratio of marginal (additional) cost of the risk control option to the reduction in risk to personnel in terms of the fatalities averted. GrossCAF is derived from: GCAF = ΔCost/ΔRisk where ΔCost is the cost per ship for implementation of the RCO, see Table 12, and ΔRisk is the risk reduction per ship in terms of number of averted fatalities implied by introduction of the RCO. NetCAF or shorter NCAF is a cost-effectiveness measure in terms of ratio of marginal (additional) cost, accounting for the economic benefits of the risk control option to the reduction in risk to personnel in terms of the fatalities averted. NetCAF is derived from: NCAF = (ΔCost – ΔBenefit)/ΔRisk where ΔBenefit is the economic benefit per ship resulting from the implementation of the RCO Based the data presented in Table 9 and Table 12, the GCAF and NCAF figures are calculated and tabulated below. Table 13 Calculated GCAF and NCAF figures for the analysed RCO.
Risk reduction (PLL/year)
Implementing cost GCAF (Cost/risk reduction)
NCAF ((Cost-Savings)/risk reduction) /ship
5,24E-04 4 298 € 8 585 908 € -12 852 414 €
If the traditional criterion figure of 3 million USD (2.7 M€) is applied to the GCAF and values above, the RCO is not considered cost effective from a strict safety

MONALISA 2.0 — FSA: FORMAL SAFETY ASSESSMENT 44
(only loss of lives) point of view. More recent studies (EMSAa, 2015), however, suggest a higher Value of Preventing a Fatality (VPF) and indicates that a VPF of 6.3 million € would be more relevant today. The estimated GCAF in the table is still somewhat higher than the suggested VPF and the RCO cannot be considered cost-efficient in itself without taking economic benefits into account. The NCAF figure, taking into account the estimated economic benefits of reduced hull and machinery insurance claims for averted navigational accident costs at an average of 830 000 € for collisions and 910 000 € for grounding accidents, is negative. The negative NCAF indicates that the implementation of the three RCMs still is economically beneficial. A negative NCAF is indicating that the RCOs are economically beneficial in itself, i.e. the costs of implementing the RCO is less than the economic benefit of implementing it, regardless of how many lives that are saved.
MONALISA 2.0 — FSA: FORMAL SAFETY ASSESSMENT 45
9 Uncertainties and sensitivity in assumptions and output
Many of the presented indicative figures are based on limited sets of empirical data and calculation examples. All calculations are conducted in documented and transparent spread sheets and by systematic variation of estimated input figures and assumptions, the output sensitivity is easily verified numerically. Uncertainties in estimated risk reduction potential for the different RCM components and aggregated RCO may be reduced in parallel with further development and validation tests of the operational services and tools provided by the EMSN testbed, by theoretical calculations, and by additional evaluation of actual accident case descriptions. Potential risk reduction figures are primarily derived in unit per ship year. For the presented estimations on potential savings by STM introduction in all EU waters, more uncertainties associated with the total number of ship years in the area are introduced. Presented figures are based on a high estimation of total ship years in order to keep estimation on the GCAF and NCAF figures conservative and not to overestimate favourable risk reduction efficiency. Valuable complementary information may also be gained by further analysis of accident statistics in EU waters and qualified estimation of potential risk reduction distributed for RCM components, type of navigational accident, type of ship, accident location, and initiating cause.

MONALISA 2.0 — FSA: FORMAL SAFETY ASSESSMENT 46
10 Conclusions and recommendations The conclusions presented and associated recommendations are based on indicative results compiled by combination of simulation output, theoretical calculations, evaluation of regional accident cases and EU-wide accident statistics. The derived potential risk reduction figures rely partly on uncertain statistics, assumptions and engineering judgements. The analysed RCMs are still under development and therefore the final expected risk reduction cannot be assessed in detail.
10.1 Safety enhancement and potential risk reduction by STM The resulting NCAF figure derived from analysis of an RCO combining the three addressed RCMs; flow optimisation, route exchange, enhanced monitoring, is negative and thus indicates that the RCO is cost-effective if the cost of averting fatalities and the direct benefits of reduced hull and machinery claims cost are considered. A number of additional cost benefits may also be identified, but quantitative estimations in monetary terms are difficult and therefore disregarded in the presented NCAF calculation. For example reduced frequency of navigational accidents will also generate saving by averted costs for accidental environmental pollution, oil spill response and clean-up. For the Baltic Sea area, HELCOM statistics (HELCOM, 2014) show that about 4.7 % of all maritime accidents (2004-2013) involve pollution, usually oil spill. Taking these aspects into account, the presented NCAF figure is regarded conservative but still clearly supports further development of the STM, and its safety related operational services and RCMs.
10.2 Recommendations on further safety assessment and validation studies on the ML STM
10.2.1 CATS calculation Serious navigational accidents are often also associated with oil spill and pollution. In particular large crude carriers and product tankers may generate large spills if involved in navigational accidents. Spill of cargo oil from tankers or bunker oil from cargo vessel are normally also resulting in very high costs for oil recovery, shoreline clean-up and compensation claims from affected stakeholders. It is therefore recommended to complement the GCAF and NCAF calculations with calculations of adequate indicators also taking into account potential economic benefits of averted oil spills. The Cost of Averting one Tonne of Spilled oil (CATS) is one criterion frequently used for taking societal oil spill costs into account when various RCMs are evaluated by FSA studies. A number of empirical

MONALISA 2.0 — FSA: FORMAL SAFETY ASSESSMENT 47
mathematical models have been proposed and tested to describe the relation between spill quantity and total clean-up costs but oil spill statistics in different sea areas vary a lot.
10.2.2 Alternative Monte-Carlo simulation models for safety assessment The simulation technique used in the EMSN, combined with theoretical fast-time calculations and comparative studies of alternative route options, have proved to provide valuable tools for development and validation of the new STM concept. Modern simulation technique based on Monte Carlo approaches is regularly used by SSPA for risk analysis and allow for realistic simulation of statistical failure occurrences and human error behaviour. It is recommended to complement the theoretical calculations on risk reduction efficiency of Flow Management and synchronization services like the CRA, with Monte Carlo simulations in selected European sea areas. Such simulation studies may provide more accurate prediction on potential risk reduction and allow optimizing tuning of the outlined services.
10.2.3 Wider test areas and European geo-extrapolation The presented results are based on a stepwise approach with analyses of EMSN simulations in a small test area in Hatter Barn, theoretical calculations in Kattegat, and analysis of European accident statistics. The sea areas investigated by simulations and theoretical calculations are limited in area, time, and number of ships. It is therefore recommended to complement the third phase of geo-extrapolation with additional test areas representing other sea areas within EU. By such complementary studies, a more accurate and representative basis for EU-wide predictions of the risk reduction potential of the ML2 would be gained.
MONALISA 2.0 — FSA: FORMAL SAFETY ASSESSMENT 48
11 References Andersson|Ivehammar. (2015). Cost-Benefit Analysis of the Effects of implementing Sea
Traffic MAnagement in the Northern Parts of EU. Final report for MONALISA 2.0 Nvember 2015. Linköping University, Peter Andersson and Pernilla Ivehammar.
EMSA. (2015). EMSA, Risk acceptance criteria and risk based damage stability. Final report, part 1: Risk acceptance criteria, Report no. 2015-0165, rev 1. European Maritime Safety Agency .
EMSAa. (2015). EMSA, Risk acceptance criteria and risk based damage stability. Final report, part 1: Risk acceptance criteria, Report no. 2015-0165, rev 1. European Maritime Safety Agency.
EMSAb. (2015). Annual overview of marine casualties and incidents 2014V. Eurocontrol. (2010). European Operational Concept Validation Methodology applied for
ATM system development. HELCOM. (2014). HELCOM Annual report on Shipping accidents in the Baltic Sea in
2013 . IALA_a. (2013). Reporting of results of e-Navigation testbeds 1107. IALA_b. (2013). Shore side portrayal 1105. IMO. (2000). IMO 2000, Formal Safety Assessment, MSC 72/16. IMO. (2013). Revised Guidelines for FSA for the use in the rule-making processi. IMO. (2014). SIP, Strategy Implementation Plan. IMO NCSR 1/9/1, 28 March 2014 . IMO. (2015). Revised Guidelines for Formal Safety Assessment (FSA) for use in the IMO
rule-making process. MSC-MEPC.2/Circ.12/Rev.1 dated 18 June 2015. IMO_DNV. (2013). Development of an E-navigation Strategy Implementation Plan.
Submitted by Norway to IMO NAV59/6. Annex 1 prepared by DNV: FSAincluding the finalized risk and cost-benfit analysis.
ML2_D1.6.7. (2015). Integration of decision support tools. MONALISA 2.0 D1.6.7 - prepared by SSPA.
ML2_D4.3.3. (2015). Report on ICT tool to support bridge operations with early warning of grounding. MONALISA 2 0__D4.3.3 prepared by SSPA.
MSC. (1494). MSC.1/Circ.1494 on Guidelines on Harmonization of Testbed Reporting. NMA. (2012). Norwegian Maritime Authority, NMA, Maritime casualty database, 2012. Ramböll. (2000). SEAS Skibskollisioner ved Rödsand. Sag995681. Baggrundsraport nr
21 till VVM-redogörelse . SSPA. (2013). SSPA Report RE40115834-02-00-C . Swedish_Club. (2014). Navigational Claims, Information broschure with claims statistics. Transportstyrelsen. (2015). Säkerhetsöversikt Luftfart och Sjöfart. Transportstyrelsen.
TSG 2015-387. April 2015.
MONALISA 2.0 — FSA: FORMAL SAFETY ASSESSMENT 49
12 Appendices
Appendix 1
Minutes of meetings from Hazid Identification workshop, 29 October 2014

MONALISA 2.0 — FSA: FORMAL SAFETY ASSESSMENT 50
MONALISA 2.0 (ML2) – Formal Safety Assessment (FSA) component of Activity 2WP3 (A2.3) Minutes of meeting from HAZID, Hazard Identification Workshop on Wednesday October 29, 09:00-16:30, 2014 at SSPA Sweden AB, Gothenburg Background SSPA Sweden AB is committed to conduct an FSA addressing the ML2 sea traffic management concept to validate its anticipated risk reduction effects. The FSA methodology, developed by the IMO, is based on established risk analysis methodologies but specifically adapted for application in maritime industry for research and development of new risk based and proactive safety regimes and is regularly applied in the rulemaking process. It includes the following five basic steps: 1 Identification of hazards, 2 Risk analysis, 3 Risk control options, 4 Cost benefit analysis, and 5 Recommendations for decision making (cf MSC 83 INF.2, 2007).
These Minutes of Meeting MoM summarise the outcome of an initial HAZID workshop conducted as part of the first step of the FSA. Identified hazards will be further analysed in comparative testbed simulations within the EMSN in A1.4 (week 50) and a set of Key Performance Indicators, KPIs will be defined and logged. The KPIs comprise hard quantitative metrics as well as soft KPIs addressing qualitative human factor related issues to be registered by use of debriefing questionnaires and simulator observer interviews. The output from the first EMSN trials is also anticipated to provide additional input on potential hazards to complement the initially identified hazards reported in these MoM.
The Kattegat area has been selected as test area for the first EMSN trial to be conducted in December and this initial Hazid workshop therefore specifically approached expertise and stakeholders with experience from this sea area. For further ML2 development and testbed trials in the EMSN it is also important to ensure input from other areas as well as issues on the concept design and general non site-specific hazards.
Participants
Of the following 20 persons invited, 5 were prevented to take part and in total 15 (marked Y) different experts of various disciplines participated actively in the discussions.
Björn Forsman SSPA Sweden AB, FSA ML2 A2.3 [email protected] Y Lars Markström SSPA Sweden AB, ML2 A1.6, A4.3 [email protected] Y Axel Andersson SSPA Sweden AB, risk analyst [email protected] Y Jessica Johansson SSPA Sweden AB, risk analyst [email protected] Y Reto Weber Chalmers Univ. of Technology [email protected] Y Karin Nodin Chalmers Univ. of Technology [email protected] Y Anders Rydlinger Transas [email protected] Y Anders Brödje Swedish Maritime Administration [email protected] N Brian Schmidt Nielsen Dan Pilot Denmark [email protected];[email protected] Y Red card pilot, Henrik Sjöberg Swedish Maritime Adm. [email protected] Y Wiggo Lander Stena Line Scandinavia AB [email protected] Y Jonas Gunnarsson Furetank [email protected] Y Anders Junqquist VTS SOUNDREP VTS operators ML2 [email protected] Y Ingemar Granat VTS SOUNDREP VTS operators ML2 [email protected] Y Jögen Brandt VTS Great Belt Head of VTS [email protected] N Dick Andreasson VTS Göteborg, Sjöfartsverket [email protected] Y Michael Baldauf WMU, ML2 MSP [email protected] cc: [email protected] Y Thomas Johansson SWAM (Havsmyndigheten) [email protected] N
40137181, BEF 20141020

MONALISA 2.0 — FSA: FORMAL SAFETY ASSESSMENT 51
Benny Börjesson Sjöbevakningscentralen Kärringberget [email protected] N Bengt Fernlund, Head of region S-W Swedish Coast Guard South-West [email protected] N
Objectives of the workshop
The objectives of the workshop were two-fold and were; A) addressing the FSA task and B) the EMSN testbed trials scheduled for w 50 in Dec.
A) Primary FSA Objectives:
1 Identify potential hazards by introduction of ML2 STM 2 Identify hard KPIs for analysis of EMSN trial simulation results in Kattegat 3 Identify soft KPIs for analysis of EMSN trial simulation results in Kattegat 4 Discussion how to combine elements from the following 4 guiding documents; FSA guidelines, E-OCM3.0, e-Nav SIP guidelines, and IALA guidelines
B) Primary EMSN trial objectives:
1 Identify the Kattegat baseline scenario; Site, Situation, Date, AIS-data, Analysis. Basis for modelling of: i) Ideal ML2 reference scenario and ii) EMSN reference scenario without ML2 (for w50 trial) 2 Identify conditions for EMSN reference scenario without ML2 Specify variables to be logged/recorded during EMSN trials for post-analysis and derivation of hard KPIs. Voice/video recordings, eye-tracking…. 3 Identify conditions for comparative EMSN scenario with ML2 Parametric variation of: ML2 adoption rate, category of officers, adjusted voyage plans, changed ETA, MSI messages, unexpected events etc.
Nautical hotspots in the Kattegat, Belt, and Sound area
Following an introduction presented by SSPA´s FSA project manger, the first workshop session was dedicated for identification of nautical hotspots, traffic characteristics and hazards in order to engage and gain as much knowledge as possible from the nautical expertise present. The addressed sea area was divided into specific sub-areas and discussed systematically from north to south starting with the Skaw area.
1. The Skaw area and the Skagen roads
Traffic characteristics: Dense traffic with merging routes from Kattegat turning around the Skaw and ferry routes Oslo-Fredrikshavn. No VTS. Anchoring area (non-delimitated) W of Herthas flak used for bunkering or awaiting destination orders. All loaded tankers must take pilot for route B. Anchoring outside VTS areas must always be notified to point of contact at the Danish Navy (SOK Sövärnets Operativa Kommando). The sea area N of Laesö and E of Fredrikshavn is regularly used for STS-transfer operations with tanker vessels topping up after passing the belt short loaded at reduced draft.
Hazards: Primary hazards identified are related to collision risks associated with a number of various potential causes. Difficulties to predict when anchored ships raise anchor and depart from

MONALISA 2.0 — FSA: FORMAL SAFETY ASSESSMENT 52
anchorage. Bunker vessels serving the anchored vessel, provide “VTS-info” and give advice on appropriate anchorage site. Other service providers, provisions, water etc. operates from Skagen port and board anchored ships and together with fishing vessels and pleasure craft also contribute to complex traffic. In rough weather Pilot mark Skagen2 is used for pilot boarding which means that N-bound vessels deviate and cross the route to reach Skagen2 and then turns back and cross the T-route again. Some vessels approaching from the North Sea intending to stop for bunkering at the Skaw first pass the T-route and then turns to SE, and again cross the T-route, before stopping for bunkering. Another hazard noted is related to the fact that the captain of N-bound vessels with pilot on-board often uses this route for rest and are asleep until the pilot is leaving at Skagen1 or 2. Sometimes the time for take-over, registration and to gain situational awareness become too short and thereby poses a hazard. Traffic is often dense in critical early morning hours -e.g. when The Oslo-Fredrikshavn arrives and cross the main route around the Skaw. The Gothenburg-Fredrikshavn ferry crosses the T-route and sometimes also interferes with tankers engaged in STS operations E of Fredrikshavn. Weather is normally not a risk issue but dense fog makes unexpected movements and manoeuvres of anchored ships more hazardous. It was noted, as curiosity, that the VHF traffic tends to decrease in reduced visibility compared with clear weather when the VHF traffic is intensive in the area.
Risk control: A former buoy marking the N start of the T-route has been removed because of too frequent damages by collisions. A TSS with a roundabout at the Skaw has been discussed as a possible RCO (Risk Control Option) but would then also require a VTS. No decision has been made yet. Introduction of VTS would be difficult as the VTS cannot keep track of and inform about all ship’s intended voyage plans and destinations. Recognising the difficulties to predict vessels’ intentions regarding if/where to leave/board pilot and anchoring, it was considered that a future ML2 system for exchange and display of voyage plans would be helpful. It was considered helpful to be able to see 5-10 voyage plans simultaneously but if the number amounts to about 20 it will be too much. The Oslo-Fredrikshavn ferry sometimes chooses to avoid crossing the most intensive and densely trafficked area off the Skaw by using a somewhat longer route E of Buoy 1A (alpha).
2. The Anholt route junction
Traffic characteristics: E of the Island Anholt at Buoy 6, route T is divided into three, the A, T, and D routes towards the Danish belts and towards the Sound respectively. The traffic situation is not as complex as at the Skaw but a large number of fishing vessels and pleasure craft contribute making it complicated.
Hazards: The main hazard is posed by the uncertainty regarding which of the three routes that S-bound vessels intend to enter after passing the junction. Most vessels operate at almost equal speed, implicating that overtakings take long time. Unexpected deviations to another route during overtaking may cause hazardous situations. During overtaking the focus is usually ahead of your vessel and sometimes at the expense of attention on what happening behind you and risks from fast vessels catching up from behind.
Risk control:
MONALISA 2.0 — FSA: FORMAL SAFETY ASSESSMENT 53
It was found that route exchange would be very helpful and reduce uncertainties. Route B W of Läsö may possibly be more frequently used by small vessels if ML2 results in more unregulated choice of routes.
3. The Sound
Traffic characteristics: AIS based traffic flow figures from 2013 indicate the following approximate distribution between the addressed areas: Öresund bridge 34 000, Great Belt bridge 20 000 and Skagen 58 000. The ferry crossing is intensive and sometimes the ferries tend to act as local VTS.
Hazards: At buoy W5A, S of Helsinore-Helsingborg the fairway is divided in a “Danish” route W of Disken and the island Ven and a “Swedish” E of Ven. Danish pilots avoid meetings E of Ven. S of Ven, the lighthouse Pinhättan divides the fairway in one 12.5 m deep channel to Malmö and one 8.0 m channel through the Sound. Buoy Flintrännan No. 1 is a hotspot. Sometimes N-going vessels W of the lighthouse Drogden complicate the traffic situation. In the Drogden channel outside Copenhagen there are three different anchoring areas. There is also a wind farm close to the navigation channel. The Drogden channel is very narrow (about 350 m) and overtaking in the channels could result in accidents. Sometimes there are huge platforms going through the Drogden channel (the only without air draft limitations) which virtually closes the entire channel. The Flint channel is about the same width.
A problem in the Sound could be the strong and shifting current as well as the risk for extreme shallow water. The decrease of water level could force vessels to sudden route changes. In addition Copenhagen is a large cruise ship port. These ships need wide space for turning and sometimes experience difficultiec due to strong cross current. The current may be 3-4 knots. The current direction changes from N/S direction to more W/E further south of Copenhagen.
The most risky area in the Sound is considered to be at Ryggen, between Middelgrund and Flakfort and at the northern entrance to the Drogden channel. Nordre Röse mid-bouy is another tricky point where vessels sometimes pass on wrong side.
Risk control: AIS air draft data to be checked. All ViVa stations are available via AIS and Internet for on-line info on current, wind and sea level. Route exchange information may be valuable for predicting the plans of vessels approaching the Falsterborev roundabout S of Sound entrance.
4. Great Belt and Hatterbarn
Traffic characteristics: The deepest route used by Baltic Sea max-vessels (T 15.0 m) is the Great Belt route. At Hatter Barn at the N entrance of the Belt, the DW route deviates from the ordinary lane and is thereby forming two point of merging fairways. Buoy No.33 marks a tricky junction of the T (DW) route and route H and Omö sound. In Fehmarn Belt the Rödby-Puttgarden ferries add substantial crossing traffic. At Rödsand 1 and 2 in the Kadetrende there is also a complex junction and crossings of routes.

MONALISA 2.0 — FSA: FORMAL SAFETY ASSESSMENT 54
Hazards: At Hatter Barn at the N entrance of the Belt, the two merging points between the deep water (DW) route and the ordinary route are well known as a difficult area. Uncertainty whether vessels intend to go the DW route or not makes it hard to predict other vessels intentions and manoeuvres. In addition there is often a significant cross current. The Great Belt Bridge is no problem but S of it, at buoy No. 33 is the place with the highest frequency near misses in Danish waters. One difficulty is to identify and differentiate the lights from numerous of buoys (there may be too many) and the 500 m wide passage tend to look more narrow than it actually is. In addition there may be confusion on the intended routes of other vessels.
Risk control: The ML2 function of route exchange is considered an attractive risk reduction option for Hatter Barn as well as for the critical area at Buoy No.33 area.
General non site-specific potential hazards:
Information overflow It was noticed that additional new bridge equipment and availability of data and services may lead to information overflow. Too many devices with acoustic alarm signals or warnings lamps may contribute to acoustic and visual pollution generating distracting and loss of attention on essential navigational issues and may eventually also stimulate innovative solutions to block or override warning alarms and jeopardize the safety of the vessel. Information on other vessels’ voyage plans may be valuable but there is a fear that more than 4 - 5 plans would be difficult to embrace and observe simultaneously. ECDIS often generates too many warnings and alarms but new IMO guidelines strive to create a more adequate hierocracy identifying escalating hazards. At blackout events numerous of alarms are activated simultaneously making it difficult to prioritise the best actions.
Cultural-hierarchic traditions It was also claimed that some vessels may tend to follow their assigned voyage plan exactly, no matter what, and also that differences in cultural-hierarchic behaviour may generate different ways of using the STCC information on validated voyage plans and STCC services.
Over reliance There may be a risk that some officers will be too reliant to the validated voyage plans provided by the STCC, so that they do not check carefully enough or distrust their own decision making.
Preferred ship speed The time separation provided by the STCC aims at reduced number of close encounters and anti- collision manoeuvres but implicates that small speed adjustments are recommended at different legs of the voyage plan between the way points presented by the vessels. It is, however, well known that the vessels often have a number of preferred speed levels where engine RPM and power output are considered convenient and efficient. Therefore time separation recommendations should not be based on arbitrarily selected optimum speed but should also take into account the preferred operational speed levels of the specific ship. Information on such preferred speed levels may possibly be part of the static ship data exchanged together with voyage plan data. It was also noted that a slowdown action from e.g. 20 knots to 12 knots might take up to 45 minutes for a large vessel.
MONALISA 2.0 — FSA: FORMAL SAFETY ASSESSMENT 55
Mandate to effectuate STCC recommendations If the ship gets an update from the STCC with a request of an increase speed, is it the captain’s decision to approve the new plan? In most cases it is up to the officer on the bridge to take such decisions on minor correction or alterations of the planned route.
Taxonomy The STCC attributes a number of different status levels to the voyage plans communicated, adjusted, and validated. It is important that the character of this status taxonomy is well known and easy to interpret for everyone involved. Example; the status a voyage plan may be indicated as:
1. Original 2. Planned 3. Optimised 4. Recommended (validated by STCC) 5. Safety checked on-board 6. Approved by captain 7. Monitored route (or Active route up-loaded in bridge navigation system)
Workload The ML2 STM may provide valuable additional information contributing to improved safety and reduced number of accidents but it is also important that this additional information does not increase the workload required by the bridge team. Particularly in critical situations when correct decision have to be made under stress, it is important that the new ML2 STM system facilitate decision making rather than adding to the work load by introducing more information to be considered. Human factor related issues, MMI, and operability aspects must be carefully assessed and evaluated in the design process. It is well known that many near misses, incidents, and accidents occur during stress.
KPIs to be registered during EMSN simulations:
Hard KPIs Hard KPIs for quantification of risk reduction potential
Hard KPIs are to be analysed from all vessels involved in the simulation scenario; by registration and logging/storing of AIS data and other ship specific variables/states at reasonably high sampling rate for all vessels. Based on time histories of variables like position, speed, heading, turning rate, set rudder angle, set RPM, a number of conclusive KPIs like CPA, number of course deviations, BCD, and other safety marginal measures may then be calculated in post-analysis and compared between different simulations, and between “baseline” simulations without the ML2 STM introduced and with the system introduced and with various parametric variations included. For derivation of final results in the FSA, potential improvements of KPIs should be validated and extrapolated into terms of reduced number of collisions and provide input for cost-benefit analysis.
How and where are the hard KPI metrics registered and logged? - All simulators are logging dynamic and static AIS-data of the own ship.
MONALISA 2.0 — FSA: FORMAL SAFETY ASSESSMENT 56
- The instructior stations or the STCC function of the EMSN will register and log everything in csv-files that allow any type of post analysis. (Transas ”replay-files” are difficult to use for post-analysis). - Voyage plans stored in ”logbook”-files including free text info
Identified preferred variables to be registered and logged for all vessels in all simulations:
Static AIS: User Id MMSI (IMO No, Call sign, Name) (Type of ship and cargo type) Overall dimensions Draught T ETA Destination Dynamic AIS: Time stamp Lat, Long SOG COG (true heading) ROT Additional variables: Set rudder angle (actual rudder time history) (number of changings of set value) Set RPM/combinatory setting (actual setting) (number of changings of set value) Fuel consumption (to be calculated based on the registered data and specific ship data)
More issues on technical possibilities and limitation for data registration to be discussed and clarified prior to the baseline simulation session in December.
Manning of simulator bridges during EMSN trials Preferably all “own vessels” shall be manned by two persons. One acting navigating officer/captain and one pilot. The qualification and experience of the bridge team will vary from simulator to simulator and from simulation to simulation. This may have a significant influence on the result and decisions taken and must therefore be carefully documented for each simulation in order to allow for parametric analysis. In addition it is preferable if one observer is present during the simulation to make observations and notes and coordinate the debriefing and ensure that the digital questionnaire is completed by all active bridge team members after each simulation session. If the same test person is operating the same vessel in repeated simulation, the performance may become improved and less realistic, compared with the first time without training.
Soft KPIs for quantification of risk reduction potential
Soft KPIs include: i) analysis of individual subjectively registered data/perceptions retrieved from digital questionnaires completed by bridge team members and STCC operators after each simulation run, and ii) observations and analysis of video recording from the simulator bridges and iii) observations and analysis of recorded VHF communication (time synchronisation is important)

MONALISA 2.0 — FSA: FORMAL SAFETY ASSESSMENT 57
Identified preferred parameters and variables to be registered in the digital questionnaire
Identification related to the simulator bridge and the role of the test person Name/code of facility or “own vessel” Function of person, navigating officer, pilot, STCC(VTS)-operator, simulator instructor How do you consider the behaviour of your simulated vessel compared to a real vessel Did you lack any essential information regarding your vessel during the simulation (what) How do you consider the overall realism of the simulated scenario How did experience the overall functionality and realism of the EMSN simulator network … (Parametric data) Formal qualification, experience and individual characteristics of test person Name or Id code, experience from previous ML2 simulation tests, consecutive number Formal navigational training level, certificate Navigational sea going experience - position Navigational sea going experience - time Navigational sea going experience – type of vessels Previous experience from navigation in the actual Great Belt area Previous experience of simulation exercises/trials Computer skills, adoptability, (video game?, smart phone?) Bio data; age, gender, nationality, profession, education Variables - Subjectively perceived to be rated from 1 to 8 Overall hazard level – during the simulation session At what position (1-8 list) did you experience the most critical situation from a safety perspective What type of situation was associated with the most critical conditions, largest difficulties.. Do you consider that your ship had sufficient safety margins How do you consider your overall level of workload during the simulation session How do you consider your level of workload during the most critical situation How do you consider the communication with other ships (wrt importance, realism, clarity,) How do you consider the communication with land-based services (VTS or STCC) How do you consider the exchange of voyage plans with other ships, if any How do you consider the validation/check of voyage plans with the STCC - if any To what extent did you use the navigational aids available on the bridge to ensure a safe passage, abcdef Did you experience surprising manoeuvres by other vessel in the simulation, no. of occasions Free text comments on the simulation session/simulator

MONALISA 2.0 — FSA: FORMAL SAFETY ASSESSMENT 58
Free text comments on hazards and safety issues experienced during the simulated session Free text comments/proposals on possible RCOs ……
Further development and elaboration of questionnaire structure will be outlined in cooperation with SMA, Sweden and NTUA, Athens.

MONALISA 2.0 — FSA: FORMAL SAFETY ASSESSMENT 59
Appendix 2
Notes from RCO workshop on Accident cases in Kattegat (in Swedish/Danish)

MONALISA 2.0 — FSA: FORMAL SAFETY ASSESSMENT 60

MONALISA 2.0 — FSA: FORMAL SAFETY ASSESSMENT 61

MONALISA 2.0 — FSA: FORMAL SAFETY ASSESSMENT 62

MONALISA 2.0 — FSA: FORMAL SAFETY ASSESSMENT 63
39 partners from 10 countries taking maritime transport into the digital age
By designing and demonstrating innovative use of ICT solutions MONALISA 2.0 will provide the route to improved
SAFETY - ENVIRONMENT - EFFICIENCY
Swedish Maritime Administration ◦ LFV - Air Navigation Services of Sweden ◦ SSPA ◦ Viktoria Swedish ICT ◦ Transas ◦ Carmenta ◦ Chalmers University of Technology ◦ World
Maritime University ◦ The Swedish Meteorological and Hydrological Institute ◦ Danish Maritime Authority ◦ Danish Meteorological Institute ◦ GateHouse ◦ Navicon ◦ Novia
University of Applied Sciences ◦ DLR ◦ Fraunhofer ◦ Jeppesen ◦ Rheinmetall ◦ Carnival Corp. ◦ Italian Ministry of Transport ◦ RINA Services ◦ D’Appolonia ◦ Port of Livorno ◦ IB SRL ◦ Martec SPA ◦ Ergoproject ◦ University of Genua ◦ VEMARS ◦ SASEMAR ◦ Ferri Industries ◦ Valencia Port Authority ◦ Valencia Port Foundation ◦ CIMNE ◦ Corporacion
Maritima ◦ Technical University of Madrid ◦ University of Catalonia ◦ Technical University of Athens ◦ MARSEC-XL ◦ Norwegian Coastal Administration
www.monalisaproject.eu