formaldehyde in new homes - department of energy · presented at building america residential...
TRANSCRIPT

Presented at Building America
Residential Energy Efficiency Stakeholder Meeting
March 1, 2012Austin, Texas
Formaldehyde in New Homes---
Ventilation vs. Source Control
Brett C. Singer and Henry WillemEnvironmental Energy Technologies Division
Lawrence Berkeley National Laboratory

Acknowledgments
• Funding— U.S. Department of Energy – Building America Program— U.S. EPA – Indoor Environments Division— U.S. HUD – Office of Healthy Homes and Lead Hazard Control— Cal. Energy Commission Public Interest Environmental Research
• Technical Contributions — Fraunhofer— Ibacos— IEE-SF
• LBNL Team— Sherman, Hotchi, Russell, Stratton, and Others

Background 1
Formaldehyde is an irritant and a carcinogen
Odor threshold: about 800 ppb
Widely varying health standards US HUD (8-h): 400 ppb
Germany: 100 ppb
WHO, Japan (0.5-h): 80 ppb
Sweden (0.5-h): 50 ppb
Canada (8-h): 40 ppb
California ARB (8-h): 27 ppb
US NIOSH (8-h): 16 ppb
CA OEHHA (chronic): 7.5 ppb
*Goal is to reduce / minimize exposure, may not be viable to declare homes “safe” from formaldehyde

Formaldehyde in bulk material, diffuses to surface
Conventional Understanding:Increase ventilation reduce air conc. increase emissions
Physics of Formaldehyde Emissions

Background 2
Limited recent formaldehyde data for U.S. new homes California New Home Study:
108 homes: Summer/Winter, North/South splits
Composite wood products are largest sources in homes
Few examples of apportionment in finished homes

Formaldehyde highest in new homes, Concentrations decrease with age
Park JS, Ikeda K. Variations of formaldehyde and VOC levels during 3 years in new and older homes. Indoor Air. 2006 Apr;16(2):129-35.
Single-family houses in Japan (New in 1st year)
Con
cent
ratio
n(u
g/m
3 )
24 h mechanical ventilation
Local exhausts
Natural ventilation
1st year2nd year3rd year

Formaldehyde Emission Standards
CA: Composite Wood Air Toxic Control Measure Approved 2007 under authority to regulate outdoor air Phased implementation 2009-2012
U.S. Formaldehyde Standards in Composite Wood Products Act Approved 2010 to be implemented by Jan 1, 2013 Based on CA standards

Emissions Determinants
Source Concentration within materialDecreases with time
Diffusion rates and barriers Connection to indoor air
Environmental Temperature Humidity Solar insolation
Temperature (K)
Con
cent
ratio
n (p
pm)

Controlling Formaldehyde
Source control: Seal with low-permeability laminate Resin formulations that chemically bind formaldehyde
Options requiring energy use in building Dehumidification Air cleaning / treatment Ventilation?

Research Questions
• Can increasing ventilation substantially reduce formaldehyde concentrations in new homes?
• To what extent do emissions increase when air exchange is increased?
• Do homes built with low-emitting materials have lower formaldehyde concentrations? How much?
• This information is needed to evaluate the cost-effectiveness of ventilation and source control!

Existing Data: California New Home Study
Offermann, F. J. 2009. Ventilation and Indoor Air Quality in New Homes. California Air Resources Board and California Energy Commission, PIER Energy‐Related Environmental Research Program. Collaborative Report. CEC‐500‐2009‐085.
Form
alde
hyde
(pp
b)
Air Exchange Rate (h-1)
Built: 2002-5Data: 2006-7
N=108

California New Home Study DataFo
rmal
dehy
de (
ppb)
Air Exchange Rate (h-1)
Built: 2002-5Data: 2006-7
N=108
These homes built prior to formaldehyde emission standards

Ventilation impact in CA new homesSummer data
Built: 2002-5Data: 2006-7
Age: 1.8-5.5 y
SummerN=48
N=19 N=18 N=11
Form
alde
hyde
(pp
b)

Ventilation impact not explained by age variations
Built: 2002-5Data: 2006-7
Age: 1.8-5.5 y
SummerN=48

Ventilation impact not explained by T or RH variations
Built: 2002-5Data: 2006-7
Age: 1.8-5.5 y
SummerN=48
Indo
or T
emp
(F)
Indo
or R
H (%
)

F, df (2.3, 2): P<0.1
N=19 N=18 N=11
Emission suppressed at low AER
Built: 2002-5Data: 2006-7
Age: 1.8-5.5 y
SummerN=48

Ventilation Intervention Study
Modify AER in 9homes with other parameters fixed Materials Temperature Rel. Humidity Season
AER control via mechanical ventilation
Measure AER & concentrations, calculate emissions
Age (yrs)
Floor area(ft2)
ACH 50
Low-emitting Material#
R1 2.0 2100 1.2 1,2,3R2 1.5 150 4.0 1,2,3R3 1.5 150 4.0 1,2,3R4 0.3 1475 0.6 1,2,3R5 7.5 1300 4.3 -R6 0.8 1570 1.0 2,3R7 1.0 2260 0.7 2,3R8 2.5 1600 1.0 2R9 2.5 3440 4.0 2
#1= Wood products compliant with CA Title 17 or low- or no- formaldehyde standards, 2= Wet surface finishing certified as low-emitting,3= Carpet materials and backing low-emitting.

Lower concentration with increased AER in each study home
May - Sep 2011Age: 0.3 - 2.5 y
N = 9 homes

Emission impact of AER varies
May - Sep 2011Age: 0.3 - 2.5 y
N = 9

Study of Source Control
Measure concentrations and AER in new homes constructed with low-emitting materials 10 LEED / Indoor Air Plus homes in New Mexico (NM)
0.3 – 2.5 years old
ATCM compliant wood products
8 California homes complying with ATCM:
0.3 – 1.1 years old
Additional data being collected in CA-compliant homes
Compare to CNHS and NM conventional homes

Low-emitting materials yield lower formaldehyde concentrations
Form
alde
hyde
(ug
/m3 )
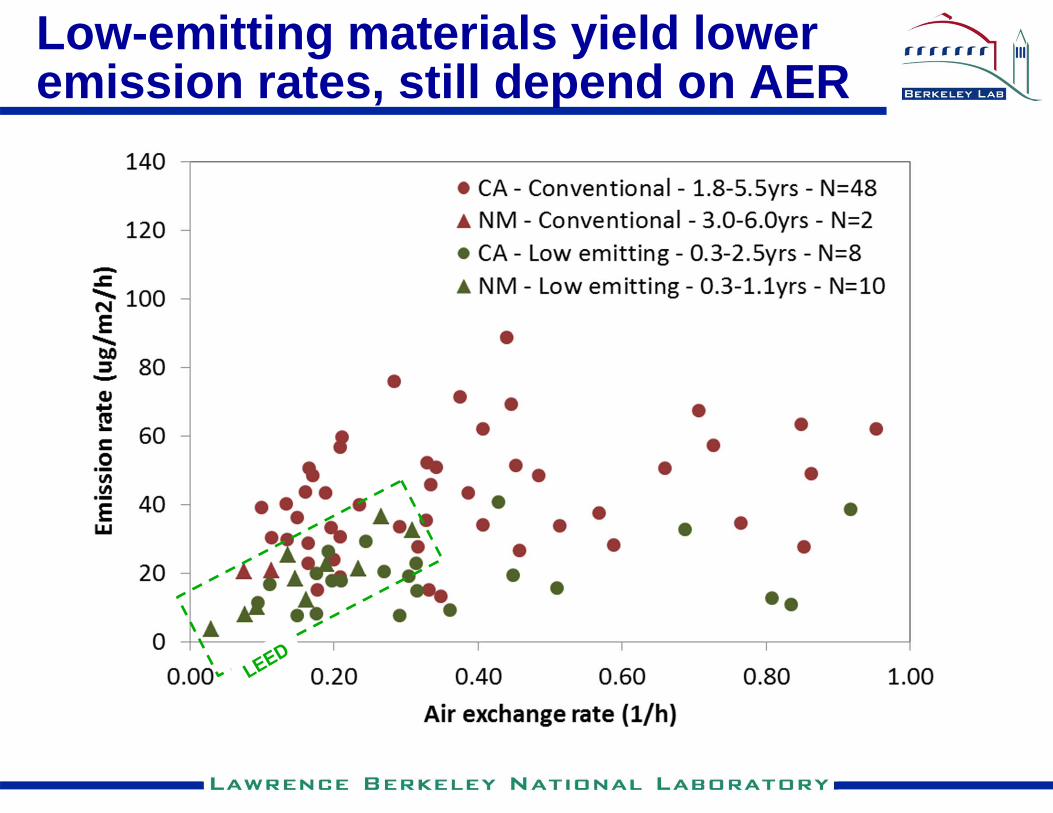
Low-emitting materials yield lower emission rates, still depend on AER

Conclusions
• Emission limits on composite wood products reducing formaldehyde in new homes
• Increasing ventilation can reduce near-term concentrations, exposures
• Benefits of adding ventilation depend on starting point b/c emissions increase
• Increasing ventilation should deplete sources more rapidly
• Open questions— What is value of health benefits?— How much impact does higher ventilation have in long term?— Time evolution of homes with low-emitting materials?

Extra Slides
• The following slides will not be shown unless requested or needed

No Mechanical Ventilation Benefits only by Increasing AER
Built: 2002-5Data: 2006-7
Age: 1.8-5.5 y
SummerN=48

Health Benefit Calculation
• Methodology described in Logue et al., Environmental Health Perspectives, 2012
• 10 ppb reduction for 100K people for 1 year saves 5 DALYs
• Assume 25K homes for every 100K people living in new homes
• $100K per DALY -> $500K per year ->• $20 per 10 ppb per year• 10 ppb lower over 10 years -> $200 per home

Ventilation impacts in CA new homes (Adjusted to 77 F and 50% RH)
Est
imat
ed fo
rmal
dehy
de (p
pb)
at 7
7 F
and
50%
RH
Built: 2002-5Data: 2006-7
Age: 1.8-5.5 y
SummerN=48

Offermann, F. J. 2009. Ventilation and Indoor Air Quality in New Homes. California Air Resources Board and California Energy Commission, PIER Energy‐Related Environmental Research Program. Collaborative Report. CEC‐500‐2009‐085.
No Clear Age Signal in CNHS
Built: 2002-5Data: 2006-7
Age: 1.8-5.5 y
SummerN=48