formaldehyde risk assessment: proposal of … risk assessment: proposal of exposure limits,...
TRANSCRIPT
UNIVERSITY OF MILAN
PhD School in Biomedical Sciences
Department of Occupational and Environmental Health
PhD in Occupational and Environmental Health and Industrial Hygiene
XXIII cycle
Formaldehyde Risk Assessment:
proposal of exposure limits,
characterisation of exposure,
and development of scenarios
PhD student: Patrizia VIDA
Tutor: professor Angelo MORETTO
Coordinator: professor Giovanni COSTA
Academic year 2009/10
I
Index
List of acronyms ……………………………………………………………………... p. IV
1. Introduction ………………………………………………………………….. p. 1
1.1. Key properties and applications …………………………….. p. 1
1.2. Sources of exposure …………………………………………... p. 2
1.3. Health Effects …………………………………………………… p. 4
1.3.1 Human toxicity…………………………………………………………. p. 4
1.3.2 Animal toxicity………………………………………………………….. p. 7
1.3.3 Carcinogenicity…………………………………………...……………. p. 8
1.4. Classification ……………………………………………… ……. p.11
1.4.1 European Union………………………………………………………... p. 11
1.4.2 IARC and US classification………………………………………….... p. 13
1.5. Project objectives .…………………………………………............ p. 14
2. Materials and Methods .…………………………………………......... p. 15
2.1. European Project INDEX UPRIC 2009 ………………………... p. 15
2.1.1. Literature review…………………………….……………………….... p. 15
2.1.2. Calculation of exposure reference values……..………………….... p. 17
2.2. Exposure characterisation and scenarios in hos pitals .... p.19
2.2.1. Identification of uses and exposure determinants……………..….. p. 19
2.2.2. Air monitoring techniques………………………………………..…... p. 22
2.2.3. Monitoring campaigns setting…………………………………..…… p. 26
2.2.4. Data elaboration………………………………………...……..……… p. 29
3. Results ……………………………………………………………....………... p. 30
3.1. European Project INDEX UPRIC 2009 …………….…………. p. 30
3.1.1. Levels of exposure among general population…………………… p. 30

Index
II
3.1.2. Hazard characterisation…………………………………………….. p. 35
3.1.3. Exposure Reference Values……………………………………...… p. 37
3.2. Exposure characterisation and Exposure Scenari os in
hospitals ……………………………………………………………………. p. 40
3.2.1. Uses and exposure determinants identified………………………. p. 40
3.2.2. Preliminary measurements…………………………………………. p. 42
3.2.3. Monitoring survey at University Hospital L. Sacco……………….. p. 44
3.2.4. Monitoring survey at National Cancer Institute…………………… p. 51
3.2.5. Exposure Scenarios and Risk Management Measures proposal.. p. 60
4. Discussion …………………………………………………………………... p. 72
4.1. European Project INDEX UPRIC 2009 …………………….…. p. 72
4.1.1. Levels of exposure among EU population…………………….…… p. 72
4.1.2. INDEX 2005 summary………………………………………….……. p. 73
4.1.3. Reconsideration of formaldehyde exposure limits………….…….. p. 74
4.1.4. Protection from effects other than irritation……………….……….. p. 75
4.1.5. Comparison with other reference values……………….………..… p. 76
4.1.6. The relevance of exposure characterisation………….…………… p. 77
4.1.7. Recommendations…………………………………….……………... p. 79
4.2. Exposure characterisation and Exposure Scenari os in
hospitals ……………………………………………………………………. p. 80
4.2.1. Occupational exposure to formaldehyde in Pathology laboratories p. 80
4.2.2. Comparison of exposure data with the TLV-C……………………. p. 81
4.2.3. Considerations on proposed RMMs……………………………...… p. 86
4.2.4. Considerations on monitoring techniques……………………….… p. 87
5. Conclusions ……………………………………………………………....... p. 90
5.1. European Project INDEX-UPRIC 2009 ……………………….. p. 90
5.2. Exposure characterisation and Exposure Scenari os in
hospitals ……………………………………………………………………. p. 91

Index
III
Bibliography ………………………………………………………………………… p. 93
Appendix A: Exposure modelling exercise ……………………………………. p. i
Appendix B: Results of pilot test ………………………………………………… p. v
Appendix C: Results of PCA ……………………………………………………… p. vi
Appendix D: INDEX-UPRIC Project - Results of litera ture review …………… p. ix

IV
VOCs
HPVCs
UFFI
ETS
OQAI
NOEL
NOAEL
LOAEL
NCI
CLP
ECHA
MSC
IARC
NTP
US EPA
WHO
IPCS
CSAF
PBT
vPvB
TWA
CMS
RMMs
PCA
ACGIH
TLV
TNO
CEFIC
List of acronyms
Volatile Organic Compounds
High Production Volume Chemicals
Urea-Formaldehyde Foam Insulation
Environmental Tobacco Smoke
Indoor Air Quality Observatory (French)
No Observed Effect Level
No Observed Adverse Effect Level
Lowest Observed Adverse Effects Level
National Cancer Institute
Classification, Labelling and Packaging
European Chemicals Agency
Member State Committee
International Agency for Cancer Research
National Toxicology Program
United States Environmental Protection Agency
World Health Organization
International Programme on Chemical Safety
Chemical Specific Assessment Factor
Persistent Bioaccumulative Toxic
very Persistent very Bioaccumulative
Time Weighted Average
Chip Measurement System
Risk Management Measures
Principle Component Analysis
American Conference of Industrial Hygienists
Threshold Limit Value
Netherlands Organisation for Applied Scientific Research
European Chemical Industry Council

List of acronyms
V
ppm
ppb
RELs
Part per million
Part per billion
Reference Exposure Limits

1
Introduction
1.1 Key properties and applications
Formaldehyde [methanal, CAS No. 50-00-0; EC No. 200-001-8] is an organic
compound with the formula CH2O. At room temperature, it is a gas with a strong
chemical reactivity (as it is electrophile) and it readily converts to derivative
compounds. It has a molecular weight of 30.03, and a boiling point of -19°C (Lide,
2003). Because of its low boiling point it is not considered to belong to the Volatile
Organic Compounds (VOCs), and is not sampled or analysed with the methods used
for the VOCs. As the simplest aldehyde, it is a common precursor to many other
chemicals, especially polymeric compounds.
Formaldehyde does not accumulate in the environment, because it undergoes
photolysis within a few hours by sunlight or biologic breakdown by bacteria present in
soil or water.
It is generally commercialised as formalin, a colourless aqueous solution, with a
characteristic pungent odour. Saturated solution of formaldehyde (about 40% by
volume or 37% by mass) in water, usually contain a small amount of stabilizer (i.e.
methanol) to limit oxidation and polymerization.
Formaldehyde ranks among leading HPVCs (High Production Volume Chemicals): in
2004 its production in EU and Norway amounted to 10.7 million tons (FormaCare,
2008) while world production was reported to be about 21 million tons (IARC, 2006).
Formaldehyde is one of the most utilised chemical substances in the world as it is a
common component of a large variety of materials. Because of its high versatility,

Introduction
2
formaldehyde has application in numerous uses. Thermosetting polymers are resins
that achieve hardiness through the formation of a 3-D network of bonds (curing
process). Production of formaldehyde resins accounts for more than half of
formaldehyde consumption and probably its most significant economic sector. The
most widespread formaldehyde-based resins are:
– urea-formaldehyde,
– melamine-formaldehyde,
– phenol-formaldehyde;
Formaldehyde-based materials are employed in a huge number of products, in
particular are basic components of wood-based material such as plywood,
fibreboard, particle board. They are also present in adhesives, insulating foams,
glues, automotive equipment, textile treatments, and dozens of other consumer’s
products.
Formaldehyde is also extensively used as preservative, biocide and disinfectant.
Formalin is the most common solution to fix and preserve biologic specimens:
hospitals, laboratories, embalmers consume significant amounts of formalin every
day. In a more diluted solution, formaldehyde is also present in many household
products such as detergents, disinfectants and varnishes.
1.2 Sources of exposure
Formaldehyde emerged as the first modern, non-industrial, indoor air quality issue.
During 1970’s when concerns about energy efficiency led to efforts to improve home
insulation, Urea-Formaldehyde Foam Insulation (UFFI) became an important
insulation product for existing houses. Formaldehyde-based materials have the
characteristic of slowly releasing molecules of formaldehyde into the environment
(see figure 1.2 Urea-formaldehyde resin structure) by hydrolysis. Indoor air surveys
soon detected formaldehyde releases also from chipboards and plywood, both widely
used in building and furnishing materials.

Introduction
3
Household products such as detergents and disinfectants are also significant
domestic sources of formaldehyde; among considerable indoor sources there are
other consumer products like paints, adhesives, carpets, varnishes, textiles and so
on.
Formaldehyde is also a by-product of combustion processes, Environmental Tobacco
Smoke (ETS) in particular. Air chemistry of terpenes, contained in fragrances and air
fresheners, which are more and more widespread in domestic settings, can form
formaldehyde in presence of ozone (even if it is present at levels of ppb) (ECA-IAQ,
2007).
Because of its multitude of indoor sources, formaldehyde is found ubiquitously in
almost all indoor environments at levels which exceed the outdoor concentrations by
an order of magnitude or more. Background levels of formaldehyde present in
outdoor air (in rural areas) are usually lower than 10 µg/m3 or 8 ppb.(1 ppb = 1.24
µg/m3 ).
Nowadays formaldehyde emissions from wood-based panels have been regulated in
most developed countries. Typical indoor levels in dwellings and offices are in the
range of 15÷50 µg/m3 (12-40 ppb), even if in some cases they can reach
concentrations above 100 µg/m3 (80 ppb) (Kotzias et al, 2005). Higher
concentrations are found in environments where there is a large presence of wood-
based materials, in brand new, renewed/refurnished environments or in those
characterised by poor ventilation, high relative humidity and temperature.
The maximum values measured indoors varied quite a lot since the 1980s, as can be
seen when comparing the various surveys carried out in Germany (GerES 1985/86)
to the most recent ones from France (OQAI, Indoor Air Quality Observatory, Kircher
et al, 2006) and AIRMEX (Kotzias et al, 2009). A trend to decreasing concentration
over time seems to be observed. This reduction can be partially attributed to the less
emitting materials being developed over time, in the context of various labelling
schemes in place in different European countries, including Italy (i.e. class E1, where
concentrations at equilibrium state must not exceed 0.1 ppm) where have become
mandatory in 2008. Nevertheless, in spite of the restrictions adopted, formaldehyde
remains an indoor air quality issue. Due to its widespread diffusion it has been
recognised as the most critical substance for indoor air quality (Kotzias et al, 2005).
Though formaldehyde is an indoor air pollutant that has been acknowledged and
measured broadly for decades across Europe, and considering its large spreading

Introduction
4
and the concern for human health, representative and accurate data describing
indoor exposure to formaldehyde in Europe are still scarce.
Figure 1.2.1 Urea-formaldehyde resin
Occupational exposure to formaldehyde is principally due to thermal or chemical
decomposition of formaldehyde-based resins, to the combustion of organic
compounds, and emission from aqueous solutions (i.e. in laboratories and hospitals).
Particularly, due to the volatile nature of formaldehyde, the latter is characterised by
peaks of concentration that can range levels of several ppm if no containment
measures (i.e. exhaust hood) are put in place (Orsiere et al, 2006).
1.3 Health effects
1.3.1 Human toxicity
Being a highly reactive chemical, formaldehyde causes tissue irritation and damage
on contact. Due to its high volatility, the major and, most significant for human health,
route of exposure is inhalation, either for indoor or occupational settings.
Formaldehyde concentrations associated with adverse effects in humans show wide
inter-individual differences. Predominant symptoms and signs of exposure by
inhalation in humans are irritation of the eyes, nose and throat, together with
concentration-dependent discomfort, lacrimation, sneezing, coughing, nausea and

Introduction
5
dyspnoea. Though oral exposure is rare, formaldehyde ingestion results in severe,
corrosive, damage to the gastrointestinal tract, followed by CNS depression,
myocardial depression, circulatory collapse, metabolic acidosis, and multiple organ
failure (NTP 2010).
Controlled conditions studies on humans are relatively rare. On the opposite,
community or work surveys are found very often in scientific literature. Generally,
these papers do report the air levels of formaldehyde that were associated with
health symptoms among people exposed.
Respiratory tract and eye irritation, and changes in odour threshold, have been
reported in numerous surveys conducted among general population, even at
concentration lower than 0.1 ppm. In occupational settings, reported effects include
allergic contact dermatitis, histopathological abnormalities such as hyperplasia,
squamous metaplasia, and mild dysplasia of the nasal mucosa, occupational asthma,
reduced lung function, altered immune response, and hematotoxicity (IARC 2006).
Some surveys conducted on workers in China suggest that long-term exposure to
formaldehyde can cause leucopoenia. Particularly, one study reported that a
significantly higher percentage of formaldehyde-exposed workers had blood cell
abnormalities (leucopoenia, thrombocytopenia, and depressed serum haemoglobin
levels) compared to unexposed controls (reviewed by Tang et al. 2009).
Higher rates of spontaneous abortion and low birth weights have been reported
among women occupationally exposed to formaldehyde (IARC 2006, Saurel-
Cubizolles et al. 1994).
Recent literature data highlight the role of recurrent short-term peak exposures,
rather than exposure to constant formaldehyde levels, in adversely affecting upper
airways. One study in particular, monitored the health outcomes of a group of 21
volunteers exposed to several levels of formaldehyde in controlled conditions, with
and without concentration peaks over a 10-week period, using a repeated exposure
design (Lang et al., 2008). Eye irritation was found to be the most sensitive
parameter. Eye and nasal irritation were objectively observed at continuous exposure
to 0.5 ppm with peaks of 1 ppm exposure, but not at constant exposure to 0.5 ppm.
Effects reversed 16 hours after the end of the exposures. No significant treatment
effects of nasal flow and resistance, pulmonary disfunction, and reaction times were
observed. It was concluded that a No Observed Effect Level (NOEL) for subjective
Introduction
6
and objective eye irritation is 0.5 ppm in case of constant exposure levels, and 0.3
ppm with peaks of 0.6 ppm in case of short-term peak exposure.
Another study performed on asthmatic volunteers in controlled conditions was
conducted in 2006 to evaluate the influence of pre-exposure to low-dose
formaldehyde (100 µg/m3, 0.08 ppm, for 30 min) on bronchial response to a mite
allergen (Casset et al. 2006). Patients developed an immediate bronchial response at
a significantly lower dose of mite allergen than after fresh air exposure, suggesting
that formaldehyde might be involved in asthma exacerbation.
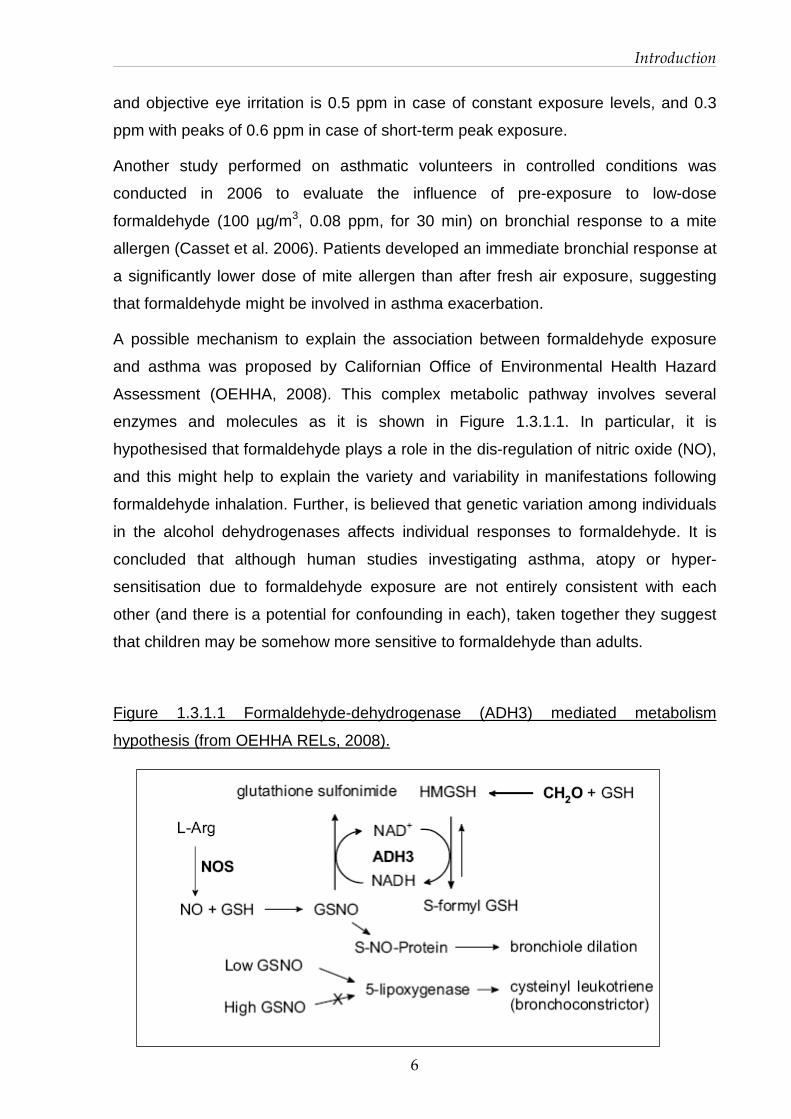
A possible mechanism to explain the association between formaldehyde exposure
and asthma was proposed by Californian Office of Environmental Health Hazard
Assessment (OEHHA, 2008). This complex metabolic pathway involves several
enzymes and molecules as it is shown in Figure 1.3.1.1. In particular, it is
hypothesised that formaldehyde plays a role in the dis-regulation of nitric oxide (NO),
and this might help to explain the variety and variability in manifestations following
formaldehyde inhalation. Further, is believed that genetic variation among individuals
in the alcohol dehydrogenases affects individual responses to formaldehyde. It is
concluded that although human studies investigating asthma, atopy or hyper-
sensitisation due to formaldehyde exposure are not entirely consistent with each
other (and there is a potential for confounding in each), taken together they suggest
that children may be somehow more sensitive to formaldehyde than adults.
Figure 1.3.1.1 Formaldehyde-dehydrogenase (ADH3) mediated metabolism
hypothesis (from OEHHA RELs, 2008).
Introduction
7
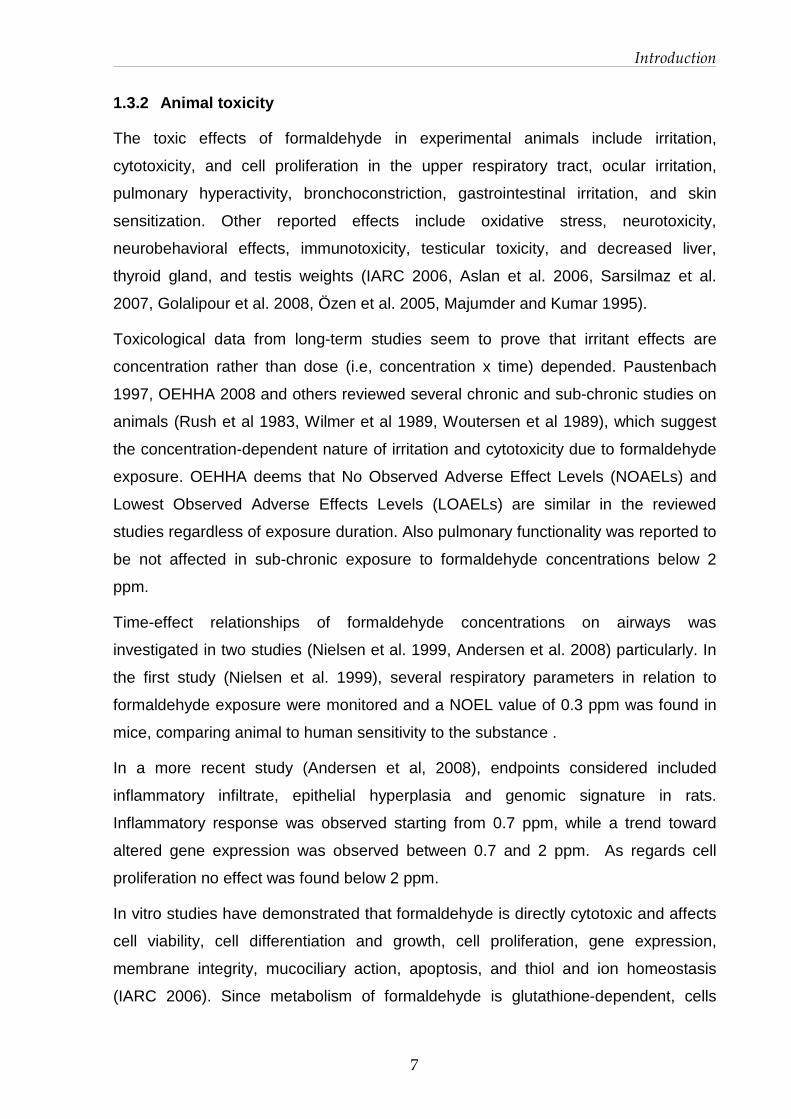
1.3.2 Animal toxicity
The toxic effects of formaldehyde in experimental animals include irritation,
cytotoxicity, and cell proliferation in the upper respiratory tract, ocular irritation,
pulmonary hyperactivity, bronchoconstriction, gastrointestinal irritation, and skin
sensitization. Other reported effects include oxidative stress, neurotoxicity,
neurobehavioral effects, immunotoxicity, testicular toxicity, and decreased liver,
thyroid gland, and testis weights (IARC 2006, Aslan et al. 2006, Sarsilmaz et al.
2007, Golalipour et al. 2008, Özen et al. 2005, Majumder and Kumar 1995).
Toxicological data from long-term studies seem to prove that irritant effects are
concentration rather than dose (i.e, concentration x time) depended. Paustenbach
1997, OEHHA 2008 and others reviewed several chronic and sub-chronic studies on
animals (Rush et al 1983, Wilmer et al 1989, Woutersen et al 1989), which suggest
the concentration-dependent nature of irritation and cytotoxicity due to formaldehyde
exposure. OEHHA deems that No Observed Adverse Effect Levels (NOAELs) and
Lowest Observed Adverse Effects Levels (LOAELs) are similar in the reviewed
studies regardless of exposure duration. Also pulmonary functionality was reported to
be not affected in sub-chronic exposure to formaldehyde concentrations below 2
ppm.
Time-effect relationships of formaldehyde concentrations on airways was
investigated in two studies (Nielsen et al. 1999, Andersen et al. 2008) particularly. In
the first study (Nielsen et al. 1999), several respiratory parameters in relation to
formaldehyde exposure were monitored and a NOEL value of 0.3 ppm was found in
mice, comparing animal to human sensitivity to the substance .
In a more recent study (Andersen et al, 2008), endpoints considered included
inflammatory infiltrate, epithelial hyperplasia and genomic signature in rats.
Inflammatory response was observed starting from 0.7 ppm, while a trend toward
altered gene expression was observed between 0.7 and 2 ppm. As regards cell
proliferation no effect was found below 2 ppm.
In vitro studies have demonstrated that formaldehyde is directly cytotoxic and affects
cell viability, cell differentiation and growth, cell proliferation, gene expression,
membrane integrity, mucociliary action, apoptosis, and thiol and ion homeostasis
(IARC 2006). Since metabolism of formaldehyde is glutathione-dependent, cells

Introduction
8
depleted of glutathione are more susceptible to formaldehyde toxicity (Ku and Killings
1984).
1.3.3 Carcinogenicity
A large number of epidemiological studies evaluated the relationship between
formaldehyde exposure and carcinogenicity in humans, revealing an association
between exposure to formaldehyde and cancer in humans. Findings show increased
risks of nasopharyngeal cancer, sinonasal cancer, and myeloid leukemia among
individuals with higher exposure to formaldehyde (either exposure level or duration),
which could not be explained by chance, bias, or confounding factors.
An increased risk for nasopharyngeal cancer was found among individuals with the
highest formaldehyde exposure in numerous case-control studies (Vaughan et al.
1986, 2000, Roush et al. 1987, West et al. 1993, Hildesheim et al. 2001). Excess
nasopharyngeal cancer mortality associated with formaldehyde exposure was
observed in the US National Cancer Institute (NCI) cohort of industrial workers
(Hauptmann et al. 2004). Further, positive exposure-response relationships were
found both in a large multi-centre case-control study (Vaughan et al. 2000) and in the
NCI cohort (Hauptmann et al. 2004).
Concerning sinonasal cancer, an increased risk was found in population-based case-
control studies (Olsen et al. 1984, Olsen and Asnaes 1986, Hayes et al. 1986, Roush
et al. 1987, Luce et al. 1993). A pooled analysis of 12 case-control studies (Luce et
al. 2002) found also an excess of sinonasal cancer. In most studies, estimates of
increased risk for both sinonasal adenocarcinoma and squamous-cell carcinoma;
were statistically significant for individuals ever exposed to formaldehyde, or with
higher probability or higher levels of exposure.
An association between excess mortality from leukemia or combined
lymphohematopoietic cancers has been reported in several cohort studies, including
studies of professional groups (especially embalmers) and some of the studies of
industrial cohorts (NTP 2010). Some of these studies reported positive exposure-
response relationships for combined lymphohematopoietic cancer or specific
subtypes (Beane Freeman et al. 2009, Hauptmann et al. 2009). In particular, the
strongest associations were observed for myeloid leukemia. The most informative
studies for evaluation of the risk of this cancer are the large cohort studies (NCI,

Introduction
9
NIOSH, British cohorts) of industrial workers and the NCI nested case-control study
of lymphohematopoietic cancer in embalmers. Three of these (NCI, NIOSH and
embalmers), found elevated risks of myeloid leukemia among individuals with high
exposure to formaldehyde, as well as positive exposure-response relationships
(Beane Freeman et al. 2009, Pinkerton et al. 2004, Hauptmann et al. 2009). In
contrast, no association between these types of cancer was found among British
chemical workers cohort (Coggon et al, 2003). Exposure to peak levels of
formaldehyde (of 4 ppm and above) was associated with increased mortality of
lymphohematopoietic cancers among workers in the NCI cohort study (Beane
Freeman et al. 2009), while no associations were found with cumulative or average
exposure. In the smaller industrial cohort studies, some reported excesses for all
lymphohematopoietic cancers combined among formaldehyde-exposed workers
(Bertazzi et al. 1989, Stellman et al. 1998) or leukemia (Hansen and Olsen 1995,
1996), but others observed no association for all lymphohematopoietic cancers
combined (Andjelkovich et al. 1995, Stern 2003, Pinkerton et al. 2004) or leukemia
(Andjelkovich et al. 1995, Stellman et al. 1998, Stern 2003). With respect to other
case-control studies, a population-based study found no clear association between
leukemia and exposure to formaldehyde (Blair et al. 2001), and two nested case-
control studies reported statistically non-significant increases in leukemia risk based
on small numbers of exposed cases (Partanen et al. 1993, Ott et al. 1989).
Formaldehyde has been tested for carcinogenicity in mice, rats, and hamsters.
Studies reviewed include chronic and sub-chronic inhalation studies in mice, rats,
and hamsters; chronic and subchronic drinking-water studies in rats; and one
chronic skin-application study in mice (NTP. 2010).
Long-term exposure inhalation to formaldehyde by inhalation caused nasal tumours,
both benign (polypoid adenoma) and malignant (predominantly squamous-cell
carcinoma but also adenocarcinoma and carcinoma) in male and female F344 rats
(Kerns et al. 1983, Monticello et al. 1996, Kamata et al. 1997), male Sprague-Dawley
rats (Sellakumar et al. 1985), and male B6C3F1 mice (Kerns et al. 1983a). In
particular, long-term exposure to 6 ppm formaldehyde and above caused squamous
cell carcinomas of the nasal cavity of rats with a non-linear, biphasic concentration-
Introduction
10
response relationship having the breakpoint at or above 2 ppm. (Kerns et al 1983,
Monticello et al. 1996).
Nasal tumours were observed after 13 weeks exposure in male Wistar rats also
(Feron et al. 1988). Although the increased incidences of nasal tumours in mice and
in the short term exposure study in rats were not statistically significant, they were
considered to be biologically significant because of the rarity of this type of tumour.
One of the most accredited hypotheses to date explaining carcinogenic pathway has
been based primarily upon data derived from laboratory studies. Increased cellular
proliferation, as a consequence of epithelial cell toxicity, appears to be the most
significant determinant of tumour progression associated with formaldehyde
inhalation. Formaldehyde concentration, rather than duration of exposure, seems to
be related to histopathological effects and increased proliferation of epithelial
respiratory cell in the nasal cavity. Further, the extent of proliferative response
depends on the specific site of the nasal cavity being examined (Liteplo and Meek,
2003). These regions are similar to those where tumours are observed. Significant
increases in endpoint considered such as cytotoxicity, increased epithelial cell
proliferation, and even DNA-cross linking, though non-linear, are observed at
concentration of 4 ppm (Casanova & Heck, 1987). This might be correlated with the
concentration at which mucociliary clearance is inhibited (> 2 ppm ca.) and
gluthatione-mediated metabolism saturated (4 ppm) (Morgan et al, 1986a, Casanova
et al, 1994).
Several studies consider formaldehyde exposure associated with multiple modes of
action related to carcinogenicity, such as DNA reactivity, gene mutation,
chromosomal breakage, aneuploidy, epigenetic effects (binding to lysine residues of
histones), glutathione depletion, oxidative stress, and cytotoxicity-induced cellular
proliferation (Lu et al. 2008, Guyton et al. 2009, NTP 2010). Although an evidence for
a genotoxic mode of action for formaldehyde-induced cancer seems possible, the
mechanisms by which formaldehyde causes cancer are not completely understood.

Introduction
11
1.4 Classification
Formaldehyde classification, especially concerning carcinogenicity, presents relevant
discrepancies among different countries.
1.4.1 European Union
In EU, accordingly to Directive EEC/67/548, it is classified as Carcinogen Category 3.
This group includes “substances which cause concern for man owing to possible
carcinogenic effects but in respect of which the available information is not adequate
for making a satisfactory assessment. There is some evidence from appropriate
animal studies, but this is insufficient to place the substance in Category 2”. This
means that ‘there is a limited evidence of carcinogenic effect’. Further, is classified as
Toxic (T) and Corrosive (C), and the following Risk and Safety Phrases are given:
� R23/24/25 : Toxic by inhalation, in contact with skin and if swallowed.
� R34 : Causes burns.
� R40 : Limited evidence of a carcinogenic effect.
� R43 : May cause sensitization by skin contact.
• S1/2 : Keep locked up and out of the reach of children.
• S26 : In case of contact with eyes, rinse immediately with plenty of water and
seek medical advice.
• S36/37/39 : Wear suitable protective clothing, gloves and eye/face protection.
• S45 : In case of accident or if you feel unwell, seek medical advice
immediately (show the label where possible).
• S51 : Use only in well-ventilated areas.
Regarding chemical safety, due to its low flash point, it is classified as a flammable
gas.
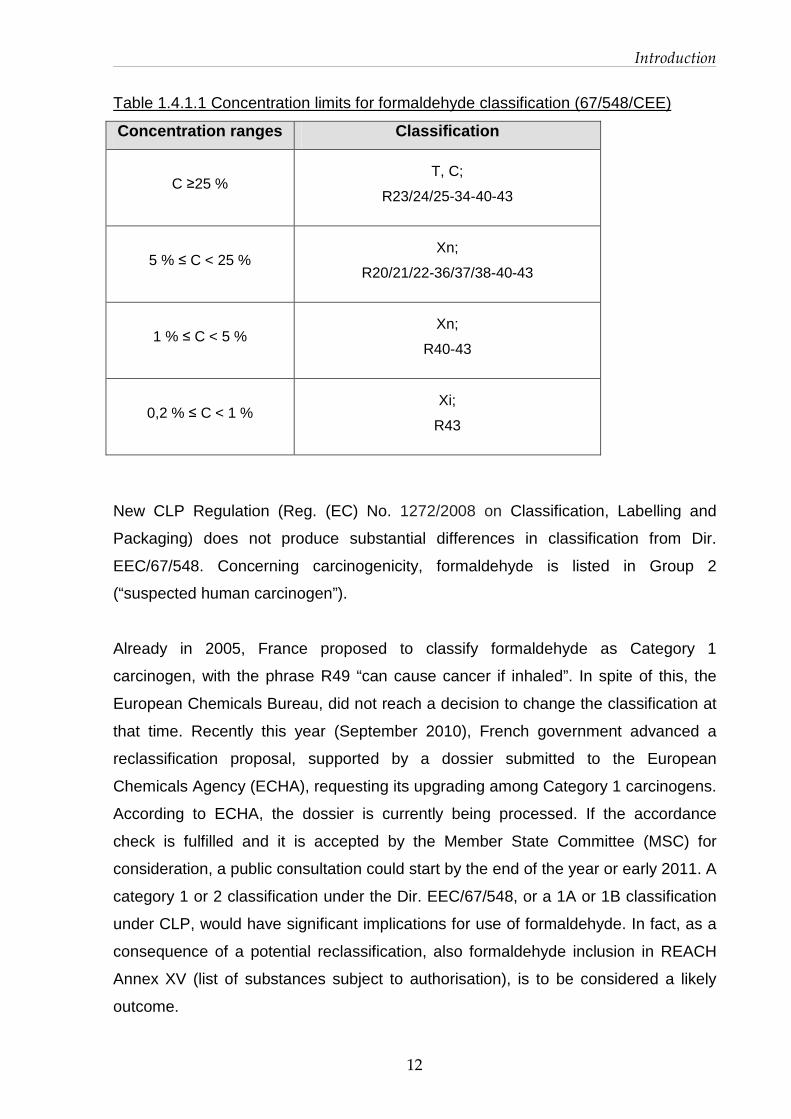
Classification of its commercialised products depends on concentration range. In
table 1.4.1 specific concentration limits are reported.
Introduction
12
Table 1.4.1.1 Concentration limits for formaldehyde classification (67/548/CEE)
Concentration ranges Classification
C ≥25 %
T, C;
R23/24/25-34-40-43
5 % ≤ C < 25 %
Xn;
R20/21/22-36/37/38-40-43
1 % ≤ C < 5 %
Xn;
R40-43
0,2 % ≤ C < 1 %
Xi;
R43
New CLP Regulation (Reg. (EC) No. 1272/2008 on Classification, Labelling and
Packaging) does not produce substantial differences in classification from Dir.
EEC/67/548. Concerning carcinogenicity, formaldehyde is listed in Group 2
(“suspected human carcinogen”).
Already in 2005, France proposed to classify formaldehyde as Category 1
carcinogen, with the phrase R49 “can cause cancer if inhaled”. In spite of this, the
European Chemicals Bureau, did not reach a decision to change the classification at
that time. Recently this year (September 2010), French government advanced a
reclassification proposal, supported by a dossier submitted to the European
Chemicals Agency (ECHA), requesting its upgrading among Category 1 carcinogens.
According to ECHA, the dossier is currently being processed. If the accordance
check is fulfilled and it is accepted by the Member State Committee (MSC) for
consideration, a public consultation could start by the end of the year or early 2011. A
category 1 or 2 classification under the Dir. EEC/67/548, or a 1A or 1B classification
under CLP, would have significant implications for use of formaldehyde. In fact, as a
consequence of a potential reclassification, also formaldehyde inclusion in REACH
Annex XV (list of substances subject to authorisation), is to be considered a likely
outcome.
Introduction
13
As regards other aspects of REACH Regulation it is not considered “Persistent
Bioaccumulating Toxic (PBT)” or “very Persistent very Bioaccumulating (vPvB)”
substance, while being a High Production Volume Chemical (HPVC) its deadline for
REACH registration is 30th November 2010 (its dossier has already been submitted).
Formaldehyde is not listed in the Annex I of Regulation (EC) No 689/2008 (export
and import of dangerous chemicals regulation), nor on a priority list for risk
assessment. However, formaldehyde is banned from use in certain applications
(preservatives for liquid-cooling and processing systems, slimicides, metalworking-
fluid preservatives, and antifouling products) under the Biocidal Products Directive
(Directive 98/8/EC).
1.4.2 IARC and US classification
In 2004, based on observed excess risk of nasopharyngeal cancers in the
considered cohorts, the International Agency for Cancer Research (IARC)
reclassified formaldehyde as carcinogen to humans in Group 1 (Cogliano, 2005,
IARC 2006). In October 2009, IARC concluded on the basis of the outcomes from
cohort studies, that there is sufficient evidence for a causal association between
formaldehyde and leukemia.
Outside EU, other re-considerations of formaldehyde classification regarding
carcinogenicity have taken place in last year. In particular, in United Stated, on
January 2010 the Department of Health and Human Service re-classified
formaldehyde from “reasonably anticipated to be a human carcinogen” to ‘known
human carcinogen’ through its National Toxicology Program (NTP).
In addition, last June, the US Environmental Protection Agency (US EPA) released
for public consultation a draft report wherein it is affirmed that sufficient
epidemiological evidence to consider formaldehyde ‘carcinogenic to humans by the
inhalation route of exposure’ both exists for naso-pharyngeal and lympho-
hematopoietic cancers. Public consultation was expected to be closed within 3
months (September 2010), nevertheless, no news has been posted on EPA website
to date (November 2010). Currently, official EPA classification regarding
carcinogenicity is B1, “probable carcinogen”.

Introduction
14
1.5 Project objectives
The project has been developed around two major purposes.
The first one has been to perform a hazard characterisation of formaldehyde in order
to calculate health-based reference exposure limits for concentrations in indoor air.
This study has been carried out participating at European Project “INDEX UPRIC
2009” funded by DG SANCO.
The first edition of the project INDEX “Critical Appraisal of the Setting and
Implementation of Indoor Exposure Limits in the EU”, funded by DG SANCO in 2004,
aimed to perform risk assessments for several pollutants typical of indoor
environments and the proposal of reference limit of exposure and/or risk
management measures (Kotzias et al, 2005). Outcomes have contributed to the
development of strategies at EU level for indoor air quality management. In 2009, DG
SANCO re-funded an update of the project, with particular regards to formaldehyde.
INDEX-UPRIC (UPdate of PRIority compounds) aimed to review recent scientific
data in order to re-consider reference values proposed in 2005. From selected results
of scientific literature and an innovative approach in uncertainty factors application,
new reference limits have been calculated for formaldehyde in indoor settings and
proposed at EU level.
The second objective of the project has based its rationale from the outcomes of
INDEX project. From the hazard characterisation of formaldehyde, it seems that
recurrent, short-term, peak exposures, rather than exposure to constant levels, are
expected to adversely affect eyes and upper airways in exposed subjects. Secondly,
exposure to formaldehyde in occupational settings, and particularly in Pathology labs,
seems to be characterised by marked fluctuations and peaks of concentration. To
perform a correct exposure assessment in Pathology Units, and to eventually
associate exposure levels with health effects, an in-depth understanding of exposure
is a requirement. The project aimed to reach this goal through the development of
detailed Exposure Scenarios and the comprehension of concentration fluctuations
during specific tasks in Pathology Units of two different hospitals.

15
Materials and
Methods
2.1 European Project INDEX-UPRIC 2009
2.1.1 Literature review
An extensive literature review of the period 2004-2009 about crucial topics regarding
formaldehyde has been carried out. Also relevant previous studies and reviews were
reconsidered. Data have been searched for formaldehyde exposure (especially on
community surveys) and health effects by inhalation (both on volunteers and
animals). Epidemiological data concerning carcinogenicity have been taken into
account as well. A particular attention has been paid to reports published by national
or international institutions. Due to their use for risk assessment and for exposure
limits calculation by several institutions, surveys at the workplace have been carefully
evaluated.
Web search of scientific papers about formaldehyde health outcomes and cohort
studies has been based mostly on digital archives PubMed and Web of Science. Key
words of the search have been “formaldehyde toxicology”, “formaldehyde irritation”,
“formaldehyde effects”, “formaldehyde asthma” and “formaldehyde cohort”. To seek
for exposure levels among population both above-mentioned archives and Google
have been used. Key words have been “formaldehyde surveys”, “formaldehyde
exposure”, “and formaldehyde indoor”. Web sites of major national and international
organisations have been consulted looking for reports, evaluations, if present, the
classification proposed and any other relevant news or communication on
formaldehyde. Workplace surveys have been initially identified from the bibliography
of organisation reports; further the search has deepened following usual scientific

Materials and Methods
16
archives cited above with key words “formaldehyde work exposure” and
“formaldehyde monitoring”. Also a number of in-silico studies have been considered,
since when their significance appeared from the literature review.
Following the search, relevant literature has been catalogued. International
organisation guidelines together with scientific reviews and risk evaluations have
been separately summarised by:
� health outcome:
o toxicological effect except cancer and
o carcinogenicity;
� setting:
o indoor (home, kindergarten or office) or
o occupational.
Relevant scientific papers such as human, animal and in-silico studies have been
arranged by condition (controlled or uncontrolled exposure) and by outcomes:
� health effect on humans, excluding carcinogenicity:
o subjective discomfort,
o signs of irritation of eyes and upper airways,
o pulmonary function,
o occurrence of asthma or hypersensitivity (hyperreactive airways?),
o genotoxicity;
o histopathological changes;
� health effect on animals, excluding carcinogenicity:
o histopathological/biochemical changes in nasal tissues,
o pulmonary function,
o genomic signature;
� In-silico studies.

Materials and Methods
17
2.1.2 Calculation of reference exposure values
The derivation of reference exposure values has been based on recent human and
animal studies. The choice of pivotal studies has been based on the following
parameters.
First, the study must have been conducted under well defined and controlled
conditions, especially with respect to air concentrations of formaldehyde and length
of exposure (via inhalation. Second, health outcomes investigated have to be
unequivocally attributed to formaldehyde exposure, to be extensively documented,
and to occur at low levels of exposure (most sensitive endpoint).
The endpoint chosen was irritation of eyes (in humans) or upper airways, especially
nose tissues (in animals). Eye irritation in humans has been measured with two
parameters, conjunctival redness and eye blinking frequency (Lang et al, 2008).
Irritation of upper airways is deemed to be due to sensory irritation caused by the
direct stimulation of the trigeminal nerve endings of the upper respiratory tract. This
effect is measured as the decreases in respiratory rate in mice (Nielsen et al, 1999).
In rats irritation signs have been identified as inflammatory infiltrates development at
various nasal tissues (Andersen et al, 2008).
Based on these criteria, two animal (on mice and rats) and one human study have
been chosen for formaldehyde hazard assessment (characterisation)
To calculate reference exposure values, chemical-specific uncertainty factors (also
known as assessment factors) have been applied as described in a document
published by World Health Organization International Programme on Chemical
Safety (IPCS, 2006) to toxicological endpoint values such as NOAELs or LOAELs.
This report present several indications for the use of adjustment or uncertainty factors
in the calculation of health-base exposure limits for chemical substances. It
distinguishes and assigns different weights to toxicokinetic and toxicodynamic
components. As depicted in figure 2.1.3.1, the default uncertainty factor used to set
exposure limits for general population accounts for both inter-species (factor of 10)
and inter-individual differences (factor of 10) evenly. Here specific weights are given
for the toxicodynamic and toxicokinetic components, accounting for inter-species or
inter-individual variability.

Materials and Methods
18
Figure 2.1.2.1 Different weights for toxicokinetic and toxicodynamic components from
WHO, Harmonisation Project Document No. 2, 2005.
Further, warnings are given on the nature of chemical. Particularly, a Chemical
Specific Assessment Factor (CSAF) should be applied, and has to be determined by
the chemical-specific data. It is reported that “an inter-species factor could be less
than 1 if humans had lower target tissue exposure to the active chemical moiety for
the same external dose or showed lower tissue sensitivity”.
Default UNCERTAINTY FACTOR for general population: 100
INTER-SPECIES DIFFERENCES 10
INTERINDIVIDUAL DIFFERENCES 10
TOXICO- DYNAMIC
2.5
TOXICO- KINETIC
4.0
TOXICO- KINETIC
3.16
TOXICO- DYNAMIC
3.16

Materials and Methods
19
2.2 Exposure characterisation and scenarios in hosp itals
2.2.1 Identification of uses and exposure determina nts
Exposure characterisation of formaldehyde in a Pathology Unit has started from the
building of Exposure Scenarios. An Exposure Scenario is “a set of information
describing the conditions under which the risks associated with the identified use(s)
of a substance can be controlled. It includes operational conditions (for example the
duration and frequency of use or the amount used, the process temperature or the
pH) and necessary risk management measures (e.g. local exhaust ventilation or a
certain type of glove, waste water and waste gas treatment)”. It is an iterative process
which is part of the Chemical Safety Assessment (CSA) under REACH Regulation. In
particular, the preparation of Exposure Scenarios is mandatory for the registration
when a substance is manufactured or imported in quantities of 10 tonnes per year
and above and classified as dangerous or as PBT (Persistent Bioaccumulative Toxic)
or vPvB (very Persistent very Bioaccumulative). Relevant exposure scenarios will be
annexed to the Safety Data Sheets that will be supplied to downstream users and
distributors.
This part of the work has been based on REACH Regulation Technical Guidance,
particularly on the document “Guidance on information requirements and chemical
safety assessment - Part D: Exposure Scenario Building” (ECHA, 2008).
The two hospitals chosen for the purpose are located on the territory of the
municipality of Milan. Pathology Units presents differences in size, number of
operators occupied, instruments and organisation adopted. Nevertheless, the same
checklist (based on REACH technical guidance) has been applied during interviews
with personnel (pathologists, students, technicians and other attendants).
At first, uses of formalin within the unit have been identified: all direct tasks, which
involve the handling of formalin (i.e. inclusion of specimens in formalin, dilution,
disposal, etc) and indirect, which do not bring the operator to the direct handling of
formalin (i.e. colouration, inclusion in paraffin, etc) have been recognised from
dilution, to its disposal. For each one of them a description of the activity is given and,
when possible, of exposure determinants such as concentration, frequency, quantity,
duration, existent mitigation measures (i.e. ventilation, extracting devices or chemical
hood) and observations noted during the first inspection. Further, each room

Materials and Methods
20
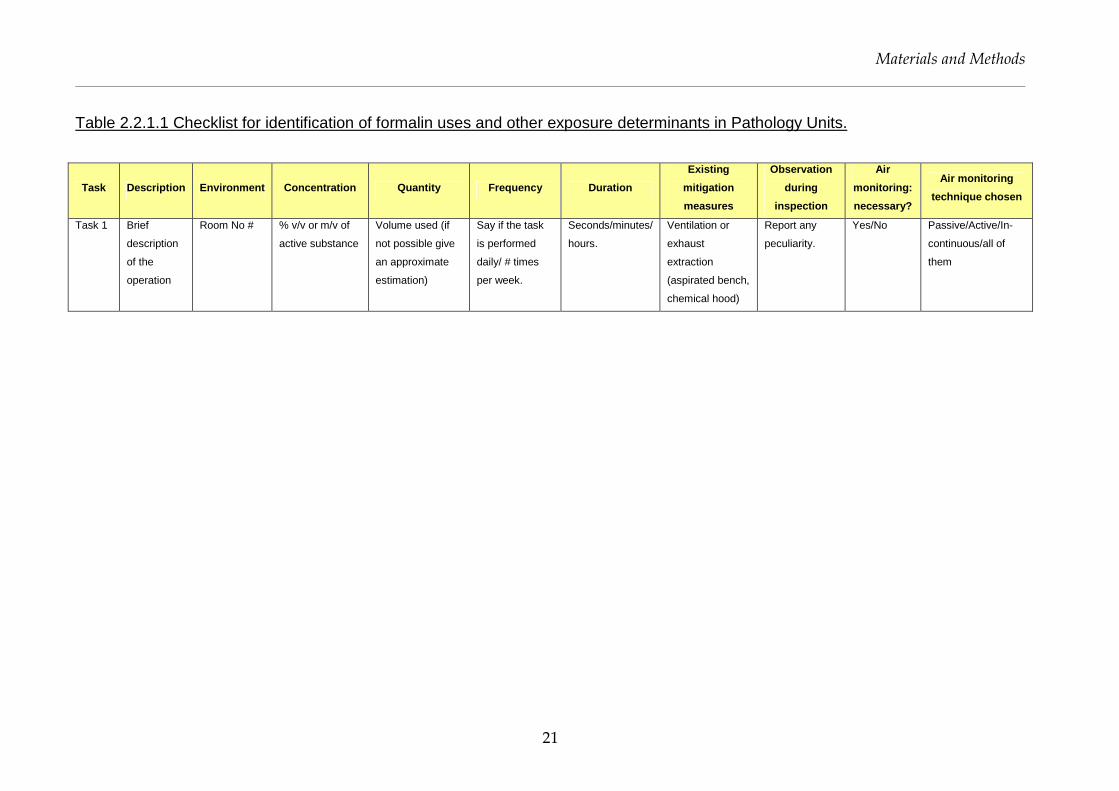
interested by the use of formalin has been numbered. The checklist headlines are
reported in table 2.2.1.1.
Based on the exposure determinants and conditions of use, it has been possible to
identify some uses as critical for operator exposure. Particular attention has been
paid to those tasks in which there is a direct use of formalin. In fact, the monitoring
survey has been planned to measure air concentrations during selected, critical
tasks, where possible one by one, trying to avoid overlapping. In such a way, air
levels of formaldehyde and their fluctuations can be better understood and
associated to single tasks.
Materials and Methods
21
Table 2.2.1.1 Checklist for identification of formalin uses and other exposure determinants in Pathology Units.
Task Description Environment Concentration Quantity Frequency Duration
Existing
mitigation
measures
Observation
during
inspection
Air
monitoring:
necessary?
Air monitoring
technique chosen
Task 1 Brief
description
of the
operation
Room No # % v/v or m/v of
active substance
Volume used (if
not possible give
an approximate
estimation)
Say if the task
is performed
daily/ # times
per week.
Seconds/minutes/
hours.
Ventilation or
exhaust
extraction
(aspirated bench,
chemical hood)
Report any
peculiarity.
Yes/No Passive/Active/In-
continuous/all of
them

Materials and Methods
22
2.2.2 Air monitoring techniques
The air sampling techniques measuring formaldehyde are crucial to perform an
Exposure Characterisation. To date, traditional air monitoring for the measurement of
formaldehyde levels, have been mostly conducted using both active and passive
devices. Those methods can provide air concentrations as Time Weighted Average
(TWA), over 15-20 minutes with active devices and over hours to days when using
passive techniques. Thus, traditional air monitoring may not be able to identify short-
term concentration fluctuations typical of pathology labs. In-continuous gas sampler
could present an effective method to depict formaldehyde fluctuations and peaks in
laboratories. To conduct a detailed monitoring and to assess the suitability of different
sampling methods, a simultaneous air monitoring utilising three techniques has been
planned.
Since the beginning of the project, the use of a sampling method capable to depict
the extent of concentration peaks and exposure variability has been taken into
account. To do this, a brief literature search has been carried out, and some
companies have been consulted. Three detection techniques have been carefully
considered: Photo-acoustic gas monitor, infrared sampler, electro-chemical cells. The
latter has been considered at first, but it has been discounted due to the difficulties in
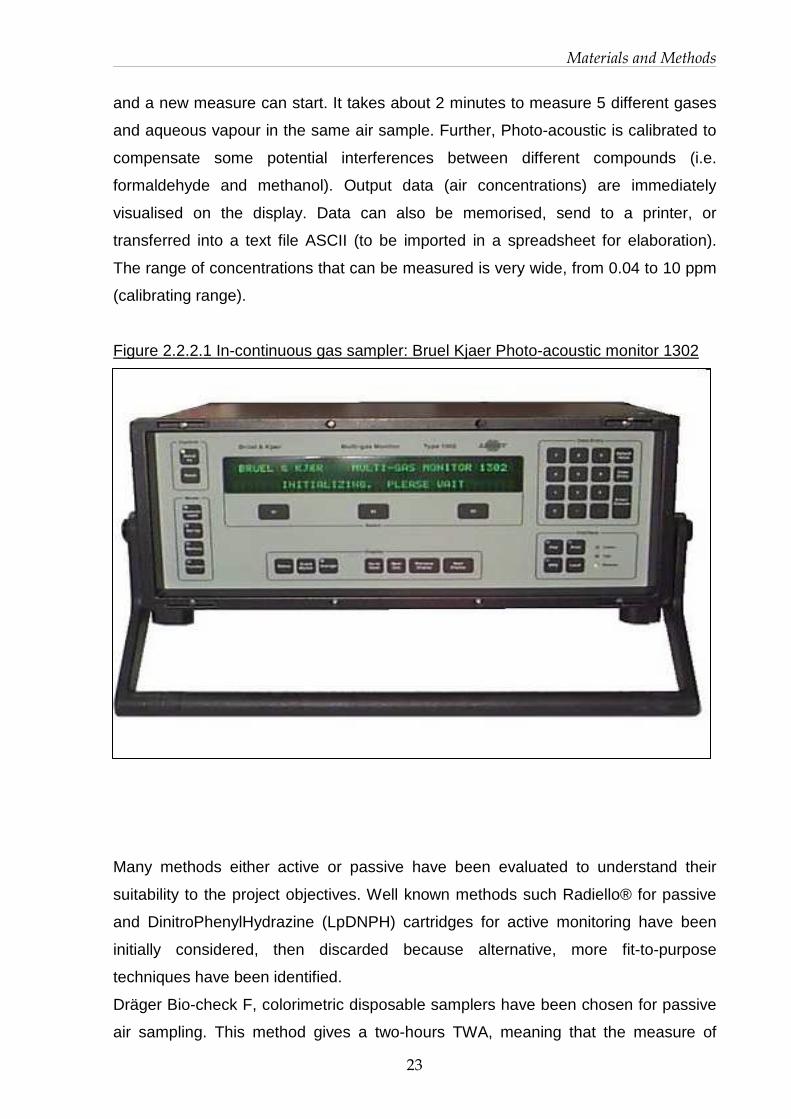
device calibration. Bruel Kjaer 1302 photo-acoustic gas monitor (following Photo-
acoustic) has then been chosen. It presents several remarkable characteristics. It is a
quantitative gas analyser, controlled by a microprocessor, and it works as in-
continuous detector for several gases (depending on the filters chosen). It gives real
time concentrations within 120 seconds or less, thus it is very likeable to detect peak
levels. The measurement is based on the principle of photo-acoustic/infra-red
detection method, in particular on the capability of the molecules to absorb energy as
infra-red light and release it in the form of heat (with vibrational motions). An air
sample is drawn and sealed into an analysis cell inside the instrument. The light
produced passes through an optic filter, which selects the proper wave length to be
transmitted to the cell. One single wave length is thus transmitted at a given instant.
When the light emitted is absorbed, selectively, by the gas, its temperature rises. As
the light is pulsing, gas temperature rises and decreases causing a pressure
variation. Therefore, an acoustic signal proportional to the gas concentration is
produced. Two microphones are present inside the cell to detect the signal. When a
certain gas measuring is done, a rotation of the whirl on which filters are fixed occurs
Materials and Methods
23
and a new measure can start. It takes about 2 minutes to measure 5 different gases
and aqueous vapour in the same air sample. Further, Photo-acoustic is calibrated to
compensate some potential interferences between different compounds (i.e.
formaldehyde and methanol). Output data (air concentrations) are immediately
visualised on the display. Data can also be memorised, send to a printer, or
transferred into a text file ASCII (to be imported in a spreadsheet for elaboration).
The range of concentrations that can be measured is very wide, from 0.04 to 10 ppm
(calibrating range).
Figure 2.2.2.1 In-continuous gas sampler: Bruel Kjaer Photo-acoustic monitor 1302
Many methods either active or passive have been evaluated to understand their
suitability to the project objectives. Well known methods such Radiello® for passive
and DinitroPhenylHydrazine (LpDNPH) cartridges for active monitoring have been
initially considered, then discarded because alternative, more fit-to-purpose
techniques have been identified.
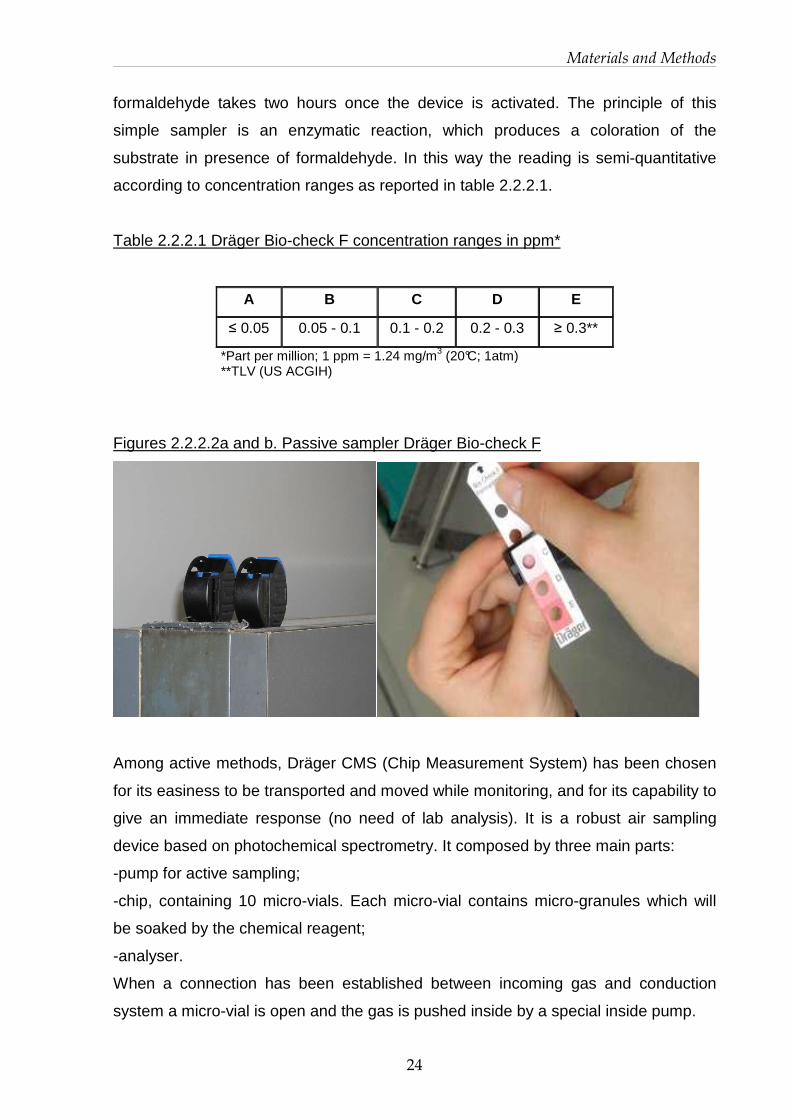
Dräger Bio-check F, colorimetric disposable samplers have been chosen for passive
air sampling. This method gives a two-hours TWA, meaning that the measure of
Materials and Methods
24
formaldehyde takes two hours once the device is activated. The principle of this
simple sampler is an enzymatic reaction, which produces a coloration of the
substrate in presence of formaldehyde. In this way the reading is semi-quantitative
according to concentration ranges as reported in table 2.2.2.1.
Table 2.2.2.1 Dräger Bio-check F concentration ranges in ppm*
A B C D E
≤ 0.05 0.05 - 0.1 0.1 - 0.2 0.2 - 0.3 ≥ 0.3**
*Part per million; 1 ppm = 1.24 mg/m3 (20°C; 1atm) **TLV (US ACGIH)
Figures 2.2.2.2a and b. Passive sampler Dräger Bio-check F
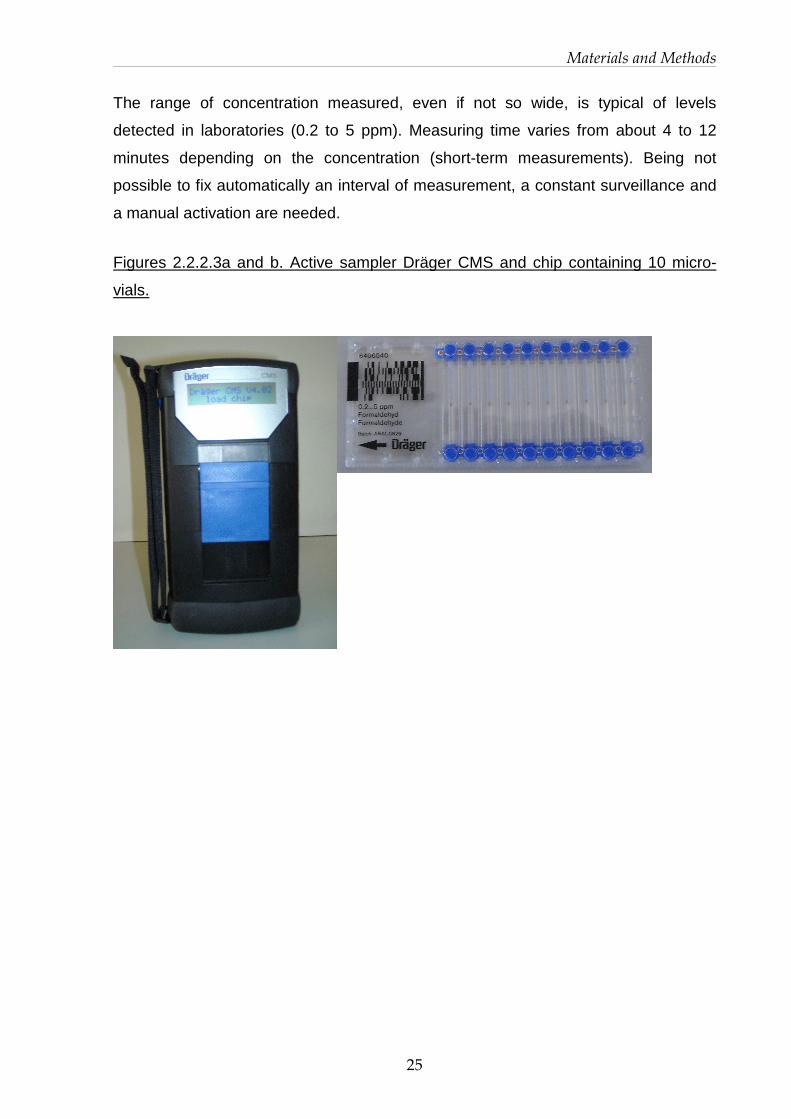
Among active methods, Dräger CMS (Chip Measurement System) has been chosen
for its easiness to be transported and moved while monitoring, and for its capability to
give an immediate response (no need of lab analysis). It is a robust air sampling
device based on photochemical spectrometry. It composed by three main parts:
-pump for active sampling;
-chip, containing 10 micro-vials. Each micro-vial contains micro-granules which will
be soaked by the chemical reagent;
-analyser.
When a connection has been established between incoming gas and conduction
system a micro-vial is open and the gas is pushed inside by a special inside pump.
Materials and Methods
25
The range of concentration measured, even if not so wide, is typical of levels
detected in laboratories (0.2 to 5 ppm). Measuring time varies from about 4 to 12
minutes depending on the concentration (short-term measurements). Being not
possible to fix automatically an interval of measurement, a constant surveillance and
a manual activation are needed.
Figures 2.2.2.3a and b. Active sampler Dräger CMS and chip containing 10 micro-
vials.

Materials and Methods
26
2.2.3 Monitoring campaigns setting
Preliminary screening
A preliminary monitoring survey has been conducted at University Hospital Luigi
Sacco. This survey had the purpose to inspect the labs, to interview the personnel
and identify tasks and exposure determinants. It included also a preparatory
screening of formaldehyde concentration by ambient and personal sampling. Dräger
Bio-check F passive sampler has been used to detect two-hours TWA in three
rooms: dissection room, central laboratory (where various operations occur) and the
archive located in the basement.
Exposure modeling exercise
Before starting with monitoring campaigns, exposure estimation has been carried out
utilising the software ConsExpo 4.1 (see description in Appendix A). Input data
inserted try to simulate a plausible routine task which could be pouring a certain
amount of formalin from a container in dissection room. Results of the exposure
estimation have been then compared with level of formaldehyde measured in
laboratories, in particular with those found in dissection room of University Hospital L.
Sacco. Input data and outcomes of the exercise have been reported in Appendix A.
Testing of the three techniques
Before starting the paired monitoring with the three techniques, an experiment has
been conducted in order to test the three instruments during the same situation. The
test consisted in measuring environmental levels of formaldehyde following formalin
pouring into an exposure room. It has been conducted in a laboratory provided with
two chemical extraction hoods. The first one has been sealed with plastic paper and
kept switched off to work as exposure room; the other one has been switched on in
order to ensure safe conditions in the lab. Environmental conditions, i.e. ventilation
and temperature, have been kept under control until the test ended.
A known amount of formalin (4% m/v formaldehyde) has been poured on filter paper
in a container under an extraction hood used as exposure room. Another chemical
extraction hood was switched on in order to ensure safe conditions in the lab.
Photo-acoustic, CMS and Bio-check F samplers have been placed inside the
exposure room and started monitoring air concentrations. Formaldehyde levels were

Materials and Methods
27
expected to follow the dilution model described in the formula below (Clausen et al,
1993).
Where:
A: (area of emitting surface) [m2]
M0: (initial mass) [mg];
k1= emission rate [m2/m3];
k2: air exchange rate [1/t];
V: room volume [m3].
Data detected by photo-acoustic method fit a decay model (see Appendix B). As
expected CMS and Bio-check F samplers, gave TWA results, and were in good
accordance with photo-acoustic measurements.
During this test a problem with CMS sampler has come out. Some chips were not
able to read the ‘blank’, namely concentration below detection limit (0.2 ppm). In a
“control” room, where exposure to formaldehyde levels are expected to be
exceedingly low, values higher than 0.2 ppm have been measured, a sort of “false
positive”. The supplier consulted deemed that it must have been a single chip rather
than a whole apparatus problem.
Thus, to guarantee a sound use of the instrument and reliable results a method for
chip selection has been set up. Prior to be used for monitoring purposes, at least
blank reading for 2 vials each chip (on 10 vials) is required. Chips which gave one
false positive have been discarded.
Monitoring surveys
Two monitoring surveys have been planned in the two hospitals. Taking into account
exposure determinants, tasks identified as critical have been selected for the
monitoring with the three techniques. Other tasks or situation not expected to present
high exposure levels have generally been monitored with passive sampler Bio-check
F only. The careful surveillance of the operation during the measurement has
permitted to notice and record any peculiar circumstance as well as potential
)21
(10
12
kkV
tke
tke
kMAt
C−
−−
−
⋅⋅⋅=
Materials and Methods
28
misuses, or even accidental situation (i.e. pouring formalin on the floor or on the
bench). Concentrations detected have then been compared to the Threshold Limit
Value (TLV) for occupational exposure to formaldehyde adopted by the American
Conference of Industrial Hygienists (ACGIH). A detailed Exposure Scenario for each
use identified as critical, namely those tasks where concentrations clearly exceeded
TLV-C (or at least for some of them taken together), has been built up and Risk
Management Measures (RMMs) addressed specifically.
Materials and Methods
29
2.2.4 Data elaboration
Principle Component Analysis (PCA) has been used as an exercise on data obtained
from the survey carried out at the University Hospital L. Sacco. Data from the
monitoring at National Cancer Institute had a surplus of non-parallel measurements,
rendering this type of analysis unreliable because of the poor level of variability of the
data. The statistical unit used in the PCA data matrix has been the timing of
measurement (sampling) by the three techniques. Only time units having all three
measures have been analysed.
The aim of the PCA has been twofold: (a) to investigate the correlation among the
outputs given by the three sampling methods and, (b) to see the profiles obtained for
the three sampling techniques per task type. Bio-check F classes have been
assigned as quantitative values, choosing representative values of 0.075 ppm for
class B, 0.25 ppm for class D and 0.3 ppm for class E.
Data obtained with CMS and Bio-check F methods have been paired to each
measurement obtained with Photo-acoustic. The PCA has then been applied to the
matrix of the differences between measures and the ACGIH TLV set for
formaldehyde. The graphical display chosen has been the biplot, in which the x and y
axes are a linear combination of the three measurements and the vectors reflect the
behaviour of the original values in the new orthogonal axes. The origin represents the
TLV. Each point is a bi-dimensional representation of one moment in time, when
measurements have been taken while a certain task was performed. Each task has
been given a number that was used to label the points and this allowed comparisons
of measurements according to task by projecting the single point onto the vectors. In
fact, when the barycentre of each group of tasks is projected onto the vectors, the
average profile of the task is obtained. Charts and outcomes are reported and
discussed in Appendix C. The software used for the analysis has been XLSTAT
Version 2010.5.08 - Copyright Addinsoft 1995-2010.

30
Results
3.1 European Project INDEX-UPRIC 2009
3.1.1 Levels of exposure among general population
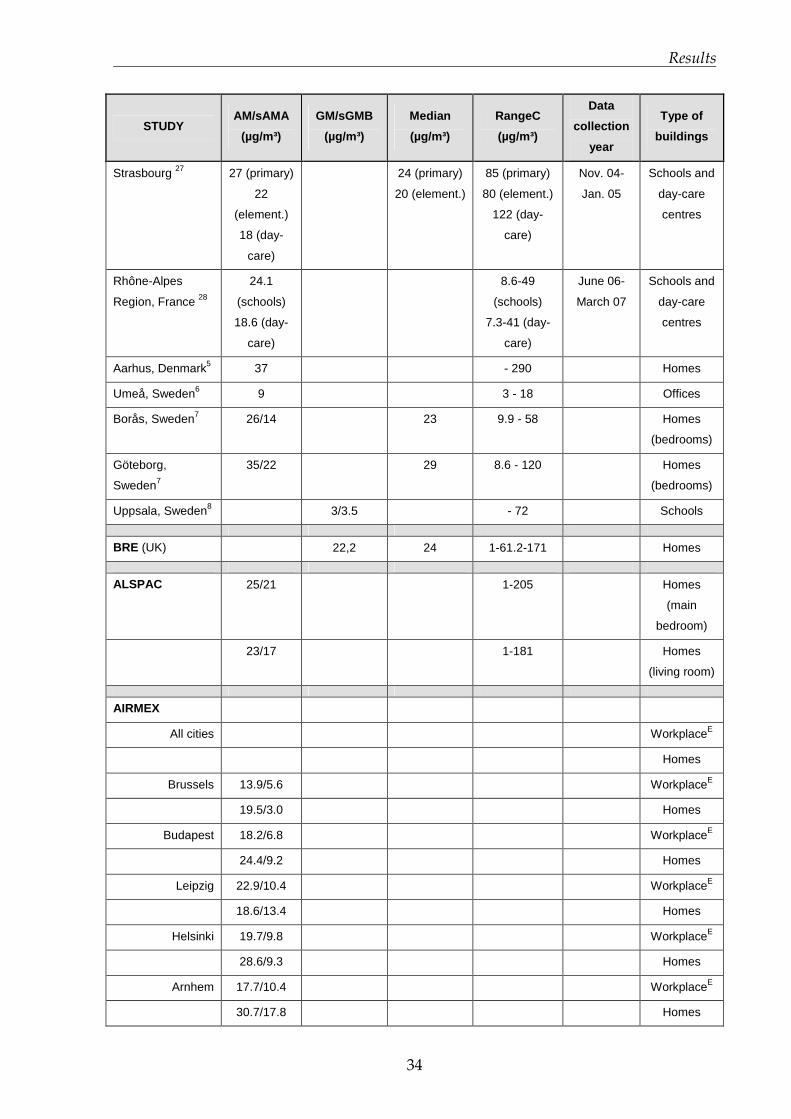
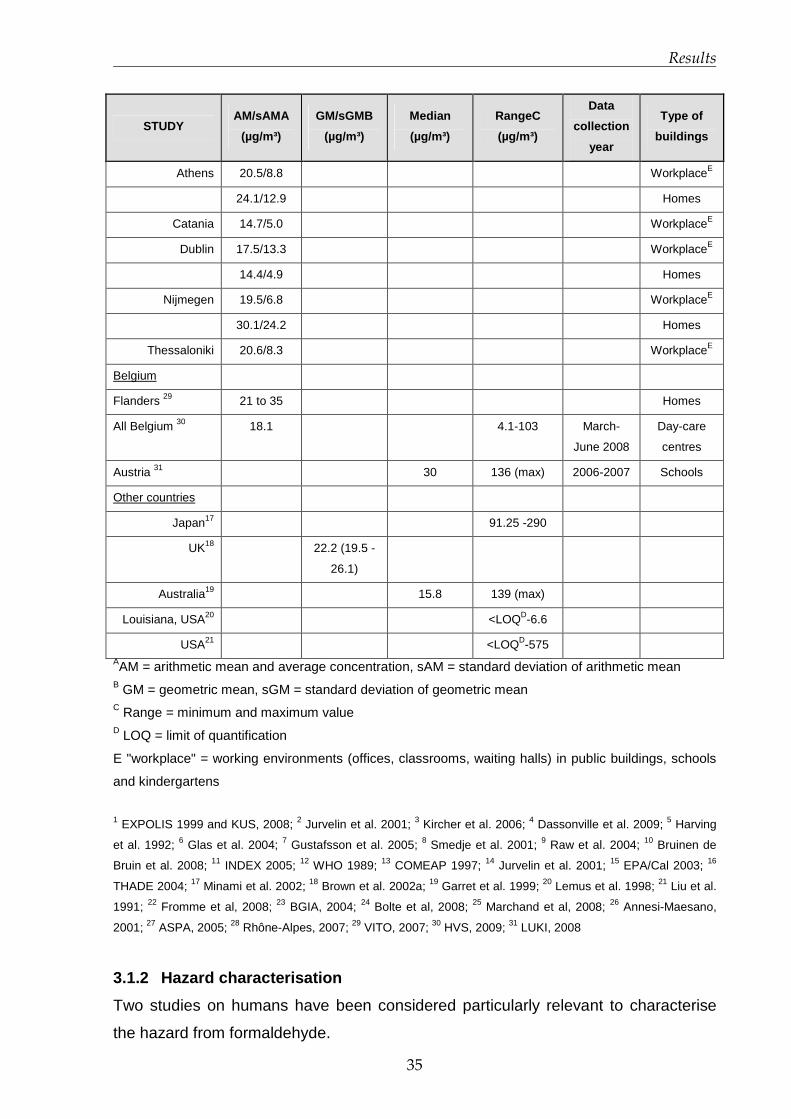
Results of the indoor air formaldehyde measurements in 21 studies representing
mostly Europe but including also North America, Australia and Japan are
summarised in Table 3.1.1.1.
Between 2003 and 2005 the French Observatory on indoor air quality (OQAI) carried
out a large monitoring survey in 567 dwellings randomly selected (Kirchner et al,
2006). Formaldehyde median indoor concentration, 95th percentile and maximum
value of 7-day passive sampling in the bedroom (n=554) were respectively 19.6, 46.7
and 86.3 µg/m3 (15.8, 37.7 and 69.6 ppb respectively). Still in France, aldehyde
concentrations were measured through active sampling (duration of measuring varied
from 30 to 95 min) in 162 homes in the Strasbourg area, in the frame of a case-
control study pairing asthmatic and non-asthmatic people (Marchand et al, 2008).
Measured formaldehyde mean indoor concentration was 32.2 ± 14.6 µg/m3 (26 ±
11.8 ppb).
In Germany, children’s bedrooms in 555 dwellings located in 150 cities were
monitored by passive sampling during one week, between May 2003 and May 2006
(KUS, 2008). The geometric mean, the 95th percentile and the maximum value of
formaldehyde indoor concentration, (n=586) were respectively 23.3, 47.7 and 68.9
µg/m3 (18.8, 38.5 and 55.6 ppb). These levels were lower than the respective
concentrations measured in the past years in the frame of the German Environmental
Survey (GerES I 1985/86).

Results
31
In Belgium, a measuring survey was carried out in 50 dwellings in the frame of the
FLIES project (Flanders Indoor Exposure Survey) in January and February 2006
(VITO, 2007). Indoor formaldehyde mean concentrations in bedrooms and living
rooms were 35, 37 and 21 µg/m3 (28.2, 29.8 and 16.9 ppb) in urban areas, hot spots
and rural areas respectively.
Much less information is available for formaldehyde levels in offices compared to
residential settings. A large monitoring survey in offices was carried out in Germany
between 2001 and 2004 in 419 rooms: a median indoor concentration of 28 µg/m3
(22.6 ppb) was measured (BGIA, 2004). Over the period 2004-2007, the Joint
Research Centre of the EC carried out the monitoring of priority pollutants for indoor
air quality, including formaldehyde within the frame of the Indoor Air Monitoring and
Exposure Assessment Project (AIRMEX) (Kotzias et al, 2009). The survey included
monitoring in European public buildings and environments where children frequently
stay, like schools and kindergartens. Formaldehyde concentrations in offices of public
buildings (n=94) ranged from 3 to 33 µg/m3 (from 2.4 to 26.6 ppb).
Measurements of formaldehyde indoor levels in schools and kindergartens in many
European countries are available. In France, in the frame of the study ISAAC
(International Study on Asthma and Allergies in Childhood), formaldehyde was
measured in 401 classrooms of 108 schools located in six cities in 1999 (Strasbourg,
Creteil, Reims, Marseille, Bordeaux, Clermont-Ferrand) (Annesi-Maesano et al,
2001). Concentrations ranged from 4 to 100 µg/m3 (from 3.2 to 80.6 ppb) with a
mean value of 27 µg/m3 (21.8 ppb). In 50 Parisian kindergartens studied between
1999 and 2001, both in winter and summer seasons (n=222), indoor formaldehyde
concentrations ranged from 1.5 to 56 µg/m3 (from 1.2 to 45.2 ppb) with a median
value equal to 14 µg/m3 (11.3 ppb) (Domsic and Squinazi, 2001). In Strasbourg,
formaldehyde concentrations have been measured through passive sampling during
48h in 111 schools (n=384 classrooms) and 33 day-care centres (n=142 rooms)
between November 2004 and January 2005 (ASPA, 2005). Mean indoor
formaldehyde concentrations were respectively 27 µg/m3 (21.8 ppb) in primary
schools, 22 µg/m3 (17.8 ppb) in elementary schools, and 18 µg/m3 (14.5 ppb) in day-
care centres. Similarly, in the Rhône-Alpes region, formaldehyde concentrations have

Results
32
been measured by passive samplers during 4,5 days in 28 schools and 22 day-care
centres (n=150 rooms) between June 2006 and March 2007 (Rhône-Alpes, 2007).
Mean indoor formaldehyde concentration was higher in schools than in day-care
centres 24.1µg/m3 (19.4 ppb) versus 18.6 µg/m3 (15 ppb).
In Germany, in the region of South Bavaria the indoor air quality was evaluated in 92
classrooms in winter 2004-2005 and in 75 classrooms in summer 2005. Indoor
formaldehyde concentrations ranged from 3.1 to 46.1 µg/m3 (from 2.5 to 37.2 ppb)
(Fromme et al, 2008).
In Belgium, Hainaut Province Sanitary Surveillance Centre carried out measurements
in 25 day-care centres (passive sampling during 48 hours) between March and June
2008 (HVS, 2009). In one of them, formaldehyde concentration was above the 100
µg/m3 (80.6 ppb) intervention value established by the Flemish Community; in 16 of
them, the formaldehyde concentration was above the 10 µg/m3 (8.1 ppb) objective
value fixed by the authorities.
In nine Austrian schools, located both in urban and rural areas, a median of 30 µg/m3
(24.2 ppb) and a maximum value of 136 µg/m3 (110 ppb) have been reported for
indoor formaldehyde concentration when sampling (active) one week long (LUKI,
2008).
Within the frame of the AIRMEX project (Kotzias et al, 2009), formaldehyde
concentrations were measured in European kindergartens located in 11 European
cities (n=57; 7 days passive sampling) between 2004 and 2007. The average
concentration of formaldehyde was 17.4 µg/m3 (14 ppb) and ranged from 1.5 µg/m3
(1.2 ppb) to 49.7 µg/m3 (40 ppb).
In the frame of BUMA project (Prioritization of Building Materials Emissions),
monitoring surveys were conducted in two Mediterranean cities (Nicosia and Athens)
in winter period, in four buildings in each city (one public building, one school and two
houses) (Bartzis et al, 2009). Indoor formaldehyde concentrations ranged between
5.8 – 43.2 µg/m3 (4.7 to 34.9 ppb). Additional results from this project are expected
soon.
In public premises one European study is mentioned. In Germany, active sampling of
indoor air was conducted for 4 hours during the main visiting hours in 28 premises in

Results
33
the cities of Augsburg and Munich, from April 2005 to May 2006 (Bolte et al, 2008).
Median levels of formaldehyde were 17 µg/m3 (13.7 ppb) in restaurants and cafés
(n=11), 17 µg/m3 (13.7 ppb) in pubs and bars (n=7), and 47.0 µg/m3 (37.9 ppb) in
discotheques (n=10) (no smoke-free legislation).
Table 3.1.1.1. Indoor exposures to formaldehyde and attribution to sources (ordered
by countries; large-scale studies are cited first and mentioned in bold characters)
STUDY AM/sAMA
(µg/m³)
GM/sGMB
(µg/m³)
Median
(µg/m³)
RangeC
(µg/m³)
Data
collection
year
Type of
buildings
GerES 1
Survey 1985/86 58.6 49.4/1.9 309 (max) Homes
Survey 1991/92 79 816 (max) Homes
Survey 2003/06 25.7 23.3 23.5 68.9 (max) 2003-2006 Homes
(children’s
bedroom)
South Bavaria,
Germany 22
3.1-46.1 Winter 04-
05 +
summer 05
Schools
Germany 23 28 76 (p95) 2001-2004 Offices
Augsburg and
Munich,Germany 24
14 (restaus)
23 (pubs)
47 (discos)
17
(restaurants)
17 (pubs)
47 (discos)
28
(restaurants)
63 (pubs)
86 (discos)
April 05-
May 2006
Public
premises
EXPOLIS 2
Helsinki 44.8 25.7 1.5-217.5 1996-1997
OQAI 3
France
19.6 (18.4-
21.0)
86.3 (max) 2003-2005 Homes
(bedrooms)
Paris4 18.6/1.8 18,4 5% - 95%: 7.5
– 45.5
Homes of
new-born
Strasbourg 25 32.2/14.6 Feb.-May
04 + Oct.
04-May 05
Homes
6-cities, France 26 27 4-100 1999 Schools
Results
34
STUDY AM/sAMA
(µg/m³)
GM/sGMB
(µg/m³)
Median
(µg/m³)
RangeC
(µg/m³)
Data
collection
year
Type of
buildings
Strasbourg 27 27 (primary)
22
(element.)
18 (day-
care)
24 (primary)
20 (element.)
85 (primary)
80 (element.)
122 (day-
care)
Nov. 04-
Jan. 05
Schools and
day-care
centres
Rhône-Alpes
Region, France 28
24.1
(schools)
18.6 (day-
care)
8.6-49
(schools)
7.3-41 (day-
care)
June 06-
March 07
Schools and
day-care
centres
Aarhus, Denmark5 37 - 290 Homes
Umeå, Sweden6 9 3 - 18 Offices
Borås, Sweden7 26/14 23 9.9 - 58 Homes
(bedrooms)
Göteborg,
Sweden7
35/22 29 8.6 - 120 Homes
(bedrooms)
Uppsala, Sweden8 3/3.5 - 72 Schools
BRE (UK) 22,2 24 1-61.2-171 Homes
ALSPAC 25/21 1-205 Homes
(main
bedroom)
23/17 1-181 Homes
(living room)
AIRMEX
All cities WorkplaceE
Homes
Brussels 13.9/5.6 WorkplaceE
19.5/3.0 Homes
Budapest 18.2/6.8 WorkplaceE
24.4/9.2 Homes
Leipzig 22.9/10.4 WorkplaceE
18.6/13.4 Homes
Helsinki 19.7/9.8 WorkplaceE
28.6/9.3 Homes
Arnhem 17.7/10.4 WorkplaceE
30.7/17.8 Homes
Results
35
STUDY AM/sAMA
(µg/m³)
GM/sGMB
(µg/m³)
Median
(µg/m³)
RangeC
(µg/m³)
Data
collection
year
Type of
buildings
Athens 20.5/8.8 WorkplaceE
24.1/12.9 Homes
Catania 14.7/5.0 WorkplaceE
Dublin 17.5/13.3 WorkplaceE
14.4/4.9 Homes
Nijmegen 19.5/6.8 WorkplaceE
30.1/24.2 Homes
Thessaloniki 20.6/8.3 WorkplaceE
Belgium
Flanders 29 21 to 35 Homes
All Belgium 30 18.1 4.1-103 March-
June 2008
Day-care
centres
Austria 31 30 136 (max) 2006-2007 Schools
Other countries
Japan17 91.25 -290
UK18 22.2 (19.5 -
26.1)
Australia19 15.8 139 (max)
Louisiana, USA20 <LOQD-6.6
USA21 <LOQD-575 AAM = arithmetic mean and average concentration, sAM = standard deviation of arithmetic mean B GM = geometric mean, sGM = standard deviation of geometric mean C Range = minimum and maximum value D LOQ = limit of quantification
E "workplace" = working environments (offices, classrooms, waiting halls) in public buildings, schools
and kindergartens
1 EXPOLIS 1999 and KUS, 2008; 2 Jurvelin et al. 2001; 3 Kircher et al. 2006; 4 Dassonville et al. 2009; 5 Harving
et al. 1992; 6 Glas et al. 2004; 7 Gustafsson et al. 2005; 8 Smedje et al. 2001; 9 Raw et al. 2004; 10 Bruinen de
Bruin et al. 2008; 11 INDEX 2005; 12 WHO 1989; 13 COMEAP 1997; 14 Jurvelin et al. 2001; 15 EPA/Cal 2003; 16
THADE 2004; 17 Minami et al. 2002; 18 Brown et al. 2002a; 19 Garret et al. 1999; 20 Lemus et al. 1998; 21 Liu et al.
1991; 22 Fromme et al, 2008; 23 BGIA, 2004; 24 Bolte et al, 2008; 25 Marchand et al, 2008; 26 Annesi-Maesano,
2001; 27 ASPA, 2005; 28 Rhône-Alpes, 2007; 29 VITO, 2007; 30 HVS, 2009; 31 LUKI, 2008
3.1.2 Hazard characterisation
Two studies on humans have been considered particularly relevant to characterise
the hazard from formaldehyde.

Results
36
One study was conducted on a group of 21 healthy volunteers exposed over a 2-
week period to different continuous levels of formaldehyde in controlled conditions,
with and without occurrences of concentration peaks, using a repeated exposure
design (Lang et al., 2008). Each subject was exposed for 4 hours to each of the 10
exposure conditions on 10 consecutive working days. Eye irritation was found to be
the most sensitive health outcome. Eye and nasal irritation were objectively observed
at continuous exposure to 0.5 ppm with peaks of 1 ppm exposure, but not at constant
exposure to 0.5 ppm. Effects reversed 16 hours after the end of the exposures. No
significant effects on nasal flow and resistance, pulmonary function and reaction
times were observed. It was concluded that a NOEL for subjective and objective eye
irritation is 0.5 ppb in case of constant exposure levels, and 0.3 ppm with peaks of
0.6 ppm in case of short-term peak exposure.
Another study was conducted on asthmatic volunteers in controlled conditions to
evaluate the influence of pre-exposure to low-dose formaldehyde (100 µg/m3, 0.08
ppm, for 30 min) on bronchial response to a mite allergen (Casset et al. 2006).
Subjects exposed to formaldehyde developed an immediate bronchial response at a
significantly lower dose of mite allergen than after air exposure, suggesting that
formaldehyde, in some way, might be involved in asthma exacerbation.
Concerning toxicity in animals, two studies in particular addressed the time-effect
relationships of formaldehyde concentrations on airways.
In the first study (Nielsen et al. 1999), several irritation and respiratory parameters
(such as air flow limitation or broncho-constriction patterns) in relation to
formaldehyde exposure of the duration of 30 minutes were monitored in mice. A
NOEL value of 0.3 ppm was established for sensory irritation from the `just
detectable effect' (JDE) method described by authors. They deduced that at low
concentrations adverse effects are due to trigeminal nerve stimulation.
In a more recent study (Andersen et al, 2008) rats were exposed to formaldehyde 6
hours per day, 5 days per week, up to 3 weeks. Endpoints considered included
inflammatory infiltrate, epithelial hyperplasia and genomic signature in nasal epithelial
tissues of rats. Inflammatory response was observed starting from 0.7 ppm (LOAEL),
while a trend toward altered gene expression was observed between 0.7 and 2 ppm.
As regards cell proliferation no effect was found below 2 ppm.
Results
37
Documents published by international institutions are summarised and reviewed in
Appendix D, Table A, while in Appendix D, Table B a summary of the most significant
effects due to exposure to formaldehyde on humans and animals (excluding
carcinogenicity) is reported.
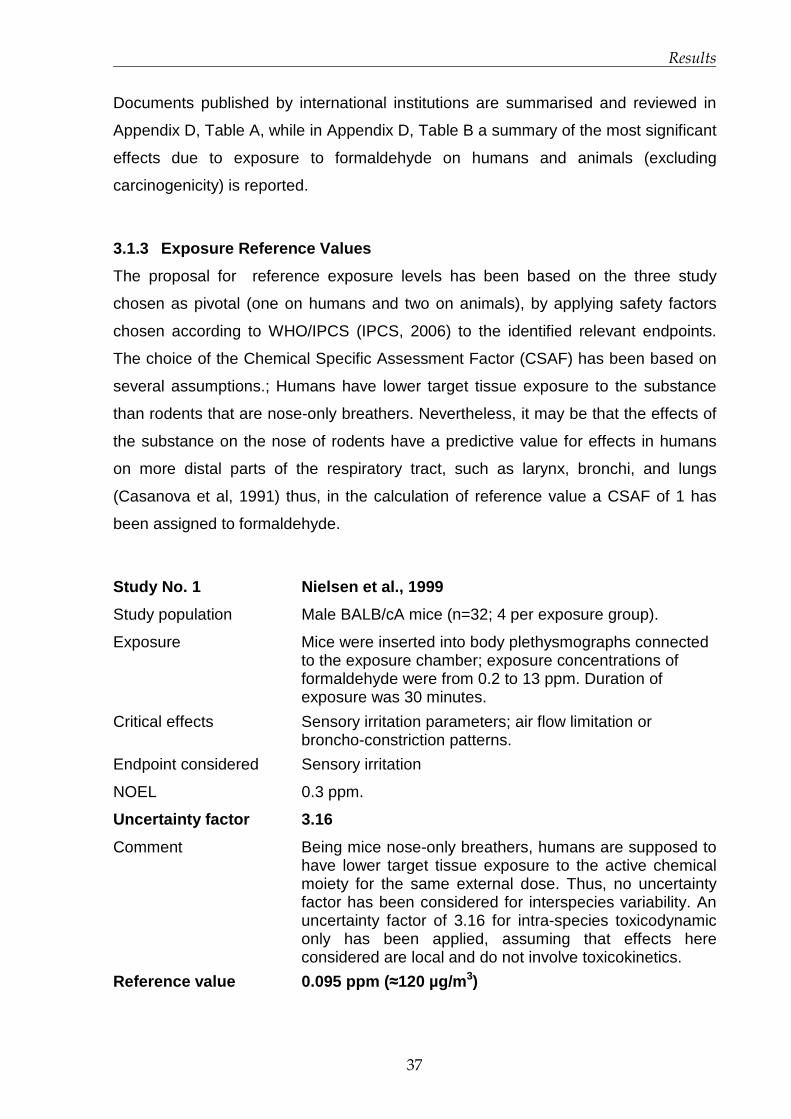
3.1.3 Exposure Reference Values
The proposal for reference exposure levels has been based on the three study
chosen as pivotal (one on humans and two on animals), by applying safety factors
chosen according to WHO/IPCS (IPCS, 2006) to the identified relevant endpoints.
The choice of the Chemical Specific Assessment Factor (CSAF) has been based on
several assumptions.; Humans have lower target tissue exposure to the substance
than rodents that are nose-only breathers. Nevertheless, it may be that the effects of
the substance on the nose of rodents have a predictive value for effects in humans
on more distal parts of the respiratory tract, such as larynx, bronchi, and lungs
(Casanova et al, 1991) thus, in the calculation of reference value a CSAF of 1 has
been assigned to formaldehyde.
Study No. 1 Nielsen et al., 1999
Study population Male BALB/cA mice (n=32; 4 per exposure group).
Exposure Mice were inserted into body plethysmographs connected to the exposure chamber; exposure concentrations of formaldehyde were from 0.2 to 13 ppm. Duration of exposure was 30 minutes.
Critical effects Sensory irritation parameters; air flow limitation or broncho-constriction patterns.
Endpoint considered Sensory irritation
NOEL 0.3 ppm.
Uncertainty factor 3.16
Comment Being mice nose-only breathers, humans are supposed to have lower target tissue exposure to the active chemical moiety for the same external dose. Thus, no uncertainty factor has been considered for interspecies variability. An uncertainty factor of 3.16 for intra-species toxicodynamic only has been applied, assuming that effects here considered are local and do not involve toxicokinetics.
Reference value 0.095 ppm ( ≈120 µg/m 3)

Results
38
Study No. 2 Andersen et al., 2008
Study population Rats (n=8 per group, per time-point)
Exposure Inhalation chamber, 6 h/day, 5d/week, up to 3 weeks.
Exposure groups: 0.7, 2, 6 and 15 ppm.
Critical effects Nasal mucosa: inflammatory infiltrate, epithelial hyperplasia, gene changes (squamous metaplasia, cell proliferation at higher concentrations)
Endpoint considered Inflammatory infiltrate
LOAEL 0.7 (measured 0.6) ppm
Uncertainty factor 3 X 3.16 = 9.48
Comment Being mice nose-only breathers, humans are supposed to have lower target tissue exposure to the active chemical moiety for the same external dose. Thus, no uncertainty factor has been considered for interspecies variability. An uncertainty factor of 3.16 for intra-species toxicodynamics has been applied, assuming that effects here considered are local and do not involve toxicokinetics, multiplied for the adjustment factor of 3 for the use of a LOAEL.
Reference value 0.074 ppm ( ≈90 µg/m 3)
Study No. 3 Lang et al., 2008
Study population: 21 healthy volunteers (11 males, 10 females)
Exposure Repeated measure design; each person exposed to both constant and peak levels for 4h and 10 consecutive days in 10 different exposure conditions.
Critical effects Eye irritation (conjunctival redness, blinking frequency), nasal flow and resistance, pulmonary function and reaction times.
Endpoint considered Eye irritation
LOAEL 0.5 ppm with 1 ppm peaks
NOAEL 0.5 ppm constant level (or 0.3 ppm with 0.6 ppm peaks)
Uncertainty factor 3.16
Comment An uncertainty factor of 3.16 for intra-species toxicodynamic only has been applied, assuming that effects here considered are local and do not involve toxicokinetics.
Reference values 0.158 ppm ( ≈ 200 µg/m 3) constant level 0.095 ppm (≈ 120 µg/m 3) with peaks (0.190 ppm- ≈ 235
µg/m 3)

Results
39
Based on objective eye irritation, the reference value proposed for short-term
exposure to formaldehyde is in the range of 70-100 ppb (90-120 µg/m3).
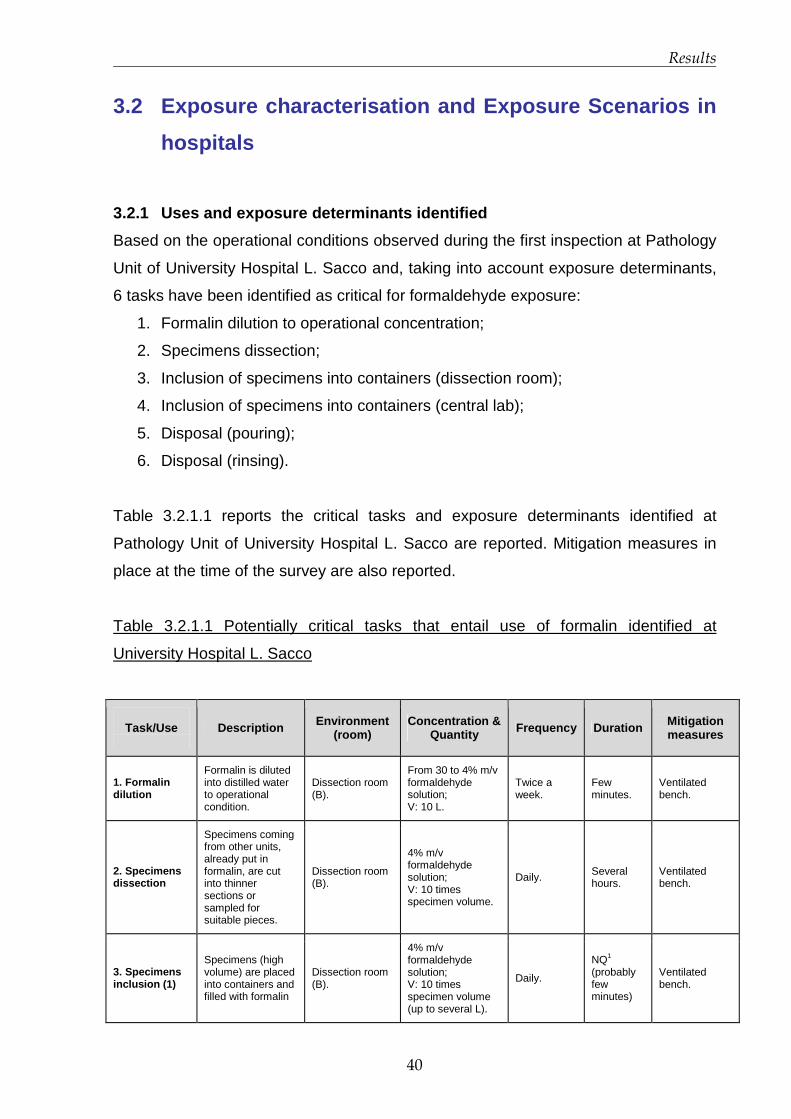
Results
40
3.2 Exposure characterisation and Exposure Scenario s in
hospitals
3.2.1 Uses and exposure determinants identified
Based on the operational conditions observed during the first inspection at Pathology
Unit of University Hospital L. Sacco and, taking into account exposure determinants,
6 tasks have been identified as critical for formaldehyde exposure:
1. Formalin dilution to operational concentration;
2. Specimens dissection;
3. Inclusion of specimens into containers (dissection room);
4. Inclusion of specimens into containers (central lab);
5. Disposal (pouring);
6. Disposal (rinsing).
Table 3.2.1.1 reports the critical tasks and exposure determinants identified at
Pathology Unit of University Hospital L. Sacco are reported. Mitigation measures in
place at the time of the survey are also reported.
Table 3.2.1.1 Potentially critical tasks that entail use of formalin identified at
University Hospital L. Sacco
Task/Use
Description Environment
(room) Concentration &
Quantity Frequency Duration Mitigation measures
1. Formalin dilution
Formalin is diluted into distilled water to operational condition.
Dissection room (B).
From 30 to 4% m/v formaldehyde solution; V: 10 L.
Twice a week.
Few minutes.
Ventilated bench.
2. Specimens dissection
Specimens coming from other units, already put in formalin, are cut into thinner sections or sampled for suitable pieces.
Dissection room (B).
4% m/v formaldehyde solution; V: 10 times specimen volume.
Daily. Several hours.
Ventilated bench.
3. Specimens inclusion (1)
Specimens (high volume) are placed into containers and filled with formalin
Dissection room (B).
4% m/v formaldehyde solution; V: 10 times specimen volume (up to several L).
Daily.
NQ1
(probably few minutes)
Ventilated bench.

Results
41
Task/Use
Description Environment
(room) Concentration &
Quantity Frequency Duration Mitigation measures
4. Specimens inclusion (2)
Specimens (biopsies) are placed into bio-cassettes and filled with formalin
Central lab (A)
4% m/v formaldehyde solution; V: 10 times specimen volume (<10 mL/container).
Daily. ~30 minutes.
Chemical hood.
5. Pouring
Residual formalin present in containers is poured into apposite sink
Dissection room (B).
4% m/v formaldehyde solution; V: 10 times specimen volume (up to several L)..
Daily Few minutes.
Ventilated bench.
6. Rinsing
Recyclable containers are washed under tap water
Washing room (Z)
4% m/v formaldehyde solution V: NQ1
Almost daily. Few minutes.
None (no ventilation, no windows).
1NQ: not quantifiable.
The second hospital investigated, being a Cancer Institute, has a larger Pathology
Department, divided into three sections (two dedicated to routine pathology and one
to research). Direct uses of formalin, which are identified as critical, have been
described and reported in table 3.2.1.2.
Table 3.2.1.1 Potentially critical tasks that entail use of formalin identified at National
Cancer Institute.
Task/Use
Description Environment
(room) Concentration &
Quantity Frequency Duration Mitigation measures
1. Specimens dissection (1)
Fresh1 organs coming from other units are cut into thinner sections.
Dissection room (A)
4% m/v formaldehyde solution; V= up to 20 L for big organs,
Daily Several hours
Chemical hood (kept switched on for 1 our after operation has finished)
2. Specimens dissection (2)
Biopsies coming from other units, already put into formalin, are sampled for suitable pieces.
Dissection room (A)
4% m/v formaldehyde solution; V= 10 mL
Daily Several hours
Chemical hood (kept switched on for 1 our after operation has finished)
3. Specimens inclusion
Formalin is poured into the containers through the opening of a tap.
Dissection room (A)
4% m/v formaldehyde solution; V= up to 20 L for big organs, 10 mL for biopsies;
Daily Several minutes Chemical hood

Results
42
4. Biopsy positioning
Small dimension biopsies already included in formalin, are put into bio-cassettes.
Processing room (B)
4% m/v formaldehyde solution; V= 10 mL.
Daily ~ 1 hour Chemical hood
5. Formalin upload and download
Formalin is uploaded and downloaded from processing machine.
Processing room (B)
4% m/v formaldehyde solution; V= 5 tanks of 5 L, total: 10 L.
1-2 times per day
~15 minutes
Exhaust ventilation: 20 air exchange per hour (theoretical).
6. Bio-cassettes upload and download
Bio-cassettes are positioned inside formalin in the processing machine.
Processing room (B)
4% m/v formaldehyde solution; V: 10 L.
2 upload & download per day for each machine (total: 8 times/day)
Few minutes
Exhaust ventilation: 20 air exchange per hour (theoretical).
7. Pouring
Residual formalin present in containers is poured into apposite sink.
Dissection room (A)
4% m/v formaldehyde solution; V= 10 mL.
Daily
Few seconds per container
Chemical hood
8. Disposal of archive specimens
Residual formalin present in big, containers of archive is poured into apposite sink.
Disposal room (C)
4% m/v formaldehyde solution; V = up to 20 L.
Almost daily Up to 1 hour.
Chemical hood
9. Rinsing
Recyclable containers are washed under tap water
Disposal room (C)
4% m/v formaldehyde solution V: NQ2
Almost daily Few minutes
Chemical hood
10. Washing
Recyclable containers are put inside washing machine
Ex-autopsy room (D)
4% m/v formaldehyde solution V: NQ2
Almost daily Few minutes
None
1 Fresh: not included in formalin 2NQ : not quantifiable
Due to working organisation and timing it has not been possible to carry out any
sampling for some of the tasks. Sometimes two or more tasks have been monitored
at the same time. Further, some other situations or tasks identified as potentially non-
critical have been monitored as described in paragraph 3.2.3.
3.2.2 Preliminary measurements
A screening monitoring at University Hospital L. Sacco has been conducted with
passive method Dräger Bio-check-F during the first visit at Pathology Unit. 2 hours
TWA of formaldehyde air concentrations have been measured in three environments:
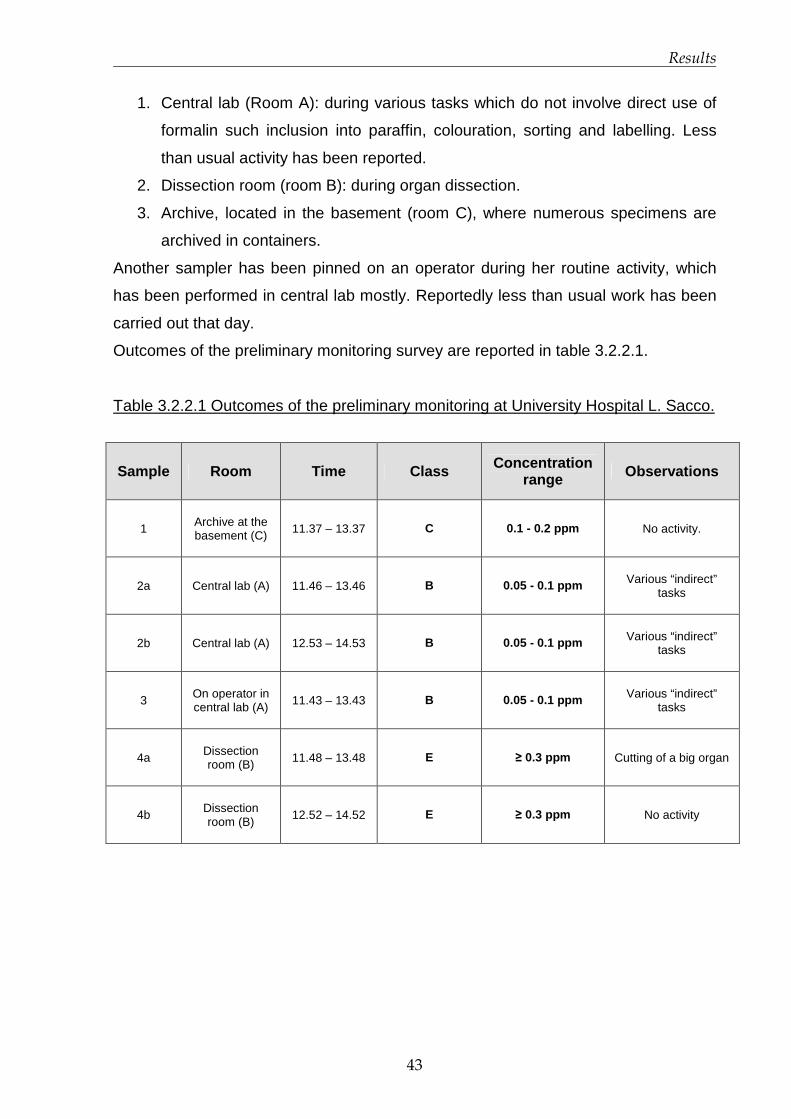
Results
43
1. Central lab (Room A): during various tasks which do not involve direct use of
formalin such inclusion into paraffin, colouration, sorting and labelling. Less
than usual activity has been reported.
2. Dissection room (room B): during organ dissection.
3. Archive, located in the basement (room C), where numerous specimens are
archived in containers.
Another sampler has been pinned on an operator during her routine activity, which
has been performed in central lab mostly. Reportedly less than usual work has been
carried out that day.
Outcomes of the preliminary monitoring survey are reported in table 3.2.2.1.
Table 3.2.2.1 Outcomes of the preliminary monitoring at University Hospital L. Sacco.
Sample Room Time Class Concentration range Observations
1 Archive at the basement (C) 11.37 – 13.37 C 0.1 - 0.2 ppm No activity.
2a Central lab (A) 11.46 – 13.46 B 0.05 - 0.1 ppm Various “indirect” tasks
2b Central lab (A) 12.53 – 14.53 B 0.05 - 0.1 ppm Various “indirect” tasks
3 On operator in central lab (A) 11.43 – 13.43 B 0.05 - 0.1 ppm Various “indirect”
tasks
4a Dissection room (B) 11.48 – 13.48 E ≥ 0.3 ppm Cutting of a big organ
4b Dissection room (B)
12.52 – 14.52 E ≥ 0.3 ppm No activity
Results
44
3.2.3 Monitoring survey at University Hospital L. S acco
The monitoring has been conducted in July 2010, during routine activity of the
Pathology Unit. Tasks monitored with 3 techniques have been:
1. Specimens dissection and inclusion into formalin in dissection room (including
cutting of large organs);
2. Various tasks not involving the direct use of formalin such as specimens
processing, inclusion into paraffin, colouration, microtome sectioning and
specimens sorting in central lab;
3. Formalin dilution in dissection room;
4. Specimens inclusion in central lab (small biopsies);
5. Pouring of residual formalin in dissection room (5 high volume containers up to
5 L).
Other environments have been monitored with passive sampler Bio-check F and/or
photo-acoustic gas monitor. On personnel request, one Bio-check F measurement
has been performed in the cellar where archives are stored (situation no. 6). A task
identified as critical, rinsing of recyclable containers, could not be performed because
no used containers were present that day, nevertheless a measurement with photo-
acoustic and Bio-check has been carried out while rinsed containers were drying
(situation no. 7). Both environments (cellar and washing room) are not provided with
any ventilation system.
Data and charts depicting relevant outcomes are presented in this section. Relevant
occurrences observed during measurements are reported in charts.
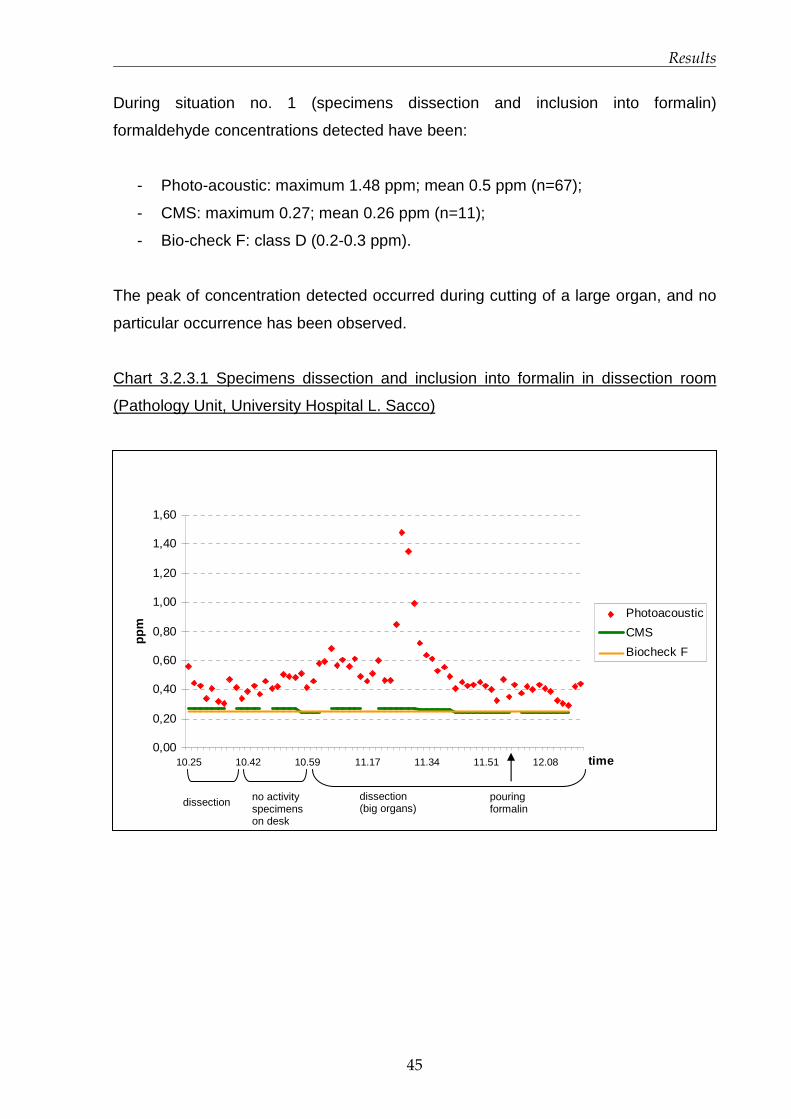
Results
45
During situation no. 1 (specimens dissection and inclusion into formalin)
formaldehyde concentrations detected have been:
- Photo-acoustic: maximum 1.48 ppm; mean 0.5 ppm (n=67);
- CMS: maximum 0.27; mean 0.26 ppm (n=11);
- Bio-check F: class D (0.2-0.3 ppm).
The peak of concentration detected occurred during cutting of a large organ, and no
particular occurrence has been observed.
Chart 3.2.3.1 Specimens dissection and inclusion into formalin in dissection room
(Pathology Unit, University Hospital L. Sacco)
0,00
0,20
0,40
0,60
0,80
1,00
1,20
1,40
1,60
10.25 10.42 10.59 11.17 11.34 11.51 12.08 time
ppm
Photoacoustic
CMS
Biocheck F
dissection no activity specimens on desk
pouring formalin
dissection (big organs)
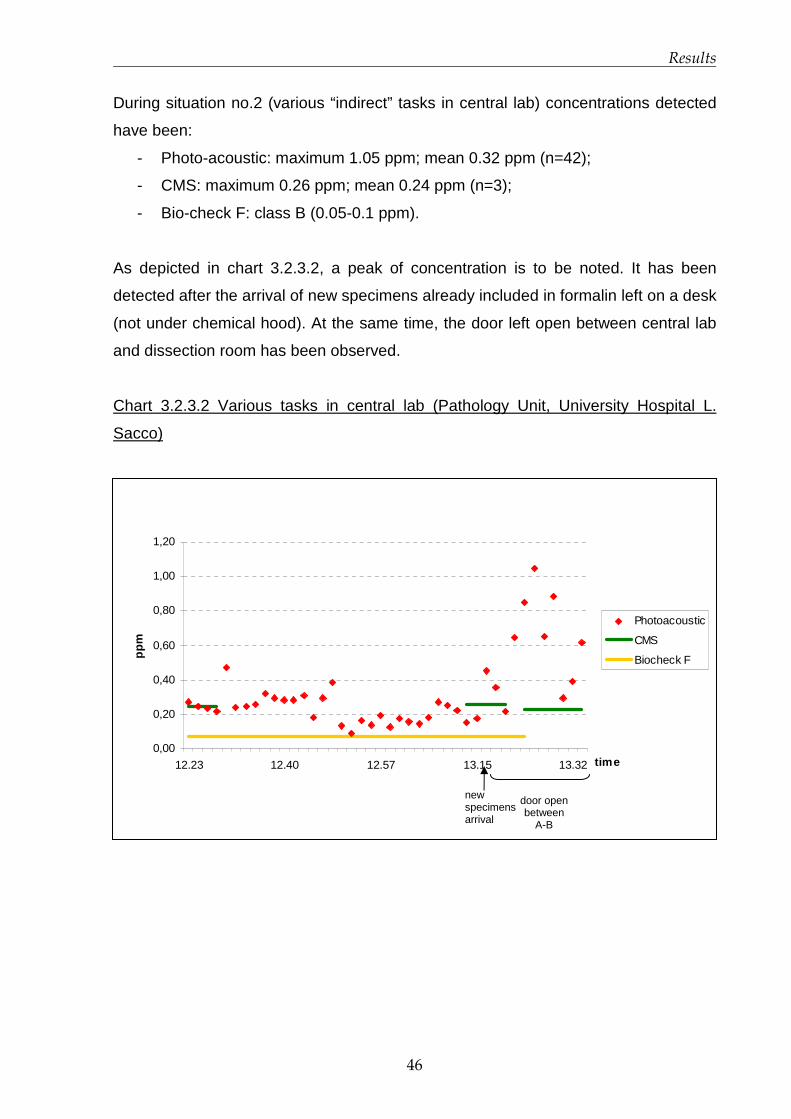
Results
46
During situation no.2 (various “indirect” tasks in central lab) concentrations detected
have been:
- Photo-acoustic: maximum 1.05 ppm; mean 0.32 ppm (n=42);
- CMS: maximum 0.26 ppm; mean 0.24 ppm (n=3);
- Bio-check F: class B (0.05-0.1 ppm).
As depicted in chart 3.2.3.2, a peak of concentration is to be noted. It has been
detected after the arrival of new specimens already included in formalin left on a desk
(not under chemical hood). At the same time, the door left open between central lab
and dissection room has been observed.
Chart 3.2.3.2 Various tasks in central lab (Pathology Unit, University Hospital L.
Sacco)
0,00
0,20
0,40
0,60
0,80
1,00
1,20
12.23 12.40 12.57 13.15 13.32 time
ppm
Photoacoustic
CMS
Biocheck F
door open between
A-B
new specimens arrival

Results
47
During situation no. 3 (formalin dilution in dissection room) concentrations detected
have been:
- Photo-acoustic: maximum 0.69 ppm; mean 0.53 ppm (n=6);
- CMS: maximum 0.32 ppm, mean 0.24 ppm (n=2); 1 measurement has been
below LOD (0.2 ppm); it started before the operation beginning and ended
during task.
- Bio-check F: class E (≥0.3 ppm).
Chart 3.2.3.3 Formalin dilution in dissection room (Pathology Unit, University Hospital
L. Sacco)
0
0.1
0.2
0.3
0.4
0.5
0.6
0.7
0.8
13:41 13:45 13:49 13:52 13:55 13:59time
ppm
Photoacoustic
CMS
Biocheck
CMS below measuring
range
LOD CMS
Biocheck F class E
Dilution started
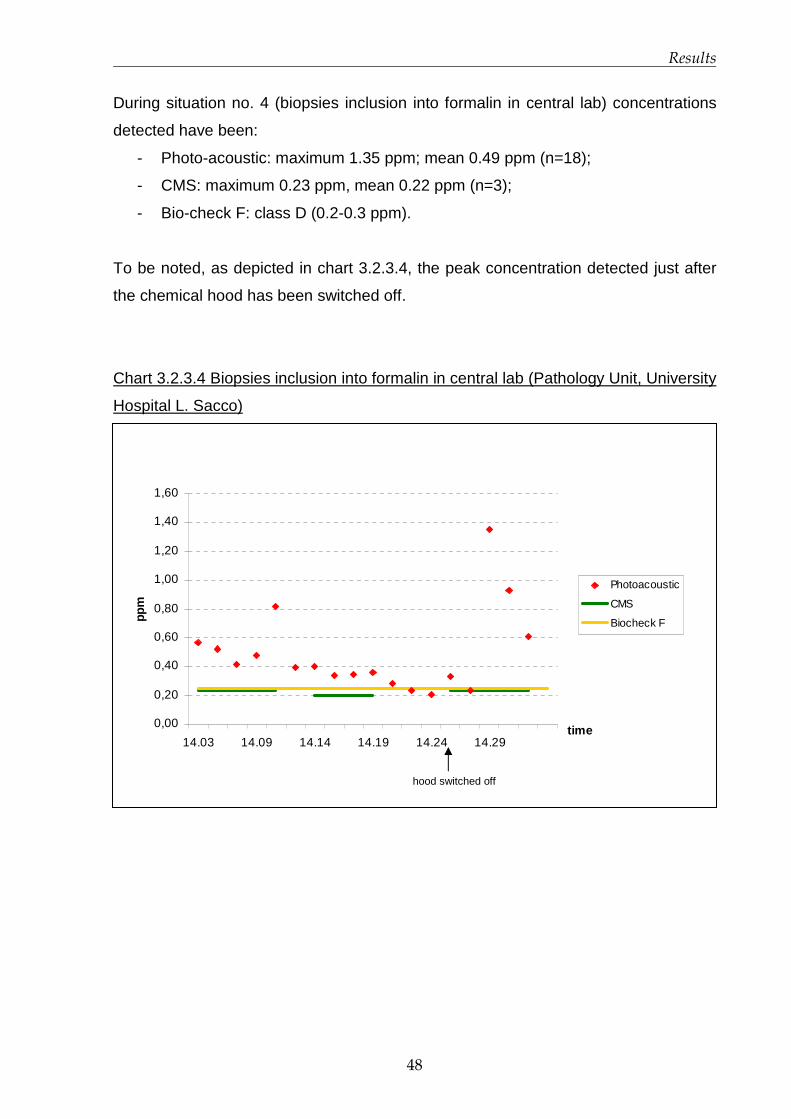
Results
48
During situation no. 4 (biopsies inclusion into formalin in central lab) concentrations
detected have been:
- Photo-acoustic: maximum 1.35 ppm; mean 0.49 ppm (n=18);
- CMS: maximum 0.23 ppm, mean 0.22 ppm (n=3);
- Bio-check F: class D (0.2-0.3 ppm).
To be noted, as depicted in chart 3.2.3.4, the peak concentration detected just after
the chemical hood has been switched off.
Chart 3.2.3.4 Biopsies inclusion into formalin in central lab (Pathology Unit, University
Hospital L. Sacco)
0,00
0,20
0,40
0,60
0,80
1,00
1,20
1,40
1,60
14.03 14.09 14.14 14.19 14.24 14.29time
ppm
Photoacoustic
CMS
Biocheck F
hood switched off

Results
49
During situation no. 5 (disposal: pouring residual formalin in dissection room)
concentrations detected have been:
- Photo-acoustic: maximum 0.61 ppm; mean 0.53 ppm (n=7);
- CMS: maximum 0.42 ppm, mean 0.38 ppm (n=2);
- Bio-check F: class E (≥0.3 ppm).
Chart 3.2.3.5 Formalin disposal in dissection room (Pathology Unit, University
Hospital L. Sacco)
0.00
0.10
0.20
0.30
0.40
0.50
0.60
0.70
14:37 14:38 14:40 14:42 14:44 14:46 14:47 14:49 14:50 14:52time
ppm
Photoacoustic
CMS
Biocheck F
Results of other environments monitored are reported in table 3.2.3.1
Table 3.2.3.1 Other environments monitored at Pathology Unit, University Hospital L.
Sacco
Formaldehyde levels Situation Environment
Bio-check F Photo-acoustic
Notes
6. Specimen
archives Basement (room C)
Class E
(≥ 0.3ppm) -
Organs kept in
non-hermetic bins
7. Washing
Washing room
(room Z)
Class B
(0.05 - 0.1ppm)
Below detection
limit (0.04 ppm)
No activity;
containers left to
dry.
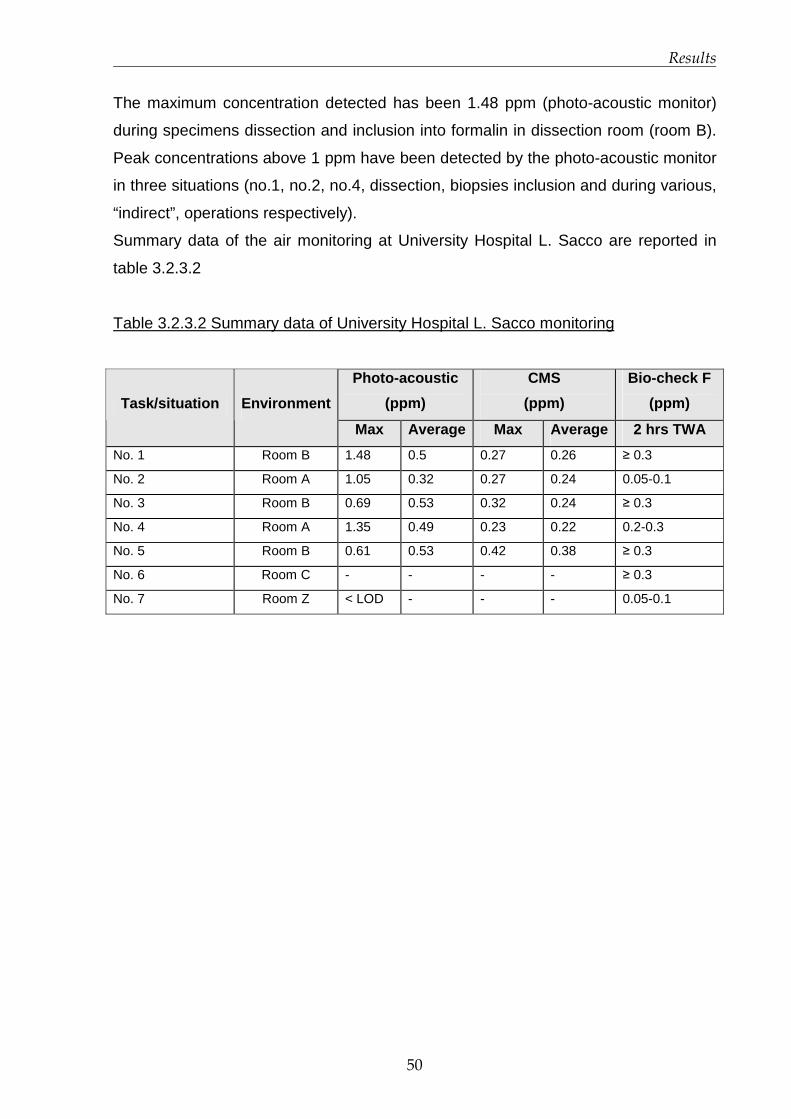
Results
50
The maximum concentration detected has been 1.48 ppm (photo-acoustic monitor)
during specimens dissection and inclusion into formalin in dissection room (room B).
Peak concentrations above 1 ppm have been detected by the photo-acoustic monitor
in three situations (no.1, no.2, no.4, dissection, biopsies inclusion and during various,
“indirect”, operations respectively).
Summary data of the air monitoring at University Hospital L. Sacco are reported in
table 3.2.3.2
Table 3.2.3.2 Summary data of University Hospital L. Sacco monitoring
Photo-acoustic
(ppm)
CMS
(ppm)
Bio-check F
(ppm) Task/situation Environment
Max Average Max Average 2 hrs TWA
No. 1 Room B 1.48 0.5 0.27 0.26 ≥ 0.3
No. 2 Room A 1.05 0.32 0.27 0.24 0.05-0.1
No. 3 Room B 0.69 0.53 0.32 0.24 ≥ 0.3
No. 4 Room A 1.35 0.49 0.23 0.22 0.2-0.3
No. 5 Room B 0.61 0.53 0.42 0.38 ≥ 0.3
No. 6 Room C - - - - ≥ 0.3
No. 7 Room Z < LOD - - - 0.05-0.1
Results
51
3.2.4 Monitoring survey at National Cancer Institut e
The monitoring has been conducted at the end of October 2010, during routine
activity of the Pathology Unit. Situations monitored with at least two techniques have
been:
1. Specimens dissection (2): sampling of biopsies and inclusion into formalin (tap
of formalin tank opened several times) in dissection room;
2. Formalin upload and download in processing room;
3. Specimens dissection (1): cutting of “fresh” organs (not already included into
formalin) and inclusion into formalin in dissection room;
4. Disposal of archive specimens (pouring residual formalin) in disposal room;
5. Washing of recyclable containers in ex autopsy room (CMS and Bio-check F
only);
6. Biopsies positioning in processing room;
7. Bio-cassettes upload and download in processing room (photo-acoustic and
CMS);
8. Pouring of residual and loading of new formalin in dissection room (photo-
acoustic and CMS).
Data and charts depicting relevant outcomes are presented in this section. Relevant
occurrences observed during measurements are reported in charts.

Results
52
During situation no. 1 (biopsies sampling and inclusion into formalin) formaldehyde
concentrations detected have been:
- Photo-acoustic: maximum 0.35 ppm; mean 0.07 ppm (n=27);
- CMS: below LOD (0.2 ppm; n=5)
- Bio-check F: class E (≥ 0.3 ppm).
Chart 3.2.4.1 Biopsies sampling and inclusion into formalin (Pathology dept. National
Cancer Institute)
0,00
0,05
0,10
0,15
0,20
0,25
0,30
0,35
0,40
10.09 10.16 10.23 10.30 10.37 10.44 10.51 time
ppm
Photoacoustic
CMS LOD
Biocheck Fclass E
1. Observation no. 1: operator passed above instruments with gloves soaked with formalin
2. Observation no. 2: formalin tank opened for 1 min ca.
1 2

Results
53
In situation no. 2, formalin upload and download in processing room, photo-acoustic
measurements have been invalidated because of positive interferences present in
the room (ethanol and xylenes), thus cannot be used to depict formaldehyde levels.
Concentrations detected with other two methods have been:
- CMS: maximum 0.54 ppm, mean 0.35 ppm (n=2);
- Bio-check F in processing room: null measurement;
- Bio-check F positioned in the corridor, in front of the door between processing
room (left open): class D (0.2- 0.3 ppm).
Chart 3.2.4.2 Formalin upload and download in processing room (Pathology dept.
National Cancer Institute)
0
0,1
0,2
0,3
0,4
0,5
0,6
11.05 11.12 11.17 11.22 11.27 11.33 11.38 11.43time
ppm CMS
Biocheck F (corridor)
1. Observation no. 1: download started.
2. Observation no. 2: automatic upload started (1st tank).
3. Observation no. 3: manual upload started (2nd tank).
4. Observation no. 4: accidental pouring on the floor.
1 2 4 3
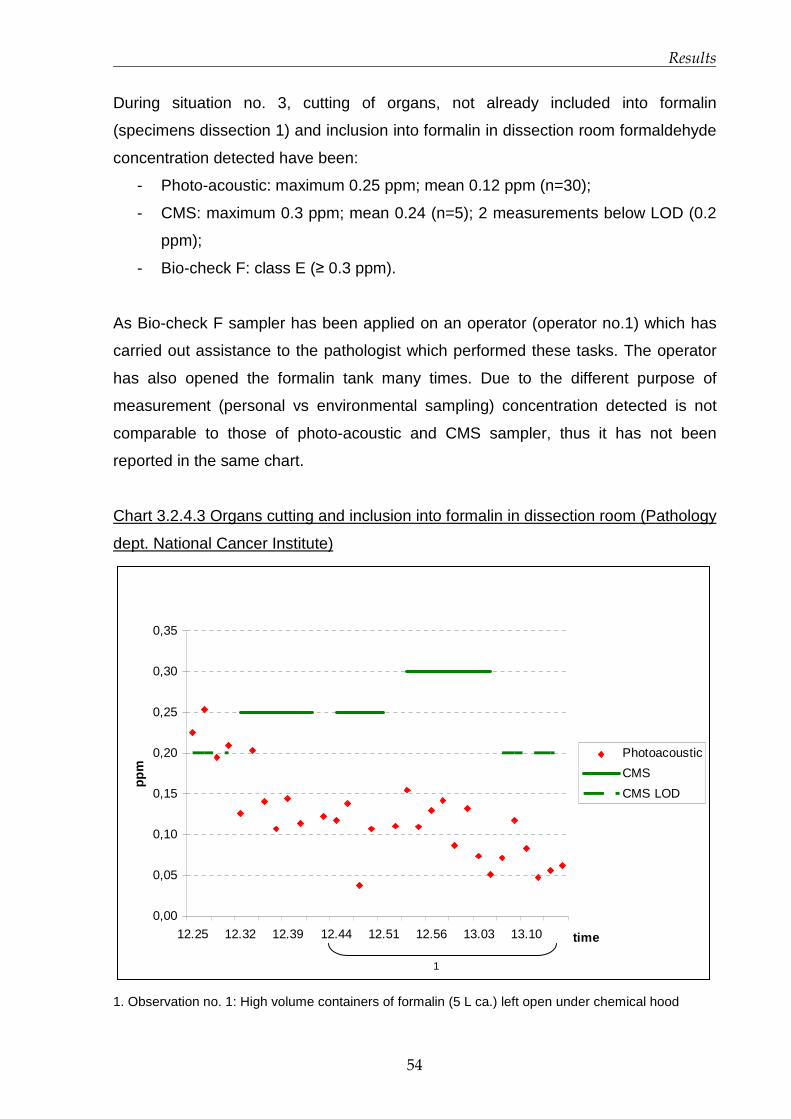
Results
54
During situation no. 3, cutting of organs, not already included into formalin
(specimens dissection 1) and inclusion into formalin in dissection room formaldehyde
concentration detected have been:
- Photo-acoustic: maximum 0.25 ppm; mean 0.12 ppm (n=30);
- CMS: maximum 0.3 ppm; mean 0.24 (n=5); 2 measurements below LOD (0.2
ppm);
- Bio-check F: class E (≥ 0.3 ppm).
As Bio-check F sampler has been applied on an operator (operator no.1) which has
carried out assistance to the pathologist which performed these tasks. The operator
has also opened the formalin tank many times. Due to the different purpose of
measurement (personal vs environmental sampling) concentration detected is not
comparable to those of photo-acoustic and CMS sampler, thus it has not been
reported in the same chart.
Chart 3.2.4.3 Organs cutting and inclusion into formalin in dissection room (Pathology
dept. National Cancer Institute)
0,00
0,05
0,10
0,15
0,20
0,25
0,30
0,35
12.25 12.32 12.39 12.44 12.51 12.56 13.03 13.10 time
ppm
Photoacoustic
CMS
CMS LOD
1. Observation no. 1: High volume containers of formalin (5 L ca.) left open under chemical hood
1
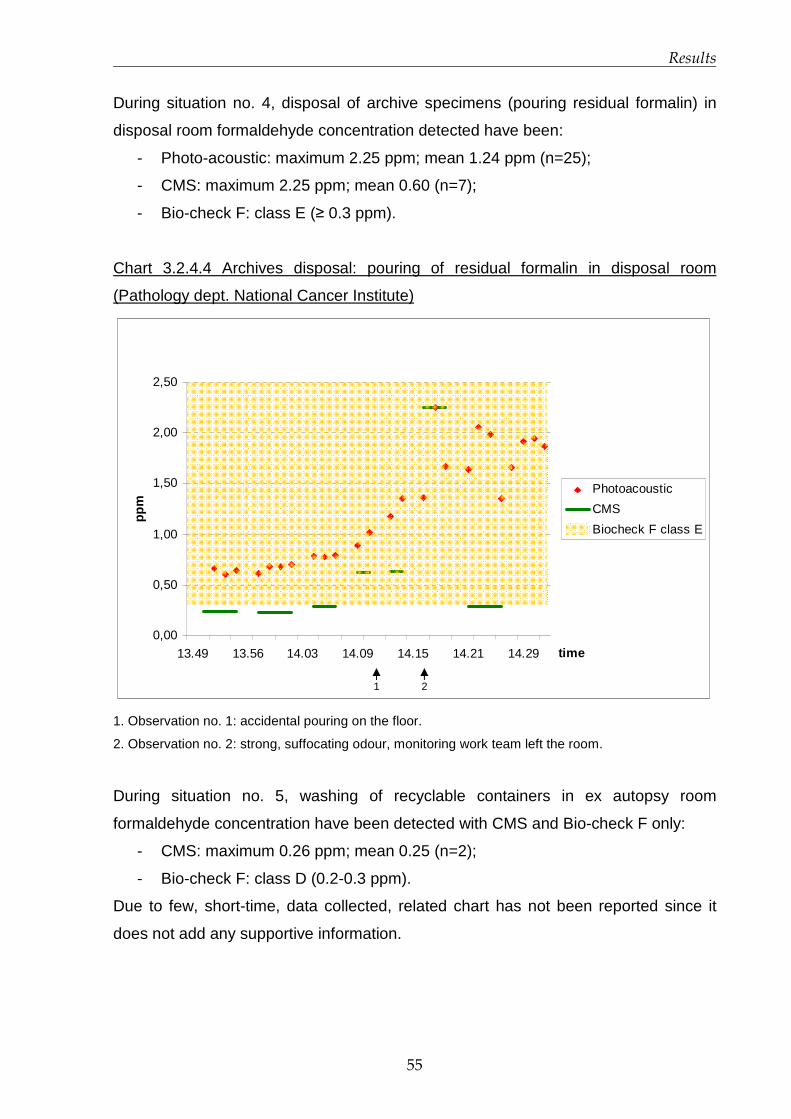
Results
55
During situation no. 4, disposal of archive specimens (pouring residual formalin) in
disposal room formaldehyde concentration detected have been:
- Photo-acoustic: maximum 2.25 ppm; mean 1.24 ppm (n=25);
- CMS: maximum 2.25 ppm; mean 0.60 (n=7);
- Bio-check F: class E (≥ 0.3 ppm).
Chart 3.2.4.4 Archives disposal: pouring of residual formalin in disposal room
(Pathology dept. National Cancer Institute)
0,00
0,50
1,00
1,50
2,00
2,50
13.49 13.56 14.03 14.09 14.15 14.21 14.29 time
ppm
Photoacoustic
CMS
Biocheck F class E
1. Observation no. 1: accidental pouring on the floor.
2. Observation no. 2: strong, suffocating odour, monitoring work team left the room.
During situation no. 5, washing of recyclable containers in ex autopsy room
formaldehyde concentration have been detected with CMS and Bio-check F only:
- CMS: maximum 0.26 ppm; mean 0.25 (n=2);
- Bio-check F: class D (0.2-0.3 ppm).
Due to few, short-time, data collected, related chart has not been reported since it
does not add any supportive information.
1 2

Results
56
During situation no. 6, biopsies positioning in bio-cassettes in processing room,
photo-acoustic measurements have been invalidated because of positive
interferences present in the room (ethanol and xylenes), as well as in situation no.2.
Concentrations detected with other two methods have been:
- CMS: maximum 0.29 ppm; mean 0.25 (n=4);
- Bio-check F: class E (≥ 0.3 ppm).
In this case also, due to few, short-time, data collected, related chart has not been
reported since it does not add any supportive information.
Situation no. 7, bio-cassettes upload and download in processing room, has been
characterised by the presence of positive interferences too (for photo-acoustic). Bio-
check F sampler has not been considered worthy to use because of the brevity of the
task. Thus, only data from CMS are reported:
- CMS (1 measurement): 0.3 ppm
Chart is not reported.
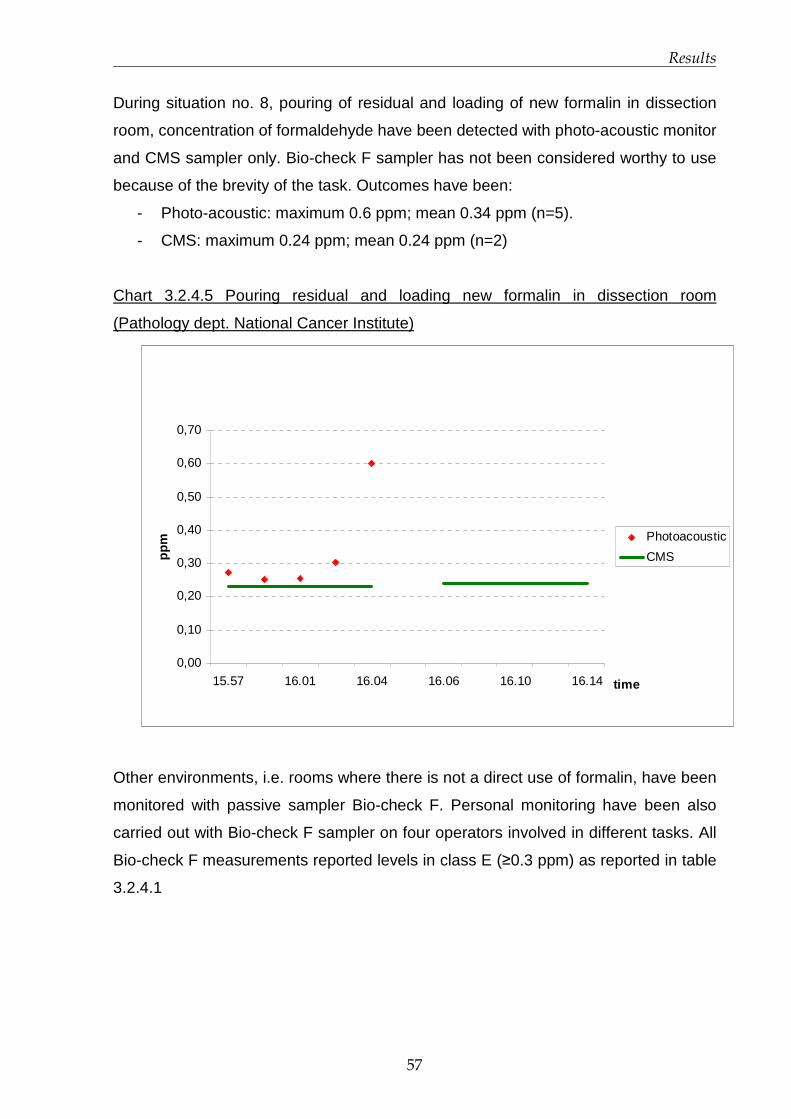
Results
57
During situation no. 8, pouring of residual and loading of new formalin in dissection
room, concentration of formaldehyde have been detected with photo-acoustic monitor
and CMS sampler only. Bio-check F sampler has not been considered worthy to use
because of the brevity of the task. Outcomes have been:
- Photo-acoustic: maximum 0.6 ppm; mean 0.34 ppm (n=5).
- CMS: maximum 0.24 ppm; mean 0.24 ppm (n=2)
Chart 3.2.4.5 Pouring residual and loading new formalin in dissection room
(Pathology dept. National Cancer Institute)
0,00
0,10
0,20
0,30
0,40
0,50
0,60
0,70
15.57 16.01 16.04 16.06 16.10 16.14 time
ppm Photoacoustic
CMS
Other environments, i.e. rooms where there is not a direct use of formalin, have been
monitored with passive sampler Bio-check F. Personal monitoring have been also
carried out with Bio-check F sampler on four operators involved in different tasks. All
Bio-check F measurements reported levels in class E (≥0.3 ppm) as reported in table
3.2.4.1

Results
58
Table 3.2.4.1 Various situations and environments monitored with Bio-check F at
National Cancer Institute.
Sample Environment Time Tasks carried out during monitoring
Class Formaldehyde concentrations
(ppm)
1 Dissection room (space 1) 10.10-12.10
Biopsies sampling, opening of formalin tank. E ≥0.3
2 Dissection room (space 2) 10.10-12.11
Various; no biopsies sampling C 0.1-0.2
3
Corridor A (next to dissection room) 10.18-12.18 Passageway A ≤0.05
4 Cytology lab 10.18-12.18 Various/not specified B 0.05-0.1
5 Secretary office A (small room) 10.22-12.22 Secretary activities A ≤0.05
6
Experimental Molecular Pathology lab 10.24-12.24 Various/not specified A ≤0.05
7
Diagnostic Molecular Pathology lab 10.24-12.24 Various/not specified B 0.05-0.1
8 Processing room 11.05-13.05
Formalin upload and download from processing machines Null -
9
Corridor B (in front of processing room) 11.15-13.15
Passageway; door open between corridor and processing room during upload/download D 0.2-0.3
10 Paraffin and colouration lab 11.20-13.20 Various/not specified B 0.05-0.1
11 Histology lab 11.32-13.32 Personnel meeting B 0.05-0.1
12 Operator 1: dissection room 12.40-14.40
Assistance to sampling and cutting; formalin tank opening. E ≥0.3
13
Operator 2: processing room 13.00-15.00
Formalin upload and download from processing machines E ≥0.3
14 Ex autopsy room 13.10-15.10
Loading of containers into washing machines; washing cycle; drying of containers D 0.2-0.3
15 Disposal room 13.10-15.10
Pouring of residual formalin (ca. 15 big containers 2-3 L and 20 small 250 mL) E ≥0.3
16 Secretary office B (large room) 13.25-15.25 Secretary activities B 0.05-0.1

Results
59
Sample Environment Time Tasks carried out during monitoring
Class Formaldehyde concentrations
(ppm)
17 Processing room 13.35-15.35
Positioning of small biopsies in bio-cassettes E ≥0.3
18 Immune-histo-chemistry lab 13.35-15.35 Various/not specified B
0.05-0.1 (media 0.075)
19
Corridor B (in front of processing room) 13.37-15.37
Positioning of small biopsies in bio-cassettes in processing room (door open) Null -
20
Operator 3: disposal room, ex autopsy room; 13.52-15.52
Archives disposal (pouring formalin), loading washing machines E ≥0.3
21
Operator 4: processing room
14.55-rimozione
Positioning of small biopsies in bio-cassettes Null -
The maximum concentration detected in monitoring survey has been 2.25 ppm
(found with both photo-acoustic and CMS methods) during pouring of residual
formalin in disposal room (room C), the only task/situation to produce peak
concentrations above 1 ppm. In three situations (no. 2, 6, 7) photo-acoustic
measurements gave very high peak concentrations, but have been discarded
because of the presence of positive interferences inside processing room. Summary
data of the air monitoring at National Cancer Institute are reported in table 3.2.4.2.
Table 3.2.4.2 Summary data of National Cancer Institute monitoring
Photo-acoustic
(ppm)
CMS
(ppm)
Bio-check F
(ppm) Task/circumstance
monitored Environment
Max Average Max Average 2 hrs TWA
No. 1 Room A 0.35 0.07 < LOD - ≥ 0.3
No. 2 Room B Dis1 Dis1 0.54 0.35 0.2-0.3
No. 3 Room A 0.12 0.25 0.3 0.24 ≥ 0.3 (operator)
No. 4 Room C 2.25 1.24 2.25 0.65 ≥ 0.3
No. 5 Room D - - 0.26 0.25 0.2-0.3
No. 6 Room B Dis1 Dis1 0.29 0.25 ≥ 0.3
No. 7 Room B Dis1 Dis1 0.3 0.3 -
No. 8 Room A 0.6 0.34 0.24 0.24 - 1Dis: discarded because of positive interferences.

Results
60
3.2.5 Exposure Scenarios and Risk Management Measur es proposal
Exposure Scenario development has been based on REACH Regulation Guidelines,
particularly on the document “Guidance on information requirements and chemical
safety assessment - Part D: Exposure Scenario Building” (ECHA, 2008). First, a
checklist has been completed during the personnel interviews and the inspection of
laboratories. To answer some questions, the support of the Prevention and
Protection Service of both hospitals has been required.
Always basing the Scenario development on REACH Technical Guidance, an
exposure estimation model has been taken into account and, as exercise, tested on
a generic task repeated several times per day in a pathology laboratory (see
Appendix A). The concentration estimated are in the same order of magnitude of
those encountered during the surveys and the detailed results of exposure modelling;
the model description and the input/output data are reported in Appendix A.
Exposure data obtained from air monitoring surveys have been evaluated and
implemented into the Exposure Scenario. Concentration values exceeding TLV-C for
formaldehyde (0.3 ppm) have been highlighted, trying to describe possible causes of
exceeding formaldehyde levels. Further, Risk Management Measures (RMMs) for
each task resulting in a potential risk for operators health have been proposed.
Exposure Scenarios developed are presented in a re-arranged format based on
REACH guidelines. An Exposure Scenario can pool more than one task together.
This is the case when two or more task are carried out at the same time and in the
same environment, where the single source of emission is not distinguishable during
a routine work activity (i.e specimens dissection and inclusion into formalin). Also
various, indirect, tasks performed in the same environment where a relevant, single
source of formaldehyde is not expected, have been grouped in the same Exposure
Scenario.
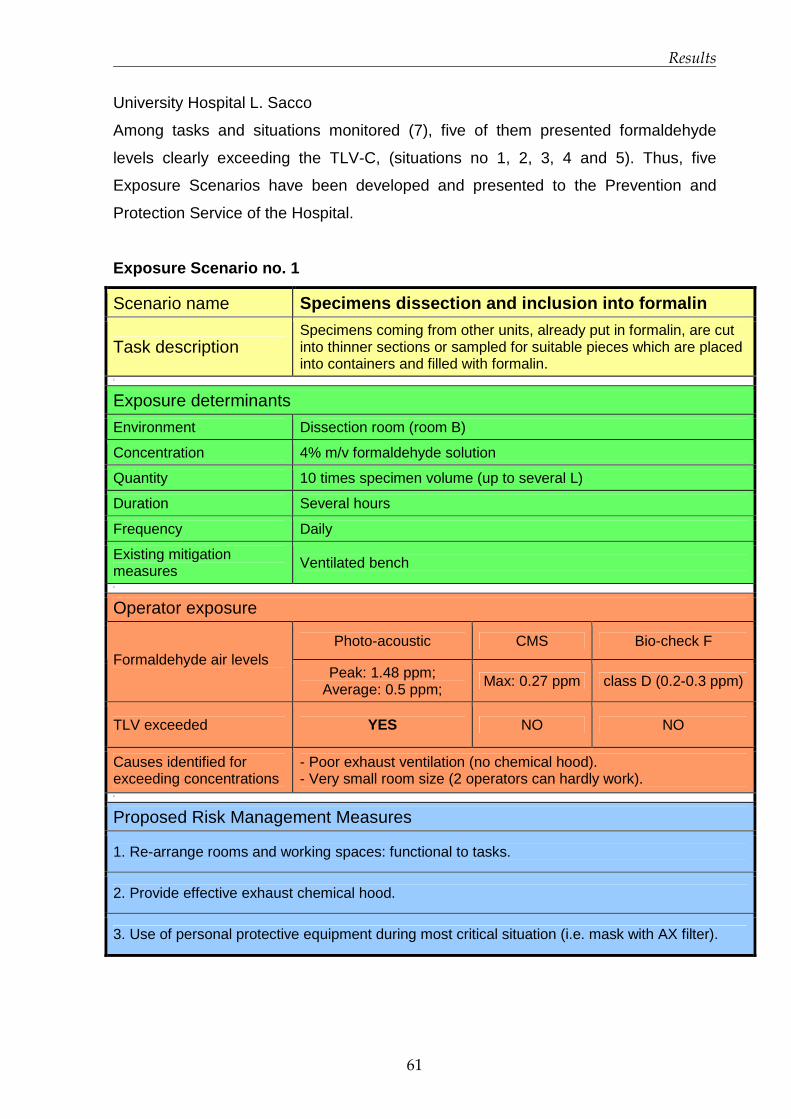
Results
61
University Hospital L. Sacco
Among tasks and situations monitored (7), five of them presented formaldehyde
levels clearly exceeding the TLV-C, (situations no 1, 2, 3, 4 and 5). Thus, five
Exposure Scenarios have been developed and presented to the Prevention and
Protection Service of the Hospital.
Exposure Scenario no. 1
Scenario name Specimens dissection and inclusion into formalin
Task description Specimens coming from other units, already put in formalin, are cut into thinner sections or sampled for suitable pieces which are placed into containers and filled with formalin.
1
Exposure determinants
Environment Dissection room (room B)
Concentration 4% m/v formaldehyde solution
Quantity 10 times specimen volume (up to several L)
Duration Several hours
Frequency Daily
Existing mitigation measures Ventilated bench 1
Operator exposure
Photo-acoustic CMS Bio-check F Formaldehyde air levels
Peak: 1.48 ppm; Average: 0.5 ppm; Max: 0.27 ppm class D (0.2-0.3 ppm)
TLV exceeded YES NO NO
Causes identified for exceeding concentrations
- Poor exhaust ventilation (no chemical hood). - Very small room size (2 operators can hardly work).
1
Proposed Risk Management Measures
1. Re-arrange rooms and working spaces: functional to tasks.
2. Provide effective exhaust chemical hood.
3. Use of personal protective equipment during most critical situation (i.e. mask with AX filter).
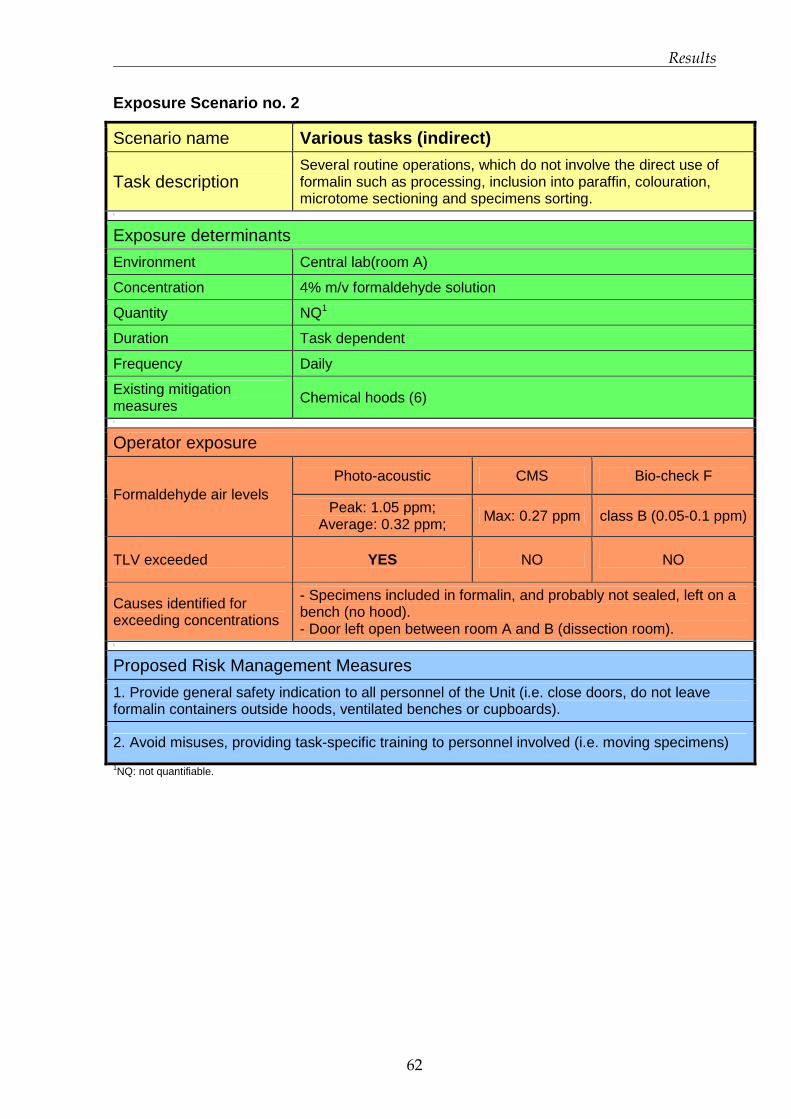
Results
62
Exposure Scenario no. 2
Scenario name Various tasks (indirect)
Task description Several routine operations, which do not involve the direct use of formalin such as processing, inclusion into paraffin, colouration, microtome sectioning and specimens sorting.
1
Exposure determinants
Environment Central lab(room A)
Concentration 4% m/v formaldehyde solution
Quantity NQ1
Duration Task dependent
Frequency Daily
Existing mitigation measures Chemical hoods (6) 1
Operator exposure
Photo-acoustic CMS Bio-check F Formaldehyde air levels
Peak: 1.05 ppm; Average: 0.32 ppm; Max: 0.27 ppm class B (0.05-0.1 ppm)
TLV exceeded YES NO NO
Causes identified for exceeding concentrations
- Specimens included in formalin, and probably not sealed, left on a bench (no hood). - Door left open between room A and B (dissection room).
1
Proposed Risk Management Measures
1. Provide general safety indication to all personnel of the Unit (i.e. close doors, do not leave formalin containers outside hoods, ventilated benches or cupboards).
2. Avoid misuses, providing task-specific training to personnel involved (i.e. moving specimens)
1NQ: not quantifiable.

Results
63
Exposure Scenario no. 3
Scenario name Formalin dilution
Task description Formalin, provided in tanks from Pharmacy Unit, is diluted to operational condition into distilled water.
1
Exposure determinants
Environment Dissection room (room B)
Concentration From 30 to 4% m/v formaldehyde solution
Quantity 10 L
Duration Few minutes (<5)
Frequency Twice a week
Existing mitigation measures Ventilated bench 1
Operator exposure
Photo-acoustic CMS Bio-check F Formaldehyde air levels
Peak: 0.69 ppm; Average: 0.53 ppm; Max: 0.32 ppm class E (≥ 0.3ppm)
TLV exceeded YES YES YES
Causes identified for exceeding concentrations
- Poor exhaust ventilation (no chemical hood). - Very small room size (2 operators can hardly work). - Emission of formaldehyde during dilution is unavoidable.
1
Proposed Risk Management Measures
1. Provide the Unit with formalin already diluted to operational condition (buying directly from supplier).
2. Re-arrange rooms and working spaces: functional to tasks.
3. Provide effective exhaust chemical hood.
4. Use of personal protective equipment during most critical situation (i.e. mask with AX filter).

Results
64
Exposure Scenario no. 4
Scenario name Biopsies inclusion into formalin
Task description Biopsies are placed into bio-cassettes and filled with formalin 1
Exposure determinants
Environment Central lab (room A)
Concentration 4% m/v formaldehyde solution
Quantity <10 mL/container
Duration ~30 minutes
Frequency Daily
Existing mitigation measures Chemical hood 1
Operator exposure
Photo-acoustic CMS Bio-check F Formaldehyde air levels
Peak: 1.35 ppm Average: 0.49 ppm Max: 0.23 ppm class D (0.2-0.3 ppm)
TLV exceeded YES NO NO
Causes identified for exceeding concentrations - Exhaust hood is switched off too soon, just after the task is finished.
1
Proposed Risk Management Measures
1. Avoid misuses, providing task-specific training to personnel involved (i.e. leave the hood switched on for a while after the work has been done).

Results
65
Exposure Scenario no. 5
Scenario name Disposal
Task description Residual formalin present in containers is poured into apposite sink 1
Exposure determinants
Environment Dissection room (room B)
Concentration 4% m/v formaldehyde solution
Quantity Up to several L (over 10 L very rare)
Duration 10-15 minutes
Frequency Daily
Existing mitigation measures Ventilated bench 1
Operator exposure
Photo-acoustic CMS Bio-check F Formaldehyde air levels
Peak: 0.61 ppm Average: 0.53 ppm Max: 0.42 ppm class E (≥ 0.3ppm)
TLV exceeded YES YES YES
Causes identified for exceeding concentrations
- Poor exhaust ventilation (no chemical hood). - Very small room size (2 operators can hardly work). - Containers are poured too fast.
1
Proposed Risk Management Measures
1. Re-arrange rooms and working spaces: functional to tasks.
2. Provide effective exhaust chemical hood.
3. Avoid misuses, providing task-specific training to personnel involved (i.e. wait few minutes between pourings)
4. Use of personal protective equipment during most critical situation (i.e. mask with AX filter).
An Exposure Scenario for situation no. 6 at University Hospital Luigi Sacco has not
been developed. The situation has not been monitored with CMS sampler and photo-
acoustic monitor because the task (archiving) was not supposed to be critical,
however on personnel request a Bio-check-F sampler has been activated.
Formaldehyde concentrations increased if compared to results of preliminary
campaign (class E vs class C), and this is probably due to the presence of unsealed
containers of biological material put in a normal bin. Although archive is located in the

Results
66
cellar, and operators do not stay there for a long nor they go down frequently, the
removal of unsealed containers from bins is recommended, as well as the sealing of
material to be kept as archive into cupboards (already present).
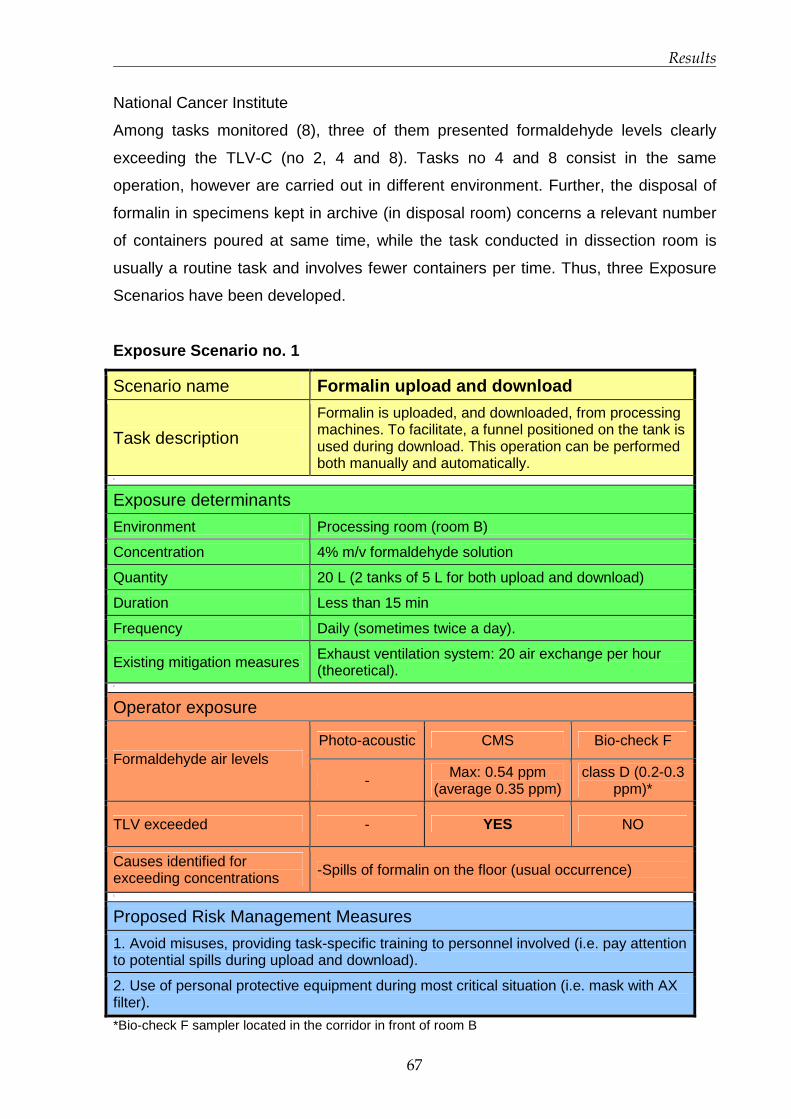
Results
67
National Cancer Institute
Among tasks monitored (8), three of them presented formaldehyde levels clearly
exceeding the TLV-C (no 2, 4 and 8). Tasks no 4 and 8 consist in the same
operation, however are carried out in different environment. Further, the disposal of
formalin in specimens kept in archive (in disposal room) concerns a relevant number
of containers poured at same time, while the task conducted in dissection room is
usually a routine task and involves fewer containers per time. Thus, three Exposure
Scenarios have been developed.
Exposure Scenario no. 1
Scenario name Formalin upload and download
Task description
Formalin is uploaded, and downloaded, from processing machines. To facilitate, a funnel positioned on the tank is used during download. This operation can be performed both manually and automatically.
1
Exposure determinants
Environment Processing room (room B)
Concentration 4% m/v formaldehyde solution
Quantity 20 L (2 tanks of 5 L for both upload and download)
Duration Less than 15 min
Frequency Daily (sometimes twice a day).
Existing mitigation measures Exhaust ventilation system: 20 air exchange per hour (theoretical).
1
Operator exposure
Photo-acoustic CMS Bio-check F Formaldehyde air levels
- Max: 0.54 ppm (average 0.35 ppm)
class D (0.2-0.3 ppm)*
TLV exceeded - YES NO
Causes identified for exceeding concentrations -Spills of formalin on the floor (usual occurrence)
1
Proposed Risk Management Measures
1. Avoid misuses, providing task-specific training to personnel involved (i.e. pay attention to potential spills during upload and download).
2. Use of personal protective equipment during most critical situation (i.e. mask with AX filter).
*Bio-check F sampler located in the corridor in front of room B
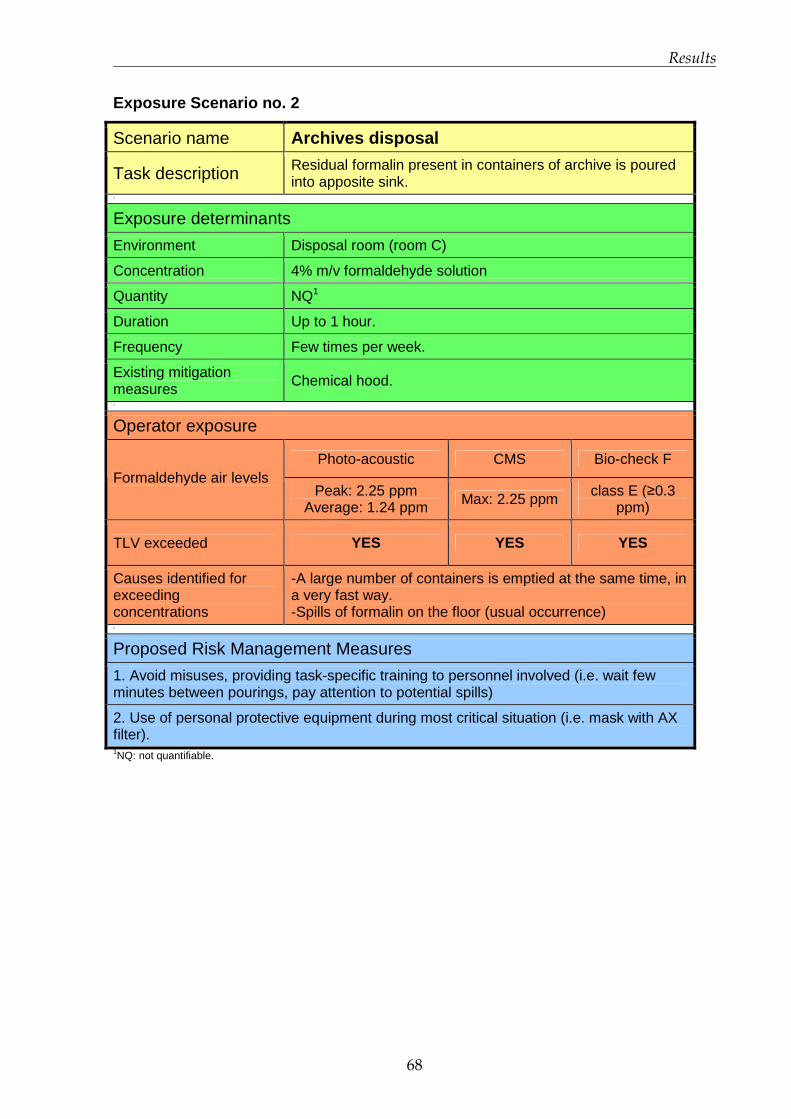
Results
68
Exposure Scenario no. 2
Scenario name Archives disposal
Task description Residual formalin present in containers of archive is poured into apposite sink.
1
Exposure determinants
Environment Disposal room (room C)
Concentration 4% m/v formaldehyde solution
Quantity NQ1
Duration Up to 1 hour.
Frequency Few times per week.
Existing mitigation measures Chemical hood. 1
Operator exposure
Photo-acoustic CMS Bio-check F Formaldehyde air levels
Peak: 2.25 ppm Average: 1.24 ppm Max: 2.25 ppm class E (≥0.3
ppm)
TLV exceeded YES YES YES
Causes identified for exceeding concentrations
-A large number of containers is emptied at the same time, in a very fast way. -Spills of formalin on the floor (usual occurrence)
1
Proposed Risk Management Measures
1. Avoid misuses, providing task-specific training to personnel involved (i.e. wait few minutes between pourings, pay attention to potential spills)
2. Use of personal protective equipment during most critical situation (i.e. mask with AX filter). 1NQ: not quantifiable.
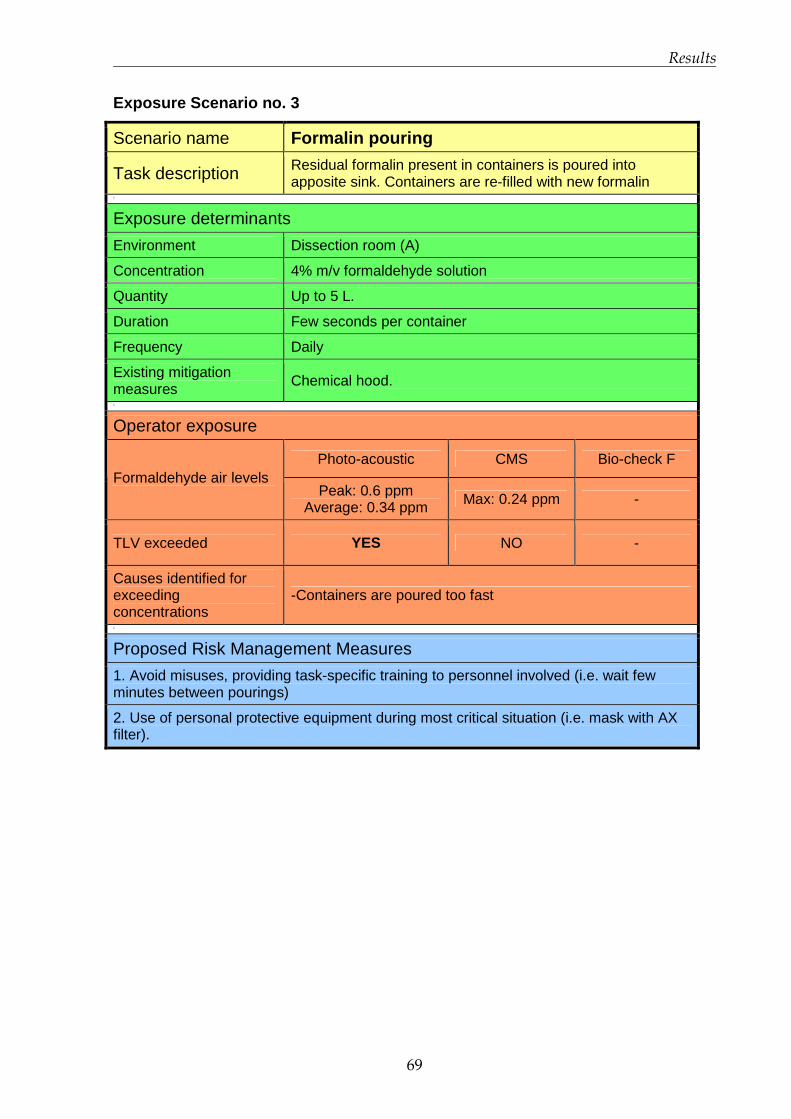
Results
69
Exposure Scenario no. 3
Scenario name Formalin pouring
Task description Residual formalin present in containers is poured into apposite sink. Containers are re-filled with new formalin
1
Exposure determinants
Environment Dissection room (A)
Concentration 4% m/v formaldehyde solution
Quantity Up to 5 L.
Duration Few seconds per container
Frequency Daily
Existing mitigation measures Chemical hood. 1
Operator exposure
Photo-acoustic CMS Bio-check F Formaldehyde air levels
Peak: 0.6 ppm Average: 0.34 ppm Max: 0.24 ppm -
TLV exceeded YES NO -
Causes identified for exceeding concentrations
-Containers are poured too fast
1
Proposed Risk Management Measures
1. Avoid misuses, providing task-specific training to personnel involved (i.e. wait few minutes between pourings)
2. Use of personal protective equipment during most critical situation (i.e. mask with AX filter).
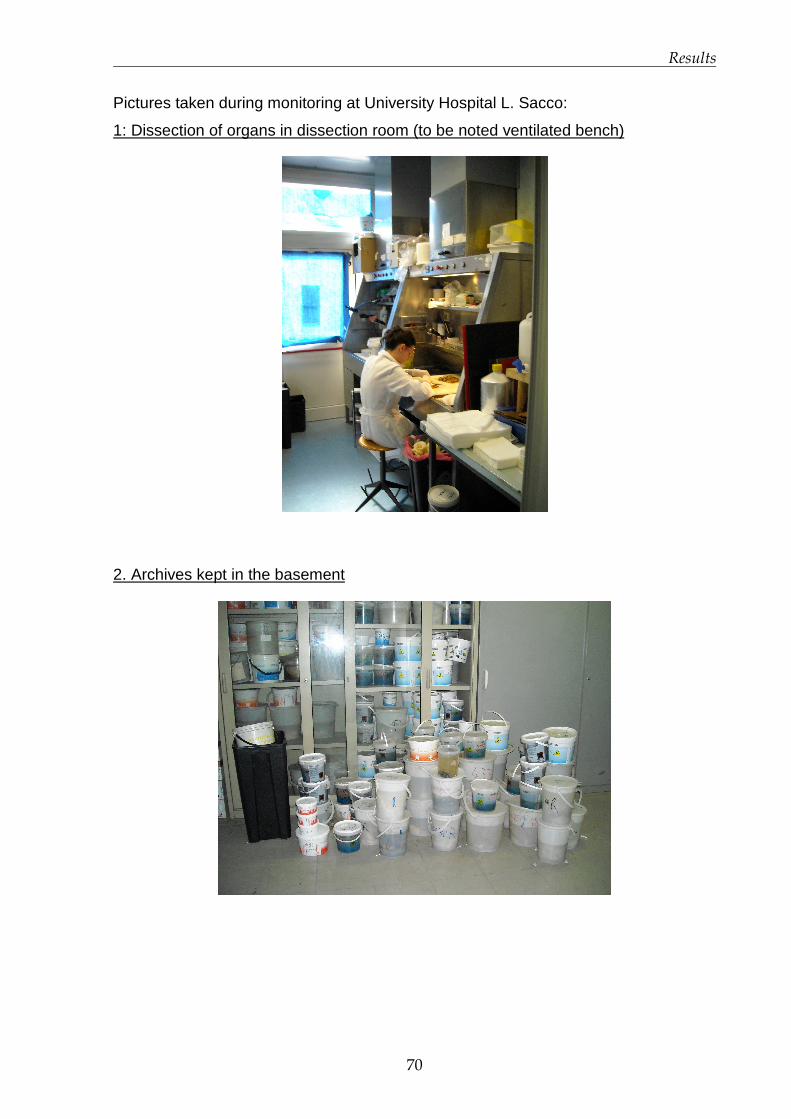
Results
70
Pictures taken during monitoring at University Hospital L. Sacco:
1: Dissection of organs in dissection room (to be noted ventilated bench)
2. Archives kept in the basement

Results
71
Pictures taken during monitoring at National Cancer Institute:
1. Sampling and inclusion into formalin under chemical hood in dissection room
2.Formalin download (a) and upload (b) (manual) in processing room
72
Discussion
4.1 European Project INDEX-UPRIC 2009
4.1.1 Levels of exposure among EU population
In the most recent surveys, the average levels of formaldehyde indoor ranged
between 15 and 50 µg/m3 (12 and 40 ppb). The maximum values were significantly
lower than in the 1980s, as can be noted when comparing the various surveys
carried out in Germany (GerES studies) to the most recent ones from France (OQAI,
Indoor Air Quality Observatory) and AIRMEX project. The trend of decreasing
concentrations can be partially attributed to the less emitting materials being
developed over time in the context of various labelling schemes put in place in
different European countries. Very high concentrations, in particular, have become
less common. However, formaldehyde still features as one of the most common
indoor air pollutants. In particular, data collected suggest that concentrations inside
home are higher than those measured in offices and schools. Wood based materials,
and furniture, due to their formaldehyde-resins content, are one of the main sources
of formaldehyde, especially at the beginning of their employment. New buildings,
dwellings furnished with many wood based materials, low ventilation, high
temperatures and humidity (which facilitate the hydrolysis of formaldehyde molecules
from resin’s terminals), typically experience higher formaldehyde levels when
compared to buildings with opposite characteristics.
Although formaldehyde is considered from scientific community a likely human
carcinogen, and a major indoor air pollutant that has been acknowledged and

Discussion
73
measured for decades across Europe, detailed and representative data on general
population exposure indoors in European Union are still scarce.
In order to better understand and comment INDEX UPRIC 2009 outcomes, a brief
summary of the first edition is reported.
4.1.2 INDEX 2005 summary
The first edition of EU project INDEX “Critical Appraisal of the Setting and
Implementation of Indoor Exposure Limits in the EU” has been funded by DG
SANCO in 2004. The project objectives were the risk assessment for several
pollutants representative of indoor air settings, the proposal of reference values of
exposure and, recommendation of risk management measures (Kotzias et al, 2005).
Substances “of concern” identified as priority (Group 1) for indoors were:
formaldehyde, nitrogen dioxide, carbon monoxide, benzene, naphthalene.
Formaldehyde, due to its adverse effects and its ubiquity, was deemed as the most
problematic. Other chemicals were considered to be “second priority chemicals”
(Group 2): acetaldehyde, toluene, xylenes, styrene. In Group 3: have been included
“chemicals requiring further research with regard to human exposure or dose
response”: ammonia, limonene, α-pinene.
Concerning formaldehyde, a risk characterisation for general population was carried
out. A NOAEL of 0.03 mg/m3 (24 ppb) was derived based on the lowest
concentration estimated not to give effects in the normal population. This evaluation,
expressed by Californian OEHHA, was based on a Scandinavian work survey
(Wilhelmsson and Holmstrom 1992), in which 66 workers of a chemical plant
complained nasal and eye irritation, nasal obstruction, and lower airway discomfort.
In the context of a risk characterisation experiment, the NOAEL was further divided
by an assessment factor of 30, taking into account intra-species variation (10) and
the consideration that children may be more sensitive than adults to formaldehyde
respiratory toxicity (3). This experiment resulted in a paradoxical exposure limit of 1
µg/m3 (0.8 ppb), which is the background concentration of formaldehyde in rural
areas. Nevertheless, the exposure limit officially proposed in INDEX 2005 for
formaldehyde was equivalent to the NOAEL, 30 µg/m3 (24 ppb). Looking at exposure
surveys, it emerged that almost the entire EU population was exposed at indoors
Discussion
74
levels (median level ± sd: 26 ± 6 µg/m3; 90th ± sd: 59 ± 7 µg/m3; N = 6) higher than
the background, with at least 20% of the European population exposed at levels
exceeding 30 µg/m3.
4.1.3 Reconsideration of formaldehyde exposure limi ts
After the proposal concerning formaldehyde exposure limits made by INDEX 2005
some criticism arose (Arts et al. 2008). Arts et al. from Netherlands Organisation for
Applied Scientific Research (TNO) published in 2008 a review funded by the
FormaCare sector group of the European Chemical Industry Council (CEFIC),
assessing the risk characterisation carried out in the INDEX 2005 project. In this
paper the indoor air level of 1 µg/m3 (0.8 ppb) used in the risk characterisation
exercise has been evaluated. The threshold for sensory irritation in human volunteers
was identified to be 1 ppm (1,24 mg/m3), higher than the 100 µg/m3 (~80 ppb)
indicated by WHO and considered in the INDEX 2005 project. The authors
considered that nose and throat irritation, at concentrations below which
hyperplasia/metaplasia occurs, are most likely the consequence of trigeminal nerve
stimulation (sensory irritation). Eye irritation is recognised as the most sensitive effect
reported in human volunteers, but it is considered as a merely local reaction that
requires, if any, a low assessment factor. Concerning children vulnerability in relation
to asthma, it is stressed the difficulty to judge the sensitivity in children because of
the potential confounding factors in the evaluated studies. It is concluded that an
indoor air level of 120 µg/m3 (~0.1 ppm) can be considered safe and appropriate for
the general population, as indicated by Appel et al. in 2006.
The INDEX UPRIC 2009 project, adopted a different, up-to-date approach in
assessing formaldehyde hazards for human health and in indoor exposure limit
calculation, basing its assumptions on the most recent scientific data, choosing
objective, clear, toxicological endpoints from studies conducted in controlled
conditions of exposure and applying chemical specific uncertainty factors as
described in chapter Materials and Methods.

Discussion
75
4.1.4 Protection from effects other than irritation
Several considerations have been elaborated to explain and support the reference
value calculated.
The range of concentration proposed in INDEX UPRIC 2009 (70-100 ppb or 90-120
µg/m3), is considered protective also from impairment of pulmonary function. Human
studies investigating asthma and hyper-sensitisation due to formaldehyde exposure
are not entirely consistent among each other and there is no clear and unambiguous
evidence that children may be more sensitive to formaldehyde toxicity than adults.
However, a possible mechanism explaining the association of the formaldehyde
exposure with asthma exacerbation has been recently hypothesised (OEHHA, 2008).
There is also some concern about synergistic effects between formaldehyde and
allergens that may favourite asthma exacerbation (Casset et al., 2006).
The threshold for pulmonary effects is above 1 ppm, as most studies investigating
this endpoint report a LOAEL between 2 and 3 ppm (Paustenbach et al. 1997). A
potential uncertainty factor for children and asthmatic subjects vulnerability should be
applied to these threshold values, and not to NOELs for sensory irritation. In the
hypothesis of applying a default uncertainty factor of 10 to the threshold for
pulmonary effects, the reference value obtained would be in the order of 0.1 ppm,
which is in the same range of the one based on sensory irritation.
Toxicological data from long-term studies seem to show that irritating effects are
concentration rather than dose (i.e, concentration per time) depended. Paustenbach
1997, OEHHA 2008 and others reviewed several chronic and sub-chronic studies on
animals (Rush et al 1983, Wilmer et al 1989, Woutersen et al 1989), which suggest
the concentration-dependent nature of irritation and cytotoxicity due to formaldehyde
exposure. Particularly, OEHHA deems that NOAELs and LOAELs are similar in the
reviewed studies regardless of exposure duration, and did not apply any ‘sub-chronic
uncertainty factor’ in the calculation of chronic Reference Exposure Limits (RELs).
Also pulmonary functionality was reported to be not affected in sub-chronic exposure
to formaldehyde concentrations below 2 ppm.
Nevertheless, further toxicological data related to exposure to long-term, low
average, levels of formaldehyde, are required to exclude any life-long cumulative
effect.
Discussion
76
Concerning carcinogenicity, the most accredited hypothesis is that inhalation of
formaldehyde under conditions that induce cytotoxicity and sustained regenerative
proliferation within the respiratory tract does represent a carcinogenic hazard (Liteplo
and Meek, 2003). The carcinogenic process may be explained as the result of
cytotoxic damage following severe tissue irritation (Arts, Rennen and de Heer 2006).
Therefore, preventing irritation should be sufficient in order to protect from the
potential carcinogenic effect in upper airways, which is generally observed in animals
starting from long-term exposure to 6 ppm (Kerns et al 1983, Monticello et al. 1996).
However, outcomes of in vivo genotoxicity studies (currently inconclusive) will have to
be considered, particularly in relation to a potential association of formaldehyde with
other tumours than those located in the site of exposure (airways tissues), such as
lympho-hematopoietic tumours.
Since the reference concentration range here calculated, 70-100 ppb or 90-120
µg/m3 for short term exposure is, at least, one order of magnitude lower than the
threshold level observed for cytotoxic damage in the nasal mucosa (Arts, et al. 2006,
WHO 2000), the general population exposed to these concentrations can be
considered to be protected also against the risk for nasal-pharyngeal cancer.
Outcomes from studies about genotoxic effects are currently not entirely consistent,
but should be evaluated and taken into account in the assessment of formaldehyde
carcinogenic potential, considering also other tumours sites than nasopharyngeal
cancers, such as lymphohematopoietic system. In addition, biologically-motivated
computational modelling can be a useful tool in evaluating cancer risk for human
respiratory tract (Conolly et al 2003 and 2004). Relevant outcomes on this topic
published so far have been reported in table B of Appendix D.
4.1.5 Comparison with other reference values
Although selected studies for endpoint identification and the method of calculation
are different, the exposure reference range proposed by INDEX UPRIC 2009 is in the
same order of magnitude of several short-term exposure limits for indoor environment
recommended by several organisation. These guideline values, which have been
published in last years, i.e. by HEALTH CANADA (2005), AFSSET - France (2007),
RIVM – The Netherlands (2007) and by OEHHA - US (2008), are reported in table
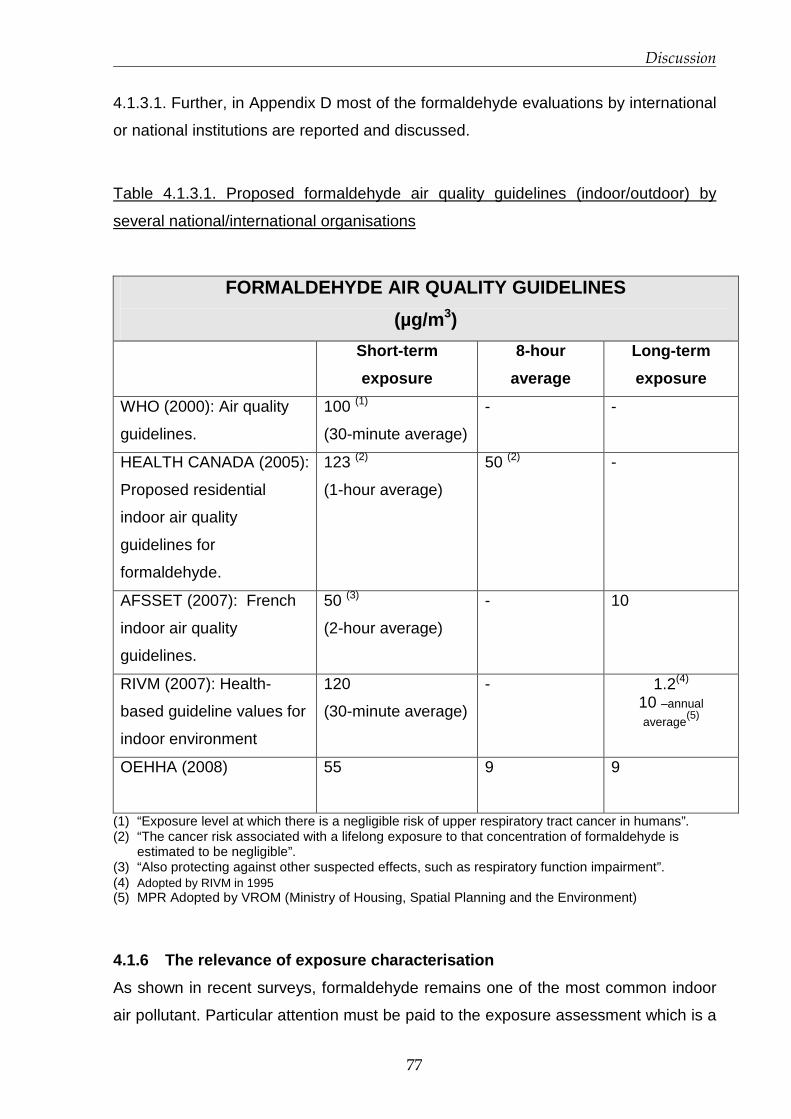
Discussion
77
4.1.3.1. Further, in Appendix D most of the formaldehyde evaluations by international
or national institutions are reported and discussed.
Table 4.1.3.1. Proposed formaldehyde air quality guidelines (indoor/outdoor) by
several national/international organisations
FORMALDEHYDE AIR QUALITY GUIDELINES
(µg/m 3)
Short-term
exposure
8-hour
average
Long-term
exposure
WHO (2000): Air quality
guidelines.
100 (1)
(30-minute average)
- -
HEALTH CANADA (2005):
Proposed residential
indoor air quality
guidelines for
formaldehyde.
123 (2)
(1-hour average)
50 (2) -
AFSSET (2007): French
indoor air quality
guidelines.
50 (3)
(2-hour average)
- 10
RIVM (2007): Health-
based guideline values for
indoor environment
120
(30-minute average)
- 1.2(4) 10 –annual
average(5)
OEHHA (2008)
55 9 9
(1) “Exposure level at which there is a negligible risk of upper respiratory tract cancer in humans”. (2) “The cancer risk associated with a lifelong exposure to that concentration of formaldehyde is
estimated to be negligible”. (3) “Also protecting against other suspected effects, such as respiratory function impairment”. (4) Adopted by RIVM in 1995 (5) MPR Adopted by VROM (Ministry of Housing, Spatial Planning and the Environment)
4.1.6 The relevance of exposure characterisation
As shown in recent surveys, formaldehyde remains one of the most common indoor
air pollutant. Particular attention must be paid to the exposure assessment which is a

Discussion
78
requisite for risk assessment and management purposes. The association of possible
health effects encountered in exposed population with environmental levels
especially, should be analysed with awareness, looking at concentration fluctuations
and at the monitoring method adopted. Among available exposure data reported in
indoor air surveys, results are often not adequate to perform a risk characterisation.
Reasons can be identified in several aspects, being probably the most important the
fact that, very often, concentrations are reported as TWA of several hours or even
days; neither average concentrations are representative of real levels of exposure
nor a specific health endpoint can be correctly associated to TWA. Further, in many
surveys exposure determinants are not identified and/or exposure scenarios are not
thoroughly understood.
However, in some studies reported here, concentrations above 100 µg/m3 have been
observed and can be expected to occur quite often during some domestic tasks or
soon after home refurbishment, especially in the absence of proper ventilation. Other
common practices resulting in secondary sources of formaldehyde indoors, may even
worsen the scenario of short-term/acute exposure to formaldehyde. For example, the
more and more widespread use of fragrances or air fresheners can result, in
presence of ozone (even at very low concentrations), in formaldehyde and ultra-fine
particulate matters production (ECA-IAQ, 2007). Environmental Tobacco Smoke too
is considered a relevant source of formaldehyde in domestic setting as well as the
use of antibacterial detergents.
The matter is that such situations that are potentially leading to peak concentrations
can hardly be detected with conventional, in particular passive, air monitoring
techniques and without a deep understanding of exposure scenarios.
In the light of above considerations, health effects reported in community surveys
should not be associated with time-weighted average levels, which are usually
reported when using traditional air monitoring techniques (either active or passive). If
possible, eventual adverse effect shall be related to concentrations exceeding a
certain threshold. Most of the air monitoring campaigns carried out until now are not
detailed enough to fully characterise the exposure and, hence, to perform a correct
risk evaluation. The identification of crucial situations leading to formaldehyde
exposure as well as of all the parameters determining its emission, spatial distribution
and air concentration can improve the scenario depiction. Moreover, the adoption of

Discussion
79
in-continuous gas detectors, capable to identify and monitor emissions in real-time
i.e. during critical circumstances, can easily detect exceeding air levels.
4.1.7 Recommendations
The exposure reference value for formaldehyde is suggested to be 70-100 ppm or
90-120 µg/m3 as short-term exposure (30 minutes). In order to reduce and contain
formaldehyde exposure the following actions are recommended to policy makers:
• Minimise the emissions of formaldehyde from building materials, products and
furnishings (i.e. through the application of certification systems);
• Discourage the use of formaldehyde in household/office products;
• Require product labelling providing information on potential formaldehyde
release from household and building products;
• Ensure health based ventilation for indoor environments;
• Raise public awareness and provide information to the public about the
sources and prevention of risks from exposure to formaldehyde in indoor
environments.
Long-term implications
Toxicological data associated with long-term exposure to formaldehyde are currently
not exhaustive to define a long-term exposure level to exclude life-long health
hazards. In any case, in order to meet the short-term reference range proposed,
long-term average exposure levels (i.e. those detected with passive air monitoring)
will need to be kept significantly lower, in order to take into account exposure
fluctuations and short–term releases of formaldehyde.

Discussion
80
4.2 Exposure characterisation and Exposure Scenario s in
hospitals
4.2.1 Occupational exposure to formaldehyde in Path ology laboratories.
Occupational exposure to formaldehyde presents marked differences if compared
with indoor exposure, especially for what concern laboratory settings. Personnel
working in Pathology units (technicians, anatomists, pathologists, researchers,
students and attendants) are exposed, even if to very different extents, to
concentrations generated by their working activity, during various tasks which involve
the use (or the presence) of formalin. Formaldehyde contained in the solution easily
evaporates and produces peaks of concentration in the close vicinity. Those peaks
can even reach ppm levels posing a non-negligible risk for personnel health.
In table 4.2.1.1 some studies published in the last 10 years investigating occupational
exposure to formaldehyde in Pathology labs are reported. Using either passive or
active sampling techniques , both environmental and personal monitorings show that
formaldehyde levels can reach worrying concentration (see in particular Orsiere et al,
2006, and Costa et al, 2008).
Table 4.2.1.1 Levels of formaldehyde exposure in Pathology laboratories reported
during the last decade.
Study Sampling method
reported Exposure level
Personal sampling 8
hrs TWA
0.04÷1.6 ppm
Costa et al, 2008
Environmental
sampling 8 hrs TWA
-macroscopic examination: 1.50 ppm;
-disposal: 4.4 ppm.
Pala et al, 2008 Personal passive
sampling 8 hrs TWA
(among different
hospital units, including
pathology).
3.5÷216.1 ppb

Discussion
81
Study Sampling method
reported Exposure level
Active sampling 15 min <0.1÷20.4 ppm. Orsiere et al, 2006
Passive sampling 8 hrs
TWA
<0.1÷0.7 ppm
Environmental
sampling (4-6 hrs)
0.23÷1.03 ppm.
Ohmichi et al,
2006
Personal sampling
(1.1-6 hrs)
0.80, 0.45 and 0.51 ppm (instructors)
1.02, 1.08 and 0.89 ppm (students).
Burgaz et al, 2002 Active monitoring in the
breathing zone
(sampling time not
reported)
2÷4 ppm
0.04÷0.7 ppm (laboratory assistants and
technicians).
Shaham et al,
2002
Personal and
environmental
sampling (15 min).
0.72÷5.6 ppm (physicians and hospital
orderlies).
Air sampling methods reported in literature are often not described in detail. Being
detected with an in-continuous (photo-acoustic gas monitor) or with an active, short-
time, technique (maximum 10 minutes measurement, CMS sampler), maximum
levels of formaldehyde measured in our study seem, to be generally lower than many
of those reported in table 4.2.1.1
4.2.2 Comparison of exposure data with the TLV-C
Threshold Limit Values (TLVs) are set by American Conference of Industrial
Hygienists (ACGIH) to be protective of both acute and long term adverse effects on
workers professionally exposed to a certain substance. The comparison of the TLV to
concentration values measured with the three techniques in both hospitals is
necessary to identify situations leading to potentially critical exposure for operators’

Discussion
82
health. For formaldehyde the TLV is set at 0.3 ppm as ceiling value (TLV-C)
indicating that this exposure limit should not be exceeded at any time. In
consideration of this, values to be compared with the threshold limit should be
measured within the shortest time period to be representative of real levels exposure.
In fact, in the case of exposure to formaldehyde in occupational settings, the
sampling time is a crucial issue, as due to the nature of the substance, fluctuations of
air concentration might occur suddenly. Photo-acoustic monitor, giving a
measurement every ~90 seconds appears to be the most suitable method for the
purpose. Hence, a primary importance is given to photo-acoustic monitor results in
representing actual levels of exposure in respect to those of the other two monitoring
techniques.
As reported in chapter Results, CMS and Bio-check F samplers present
discrepancies when compared to photo-acoustic, but also between each other,
principally due to different sampling times. Both CMS and Bio-check-F samplers
cannot give a real-time reading of air concentrations, thus concentration values
measured in 5-10 minutes or 2 hours respectively, have to be compared with caution
to a threshold limit.
In this study, to consider the exposure during a task as critical and therefore, to
implement an Exposure Scenario, it has been sufficient that results of photo-acoustic
monitor clearly exceeded the TLV-C even if the other two did not. In the case of
invalidated photo-acoustic measurements, CMS and Bio-check F samplers have
been carefully evaluated and used for the comparison with the TLV-C.
University Hospital L. Sacco
Among formaldehyde levels found at University Hospital L. Sacco, 76% of the photo-
acoustic measurements (n=140) exceeded the TLV-C. In particular, 98%, 31%, 78%
of the concentrations determined by the photo-acoustic monitor were higher than the
TLV-C during dissection in room B (situation no. 1), various tasks in room A (situation
no. 2), and during biopsies inclusion into formalin in room A (situation no. 4),
respectively. Further, in these three situations formaldehyde levels exceeded 1 ppm
for several minutes, indicating a characteristic “peak pattern” of exposure. Although
all tasks grouped in situation no.2, were not identified as critical, as they do not
involve the direct use of formalin, levels of formaldehyde measured reached a peak
of 1.05 ppm. Such a concentration is not attributable to routine tasks carried out
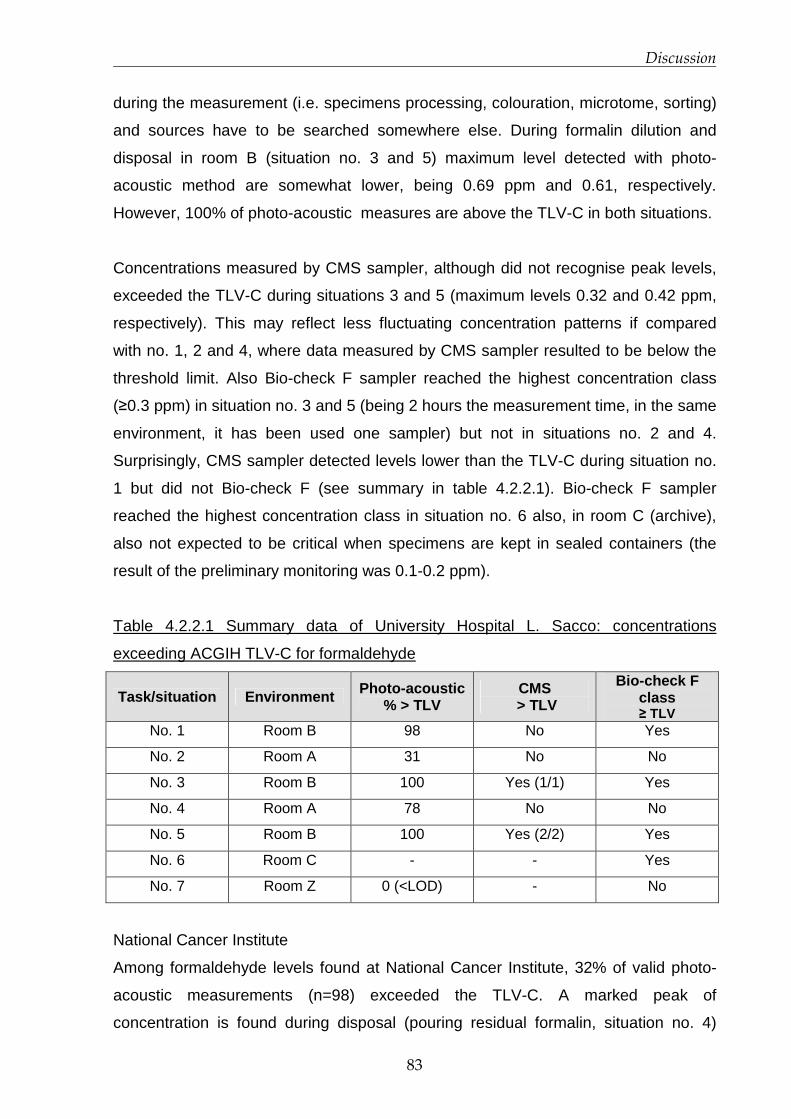
Discussion
83
during the measurement (i.e. specimens processing, colouration, microtome, sorting)
and sources have to be searched somewhere else. During formalin dilution and
disposal in room B (situation no. 3 and 5) maximum level detected with photo-
acoustic method are somewhat lower, being 0.69 ppm and 0.61, respectively.
However, 100% of photo-acoustic measures are above the TLV-C in both situations.
Concentrations measured by CMS sampler, although did not recognise peak levels,
exceeded the TLV-C during situations 3 and 5 (maximum levels 0.32 and 0.42 ppm,
respectively). This may reflect less fluctuating concentration patterns if compared
with no. 1, 2 and 4, where data measured by CMS sampler resulted to be below the
threshold limit. Also Bio-check F sampler reached the highest concentration class
(≥0.3 ppm) in situation no. 3 and 5 (being 2 hours the measurement time, in the same
environment, it has been used one sampler) but not in situations no. 2 and 4.
Surprisingly, CMS sampler detected levels lower than the TLV-C during situation no.
1 but did not Bio-check F (see summary in table 4.2.2.1). Bio-check F sampler
reached the highest concentration class in situation no. 6 also, in room C (archive),
also not expected to be critical when specimens are kept in sealed containers (the
result of the preliminary monitoring was 0.1-0.2 ppm).
Table 4.2.2.1 Summary data of University Hospital L. Sacco: concentrations
exceeding ACGIH TLV-C for formaldehyde
Task/situation Environment Photo-acoustic % > TLV
CMS > TLV
Bio-check F class ≥ TLV
No. 1 Room B 98 No Yes
No. 2 Room A 31 No No
No. 3 Room B 100 Yes (1/1) Yes
No. 4 Room A 78 No No
No. 5 Room B 100 Yes (2/2) Yes
No. 6 Room C - - Yes
No. 7 Room Z 0 (<LOD) - No
National Cancer Institute
Among formaldehyde levels found at National Cancer Institute, 32% of valid photo-
acoustic measurements (n=98) exceeded the TLV-C. A marked peak of
concentration is found during disposal (pouring residual formalin, situation no. 4)
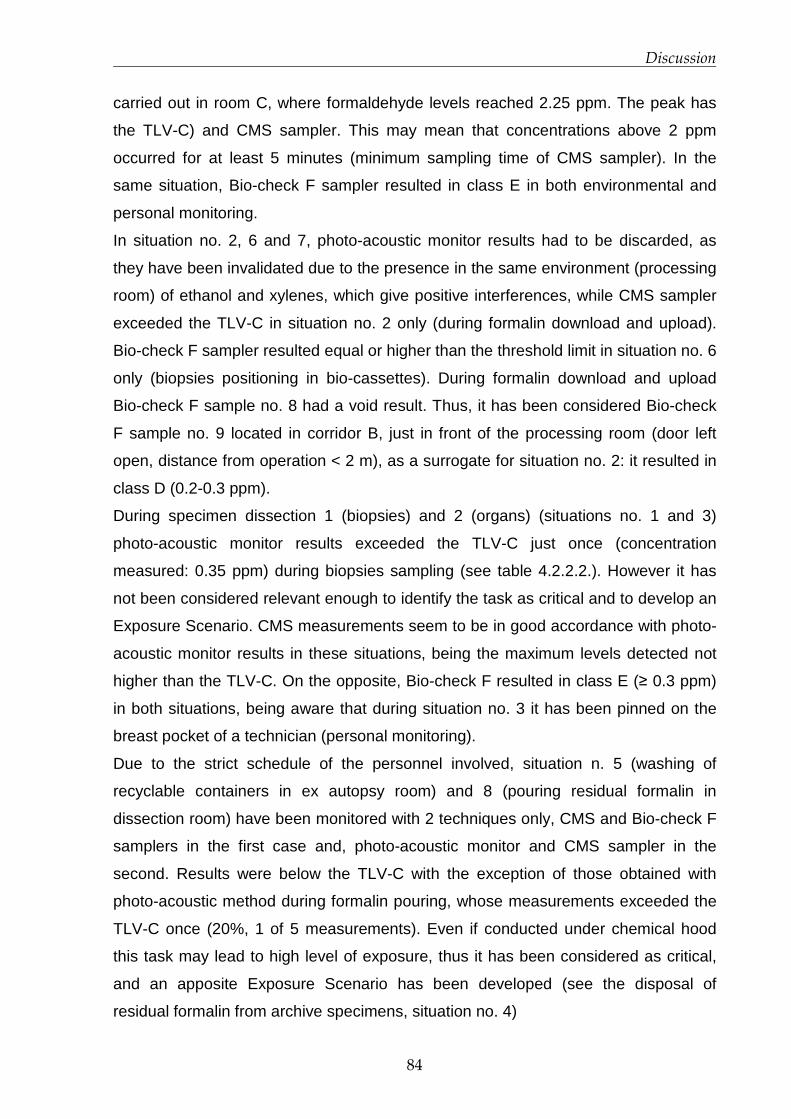
Discussion
84
carried out in room C, where formaldehyde levels reached 2.25 ppm. The peak has
the TLV-C) and CMS sampler. This may mean that concentrations above 2 ppm
occurred for at least 5 minutes (minimum sampling time of CMS sampler). In the
same situation, Bio-check F sampler resulted in class E in both environmental and
personal monitoring.
In situation no. 2, 6 and 7, photo-acoustic monitor results had to be discarded, as
they have been invalidated due to the presence in the same environment (processing
room) of ethanol and xylenes, which give positive interferences, while CMS sampler
exceeded the TLV-C in situation no. 2 only (during formalin download and upload).
Bio-check F sampler resulted equal or higher than the threshold limit in situation no. 6
only (biopsies positioning in bio-cassettes). During formalin download and upload
Bio-check F sample no. 8 had a void result. Thus, it has been considered Bio-check
F sample no. 9 located in corridor B, just in front of the processing room (door left
open, distance from operation < 2 m), as a surrogate for situation no. 2: it resulted in
class D (0.2-0.3 ppm).
During specimen dissection 1 (biopsies) and 2 (organs) (situations no. 1 and 3)
photo-acoustic monitor results exceeded the TLV-C just once (concentration
measured: 0.35 ppm) during biopsies sampling (see table 4.2.2.2.). However it has
not been considered relevant enough to identify the task as critical and to develop an
Exposure Scenario. CMS measurements seem to be in good accordance with photo-
acoustic monitor results in these situations, being the maximum levels detected not
higher than the TLV-C. On the opposite, Bio-check F resulted in class E (≥ 0.3 ppm)
in both situations, being aware that during situation no. 3 it has been pinned on the
breast pocket of a technician (personal monitoring).
Due to the strict schedule of the personnel involved, situation n. 5 (washing of
recyclable containers in ex autopsy room) and 8 (pouring residual formalin in
dissection room) have been monitored with 2 techniques only, CMS and Bio-check F
samplers in the first case and, photo-acoustic monitor and CMS sampler in the
second. Results were below the TLV-C with the exception of those obtained with
photo-acoustic method during formalin pouring, whose measurements exceeded the
TLV-C once (20%, 1 of 5 measurements). Even if conducted under chemical hood
this task may lead to high level of exposure, thus it has been considered as critical,
and an apposite Exposure Scenario has been developed (see the disposal of
residual formalin from archive specimens, situation no. 4)
Discussion
85
Personal monitoring conducted with Bio-check F samplers revealed a non-negligible
condition of exposure of technicians, since the 3 valid samples resulted in the highest
concentration class (equal or above the TLV-C). Working procedures adopted by
operators during these and other situations have been observed during monitoring
and are discussed in paragraph 4.2.3.
All the other Bio-check F samplers used for screening purposes in many
environments (see table 3.2.4.1 in chapter Results), have been useful to check levels
of formaldehyde where fluctuations are not expected, as i.e. in offices, corridors or
single laboratories where there is not a direct use of formalin. Only sample no. 9,
located in corridor B in front of processing room during formalin download/upload
(door left open), resulted in class D (0.2-0.3 ppm), while in all other environments
concentration class detected is much lower (A or B).
Table 4.2.2.2 Summary data of National Cancer Institute: concentrations exceeding
ACGIH TLV-C for formaldehyde
Task/situation Environment Photo-acoustic % > TLV
CMS > TLV
Bio-check F class ≥ TLV
No. 1 Room A 4 No (<LOD) Yes
No. 2 Room B Dis1 Yes (6/7) No
No. 3 Room A 0 No Yes (operator)
No. 4 Room C 100 Yes (3/7) Yes
No. 5 Room D - No No
No. 6 Room B Dis1 No Yes
No. 7 Room B Dis1 No No
No. 8 Room A 20 No - 1Dis: discarded because of positive interferences.
Sometimes, Bio-check F sampler measured not expected, “paradoxical”,
formaldehyde concentrations if compared to photo-acoustic and CMS measurements
in the same situation (namely, Bio-check F results higher than the other two, as in
situation no 1 at National Cancer Institute). This may be explained by the fact that its
sampling time has a fixed duration of 2 hours, in which it must be left in the same
room. The other two techniques for organisation and schedule of the monitoring
survey, are generally left to monitor the same task for one hour at maximum. After

Discussion
86
that photo-acoustic monitor and CMS sampler have been removed, working
conditions may have varied or an unnoticed circumstance have occurred.
4.2.3 Considerations on proposed RMMs
The two hospitals, being focused on different medical specialities, do present very
different work organisation, logistic and mitigation measures already put into place.
However, both present critical situations, potentially leading to a risk for operators’
health. A number of these situations can be resolved (at least partially) by paying
attention on working procedures, especially avoiding misuses. To do this, personal
training is a requisite. They must not only be informed on how to correctly perform a
certain task, avoiding risky situations, but they must be aware of the intrinsic
characteristics of formaldehyde such as physical-chemical behaviour (i.e. being a
gas, it naturally tends to leave the solution) and toxicological properties.
To summarise, Risk Management Measures proposed in the two hospital concern
interventions to be implemented at different levels:
� logistics: re-arranging room and spaces in function to tasks;
� organisation: buying ready-to-use formalin, already diluted to operational
dilution, as well as ready-to-use containers (already filled with formalin);
� mitigation: providing effective ventilation (chemical hood or exhaust ventilation)
� personal protective equipment: providing masks (i.e. AX filters) and also
goggles
� training: general indications to all staff of Pathology Units and specific to
operator for critical tasks. Motivating personnel to use personal protective
equipment is necessary.
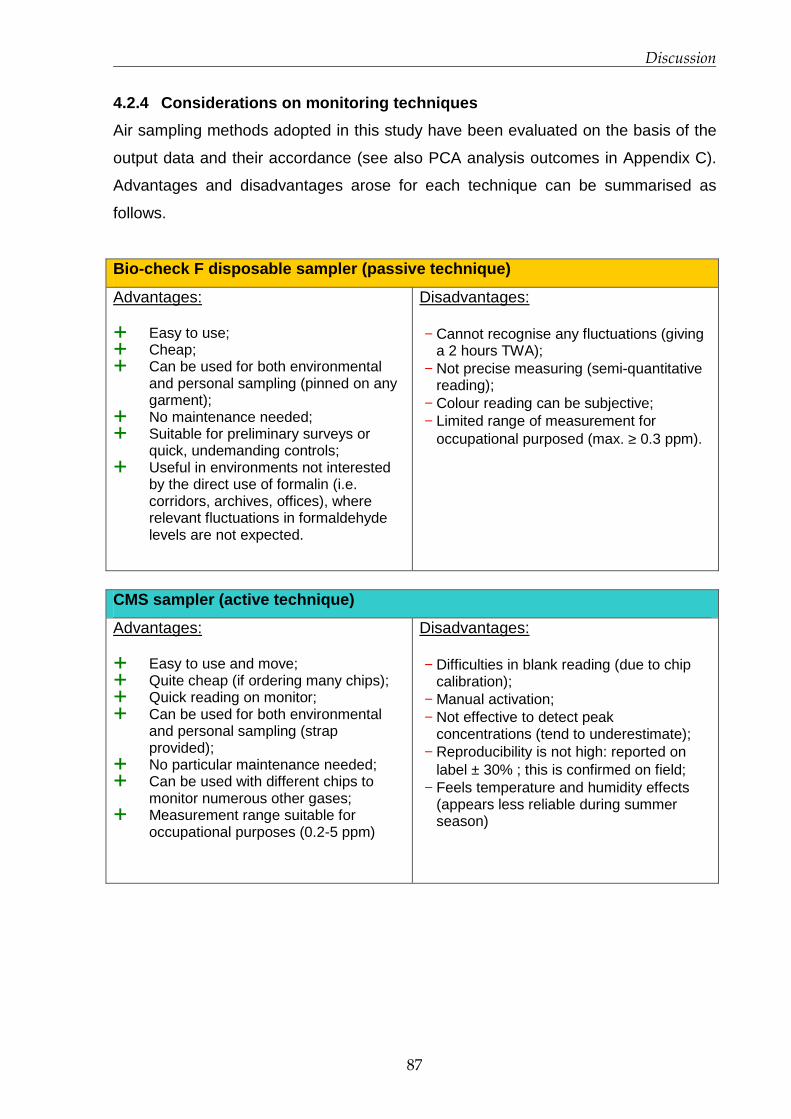
Discussion
87
4.2.4 Considerations on monitoring techniques
Air sampling methods adopted in this study have been evaluated on the basis of the
output data and their accordance (see also PCA analysis outcomes in Appendix C).
Advantages and disadvantages arose for each technique can be summarised as
follows.
Bio-check F disposable sampler (passive technique)
Advantages: � Easy to use; � Cheap; � Can be used for both environmental
and personal sampling (pinned on any garment);
� No maintenance needed; � Suitable for preliminary surveys or
quick, undemanding controls; � Useful in environments not interested
by the direct use of formalin (i.e. corridors, archives, offices), where relevant fluctuations in formaldehyde levels are not expected.
Disadvantages: − Cannot recognise any fluctuations (giving
a 2 hours TWA); − Not precise measuring (semi-quantitative
reading); − Colour reading can be subjective; − Limited range of measurement for
occupational purposed (max. ≥ 0.3 ppm).
CMS sampler (active technique)
Advantages: � Easy to use and move; � Quite cheap (if ordering many chips); � Quick reading on monitor; � Can be used for both environmental
and personal sampling (strap provided);
� No particular maintenance needed; � Can be used with different chips to
monitor numerous other gases; � Measurement range suitable for
occupational purposes (0.2-5 ppm)
Disadvantages: − Difficulties in blank reading (due to chip
calibration); − Manual activation; − Not effective to detect peak
concentrations (tend to underestimate); − Reproducibility is not high: reported on
label ± 30% ; this is confirmed on field; − Feels temperature and humidity effects
(appears less reliable during summer season)

Discussion
88
Photo-acoustic gas monitor (in-continuous technique)
Advantages: � Once switched on it gives
approximately real-time measuring (one measure every~90 s)
� Quick reading on monitor; � Effective to detect peak
concentrations and fluctuations; � Measurement of other gases at the
same time with apposite filters (i.e. methanol, CO2, etc..);
� Measurement range suitable for occupational purposes (0.04 -10 ppm).
Disadvantages: − Specificity: other gases can easily give
interferences if specific filters are not assembled;
− Expensive; − Need maintenance; − Cannot be used for personal sampling.
In the light of above considerations, it seems that photo-acoustic gas monitor would
be the most suitable and fit-to-purpose method to thoroughly understand
formaldehyde air levels in occupational settings where high concentration fluctuations
occur, such as Pathology laboratories. Nevertheless, many aspects have to be taken
into account, starting from economic resources, but also the purposes of the survey.
Of course, when characterising exposure in order to perform a risk assessment, or
when associating formaldehyde levels with specific health effects encountered in
exposed operators, an in-continuous technique is recommended. However, if a
photo-acoustic gas monitor is chosen, particular attention must be paid to the aspect
of interferences. Unfortunately, while sensitivity is very high (LOD is 0.04 ppm),
specificity can be low if filters for those gases likely to interfere are not assembled on
the device. In particular, when monitoring formaldehyde, possible (positively)
interfering substances consist in alcohols and other low-weight aldehydes. A filter for
methanol is assembled on the device used in this study and, when activated, it
measures its air concentration at the same time of formaldehyde. This is very useful,
since when measuring formaldehyde released from formalin buffered with methanol,
as in the case of University Hospital L. Sacco, it can work as a control. If
formaldehyde fluctuation has the same trend of methanol (see chart 4.2.4.1), it can
be reasonably assumed that concentrations measured are due to the release from
formalin, thus are not compromised by the presence of interferences. While
monitoring at National Cancer Institute, instead, the possible presence of alcohols
such as ethanol and xylenes in processing room has been promptly reported by
operators. Photo-acoustic measures resulted clearly affected by positive interference
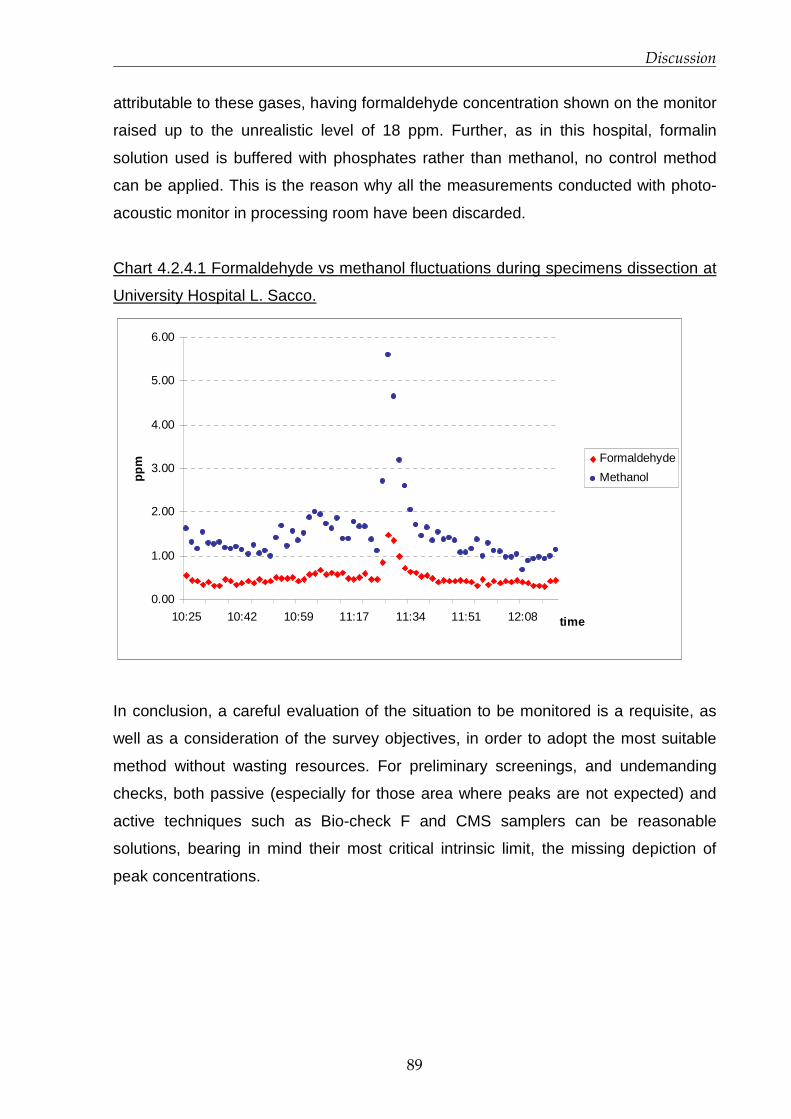
Discussion
89
attributable to these gases, having formaldehyde concentration shown on the monitor
raised up to the unrealistic level of 18 ppm. Further, as in this hospital, formalin
solution used is buffered with phosphates rather than methanol, no control method
can be applied. This is the reason why all the measurements conducted with photo-
acoustic monitor in processing room have been discarded.
Chart 4.2.4.1 Formaldehyde vs methanol fluctuations during specimens dissection at
University Hospital L. Sacco.
0.00
1.00
2.00
3.00
4.00
5.00
6.00
10:25 10:42 10:59 11:17 11:34 11:51 12:08 time
ppm Formaldehyde
Methanol
In conclusion, a careful evaluation of the situation to be monitored is a requisite, as
well as a consideration of the survey objectives, in order to adopt the most suitable
method without wasting resources. For preliminary screenings, and undemanding
checks, both passive (especially for those area where peaks are not expected) and
active techniques such as Bio-check F and CMS samplers can be reasonable
solutions, bearing in mind their most critical intrinsic limit, the missing depiction of
peak concentrations.
90
Conclusions
5.1 European Project INDEX-UPRIC 2009
In 2009, DG SANCO funded an update of the 2005 project INDEX “Critical Appraisal of the
Setting and Implementation of Indoor Exposure Limits in the EU”. DG SANCO required a
particular focus on formaldehyde, on the basis of new papers published following its re-
classification in Group 1 (sufficient epidemiological and scientific evidence for an
association with nasopharyngeal cancer) by IARC. INDEX-UPRIC 2009 (“UPdate of
PRIority Compounds”) aimed at reviewing recent scientific data, but also at re-examining
previous studies and re-considering the reference values proposed in 2005. From selected
results of scientific literature and an innovative approach in applying uncertainty factors,
making the best use of chemical specific data on toxicodynamics and toxicokinetics, new
reference limits have been proposed for exposure to formaldehyde in indoor settings.
The reference range of values for short-term exposure (30 minutes) proposed at EU level
is 70-100 ppb (or 90-120 µg/m3); it is comparable to most of exposure limits set by other
national or international organisation. WHO in particular, in the latest version of IAQ
guidelines (just published in December 2010), even if resulting from a different calculation,
recommends a limit of 100 µg/m3 (~80 ppb) for short-term exposure.
The reference values proposed by INDEX UPRIC 2009 should be used for the risk
characterisation of situations related to acute exposure to formaldehyde indoors. In the
light of scientific data available, it can be considered protective from carcinogenic effects in
relation to short-term exposure, although it is derived from an irritation endpoint. Always
looking at the scientific evidence available so far, there is no indication of cumulative
effects following exposure to low concentrations (below 1 ppm), as adverse effects seem
Conclusions
91
to recover shortly after exposure period. Current knowledge allows to reasonably assume
that the proposed reference range of concentrations is also protective from long-term
health effects due to repetitive short-term exposures. However, attention must be paid at
the outcomes of genotoxicity studies (currently inconclusive), particularly with concern to a
potential association of formaldehyde with increased incidence of tumours other than
those located in the site of exposure (airways tissues).
5.2 Exposure characterisation and Exposure Scenario s in
hospitals
The hazard characterisation of formaldehyde carried out in INDEX UPRIC project indicates
that recurrent, short-term, peak exposures, rather than exposure to constant levels, are
expected to adversely affect eyes and upper airways in exposed subjects, posing also a
potential risk for more severe health outcomes. Exposure to formaldehyde in occupational
settings, and particularly in Pathology labs, appears to be characterised by concentration
fluctuations and peaks. To perform a correct exposure assessment in Pathology Units, and
to eventually associate exposure levels with health effects, an in-depth understanding of
determinant factors of exposure and actual air levels, is a requirement. The project aimed
to reach this goal through the development of detailed Exposure Scenarios and the
characterisation of concentration fluctuations during specific tasks in Pathology Units of
two different hospitals.
Three monitoring methods have been adopted: passive, active and in-continuous
techniques have been tested and their outcomes analysed. Potential hazards for
operators’ health have been identified during the performance of several tasks, being
measured formaldehyde levels clearly above the TLV-C set by US ACGIH (0.3 ppm). From
circumstances observed during monitoring, some misuses have been identified as well as
inappropriateness of some organisational, logistic, and mitigation factors leading to high
level of exposure (even above 1 ppm). Exposure Scenarios for critical tasks have been
presented, including operational conditions, formaldehyde levels detected by the three
techniques, possible causes of rises above the TLV-C, and proposed RMMs .
Due to intrinsic properties of formaldehyde, its release from formalin solution is
unavoidable, thus the implementation of RMMs is particularly crucial to avoid excessive
exposure of operators. Much can be done in order to reduce critical situations, but

Conclusions
92
measures to put into practice must be shared within all personnel working in the Unit. Less
problematic alternatives (i.e. glutaraldehyde) should be also taken into account,
considering the current debate on carcinogenicity and being formaldehyde in revision of
classification at EU level as a consequence of a French request to place it among
Carcinogens Category 1.
Proposed RMMs have started to be put into place by Prevention and Protection Service of
both hospitals. Very soon after their implementation another monitoring survey is foreseen,
in order to check their effectiveness and appropriateness.
93
Bibliography
AFSSET Working Group on Indoor Air Quality Guideline Values ‘Indoor Air Quality
Guideline Value Proposals Formaldehyde’, Final version no. 2. January 2007 (http://www.afsset.fr/upload/bibliotheque/352292954499698728132467989762/formaldehyde_160
608.pdf), last accessed June 2009. Andersen, M. E., H. J. Clewell, E. Bermudez, G. A. Willson & R. S. Thomas (2008)
Genomic signatures and dose-dependent transitions in nasal epithelial responses to inhaled formaldehyde in the rat. Toxicological Sciences, 105, 368-383.
Andjelkovich DA, Janszen DB, Brown MH, Richardson RB, Miller FJ (1995) Mortality of iron foundry workers: IV. Analysis of a subcohort exposed to formaldehyde. Journal of occupational and environmental medicine, 37(7):826-37.
Annesi-Maesano I., Debotte G., Moreau D. et al. (2001) Measurements of air pollutants in elementary schools in the six cities of metropolitan France in the framework of the ISAAC study. Proc. Of the 12th World Clean Air & Environment Congress and Exhibition, 26-31 August 2001, Seoul, Korea.
Appel, U. Bernauer, U. Herbst, S. Madle, A. Schulte, H.B. Richter-Reichhelm and U. Gundert-Remy (2006) Kann für Formaldehyd eine “sichere” Konzentration abgeleitet werden?—Analyse der Daten zur krebserzeugenden Wirkung (Can a “safe” concentration be established for formaldehyde?—Analysis of carcinogenicity data), Umweltmed. Forsch. Prax. 11, pp. 347–361.
Arts, J. H. E., H. Muijser, C. F. Kuper & R. A. Woutersen (2008) Setting an indoor air exposure limit for formaldehyde: Factors of concern. Regulatory Toxicology and Pharmacology, 52, 189-194.
Arts, J. H. E., M. A. J. Rennen & C. de Heer (2006) Inhaled formaldehyde: Evaluation of sensory irritation in relation to carcinogenicity. Regulatory Toxicology and Pharmacology, 44, 144-160.
Aslan H, Songur A, Tunc AT, Ozen OA, Bas O, Yagmurca M, Turgut M, Sarsilmaz M, Kaplan S. (2006). Effects of formaldehyde exposure on granule cell number and volume of dentate gyrus: a histopathological and stereological study. Brain Research, 1122(1), 191-200.

Bibliography
93
ASPA. 2005. Campagne de mesure du formaldéhyde dans les établissements scolaires et d’accueil de petite enfance de la ville de Strasbourg : bilan des niveaux mesurés. http://www.atmo-alsace.net
Bartzis J et al.(2008) Concentrations of VOCs and ozone in indoor environments: A case study in two mediteranean cities during winter period. Fresenius Environmental Bulletin, 17: 1480.
Beane Freeman LE, Blair A, Lubin JH, Stewart PA, Hayes RB, Hoover RN, Hauptmann M (2009) Mortality from lymphohematopoietic malignancies among workers in formaldehyde industries: the National Cancer Institute Cohort. Journal of the National Cancer Institute, 101(10), 751-61. Epub 2009 May 12.
Bertazzi PA, Pesatori A, Guercilena S, Consonni D, Zocchetti C (1989) [Carcinogenic risk for resin producers exposed to formaldehyde: extension of follow-up]. La Medicina del lavoro, 80(2), 111-22.
BGIA. 2005. Innenraumarbeitsplätze – Vorgehensempfehlung für die Ermittlungen zum Arbeitsumfeld, Report der gewerblichen Berufsgenossenschaften, des Unfallversicherungsträger des öffentlichen Hand und des Berufsgenossenschaftlichen Instituts für Arbeitsschutz – BGIA, ISBN 3-88383-681-8.
Blair A, Zheng T, Linos A, Stewart PA, Zhang YW, Cantor KP (2001) Occupation and leukemia: a population-based case-control study in Iowa and Minnesota. Am J Ind Med 40 (1):3.14. (Support not reported. Authors affiliated with NCI; Yale University School of Public Health, CT; University of Athens, Greece).
Bolt, H. M. & A. Huici-Montagud (2008) Strategy of the scientific committee on occupational exposure limits (SCOEL) in the derivation of occupational exposure limits for carcinogens and mutagens. Archives of Toxicology, 82, 61-64.
Bolte G, Heitmann D, Kiranoglu M, Schierl R, Diemer J, Koerner W, Fromme H (2008) Exposure to environmental tobacco smoke in German restaurants, pubs and discotheques. Journal of exposure science & environmental epidemiology, 18(3), 262-71.
Burgaz S, Erdem O, Cakmak G, Erdem N, Karakaya A, Karakaya AE (2002). Cytogenetic analysis of buccal cells from shoeworkers and pathology and anatomy laboratory workers exposed to n-hexane, toluene, methyl ethyl ketone and formaldehyde. Biomarkers. 7(2):151-61. Erratum in: Biomarkers. 2006 Jul-Aug;11(4):383.
Casanova, M., Morgan, K. T., Steinhagen, W. H., Everitt, J. I., Popp, J. A., and Heck, H (1991) Covalent binding of inhaled formaldehyde to DNA in the respiratory tract of rhesus monkeys: pharmacokinetics, rat-to-monkey interspecies scaling, and extrapolation to man. Toxicol. Appl. Pharmacol. 17, 409-428.
Casanova M, Morgan KT, Gross EA, Moss OR, Heck HA (1994) DNA-protein cross-links and cell replication at specific sites in the nose of F344 rats exposed subchronically to formaldehyde. Fundamental and applied toxicology, 23(4), 525-36.
Bibliography
94
Cassee, F. R., J. P. Groten & V. J. Feron (1996) Changes in the nasal epithelium of rats exposed by inhalation to mixtures of formaldehyde, acetaldehyde, and acrolein. Fundamental and Applied Toxicology, 29, 208-218.
Casset, A., C. Marchand, A. Purohit, S. le Calve, B. Uring-Lambert, C. Donnay, P. Meyer & F. de Blay (2006) Inhaled formaldehyde exposure: effect on bronchial response to mite allergen in sensitized asthma patients. Allergy, 61, 1344-1350.
Clausen PA (1993). Emission Of Volatile And Semivolatile Organic Compounds From Waterborne Paints – The Effect Of The Film Thickness. International journal of indoor environment and health, Volume 3, Issue 4, 269–275.
Coggon D, Harris EC, Poole J, Palmer KT (2003) Extended follow-up of a cohort of british chemical workers exposed to formaldehyde. Journal of the National Cancer Institute, 95(21), 1608-15.
Cogliano, V. J., Y. Grosse, R. A. Baan, K. Straif, M. B. Secretan, F. El Ghissassi & V. Working Grp (2005) Meeting report: summary of IARC monographs on formaldehyde, 2-butoxyethanol, and 1-tert-butoxy-2-propanol. Environmental Health Perspectives, 113, 1205-1208.
Conolly (2004) Human respiratory tract cancer risks of inhaled formaldehyde: Dose-response predictions derived from biologically-motivated computational modeling of a combined rodent and human dataset. Toxicological Sciences, 82, 279-296.
Conolly, R. B., J. S. Kimbell, D. Janszen, P. M. Schlosser, D. Kalisak, J. Preston & F. J. Miller (2003) Biologically motivated computational modeling of formaldehyde carcinogenicity in the F344 rat. Toxicological Sciences, 75, 432-447.
Costa S, Coelho P, Costa C, Silva S, Mayan O, Santos LS, Gaspar J, Teixeira JP (2008). Genotoxic damage in pathology anatomy laboratory workers exposed to formaldehyde. Toxicology. 30;252(1-3):40-8. Epub 2008 Jul 31.
Directive 98/8/EC of the European Parliament and of the Council of 16 February 1998 concerning the placing of biocidal products on the market
http://eur-lex.europa.eu/LexUriServ/LexUriServ.do?uri=CELEX:31998L0008:EN:NOT last accessed December 2010.
Domsic S., Squinazi F. 2001. Connaissance de l’exposition de jeunes enfants à la
pollution atmosphérique dans les crèches parisiennes. Convention DRASSIF-LHVP. Avenant n°10, Rapport d’étape. Laboratoire d’ Hygiène de la Ville de Paris. Mairie de Paris + Complément au rapport. In French.
ECA-IAQ (European Collaborative Action, Urban Air, Indoor Environment and Human Exposure), 2007. Impact of Ozone-initiated Terpene Chemistry on Indoor Air Quality and Human Health, Report No 26. EUR 23052 EN. Luxembourg: Office for Official Publications of the European Communities.

Bibliography
95
ECHA-08-GF-07-EN, “Guidance on information requirements and chemical safety assessment - Part D: Exposure Scenario Building”, European Chemicals Agency, Helsinki 2008
(http://echa.europa.eu/doc/reach/echa_08_gf_07_inforeq_csr_part_d_en_20080721.pdf )last accessed November 2010. Ezratty, V., M. Bonay, C. Neukirch, G. Orset-Guillossou, M. Dehoux, S. Koscienlny, P. A.
Cabanes, J. Lambrozo & M. Aubier (2007) Effect of formaldehyde on asthmatic response to inhaled allergen challenge. Environmental Health Perspectives, 115, 210-214.
Feron VJ, Bruyntjes JP, Woutersen RA, Immel HR, Appelman LM (1988) Nasal tumours in rats after short-term exposure to a cytotoxic concentration of formaldehyde. Cancer letters, 39(1), 101-11.
FormaCare. «Socio-Economic Benefits of Formaldehyde to the European Union (EU 25) and Norway.» Press Conference. Weymouth, January 2008. http://www.formaldehyde-europe.org/index.php?id=138, last accessed November 2010.
Fromme H, Heitmann D, Dietrich S, Schierl R, Körner W, Kiranoglu M, Zapf A, Twardella D (2008) [Air quality in schools - classroom levels of carbon dioxide (CO2), volatile organic compounds (VOC), aldehydes, endotoxins and cat allergen]. Gesundheitwesen, 70(2), 88-97.
Gaston, B., S. Sears, J. Woods, J. Hunt, M. Ponaman, T. McMahon & J. S. Stamler (1998) Bronchodilator S-nitrosothiol deficiency in asthmatic respiratory failure. Lancet, 351, 1317-1319.
GerES I (1985/86) Health and Environmental Hygiene German Environmental Survey (GerES). Umweltbundesamt (The Federal Environment Agency).
Golalipour MJ, Kord H, Ghafari S, Gharravi AM, Davarian A, Fazeli SA, Azarhoush R.(2008) Morphometric alterations of the rat spleen following formaldehyde exposure. Folia Morphol (Warsz), 67(1), 19-23.
Guyton KZ, Chiu WA, Bateson TF, Jinot J, Scott CS, Brown RC, Caldwell JC. (2009) A reexamination of the PPAR-alpha activation mode of action as a basis for assessing human cancer risks of environmental contaminants. Environmental Health Perspectives, 117(11), 1664-72.
Hauptmann M, Stewart PA, Lubin JH, Beane Freeman LE, Hornung RW, Herrick RF, Hoover RN, Fraumeni JF Jr, Blair A, Hayes RB (2009) Mortality from lymphohematopoietic malignancies and brain cancer among embalmers exposed to formaldehyde. Journal of the National Cancer Institute, 101(24), 1696-708.
Hayes RB, Gerin M, Raatgever JW, de Bruyn A (1986) Wood-related occupations, wood dust exposure, and sinonasal cancer. American journal of epidemiology, 124(4), 569-77.
Bibliography
96
Hildesheim A, Dosemeci M, Chan CC, Chen CJ, Cheng YJ, Hsu MM, Chen IH, Mittl BF, Sun B, Levine PH, Chen JY, Brinton LA, Yang CS. (2001) Occupational exposure to wood, formaldehyde, and solvents and risk of nasopharyngeal carcinoma. Cancer Epidemiology, Biomarkers and Prevention, 10(11),1145-53.
HVS. 2009. Hainaut Vigilance Sanitaire, Projet « Crèches » : Mise au point d’un outil d’évaluation et analyse de l’environnement intérieur. http://www.nehap.be
IARC 2006. C. Bosetti, J. K. McLaughlin, R. E. Tarone, E. Pira & C. La Vecchia (2006) Formaldehyde and cancer risk: a quantitative review of cohort studies through 2006. Oxford Journals, Annals of Oncology , 19(1), 29-43.
IARC. 2006. IARC Monographs on the Evaluation of Carcinogenic Risks to Humans. Formaldehyde, 2-Butoxyethanol and 1-tert-Butoxypropan-2-ol, vol. 88, Lyon, France: International Agenc for Research on Cancer. p. 39-325.
IPCS (2006) Chemical-specific adjustment factors for interspecies differences and human variability: guidance document for use of data in dose/concentration-response assessment. Harmonization Project Document No. 2. WHO
Jensen, D. E., G. K. Belka & G. C. Du Bois (1998) S-Nitrosoglutathione is a substrate for rat alcohol dehydrogenase class III isoenzyme. Biochemical Journal, 331, 659-668.
Jeppe-Jensen D, Clausen H, Leigh IM, Lane EB, Dabelsteen E (1993) Three monoclonal antibodies differentiate human from murine epidermis. Epithelial Cell Biology, 2(3), 100-6.
Kamata E, Nakadate M, Uchida O, Ogawa Y, Suzuki S, Kaneko T, Saito M, Kurokawa Y. (1997) Results of a 28-month chronic inhalation toxicity study of formaldehyde in male Fisher-344 rats. The Journal of toxicological sciences, 22(3), 239-54.
Kerns, W.D., Pavkov, K.L., Donofrio, D.J., Gralla, E.J., Swenberg, J.A. (1983). Carcinogenicity of formaldehyde in rats and mice after long-term inhalation exposure. Cancer Res. 43, 4382–4392
Kirchner S, Arenes J-F, Cochet C, Derbez M, Duboudin C, Elias P, Gregoire A, Jédor B, Lucas J-P, Pasquier N, Pigneret M, Ramalho O. (2006) OQAI (Observatoire de la Qualité de l’Air Intérieur) National survey: Indoor air quality in French dwellings. Final report. CSTB Département Développement Durable, Division Santé. Paris, FRANCE , 91 pp.
Kotzias D, Koistinen K, Kephalopoulos S, Schlitt C, Carrer P, Maroni M, Jantunen M, Cochet C, Kirchner S, Lindvall T, McLaughlin J, Mølhave L, Fernandes EdO and Seifert B.(2005) The INDEX project. Critical Appraisal of the Setting and Implementation of Indoor Exposure Limits in the EU. Final Report. European Commission Directorate-General Joint Research Centre. Institute for Health and Consumer Protection. Physical and Chemical Exposure Unit, 331 pp.
Kotzias D; Geiss O, Tirendi S et al.(2009) Exposure to multiple air contaminants in public buildings, schools and kindergartens. the European indoor air monitoring and exposure assessment (AIRMEX) study. Fresenius Environmental Bulletin, 18(5): 670-681.

Bibliography
97
Krakowiak, A., P. Gorski, K. Pazdrak & U. Ruta (1998) Airway response to formaldehyde inhalation in asthmatic subjects with suspected respiratory formaldehyde sensitization. American Journal of Industrial Medicine, 33, 274-281.
Ku RH, Billings RE (1984) Relationships between formaldehyde metabolism and toxicity and glutathione concentrations in isolated rat hepatocytes, Chemico-Biological Interactions, 51(1), 25-36.
KUS. 2008. Vergleichswerte für flüchtige organische Verbindungen (VOC und Aldehyde) in der Innenraumluft von Haushalten in Deutschland, Ergebnisse des repräsentativen Kinder-Umwelt- Surveys (KUS) des Umweltbundesamtes. Bundesgesundheitsblatt – Gesundheitsforschung – Gesundheitsschutz 2008, 51: 109-112.
Lang, I., T. Bruckner & G. Triebig (2008) Formaldehyde and chemosensory irritation in humans: A controlled human exposure study. Regulatory Toxicology and Pharmacology, 50, 23-36.
Lide, D.R., ed. (2003) CRC Handbook of Chemistry and Physics, 84th Ed., Boca Raton, FL, CRC Press, p. 3-288
Liteplo, R. G. and Meek, M. E.(2003)’Inhaled Formaldehyde: Exposure Estimation, Hazard Characterization, and Exposure-Response Analysis’, Journal of Toxicology and Environmental Health, Part B,6:1,85 — 114
Lu K, Boysen G, Gao L, Collins LB, Swenberg JA (2008) Formaldehyde-induced histone modifications in vitro. Chemical research in toxicology, 21(8), 1586-93.
Luce D, Gérin M, Berrino F, Pisani P, Leclerc A (1993) Sources of discrepancies between a job exposure matrix and a case by case expert assessment for occupational exposure to formaldehyde and wood-dust. International journal of epidemiology, 22 Suppl 2, S113-20.)
Luce D, Gérin M, Leclerc A, Morcet JF, Brugère J, Goldberg M (1993) Sinonasal cancer and occupational exposure to formaldehyde and other substances. International journal of cancer, 53(2), 224-31.
Luce D, Leclerc A, Bégin D, Demers PA, Gérin M, Orlowski E, Kogevinas M, Belli S, Bugel I, Bolm-Audorff U, Brinton LA, Comba P, Hardell L, Hayes RB, Magnani C, Merler E, Preston-Martin S, Vaughan TL, Zheng W, Boffetta P (2002) Sinonasal cancer and occupational exposures: a pooled analysis of 12 case-control studies. Cancer causes & control, 13(2), 147-57.
LUKI – LUft und KInder, Einfluss der Innen-raumluft auf die Gesundheit von Kindern in Ganztagsschulen, Endbericht, Umweltbundesamt, REP-0182, ISBN: 3-85457-980-2. 2008, 236 pages. http://www.umweltbundesamt.at/fileadmin/ site/publikationen/REP0182.pdf
Majumder PK, Kumar VL. (1995) Inhibitory effects of formaldehyde on the reproductive system of male rats. Indian Journal of Physiology and Pharmacology, 39(1), 80-2.

Bibliography
98
Marchand C, Le Calve S, Mirabel P et al. (2008) Concentrations and determinants of gaseous aldehydes in 162 homes in Strasbourg (France). Atmospheric Environment, 42(3): 505-516.
Monticello, T.M., Swenberg, J.A., Gross, E.A., Leininger, J.R., Kimbell, J.S., Seilkop, S., Starr, T.B., Gibson, J.E., Morgan, K.T. (1996) Correlation of regional and nonlinear formaldehyde-induced nasal cancer with proliferating populations of cells. Cancer Res. 56, 1012–1022.
Morgan KT, Gross EA, Patterson DL.(1986) Distribution, progression, and recovery of acute formaldehyde-induced inhibition of nasal mucociliary function in F-344 rats. Toxicology and applied pharmacology, 86(3), 448-56.
Naya, M. & J. Nakanishi (2005) Risk assessment of formaldehyde for general population in Japan. Toxicology Letters, 158, S147-S147.
Nielsen, G. D., K. S. Hougaard, S. T. Larsen, M. Hammer, P. Wolkoff, P. A. Clausen, C. K. Wilkins & Y. Alarie (1999) Acute airway effects of formaldehyde and ozone in BALB/c mice. Human & Experimental Toxicology, 18, 400-409.
Nielsen, G. D., S. T. Larsen, O. Olsen, M. Lovik, L. K. Poulsen, C. Glue & P. Wolkoff (2007) Do indoor chemicals promote development of airway allergy? Indoor Air, 17, 236-255.
Noisel, N., M. Bouchard & G. Carrier (2007) Evaluation of the health impact of lowering the formaldehyde occupational exposure limit for Quebec workers. Regulatory Toxicology and Pharmacology, 48, 118-127.
NTP 2010 Jan;(10-5981):i-512. Final Report on Carcinogens Background Document for Formaldehyde. National Toxicology Program. U.S. Department of Health and human Services.
OEHHA, Formaldehyde Reference Exposure Levels DRAFT 2008 (Methanal, oxomethane, methylene oxide)
Ohmichi K, Komiyama M, Matsuno Y, Takanashi Y, Miyamoto H, Kadota T, Maekawa M, Toyama Y, Tatsugi Y, Kohno T, Ohmichi M, Mori C (2006) Formaldehyde exposure in a gross anatomy laboratory--personal exposure level is higher than indoor concentration. Environ Sci Pollut Res Int.13(2):120-4.
Olsen JH, Jensen SP, Hink M, Faurbo K, Breum NO, Jensen OM (1984) Occupational formaldehyde exposure and increased nasal cancer risk in man. Int J Cancer 34(5): 639-644. (Support not reported. Authors affiliated with Danish Cancer Registry, Denmark; Labour Inspection Service, Denmark; Danish National Institute of Occupational Health.).
Olsen JH, Asnaes S (1986) Formaldehyde and the risk of squamous cell carcinoma of the sinonasal cavities. British journal of industrial medicine, 43(11), 769-74.
Olsen JH, Møller H, Jensen OM (1988) Risks for respiratory and gastric cancer in wood-working occupations in Denmark. Journal of cancer research and clinical oncology, 114(4), 420-4.
Bibliography
99
Orsière T, Sari-Minodier I, Iarmarcovai G, Botta A (2006) Genotoxic risk assessment of pathology and anatomy laboratory workers exposed to formaldehyde by use of personal air sampling and analysis of DNA damage in peripheral lymphocytes. Mutation research, 605(1-2), 30-41.
Ott MG, Teta MJ, Greenberg HL (1989) Lymphatic and hematopoietic tissue cancer in a chemical manufacturing environment. American journal of industrial medicine, 16(6), 631-43.
Ozen OA, Akpolat N, Songur A, Kuş I, Zararsiz I, Ozaçmak VH, Sarsilmaz M. (2005) Effect of formaldehyde inhalation on Hsp70 in seminiferous tubules of rat testes: an immunohistochemical study. Toxicology and Industrial Health, 21(10),249-54.
Pala M, Ugolini D, Ceppi M, Rizzo F, Maiorana L, Bolognesi C, Schilirò T, Gilli G, Bigatti P, Bono R, Vecchio D (2008) Occupational exposure to formaldehyde and biological monitoring of Research Institute workers. Cancer Detect Prev.;32(2):121-6. Epub 2008 Jul 18.
Pariselli F, Sacco MG, Ponti J, Rembges D. (2009) Effects of toluene and benzene air mixtures on human lung cells (A549). Exp Toxicol Pathol. , 61(4), 381-6.
Partanen T, Kauppinen T, Luukkonen R, Hakulinen T, Pukkala E (1993) Malignant lymphomas and leukemias, and exposures in the wood industry: an industry-based case-referent study. International archives of occupational and environmental health, 64(8), 593-6.
Paustenbach, D., Y. Alarie, T. Kulle, N. Schachter, R. Smith, J. Swenberg, H. Witschi & S. B. Horowitz (1997) A recommended occupational exposure limit for formaldehyde based on irritation. Journal of Toxicology and Environmental Health, 50, 217-263.
Pinkerton LE, Hein MJ, Stayner LT (2004) Mortality among a cohort of garment workers exposed to formaldehyde: an update. Occupational and Environment Medicine, 61(3), 193-200.
Reynaert, N. L., K. Ckless, E. F. M. Wouters, A. Van Der Vliet & Y. M. W. Janssen-Heininger (2005) Nitric oxide and redox signaling in allergic airway inflammation. Antioxidants & Redox Signaling, 7, 129-143.
Rhône-Alpes. 2007. Mesure des aldéhydes dans l’air intérieur des écoles maternelles et des crèches de la région Rhône-Alpes. http://www.atmo-rhonealpes.org
Roush GC, Walrath J, Stayner LT, Kaplan SA, Flannery JT, Blair A. (1987) Nasopharyngeal cancer, sinonasal cancer, and occupations related to formaldehyde: a case-control study. Journal of the National Cancer Institute, 79(6),1221-4.
Rusch, G.M., Clary, J.J., Rinehart, W.E. & Bolte, H.F. (1983) A 26-week inhalation toxicity study with formaldehyde in the monkey, rat, and hamster. Toxicol. appl. Pharmacol., 68, 329–343.
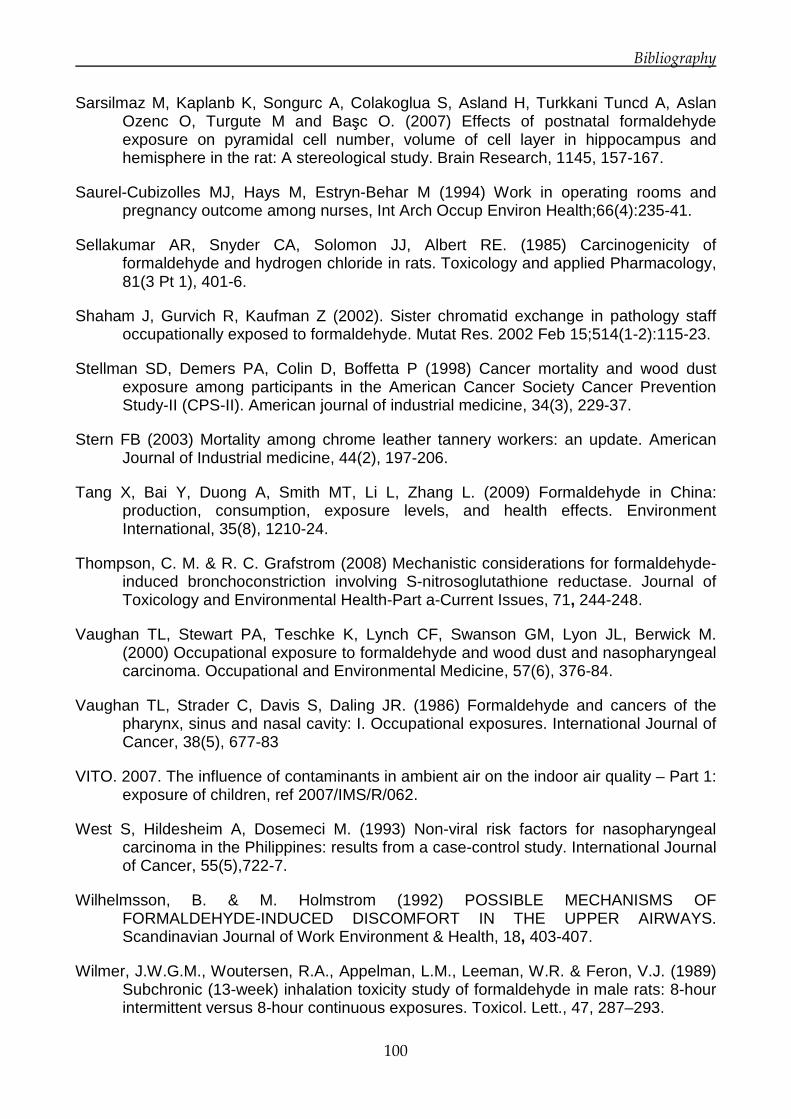
Bibliography
100
Sarsilmaz M, Kaplanb K, Songurc A, Colakoglua S, Asland H, Turkkani Tuncd A, Aslan Ozenc O, Turgute M and Başc O. (2007) Effects of postnatal formaldehyde exposure on pyramidal cell number, volume of cell layer in hippocampus and hemisphere in the rat: A stereological study. Brain Research, 1145, 157-167.
Saurel-Cubizolles MJ, Hays M, Estryn-Behar M (1994) Work in operating rooms and pregnancy outcome among nurses, Int Arch Occup Environ Health;66(4):235-41.
Sellakumar AR, Snyder CA, Solomon JJ, Albert RE. (1985) Carcinogenicity of formaldehyde and hydrogen chloride in rats. Toxicology and applied Pharmacology, 81(3 Pt 1), 401-6.
Shaham J, Gurvich R, Kaufman Z (2002). Sister chromatid exchange in pathology staff occupationally exposed to formaldehyde. Mutat Res. 2002 Feb 15;514(1-2):115-23.
Stellman SD, Demers PA, Colin D, Boffetta P (1998) Cancer mortality and wood dust exposure among participants in the American Cancer Society Cancer Prevention Study-II (CPS-II). American journal of industrial medicine, 34(3), 229-37.
Stern FB (2003) Mortality among chrome leather tannery workers: an update. American Journal of Industrial medicine, 44(2), 197-206.
Tang X, Bai Y, Duong A, Smith MT, Li L, Zhang L. (2009) Formaldehyde in China: production, consumption, exposure levels, and health effects. Environment International, 35(8), 1210-24.
Thompson, C. M. & R. C. Grafstrom (2008) Mechanistic considerations for formaldehyde-induced bronchoconstriction involving S-nitrosoglutathione reductase. Journal of Toxicology and Environmental Health-Part a-Current Issues, 71, 244-248.
Vaughan TL, Stewart PA, Teschke K, Lynch CF, Swanson GM, Lyon JL, Berwick M. (2000) Occupational exposure to formaldehyde and wood dust and nasopharyngeal carcinoma. Occupational and Environmental Medicine, 57(6), 376-84.
Vaughan TL, Strader C, Davis S, Daling JR. (1986) Formaldehyde and cancers of the pharynx, sinus and nasal cavity: I. Occupational exposures. International Journal of Cancer, 38(5), 677-83
VITO. 2007. The influence of contaminants in ambient air on the indoor air quality – Part 1: exposure of children, ref 2007/IMS/R/062.
West S, Hildesheim A, Dosemeci M. (1993) Non-viral risk factors for nasopharyngeal carcinoma in the Philippines: results from a case-control study. International Journal of Cancer, 55(5),722-7.
Wilhelmsson, B. & M. Holmstrom (1992) POSSIBLE MECHANISMS OF FORMALDEHYDE-INDUCED DISCOMFORT IN THE UPPER AIRWAYS. Scandinavian Journal of Work Environment & Health, 18, 403-407.
Wilmer, J.W.G.M., Woutersen, R.A., Appelman, L.M., Leeman, W.R. & Feron, V.J. (1989) Subchronic (13-week) inhalation toxicity study of formaldehyde in male rats: 8-hour intermittent versus 8-hour continuous exposures. Toxicol. Lett., 47, 287–293.

Bibliography
101
Woutersen, R.A., van Garderen-Hoetmer, A., Bruijntjes, J.P., Zwart, A. & Feron, V.J. (1989) Nasal tumours in rats after severe injury to the nasal mucosa and prolonged exposure to 10 ppm formaldehyde. J. appl. Toxicol., 9, 39–46.
Zaman, K., M. H. Hanigan, A. Smith, J. Vaughan, T. Macdonald, D. R. Jones, J. F. Hunt & B. Gaston (2006) Endogenous S-nitrosoglutathione modifies 5-lipoxygenase expression in airway epithelial cells. American Journal of Respiratory Cell and Molecular Biology, 34, 387-393.

i
Appendix A
Exposure modelling exercise
Before starting with monitoring campaigns, exposure estimation has been carried out
utilising the software ConsExpo 4.1. The programme, developed by Dutch Institute
for Public Health and Environment (RIVM) is freely downloadable on the institute
website. It was created to estimate exposure to chemical substances released by
consumers’ products, nevertheless having a free-input data mask, it has been
considered for a preliminary estimate of exposure to formaldehyde in occupational
settings such as laboratories. Input data of a typical laboratory of Pathology Unit at
University Hospital Luigi Sacco have been put in the model for the inhalation route,
as shown in figure A.1. In particular, the “exposure to vapour model” has been
chosen, which describes a scenario in which a compound evaporates from a surface
into the room air, for example, spread onto a bench or from a can of product. The
compound may contain 100% of the product, or be part of a mixture or dilution (as in
the case of formalin). The concentration in the room air will depend on the amount of
chemical present in the room, the room size, ventilation of the room air, vapour
pressure of the compound and the rate at which the compound is released into the
air (input data, see figure A.1).
Depending on the information available on physicochemical properties of the
compound and the use of the product, different modes of release of the compound
from the product can be selected to calculate the release of the compound into the
room air.
The Scenario hypothesis chosen among those proposed for exposure to vapour
model is “constant rate release”, a second tier scenario. It describes the release of a
compound with a constant rate over a certain period of time. During this time, the
compound is simultaneously removed from the air by ventilation of the room.
The air concentration of the compound at time t is calculated as follows:

Appendix A
ii
when t<tr
and
when t>tr
where:
Cair: concentration of compound in the room air [g/m3]
tr: release time [s]
Ao: amount of product used [g]
wf: weight fraction of the compound in the product [fraction]
V: room volume [m3]
q: ventilation rate of the room (number of air changes per time) [1/s]
Hypothesised input data for the Pathology lab:
A0= 10 (g)
tr = 30 (min)
wf = 0.04
V = 80 m3
Input data inserted try to simulate a plausible routine task which could be pouring a
certain amount of formalin from a container in dissection room. This operation could
be repeated for several times per day. Results of the exposure estimation have been
then compared with level of formaldehyde measured in laboratories, in particular with
those found in dissection room of University Hospital L. Sacco. Peak values obtained
from the model are in the same order of magnitude.
( ) ( )( )rr ttqqtrfair ee
qV
twAC −−− −×−×
×= 11
/0
( )qtrfair e
qV
twAC −−×
×= 1
/0
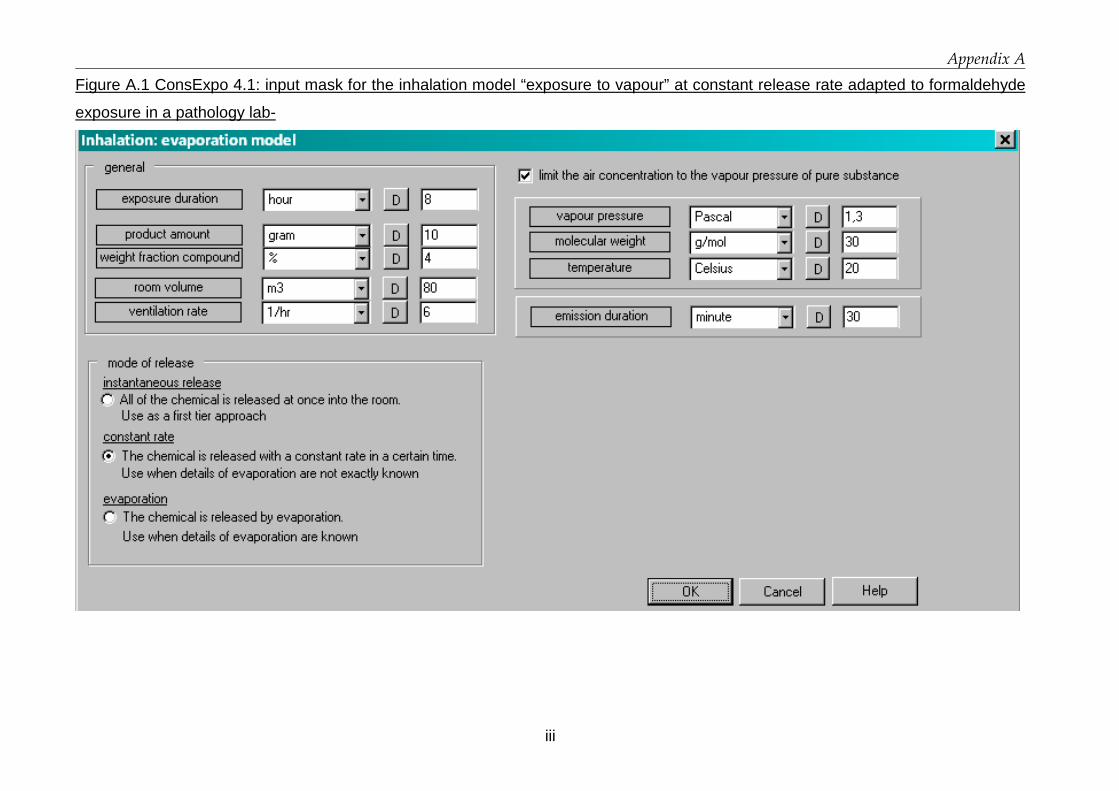
Appendix A
iii
Figure A.1 ConsExpo 4.1: input mask for the inhalation model “exposure to vapour” at constant release rate adapted to formaldehyde
exposure in a pathology lab-

Appendix A
iv
Figure A.2 Plotted output data

v
Appendix B
Results of pilot test
The methodology followed during pilot test is described in chapter Materials and
Methods, paragraph 2.2.3.
In chart B.1 concentration values measured by photo-acoustic monitor and CMS
sampler during the decay phase vs dilution model (Clausen et al, 1993) are depicted.
Chart B.1 Decay of formaldehyde concentrations measured by two methods vs
dilution model.
0.00
1.00
2.00
3.00
4.00
5.00
6.00
17:47 18:02 18:14 18:28 18:42 18:56
time
ppm
Photo-acoustic
CMS
Modelled decay
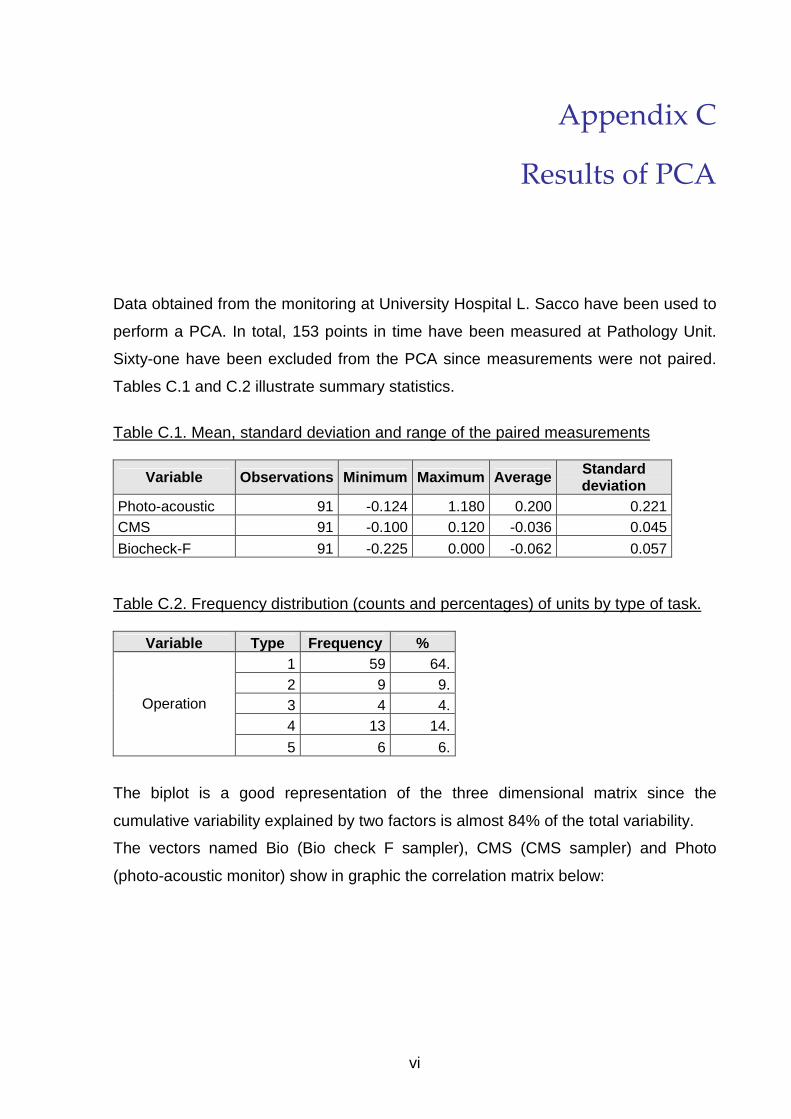
vi
Appendix C
Results of PCA
Data obtained from the monitoring at University Hospital L. Sacco have been used to
perform a PCA. In total, 153 points in time have been measured at Pathology Unit.
Sixty-one have been excluded from the PCA since measurements were not paired.
Tables C.1 and C.2 illustrate summary statistics.
Table C.1. Mean, standard deviation and range of the paired measurements
Variable Observations Minimum Maximum Average Standard deviation
Photo-acoustic 91 -0.124 1.180 0.200 0.221 CMS 91 -0.100 0.120 -0.036 0.045
Biocheck-F 91 -0.225 0.000 -0.062 0.057 Table C.2. Frequency distribution (counts and percentages) of units by type of task.
Variable Type Frequency % 1 59 64. 2 9 9. 3 4 4. 4 13 14.
Operation
5 6 6.
The biplot is a good representation of the three dimensional matrix since the
cumulative variability explained by two factors is almost 84% of the total variability.
The vectors named Bio (Bio check F sampler), CMS (CMS sampler) and Photo
(photo-acoustic monitor) show in graphic the correlation matrix below:

Appendix C
vii
Correlation matrix (Spearman):
Variables Photo CMS BIO
Photo 1 0.430 0.179 CMS 0.430 1 0.419
BIO 0.179 0.419 1 Bold values are different from 0 at α=0.05
Bio-check F values are more positively correlated to CMS than to photo-acoustic
results.
The origin of the graph is the TLV-C, therefore points in quadrants I and II of the
figure have higher results than TLV-C, while points in the third quadrant have levels
below the TLV-C for formaldehyde (0.3 ppm). Points in fourth quadrant have higher
level in Bio-check F results and lower level of CMS and photo-acoustic results.
Figure C.1 biplot
Biplot (assi F1 e F2: 83.91 %)
1
111
111
1 111 11
1 111111
11
111
111 1
11 1
1
11
1
1
1
1
111
1
1
11111111
1
11
11 11111
111
111
2 222
2
22222222
22
2
22222
2 2222222
2 2
22
2
2
2
2
2
2
22
2
2
333
3333
3
3
3333
4
4
44
4
4
4 4444
444
44
4
4
4
555
55 55
5
55
Operation-1
Operation-2
Operation-3
Operation-4
Operation-5
Photo
CMS
BIO
-3
-2
-1
0
1
2
-3 -2 -1 0 1 2 3 4 5
F1 (56.54 %)
F2
(27.
37 %
)
Attivo Baricentri
I
II
III
IV

Appendix C
viii
In conclusion, looking at the average profiles of the tasks, most of exposure
determined by any method during task 2 is below the TLV-C, while other tasks have
different profiles. Tasks 1 and 4 vary along the photo-acoustic measurements, while
the grouping of tasks seem to follow the classes of Bio-check F measurements
(task.2 lower followed by task 1, 4 and 3, 5 highest).

ix
Appendix D
INDEX-UPRIC Project
Results of literature review

Appendix D
ix
Table D.1 Human and animal studies and in-silico models
a. Human studies, controlled conditions
EFFECT STUDY SUBJECT EXPOSURE OUTCOME COMMENT Krakowiak et al. 1998
10 asthmatics with suspected respiratory sensitisation to HCOH + 10 healthy.
0.3 ppm (0.5 mg/m3) for 2 h.
(+) all subjects reported sneezing, itching and congestion.
Due to infrequent calibrations of the exposure chamber, it is possible that concentrations exceeded 0.5 ppm at some point of the study.
Discomfort (subjective)
Lang et al, 2008 21 healthy subjects 4h each x 10 dd at different concentrations with and without peaks (4 x 15 min).
LOAELs: 0.3 ppm eye; 0.5 ppm nose. NOAELs after adjustments for negative affectivity: 0.5 ppm constant or 0.3 ppm with 0.6 peaks.
NOAELs proposed considering negative affectivity factors.
Irritation - eye, upper airways (objective)
Lang et al, 2008 21 healthy subjects 4h each x 10 dd at different concentrations with and without peaks (4 x 15 min).
LOAEL: 0.5 ppm with 4 x 1ppm peaks (eye irritation and blinking) NOAEL: 0.5 ppm constant or 0.3 ppm with 0.6 ppm peaks.
Krakowiak et al, 1998 10 asthmatics with suspected respiratory sensitisation to HCOH + 10 healthy.
0.3 ppm (0.5 mg/m3) for 2 h.
(-) no significant pulmonary function changes in both groups.
Due to infrequent calibrations of the exposure chamber, it is possible that concentrations exceeded 0.5 ppm at some point of the study.
Lang et al, 2008 21 healthy subjects 4h each x 10 dd at different concentrations with and without peaks (4 x 15 min).
(-) no significant changes in lung function NOAEL: 1 ppm
Ezratty et al. 2007 12 subjects with intermittent asthma or allergy to pollen.
0.5 mg/m3 for 1 h in 2 separated days.
(-) no significant changes in lung function NOAEL: 0.5 ppm
Pulmonary function (FEV1 and FVC)
Casset et al., 2006 19 asthmatic subjects 0.1 mg/m3 for 30 min.
(+) FEV1 significantly higher after formaldehyde exposure (15% vs 11%, p= 0.046)

Appendix D
x
EFFECT STUDY SUBJECT EXPOSURE OUTCOME COMMENT Krakowiak et al, 1998 10 asthmatics with suspected
respiratory sensitisation to HCOH + 10 healthy.
0.3 ppm for 2 h. (+) transient increase of the nr. of leukocytes and in the permeability index of proteins recovered from nasal washings from both groups- suggesting transient non-specific nasal reaction. (-) no induction of specific allergic responses in either the upper or the lower respiratory tract.
Due to infrequent calibrations of the exposure chamber, it is possible that concentrations exceeded 0.5 ppm at some point of the study.
Ezratty et al., 2007 12 subjects with intermittent asthma or allergy to pollen.
0.5 mg/m3 for 1 h in 2 separated days.
(-) no significant deleterious effect on airway allergen responsiveness (no enhanced asthmatic effect)
A trend to a protective effect of formaldehyde was observed.
Asthma/ Hypersensitivity
Casset et al., 2006 19 asthmatic subjects 0.1 mg/m3 for 30 min.
(+) patients developed an immediate bronchial response at significantly lower dose of mite allergen than after air exposure.
Appendix D
xi
b. Human studies, uncontrolled conditions
EFFECT STUDY SUBJECT EXPOSURE OUTCOME COMMENT Genotoxicity Orsiere et al, 2006 59 pathology and anatomy
workers after 1 day-exposure (or 8h)
<0.1-20.4 ppm (sampling 15 min) <0.1 -0.7 ppm (sampling 8h)
(+) increased frequency of monocentrometric micronuclei (MN) in peripheral lymphocytes (chromosomal loss). (-) no increase in DNA damage (repair process or induction of lesions) in peripheral lymphocytes.
Aneugenic effect of formaldehyde: all call lines derived from HCOH-induced rat tumours have been shown to be aneupoid. Results suggest that MN was a consequence of spindle disturbances (tubulin) and not a direct interaction with DNA.
Histopathological changes
Edling et al., 1988 75 plant workers exposed to formaldehyde.
0.1-1.1 mg/m3 with peaks of up to 5 mg/m3
25% of exposed workers had changes to nasal mucosa. Histological grading showed a significantly higher score for nasal lesion among exposed. No difference btw those exposed to wood dust and HCOH and only HCOH.
Authors attribute histopathological changes to HCOH alone in the 0.1-1.1 mg/m3 range
Krzyzanowsky M et al. 1990 298 children 5-15 y, 613 adults;
Increased prevalence rate of physician-diagnosed chronic respiratory disease (chronic bronchitis or asthma) in children exposed to HCOH btw 60-140 ppb. Some 10% decrement in PEFR was found for concentrations as low as 30 ppb (greater effect in asthmatic children). Data suggests non-negligible respiratory effects of prolonged exposure to HCOH even below 60 ppb. LOAEL 30 ppb
Greater association of the effects was found with ETS and HCOH. ETS possible confounder.
Asthma/ Hypersensitivity
Wilhelmsson B, Holmstrom M, 1992
66 plant employees exposed for a mean of 10 years
0.05-0.6 mg/m3 (mean 0.26. No exposure to industrial solvents or dust.Ref.group: 36 community clerks exposed to 0.09 mg/m3
Frequency of atopics in the exposed was found low (11%) compared to the controls (33%) and the general population of UK and Scandinavia (30%). An hypothesis is that a certain number of atopics had left the HCOH-exposed environment. HCOH seems to induce non-specific hyperreactivity in the airways (about 50% of those chronically exposed to moderate doses)
Authors believe that HCOH can induce, in certain cases, IgE-mediated type 1 reaction in the nose, but in most cases the annoying nasal symptoms are due to HCOH-induced hyperreactivity which can cause problems in about 50% of the population subjected to long-term exposure at levels described in the study.
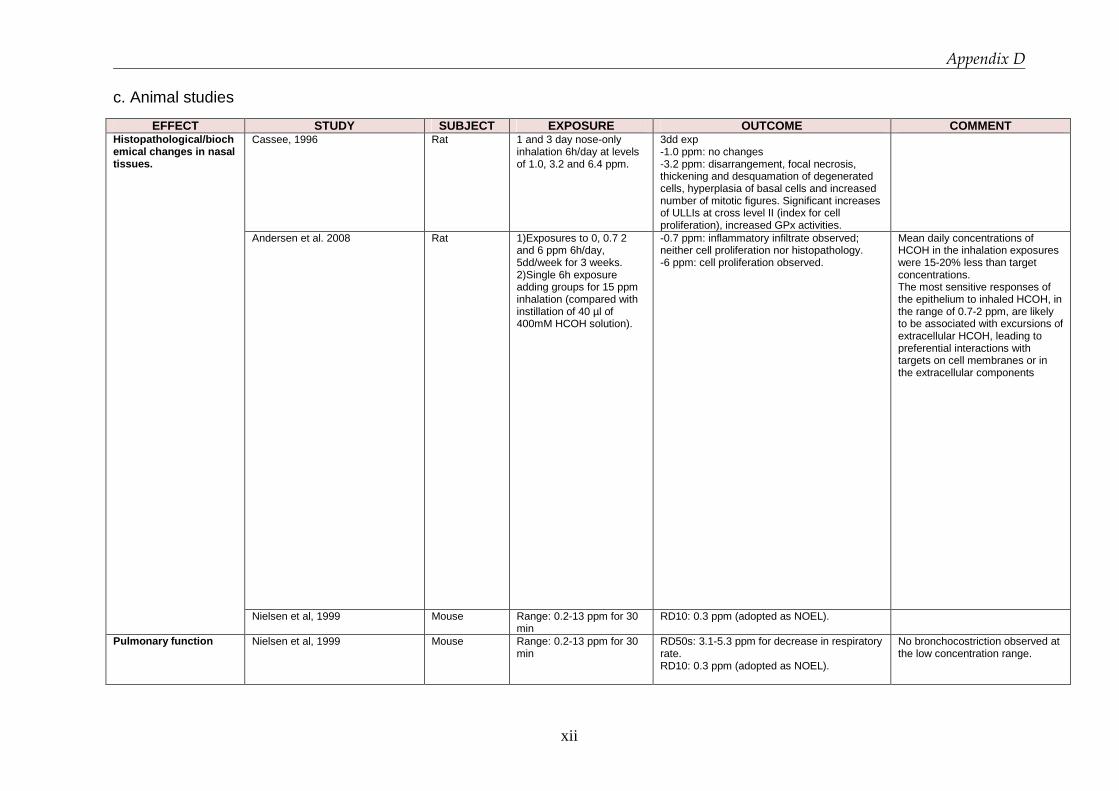
Appendix D
xii
c. Animal studies
EFFECT STUDY SUBJECT EXPOSURE OUTCOME COMMENT Cassee, 1996 Rat 1 and 3 day nose-only
inhalation 6h/day at levels of 1.0, 3.2 and 6.4 ppm.
3dd exp -1.0 ppm: no changes -3.2 ppm: disarrangement, focal necrosis, thickening and desquamation of degenerated cells, hyperplasia of basal cells and increased number of mitotic figures. Significant increases of ULLIs at cross level II (index for cell proliferation), increased GPx activities.
Andersen et al. 2008 Rat 1)Exposures to 0, 0.7 2 and 6 ppm 6h/day, 5dd/week for 3 weeks. 2)Single 6h exposure adding groups for 15 ppm inhalation (compared with instillation of 40 µl of 400mM HCOH solution).
-0.7 ppm: inflammatory infiltrate observed; neither cell proliferation nor histopathology. -6 ppm: cell proliferation observed.
Mean daily concentrations of HCOH in the inhalation exposures were 15-20% less than target concentrations. The most sensitive responses of the epithelium to inhaled HCOH, in the range of 0.7-2 ppm, are likely to be associated with excursions of extracellular HCOH, leading to preferential interactions with targets on cell membranes or in the extracellular components
Histopathological/biochemical changes in nasal tissues.
Nielsen et al, 1999 Mouse Range: 0.2-13 ppm for 30 min
RD10: 0.3 ppm (adopted as NOEL).
Pulmonary function Nielsen et al, 1999 Mouse Range: 0.2-13 ppm for 30 min
RD50s: 3.1-5.3 ppm for decrease in respiratory rate. RD10: 0.3 ppm (adopted as NOEL).
No bronchocostriction observed at the low concentration range.

Appendix D
xiii
EFFECT STUDY SUBJECT EXPOSURE OUTCOME COMMENT Genomic Andersen et al. 2008 Genomic
benchmark dose analysis was performed
Rat 1)Exposures to 0, 0.7 2 and 6 ppm 6h/day, 5dd/week for 3 weeks. 2)Single 6h exposure adding groups for 15 ppm inhalation (compared with instillation of 40 µl of 400mM HCOH solution).
Btw 0.7 and 2 ppm: temporal and concentration dependent transitions in genomic signatures. Reduced sensivity by day 15 (Tissue adaption). U-shaped dose responses were noted in the acute study for many genes.

Appendix D
xiv
d. In-silico models
AUTHOR TITLE/TOPIC POPULATION/STUDY DESIGN MAIN FINDINGS COMMENTS (Conolly et al. 2004)
Application of the dose-response computational model to humans for the prediction of airway cancer risk.
Switch in additional risk curve between 0.6-0.7 ppm occurs. Direct mutation does not play a significant role. Moreover DPX do not accumulate in the rat (and humans) with repeated daily exposure. Additional risk for 80 years of continuous environmental exposure to 0.1 ppm of HCOH of 10-6 or less for respiratory tract carcinogenicity is driven by parameter considering DPX, since 0.1 ppm inhaled HCOH does not affect cell proliferation (cytotoxicity).
This model is considered (by authors themselves) to be based on risk-conservative choices.
(Conolly et al. 2003)
Biological motivated computational model to predict dose-response behaviours at exposure levels below those at which SCC were seen experimentally. (6 ppm and above)
Carcinogenicity of inhaled HCOH in rats appears to arise primarily from enhanced cell proliferation due to cytotoxic responses rather than from a mutagenic potential of the DNA-protein cross-links.
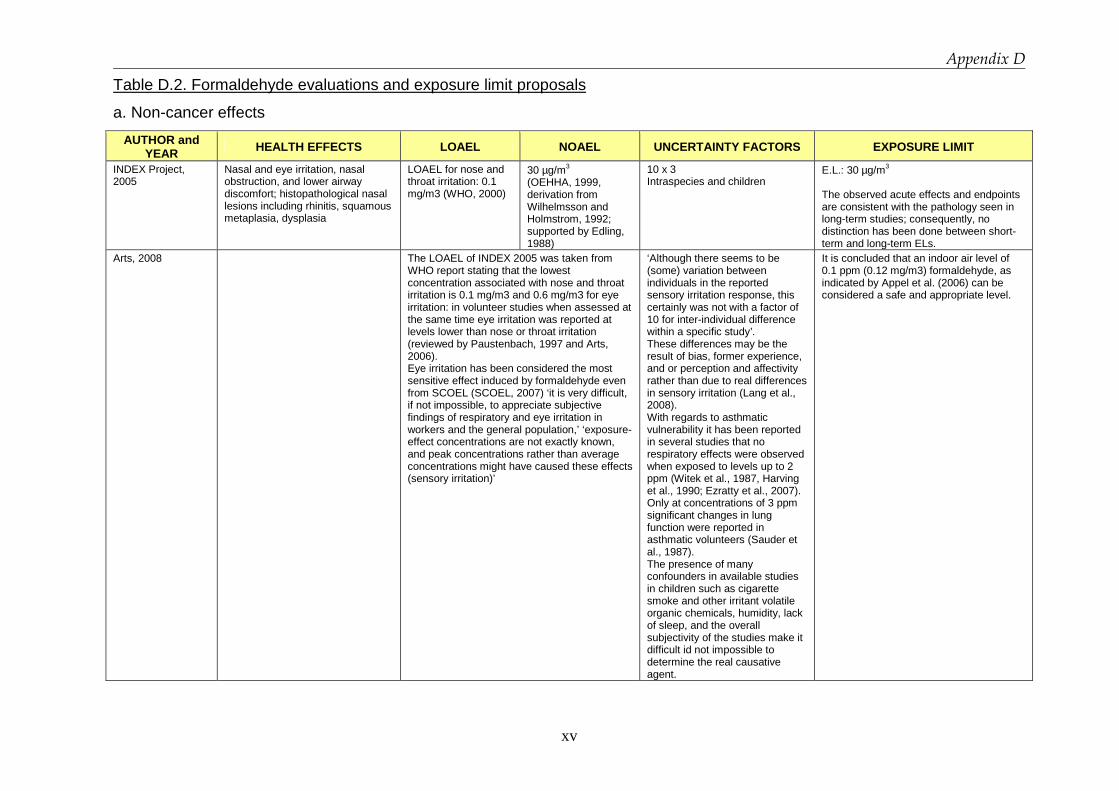
Appendix D
xv
Table D.2. Formaldehyde evaluations and exposure limit proposals
a. Non-cancer effects
AUTHOR and YEAR HEALTH EFFECTS LOAEL NOAEL UNCERTAINTY FACTORS EXPOSURE LIMIT
INDEX Project, 2005
Nasal and eye irritation, nasal obstruction, and lower airway discomfort; histopathological nasal lesions including rhinitis, squamous metaplasia, dysplasia
LOAEL for nose and throat irritation: 0.1 mg/m3 (WHO, 2000)
30 µg/m3 (OEHHA, 1999, derivation from Wilhelmsson and Holmstrom, 1992; supported by Edling, 1988)
10 x 3 Intraspecies and children
E.L.: 30 µg/m3 The observed acute effects and endpoints are consistent with the pathology seen in long-term studies; consequently, no distinction has been done between short-term and long-term ELs.
Arts, 2008
The LOAEL of INDEX 2005 was taken from WHO report stating that the lowest concentration associated with nose and throat irritation is 0.1 mg/m3 and 0.6 mg/m3 for eye irritation: in volunteer studies when assessed at the same time eye irritation was reported at levels lower than nose or throat irritation (reviewed by Paustenbach, 1997 and Arts, 2006). Eye irritation has been considered the most sensitive effect induced by formaldehyde even from SCOEL (SCOEL, 2007) ‘it is very difficult, if not impossible, to appreciate subjective findings of respiratory and eye irritation in workers and the general population,’ ‘exposure-effect concentrations are not exactly known, and peak concentrations rather than average concentrations might have caused these effects (sensory irritation)’
‘Although there seems to be (some) variation between individuals in the reported sensory irritation response, this certainly was not with a factor of 10 for inter-individual difference within a specific study’. These differences may be the result of bias, former experience, and or perception and affectivity rather than due to real differences in sensory irritation (Lang et al., 2008). With regards to asthmatic vulnerability it has been reported in several studies that no respiratory effects were observed when exposed to levels up to 2 ppm (Witek et al., 1987, Harving et al., 1990; Ezratty et al., 2007). Only at concentrations of 3 ppm significant changes in lung function were reported in asthmatic volunteers (Sauder et al., 1987). The presence of many confounders in available studies in children such as cigarette smoke and other irritant volatile organic chemicals, humidity, lack of sleep, and the overall subjectivity of the studies make it difficult id not impossible to determine the real causative agent.
It is concluded that an indoor air level of 0.1 ppm (0.12 mg/m3) formaldehyde, as indicated by Appel et al. (2006) can be considered a safe and appropriate level.

Appendix D
xvi
AUTHOR and YEAR HEALTH EFFECTS LOAEL NOAEL UNCERTAINTY FACTORS EXPOSURE LIMIT
Arts, 2008 Eye and nose and throat irritation (sensory irritation
1200 µg/m3 for sensory irritation (in general)-based on Lang
5 for intra-species variability justified based on the available data (Appel et al. 2006). No sensitive groups identified. It seems that this factor of is meant for humans in general, and is not worker-specific. Due to a more homogeneous population, the intra-species factor for workers may even be lower. In an extensive review on upper respiratory tract and ocular irritant effects of volatile chemicals a higher susceptibility of children was not mentioned (Doty et al., 2004). Based on the available data no additional assessment factor is needed. Appel et al, 2006 concluded that although in children higher internal concentrations can be reached because of the higher breathing rate and an incomplete metabolism, there is yet no indication that this also true for locally acting substances as formaldehyde. They therefore stated that it is not necessary to include an additional child-assessment factor. No sensitive groups identified
Indoor settings: 0.1 ppm considered safe for preventing any adverse effect. (‘considered safe realistic and meaningful level, while still taking into account the carcinogenicity of formaldehyde’).

Appendix D
xvii
AUTHOR and YEAR
HEALTH EFFECTS LOAEL NOAEL UNCERTAINTY FACTORS EXPOSURE LIMIT
Paustenbach, 1997 Irritation (eye, nose, throat). Sensitization Bronchoconstriction Total of 150 studies evaluated.
1200 µg/m3 for eye. ‘If irritation occurs at <1 ppm the effects rapidly subside due to accommodation’. LOEL: < 360 µg/m3 for 3-8 h exp. LOAEL for bronchoconstriction>2 ppm.
NOEL: 360 (up to 8h/d exposure)
The panel recognized that there is some uncertainty in the margin of safety inherent 1.0 ppm per 8 h, since the basis is derived from relatively small studies of healthy volunteers. No sensitive groups identified ‘Repeated exposure may not enhance susceptibility to formaldehyde’.
OEL: 360 µg/m3is recommended as TWA (would protect nearly all workers except perhaps the 95th to 99th percentile person from transient eye irritation). Ceiling:1 ppm (‘likely to protect at least 75% and perhaps as much as 95% of workers). For indoor settings levels below 0.1 ppm should prevent irritation in virtually all persons. Based on the available data the panel concluded that although concentrations below 0.1 ppm in residential setting have been reported to cause minor irritant effects in humans, based on the data obtained in volunteer studies, it is likely that this level of response was attributable to other environmental factors, the background incidence of eye irritation, self-selection bias, or the effects of interviewer interaction.
IAQ – WHO (2000) Nose and throat irritation in humans after short-term exposure
100 µg/m3 The lowest concentration that has been associated with nose and throat irritation in humans after short-term exposure is 10, mg/m3, although some individuals can sense the presence of formaldehyde at lower concentrations.
100 µg/m3 (30-minute average) * although some individuals can sense the presence of FA at lower concentrations * exposure level at which there is a negligible risk of upper respiratory tract cancer in humans.
HEALTH CANADA: Proposed residential indoor air quality guidelines for formaldehyde (2005)
Short-term Effects - irritation of the mucosa of the upper respiratory tract and the eyes. (Kulle et al. 1993) Chronic Effects Other Than Cancer hospitalization for asthma in children (Rumchev et al. 2002),
1230 µg/m3
615 µg/m3 50 µg/m3
10
123 µg/m3 - (1-hour averaged) 50 µg/m3 - (8-hours averaged) * development of allergic sensitization and/or asthma is biologically plausible as it is consistent with observations in animals.
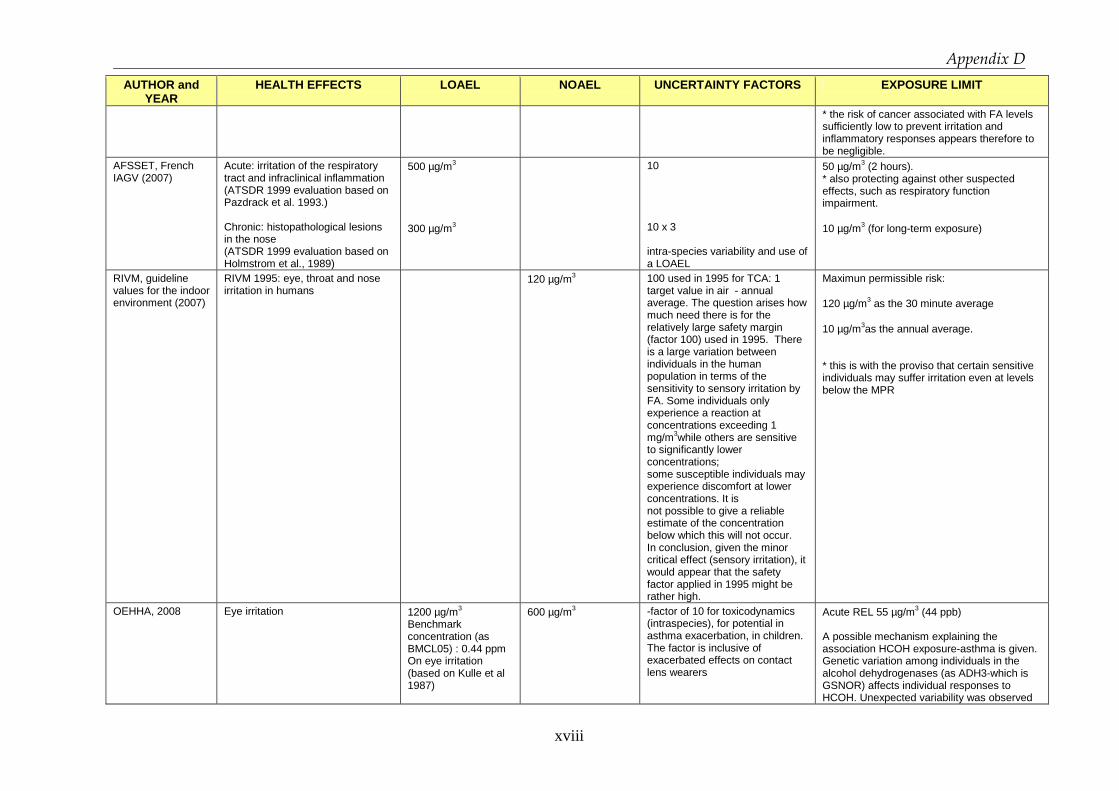
Appendix D
xviii
AUTHOR and YEAR
HEALTH EFFECTS LOAEL NOAEL UNCERTAINTY FACTORS EXPOSURE LIMIT
* the risk of cancer associated with FA levels sufficiently low to prevent irritation and inflammatory responses appears therefore to be negligible.
AFSSET, French IAGV (2007)
Acute: irritation of the respiratory tract and infraclinical inflammation (ATSDR 1999 evaluation based on Pazdrack et al. 1993.) Chronic: histopathological lesions in the nose (ATSDR 1999 evaluation based on Holmstrom et al., 1989)
500 µg/m3 300 µg/m3
10 10 x 3 intra-species variability and use of a LOAEL
50 µg/m3 (2 hours). * also protecting against other suspected effects, such as respiratory function impairment. 10 µg/m3 (for long-term exposure)
RIVM, guideline values for the indoor environment (2007)
RIVM 1995: eye, throat and nose irritation in humans
120 µg/m3 100 used in 1995 for TCA: 1 target value in air - annual average. The question arises how much need there is for the relatively large safety margin (factor 100) used in 1995. There is a large variation between individuals in the human population in terms of the sensitivity to sensory irritation by FA. Some individuals only experience a reaction at concentrations exceeding 1 mg/m3while others are sensitive to significantly lower concentrations; some susceptible individuals may experience discomfort at lower concentrations. It is not possible to give a reliable estimate of the concentration below which this will not occur. In conclusion, given the minor critical effect (sensory irritation), it would appear that the safety factor applied in 1995 might be rather high.
Maximun permissible risk: 120 µg/m3 as the 30 minute average 10 µg/m3as the annual average. * this is with the proviso that certain sensitive individuals may suffer irritation even at levels below the MPR
OEHHA, 2008 Eye irritation 1200 µg/m3 Benchmark concentration (as BMCL05) : 0.44 ppm On eye irritation (based on Kulle et al 1987)
600 µg/m3 -factor of 10 for toxicodynamics (intraspecies), for potential in asthma exacerbation, in children. The factor is inclusive of exacerbated effects on contact lens wearers
Acute REL 55 µg/m3 (44 ppb) A possible mechanism explaining the association HCOH exposure-asthma is given. Genetic variation among individuals in the alcohol dehydrogenases (as ADH3-which is GSNOR) affects individual responses to HCOH. Unexpected variability was observed
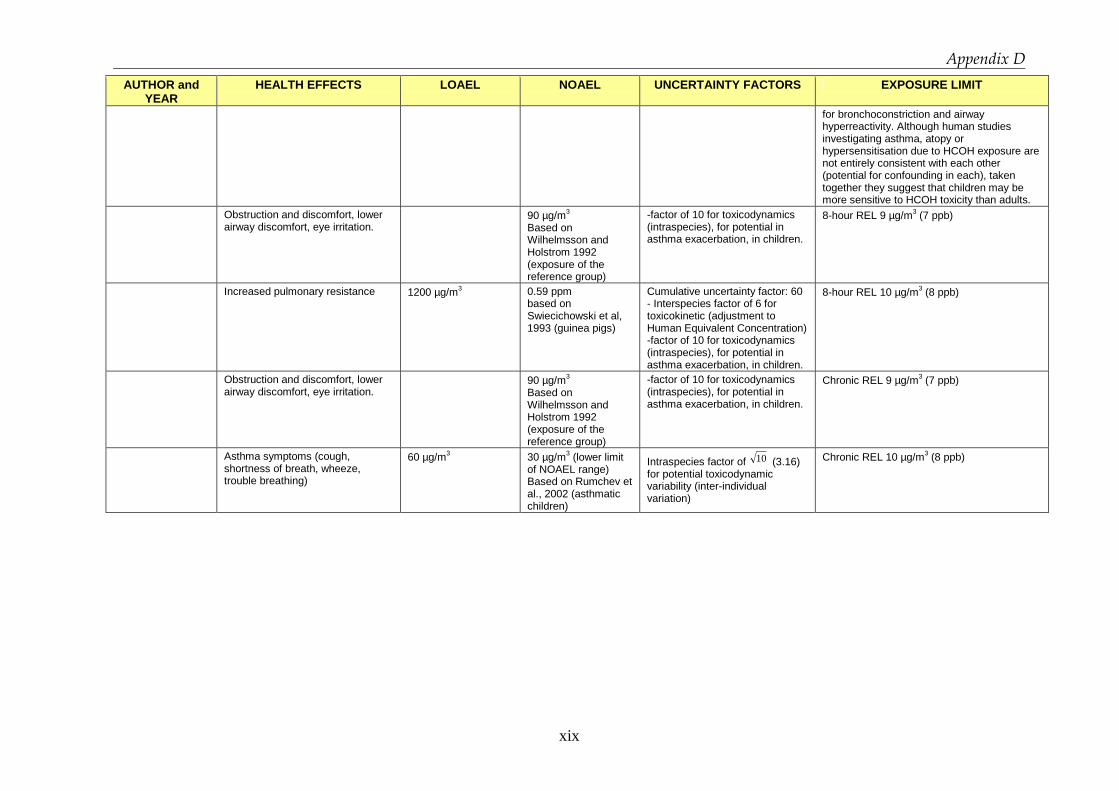
Appendix D
xix
AUTHOR and YEAR
HEALTH EFFECTS LOAEL NOAEL UNCERTAINTY FACTORS EXPOSURE LIMIT
for bronchoconstriction and airway hyperreactivity. Although human studies investigating asthma, atopy or hypersensitisation due to HCOH exposure are not entirely consistent with each other (potential for confounding in each), taken together they suggest that children may be more sensitive to HCOH toxicity than adults.
Obstruction and discomfort, lower airway discomfort, eye irritation.
90 µg/m3 Based on Wilhelmsson and Holstrom 1992 (exposure of the reference group)
-factor of 10 for toxicodynamics (intraspecies), for potential in asthma exacerbation, in children.
8-hour REL 9 µg/m3 (7 ppb)
Increased pulmonary resistance 1200 µg/m3
0.59 ppm based on Swiecichowski et al, 1993 (guinea pigs)
Cumulative uncertainty factor: 60 - Interspecies factor of 6 for toxicokinetic (adjustment to Human Equivalent Concentration) -factor of 10 for toxicodynamics (intraspecies), for potential in asthma exacerbation, in children.
8-hour REL 10 µg/m3 (8 ppb)
Obstruction and discomfort, lower airway discomfort, eye irritation.
90 µg/m3 Based on Wilhelmsson and Holstrom 1992 (exposure of the reference group)
-factor of 10 for toxicodynamics (intraspecies), for potential in asthma exacerbation, in children.
Chronic REL 9 µg/m3 (7 ppb)
Asthma symptoms (cough, shortness of breath, wheeze, trouble breathing)
60 µg/m3
30 µg/m3 (lower limit of NOAEL range) Based on Rumchev et al., 2002 (asthmatic children)
Intraspecies factor of 10 (3.16) for potential toxicodynamic variability (inter-individual variation)
Chronic REL 10 µg/m3 (8 ppb)

Appendix D
xx
b. Considering carcinogenic effects
AUTHOR and YEAR
HEALTH EFFECTS LOAEL NOAEL UNCERTAINTY FACTORS EXPOSURE LIMIT
Appel, 2006 \
240 µg/m3 A slight sensory irritation response can be observed at concentrations of 0.2 – 0.3 ppm and ocular and upper respiratory tract sensory irritation is not present below 0.1 ppm
120 µg/m3 120 µg/m3 (0.1 ppm) * Since 0.1 ppm is more than 10 times below the threshold level observed for cytotoxic damage in the nasal mucosa, this level seems to protect the whole population with regard to the carcinogen.
Arts, 2006 Sensory irritation (eye, nose and throat)-volunteer studies; Nasal injury - animals. Carcinogenicity - animals, population studies.
LOAEL for sensory irritation (humans): 1 ppm for eye, and 2 ppm for nasal and 3 ppm throat. Threshold for increased nasopharyngeal cancer risk in humans: 4 ppm (Hauptmann et al., 2004). Formaldehyde considered carcinogenic at cytotoxic levels only, i.e. levels at which sustained regenerative epithelial proliferation is observed ≥ 6 ppm in animals. Animals: NOAEL for nasal injury: 1 ppm LOAEL for epithelial hyperplasia and squamous metaplasia: 2 ppm BMD analysis performed on Andersen and Mohave 1983, Kulle 1993, Kulle et al, 1987. For 10% extra risk for mild eye irritation is accepted, 0.56 ppm (C.I. 95%) would be acceptable. At level of 1 ppm: -56% (C.I. 95%) experiences ‘slight discomfort’ after 2.5 h.
No sensitive groups identified (no asthma correlation, nor enhanced effects on asthmatic subjects).
Airborne levels of formaldehyde below 1 ppm seem low enough to protect workers against nasal tissue damage, consequently against the potential risk of nasal cancer

Appendix D
xxi
AUTHOR and YEAR
HEALTH EFFECTS LOAEL NOAEL UNCERTAINTY FACTORS EXPOSURE LIMIT
-0% experiences ‘discomfort’ -30% (C.I. 95%) experiences ‘mild eye irritation’ 9.5% (C.I. 95%) experiences ‘moderate eye irritation’
c. Occupational exposure limits
AUTHOR and YEAR
HEALTH EFFECTS LOAEL NOAEL UNCERTAINTY FACTORS EXPOSURE LIMIT
Occupational exposure limit for Quebec workers. (Noisel, Bouchard and Carrier 2007)
Irritation can cause an irritant-induced asthma reaction and induce cytotoxicity that can act as a cancer promoter. The experimental data show that there was no difference in the proportion of individuals experiencing effects in groups exposed to FA concentrations
LOAEL : 1 ppm Benchmark concentration (as BMCL05) : 0.44 ppm on eye irritation based on Kulle et al 1987
NOAEL : 0.5 ppm
asthmatics did not appear to be more sensitive to irritation at FA concentrations below 3 ppm .
the risk of irritating effects would be negligible for airborne formaldehyde concentrations below 0.75 ppm.
SCOEL: Occupational exposure limits (Bolt and Huici-Montagud 2008)
Subjective symptoms of eye irritation (based on Lang, 2008) if the personal trait of negative affectivity was treated as a co-variable.
360 µg/m3 The TWA-OEL of FA should be set at or below the NOAEL for sensory irritancy of the eye. In view of the limited number of persons that can be examined in a laboratory volunteer study, the exclusion of particularly sensitive persons with negative affectivity appears problematic.
480 µg/m3- 15min-STEL This STEL is set below the threshold for objective eye irritation, as outlined by Lang At these levels, no systemic effect of formaldehyde is to be expected 240 µg/m3 - 8h-TWA This especially considers possible interindividual differences in susceptibility to irritation by formaldehyde Additional classification: skin sensitizer.

Appendix D
xxii
d. Outdoor exposure limits
AUTHOR and YEAR HEALTH EFFECTS LOAEL NOAEL UNCERTAINTY FACTORS EXPOSURE LIMIT
RA for the general population in Japan(Naya and Nakanishi 2005)
Histopathological changes (i.e., loss of cilia, goblet cell hyperplasia, and cuboidal and squamous cell metaplasia) in the nasal cavity (Holmstrom et al., 1989)
50 µg/m3 The lowest concentration of 0.04 ppm in the study of Holmstrom et al. is considered to be nearly equal to NOAEL;
3 for human LOAEL.
12 µg/m3 Reference value of FA in atmosphere (outdoor air) for Japanese general population is recommended