formation of embryoid bodies from human embryonic stem
TRANSCRIPT
University of Arkansas, FayettevilleScholarWorks@UARKBiological and Agricultural EngineeringUndergraduate Honors Theses Biological and Agricultural Engineering
5-2012
Formation of Embryoid Bodies from HumanEmbryonic Stem Cells in Defined MediumAshley KieneUniversity of Arkansas, Fayetteville
Follow this and additional works at: http://scholarworks.uark.edu/baeguht
Part of the Engineering Commons
This Thesis is brought to you for free and open access by the Biological and Agricultural Engineering at ScholarWorks@UARK. It has been accepted forinclusion in Biological and Agricultural Engineering Undergraduate Honors Theses by an authorized administrator of ScholarWorks@UARK. Formore information, please contact [email protected], [email protected].
Recommended CitationKiene, Ashley, "Formation of Embryoid Bodies from Human Embryonic Stem Cells in Defined Medium" (2012). Biological andAgricultural Engineering Undergraduate Honors Theses. 20.http://scholarworks.uark.edu/baeguht/20
Formation of Embryoid Bodies from Human Embryonic Stem Cells in Defined Medium
An Undergraduate Honors College Thesis
in the
Department of Biological Engineering
College of Engineering
University of Arkansas
Fayetteville, AR
by
Ashley Kiene
April 27, 2012


Page 2
Abstract:
Embryonic stem cells have the characteristic of self-renewal and the ability to differentiate into tissues
from all three germ layers. Many times, the first step in using human embryonic stem cells for
regenerative medicine is often initiated by embryoid body (EB) formation. EBs are three-dimensional
multicellular aggregates that resemble early post implantation embryos that still maintain the potential
to form the three germ layers. Currently, generating EBs from human embryonic stem cells (hESC) that
are adapted to feeder-independent medium is difficult, much more so than feeder cultured hESC. Using
a chemically defined medium would not only help the application of hESC in research and therapy but
also provide the possibility studying the molecular mechanisms of self-renewal and differentiation,
without the use of feeder cells. Three comparisons have been done to compare culture conditions: the
type of medium, the dosage of bFGF and pretreatment with conditioned MEF medium. By varying the
culture conditions, EB formation can be optimized for a based on average total EB count and
morphology. The EBs were formed and cultured for 2 weeks in suspension. The effectiveness of
completely defined EB medium was compared to commercially available AggreWell medium and proved
to be sufficient in forming and maintaining EBs throughout the culture period. Feeder-free and feeder-
independent conditions were also compared by conditioning hESC in mouse embryonic fibroblast (MEF)
conditioned medium (CM) for 0, 1, 2 or 3 days. Feeder-free culture conditions after 3 days of
conditioning showed optimal EB growth. Different concentrations of basic fibroblast growth factor
(bFGF) in the EB medium were compared and determined to encourage optimal growth at 40 ng/mL
bFGF. Selected EBs were taken up, and quantitative real time PCR amplification was performed to verify
the presence of the three germ layers.
Keywords: Human embryonic stem cells, embryoid body, defined medium, basic fibroblast growth
factor, feeder-free, feeder-independent
Page 3
Introduction:
A major goal of biomedical engineering is to create a renewable source of cells that may be used
for cell-based therapy or regenerative medicine. Embryonic stem cells are derived from totipotent cells
of the embryo [1]. They play a critical role in the human body by providing the starting material for
every tissue and organ during embryogenesis and contribute to the regeneration of tissue in adult life
[2]. Embryonic stem cells can be maintained in an undifferentiated state but have the ability to
differentiated into all three germ layers. Differentiation of human embryonic stem cells (hESC) into cells
for regenerative medicine is often initiated by embryoid body (EB) formation. EBs are in vitro
aggregates of ES cells with regional differentiation into embryonically distinct cell types [1]. Currently,
there are protocols for forming EBs, but there is limited research on forming EBs from hESC that are
adapted to feeder-independent medium. Undefined culture conditions are a major source of
inconsistency [3]. Using a chemically defined medium would not only help the application of hESC in
research and therapy but also provide the possibility studying the molecular mechanisms underlying
self-renewal and differentiation [3]. One of the main problems with EBs is maintaining their healthy
morphology and an adequate survival rate for an extended amount of time. After several days, many of
the EBs in culture degrade in health, size and number. In this study, multiple culture conditions were
tested for their influence in forming and maintaining EBs by monitoring and recording the number, size
and appearance of the EBs. Ultimately, the ideal condition would form healthy EBs that are composed of
all three germ layers using a completely defined medium.
The specific type of medium is an important aspect for culturing EBs. EB medium is assembled
by the user (78% DMEM/F-12, 20% KnockOut Serum Replacement, 1% Non-Essential Amino Acids, 1% 2-
mercaptoethanol) and typically used as a simple, less expensive method to form EBs in vitro. KnockOut
Serum Replacement is completely defined and widely used to replace fetal bovine serum, which
contains animal products causing undefined lot-to-lot variability. AggreWell medium is a specialty cell

Page 4
culture medium developed by StemCell Techonologies specifically for the formation of EBs. This
commercially available medium creates EBs that are reproducibly uniform in size and shape; however,
this is an expensive method for smaller scale research. These two mediums were compared in order to
determine how the simple method of using de novo EB medium compared to the standardized,
commercially available AggreWell medium.
In early research protocols, the use of mouse embryonic fibroblast (MEF) feeder layers would
help maintain the undifferentiated state of the hESC. However, in order to use these cells for human
therapy, an animal-free culture system must be use to prevent exposure to mouse retroviruses [4]. A
serum-free, animal product-free medium was developed to support the derivation and long-term
feeder-independent culture of hESC [5]. This medium is completely defined; therefore, there is no lot-
to-lot variations in the composition. Methods, such as feeder-free and feeder-independent, have been
developed to avoid the use of feeder layers using the serum-free, animal-free medium. These methods
allow for the maintenance of cells in an undifferentiated state on a Matrigel matrix. The feeder-free
method eliminates the need to grow cells directly on the feeder layer by using medium that is previously
exposed to MEFs to acquire soluble factors that support the propagation of undifferentiated hESC in
culture [6]. This technique does not completely eliminate the lot-to-lot variation because different
batches can add different types or amounts of the soluble factors. The feeder-independent method
uses medium that is completely defined, mTESR1 (StemCell Technologies). The differences between
using a feeder-free and a feeder-independent environment was tested by varying the number of days of
conditioning the hESC in MEF conditioned medium (CM) before EB formation. After passaging the hESC,
the cells are either grown in mTeSR1 the entire 3 days before forming EBs (feeder-independent) or
switched to MEF CM (feeder-free).
Another common feature of more recently developed hESC culture conditions include the
presence of basic fibroblast growth factor (bFGF). bFGF signaling has a significant role in sustaining
Page 5
human embryonic stem cells and is dose-dependent [5,7]. It has been shown that bFGF prevents
apoptosis, programmed cell death [8]. It was concluded that bFGF is required to instruct cells to exit the
self-renewal program and begin differentiation. Manipulating the level of bFGF signaling in stem cell
cultures may also present a bias toward the differentiation to different germ layers [9]. However,
combination of bFGF with other signaling factors also supports the pluripotency of hESC [8,9]. After the
removal of the feeder layers, bFGF was supplemented in much higher dosages to maintain hESC in the
self-renewal state. For example, mTeSR1 contains 100 ng/mL bFGF to sustain hESC in feeder-free
conditions [8]. The importance of bFGF in maintaining EBs was tested by supplementing EB medium
with different concentrations of bFGF and evaluating the effects on the EBs throughout the two week
culture period.
Methods and Materials:
Human embryonic stem cells of the cell lineage H9 were maintained on Matrigel coated dishes at 37 deg
C and 5% CO2. These cells were brought out of cryopreservation and cultured in mTeSR1 medium (80%
Basal Medium, 20% 5x Supplement) to maintain their undifferentiated state. Specification of materials
can be found in Appendix A.
Passaging H9 hESCs Grown in mTESR1
When cells were observed to have large colonies that were beginning to merge and/ or
differentiate, the cells needed to be passaged into new dishes at approximately a 1 to 3 ratio. This
usually occurred after three days of culturing. The morphology for differentiated colonies will look
different in comparison to the undifferentiated cells. The colonies will have dense and phase-bright
centers. Using a light microscope, the differentiated cells were identified and marked with a felt tip
marker on the bottom of the plate. These colonies need to be mechanically removed by scraping before
the passaging. These cells were removed by scraping with a pipette tip.
Page 6
Dishes were coated with Matrigel and DMEM/F-12 at a 1 to 200 ratio and let stand for one hour.
Sufficient mTeSR1 was aliquotted and put in a 37 deg water bath to warm. Dispase (1 mg/mL) was also
allowed to thaw at room temperature. Using a microscope, the differentiated cells were identified and
marked with a felt tip marker on the bottom of the plate. These cells were removed by scraping with a
pipette tip. The medium was aspirated, and 1mL dispase (1 mg/mL) was added to the dish to loosen the
attachment of colonies from the dish. The dish was placed in the incubator at 37 deg C and 5% CO2 for 7
min. The dispase was removed, and the plate was washed 2 to 3 times with 1 mL DMEM/F-12 to dilute
any remaining dispase. The colonies were then scraped off multiple times with a 5 mL pipette tip while
simultaneously adding 2 mL mTeSR1. The detached colonies were transferred into a 15 mL conical tube
and pipetted up and down to break the colonies into smaller aggregates. The required amount of
mTeSR1 was added to the 15 mL tube and transferred to the Matrigel-coated dishes. The cells are
finally placed in the incubator at 37 deg C and 5% CO2.
Formation of EBs
Forming EBs is similar to passaging in that all cells are removed from one plate and transferred
to another. Using a light microscope again, the differentiated cells were identified and marked with a
felt tip marker on the bottom of the plate. These cells were removed by scraping with a pipette tip.
Dispase (1mg/mL) was diluted to ½ mg/mL using DMEM/F-12. The medium was aspirated, and 1mL
dispase (½ mg/mL) was added to the dish to loosen the attachment of colonies from the dish. The dish
was placed in the incubator at 37 deg C and 5% CO2 for 30-45 min until the colonies were visibly
dislodged from the bottom of the plate. The dispase was then diluted with 3 mL DMEM/F-12. The
dispase and DMEM/F-12 was drawn up with the cell aggregates and transferred to a 15 mL conical tube.
Rewashing the dish with extra DMEM/F-12 can ensure that the maximum number of cells was retrieved.
The large aggregates were allowed to settle to the bottom of the tube, and the supernatant was drawn
Page 7
off with a pipette. Another 6-8 mL DMEM/F-12 was added to the tube to wash any remaining dispase.
The aggregates settled to the bottom, and the supernatant was again pipetted off. The desired medium,
either EB medium or AggreWell medium, was used to resuspend the cells, which were transferred to a
low-attachment 24 well plate. The low attachment plate prevents the cells from attaching to the
surface, forcing the EBs to be grown in suspension. A half medium exchange was performed every other
day to ensure the appropriate amount of nutrition was replenished at a regular interval.
Culture Conditions:
Three comparisons have been done to compare culture conditions: the type of medium, the dosage of
bFGF and pretreatment with MEF conditioned medium.
Type of Medium - Two different mediums were tested for their effectiveness in
sustaining EBs after formation. AggreWell medium (StemCell Technologies) is a completely
defined, feeder-independent medium manufactured specifically for forming EBs. This medium
presents a standardized approach for generating EBs that are consistent in size and shape. The
self-assembled EB medium (also completely defined as expressed above) is a commonly used
technique for EB formation because of its accessibility.
Feeder-Free vs. Feeder-Independent – Feeder-free and feeder-independent culture
conditions were compared by varying the length of time the hESC were cultured in MEF CM
before EB formation. For feeder-independent culture conditions, the hESC were maintained in
mTeSR1 all 3 days before EB formation. For feeder-free culture conditions, the hESC were either
cultured immediately in MEF CM after passaging or in mTeSR1 then switched to MEF CM before
forming EBs. The MEF CM was extracted from cultured MEF after 1 day; therefore, it contains
appropriate amounts of soluble factors that support the undifferentiated state of the hESC in
culture [6].

Page 8
Varied bFGF Dosage – The effects of different dosages of bFGF were tested on the
ability to adequately sustain the EBs throughout the first two weeks. Concentrations of 0, 20, 40
and 100 ng/mL were tested on EBs that were cultured with EB medium. These EBs were
pretreated with MEF CM for 3 days prior to EB formation. This test shows how much bFGF is
necessary or if more bFGF would benefit the EBs.
Data Collection
In order to determine the effectiveness of each condition, three factors were measured during and after
the two weeks of sustention: average EB count, average size/morphology and PCR.
Average EB Count
The total number of EBs in each well was recorded on a daily basis throughout this
study. The seeding density varied in separate wells; therefore, the average number of EBs best
compares the effects of different culture conditions on the EBs by putting the measurements on
the same scale. The average number of EBs for each culture condition was found by adding the
total number of EBs in every representative well and dividing by the number of wells in which
they were grown. Very small variations, such as a difference between one or two EBs between
consecutive days, may have been simple human error. However, significant changes in this
value can indicate changes in the EBs such as formation or death of EBs. A decrease in the
number, though, does not always indicate death. It is the nature of EBs to merge together to
form a larger EB from multiple smaller ones, called agglomeration. EBs that were slightly merged
together but were still two or more distinct EBs were counted as multiple EBs. When the EBs
were merged enough to lose that distinction, they were then counted as one. The average
number of EBs inevitably decreased overtime; however, the culture condition that provided the
slowest rate of decrease in viable EBs was ideal.

Page 9
Average EB Size and Morphology
Throughout the study, bright field images were taken every day to capture the sizes and
morphologies of multiple EBs at random. Images were taken with the 4x and 10x objective
lenses. SlideBook software was used to record the images and convert to .tiff files. The
dimensions of the EBs can be estimated using this software. Healthy EBs showed to have very
defined edges rather than indistinct, blurred edges. More uniform EBs are preferred over EBs
that are agglomerated (multiple EBs merging to form one) and have heterogeneous
morphologies [10]. Healthy EBs also exhibited traits such as cavitation after a certain amount of
time, which mimic the early developmental stages prior to gastrulation [11].
Cell debris was also monitored in these images because it is an indication of EB death.
This helped distinguish between cell death and agglomeration in the case of a significant
decrease in EB count.
Polymerase Chain Reaction (PCR)
EBs as defined earlier must exhibit the three embryonic germ layers. Real time PCR
(rtPCR) quantifies the presence of the three germ layers by showing the presence of certain
mesoderm, ectoderm and endoderm markers. The hESC, when differentiating in suspension in
vitro, acquire molecular markers specific to the three germ layers [1]. Total RNA is extracted
from the EBs using the RNEasy Mini Kit (Qiagen) and subjected to PCR amplification. Four
markers were subject to detection: Pax6, Brachyury, Sox17 and Oct4. Pax6 represents the
ectoderm layer. Brachyury represents the mesoderm layer. Sox17 represents the endoderm
layer. Oct4 was the detected pluripotency marker. This test needs to be performed on
representative days such as Day 2, 5, 7, 10 and 14; however, for the purpose of this study, PCR
was performed on Day 10 EBs cultured in feeder-free EB medium with 40 ng/mL bFGF and Day
14 EBs cultured in feeder-independent AggreWell medium. The PCR primers used were Oct4
Page 10
(5’-TGGGCTCGAGAAGGATGTG-3’ and reverse, 5’-GCATAGTCGCTGCTTGATCG-3’), Pax6 (5’-
AACAGACACAGCCCTCACAAACA-3’ and reverse, 5’-CGGGAACTTGAACTGGAACTGAC-3’),
Brachyury (5’-TGCTTCCCTGAGACCCAGTT-3’ and reverse, 5’-GATCACTTCTTTCCTTTGCATCAAG-3’),
Sox17 (5’-GGCGCAGCAGAATCCAGA-3’ and reverse, 5’-GGCGCAGCAGAATCCAGA-3’) and β-Actin
(5’-CTGGAACGGTGAAGGTGACA-3’ and reverse, 5’-AAGGGACTTCCTGTAACAATGCA-3’).
Results and Analysis:
Type of Medium
Average EB Count
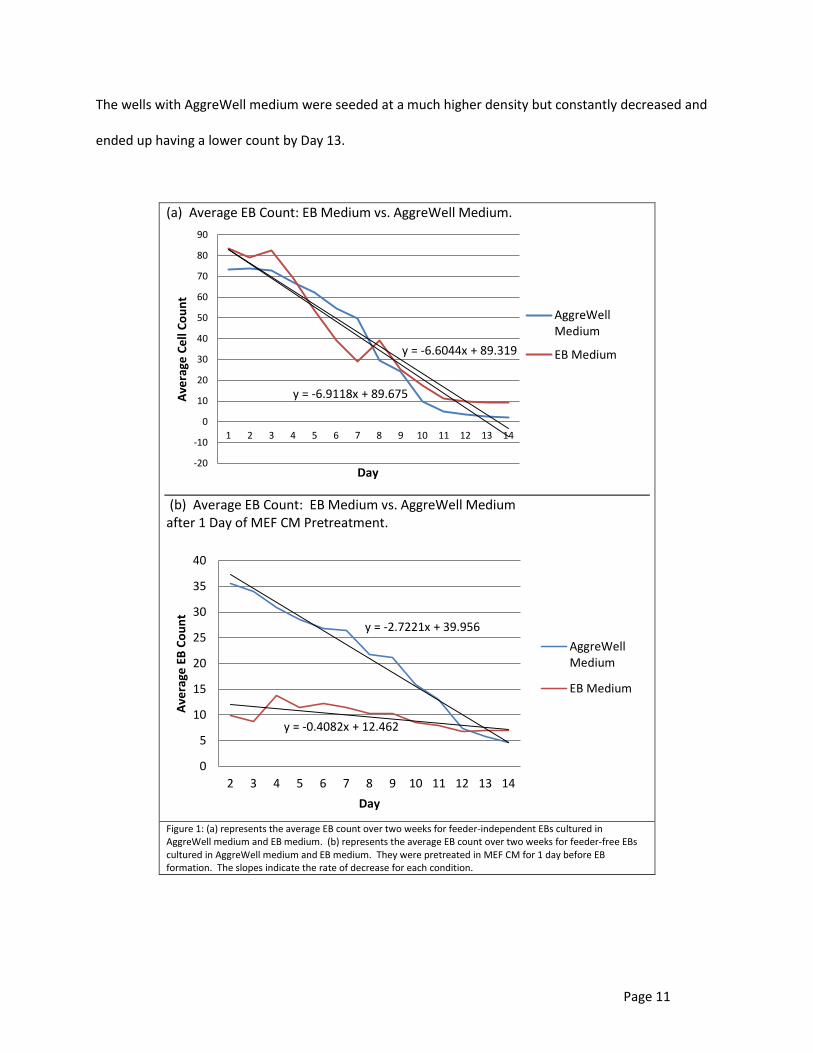
Figure 1a shows the average EB count of the wells containing either EB Medium or AggreWell
Medium. Neither of these samples included the addition of bFGF and were not conditioned in MEF
conditioned medium before EB formation. According to this graph, both types of medium had an overall
decrease in the number of EBs during the two weeks of suspension. The AggreWell medium had a more
steady decrease than the EB Medium, and during the first week seemed to be maintaining EBs better.
However, by the end of two weeks, the AggreWell medium only had about 2 EBs per well whereas the
EB Medium still maintained almost 10 EBs per well on average. The rate of decrease for the EBs was
determined by the slope of the graph. AggreWell Medium had a higher rate of decrease at about 6.9118
EBs/day. EB Medium had a lower rate of decrease at about 6.6044 EBs/day.
Figure 1b shows the average EB count of the wells containing either EB Medium or AggreWell
Medium after being conditioned with 1 day of MEF CM before EB formation. Neither of these samples
included the addition of bFGF. According to this graph, the wells with EB Medium remained fairly
constant throughout the course of the first two weeks, but the wells with AggreWell medium
experienced more of a decrease. The wells with AggreWell medium decreased at an average rate of
2.7221 EBs/day; whereas, the wells with EB medium decreased at an average rate of 0.4083 EBs/day.
Page 11
The wells with AggreWell medium were seeded at a much higher density but constantly decreased and
ended up having a lower count by Day 13.
(a) Average EB Count: EB Medium vs. AggreWell Medium.
(b) Average EB Count: EB Medium vs. AggreWell Medium after 1 Day of MEF CM Pretreatment.
Figure 1: (a) represents the average EB count over two weeks for feeder-independent EBs cultured in AggreWell medium and EB medium. (b) represents the average EB count over two weeks for feeder-free EBs cultured in AggreWell medium and EB medium. They were pretreated in MEF CM for 1 day before EB formation. The slopes indicate the rate of decrease for each condition.
y = -6.9118x + 89.675
y = -6.6044x + 89.319
-20
-10
0
10
20
30
40
50
60
70
80
90
1 2 3 4 5 6 7 8 9 10 11 12 13 14
Ave
rage
Ce
ll C
ou
nt
Day
AggreWellMedium
EB Medium
y = -2.7221x + 39.956
y = -0.4082x + 12.462
0
5
10
15
20
25
30
35
40
2 3 4 5 6 7 8 9 10 11 12 13 14
Ave
rage
EB
Co
un
t
Day
AggreWellMedium
EB Medium
Page 12
Average EB Size and Morphology
Table 1a in Appendix B illustrates the morphology of random EBs on Day 2, 5, 7, 10 and 14 in
wells cultured in EB medium and AggreWell medium. These mediums were not supplemented with
bFGF, and the cells were not pretreated with MEF CM before EB formation, therefore, were feeder-
independent. These images were taken using either the 4x or 10x objective lens. The EBs cultured in
the AggreWell medium were mostly uniform in size and shape throughout the first week (Day 2 and Day
5). However, during the second week, the EBs began to merge together, or agglomerate, making long
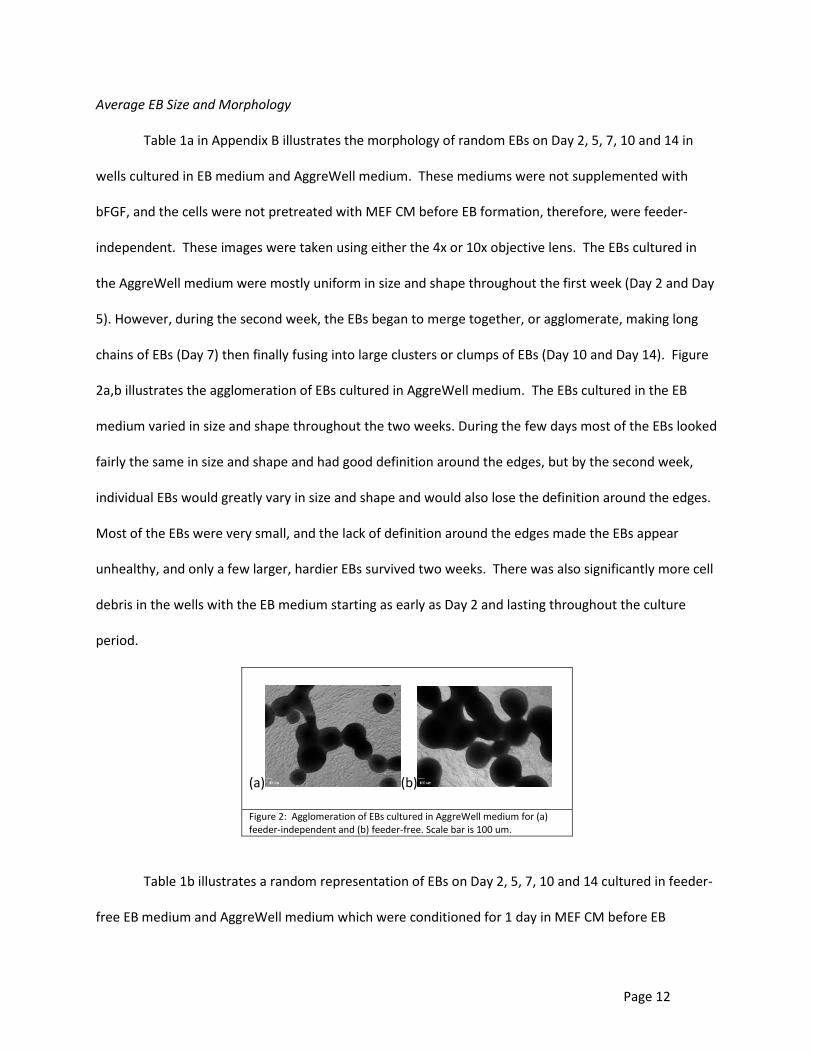
chains of EBs (Day 7) then finally fusing into large clusters or clumps of EBs (Day 10 and Day 14). Figure
2a,b illustrates the agglomeration of EBs cultured in AggreWell medium. The EBs cultured in the EB
medium varied in size and shape throughout the two weeks. During the few days most of the EBs looked
fairly the same in size and shape and had good definition around the edges, but by the second week,
individual EBs would greatly vary in size and shape and would also lose the definition around the edges.
Most of the EBs were very small, and the lack of definition around the edges made the EBs appear
unhealthy, and only a few larger, hardier EBs survived two weeks. There was also significantly more cell
debris in the wells with the EB medium starting as early as Day 2 and lasting throughout the culture
period.
(a) (b) Figure 2: Agglomeration of EBs cultured in AggreWell medium for (a) feeder-independent and (b) feeder-free. Scale bar is 100 um.
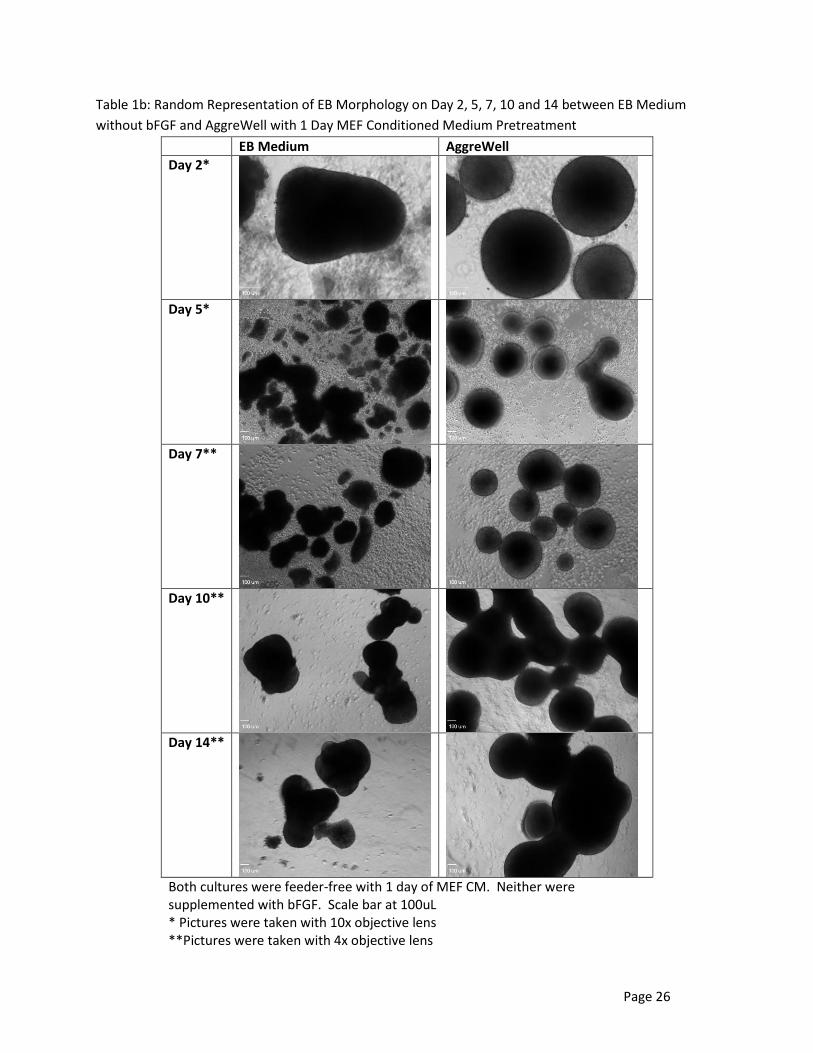
Table 1b illustrates a random representation of EBs on Day 2, 5, 7, 10 and 14 cultured in feeder-
free EB medium and AggreWell medium which were conditioned for 1 day in MEF CM before EB

Page 13
formation. The mediums were not supplemented with additional bFGF. These images were also taken
using either the 4x or 10x objective lens. EBs cultured in AggreWell had the same morphology as those
that were cultured in a feeder-independent environment. They were uniform in size and shape for the
first week but also began to agglomerate like feeder-independent AggreWell EBs. The EBs cultured in
the EB medium did not have the same uniformity as the AggeWell. Cell debris was found early in the
first week of the culture period and affected the healthiness of the EB within the debris accumulation. In
Table 1b, Day 5 EBs in EB medium illustrates the variation in size and shape while also showing
significant cell debris and its effect on EB morphology. They appear to be broken pieces with undefined,
blurred edges. Most of these unhealthy EBs did not survive; therefore, the larger, healthier EBs thrived
during the second week of culturing as shown in Day 10 and Day 14.
Analysis
When comparing the AggreWell medium and the traditional EB medium, the AggreWell medium
had a much higher rate of decrease in the number of EBs throughout the culturing period. This may
have been due to the high agglomeration of the AggreWell EBs. However, most agglomerates formed
long chains rather than large, round EBs. EB medium on its own did not prove to be a very effective
method in forming EBs; however, adjusting aspects of the protocol showed to improve the overall
effectiveness of the EB medium.
Feeder-Free vs. Feeder-Independent
Average EB Count
Figure 3a shows the average EB count of wells using EB medium that were conditioned with
MEF conditioned medium for different lengths of time before EB formation. These wells were not
treated with bFGF. According to this graph, the number of days of MEF CM pretreatment greatly
affected the rate of decrease in the average EB count. Having no days of conditioned medium,
Page 14
completely feeder-independent (0D CM) had the greatest number of EBs formed in the beginning but
after the first week the number significantly reduced at a rate of 6.6044 EBs/day. Those with one day of
MEF CM pretreatment (1D CM) had a fairly constant number of EBs on average with a rate of decrease
of 0.4082 EBs/day; however, not many EBs were initially formed. EBs formed after 2 and 3 days of MEF
CM pretreatment (2D CM, 3D CM) had rates of decrease of 3.2297 EBs/day and 1.863 EBs/day,
respectively.
Figure 3b shows the average EB count of wells using EB medium that were conditioned with
MEF conditioned medium for different lengths of time before EB formation and were also treated with
40 ng/mL bFGF. Those with one day of MEF CM pretreatment had a fairly constant number of EBs on
average with a rate of decrease of 0.2057 EBs/day; however, not many EBs were initially formed. These
results are very similar to those without bFGF treatment. EBs formed after 2 and 3 days of MEF CM
pretreatment had rates of decrease of 3.2297 EBs/day and 1.863 EBs/day, respectively.

Page 15
(a) Average EB Count: Varying Days of MEF Conditioned Medium Pretreatment
(b) Average EB Count: Varying Days of MEF Conditioned Medium Pretreatment with 40 ng/mL bFGF
Figure 3: (a) represents the average EB count over two weeks for EBs subjected to varied days of MEF CM before EB formation. The EB medium was not supplemented with bFGF. (b) represents the average EB count over two weeks for EBs cultured subjected to varied days of MEF CM before EB formation. The EB medium was supplemented with 40 ng/mL bFGF. The slopes indicate the rate of decrease for each condition.
Average EB Size and Morphology
In Appendix B, Table 2a illustrates a random representation of the EB morphology of EBs culture
in EB medium without bFGF supplement. Differences between morphology were seen early in the
culture period. The images from Day 5 already show that the EBs cultured in feeder-independent
y = -6.6044x + 89.319
y = -0.4082x + 12.87
y = -3.2297x + 64.758
y = -1.863x + 43.33
-10
0
10
20
30
40
50
60
70
80
90
1 2 3 4 5 6 7 8 9 10 11 12 13 14
Ave
rage
EB
Co
un
t
Day
0D CM
1D CM
2D CM
3D CM
y = -0.2057x + 11.513
y = -3.0027x + 58.217
y = -1.8646x + 48.022
0
10
20
30
40
50
60
1 2 3 4 5 6 7 8 9 10 11 12 13 14
Ave
rage
EB
Co
un
t
Day
1D CM
2D CM
3D CM
Page 16
conditions (0D CM) do not compare well with the feeder-free cultures. The EBs were smaller and had a
greater accumulation of cell debris. They were not strong enough to uphold large boundaries and
appeared to be breaking into pieces. Few feeder-independent EBs thrived and grew to a larger healthy
EBs by the end of the two weeks, but most were poor and feeble. EB cultured after 1D CM were
inconsistent with each other. Four wells were maintained using this culture condition. Two of the four
wells had fairly consistent results, while the other two seemed to increase and decrease in number, size
and morphology without warning. Cell debris also greatly accumulated in these cultures. The EBs
cultured after 2D CM had similar morphologies to the 0D CM by the end of the culture period but not
nearly as severe. The edges were blurry and undefined, and many of them were relatively small in size.
The EBs cultured after 3D CM showed relatively good morphologies. The 3D CM cultures were
consistent throughout the 2-week culture period, and produced larger, more defined EBs on average
without the high accumulation of surrounding cell debris.
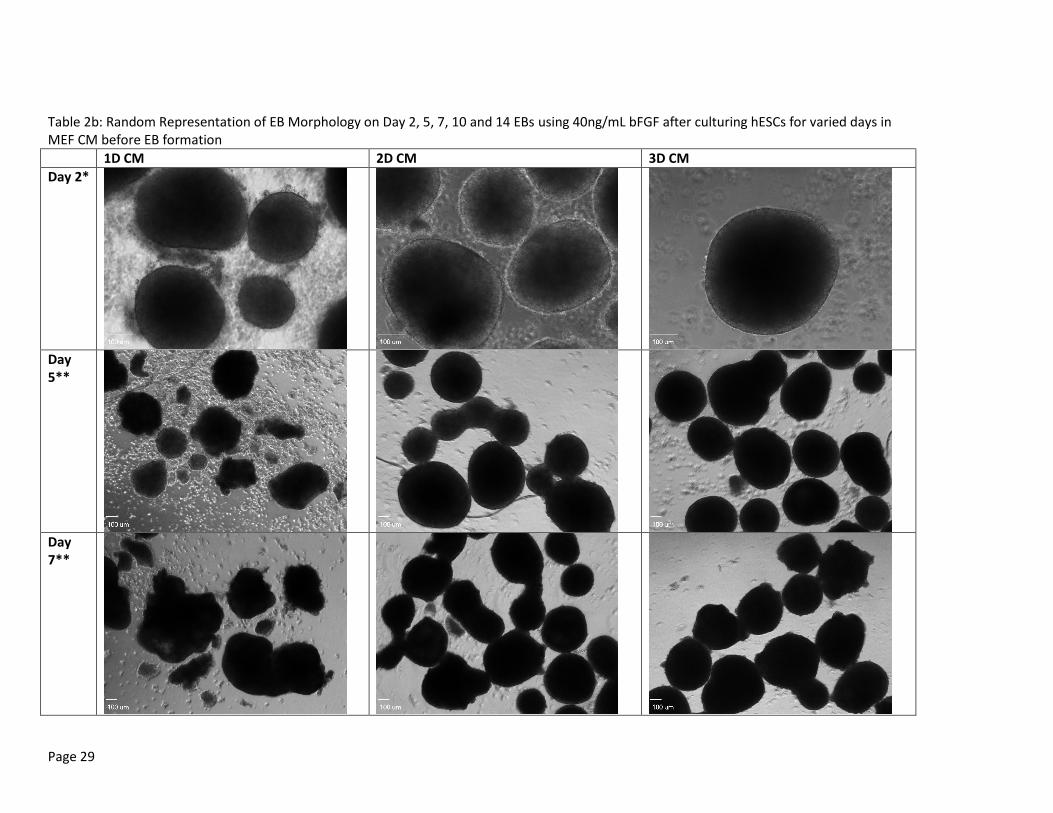
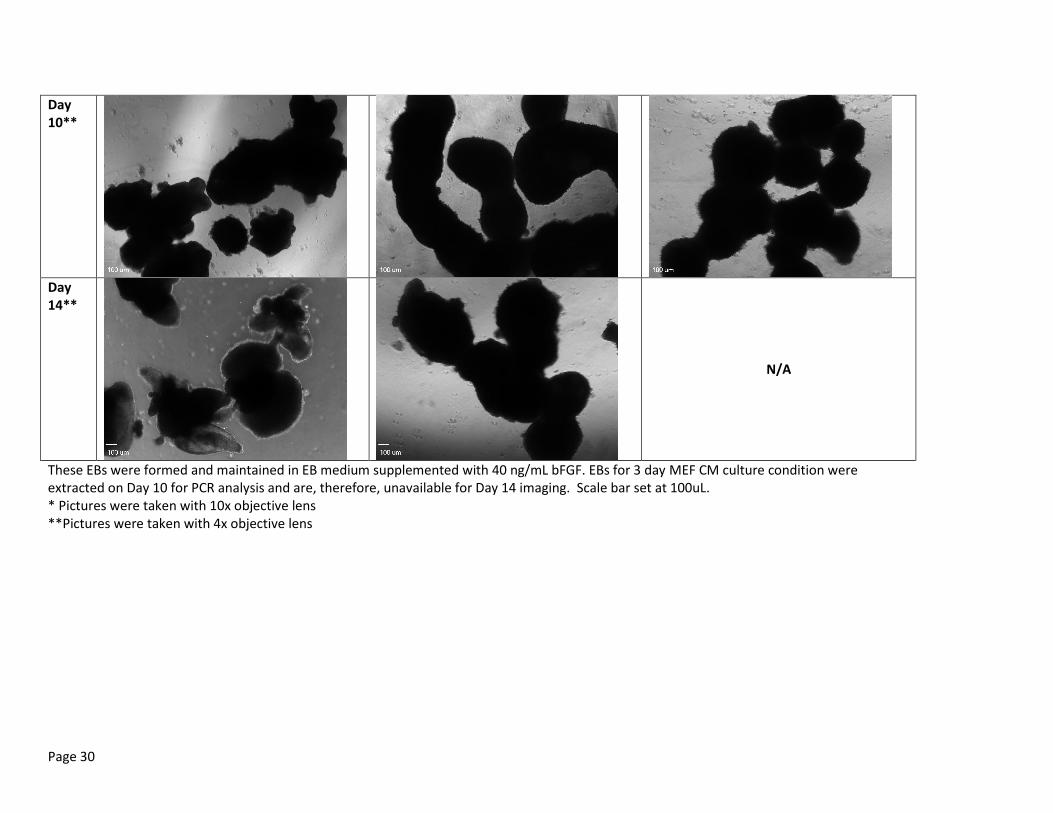
Table 2b in Appendix B illustrates a random representation of the EB morphology of feeder-free
EBs culture in EB medium supplemented with 40 ng/mL bFGF. EBs for 3 day CM culture condition were
extracted on Day 10 for PCR analysis and are, therefore, unavailable for Day 14 imaging. With the
addition of bFGF, the morphologies improved in each condition; however, there were still variations
between the different number of days of conditioning in MEF CM. Those cultured after 1D CM still
showed more cell debris than the 2D CM and 3D CM; however, EBs cultured outside the accumulated
cell debris were very large. The EBs formed after 2D CM and 3D CM were similar in size and
morphology. These EBs often agglomerated in these cultures during the second week forming chains or
clumps of aggregated EBs. These cultures also exhibited cavitated or cystic EBs, which are EBs that form
hollowed out cavities [10]. Figure 4a,b illustrates a cavitated EB cultured in EB medium supplemented
with 40 ng/mL bFGF after 2D CM and 3D CM pretreatment.

Page 17
(a) (b) Figure 4: Cavitated EB cultured in EB medium supplemented with 40 ng/mL bFGF after (a) 2D CM and (b) 3D CM pretreatment. Scale bar is 100 um.
Analysis
When comparing the number of days the hESC were conditioned in MEF CM, the EB count
decreased at a slower rate for those conditioned for one day. However, a much lower number of EBs
were initially formed for those conditioned for 1 day as opposed to those conditioned for 0, 2 or 3 days,
which was same for those cultured with or without bFGF. The lower seeding density may have
contributed to the low rate of decrease because of factors such as less cell debris, therefore, less
apoptotic signaling. The EBs without bFGF conditioned for 0 days and 2 days appeared very unhealthy.
Very soon after EBs were formed in these conditions, cell debris was prominent. EBs that were
conditioned in MEF CM for 3 days before formation appeared to be larger and healthier with overall less
cell debris. Cavitation was also occurred more frequently in feeder-free conditions. The addition of
bFGF to the EB medium improved the morphologies of each culture condition showing more defined
edges and less cell debris; however, more agglomeration was seen. This indicates that decreases in EB
count can be accounted to multiple EBs merging together rather than cell death.
Feeder-independent cells experience a greater “shock” when being transferred from mTeSR1
medium to EB medium. This could explain why the EBs formed from these conditions did not flourish as
well as the feeder-free conditions. The MEF CM makes this transition easier because the cells can
become acclimated to the EB mediums differing nutrient content and osmolarity. Due to the small rate

Page 18
of decrease in EB count and the consistently healthier morphologies, the EBs conditioned in MEF CM for
3 days before formation proved to be optimal conditions with or without bFGF.
Varied bFGF Dosages
Average EB Count
Figure 5 shows the average EB count of the wells with EB medium containing different dosages
of bFGF: 0 ng/mL, 20 ng/mL, 40 ng/mL and 100 ng/mL. (Note: Data was collected up to Day 10 for the
wells with 40 ng/mL in order to perform rtPCR.) All of these cultures were conditioned in MEF CM all 3
days before EB formation. According to this graph, the EB count has fairly the same rate of decrease for
each dosage. The highest rate of decrease was for the wells treated with 20 ng/mL at a rate of -2.9788
EBs/day. The lowest rate of decrease was in the wells supplemented with 40 ng/mL at a rate of -1.8646
EBs/day.
Average EB Count: bFGF Dosage Dependent EB Medium
Figure 5 represents the average EB count over two weeks for EBs cultured with EB medium supplemented with varied concentrations of bFGF. The slopes indicate the rate of decrease for each condition.
y = -1.9048x + 43.19
y = -2.9788x + 53.817
y = -1.8646x + 48.022
y = -2.1553x + 46.974
0
10
20
30
40
50
60
1 2 3 4 5 6 7 8 9 10 11 12 13 14
Ave
rage
EB
Co
un
t
Day
0-bFGF
20-bFGF
40-bFGF
100-bFGF
Page 19
Average EB Size and Morphology
In Appendix B, Table 3 illustrates a random representation of the EB morphology of EBs culture
in EB medium supplemented with varied concentrations of bFGF. For the first week, the EBs seemed
relatively the same in morphology. On Day 2, there was little difference seen between the different
culture conditions. On Day 5 and Day 7, the presence of accumulated cell debris starts becoming
noticeable in the wells without bFGF, but the EBs were still surviving and maintaining relatively healthy
sizes. Otherwise, there were no significant differences. Day 10 in the 0 ng/mL and 20 ng/mL wells
showed a much greater presence of cell debris, which began to have an effect on the morphology. The
EBs were diminishing in size and had very undefined edges, especially those within the perimeter of the
accumulated cell debris. The further away the EBs were from the cell debris, the bigger they grew and
better their appearance.
Analysis
bFGF signaling also was shown to clearly play a significant role in directing differentiation. Based
on the results of the EB count of the EBs with varied dosages of bFGF, the wells with 40 ng/mL had the
smallest rate of decrease in EB count while those given 20 ng/mL had the highest rate of decrease. This
shows that halving the dosage is not sufficient to maintain the EBs in culture. The morphology of EBs in
the 40 and 100 ng/mL were very similar throughout the culture period. On average, they grew larger
and showed less evidence of cell debris. Those cultured with 20 ng/mL bFGF and those cultured without
bFGF (0 ng/mL) did not grow as large and had more prevalence of cell debris. This indicates that the
rate of decrease for the EBs in 0 ng/mL and 20 ng/mL were more likely due to cell death, while the rate
of decrease in EBs cultured in 40 ng/mL and 100 ng/mL was most likely due to agglomeration. In these
conditions, there were a few EBs that thrived and grew to be very large; however, the majority of the
living EBs withered to an unhealthy state. This indicated that 40 ng/mL was an optimal concentration
Page 20
for the bFGF supplement. A concentration higher than that does not present a substantial change in the
morphology that would justify the slightly higher rate of decrease in EB count that was seen.
PCR Analysis
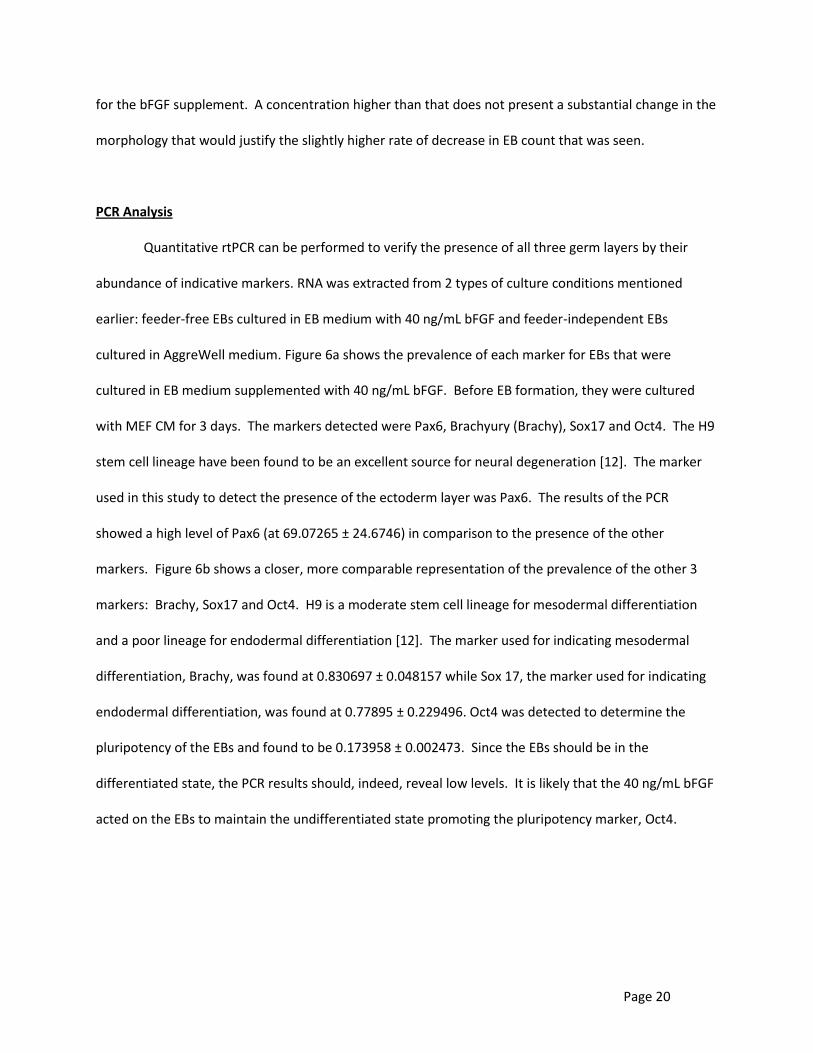
Quantitative rtPCR can be performed to verify the presence of all three germ layers by their
abundance of indicative markers. RNA was extracted from 2 types of culture conditions mentioned
earlier: feeder-free EBs cultured in EB medium with 40 ng/mL bFGF and feeder-independent EBs
cultured in AggreWell medium. Figure 6a shows the prevalence of each marker for EBs that were
cultured in EB medium supplemented with 40 ng/mL bFGF. Before EB formation, they were cultured
with MEF CM for 3 days. The markers detected were Pax6, Brachyury (Brachy), Sox17 and Oct4. The H9
stem cell lineage have been found to be an excellent source for neural degeneration [12]. The marker
used in this study to detect the presence of the ectoderm layer was Pax6. The results of the PCR
showed a high level of Pax6 (at 69.07265 ± 24.6746) in comparison to the presence of the other
markers. Figure 6b shows a closer, more comparable representation of the prevalence of the other 3
markers: Brachy, Sox17 and Oct4. H9 is a moderate stem cell lineage for mesodermal differentiation
and a poor lineage for endodermal differentiation [12]. The marker used for indicating mesodermal
differentiation, Brachy, was found at 0.830697 ± 0.048157 while Sox 17, the marker used for indicating
endodermal differentiation, was found at 0.77895 ± 0.229496. Oct4 was detected to determine the
pluripotency of the EBs and found to be 0.173958 ± 0.002473. Since the EBs should be in the
differentiated state, the PCR results should, indeed, reveal low levels. It is likely that the 40 ng/mL bFGF
acted on the EBs to maintain the undifferentiated state promoting the pluripotency marker, Oct4.
Page 21
Figure 7a illustrates the detection ratios of the 4 markers on feeder-independent EBs
formed in AggreWell medium. These EBs were extracted on Day 14. Pax6 was found to be very
high at 1432.5949 ± 163.134. Brachyury was found at 0.8310 ± 0.255. Sox17 was found to be
3.3539 ± 0.787. And, Oct4 was found to have 0.0518 ± 0.004. Both of these PCR results revealed a
high preference for differentiation into ectodermal cells, which is consistent with the typical
differentiation status of the H9 cell lineage. Figure 7b shows a closer, more comparable
representation of the prevalence of the other 3 markers: Brachy, Sox17 and Oct4.
(a)
(b)
Figure 6: EBs were cultured in EB medium supplemented with 40 ng/mL bFGF. They were feeder-free by culturing the cells in MEF CM 3 days before EB formation. EBs were extracted on Day 10. Chart (a) displays the presence of Pax6, Brachyury, Sox17 and Oct4 markers in EBs retrieved on Day 10. Chart (b) shows only Brachyury, Sox17 and Oct4 on a smaller scale for easier comparison.
(a)
(b)
Figure 7: EBs were cultured in AggreWell medium and were feeder-independent. EBs extracted on Day 14. Chart (a) displays presence of Pax6, Brachyury, Sox17 and Oct4 markers in EBs retrieved on Day 14. Chart (b) shows only Brachyury, Sox17 and Oct4 on a smaller scale for easier comparison.
0
20
40
60
80
100
Pax6 Brachy Sox17 4-Oct
Ave
rage
Fo
ld C
han
ge
PCR - EB medium 40 ng/mL bFGF - Day 10
0
0.2
0.4
0.6
0.8
1
1.2
Brachy Sox17 4-Oct
Ave
rage
Fo
ld C
han
ce
PCR - EB Medium 40 ng/mL bFGF - Day 10
0
500
1000
1500
2000
Pax6 Brachy Sox17 4-Oct
Ave
rage
Fo
ld C
han
ge
AggreWell - Day 14 - PCR
0
1
2
3
4
5
Brachy Sox17 4-Oct
Ave
rage
Fo
ld C
han
ge
AggreWell - Day 14 - PCR

Page 22
Discussion:
EBs were successfully formed in every culture condition; however, the characteristics of each
condition varied greatly. Cells cultured in MEF CM for 3 days before EB formation formed the healthiest
EBs. EB medium can be used but needs to be supplemented with 40 ng/mL bFGF to support the EBs.
After the first 24 hr of culturing, the average number of EBs formed was very high. Occasionally, there
would be an increase in the number of EBs between two days; however, for the most part, the number
decreased. Though, while having a high number of EBs is ideal, it in not useful if they are unhealthy or
unable to differentiate the three germ layers. The morphology of the EBs demonstrated the healthiness
of the EBs in each culture. Initially, the EBs that formed were small and composed of dense hESC,
creating simple EBs. After several days of culturing (usually around a week), some of the EBs
experienced cavitation in which the cells in the center of the EB perform apoptosis. These are called
cavitated or cystic EBs. The presence of cavitated EBs, in which a hollow cavity is formed within the EB,
is commonly seen in culture and mimic the early stages of embryonic development [10, 11]. It was
previously demonstrated that cavitation starts near the periphery of the EBs and proceeds inward,
suggesting that it is induced by signals originating from the cells peripheral to the cavity [11]. This would
mean the extracellular environment plays a significant role in the cell fate. None of the EBs cultured in
AggreWell medium exhibited cavitation; however, cavitated EBs were prevalent throughout several
different culture conditions using EB medium.
Cell debris not only indicates the death of EBs, but it presents as a critical problem in
maintaining the healthiness of EBs. It is composed of waste products of the living EBs and the remains of
individual cells from dead EBs. Typically, the EBs that thrived were found closer to the edge of the well
where the cell debris was less noticeable. The EBs growing in the middle of the accumulated cell debris
were much smaller, not as robust and had very undefined edges. The cell debris contributed to the
unhealthiness of the EBs by introducing paracrine signals for apoptosis.
Page 23
Another characteristic of most of the EBs was the agglomeration. As previously demonstrated
[2], cells within an EB posses an ability to sense their microenvironment and organize themselves to
some degree accordingly. Agglomeration, multiple EBs coming together to form a single EB, was seen in
almost every culture condition. A small amount of agglomeration is acceptable and expected for EBs to
grow in size; however, too much can present a problem as well. If too many EBs come together to form
one massive EB, then problems such as malnutrition and apoptosis begin to arise. This process can
become a major limitation to cell proliferation [2]. Agglomerated EBs also tend to express
trophectoderm markers such as Cdx2 [13]. These markers belong to extraembryonic tissue from the
trophoblast rather than the inner cell mass that include the three main germ layers. Agglomeration was
the major concern in the EBs cultured with AggreWell medium. The number of EBs was low in
AggreWell medium, but they were very large and seemed to “chain” together. In the EB medium,
agglomerate chains were not seen as often but were still present in many of the wells by the end of the
second week.
Cells cultured in MEF CM for 3 days before EB formation formed the healthiest EBs. EB medium
can be used but needs to be supplemented with 40 ng/mL bFGF to support the EBs. Further tests are
needed to determine if differences in EB morphology play a major role in differentiation. Using
quantitative RT-PCR will show if the differentiation is affected by characteristics such as size, edge
definition, cavitation or agglomeration.
Acknowledgements:
I would like to express my appreciation to graduate student, Jon Earls, for his helpful advice and
instruction as well as performing the RT-PCR tests. This work was supported by Dr. Sha Jin and Dr.
Kaiming Ye by allowing access to lab equipment and supplies.
Page 24
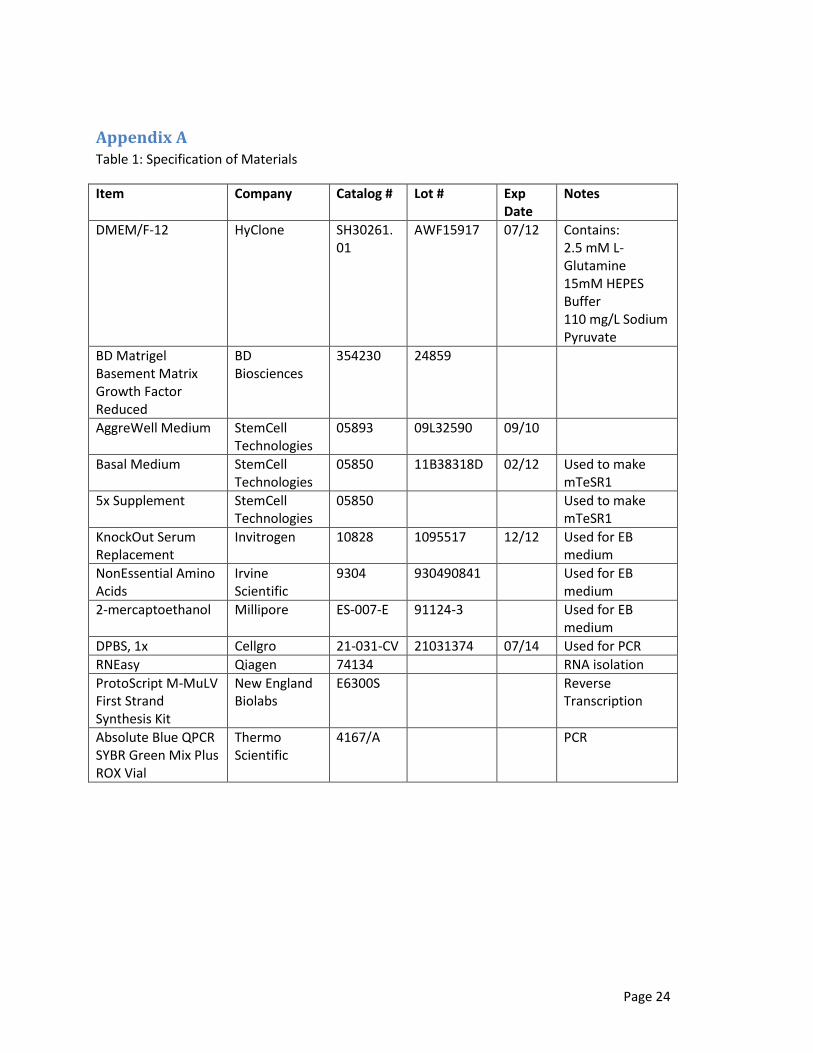
Appendix A Table 1: Specification of Materials
Item Company Catalog # Lot # Exp Date
Notes
DMEM/F-12 HyClone SH30261.01
AWF15917 07/12 Contains: 2.5 mM L-Glutamine 15mM HEPES Buffer 110 mg/L Sodium Pyruvate
BD Matrigel Basement Matrix Growth Factor Reduced
BD Biosciences
354230 24859
AggreWell Medium StemCell Technologies
05893 09L32590 09/10
Basal Medium StemCell Technologies
05850
11B38318D 02/12 Used to make mTeSR1
5x Supplement StemCell Technologies
05850 Used to make mTeSR1
KnockOut Serum Replacement
Invitrogen 10828 1095517 12/12 Used for EB medium
NonEssential Amino Acids
Irvine Scientific
9304 930490841 Used for EB medium
2-mercaptoethanol Millipore ES-007-E 91124-3 Used for EB medium
DPBS, 1x Cellgro 21-031-CV 21031374 07/14 Used for PCR
RNEasy Qiagen 74134 RNA isolation
ProtoScript M-MuLV First Strand Synthesis Kit
New England Biolabs
E6300S Reverse Transcription
Absolute Blue QPCR SYBR Green Mix Plus ROX Vial
Thermo Scientific
4167/A PCR

Page 25
Appendix B Table 1a: Random Representation of EB Morphology on Day 2, 5, 7, 10 and 14 between EB Medium and
AggreWell Medium
EB Medium AggreWell
Day 2*
Day 5*
Day 7**
Day 10**
Day 14**
Both cultures were feeder-independent. Neither were supplemented with bFGF. Scale bar at 100uL. * Pictures were taken with 10x objective lens **Pictures were taken with 4x objective lens
Page 26
Table 1b: Random Representation of EB Morphology on Day 2, 5, 7, 10 and 14 between EB Medium
without bFGF and AggreWell with 1 Day MEF Conditioned Medium Pretreatment
EB Medium AggreWell
Day 2*
Day 5*
Day 7**
Day 10**
Day 14**
Both cultures were feeder-free with 1 day of MEF CM. Neither were supplemented with bFGF. Scale bar at 100uL * Pictures were taken with 10x objective lens **Pictures were taken with 4x objective lens

Page 27
Table 2a: Random Representation of EB Morphology of Day 2, 5, 7, 10 and 14 after culturing hESCs for 0, 1, 2 and 3 days in MEF CM
OD CM 1D CM 2D CM 3D CM
Day 2*
Day 5**
Day 7**

Page 28
Day 10**
Day 14**
These EBs were formed and maintained in EB medium without bFGF supplement. Scale bar set at 100uL. * Pictures were taken with 10x objective lens **Pictures were taken with 4x objective lens
Page 29
Table 2b: Random Representation of EB Morphology on Day 2, 5, 7, 10 and 14 EBs using 40ng/mL bFGF after culturing hESCs for varied days in MEF CM before EB formation
1D CM 2D CM 3D CM
Day 2*
Day 5**
Day 7**
Page 30
Day 10**
Day 14**
N/A
These EBs were formed and maintained in EB medium supplemented with 40 ng/mL bFGF. EBs for 3 day MEF CM culture condition were extracted on Day 10 for PCR analysis and are, therefore, unavailable for Day 14 imaging. Scale bar set at 100uL. * Pictures were taken with 10x objective lens **Pictures were taken with 4x objective lens

Page 31
Table 3: Random Representation of EB Morphology of Day 2, 5, 7, 10 and 14 at bFGF Dosages of 0 ng/mL, 20 ng/mL, 40 ng/mL and 100 ng/mL.
0 ng/mL 20 ng/mL 40 ng/mL 100 ng/mL
Day 2
Day
5
Day
7
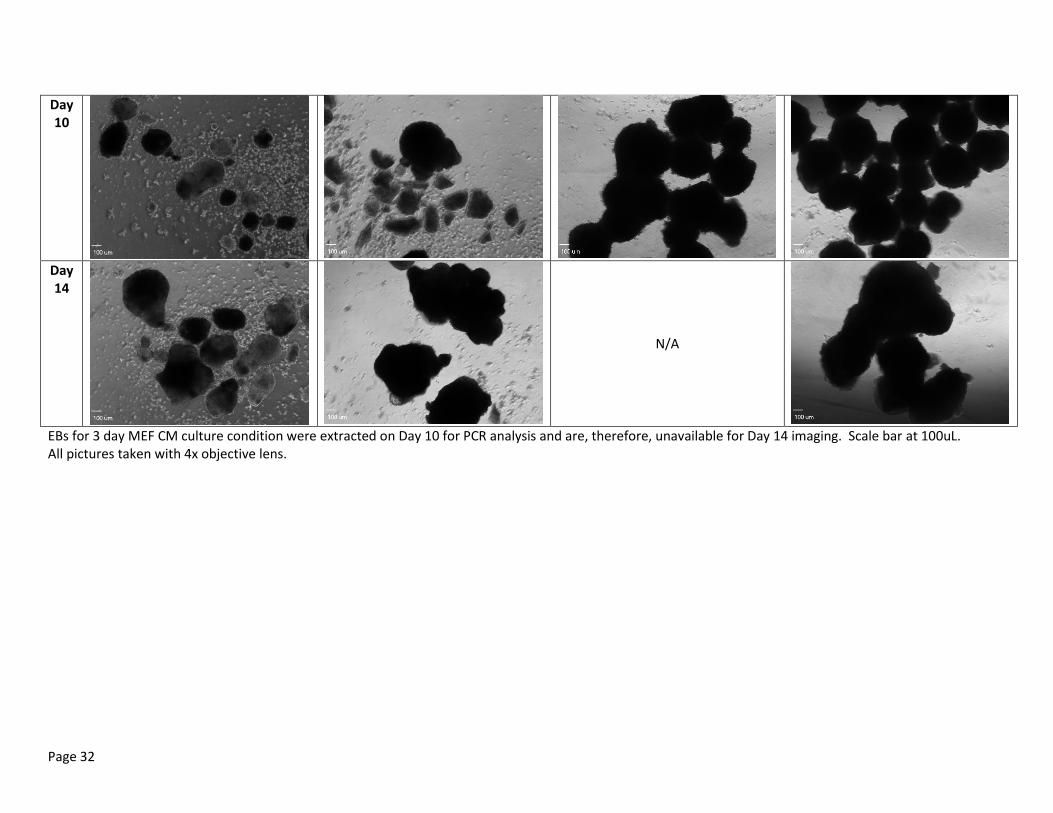
Page 32
Day 10
Day 14
N/A
EBs for 3 day MEF CM culture condition were extracted on Day 10 for PCR analysis and are, therefore, unavailable for Day 14 imaging. Scale bar at 100uL. All pictures taken with 4x objective lens.

Page 33
References
[1] Itskovitz-Eldor J, Schuldiner M, Karsenti D, Eden A, Yanuka O, Amit M et al. Differentiation of Human
Embryonic Stem Cells into Embryoid Bodies Comprising the Three Embryonic Germ Layers. Molecular
Medicine 2000;6:88-95.
[2] Dang SM, Kyba M, Perlingeiro R, Daley GQ, Zandstra PW. Efficiency of Embryoid Body Formation and
Hematopoetic Development from Embryonic Stem Cells in Different Culture Systems. Biotechnol Bioeng
2002;78:442-453.
[3] Yao S, Chen S, Clark J, Hao E, Beattle GM, Hayek A, et al. Long-term self-renewal and directed
differentiation of human embryonic stem cells in chemically defined conditions. PNAS 2006;103:6907-
6912.
[4] Amit M, Margulets V, Segev H, Shariki K, Laevsky I, Coleman R, et al. Human Feeder Layers for
Human Embryonic Stem Cells. Biology of Reproduction 2003;68:2150-2156.
[5] Ludwig TE, Bergendahl V, Levenstein ME, Yu J, Probasco M, Thomson JA. Feeder-independent
Culture of Human Embryonic Stem Cells. Nature Methods 2006;3:637-646.
[6] Wang L, Schulz TC, Sherrer ES, Dauphin DS, Shin S, Nelson AM, et al. Self-Renewal of Human
Embryonic Stem Cells Requires Insulin-like Growth Factor-1 Receptor and ERBB2 Receptor. Blood
2007;110:4111-4119.
[7] Levenstein ME, Ludwig TE, Xu R, Llanas RA, VanDenHeuvel-Kramer K, Manning D, et al. Basic
Fibroblast Growth Factor Support of Human Embryonic Stem Cell Self-Renewal. Stem Cells 2006;24:568-
574.
[8] Wang X, Lin G, Matins-Taylor K, Zeng H, Xu R. Inhibition of Capase-mediated Anoikis Is Critical for
Basic Fibroblast Growth Factor-sustained Culture of Human Puripotent Stem Cells. The Journal of
Biological Chemistry 2009;284:34054-34064.
[9] Lanner F, Rossant J. The role of FGF/Erk signaling in pluripotent cells. Development 2010;137:3351-
3360.
[10] Cameron CM, Hu W, Kaufman DS. Improved Development of Human Embryonic Stem Cell-Derived
Embryoid Bodies by Stirred Vessel Cultivation. Biotechnol Bioeng 2006;94:938-948.
[11] Coucouvanis E, Martin G. Signal for Death and Survival: A Two-Step Mechanism for Cavitation in
the Vertebrate Embryo. Cell 1995;279-287.
[12] Bock C, Kiskinis E, Varstappen G, Gu H, Boulting G, Smith Z, et al. Refernce Maps of Human ES and
iPS Cell Variation Enable High-Throughput Characterization of Pluripotent Cell Lines. Cell 2011;144:439-
452.
Page 34
[13] Ungrin, MD, Joshi C, Nica A, Bauwens C, Zandstra PW. Reproducible, Ultra High Throughput
formations of multicellular organization from single cell suspension-derived human embryonic stem cell
aggregates. PLoS ONE 2008;3:e1565
[14] Bone HK, Nelson AS, Goldring CE, Tosh D, Welham MJ. A Novel Chemically Directed Route for the
Generation of Definitive Endoderm from Human Embryonic Stem Cells Based on Inhibition of GSK-3.
Journal of Cell Sciene 2011;124:1992-2000.
[15] Kopper O, Giladi O, Golan-Lev T, Benvenisty N. Characterization of Gastrulation-Stage Progenitor
Cells and Their Inhibitory Crosstalk in Human Embryoid Bodies. Stem Cells 2010;28:75-83.
[16] Ardehali R, Inlay MA, Ali SR, Tang C, Drukker M, Weissman IL. Overexpression of BCL2 enhances
survival of human embryonic stem cells during stress and obviates the requirement for serum factors.
PNAS 2011;108:3282-3287.
[17] Cerdan C, Hong SH, Bhatia M. Formation and Hematopoietic Differentiation of Human Embryoid
Bodies by Suspension and Hanging Drop Cultures. Curr Protoc Stem Cell Biol 2007;3:1D.2.1-1D.2.16
[18] Sachlos E, Auguste DT. Embryoid body morphology influences diffusive transport of inductive
biochemical: A strategy for stem cell differentiation. Biomaterials 2008;29:4471-4480.
[19] Kurosawa H, Imamura T, Koike M, Sasaki K, Amano Y. A Simple Method for Forming Embryoid Body
from Mouse Embryonic Stem Cells. Journal of Bioscience and Bioengineering 2003;96:409-411.