formation of macrosegregation by multicomponent...
TRANSCRIPT

Formation of Macrosegregation by Multicomponent Thermosolutal Convection during the Solidification of Steel
M.C. SCHNEIDER and C. BECKERMANN
The formation of macrosegregation by multicomponent thermosolutal convection during the solidi- fication of steel is simulated by simultaneously solving macroscopic mass, momentum, energy, and species conservation equations with full coupling of the temperature and concentrations through thermodynamic equilibrium at the solid/liquid interface. The flow field, solid fraction evolution, and macrosegregation patterns for four cases are presented. The results show both the formation of channel segregates and the formation of islands of mush surrounded by bulk melt. In examining the solidification of a ten-element steel, the global extent of macrosegregation of an element is found to be linearly dependent on its partition coefficient (more severe segregation for small partition coef- ficient), although such scaling is not possible locally. Results for the solidification of a binary Fe-C alloy (with the same carbon content as the ten-element alloy) are similar to those for the ten-element alloy due solely to the large contribution of carbon to buoyancy driven flow in the ten-element steel chosen for study. While including only those elements that make significant contributions to buoy- ancy driven flow reproduces the global extent of macrosegregation seen in the ten-element alloy, local differences in the predictions are visible. Finally, comparison of results for the solidification of the same ten-element steel using two different sets of data to describe the partition coefficients and change in liquidus temperature with concentration of the elements shows completely opposite be- havior, i.e., upward flow through the mushy zone for one case and downward flow for the other. Thus, the need to have accurate phase-equilibrium data when modeling multicomponent macro- segregation is illustrated. Together, the results give an indication of what areas require more careful examination if accurate modeling of multicomponent solidification is to be accomplished.
I. INTRODUCTION
IN order to understand the processes that lead to the formation of defects in castings, the development of accu- rate models (and eff• numerical algorithms to solve the model equations) to study the transport phenomena that oc- cur during alloy solidification has been the focus of much interest in recent years. Indeed, numerical simulations have shown the ability of macroscopic solidification models to predict the effects of convection in the mushy zone and bulk liquid on the development of an irregular liquidus front, local remelting of solid, the development of flow channels in the mushy zone, and the establishment of ma- crosegregation patterns for the solidification of binary salt- water solutionstL2.3] and binary metal alloys.t 4-81
Nearly all of the previous macroscopic models of alloy solidification have focused on the study of binary alloy sys- tems. These alloys are popular because they involve rela- tively few phases but still exhibit the physical phenomena that would be expected in more complicated systems. While this attention to binary systems has led to a much wider understanding of the phenomena involved in alloy solidi- fication, many commercially and technologically important alloys (e.g., steels and nickel-base superalloys, respectively) are multicomponent systems. In considering multicompo- nent solidification, the influence of multiple species on the transport phenomena manifests itself through three coupled
M.C. SCHNEIDER, Graduate Research Assistant, and C. BECKERMANN, Associate Professor, are with the Department of Mechanical Engineering, University of Iowa, Iowa City, IA 52242.
Manuscript submitted October 11, 1994.
effects: (a) the differences in the solutal expansion coeffi- cients for the elements in the liquid phase; (b) the differ- ences in the partition coefficients for the elements, as well as the effects of the various species on the liquidus tem- perature; and (c) the differences in the rates of mass dif- fusion of the elements in the solid phase. Since the partition coefficients of the elements are unequal and the mass dif- fusivities of the elements in the solid are different, micro- segregation of each of the species in the solid will not be the same. These differences in microsegregation will lead to different distributions of the alloying elements in the liq- uid in the mushy zone. Since the solutal expansion coeffi- cients for the elements in the liquid are unequal, this will influence buoyancy driven flow in the casting. The elements also will be redistributed in the casting by this flow to dif- fering extents. This will, in turn, lead to variations in the liquidus temperature throughout the casting, as each ele- ment affects the liquidus temperature in a different manner. Clearly, the final distribution of an element in the casting will depend not only on the properties for that element, but also on those for the other elements present in the alloy.
While the vast majority of the attempts at modeling the formation of macrosegregation in alloy solidification have focused on binary systems, a few studies have considered multicomponent solidification.tg-~5] Studying unidirectional solidification and considering only flow due to solidification shrinkage, Mehrabian and Flemings rg~ calculated the degree of inverse segregation in a solidifying AI-Cu-Ni ternary al- loy. The model distinguished between the segregation be- havior of those components that are predominantly in solid solution in the primary phase with those that are predomi- nantly in secondary phases. The model predicted that over
METALLURGICAL AND MATERIALS TRANSACTIONS A VOLUME 26A, SEPTEMBER 1995--2373

certain ranges of composition, the secondary phase-forming component segregated opposite to the primary phase com- ponent, a fact which was verified experimentally. Predicted and measured segregation profiles for the unidirectional so- lidification of variable cross-section ingots showed quali- tative agreement, with the differences attributed to the assumptions of a constant thermal gradient and unidirec- tional flow. Other limitations of the model were the absence of bulk liquid motion and buoyancy driven flow.
Fujii e t aLt~Ol modeled segregation during the solidifica- tion of a low-alloy steel, including both shrinkage and buoyancy driven flow in the mushy zone. Each chemical species was classified as either nondiffusing or completely diffusing in the solid microscopically, and the progression of the liquidus and solidus isotherms was assumed to be specified as a function of time. Although the model ne- glected flow in bulk liquid regions, decreasing the silicon content and increasing the molybdenum content of the steel were shown to decrease the magnitude of flow in the mushy zone. In addition, by locating regions in the mushy zone where flow was in the same direction as the movement o f the isotherms, it was possible to locate regions where A- segregates were likely to form. The location of these regions was seen to be very sensitive to the specification of the mushy-zone permeability. Poirier and Andrewst~J ex- tended the model of Fujii e t aL to account for the formation of porosity. In order to emulate the effects of bulk liquid flow on flow in the mushy zone (particularly near the den- drite tips), a small pressure perturbation was introduced at a position on the liquidus isotherm. The predicted flow ve- locities in the vicinity of the perturbation indicated that re- melting and channel formation would be likely in that region. Predicted segregation profiles showed negative seg- regation near the bottom of the casting, positive segregation at the top of the casting, and inverse segregation near the chill.
Lesoult, and co-workerst12 ~5~ attempted to extend recent binary alloy solidification models that couple mass, mo- mentum, energy, and species conservation in all regions (solid, mush, and bulk liquid) to model steel solidification considering only buoyancy driven flow. In order to simplify the calculation procedure, the mass, momentum, and energy conservation equations were solved assuming that the com- positions in the mushy zone were given by the lever rule (for carbon) or Scheil equation (for other elements). With the solid fraction and velocity distributions known, the solid and liquid compositions were then determined explicitly at the end of each time-step. Using a binary Fe-C alloy solid- ifying in a cylindrical ingot, Vannier e t al. t151 compared this "partially coupled" method of calculation with fully cou- pled predictions. While the two methods predict the same trends, differences of up to 70 pct were apparent in axial segregation profiles, and at some locations along the cen- terline the partially coupled model predicted positive seg- regation where the coupled model indicated negative segregation. Combeau e t al. t13~ used the model to examine the effects of initial and boundary conditions on the for- mation of macrosegregation and found that the amount of superheat had little effect on the predicted carbon segre- gation along the ingot centerline, while insulating the top of the cylindrical ingot reduced the degree of carbon seg- regation at the ingot top. Roch e t al. t~2,~41 determined that the predicted degree of carbon segregation along the axis
of a cylindrical steel ingot decreased as the specified mushy-zone permeability was decreased, decreased when the specified value of the carbon-partition coefficient was increased, and decreased as the height-to-diameter ratio of the ingot was increased. In addition, slightly increasing the molybdenum content of the steel (from 0 to 1 wt pct Mo) was shown to decrease the extent of carbon segregation along the ingot axis, but a drastic increase in the molyb- denum content (3 wt pct Mo) actually increased the carbon segregation. Finally, Vannier e t al. t151 obtained qualitative agreement between measurements and predictions of the evolution of carbon segregation and the final carbon distri- bution along the centerline of a 65-ton cylindrical steel in- got.
Similar to the model used by Lesoult and co-workers,t~2 151 the present model is a generalization of a model for binary alloy solidificationr81 that accounts for the presence of multiple species. However, here, the mass, momentum, energy, and species conservation equations are solved si- multaneously, with the energy and species conservation equations fully coupled through thermodynamic equilib- rium requirements at the solid/liquid interface. The effect of each species on the liquidus temperature is accounted for, and the varying rates of mass diffusion of each element microscopically in the solid are considered. The influence of each species on buoyancy driven flow, both in the mushy zone and bulk liquid, is included. However, flow due to solidification shrinkage (as well as the effects of porosity formation on the flow ~161) is neglected in the results pre- sented here, and the model does not account for the floating or settling of equiaxed crystals in the melt. The aim of this article is to illustrate the use of this model to simulate the solidification of a ten-element steel alloy and then to show the necessity of fully accounting for all of the elements present when simulating the solidification of a multicom- ponent alloy. The latter objective is accomplished by com- paring the predicted flow field and macrosegregation patterns for the solidification of the ten-element steel alloy with those for the solidification of the corresponding binary Fe-C alloy and with those for the solidification of a five- element steel chosen to reproduce the buoyancy forces pres- ent in the ten-element alloy. Finally, the vastly different predicted flow and macrosegregation patterns for the solid- ification of the same ten-element alloy using two different sets of data from the literature for the partition coefficients and the effect of each species on the liquidus temperature are compared. Thus, the importance of an accurate knowl- edge of these thermodynamic equilibrium parameters when simulating multicomponent solidification is illustrated.
II. M O D E L D E S C R I P T I O N
A summary of the macroscopic conservation equations in the model is presented in Table I. These equations follow from the binary-alloy solidification model presented by Schneider and Beckermann t81 and can be obtained directly from the volume-averaged two-phase model of alloy solid- ification presented by Ni and BeckermannY 71 A detailed derivation of the model is available elsewhere, t8,~8,~91 so that only a brief discussion is included here. In all of the equa- tions, (qtk)~ indicates the intrinsic volume average of a quantity �9 of phase k, and ~kj indicates an average of a
2374--VOLUME 26A, SEPTEMBER 1995 METALLURGICAL AND MATERIALS TRANSACTIONS A

Table I. Summary of the Macroscopic Conservation Equations
Mixture mass conservation
0 a 05 (e ip l ) -~ v . (elPl (V/)/) = - - ~ t (esOs)
Liqu id spec ies conse rva t ion for spec ies m
0<c,~> ~ 0 a<cT>' + co, <v,>, �9 v <c~>, = v . (cip~P~, v <~>') - c,p, ~ +[<~>, _ <c7>'1 ~ (c,p,) ~tPt Ot
Solid species conservation for species m
a - - - T - ~ (e,p,) + , t~ a
Mixture energy conservation
d ( h , ) ' OT d(h ,> i , ,, ~,pi - - ~ - -g + ~ip, - ~ - ~ v , ~ �9 v
Liquid momentum conservation
d(h,) ~ aT a = V . {(e, kl + cA) V r } - e ,o , -~ - - ~ + [<hi>' - <hs>q ~ (e,p,)
a<v,>, e~p, ~ + ep,(vff �9 V (v,>' = -e iV p + V �9 (elplv~ V<vl>0+ V. {elpivl [V(vi)q' + pivl [<Vl> / V~l -~
"~l(Vl)~} ~- (Vi>l (~I~ ('sPs) -- ~ll P'~)i ~ [ ( 2 ) l ( v l > l - - ~i~lg [~T( T - Tref) ~- E~ ~'C (<~>' -- C~,=f)J
Table II. Initial Concentrations, Species-Dependent Thermophysical Properties, and Phase-Diagram Parameters
Cases El0, El, and E5 Case E10-PD or, ,
aT, s o ~
0C7, (K/Wt fl'~ (K/ K 'n Pet) [10,231 K 'n
C,, (1/Wt ~ DT~ Wt Pct)t22] (Wt Pct/ Tf = 1806 (Wt Pet/ (Wt Pct) Pct) [1~ (m2/s) [34] (m2/s) [35,36] T f - 1809 K Wt Pct) [221 K Wt Pet) [1~ Element
C 0.8 1.10 X 10 2 2 X 10 -9 5.6 X 10 -l~ - 7 8 0.34 -55 0.30 Si 0.15 1.19 • 10 2 2 • 10 -9 5.6 x 10 13 -17.1 0.59 - 1 3 0.50
Mn 0.3 1.92 • 10 3 2 X 10 -9 1.2 X 10 -13 -3.32 0.75 -4 .5 0.75 S 0.01 1.23 • 10 2 2 • 10 -9 3.3 • 10-" -30.4 0.024 - 3 0 0.05 P 0.008 1.15 • 10 -2 2 • 10 -9 2.4 x 10 -12 -27.1 0.09 - 3 0 0.06
Cu 0.2 -5.48 • 10 -4 2 X 10 9 4.4 x 10 -~z -1 .7 0.96 -5.1 0.40 Cr 0.1 3.97 X 10 3 2 X 10 -9 1.2 x 10 -12 -2.61 0.76 -1 .6 0.86 Ni 0.15 - 6 . 8 5 X 10 -4 2 • 10 -9 1.9 X 10 -13 -1 .6 0.94 -3.73 0.90 Mo 0.04 -1.92 X 10 -3 2 X 10 9 1.8 • 10 ~3 -3.25 0.56 -1 .9 0.60
quantity ~ o f phase k over the interfacial area between phases j and k in the averaging volume. The reader is re- ferred to the Nomenclature for an explanation o f all o f the symbols.
A. Simpli fy ing Assumpt ions
A number o f assumptions have been made to arrive at the form of the governing equations shown in Table II. They include the following.
(1) The solid phase is attached to the mold wall and is rigid so that
(vs> ' = 0 [1]
Thus, the model cannot account for the process o f dendrite fragmentation or for the movement o f equiaxed crystals in the melt.
(2) The solid and liquid phases within an averaging vol- ume are in thermal equilibrium, i.e.,
<ry = <~,>' = r [2]
(3) The liquid within an averaging volume is considered to be solutally well mixed for all species so that the interracial average and volume average concentrations for species m are equal, i.e.,
(Cf f= ~ [3]
(4) Microscopic species diffusion in the solid phase is modeled by assuming a one-dimensional ( l -D) plate model o f the solid dendrite arm and assuming a par- abolic concentration distribution in the solid. For the results presented here, the solid mass diffusivities o f the elements have been set constant (but unequal). More details regarding the modeling o f solid micro- segregation are provided in the following sections.
METALLURGICAL AND MATERIALS TRANSACTIONS A VOLUME 26A, SEPTEMBER 1995--2375

(5) Finite-rate macroscopic liquid-species diffusion is in- cluded, while all macroscopic solid-species fluxes are assumed to be negligible. Only ordinary (Fickian) dif- fusion is considered, and cross-diffusional effects be- tween alloying elements are neglected. For the results presented here, the liquid mass diffusivities of the el- ements have been set constant.
(6) Thermodynamic equilibrium is assumed to exist at the solid/liquid interfaces so that the interfacial tempera- ture and concentrations can be related through phase equilibrium requirements. More discussion on ther- modynamic equilibrium considerations is presented in the following sections.
(7) The phase enthalpies are assumed to vary only with temperature, and only the Fourier heat flux is consid- ered in the energy equation.
(8) Gravity is assumed to be the only body force, the Boussinesq approximation is used to account for buoyancy driven flow, and the viscous stresses are as- sumed to be proportional to the rates of deformation.
(9) The dissipative interfacial stress in the porous matrix of columnar dendrites is modeled using the mushy-zone permeability in analogy with Darcy's law. The direc- tional nature of columnar dendrites causes the perme- ability to be anisotropic.t20] Here, it is assumed that the principal flow directions are parallel and perpendicular to the primary dendrite arms and that the primary arms are aligned in a direction parallel to the flow of heat.
(10) The phase-diffusion coefficients that appear in the macroscopic conservation equations (i.e., the liquid mass diffusivities and viscosity, as well as the solid and liquid thermal conductivities) should be effective values that are functions of the local microstructure.VT] Due to a lack of a general theory or experimental cor- relations to calculate these quantities, they have been set equal to their microscopic counterparts.
Before continuing, a few further comments on thermody- namic equilibrium and solid microsegregation are necessary.
B. Thermodynamic Equilibrium Considerations
As mentioned in the preceding list of assumptions, ther- modynamic equilibrium at the solid/liquid interface has been assumed. For the relatively low solidification rates considered here, this is a reasonable assumption, while for rapid solidification processes, it may be necessary to con- sider nonequilibrium kinetic effects. Using the assumption of thermodynamic equilibrium, the temperature and con- centrations at the solid/liquid interface for a multicompo- nent system can be determined using the chemical potentials, i.e., by setting
/x'~ (T, Cs c ..... Q,) = tt7 (T,C c ..... C~s) [4]
where/.t 7 is the chemical potential of component m in phase k and n is the total number of species in the alloy. Because the focus of the present investigation is on the effects of thermosolutal convection in multicomponent solidification, such thermodynamic calculations have not been performed here. Rather, the change in the liquidus temperature with liquid concentration is assumed to be constant (but differ- ent) for each element. With the additional assumptions of a well-mixed liquid for all species and thermal equilibrium
in an averaging volume (i.e., Eqs. [2] and [3]), the liquidus temperature can be expressed as
T= ~ + aCts C7 ( ~ n ~ m
[5]
where T I is the melting temperature of pure iron. This is a reasonable approximation as long as the total alloying weight content is less than approximately 6 wt pct and the silicon content is less than 1 wt pct.t2n The partition coefficients for the elements in the alloy have also been set equal to con- stants in the present investigation. With the assumption of a well-mixed liquid within an averaging volume, the partition coefficient for component m can be written as
Km= Cs7/(C7)' [6]
Table II summarizes two sets of data for the partition co- efficients and change in liquidus temperature with compo- sition. The data from Kagawa and Okamota E2z] were obtained through thermodynamic analysis for multicom- ponent steel alloys, while the data from Fujii et aLt~O] and Wanqi and Yahoet23] were either determined experimentally or taken from the corresponding binary Fe-X phase dia- gram. The data from Reference 22 are used for most of the results presented here, with the data from References 10 and 23 used in one of the simulations in Section IV to illustrate the sensitivity of the model predictions to the phase-equilibrium parameters.
The simple approach to phase equilibrium adopted here cannot account for the formation of secondary phases or compounds due to strong interactions between elements in the alloy. In addition, the results in Section IV-F show that the prediction of flow and macrosegregation in a multicom- ponent alloy can be quite sensitive to the choice of the partition coefficients and change in liquidus temperature with concentration. The authors, therefore, anticipate in- corporating more precise thermodynamic calculations into the model in the future.
C. Microscopic Solid-Species Diffusion
In the solid-species conservation equations in Table I, the transfer of species m at the solid/liquid interface in an av- eraging volume due to microscopic concentration gradients within the solid is modeled as the product of the interracial area concentration (Ss) and a mean interfacial species flux of element m. ~7] The interfacial species flux is proportional to the difference in the interfacial average (C3) and volume average ((Cm) s) solid concentrations, with the constant of proportionality calculated from a solid-species diffusion length (l~) as well as the solid density and the mass diffu- sivity of species m in the solid. The diffusion length and the interfacial area concentration are, in general, compli- cated functions of the solid microstructure, the phase vol- ume fractions, and conditions within the averaging volume. Following Wang and Beckermann,tZ4] the assumption of a l-D, platelike secondary dendrite ann geometry (Figure l(b)) and a parabolic concentration distribution locally in the solid allows the interfacial area concentration and species diffusion length to be related to the solid fraction as
237~-VOLUME 26A, SEPTEMBER 1995 METALLURGICAL AND MATERIALS TRANSACTIONS A

Fig. 1--Schematic illustration of (a) the domain and boundary conditions used in the solidification simulations and (b) a 1-D platelike model of a dendrite arm and illustration of the solid and liquid concentration profiles on a microscopic scale.
2 Ss = - - [7]
a2
and
e A l~ = [8] 6
where es is the solid volume fraction in the averaging vol- ume, and d~ is a characteristic length of the solid micros- tructure, which is taken to be equal to the secondary dendrite arm spacing in the present investigation. Note that the diffusion lengths for all of the species are equal. How- ever, since the rate of diffusion of an element in the solid on a microscopic scale also depends on its solid mass dif- fusivity (listed in Table II), microsegregation of each ele- ment will still be different.
Using the preceding approach, no assumptions need to be made regarding whether the rate of mass diffusion of species m in the solid is fast (i.e., lever rule type behavior) or slow (i.e., Scheil type behavior), as has been done in all previous multicomponent solidification simulations. In ad- dition, the solidus temperature for multicomponent alloys can be reproduced fairly accurately, so that the prescription of a "nonequilibrium" solidus temperature or solid fraction (as done by Fujii et aL [l~ and Poirier and AndrewstlU) is not necessary. To illustrate this point, consider the case of solidification with no macroscopic solute transport by ad- vection or diffusion and a parabolic solidification rate. Wang and Beckermannt251 have shown that for these con- ditions, the species conservation equations in Table I, to- gether with Eqs. [7] and [8], allow an analytical solution for the liquid concentration of species m in terms of the solid fraction, the partition coefficient for species m, and a diffusion Fourier number for species m, a m = 4DTt:/~, where t: is the local solidification time. As one would ex- pect, this analytical solution approaches the lever rule and Scheil model for large and small a m, respectively. The an-
1750 ~ i i l , i i i i i
1725
~ 1675 o ~ , o.o1~,o.o12 s, ',..'~, 0 ~ 1 Mo, 0.06 Cu, 0.08 v \
I
1650 . . . . . lever rule \ present model
I
. . . . . . . . . . Scheil model (C lever nile) i 1625 O measm~ liquidus [37] :-
KI measme~ solidus [37]
1600 I I I I I I I I I
0.0 0.1 0.2 0.3 0.4 0.5 0.6 0.7 0.8 0.9 1.0
es
Fig. 2 ~ o m p a r i s o n of the evolution of the solid fraction with temperature for different solid microsegregation models. The lever rule was used to model carbon microsegregation for all cases, and the present model curve is for d2 = 25 /xm, ty = 230 s, and a parabolic solidification rate. Also shown are measured solidus and liquidus temperatures, t371
alytical solution for the liquid concentration, taken together with Eqs. [5] and [6], provides a relationship between the temperature and solid fraction during solidification. Figure 2 shows this T-es relation for the present model using the properties given in Table II (with the phase diagram equi- librium data taken from Reference 22), along with d2 = 25 /xm and t: = 230 seconds. (Note that this alloy is not the same as the one considered in the solidification simulations described in Section IV.) For comparison, the same relation also is shown for cases where the concentration of all of the elements are given by the lever rule or Scheil model (except carbon). The high solid-mass diffusivity of carbon results in a value of a c = 800, which is large enough that the variation in carbon concentration is indistinguishable from that given by the lever rule. Thus, the lever rule is used to model carbon microsegregation in the case where the Scheil model is used for the remaining elements. Also shown in Figure 2 are the measured liquidus and solidus temperatures for the given alloy. Although the value of d2 = 25/xm used in producing the curve in Figure 2 gives excellent agreement with the measured solidus temperature, values of 16/xm < d2 < 30 /zm would give temperatures within the experimental error associated with measuring the solidus.
During the solidification process, there is the possibility of local remelting of some of the solid that has formed. To avoid the difficulties associated with determining the local composition of the solid that is melting, E26,27j it is assumed here that the average solid concentration of element m re- mains constant during remelting, i.e.,
(Q'~)~ = constant during remelting [9]
Careful experimentation is necessary to obtain an accurate and realistic model of remelting.
METALLURGICAL AND MATERIALS TRANSACTIONS A VOLUME 26A, SEPTEMBER 1995--2377

Table III. Thermophysical Properties of Steel, Dendrite Arm Spacings, and Mushy Zone Permeability
Densityt34] p~ = p, = 7300 kg/m 3
Solid specific heat [3sa91
- - = 650 J/kg/K OT
Latent heat [m] (hi) ~ - (h~) ~ = 270 • 103 J/kg
Solid thermal conductivityt3S.39~ ks = 30 W/m/K
Primary dendrite ann spacing d~ = 350/~m
Permeability parallel to primary dendrite armstSaol
K~:s ~ = [4.53 • 10 -4 + 4.02 • 10 -6 (e, + 0.1) -5] (1 - e,)
0.07425 ~ [-In (1 - et) - 1.487 + 2(1 - e,) - 0.5(1 - el) 2]
fore, < 0.7
for e, > 0.7
Thermal expansion t~~ fiT= 2.0 • 10 -4K 1
Liquid specific heat [381 a(h,)'
- 800 J / k g / K 0T
L i q u i d v i s c o s i t y [34]
//q = 6.0 X 10 -4 k g / m / s
Liquid thermal conductivity t381 k, = 27 W/rn/K
Secondary dendrite arm spacing d2 = 75/zm
Permeability perpendicular to primary dendrite arms [5,2~176
~ [ 1 . 7 3 x 10 .3 dl) 109] d~l ~/3 gr/r/ = ( ~ (1 Z-~7749 )
I.0.03979 ~ [-In (1-e,)-1.476 + 2 (1-ez)-1.774 (1-e,)2+4.076 (1-e~) 3]
for e, < 0.7
for e, > 0.7
D. lnitial Conditions, Boundary Conditions, and Thermophysical Properties
In all of the simulations presented in this article, the do- main and boundary conditions shown in Figure l(a) have been used, with the initial conditions of a quiescent melt at a uniform temperature of 1813 K and uniform compositions for all elements at the values specified in Table II. This configuration was chosen for its simplicity and does not necessarily represent the conditions during the solidification of a steel ingot.
Thermophysical properties for steel are summarized in Tables II and III. Note that the solid and liquid densities have been set constant and equal (except in the buoyancy term) in the present investigation so that flow driven by solidification shrinkage is not considered. However, for the low cooling rate used in the simulations, shrinkage-driven flow is not expected to significantly alter the resulting ma- crosegregation patterns, t28~ The mushy-zone permeabilities in Table III are based on experimental measurements for low (el < 0.7) liquid fractions and analytical solutions for flow through arrays of cylinders at high liquid fractions, ts~ Because the permeabilities decrease with decreasing liquid fraction (and approach zero as the liquid fraction ap- proaches zero), the permeability term in the momentum equation naturally dampens out the velocities in the mushy zone as solidification progresses. The dendrite arm spacings in Table III are constants chosen to be representative of those found in steel alloys.
IlL NUMERICAL PROCEDURE
Since the conservation equations presented in the previous section are equally valid in the fully solid, mushy, and bulk
2378 VOLUME 26A, SEPTEMBER 1995
liquid regions, they can be solved using a fixed-grid, single- domain numerical solution procedure. For the results pre- sented in this article, an implicit, control-volume-based finite difference scheme has been used to discretize the conserva- tion equations, and a power-law scheme has been used to evaluate the finite-difference coefficients. The velocity-pres- sure coupling in the momentum equations was handled using the SIMPLER algorithm.t291
The coupling of the energy and species conservation equations in the mushy zone through the phase diagram provides a method for calculating the solid volume frac- tion.t3oj The method used here is an extension of an algo- rithm presented by Schneider and Beckermannt3U for the solidification of binary alloys. Briefly, the following steps outline the procedure to calculate the solid volume fraction (full details are available in Schneider and Beckermannt321). (1) The discretized form of the liquid species conservation
equation for each element at a node P in the mushy zone is substituted for (C7') t in the equation describing the liquidus temperature, i.e., Eq. [5].
(2) This equation is further substituted for the temperature at node P in the discretized energy equation, leaving a nonlinear equation for the solid fraction at node P. If the conservation equations are discretized following Pa- tankar, t29] this nonlinear equation for the solid fraction is of the form [32] (all averaging symbols have been dropped for convenience)
(aT)pTf + (aI)P ~m ( ) OTl,
E (Om)NB(Cr ~- (a')p(CT)/ NB
(Vol)p (dm)p - [1--Km](ps)p ~ - (Es) P
METALLURGICAL AND MATERIALS TRANSACTIONS A

- ~ (aT)NBTNB -- (aT)pT~- (~3rc)p (Vol)p - [(h,)p NB
(Vo l ) s - (hs)s] (ps)p ~ (es)p : 0 [10]
where a r and a m are finite-difference coefficients for the energy equation and species conservation equation for element m, respectively, and the subscript NB indicates values for the nodes that are neighbors to node P. In the discretized conservation equations, the solid frac- tion appears in the constant portion of the source term in the energy equation, (S~)p, and the finite-difference coefficient (am)p in the species conservation equation for element m. Therefore, in writing Eq. [10], the new (present time-step) value of the solid fraction at node P, (e,)s, has been separated from (Sr)p and (am)s, with the remainder of those terms contained in (SOp and (am)l ,. All other symbols are defined in the Nomencla- ture.
(3) The appropriate root of Eq. [11] is found using New- ton-Raphson iteration.
(4) The species-conservation equations are solved for the respective average concentrations, using the most re- cently calculated values for the volume fractions and solid interfacial concentrations.
(5) The temperature for each location in the mushy zone is updated based on the liquidus temperature corre- sponding to the most recent values of the average liquid concentrations.
This procedure is repeated within each time-step until con- vergence of the velocity, temperature, concentration, and volume fraction fields is achieved.
As described in Schneider and Beckermann,t8~ effort has been made to assure that the model and solution procedures are sound. Here, computations were performed on a grid that had 42 control volumes in the horizontal direction and 82 control volumes in the vertical direction and was biased near the walls. A time-step of 0.25 seconds was used in obtaining all the results. Based on previous experience with similar simulations, this grid and time-step are fine enough to capture all of the fundamental transport phenomena while allowing for reasonable computational costs. For a ten-element multicomponent simulation, simulation of a so- lidification time of 1 second required approximately 1150 seconds of cpu time on an HP* 715/50 workstation. For
*HP is a trademark of Hewlett-Packard Company, Colorado Springs, Co.
the corresponding binary Fe-C alloy, simulation of a solid- ification time of 1 second required approximately 220 cpu seconds of computation.
IV. RESULTS AND DISCUSSION
In order to illustrate the effects of multicomponent ther- mosolutal convection on the formation of macrosegrega- tion, four cases have been investigated. (1) Case El0 simulates the solidification of a ten-element
steel alloy, with initial composition as given in Table II.
(2) Case E2 simulates the solidification of a binary Fe-C alloy, with initial carbon content as given in Table II.
(3) Case E5 simulates the solidification of a five-element (iron plus carbon, silicon, manganese, and sulfur) steel alloy. The elements in the steel have initial concentra- tions as given in Table II and have been chosen to reproduce the buoyancy forces present in case El0.
(4) Case E10-PD is the same as case El0, but the data used to specify the partition coefficients and the change in liquidus temperature with concentration for the ten el- ements is taken from References 10 and 23 rather than from Reference 22. Both sets of data are summarized in Table II.
Comparing cases E2 and El0 will show the necessity of considering all of the elements present in an alloy when modeling the formation of macrosegregation. Comparison of cases E5 and El0 illustrates the usefulness of consider- ing only those elements that make a significant contribution to buoyancy driven flow, thus reducing the computational requirements for the simulation. Finally, differences in the predictions of cases El0 and E10-PD show the importance of accurately specifying the partition coefficients and change in liquidus temperature with composition when cal- culating thermosolutal buoyancy driven flow in multicom- ponent alloys. In order to illustrate the general phenomena observed in all of the cases, the results of case El0 are presented in detail. Selected results from the other cases are then presented to illustrate the similarities and differences in the model predictions.
In the vector plots used to illustrate the simulation re- suits, the velocity vectors represent the actual liquid veloc- ity, (Vl) 1, not the superficial velocity, (v~) = et(vff, and a velocity scale is shown at the bottom of each plot. Super- imposed on the vector plots are solid volume fraction con- tours in 10 pct increments. Maximum and minimum values for the plotted quantities are given at the bottom of the temperature and concentration plots. The shaded macrose- gregation plots used in the discussion of the results are of a normalized mixture concentration, i.e.,
C~,x _ e,p, < c,~, + S~ps< Cm) ~ [11]
C% (e~p, + Cp~)C~
with a scale provided in the figures. In all concentration plots, the concentration has been normalized with the initial concentration of the element under consideration to facili- tate comparison between the elements. Space limitations prohibit the presentation of concentration plots for all of the elements in the multicomponent alloys. Therefore, rep- resentative plots for selected elements are provided.
A. Case ElO--Nine-Element Steel
The results for case El0 are summarized in Figures 3 through 7. For this case, the liquidus temperature of the alloy is 1738 K, so that the melt initially contains 75 K of superheat. Once cooling is begun at the left wall, thermal buoyancy forces establish flow in the melt, and the super- heat begins to decrease. After 90 seconds, the first solid begins to form in the lower left comer, and as time pro- ceeds, the mushy zone grows into the casting and upward along the cooled wall. Figure 3(a) shows that after 250 seconds, the mushy zone is a little over 3-cm thick at the casting bottom and extends to within 2 cm of the top of the cooled wall. The velocity vectors in the figure show that the complicated buoyancy driven flow in the bulk melt
METALLURGICAL AND MATERIALS TRANSACTIONS A VOLUME 26A, SEPTEMBER 1995--2379

I---41 Cm
I x IIr~ (nls
250 S~."
7~:~::::777=.
. . . . i?":'
10 x 1~2 ~ s
~0 sec
(a) (b)
I Ox 10"2 m/s I.Sx 1~4 refit 750 scc zsO0 see
(C) (a) Fig. 3 - - V e l o c i t y field and solid fraction contours for case E l 0 at (a) 250 s, (b) 500 s, (c) 750 s, and (d) 1500 s.
I--'11 cm M~.tlganesc
"17548- 1747.0
Carbon
~ / / ~ t.005-
1.010~
1645 < TCK) < 1763 1.001 < C,t, K2in < 2.511 1.002 < C~/Cin < 2,216
(a) (b) (c)
Silicon
~ 1 . o o 5 i 1 1 ~ 0 1
I.
1.002 �9 C/JCin < 27.25 (d)
Fig. 4---(a) through (d) Isotherms (in 15 equal increments) and liquid concentration contours for case E l 0 at 250 s.
is primarily counterclockwise, with flow downward through the mushy zone. The magnitudes of the velocities in the mushy zone are much smaller than those in the bulk melt, as they are dampened by the flow through the porous mush. Since the liquid is cooled as it falls along the left wall, the mushy zone is thicker near the bottom of the casting. The isotherms in Figure 4(a) show that after 250 seconds, the superheat has largely been removed from the bulk melt. Due to the different solubilities of the elements in the solid and liquid phases, the formation of solid is accompanied by the enrichment of the interdendritic liquid with solute. The liquid concentration contours in Figures 4(b) through (d) show that the counterclockwise flow in the melt and the downward flow through the mushy zone carry some of this enriched liquid into the bulk melt. The flow carries the sol- ute-enriched liquid upward along the right wall to about the middle of the casting, where the flow tums back toward the center of the casting, leaving a region in the bottom center leaner in solute than the liquid above it. The figure also indicates that the redistribution of the elements is similar, but the extent of redistribution is larger for those elements whose partition coefficient is small (e.g., sulfur). The col- lection of solute-rich liquid at the bottom of the casting lowers the liquidus temperature there and leads to the de- layed formation of solid, as indicated by the solid fraction contours at the bottom near the left wall in Figure 3(a). If
0.0050
0.0025
O.13000
+
~ . 0.0025
- 0.0050
- 0.0075 0.0
total . . . . . . . Mn C .......... Si Cu . . . . . . . MO
0.0020 , F / .
.................. j , :
0.85 0.90 0.95 1.00 I I I I ! I 1 I I
0.1 0.2 0.3 0.4 0.5 0.6 0.7 0.8 0.9 1.0 r
Fig. 5~Contr ibut ion o f each o f the e lements to and the total buoyancy force in the mushy zone as g iven by Eq. [12].
heat were removed through the bottom of the casting, as in a typical ingot, conditions at the bottom of the casting may be different.
2381~-VOLUME 26A, SEPTEMBER 1995 METALLURGICAL AND MATERIALS TRANSACTIONS A

Fig. 6-- (a) through (d) Macrosegregation patterns for case El0 at 750 s.
As time proceeds, the mushy zone grows further into the casting, and by 300 seconds, a small, completely solid re- gion is present at the bottom of the cooled wall. The solid fraction contours in Figure 3(b) show that by 500 seconds, the fully solid region has grown to form a thin layer along the cooled wall, and the mushy zone extends to the center of the casting. There are also small "islands" of mush be- ginning to form along the bottom third of the right wall. Since (as discussed in relation to Figure 4) the elements are redistributed to differing extents throughout the casting due to the differences in their partition coefficients, the liquidus temperature also varies throughout the melt. That is, the complex dependence of the liquidus temperature on the liq- uid composition means that even though a region of the melt may be highly enriched in some elements, a smaller degree of enrichment of other elements in that region can lead to a local elevation of the liquidus temperature and the formation of the islands seen in Figure 3(b). In reality, one would expect the islands to be made up of free equiaxed crystals that would settle to the bottom of the casting to form a region of negative segregation and/or would be trapped by the growing columnar structure to form an equiaxed zone near the right wall. The present model, how- ever, does not account for solid movement. The velocity vectors in Figure 3(b) show a complicated flow pattern, with a counterclockwise circulation through most of the bulk melt and clockwise motion at the top and bottom. Most of the flow through the mushy zone is downward, although there is some upward flow very near the edge of the mush (especially near the clockwise circulation at the casting bottom). In addition, a preferred path for interden- dritic flow is visible at the bottom of the mushy zone (as indicated by the dashed lines in Figure 3(b)).
The solid fraction contours in Figure 3(c) show that after 750 seconds, an approximately 1.5-cm-thick fully solid re- gion occupies the left part of the casting, and the mushy zone extends across about two-thirds of the width of the casting. The islands of mush that were visible in Figure 3(b) have coalesced to form a longer island, and small is- lands have also begun to form farther up the right wall as well as in the bulk melt at the lower right. While these islands are porous, the resistance they offer to the flow af- fects the velocity field, as indicated in Figure 3(c), by the strong flow between the two islands at the bottom of the casting. The velocity vectors in the figure also show that the flow through the rest of the bulk melt is generally in a
counterclockwise direction. The flow through the mushy zone remains downward, i.e., in the direction of thermal buoyancy driven flow. This is somewhat surprising when one considers that the enrichment of the liquid in the mushy zone with solute serves to decrease the density of the liquid (as seen from the sign of/3~ in Table II) for most of the elements (the exceptions .being copper, nickel, and molyb- denum). Thus, one might expect upward, solutally driven flow in the mushy zone.
To further examine this issue, consider the buoyancy term in the momentum equation in Table I. Recalling that in the mushy zone the temperature and liquid composition are related through the liquidus temperature, i.e., Eq. [5], one sees that in the mushy zone, the buoyancy force is proportional to
Or~s [12]
As discussed in Section II-C, in the absence of macroscopic solute transport and with a parabolic solidification rate, there is an analytical solution to the species conservation equations in Table I that relates ACT to the solid fractionY 5~ Using this analytical solution, the right-hand side of Eq. [12] can be evaluated as a function of the solid fraction. Figure 5 shows the contribution of each of the elements to and the total for the sum in Eq. [12] and indicates that carbon, silicon, and sulfur make the most significant con- tributions to buoyancy driven flow in the mushy zone. At high solid fractions (G > 0.85 approximately), the other elements begin to exert some influence (especially phos- phorous, manganese, and molybdenum), but the low mushy-zone permeability at these high solid fractions will dampen out most of the buoyancy driven flow. Further- more, note that although/3cc is positive (in Table II), Figure 5 shows that the right-hand side of Eq. [12] is negative for
ar,~ carbon. In other words, the quantity ]3 r ~ is a negative
number whose absolute value is much larger than/3Cc, i.e., the effects of thermal buoyancy outweigh the effects of so- lutal buoyancy for carbon. Since carbon dominates the total buoyancy force in the mushy zone (as shown in Figure 5), it is not surprising to see the downward flow in the mushy zone in Figure 3. Further discussion of the relative effects of the elements on buoyancy is given in Sections IV-C and IV-E.
METALLURGICAL AND MATERIALS TRANSACTIONS A VOLUME 26A, SEPTEMBER 1995--2381

Fig. 7--(a) through (i) Final macrosegregation patterns for case El0.
Another consequence of the flow through the mushy zone is apparent in the mixture concentration plots for case El0 after 750 seconds in Figure 6. Figure 6(a) shows very little macrosegregation for nickel, while Figure 6(b) shows that silicon-rich liquid has been carried out into the bulk
melt by convection through the mushy zone. In addition Figures 6(c) and (d) clearly show that the channel at the bottom of the mushy zone (as indicated by the dashed lines in Figure 3) is enriched with solute. This channel is a pre- ferred path for the flow of solute-rich interdendritic fluid.
2382--VOLUME 26A, SEPTEMBER 1995 METALLURGICAL AND MATERIALS TRANSACTIONS A

Table IV. Overall Macrosegregation at 1000 Seconds as Indicated by the Rms Value of Net Macrosegregation ie.
(Equation [13])
C a s e
Element Case El0 Case E2 Case E5 E10-PD
C 5.12 • 10 -2 5.81 • 10 2 5.10 • 10 -2 4.97 • 10 -2 Si 3.19 • 10 2 _ _
Mn 1.97 • 10 -2 - -
S 9.40 • 10 2 __ P 8.23 • 10 -2 - -
Cu 2.92 • 10 3 __ Cr 1.82 • 10 2 __ Ni 4.55 • 10 -3 - -
Mo 3.51 • 10 2 __
3.18 • 10 -2 3.60 • 10 -2 1.94 • 10 2 1.78 • 10 -2 9.58 • 10 2 7.57 • 10 -2
- - 8.92 • 10 2 - - 4.26 • 10 -2 - - 9.60 • 10 -3 - - 6.98 X 10 3 - - 2.90 • 10 -2
Fig. 8 - - ( a ) and (b) Velocity field, solid-fraction contours, and macrosegregation patterns for case E2 at 750 s.
The presence of this fluid in the channel serves to lower the liquidus temperature, resulting in both the delayed for- mation of solid and remelting. Also evident in Figure 6 is the pooling of solute-rich liquid at the bottom of the cast- ing. Figure 3(c) again shows that the presence of this liquid has delayed the formation of solid in a layer near the bot- tom wall. (This pooling may not be evident in an ingot, where there is also cooling through the bottom wall.) Some of this liquid is also carried upward along the edge of the mushy zone by the clockwise circulation at the bottom of the melt. Finally, note that the extent of segregation of the elements is dependent on the partition coefficient for that element, i.e., smaller ~ yields more severe macrosegre- gation. That is, since the same scale is used for Figures 6(a) through (d) and because the severity of segregation depends on the partition coefficient of the element under consider- ation, the size of the segregation bands plotted in Figure 6 are different for each element.
As cooling continues, the mushy zone and completely solid regions of the casting continue to grow until, at ap- proximately 1500 seconds, the fully solid region occupies the left one-half of the casting and there is no bulk liquid
remaining. Figure 3(d) shows that by this time, the flow is downward through most of the casting, there is strong flow up along the right wall, and the flow through the porous mush is several orders of magnitude slower than at earlier times. More channels are also forming near the edge of the mushy zone toward the bottom of the casting.
After 2250 seconds, solidification of the casting is com- pleted. The final macrosegregation patterns for all of the elements are shown in Figure 7. Due to the continuous drawing of solute-rich liquid downward and out of the mushy zone, the solid near the left and top walls of the casting is solute poor, while the bottom and right is solute rich. As in the previous figure, segregated channels are vis- ible, with the compositional differences between the chan- nels and surrounding solid being especially large for those elements that have small partition coefficients (e.g., sulfur and phosphorous). Overall, the macrosegregation patterns for the elements are similar, with the severity of segregation dependent on the partition coefficient of the element, i.e., there is little segregation of copper (Wu = 0.96) and severe segregation of sulfur (K s = 0.024).
To further explore the relative segregation of the ele- ments, Table IV provides a comparison of the global extent of macrosegregation of each of the elements. The values in the table are of
1 ~ x 1 d [13] ~mrms = ~ Cirn n
~ . casting Vc~ting
Since the integration is performed over the whole volume of the casting (not just the fully solid regions), Smm~s can be interpreted as a measure of the net macrosegregation of an element throughout the casting. The values of Storms for case El0 in Table IV again show that the severity of macrose- gregation is dependent on the partition coefficient of the element. This partition coefficient dependence will be ex- plored further in Section IV-D. Evaluation of Sm~s at earlier and later times indicates that the values in the table will change as solidification proceeds. However, the dependence of Storms on the partition coefficient of the elements does not change, i.e., Smrms is larger for smaller K m a t all times.
B. Case E2--Binary Fe-C Alloy
In case E2, the solidification of an Fe-0.8 wt pct C alloy has been simulated. One might be tempted to ignore the presence of other elements when modeling the solidification of plain carbon steels. By comparing the flow field and macrosegregation patterns for this case with those from case El0, some idea of the influence of the other elements on thermosolutal convection can be ascertained. As seen in Figure 5, carbon was the element that influenced the buoy- ancy force most significantly in the mushy zone in case El0, with the effects of thermal buoyancy outweighing those due to solutal buoyancy. Therefore, one would expect the general features observed in that case to also be seen in case E2 (e.g., downward flow through the mushy zone, collecting of solute-rich fluid near the bottom and fight sides of the casting, formation of segregated channels, etc.). The velocity vectors, solid-fraction contours, and mixture concentration plots for case E2 after 750 seconds in Figure 8 confirm these expectations. Overall, the solid-fraction dis- tribution and velocity field in Figure 8(a) are very similar
METALLURGICAL AND MATERIALS TRANSACTIONS A VOLUME 26A, SEPTEMBER 1995--2383

1.25
1.20
1,15
1.10
1.05
0,95
0.90
0.85
0,80
0,75
, , , , , , , ,
a D
a e
t~
e o
- - C a C
I ~ i I I I I i I
0.CO 0.0! 0 0 2 0.03 0.04 0.0S 0.fl6 0.07 0.08 0.09 fl.10
x ( m )
(a)
IAO
130
1.20
1.10
1.00
0.9tl
0.80
0.70
0 , ~
h~
- - C u e
. . . . . . . Mn �9 Mn
. . . . . . . . . . S i o S i
0.50 I I i I i i I I I
0.00 0.0l 0.02 0,03 0.IN 0.0~ 0.06 0.07 0.08 0.09 0,10 x (m)
(b)
Fig. 9--Macrosegregation profiles along the horizontal centerline of the casting Cv = 0.10 m) after 1750 s comparing (a) cases E2 and El0 and (b) cases E5 and El0.
to those seen in Figure 3(c) (the corresponding plot for case El0). The most noticeable difference between the figures is that in case E2, there is a large "peninsula" of mush jutting out into the bulk melt at the lower right, the same location where islands of mush are seen in case El0. The mechanism for the formation of the peninsula and islands is the same. Because in case E2 the liquidus temperature is only dependent on the concentration of carbon in the liquid (not ten elements as in case El0) and the carbon compo- sition of the liquid varies continuously throughout the melt, a continuous structure of mush is formed rather than the islands seen in case El0. More exactly, the downward flow through the mushy zone carries carbon-enriched liquid to the bottom portion of the casting, lowering the liquidus temperature there so that solidification proceeds more slowly. At the same time, the relatively warmer liquid in the top part of the casting also slows solidification in that region. The peninsula forms between these two areas, where conditions lead to faster growth of the mushy zone.t331 Also note that case E2 does not show the formation of mushy islands along the right wall. Flow through the porous mush in the peninsula is much slower than that in the bulk melt, and it separates the flow into roughly two regions of counterclockwise circulation. As in case El0, flow through the mushy zone is downward in case E2. Fi- nally, examination of Figures 8(a) and 3(c) reveals that the magnitudes of the velocities are slightly larger in case E2 than in case El0.
Comparison of Figures 8(b) and 6(c) indicates that at 750 seconds, the overall macrosegregation patterns for carbon are similar in cases E2 and El0. The most noticeable dif- ference is at the bottom right, where in case E2, the pen- insula of solid has kept solute-rich liquid from progressing farther up into the bulk liquid, as was seen in case El0. Within the peninsula, there are two long, fingerlike regions of composition near the initial, and the solute-poor region at the top of the casting is slightly larger for case E2. A more detailed comparison of macrosegregation for cases E2 and El0 is provided in Figure 9(a), which shows the carbon distribution along the horizontal centerline of the casting after 1750 seconds for those cases. Since carbon played the largest role in buoyancy driven flow in case El0 (with ther- mal buoyancy overwhelming solutal buoyancy due to car- bon concentration variations), the overall pattern of macrosegregation is much the same for the two cases. How-
ever, the predicted extent of carbon segregation (especially in the channels in the right part of the casting) is worse for case E2. Looking at Figure 5, this can be explained by the fact that most of the other elements that had a significant influence on buoyancy in case El0 (e.g., silicon) oppose the buoyancy force due to C. Therefore, one would expect that when all the elements are included, the magnitude of flow would be smaller and the resulting macrosegregation less severe. Table IV provides a final comparison of cases E 10 and E2 and shows that case E2 predicts slightly more severe carbon segregation globally, as expected from the preceding analysis of the buoyancy forces present in the mushy zone.
C. Case E5--Five-Element Steel
Solving a species-conservation equation for each element present in a multicomponent alloy with full coupling of concentration and temperature in the mushy zone can be- come a computationally intensive task. Therefore, it is de- sirable to look for ways to decrease the computational effort required to accurately calculate macrosegregation. As men- tioned in Section I, Lesoult, and co-workerst12-~s] used a partially coupled model to reduce the number of compu- tations necessary, but the model could not reproduce fully coupled predictions for a binary alloy.t~sJ Another possibility is just to include those elements that make a large contri- bution to the buoyancy forces present during solidification of a multicomponent alloy. For the alloy under considera- tion in case El0, Figure 5 shows that carbon, silicon, and sulfur make the largest contributions to the buoyancy force in the mushy zone, and these are the elements that are con- sidered in case E5. The inset in Figure 5 indicates that the contribution of the remaining elements is small, except at high solid fractions, where there will be little flow due to the low mushy zone permeability. In order to have elements with a wide range of partition coefficients, however, man- ganese has also been included in the calculations for case E5.
Figure 10 shows velocity vectors, solid-fraction contours, and macrosegregation distributions for case E5 after 750 seconds of cooling and indicates that the general features of case El0 are also apparent for case E5. Comparing Fig- ures 10(a) and 3(c) (the corresponding plot for case El0) shows that the extent of the counterclockwise circulation at
2384--VOLUME 26A, SEPTEMBER 1995 METALLURGICAL AND MATERIALS TRANSACTIONS A

Fig. 10---(a) through (d) Velocity field, solid-fraction contours, and macrosegregation pattems for case E5 at 750 s.
Fig. ll--Macrosegregation for case El0 at the end of solidification: (a) global extent of macrosegregation of the elements as a function of partition coefficient, and (b) normalized net segregation along the horizontal centerline (y = 0.10 m) of the casting.
the top of the bulk liquid region does not extend as far down the casting in case E5. Looking closely at the edge of the mushy zone near the bottom of the casting, one sees that where case El0 predicts flow up into the bulk liquid, the opposite is true for case E5. Similar to case El0, case E5 shows the presence of islands of mush along the right wall, as well as in the bulk melt. Again, the porous nature of these islands slows the flow through them, forcing some of the bulk melt to flow around them. As mentioned pre- viously, in reality, one would expect these islands to be made up of free equiaxed crystals that would be free to move in the bulk melt rather than remain stationary.
While the macrosegregation pattems in Figures 10(b) through (d) are also similar to corresponding plots for case El0 (Figure 6), there are also some differences. Looking at sulfur, for example, case E5 does not predict a large region with a composition greater than 1.1 times the initial, like that seen in case El0 extending into the center of the cast- ing from the bottom. Rather, it appears that this solute is kept near the bottom of the casting by flow around the islands in the bulk melt. Further comparison of macrose- gregation for cases E5 and El0 is provided by Figure 9(b), which shows the macrosegregation of the elements along the horizontal centerline of the casting for those cases after 1750 seconds. There is good agreement between the pre- dictions of the two cases up to around x = 0.04 m, and both models predict the formation of channels along the rest of the centerline (x > 0.04 m) with their locations and
severity of segregation only slightly different. Finally, Ta- ble IV shows that on a global basis, considering the ele- ments most responsible for buoyancy driven flow (case E5) does closely approximate the extent of macrosegregation predicted when all ten elements are included (case El0).
E. Scaling of Macrosegregation of the Elements
The two previous sections have shown that by reproduc- ing the buoyancy forces present when solidifying a multi- component alloy, one can approximate the general trends in macrosegregation. The question that remains is whether using given simulation results for a reduced set of elements (as in case E5), one can determine the segregation patterns for the elements not included in the simulation. Figure 1 l(a) shows that the global extent of macrosegregation of an el- ement at the end of solidification for case El0, as deter- mined by STms (i.e., Eq. [13]), is approximately linearly dependent on its partition coefficient. Since the extent of macrosegregation is dependent on the buoyancy forces present during solidification (which, in turn, depends on the initial composition of the alloy), the curve fit to the points in Figure 1 l(a) will not be universal. However, the linear dependence on the partition coefficient should be true for alloys of other compositions. This linear dependence means that if a solidification simulation that considers a reduced set of elements correctly reproduces buoyancy driven flow for a multicomponent alloy, one could extrapolate from cal-
METALLURGICAL AND MATERIALS TRANSACTIONS A VOLUME 26A, SEPTEMBER 1995--2385

culated values of global macrosegregation to obtain an es- timate of the global extent of macrosegregation of the elements not considered in the simulation.
The similarity of the segregation profiles along the hor- izontal centerline of the casting in case El0, as shown in Figure 9(b), suggests that a scaling of the local element concentrations may also be possible. In Figure 1 l(b), the absolute value of the net local segregation of three ele- ments, normalized by their corresponding values of Smrms, along the horizontal centerline of the casting in case E 10 is shown. The figure indicates that the local concentrations of carbon and manganese are scaled well by the global severity of macrosegregation. However, the scaled segre- gation of sulfur is different by up to a factor of 2 from that of manganese and carbon, especially along the right half of the centerline of the casting. This is most likely due to the fact that the partition coefficient of sulfur is very small (an order of magnitude smaller than that for carbon and man- ganese) and is therefore severely segregated. The discrep- ancy between the profiles in Figure l l(b) indicates that while the global extent of segregation of an element can be scaled by its partition coefficient, local scaling of the ele- ment concentrations is not possible for those elements with very small partition coefficients. In other words, it is nec- essary to consider all of the elements in a multicomponent alloy in a solidification simulation if one is interested in the local severity of macrosegregation of an element.
F. Case El O-PD--Influence of Phase Equilibrium Data
In this final simulation, case E10-PD, the second set of values listed in Table II (from Fujii et aLVO] and Wanqi and Yaohe [231) for the partition coefficients of the elements and change in liquidus temperature with composition was used. The values given in Table II from Kagawa and Okamoto,[221 calculated from thermodynamic principles, were used in all the previous simulations and are but one of many sets of data available in the literature. The values for the partition coefficients and change in liquidus with composition used in case E10-PD were either determined experimentally or taken from the corresponding binary Fe-X phase dia- gram.O0.:3] Looking at Table II, the biggest discrepancy be- tween the phase equilibrium data used in the present case (E 10-PD) and that used in case E 10 is in the effect of car- bon content on the liquidus temperature. For case E 10, the liquidus temperature was changed by -78 K/wt pct, while in case E10-PD, it was changed by -55 K/wt pct, as the carbon composition of the liquid varied. The most impor- tant consequence of this discrepancy is that for case E10- PD, the contribution of carbon to the buoyancy force in the mushy zone is small (on the order of that of nickel), while the contributions of the other elements remain near those calculated using the Kagawa and Okamoto t221 data in Table II, as shown in Figure 5. Looking at that figure, one sees that for case E10-PD, silicon will be the element that dom- inates buoyancy driven flow through the mushy zone. Note also from Figure 5 that the buoyancy force associated with silicon acts in a direction opposite that due to carbon (i.e., solutal buoyancy outweighs thermal buoyancy for silicon). Therefore, in case E10-PD, the flow through the mushy zone is expected to be upward, rather than downward, as in case El0.
The plots of the flow field, solid-fraction contours, and
macrosegregation after 750 seconds for case E10-PD in Fig- ure 12 confirm these expectations. Comparing the velocity field in Figure 12(a) to the corresponding field for case El0 in Figure 3(c), one sees that there is, in general, counter- clockwise circulation in the bulk liquid for both cases. How- ever, in case E10-PD, solutal buoyancy in the mushy zone causes upward flow (in opposition to thermally driven flow) where case El0 shows downward flow. The consequences of this are shown in the macrosegregation plots in Figures 12(b) through (d), where solute-rich liquid has been carried to the top of the mushy zone by the upward flow to form a thin layer, while a solute-poor region has developed at the casting bottom. This is exactly opposite to what was ob- served for case El0 in Figure 6. Similar to what was ob- served at the casting bottom in case El0, the solid fraction contours in Figure 12(a) show that the solute-rich layer at the casting top has delayed the formation of solid there. The values in Table IV for the global severity of macrosegrega- tion indicate that in comparison with case El0, case E10-PD predicts more severe segregation for some elements and less severe segregation for others. The predictions for copper and chromium are particularly different. Clearly, to accurately model thermosolutal convection during multicomponent so- lidification, it is not only necessary to have correct values for the thermal and solutal expansion coefficients of the liq- uid but also an accurate knowledge of phase equilibrium, as indicated by the partition coefficients and liquidus tempera- ture. These results also indicate that it may be necessary to incorporate more accurate phase equilibrium calculations into the model.
V. CONCLUSIONS
A macroscopic model to study the transport of mass, mo- mentum, heat, and solute during solidification of multicom- ponent alloys (with coupling of temperature and composition in the mushy zone through phase equilibrium) has been used to examine the effects of multicomponent thermosolutal convection on the formation of macrosegre- gation. In the results presented here, flow driven by solid- ification shrinkage was not included. Results of four different simulations were compared to assess the sensitiv- ity of the model with respect to the effect of including additional elements in the calculation and with respect to the choice of phase equilibrium parameters. The model pre- dictions indicated the following. 1. Islands of mush formed in the bulk melt when multiple
elements were included in the calculations. Since the model does not account for the floating and settling of equiaxed dendrites that would be expected to make up these islands, the predicted flow field and macrosegre- gation patterns do not indicate the effects of the move- ment of the islands.
2. Carbon was the element primarily responsible for buoy- ancy driven flow for the composition of the ten-element multicomponent alloy chosen for the first simulation (case El0), with thermal buoyancy overwhelming so- lutal buoyancy. Therefore, downward flow in the mushy zone was predicted, resulting in solute-rich and solute- poor regions at the bottom and top of the casting, re- spectively.
3. Because carbon played such a large role in the buoyancy
238~-VOLUME 26A, SEPTEMBER 1995 METALLURGICAL AND MATERIALS TRANSACTIONS A
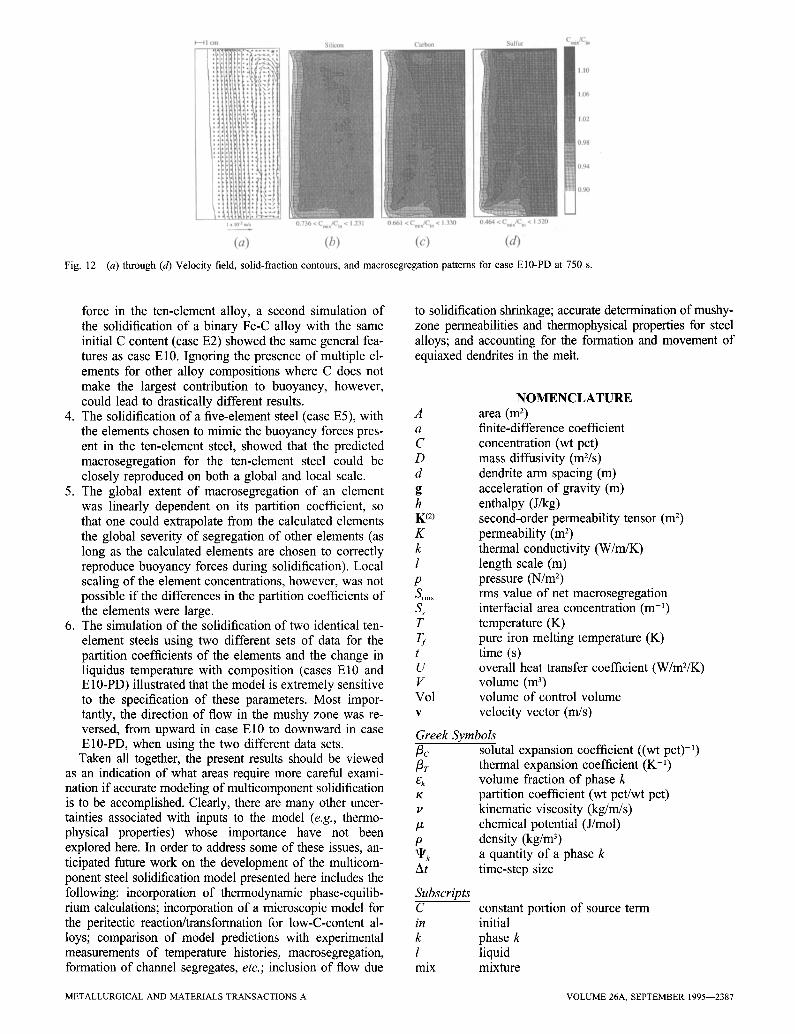
Fig. 12--(a) through (d) Velocity field, solid-fraction contours, and macrosegregation patterns for case E10-PD at 750 s.
force in the ten-element alloy, a second simulation of the solidification of a binary Fe-C alloy with the same initial C content (case E2) showed the same general fea- tures as case El0. Ignoring the presence of multiple el- ements for other alloy compositions where C does not make the largest contribution to buoyancy, however, could lead to drastically different results.
4. The solidification of a five-element steel (case E5), with A the elements chosen to mimic the buoyancy forces pres- a ent in the ten-element steel, showed that the predicted C maerosegregation for the ten-element steel could be D closely reproduced on both a global and local scale, d
5. The global extent of macrosegregation of an element g was linearly dependent on its partition coefficient, so h that one could extrapolate from the calculated elements K~2) the global severity of segregation of other elements (as K long as the calculated elements are chosen to correctly k reproduce buoyancy forces during solidification). Local l scaling of the element concentrations, however, was not P possible if the differences in the partition coefficients of S~ms the elements were large. S~
6. The simulation of the solidification of two identical ten- T element steels using two different sets of data for the Tj- partition coefficients of the elements and the change in t liquidus temperature with composition (cases El0 and U E10-PD) illustrated that the model is extremely sensitive V to the specification of these parameters. Most impor- Vol tantly, the direction of flow in the mushy zone was re- v versed, from upward in case El0 to downward in case E 10-PD, when using the two different data sets.
Taken all together, the present results should be viewed /3c as an indication of what areas require more careful exami- /3v nation if accurate modeling of multicomponent solidification ek
K is to be accomplished. Clearly, there are many other uncer- v tainties associated with inputs to the model (e.g., thermo- physical properties) whose importance have not been /z explored here. In order to address some of these issues, an- P q~k ticipated future work on the development of the multicom- At ponent steel solidification model presented here includes the following: incorporation of thermodynamic phase-equilib- Subscripts rium calculations; incorporation of a microscopic model for C the peritectic reaction/transformation for low-C-content al- in loys; comparison of model predictions with experimental k measurements of temperature histories, macrosegregation, l formation of channel segregates, etc.; inclusion of flow due mix
to solidification shrinkage; accurate determination of mushy- zone permeabilities and thermophysical properties for steel alloys; and accounting for the formation and movement of equiaxed dendrites in the melt.
NOMENCLATURE area (m 2) finite-difference coefficient concentration (wt pct) mass diffusivity (mVs) dendrite arm spacing (m) acceleration of gravity (m) enthalpy (J/kg) second-order permeability tensor (m 2) permeability (m 2) thermal conductivity (W/m/K) length scale (m) pressure (N/m 2) rms value of net macrosegregation interfacial area concentration (m -1) temperature (K) pure iron melting temperature (K) time (s) overall heat transfer coefficient (W/mZ/K) volume (m 3) volume of control volume velocity vector (m/s)
Greek Symbols solutal expansion coefficient ((wt pct) -~) thermal expansion coefficient (K -l) volume fraction of phase k partition coefficient (wt pct/wt pet) kinematic viscosity (kg/rn/s) chemical potential (J/mol) density (kg/m 3) a quantity of a phase k time-step size
constant portion of source term initial phase k liquid mixture
METALLURGICAL AND MATERIALS TRANSACTIONS A VOLUME 26A, SEPTEMBER 1995--2387

NB neighboring node points o averaging P node point P ref reference s solid "q* / perpendicular to dentrite arm ~ parallel to dendrite arm 1 primary 2 secondary
Superscripts C carbon m species m t transpose of a tensor T energy equation - interracial average ~ old (previous time-step) value
ACKNOWLEDGMENTS
This work was supported by the National Science Foun- dation under Grant No. CTS-8957149. One of the authors (MCS) thanks The University of Iowa College of Engi- neering for support through the Iowa Engineering Doctoral Scholarship Program.
REFERENCES
1. W.D. Bennon and F.P. Incropera: Metall. Trans. B., 1987, vol. 18B, pp. 611-16.
2. C. Beckermann and R. Viskanta: Physicochem. Hydrodyn., 1988, vol. 10, pp. 195-213.
3. V.R. Voller, A.D. Brent, and C. Prakash: Int. J. Heat Mass Transfer, 1989, vol. 32, pp. 1719-31.
4. G. Amberg: Int. J. Heat Mass Transfer, 1991, vol. 34, pp. 217-27. 5. S.D. Felicelli, F.C. Heinrich, and D.R. Poirier: Metall. Trans. B, 1991,
vol. 22B, pp. 847-59. 6. P.J. Prescott and F.P. Incropera: Metall. Trans. B, 1991, vol. 22B, pp.
529-40. 7. Q.Z. Diao and H.L. Tsai: Metall. Trans. A, 1993, vol. 24A, pp. 963-
73. 8. M.C. Schneider and C. Beckermarm: lnt. J. HeatMass Transfer, 1995,
in press. 9. R. Mehrabian and M.C. Flemings: Metall. Trans., 1970, vol. 1, pp.
455-64. 10. T. Fujii, D.R. Poirier, and M.C. Flemings: Metall. Trans. B., 1979,
vol. 10B, pp. 331-39. 11. D.R. Poirier and M.M. Andrews: Proc. 1st Int. Steel Foundry
Congress, Steel Foundrymens' Society of America, Des Plaines, IL, 1985, pp. 307-22.
12. F. Roch, H. Combeau, I. Poitrault, J.C. Chevrier, and G. Lesoult: Proc. 6th Int. lron and Steel Congress, vol. 1, Fundamentals, Iron and Steel Institute of Japan, Nagoya, Japan, 1990, pp. 665-72.
13. H. Combeau, F. Roch, I. Poitrault, J.C. Chevrier, and G. Lesoult: in
Advanced Computational Methods in Heat Transfer, vol. 3, Phase Change and Combustion Simulation, Springer-Verlag, New York, NY, 1990, pp. 79-90.
14. F. Roch, H. Combeau, J.Ch. Chevrier, and G. Lesoult: Modeling of Casting, Welding and Advanced Solidification Processes V, TMS, Warrendale, PA, 1991, pp. 789-95.
15. H. Vannier, H. Combeau, and G. Lesoult: Numerical Methods in Industrial Forming Processes, A.A. Balkema, Rotterdam, The Netherlands, 1992, pp. 835-40.
16. V.R. Voller and S. Sundarraj: personal communication, Dept. of Civil and Mineral Engineering, The University of Minnesota, Minneapolis, MN, 1992.
17. J. Ni and C. Beckermann: Metall. Trans. B, 1991, vol. 22B, pp. 349- 61.
18. M.C. Schneider: Master's Thesis, The University of Iowa, Iowa City, IA, 1991.
19. C. Beckermann and R. Viskanta: Appt Mech. Rev., 1993, vol. 46, pp. 1-27.
20. D.R. Poirier: Metall. Trans. B, 1987, vol. 18B, pp. 245-55. 21. J.S. Kirkaldy and E.A. Baganis: Metall. Trans. A, 1978, vol. 9A, pp.
495-501. 22. A. Kagawa and T. Okamoto: Mater. Sci. Technot, 1986, vol. 2, pp.
997-1008. 23. J. Wanqi and Z. Yaohe: Metall. Trans. B, 1989, vol. 20B, pp. 723-
30. 24. C.Y. Wang and C. Beckermann: Metall. Trans. A, 1993, vol. 24A,
pp. 2787-2802. 25. C.Y. Wang and C. Beckermann: Mater. Sci. Eng., 1993, vol. A171,
pp. 199-211. 26. M. Rappaz and V.R. Voller: Metall. Trans. A, 1990, vol. 21A, pp.
749-53. 27. D.R. Poirier, P.J. Nandapurkar, and S. Ganesan: Metall. Trans. B,
1991, vol. 22B, pp. 889-900. 28. M.J.M. Krane and F.P. Incropera: in Transport Phenomena in
Solidification, C. Beckermann, H.P. Wang, L.A. Bertram, M.S. Sohal and S.I. Guceri, eds., ASME, New York, NY, 1994, pp. 13-27.
29. S.V. Patankar: Numerical Heat Transfer and Fluid Flow, McGraw- Hill, New York, NY, 1980.
30. C. Prakash and V. Voller: Num. Heat Transfer, 1989, vol. 15, pp. 171-89.
31. M.C. Schneider and C. Beckermann: Technical Report UIME-CB01-1993, University of Iowa, Iowa City, IA, 1993.
32. M.C. Schneider and C. Beckermann: Technical Report UIME-CB01- 1994, The University of Iowa, Iowa City, IA, 1994.
33. C.Y. Wang: Ph.D. Thesis, University of Iowa, Iowa City, IA, 1994, pp. 150-51.
34. H. Landolt and R. Boi:nstein: Zahleenwerte der Physik und Chemie, Springer-Verlag, Berlin, 1969, part 5, vol. a.
35. P.J. Bunyan, S. Dellar, and N. Blake: Mater. Forum, 1992, vol. 16, pp. 215-24.
36. M.A. Krishtah Diffusion Processes in Iron Alloys, Scientific Translations, Jerusalem, 1970 (in English).
37. J. Miettinen: Metall. Trans. A, 1992, vol. 23A, pp. 1155-70. 38. R.D. Pehlke, A. Jeyarajan, and H. Wada: Document No. PB 83-
211003, National Technical Information Service, Ann Arbor, MI, Dec. 1982.
39. Y.S. Touloukain, R.W. Powell, C.Y. Ho, and P.B. Klemens: Thermophysical Properties of Matter, IFI/Plenum, New York, NY, 1970, vol. 1.
40. A.S. Sangani and A. Acrivos: Int. J. Multiphase Flow, 1982, vol. 8, pp. 193-206.
2388--VOLUME 26A, SEPTEMBER 1995 METALLURGICAL AND MATERIALS TRANSACTIONS A