formation of refractory inclusions by evaporation of...
TRANSCRIPT
PII S0016-7037(01)00731-1
Formation of refractory inclusions by evaporation of condensate precursors
LAWRENCE GROSSMAN,*,† DENTON S. EBEL,‡ and STEVEN B. SIMON
Department of the Geophysical Sciences, The University of Chicago, 5734 South Ellis Ave., Chicago, IL 60637, USA
(Received March 13, 2001;accepted in revised form June 26, 2001)
Abstract—Berman’s (1983) activity-composition model for CaO-MgO-Al2O3-SiO2 liquids is used to calcu-late the change in bulk chemical and isotopic composition during simultaneous cooling, evaporation, andcrystallization of droplets having the compositions of reasonable condensate precursors of Types A and Brefractory inclusions in CV3 chondrites. The degree of evaporation of MgO and SiO2, calculated to befaithfully recorded in chemical and isotopic zoning of individual melilite crystals, is directly proportional toevaporation rate, which is a sensitive function ofPH2
, and inversely proportional to the droplet radius andcooling rate. When the precursors are partially melted in pure hydrogen at peak temperatures in the vicinityof the initial crystallization temperature of melilite, their bulk chemical compositions evolve into thecomposition fields of refractory inclusions, mass-fractionated isotopic compositions of Mg, Si, and O areproduced that are in the range of the isotopic compositions of natural inclusions, and melilite zoning profilesresult that are similar to those observed in real inclusions. For droplets of radius 0.25 cm evaporating atPH2
�10�6 bar, precursors containing 8 to 13 wt.% MgO and 20 to 23% SiO2 evolve into objects similar to compactType A inclusions at cooling rates of 2 to 12 K/h, depending on the precise starting composition. Precursorscontaining 13 to 14 wt.% MgO and 23 to 26% SiO2 evolve into objects with the characteristics of Type B1inclusions at cooling rates of 1.5 to 3 K/h. The relatively SiO2-poor members of the Type B2 group can beproduced from precursors containing 14 to 16 wt.% MgO and 27 to 33% SiO2 at cooling rates of�1 K/h. TypeB2’s containing 27 to 35 wt.% SiO2 and �12% MgO require precursors with higher SiO2/MgO ratios atMgO � 15% than are found on any condensation curve. The characteristics of fluffy Type A inclusions,including their reversely zoned melilite, can only be understood in the context of this model if they containrelict melilite. Copyright © 2002 Elsevier Science Ltd
1. INTRODUCTION
The bulk chemical compositions of most Types A and B,Ca-, and Al-rich, refractory inclusions in Allende and otherCV3 chondrites are depleted in MgO and SiO2 relative to CaOand Al2O3, compared to compositions of calculated equilibriumassemblages of condensates from solar and dust-enriched gases(Grossman et al., 2000). Many of these objects existed as meltdroplets from which a fassaitic pyroxene crystallized whoseTi3�/Ti4� ratio indicates that the melt solidified under anoxygen fugacity equal to that of a hydrogen-rich gas of solarcomposition (Beckett, 1986). Davis et al. (1998) showed ex-perimentally that MgO and SiO2 preferentially evaporate fromdroplets having compositions similar to those of Type B inclu-sions when the droplets are immersed in hydrogen-rich gas at1500°C. Grossman et al. (2000) developed a thermodynamicmodel for calculating the equilibrium vapor pressure of anonideal, CaO-MgO-Al2O3-SiO2 (CMAS) liquid in vacuumand pure H2. They used it to show that removal of the relativeamounts of MgO and SiO2 predicted to evaporate at 1700 Kfrom melt droplets having the bulk chemical compositions ofhigh-temperature condensate assemblages would yield residueshaving the bulk compositions of Types A and B inclusions.Grossman et al. (2000) further showed that the absoluteamounts required to be evaporated are consistent with available
data on the degree of Mg and Si isotopic mass-fractionation inbulk inclusions.
It is unlikely, however, that these inclusions were either atconstant temperature or in the totally molten state when theyunderwent evaporation. In a study of the liquid-crystal phaserelations of a Type A–like composition, #98, Paque and Stolper(1984) found that spinel crystallizes on the liquidus at 1810 Kand melilite begins to form at 1783 K. On the basis of melilitetextures, they concluded that the maximum temperaturereached by inclusions of this composition was below the liq-uidus. Relict melilite grains are rare in compact Type A’s(Simon et al., 1999), suggesting these inclusions experiencedpeak temperatures close to that for initial crystallization ofmelilite. According to Stolper (1982), the sequence of mineralsthat form during cooling and equilibrium crystallization of aliquid of Type B–like composition, CAIB, is spinel, melilite,anorthite, and fassaitic clinopyroxene. The liquidus tempera-ture for this composition was estimated at 1823 K. Stolper andPaque (1986) reasoned, primarily from the textures and com-positions of melilite crystals in Type B inclusions, that themaximum temperature reached before cooling was within 20 Kof the temperature at which melilite begins to crystallize, whichis 1675 K for CAIB. The solidus temperature for all Types Aand B inclusion compositions is near 1500 K. It is thus likelythat the evaporation process that left its imprint on the chemicaland isotopic compositions of refractory inclusions occurredduring cooling and crystallization from�1800 K for Type A’sand�1700 K for Type B’s to 1500 K.
Grossman et al. (2000) found that the ratio of the vaporpressure of Mg(g) to that of SiO(g) over CMAS liquids is
* Author to whom correspondence should be addressed([email protected]).† Also Enrico Fermi Institute, The University of Chicago.‡ Present address: Department of Earth and Planetary Sciences, Amer-ican Museum of Natural History, New York, NY 10024.
Pergamon
Geochimica et Cosmochimica Acta, Vol. 66, No. 1, pp. 145–161, 2002Copyright © 2002 Elsevier Science LtdPrinted in the USA. All rights reserved
0016-7037/02 $22.00� .00
145

sensitive to both temperature and liquid composition. Further-more, the evaporation coefficients that relate the pressures ofthese species to their respective loss rates decline with fallingtemperature (Richter et al., in press). Because the actual tem-perature range over which evaporation occurred was differentfrom that modeled by Grossman et al. (2000), and because theliquid compositions were changing due to precipitation of solidphases in addition to evaporation, it is far from clear that theagreement between the degree of evaporation calculated fromtheir model and that obtained from the isotopic compositions ofinclusions would persist in a more realistic model. Thus, thepurpose of this paper is to model the chemical and isotopicevolution, during cooling and crystallization, of droplets withinitial bulk chemical compositions of high-temperature conden-sates; to explore the effects of PH2
, droplet size, and coolingrate on their final bulk chemical and isotopic compositions aswell as on the zonation of these properties within melilitegrains that crystallize from them; and, by comparison of thesepredicted properties with those of actual inclusions, to constrainthe physicochemical conditions under which refractory inclu-sions evolved.
2. TECHNIQUE
2.1. Input Assumptions
2.1.1. Initial Chemical Compositions
During condensation, the bulk chemical composition of thecondensed fraction of solar system matter changes continu-ously with falling temperature, as more and more materialcondenses into it. As in Grossman et al. (2000), any composi-tion lying along the trajectory of bulk chemical compositions ofhigh-temperature condensate assemblages predicted to form ina solar gas between 1350 and 1310 K at Ptot � 10�5 bar isconsidered a possible precursor composition for Types A and Binclusions. The specific bulk chemical compositions investi-gated in this work, �, �, �, �, and �, are calculated on a TiO2-and metallic iron–free basis, and given in Table 1.
2.1.2. Thermodynamic Data for Silicate Liquids
A model for the thermodynamic properties of silicate liquidshaving the compositions of refractory inclusions is needed tocalculate both their liquid-crystal equilibrium assemblages andtheir vapor pressures. In this work, as in Grossman et al.(2000), the 1.0 to 1.5 wt.% TiO2 present in refractory inclu-sions is ignored, and Berman’s (1983) activity-compositionrelations for CMAS liquids are used. For vapor pressure cal-
culations, the same gas species and sources of their thermody-namic data are used as in Grossman et al. (2000).
2.1.3. Thermodynamic Data for Minerals
Experimental liquid-crystal phase relations on CAIB (Stol-per, 1982) show that the evolution of the liquid is controlled bycrystallization of spinel and melilite, as anorthite and clinopy-roxene crystallize very late, almost on the solidus. In this work,therefore, crystallization of the latter two phases is ignored.This is equivalent to assuming that they both crystallize fromwhatever liquid remains at 1500 K. Thermodynamic data forMgAl2O4 spinel are taken from Berman (1988).
In this work, melilite is treated as a nonideal solid solution ofthe two end-members, gehlenite (Ca2Al2SiO7) and åkermanite(Ca2MgSi2O7). An attempt was made to use Berman’s (1983)end-member data together with the nonideal, gehlenite-åker-manite mixing model of Charlu et al. (1981) and Berman’s(1983) liquid model to calculate the temperatures of first crys-tallization of melilite and of disappearance of liquid for anumber of different bulk compositions along the gehlenite-åkermanite binary, i.e., the liquidus and solidus, respectively.Results are shown in Figure 1, where they are compared withthe liquidus and solidus curves obtained experimentally byOsborn and Schairer (1941). It is seen that this model is veryunsatisfactory in that it predicts a liquidus loop that is toonarrow, and liquidus and solidus temperatures that are too high,compared to the experimental melting relations, with the dif-ference between predicted and measured liquidus curves in-creasing with increasing åkermanite content and reaching over100 K by Åk60. Two other sets of calculated curves are shownin Figure 1. For calculating equilibrium between melilite andtheir MELTS liquid model, Ghiorso and Sack (1995) combinedBerman’s (1988) end-member thermodynamic data for melilitewith Charlu et al.’s (1981) mixing model. When the abovecalculation is repeated using this combination of melilite datawith Berman’s (1983) liquid model, it is seen in Figure 1 thatthe melting points of pure gehlenite and pure åkermanite arenow underestimated by 90 and 130 K, respectively. In thiscalculation, however, the liquidus loop is wider, and althoughthe difference between the observed and predicted liquidustemperatures increases with decreasing åkermanite content andreaches 70 K at Åk20, predicted solidus temperatures are within20 K of the measured ones in the range Åk20 to Åk60. The finalpair of curves is obtained when the thermodynamic data forgehlenite from Berman (1983) and those for åkermanite fromBerman (1988) are combined with an asymmetric regular so-lution formulation of the mixing properties of melilite solidsolutions in which the two Margules parameters are adjustedarbitrarily to obtain the best fit between predicted and observedliquidus loops. It is seen that very good agreement is achievedfor all compositions between Åk0 and Åk�45, where the com-positions of most melilite grains in Types A and B inclusionslie. Note that none of the models investigated here is capable ofreproducing the smaller loop at Åk�72, the composition withthe minimum melting temperature.
The accuracy of the latter two models was tested further byusing each of them with Berman’s (1983) liquid model tocalculate the evolution of solid and liquid compositions duringequilibrium crystallization of spinel and melilite from four
Table 1. Compositions (wt.%) of high-temperature condensate as-semblages used as starting compositions for evaporation computationsin this work, calculated on a metal- and TiO2-free basis.
Composition CaO MgO Al2O3 SiO2
� 31.78 8.30 40.17 19.74� 28.56 12.56 36.08 22.79� 26.59 13.80 33.60 26.00� 24.37 15.07 30.79 29.77� 22.58 16.15 28.53 32.74
146 L. Grossman, D. S. Ebel, and S. B. Simon

inclusion-like bulk compositions whose liquid-crystal phaserelations have been experimentally investigated. In Table 2, thetemperature and åkermanite content of the first melilite ob-served to crystallize upon cooling are compared to those pre-dicted using the old and new melilite models, i.e., Berman’s(1988) end-member data with Charlu et al.’s (1981) mixingmodel, and the asymmetric regular solution model, respec-tively. Use of the new model increases the predicted appear-ance temperatures of melilite by 30 to 50 K and decreases thepredicted Åk content of the first melilite by 7 to 13 mol.%
compared to the old model. These changes are seen to producesubstantially better agreement between observations and pre-dictions, except in the cases of melilite appearance tempera-tures for the Type B1-1 and CAIB compositions. In Figure 2,the curve of evolution of liquid compositions, called the liquidline of descent, observed upon cooling and crystallization ofthree of these bulk compositions, is also compared to thatpredicted using each of the old and new melilite models. Thenew melilite model is seen to yield liquid compositions forFTA and CTA that are much closer to the experimental data
Fig. 1. Experimentally determined, liquid-crystal phase relations in the gehlenite-åkermanite binary compared to liquidusloops calculated with Berman’s (1983) CaO-MgO-Al2O3-SiO2 liquid model using several different thermodynamic modelsfor melilite. One uses melilite end-member data from Berman (1983), another from Berman (1988). The one used in thiswork combines Berman’s (1983) data for gehlenite with Berman’s (1988) data for åkermanite.
Table 2. Compositions and temperatures of appearance of the first melilite to crystallize upon cooling from four different synthetic liquidcompositions. Experimental data are compared to predictions using two different melilite solution models, old and new (see text).
Syntheticsample
First melilite to crystallize
Bulk composition (wt.%) Appearance temperature (K) mol. % åkermanite
CaO MgO Al2O3 SiO2 TiO2 Obs Old New Obs Old New
FTA 34.61 5.23 37.36 21.53 1.21 1801 1748 1802 1.4 12.8 5.5CTA 35.52 6.28 31.71 25.12 0.48 1793 1742 1796 1.8 18.5 8.9B1-1 28.11 8.49 31.68 27.59 4.07 1705 1680 1734 15.8 24.7 13.5CAIB 29.2 10.1 28.3 31.1 1.12 1673 1680 1708 22.0 31.2 18.6
All experimental data (Obs) are from Beckett (1986) except those for CAIB, which are from Stolper (1982).
147Formation of refractory inclusions by evaporation of condensate precursors

than the old model, but for CAIB, the new melilite model givesa better fit to the higher temperature liquid compositions andthe old model is better for the lower temperature ones.
2.1.4. Calculation of Evaporation Effects
The partial pressures of all gas species in equilibrium with allliquid compositions considered in this work are calculated inexactly the same way as in Grossman et al. (2000). As in thatwork, PMg and PSiO increase with increasing activity of MgOand SiO2, respectively, in the liquid and with increasing PH2
inthe surrounding gas, and are always much higher than thepartial pressures of all other species. Because of this, thechange in composition of a CMAS liquid during evaporation
depends primarily on the fluxes of Mg(g) and SiO(g). When theconcentrations of these species in the ambient gas are zero,their free evaporation fluxes from a liquid droplet can beobtained from their equilibrium partial pressures via the Hertz-Knudsen equation:
JSiO � �SiO PSiO/�2�mSiOkT�0.5, (1)
and
JMg � �Mg PMg/�2�mMgkT�0.5, (2)
where k is the Boltzmann constant, T is the absolute tempera-ture, and J, �, and m are the flux, evaporation coefficient, andatomic mass of each evaporating species, respectively. In using
Fig. 2. Comparison of predicted vs. experimentally determined (solid lines connecting points) paths of liquid compositiondue to crystallization of spinel and melilite with falling temperature, from each of three synthetic starting compositions, allprojected from spinel onto the gehlenite-rich corner of the anorthite-gehlenite-forsterite plane. Old model (short dashes)refers to calculations using Berman’s (1988) end-member data for melilite, and new model (long dashes) to the model usedin this work. Composition fields where spinel coexists with each of melilite, anorthite, clinopyroxene, and forsterite arelabeled mel, an, px, and fo, respectively. Positions of various melilite solid solution compositions are indicated along thegehlenite-forsterite axis.
148 L. Grossman, D. S. Ebel, and S. B. Simon

these expressions, zero back-condensation of evaporating spe-cies is assumed, such as would be the case for a small dropletin an infinite reservoir.
Richter et al. (in press) conducted evaporation experimentson a droplet of initial composition 22.64 wt.% CaO, 11.94%MgO, 19.30% Al2O3, and 46.04% SiO2 at 2073 K in a vacuum,and separately on a droplet of initial composition 24.61 wt.%CaO, 17.84% MgO, 20.51% Al2O3, and 37.04% SiO2 at 1773K and at a PH2
of 1.87 10�4 bar. JSiO and JMg were measuredfor each experiment and combined with PSiO and PMg calcu-lated for each experiment by the method of Grossman et al.(2000) to yield �SiO and �Mg using Eqn. 1 and 2. When thevalues obtained for �Mg (0.17 0.05 at 2073 K and 0.040 0.011 at 1773 K) are plotted on a log � vs. 1/T graph, thestraight line through them also lies along the trend obtained for� from forsterite evaporation experiments in a vacuum (Wanget al., 1999) and in H2 (Kuroda and Hashimoto, 2000). Extrap-olating the CMAS data along this line to the temperature rangeof interest suggests that �Mg varies from 0.050 at 1813 K to0.0065 at 1500 K. Richter et al. (in press) found that the bulkchemical compositions of the evaporation residues in the vac-uum experiment were fit by an �SiO/�Mg ratio of 1.00, whileGrossman et al. (2000) found that the best fit to the residues inthe hydrogen experiment is obtained with an �SiO/�Mg ratio of1.35. In this work, the latter value of the �SiO/�Mg ratio wasused in combination with the temperature variation of �Mg toobtain the variation of �SiO with temperature.
Droplet radii were corrected for evaporative mass loss usinga composition-independent liquid density of 3.1 g/cm3 based ondata from Lange and Carmichael (1987), and for crystallizationof spinel and melilite using densities of 3.58 and 3.0 g/cm3,respectively, from Robie et al. (1978). In the model, spinel andmelilite crystals are assumed not to reside on the dropletsurface where they would otherwise reduce the liquid surfacearea. All of the liquid is assumed to be instantaneously inchemical communication with a vapor phase consisting of pureH2, and crystalline solids are assumed to undergo negligibleevaporation on the time scale of crystallization of the droplets.
As in Grossman et al. (2000), the isotopic mass-fraction-ations of Mg and Si, FMg and FSi, respectively, expressed in permil per atomic mass unit are calculated from the computedamount of evaporative mass loss of each of these elements,using the Rayleigh equation in which the fractionation factorsare the inverse square roots of the masses of the evaporatingspecies, Mg(g) and SiO(g), respectively, at each temperaturestep. In the case of oxygen, the inverse square roots of themasses of the isotopic species of SiO(g) and H2O(g) areweighted in proportion to the relative vapor pressures of thesemolecules at each temperature step to obtain the fractionationfactor.
2.1.5. Equilibration of Phases
Estimates were made of the ability of spinel and melilite,separately, to exchange Mg with the liquid as it cooled andchanged composition. The average spinel crystal in Allenderefractory inclusions has a radius of �14 �m. For coolingintervals representative of those investigated in this paper forprecursors of Types A and B inclusions, 1800 to 1500 K and1675 to 1500 K, respectively, average linear growth rates were
calculated for spinel as a function of cooling rate for eachinclusion type simply by dividing the average radius by thecooling time. Similarly, from data for Mg self-diffusion inMgAl2O4 measured by Sheng et al. (1992), mean diffusionrates were calculated as a function of cooling rate by dividingthe cooling time into the diffusion distance computed from theaverage diffusion coefficient for the temperature interval ap-propriate for each inclusion type. This calculation shows thatthe diffusion rate is faster than the growth rate for all coolingrates below �30 K/h for Type A precursors, and below �5 K/hfor Type B precursors. It can therefore be assumed that spinelcrystals grew in complete Mg isotopic equilibrium with theliquid for all but the very fastest cooling rates considered herefor Type A’s, and for cooling rates below 5 K/h for the TypeB’s.
The situation is different for melilite because its crystals aremuch larger than those of spinel, and the (Al � Al) � (Mg �Si) interdiffusion coefficient for melilite is �10 to 50 timessmaller than the self-diffusion coefficient for spinel in thistemperature range, according to the data of Morioka and Na-gasawa (1991). The average minimum and average maximumdimensions were measured for 10 melilite crystals in each oftwo compact Type A, three Type B1, and two Type B2 inclu-sions from Allende. Combining the smallest average minimumdimension found, 175 �m, with the same cooling intervals usedfor spinel, average linear growth rates were calculated formelilite as a function of cooling rate for each inclusion type inthe same way as for spinel. Using interdiffusion coefficients foråkermanite contents and temperature intervals appropriate foreach inclusion type, mean interdiffusion rates were calculatedin the same way as for spinel, and were found to be 3 to 250times slower than the melilite growth rates under these condi-tions. Only at very slow cooling rates, �2 10�2 K/h for TypeA’s and �1 10�3 K/h for Type B’s, are the interdiffusionrates comparable to the growth rates. On this basis, it seemslikely that progressive growth of melilite crystals effectivelyisolates their interiors from chemical communication with thecoexisting liquid. This prevents chemical and isotopic ex-change of Mg and Si, and equilibration of the composition ofinterior melilite, with the liquid from which the outermostmelilite is precipitating at any instant for all cooling ratesconsidered here.
In Types A and B inclusions, spinel crystals were poikiliti-cally enclosed by melilite while the latter crystallized from theliquid. Even while the centers of those spinel crystals thatremain in contact with the liquid can equilibrate with it, thevery limited ability of Mg to diffuse into the interiors of themelilite crystals causes chemical isolation of those spinel grainstrapped inside melilite. In the model, spinel grains are assumedto be homogeneously distributed throughout the liquid, so thatthe fraction of the spinel grains trapped inside melilite can beassumed to be equal to the volume fraction of the liquidconverted to melilite at each temperature step.
Using lattice diffusion data for oxygen in melilite fromYurimoto et al. (1989), estimates were made of the oxygendiffusion coefficients parallel to the fastest diffusion direction,the a-axis, as a function of åkermanite content and temperature.These are on the order of 1 to 3 10�12 cm2/s for the melilitecompositions and temperature ranges used here for Types A
149Formation of refractory inclusions by evaporation of condensate precursors

and B inclusions. As these values are quite comparable to the(Al � Al) � (Mg � Si) interdiffusion coefficients used above,it seems unlikely that melilite would undergo significant oxy-gen isotopic exchange with the liquid during cooling on thetime scales considered here.
In spinel, the diffusion coefficient for oxygen is 4 or 5 ordersof magnitude lower than for Mg at the same temperature(Ryerson and McKeegan, 1994). Thus, while it is concludedabove that spinel probably maintains Mg isotopic equilibriumwith the liquid for most of the thermal histories consideredhere, this will not be the case for oxygen. Nevertheless,throughout this paper, spinel is modeled as if it maintainsisotopic equilibrium with the liquid for both magnesium andoxygen. The justification for this is that bulk oxygen isotopiccompositions calculated in a run in which oxygen in spinel thatremains in contact with the liquid equilibrates totally with thatliquid (the “equilibration case” ) are little different from anotherwise identical run in which oxygen in all spinel is seques-tered. The factors contributing to this outcome are common toall of our run results. Spinel normally contains only 15 to 20%of the entire oxygen budget of the system. The peak tempera-ture is always slightly above the temperature at which melilitebegins to crystallize. At such peak temperatures, 80 to 90% of
the spinel is already crystalline, as in Figure 3a. Because noevaporation is assumed to occur before reaching the peaktemperature, this initial spinel isolates 12 to 18% of the totaloxygen with normal isotopic composition in the sequestrationcase. Even in the equilibration case, however, two thirds of allspinel becomes encased in melilite, after which point it cannotequilibrate with the liquid anyway. In the equilibration case,then, the additional oxygen that equilibrates with the liquid,which cannot do so in the sequestration case, is only a littlemore than 5 to 7% of the total. As a result, the additionalamount by which the bulk oxygen isotopic composition ismass-fractionated in the equilibration case relative to the frac-tionation case is less than 0.1‰. Toward the end of the coolingperiod, however, large amounts of oxygen have been isolatedfrom evaporation by its sequestration into melilite and thespinel enclosed within it, and the effect of evaporation on theisotopic composition of the residual liquid is amplified, pro-ducing much larger mass-fractionations in the liquid than in thebulk assemblage. Because of this, even the small amount (5 to7%) of additional oxygen that is in the spinel in equilibriumwith the liquid represents a relatively large fraction of theevaporating pool, resulting in significantly less mass-fraction-ation in the final liquids in the equilibration case reported in this
Fig. 3. Evolution of liquid, vapor, and melilite composition during simultaneous cooling, evaporation, and crystallizationfor the conditions indicated, plotted as a function of temperature. (a) Distribution of Mg between vapor, liquid, and solids.(b) Evolution of the bulk chemical composition of the liquid. (c) Cumulative fraction of the initial magnesium, silicon, andoxygen evaporated from the droplet, and instantaneous PMg/PSiO ratio of the escaping vapor. (d) Magnesium, silicon, andoxygen isotopic composition of the liquid and thus of the melilite crystallizing at each temperature, along with itsåkermanite content.
150 L. Grossman, D. S. Ebel, and S. B. Simon

paper than would be the case for the more realistic sequestra-tion case.
2.2. The Model
For each computation, an initial bulk chemical compositionis selected from Table 1. The initial Mg and Si isotopic com-positions are assumed to be normal. For the molten droplet, astarting temperature slightly above that at which melilite iscalculated to begin crystallizing from the assumed startingcomposition is selected, and an initial radius is specified. Acooling rate and PH2
are specified for the surrounding gas. Atime step size is selected that is appropriate for the assumedcooling rate, usually resulting in temperature differences of 0.5to 1.5 K between steps. At each temperature, the equilibriumamounts of spinel, melilite, and liquid are calculated, as well asthe chemical compositions of melilite and liquid. The Mg, Si,and O isotopic compositions of the melilite and spinel that format each temperature are assumed to be the same as those of thecoexisting liquid. The amount of spinel enclosed by melilite iscomputed, and its isotopic composition remains constant for theduration of the calculation. The droplet radius is corrected forthe volume change due to the calculated amount of liquidconverted to crystals. Next, the composition of the vapor inequilibrium with the calculated liquid composition is computedand, from PMg and PSiO, the evaporative fluxes of Mg(g) andSiO(g) are obtained. The surface area of the droplet is calcu-lated, and the fluxes are then used to calculate the amounts ofMgO and SiO2 lost from the droplet during the time step takento cool to the next temperature. These evaporative mass lossesare used to recalculate the Mg and Si isotopic compositions ofthe liquid and the radius of the droplet. Together with theamount of sequestered melilite and of the spinel within it, theevaporative mass losses are subtracted from the starting bulkcomposition to calculate the bulk chemical composition of thesystem that can undergo liquid-crystal equilibration at the nexttemperature. Then the entire computation is repeated, startingwith the equilibrium amounts of spinel, melilite, and liquidpresent in the modified bulk chemical composition at the lowertemperature. The chemical and isotopic composition of thespinel not enclosed by melilite at the previous temperature isincluded in computing the composition of the liquid fromwhich fresh spinel and melilite crystallize. This process iscontinued until the solidus temperature is reached.
3. RESULTS
3.1. Melilite Zoning
The experimentally determined liquid-crystal phase relationsalong the gehlenite-åkermanite binary (Fig. 1) show that bothliquidus and solidus temperatures gradually decline with in-creasing åkermanite content for all melilite from Åk0 to Åk73,the composition with the minimum melting temperature. Withonly a very few exceptions, all melilite in refractory inclusionslies within this range. This means that, for a given bulk com-position, the first melilite to form during equilibrium coolingand crystallization in a closed system has the lowest åkermanitecontent, that its formation enriches the liquid in MgO and SiO2
relative to Al2O3 compared to the starting composition, and thatmelilite that crystallizes at progressively lower temperatures
has progressively higher Åk contents. Phase equilibrium exper-iments in the CMAS system show that melilite cocrystallizingwith spinel also continuously increases its åkermanite contentwith falling temperature (Stolper, 1982; Beckett, 1986). Tomaintain equilibrium as the temperature falls, early formed,relatively åkermanite-poor melilite must continuously increaseits åkermanite content by diffusion driven exchange of its Al3�
ions with Mg2� and Si4� in the liquid. Failure of the diffusionrate to keep pace with the crystallization rate results in nor-mally zoned crystals whose åkermanite contents increase fromtheir cores toward their outer rims.
In an open system in which evaporation of MgO and SiO2
takes place while the temperature is falling, the resulting de-crease with time in the MgO and SiO2 contents of the liquidcounteracts the thermodynamic tendency of melilite crystals toincrease their åkermanite contents with falling temperature. Inthis situation, if the evaporation time is short compared to thecooling time, the first melilite to crystallize may be the moståkermanitic, and reversely zoned crystals, in which the åker-manite content steadily decreases from their cores to their rims,may result.
The evaporation time, , in hours, of a volatile element isgiven by the amount initially present, divided by its loss rate, asin
�4/3�a3C
4�a2J, (3)
where C is the concentration of the element (mol/cm3), J is theevaporative flux of the element (mol/cm2/h), and a is the radiusof the droplet (cm). The cooling time, T, is given simply by
T ��T
dT/dt, (4)
where �T is the initial temperature minus the final temperatureand the denominator is the cooling rate. A dimensionless pa-rameter, R, defined as the ratio of the evaporation time to thecooling time, /T, is thus given by
R �aC dT/dt
3J�T. (5)
It is expected that chemical and isotopic effects whose magni-tudes depend on the degree of evaporation of the model drop-lets, such as the decline in the concentrations of MgO and SiO2
in the droplets, the difference in Åk content between the coresand rims of melilite crystals, and the enrichment in heavyisotopes of Mg and Si in the droplets, will all increase as Rdecreases.
3.2. A Case Study
Model results for composition �, a possible precursor ofType B2 inclusions, are shown in Figure 3 for a peak temper-ature of 1693 K, a cooling rate of 0.5 K/h, an initial dropletradius of 0.25 cm, and a PH2
of 10�6 bar. Complete fraction-ation of melilite is assumed, as is complete equilibration ofspinel that remains in contact with the liquid. The distributionof Mg between gas, liquid, melilite, and spinel is illustrated inFigure 3a as a function of temperature. At the peak tempera-ture, 34% of the Mg is already present in spinel. Melilite begins
151Formation of refractory inclusions by evaporation of condensate precursors

to crystallize at 1674 K, enclosing an ever-increasing fractionof the spinel with falling temperature. When the calculationends at the solidus temperature, 1500 K, 39% of the originalMg is in spinel, 10% is in melilite, 25% remains in the liquid,and the other 26% has evaporated. The resulting variation ofthe chemical composition of the liquid is shown in Figure 3b.Before melilite crystallization, the MgO content falls due to thecombined effects of Mg evaporation and spinel precipitation,SiO2 remains constant due to the counteracting effects of itsconcentration by spinel removal and its loss by SiO(g) evapo-ration, Al2O3 remains constant due to the counteracting effectsof its removal in spinel and its relative concentration by evap-oration of Mg(g) and SiO(g), and CaO increases due to itsrelative concentration by both spinel precipitation and evapo-rative loss of Mg(g) and SiO(g). After melilite begins to crys-tallize, CaO and Al2O3 contents fall with decreasing tempera-ture, as the amounts of these oxides removed in thecrystallizing assemblage outweigh the degree of their enrich-ment in the liquid due to evaporation of the other oxides. TheMgO content remains constant with falling temperature, as itsenrichment in the liquid due to crystallization of a low-MgOassemblage is just balanced by its evaporation. The SiO2 con-tent rises with falling temperature, as its enrichment in theliquid due to crystallization of a relatively low-SiO2 assem-blage cannot be offset by the relatively small amount of SiO(g)
that evaporates. The fractions of the initial magnesium, silicon,and oxygen that evaporate are shown as functions of temper-ature in Figure 3c, reaching 26, 14, and 9%, respectively, by1500 K. Also shown as a function of temperature is the PMg/PSiO ratio of the escaping vapor. This ratio rises initially andthen falls after melilite begins to crystallize. This decline is aconsequence of the continuous drop in the MgO/SiO2 ratio ofthe evaporating liquid that occurs during melilite crystalliza-tion. Figure 3d shows the chemical and isotopic compositionsof the melilite that crystallizes at each temperature. The meliliteis seen to be normally zoned from Åk24 to Åk37. As a conse-quence of the increasing amounts of evaporation seen in Figure3c, the isotopic compositions of magnesium, silicon, and oxy-gen in the liquid become progressively more enriched in theheavy isotopes with falling temperature, and this is expected tobe recorded in the melilite. The last, most åkermanitic meliliteto crystallize will have the most highly mass-fractionated iso-topic compositions, reaching FMg � 6.9, FO � 2.5, and FSi �2.0‰ in this case. Because of sequestration of fractionatedmelilite and trapped spinel that crystallized at higher tempera-ture before so much evaporation occurred, the bulk isotopiccomposition of the inclusion as a whole is less mass-fraction-ated than the final melilite. Its composition is FMg � 6.1, FO �2.1, and FSi � 1.8‰.
3.3. Factors Controlling the Degree of Evaporation
In this section, we investigate the sensitivity of the evolutionof the droplets, as would be recorded in chemical and isotopiczoning of melilite, to the parameters that control R, i.e., thedroplet size, cooling rate, and J, the latter via its dependence onPH2
.In the case study discussed above for evaporation of a
droplet of composition � and initial radius 0.25 cm into a purehydrogen gas with PH2
� 10�6 bar, the predicted chemical and
isotopic zoning of melilite during cooling from 1693 K at 0.5K/h are shown in Figure 3d. With initial composition andradius, PH2
and peak temperature held constant, the effect ofdifferent cooling rates on the variation of the åkermanite con-tent of melilite with temperature is shown in Figure 4a, and onthe variation of the FMg of the melilite with its åkermanitecontent in Figure 4b. At the fastest cooling rate shown, 3 K/h,melilite is normally zoned, reaching Åk44 at 1500 K (Fig. 4a),and the degree of evaporation is the least, with the last melilitecrystallizing from a liquid with FMg of 1.0 (Fig. 4b). Withprogressively decreasing cooling rates, however, the time tocool to 1500 K becomes longer, causing the degree of evapo-ration to increase, so that the final melilite contains progres-sively less åkermanite (Fig. 4a) and progressively higher FMg
(Fig. 4b). At the lowest cooling rate shown, 0.2 K/h, the degreeof evaporation is so extreme that the åkermanite content de-creases continuously from the first melilite to form to the last;i.e., it is reversely zoned, and the final FMg is 23.0‰. Note thatthe åkermanite content of the first-crystallizing melilite gradu-ally declines with decreasing cooling rate. This is due to theincreased amount of evaporation that occurs due to the longertime necessary to cool from 1693 K to melilite precipitationtemperatures at the lower cooling rates. The decreasing åker-manite content of the initial melilite, in turn, causes the tem-perature of melilite appearance to increase.
Fig. 4. (a) Chemical and (b) isotopic zoning calculated for melilite ina 0.25-cm droplet of composition � during cooling from 1693 K at theindicated rates while the droplet is undergoing evaporation into ahydrogen gas at PH2
� 10�6 bar.
152 L. Grossman, D. S. Ebel, and S. B. Simon

To study the effect of droplet size on the degree of evapo-ration, the entire calculation was repeated in an identical fash-ion, except that the droplet radius was doubled, from 0.25 to 0.5cm. Results are plotted in Figures 5a and 5b. As in the previouscase, both the initial and final åkermanite content of the melilitedecrease, the zoning goes from normal to reverse, and the FMg
of the final melilite increases with decreasing cooling rate.According to Eqn. 5, if the radius of the droplet is doubled, theparameter R, and thus the degree of evaporation, would remainconstant if the cooling rate were decreased by a factor of 2when all other variables are held constant. As expected, melilitezoning profiles in Figure 5 are very similar to those in Figure 4but at half the cooling rate of those in Figure 4.
To study the effect of PH2on the degree of evaporation, the
entire calculation was repeated in an identical fashion to thefirst one, except that PH2
was increased by a factor of 103, from10�6 to 10�3 bar. The droplet radius is 0.25 cm. Results areplotted in Figures 6a and 6b. Again, both the initial and finalåkermanite content of the melilite decrease, the zoning goesfrom normal to reverse, and the FMg of the final meliliteincreases with decreasing cooling rate. Data taken from Figure4 in Grossman et al. (2000) indicate that, relative to their valuesat 10�6 bar, both JMg and JSiO increase by factors of 2.6, 8.1,and 25 as PH2
increases by factors of 10, 102, and 103, respec-tively. Since J increases by a factor of 25 when PH2
increases
from 10�6 to 10�3 bar, the degree of evaporation shouldremain constant if the cooling rate also increases by a factor of25 when all other variables are held constant, according to Eqn.5. When the profiles in Figure 6 are compared with those inFigure 4, this behavior is observed.
4. APPLICATION TO REFRACTORY INCLUSIONS
4.1. Constraints from Natural Inclusions
4.1.1. Sizes and Bulk Chemical Compositions
The objective of this section is to see if Types A and Brefractory inclusions could have been derived from plausiblecondensate precursor compositions by melting, followed byevaporation into a pure H2 gas during cooling and crystalliza-tion and, if so, under what physicochemical conditions.
Knowledge of the shapes and sizes of refractory inclusionscomes from random sections through them that only rarely passthrough their geometric centers. While a range of sizes un-doubtedly exists, observations of Types A and B inclusions inCV3 chondrites suggest that 0.25 cm is a very good estimate ofthe most frequently encountered radius, and this value was usedas the initial radius for the molten spheres modeled herein.Even in the most extremely evaporated case in this work, thefinal radius differs by only 7% from this initial value.
Fig. 5. (a) Chemical and (b) isotopic zoning calculated for melilite ina 0.5-cm droplet of composition � during cooling from 1693 K at theindicated rates while the droplet is undergoing evaporation into ahydrogen gas at PH2
� 10�6 bar.
Fig. 6. (a) Chemical and (b) isotopic zoning calculated for melilite ina 0.25-cm droplet of composition � during cooling from 1693 K at theindicated rates while the droplet is undergoing evaporation into ahydrogen gas at PH2
� 10�3 bar.
153Formation of refractory inclusions by evaporation of condensate precursors

Shown in Figure 7 are the spinel-corrected bulk chemicalcompositions of the refractory inclusions discussed by Gross-man et al. (2000), identified as fluffy Type A, compact Type A,Type B1, or Type B2 when this is known. A test of theevaporation model is to see if it can generate these bulkchemical compositions from the array of precursor composi-tions lying along the trajectory marked “condensates” in Figure7.
4.1.2. Bulk Isotopic Compositions
Although both the Mg and Si isotopic compositions of onlyone of the inclusions plotted in Figure 7 are known, virtually allTypes A and B inclusions are mass-fractionated toward theheavy isotopes of these elements, probably indicating that theyhave been partially evaporated. The inclusions for which boththe Mg and Si isotopic compositions are known are summa-rized by Grossman et al. (2000), from which it is seen that FMg
varies from 0 to 10.9‰ and FSi from 0 to 5.2‰, indicatingevaporative loss of up to 42% of the Mg and 38% of the Si.There are insufficient data to determine whether any systematicdifference exists between the degree of evaporation experi-enced by Type A inclusions and that of Type B’s. Thus, a
further test of the evaporation model is to see if it can producethe bulk chemical compositions of refractory inclusions fromthose of the condensate precursors while keeping FMg and FSi
within this observed range.As pointed out by Clayton et al. (1977), refractory inclusions
exchanged their oxygen with a reservoir near the terrestrial linesubsequent to evaporation and condensation processes. Thus,any isotopic mass-fractionation of oxygen produced by evap-oration must contribute to the spread of oxygen isotopic com-positions measured in the slope-1/2 direction about the carbo-naceous chondrite anhydrous mixing line. As pointed out byGrossman et al. (2000), when the oxygen isotopic compositionsof measured inclusions are projected from plausible 16O-poorreservoir compositions onto the mass-fractionation line passingthrough �18O � �17O � �40‰, the observed spread of �3‰/amu in the slope-1/2 direction expands to approximately doublethat amount. Thus, another constraint that successful evapora-tion models must satisfy is to keep FO below �6‰.
4.1.3. Chemical Zoning in Melilite
There are no measured magnesium, silicon, or oxygen iso-topic zoning profiles of single melilite crystals to compare with
Fig. 7. Spinel-corrected bulk chemical compositions of Types A and B inclusions compared to the calculated compositionvariation of equilibrium high-temperature condensates from a solar gas at Ptot � 10�5 bar. Compositions of condensateassemblages selected as starting materials for evaporation calculations are indicated by Greek letters, and are listed in Table1. Curves emanating from these precursor compositions are the evolutionary paths of bulk compositions produced byevaporation of 0.25-cm droplets into 10�6 bar of pure H2 during cooling to 1500 K from the peak temperatures marked“Tmax” at the rates indicated along the curves (K/h). See text for discussion of peak temperature constraints. Large squaresare the bulk compositions of CAIB and #98, whose liquid-crystal phase relations have been investigated by Stolper (1982)and Paque and Stolper (1984), respectively.
154 L. Grossman, D. S. Ebel, and S. B. Simon

predictions of evaporation models; however, core-to-rim pro-files of åkermanite contents are known for several melilitecrystals from each of many compact Type A and Type B1inclusions (e.g., Podosek et al., 1991). Few profiles exist forfluffy Type A and Type B2 inclusions. Although it is difficultto select a single melilite zoning profile as most representativeof the myriad distinct patterns in a single inclusion type, theprofiles do provide additional constraints for evaporation mod-els. What is obtained from the model is the åkermanite contentas a function of the fraction of the total volume of melilitecrystallized, and assumptions must be made about how toconvert one-dimensional profiles of åkermanite vs. distancefrom the center of a real melilite crystal into these units. Weassume that each profile used for this purpose passes throughthe center of the crystal, that the length and width of the crystalin the plane of the thin section are the true dimensions of thecrystal, that the third dimension is equal to the shorter of thetwo dimensions in the plane of the section, that the volume ofthe crystal is the product of the three dimensions, and that therelative dimensions are constant during growth. This allows thefraction of the total melilite crystal volume to be calculated asthe cube of the fractional distance along the zoning profile.
Crystallization of Types A and B inclusions from silicateliquids is usually discussed with reference to the liquid-crystalphase relations in that part of the CMAS system projected fromspinel onto the gehlenite-forsterite-anorthite plane. The phaserelations in the gehlenite-rich corner of this diagram are repro-duced in Figure 2. Grossman et al. (2000) showed that spinel-corrected bulk chemical compositions of both Type A and TypeB inclusions plot in the melilite field, which means that spineland melilite are the first phases to crystallize. With fallingtemperature, the liquid lines of descent eventually reach themelilite-anorthite boundary or cotectic, where anorthite beginsto cocrystallize with spinel and melilite at equilibrium. As thetemperature continues to fall, the liquid composition travelsalong this cotectic to the fassaite field, where the liquid disap-pears into spinel � melilite � anorthite � fassaite. The reasonwhy Type B’s contain so much more fassaite than Type A’s isthat the bulk compositions of the Type B’s plot so much closerto the fassaite field than those of the Type A’s, as seen inStolper (1982). The model presented here ignores crystalliza-tion of anorthite and fassaite, which are assumed to precipitatefrom whatever liquid remains at the solidus at 1500 K. Thus,the model fails to account for the effects of crystallization ofthese phases on the liquid composition and consequently on thecomposition of the cocrystallizing melilite. Because anorthiteand fassaite crystallize from the very last dregs of liquid,however, this simplification affects the calculated compositionof only the very outermost layers of the melilite crystals.
4.1.4. Cooling Rates of Type B Inclusions
In dynamic crystallization experiments performed on com-position CAIB, MacPherson et al. (1984) discovered that, atrelatively high cooling rates, anorthite fails to precipitate at itsequilibrium crystallization temperature, and fassaite crystal-lizes before anorthite. Melilite crystals grown before precipita-tion of fassaite are normally zoned. With the onset of crystal-lization of fassaite in the absence of anorthite, however, theAl/Mg ratio of the liquid rises steeply, causing the cocrystal-
lizing melilite to increase its gehlenite content with fallingtemperature, resulting in formation of reversely zoned mantleson the preexisting, normally zoned melilite cores. Suppressionof the anorthite crystallization temperature to below that offassaite, and consequent production of reversely zoned melilitebands, occurred in experiments cooled at 0.5 to 20 K/h. Al-though anorthite suppression occurs at 50 K/h, reversely zonedbands were not observed, presumably because fassaite formedat such high cooling rates is much more aluminous than that atlower cooling rates. The widespread occurrence of reverselyzoned bands toward the outsides of melilite crystals in TypesB1 and B2 inclusions is taken as evidence that they crystallizedwhile cooling at rates below 50 K/h and above that at whichanorthite crystallizes at its equilibrium temperature, somewherebelow 0.5 K/h. Thus, successful evaporation models for Type Binclusions must produce their bulk chemical and isotopic com-positions within this range of cooling rates.
4.2. Type A Inclusions
4.2.1. General
Most Type A inclusions, fluffy and compact, plot in a tightcluster at 7 to 8% MgO and 18 to 20% SiO2 in Figure 7, whileothers stretch out along the condensation curve toward 13%MgO and 23% SiO2. Several of the latter plot close to, butbelow, the condensation curve in a region that cannot bereached by evaporation of compositions along the curve, but itmust be emphasized that there are uncertainties in the measure-ment of their bulk compositions and that the data have alsobeen subjected to a rather large spinel correction (Grossman etal., 2000). Most of the Type A’s plot so close to the conden-sation curve that it may seem unnecessary to derive theircompositions from precursors along the curve. Even an inclu-sion plotting so close to � as one with, say, 7% MgO and 19%SiO2, however, could be a residue of � that resulted fromevaporation of �12% of its MgO and �3% of its SiO2.Furthermore, the summary of isotopic data in Grossman et al.(2000) shows that one of the two Type A inclusions whose Mgand Si isotopic compositions have been measured appears tohave lost 22% of its MgO and 12% of its SiO2, while the otherhas lost 25% of its MgO and 20% of its SiO2, implying that theType A’s have definitely undergone significant evaporation.
For all compositions discussed in this paper, spinel is theliquidus phase, i.e., the first to crystallize from a melt uponequilibrium cooling in a closed system. Experiments on twosynthetic compositions plotted in Figure 7, CAIB (Stolper,1982), and #98 (Paque and Stolper, 1984) show similar liquidustemperatures, 1823 and 1810 K, respectively, but the temper-ature at which melilite begins to crystallize is much higher,1783 K, for #98, the composition closer to the Type A field,than for CAIB, 1675 K. Similarly, calculated temperatures ofmelilite appearance rise steeply as bulk MgO and SiO2 contentsdecrease, reaching �1800 K for � and �. For #98, Paque andStolper (1984) found that dendritic or feathery melilite crystalsformed whenever peak temperatures were near or above theliquidus, at all cooling rates between 0.5 and 1000°C/h. Fromthe absence of such textures in natural Type A inclusions, it canbe concluded that their peak temperatures were below theliquidus. In a petrographic and mineral-chemical study of com-
155Formation of refractory inclusions by evaporation of condensate precursors
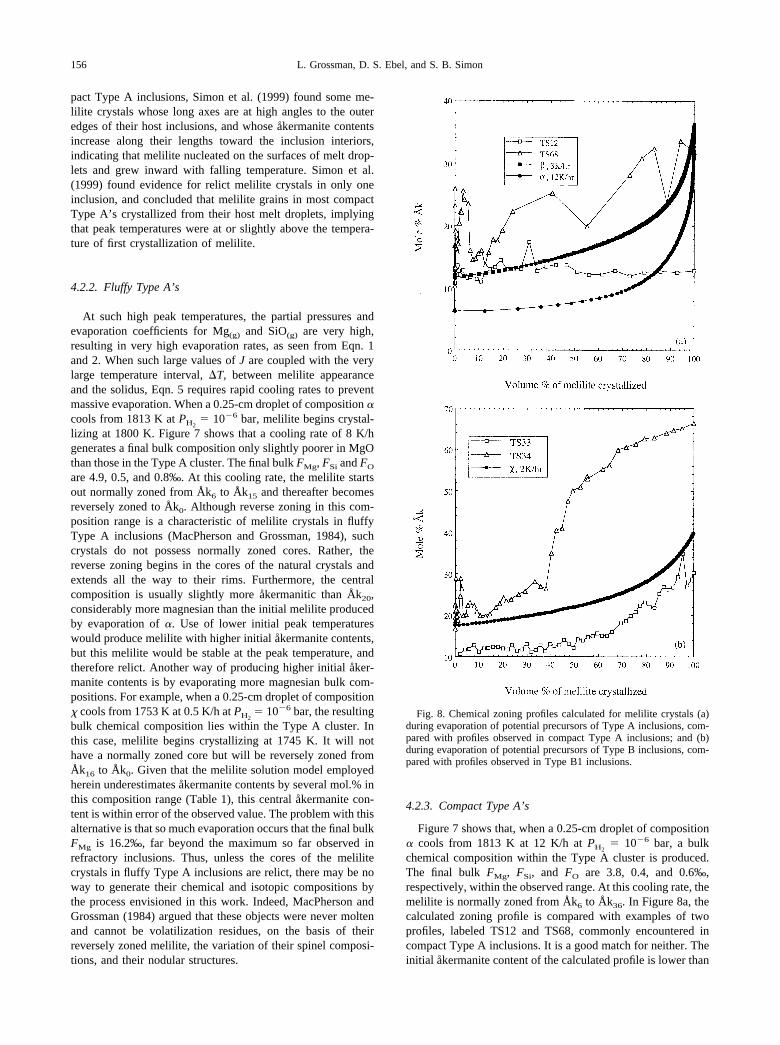
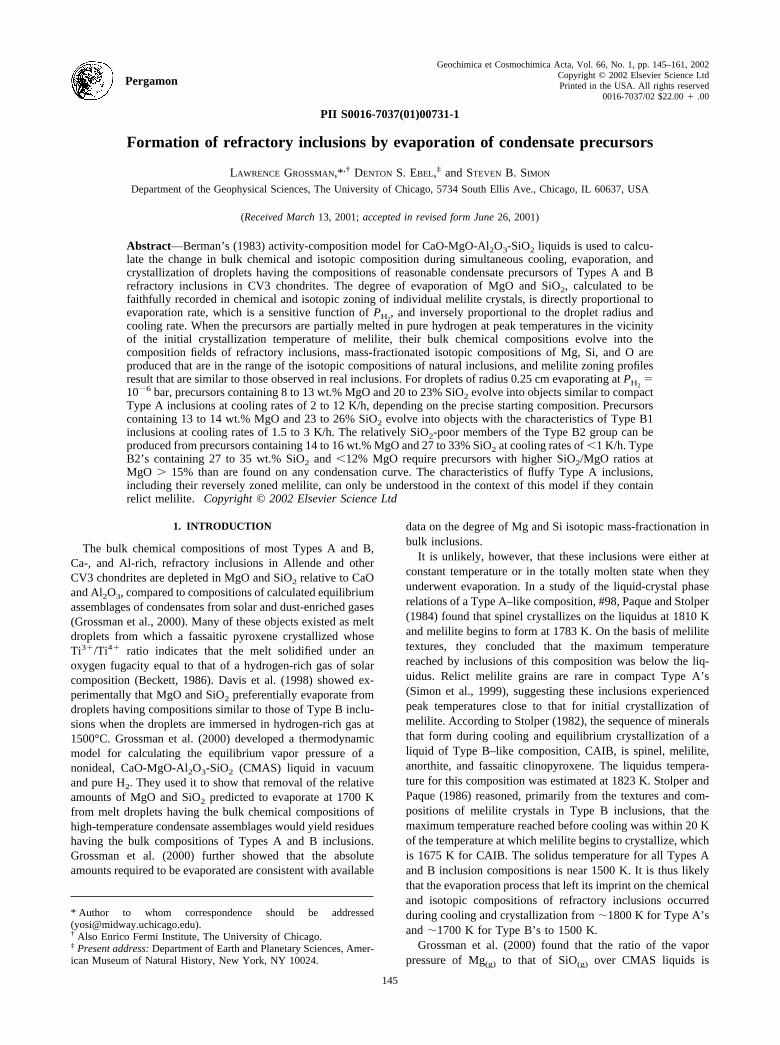
pact Type A inclusions, Simon et al. (1999) found some me-lilite crystals whose long axes are at high angles to the outeredges of their host inclusions, and whose åkermanite contentsincrease along their lengths toward the inclusion interiors,indicating that melilite nucleated on the surfaces of melt drop-lets and grew inward with falling temperature. Simon et al.(1999) found evidence for relict melilite crystals in only oneinclusion, and concluded that melilite grains in most compactType A’s crystallized from their host melt droplets, implyingthat peak temperatures were at or slightly above the tempera-ture of first crystallization of melilite.
4.2.2. Fluffy Type A’s
At such high peak temperatures, the partial pressures andevaporation coefficients for Mg(g) and SiO(g) are very high,resulting in very high evaporation rates, as seen from Eqn. 1and 2. When such large values of J are coupled with the verylarge temperature interval, �T, between melilite appearanceand the solidus, Eqn. 5 requires rapid cooling rates to preventmassive evaporation. When a 0.25-cm droplet of composition �cools from 1813 K at PH2
� 10�6 bar, melilite begins crystal-lizing at 1800 K. Figure 7 shows that a cooling rate of 8 K/hgenerates a final bulk composition only slightly poorer in MgOthan those in the Type A cluster. The final bulk FMg, FSi and FO
are 4.9, 0.5, and 0.8‰. At this cooling rate, the melilite startsout normally zoned from Åk6 to Åk15 and thereafter becomesreversely zoned to Åk0. Although reverse zoning in this com-position range is a characteristic of melilite crystals in fluffyType A inclusions (MacPherson and Grossman, 1984), suchcrystals do not possess normally zoned cores. Rather, thereverse zoning begins in the cores of the natural crystals andextends all the way to their rims. Furthermore, the centralcomposition is usually slightly more åkermanitic than Åk20,considerably more magnesian than the initial melilite producedby evaporation of �. Use of lower initial peak temperatureswould produce melilite with higher initial åkermanite contents,but this melilite would be stable at the peak temperature, andtherefore relict. Another way of producing higher initial åker-manite contents is by evaporating more magnesian bulk com-positions. For example, when a 0.25-cm droplet of composition� cools from 1753 K at 0.5 K/h at PH2
� 10�6 bar, the resultingbulk chemical composition lies within the Type A cluster. Inthis case, melilite begins crystallizing at 1745 K. It will nothave a normally zoned core but will be reversely zoned fromÅk16 to Åk0. Given that the melilite solution model employedherein underestimates åkermanite contents by several mol.% inthis composition range (Table 1), this central åkermanite con-tent is within error of the observed value. The problem with thisalternative is that so much evaporation occurs that the final bulkFMg is 16.2‰, far beyond the maximum so far observed inrefractory inclusions. Thus, unless the cores of the melilitecrystals in fluffy Type A inclusions are relict, there may be noway to generate their chemical and isotopic compositions bythe process envisioned in this work. Indeed, MacPherson andGrossman (1984) argued that these objects were never moltenand cannot be volatilization residues, on the basis of theirreversely zoned melilite, the variation of their spinel composi-tions, and their nodular structures.
4.2.3. Compact Type A’s
Figure 7 shows that, when a 0.25-cm droplet of composition� cools from 1813 K at 12 K/h at PH2
� 10�6 bar, a bulkchemical composition within the Type A cluster is produced.The final bulk FMg, FSi, and FO are 3.8, 0.4, and 0.6‰,respectively, within the observed range. At this cooling rate, themelilite is normally zoned from Åk6 to Åk36. In Figure 8a, thecalculated zoning profile is compared with examples of twoprofiles, labeled TS12 and TS68, commonly encountered incompact Type A inclusions. It is a good match for neither. Theinitial åkermanite content of the calculated profile is lower than
Fig. 8. Chemical zoning profiles calculated for melilite crystals (a)during evaporation of potential precursors of Type A inclusions, com-pared with profiles observed in compact Type A inclusions; and (b)during evaporation of potential precursors of Type B inclusions, com-pared with profiles observed in Type B1 inclusions.
156 L. Grossman, D. S. Ebel, and S. B. Simon

those of TS12 and TS68, Åk13 and Åk16, respectively. Whilethe calculated profile remains flat out to �50 vol.% crystallizedand then rises steeply in the outermost 20%, TS12 stays flat,and TS68 has a very jagged, nonuniform beginning with a steeprise starting at 50% crystallized. Although these two profilescome from different inclusions, the differences between themare comparable to those between different crystals within asingle compact Type A inclusion. Such differences, togetherwith the irregularities seen along individual profiles, are evi-dence that individual crystals undergo changes in growth rateand that different crystals solidifying from the same melt nu-cleate at different temperatures and experience different liquidcompositions depending on the number and mineralogical iden-tities of other crystals in their immediate vicinities. What iscalculated, on the other hand, is a model zoning profile for astatistically average crystal, based on the assumption that theamount of melilite that crystallizes in any temperature intervalis the amount predicted by liquid-crystal equilibrium. All in all,the evaporation residue produced by cooling of � at 12 K/h canbe considered a reasonable match for some compact Type Ainclusions.
Many other initial compositions lying along the condensa-tion trajectory between � and � are capable of evolving intoevaporation residues similar in composition to those in theType A cluster by cooling from �1800 K at �2 to 6 K/h atPH2
� 10�6 bar. Figure 7 shows that, at 3 and 5 K/h, evapo-ration of a 0.25-cm droplet of composition � produces bulkchemical compositions close to those of the more SiO2-richType A’s. At 5 K/h, final bulk FMg, FSi, and FO are 4.8, 0.6,and 1.0‰, respectively, and the melilite, which begins crystal-lizing at 1777 K, is normally zoned from Åk12 to Åk47. At 3K/h, the bulk FMg, FSi, and FO are 7.8, 1.2, and 1.7‰, respec-tively, and the melilite is normally zoned from Åk12 to Åk36, asshown in Figure 8a. These isotopic compositions are all wellwithin the observed ranges. At 2 K/h, however, the bulk FMg,11.1‰, exceeds the highest observed value of 10.9‰.
Because evaporation rates increase with increasing PH2,
faster cooling rates will produce very similar evaporation ef-fects at higher PH2
. Thus, compositions within the Type Acluster can be produced by evaporation of initial compositionslying between � and � at cooling rates of 5 to 16 K/h at PH2
�10�5 bar, 16 to 49 K/h at PH2
� 10�4 bar, etc.
4.3. Type B Inclusions
4.3.1. General
All Type B inclusions contain major amounts of fassaiticpyroxene and significant anorthite, in addition to melilite andspinel. While Type B1 and Type B2 inclusions are mineralog-ically similar, the B1’s differ from the B2’s in being concen-trically zoned, with nearly monomineralic mantles of melilite.As in some compact Type A inclusions, long axes of thesemelilite crystals are at high angles to the outer edges of theirhost inclusions, and their åkermanite contents increase alongtheir lengths toward inclusion interiors, indicating that melilitenucleated on the surfaces of melt droplets and grew inwardwith falling temperature (MacPherson and Grossman, 1981).Figure 7 shows that, with the exception of one very high-SiO2
outlier, spinel-corrected Type B1 inclusion compositions plot
within a narrow band of SiO2 contents, from 23 to 26 wt.%,sandwiched between the lower-SiO2 Type A’s and the higher-SiO2 Type B2’s.
In their dynamic crystallization experiments on CAIB, aType B–like composition, Stolper and Paque (1986) found thatdendritic melilite crystals resulted from peak temperaturesabove the liquidus, 1823 K, and that anorthite did not crystal-lize when peak temperatures were above 1723 K, for all coolingrates between 2 and 1000°C/h. Because Type B inclusions donot contain dendritic melilite but do contain anorthite, andbecause their minimum åkermanite contents are typically in thesame range as those found in experiments with peak tempera-tures near that for melilite entry, 1673 K for CAIB, Stolper andPaque (1986) concluded that Type B inclusions reached peaktemperatures within 20 K of the temperature at which melilitefirst crystallizes. In the present study, therefore, melilite crys-tallization within 20 K of the peak temperature is adopted as aconstraint for Type B inclusions.
4.3.2. Type B1’s
Composition � is an appropriate precursor for Type B1inclusions. When a 0.25-cm droplet of this composition iscooled at 2 K/h from a peak temperature of 1753 K at PH2
�10�6 bar, melilite, Åk17, begins to crystallize at 1740 K and thebulk chemical composition evolves into the middle of the fieldof Type B1’s. The final bulk FMg, FSi, and FO are 5.1, 1.1, and1.4‰, respectively, well within the ranges observed for refrac-tory inclusions. The calculated melilite zoning profile is shownin Figure 8b, along with examples of two frequently encoun-tered profiles in natural Type B1 inclusions, TS33 and TS34.MacPherson et al. (1984) reported that the normally zonedcores of melilite crystals in Type B1’s reach �Åk70 before theonset of pyroxene crystallization causes precipitation of thereversely zoned bands on top of them. Thus, the similaritybetween the calculated profile and TS33 is spurious, as the finalåkermanite content of TS33, Åk30, is obviously from a grainthat stopped crystallizing well before fassaite precipitation,while the model calculation is supposed to predict the compo-sition variation all the way to the solidus temperature, by whichpoint fassaite should have precipitated. Because TS34 reachesa final composition of Åk66, it is a more appropriate profile tocompare with the calculated one. Although beginning with thesame åkermanite content as the calculated profile, however,TS34 begins to rise sharply after 40 vol.% crystallized, whilethe calculated profile rises steeply only in the final 20% ofcrystallization and reaches a final composition of Åk40, fallingfar short of the final åkermanite content of TS34. This discrep-ancy may be due to inaccuracy of the melilite solution model.In Figure 2, note that the experimentally determined liquid lineof descent from CAIB, a Type B–like bulk composition, curvesmore sharply to the left at lower temperature than the computedone. The melilite composition crystallizing instantaneouslymay be found by drawing the tangent to such a curve at theliquid composition of interest and finding its intersection withthe melilite composition line along the gehlenite-forsterite axis.Because the calculated liquid line of descent curves much lessthan the experimentally determined one, calculated melilitecompositions never reach åkermanite contents as high as thosefound in experiments at the low temperatures immediately
157Formation of refractory inclusions by evaporation of condensate precursors

above the fassaite crystallization temperature. Cooling � at 2K/h at PH2
� 10�6 bar produces evaporation residues whosebulk chemical, bulk isotopic, and mineralogical properties canthus be considered a good match for those of Type B1 inclu-sions.
As seen in Figure 7, at a cooling rate of 1 K/h, final bulkchemical compositions much further from � can be reached,while the melilite remains normally zoned to Åk29 and the finalbulk FMg, FSi, and FO rise to 10.2, 2.4, and 2.7‰, respectively.Slightly slower cooling rates will produce FMg beyond themaximum observed value, but even at 1 K/h, the final åker-manite content is much lower than observed in most Type B1inclusions. Thus, evaporation of compositions similar to � atPH2
� 10�6 bar will produce objects similar to Type B1inclusions at 1.5 to 3 K/h, but not at 1 K/h. Again, at higher PH2
,faster cooling rates are allowed. At PH2
� 10�4 bar, forexample, cooling � at rates from �12 to �24 K/h wouldproduce similar evaporation effects as those illustrated in Fig-ure 7. At 10�3 bar, this would be achieved at cooling rates from38 to 75 K/h. Because it is not known whether cooling rates of�20 K/h can produce fassaite precipitation-induced melilitezoning reversals, however, formation of Type B1 inclusions bythe mechanism discussed herein may be precluded at 10�3 bar.
4.3.3. Type B2’s
The precursors of most Type B2 inclusions were probablymore MgO- and SiO2-rich than composition �. When compo-sition �, for example, is cooled from 1693 K at 0.5 K/h at PH2
�10�6 bar, its composition evolves into the relatively low-SiO2,high-MgO portion of the field of Type B2 inclusions. Underthese conditions, melilite begins crystallizing at 1674 K, and isnormally zoned from Åk24 to Åk38. An inclusion formed in thisway would have bulk FMg, FSi, and FO of 6.1, 1.8, and 2.1‰,respectively.
Generally, Type B2 inclusions with SiO2 contents lyingabove the evaporation curves emanating from � require precur-sors more SiO2-rich than �, such as �. A peak temperature of1613 K assures melilite crystallization from � within 20 K ofthe peak temperature. When a 0.25-cm droplet of this compo-sition is cooled at 0.07 K/h at PH2
� 10�6 bar, melilite isnormally zoned from Åk24 to Åk31, and the final bulk FMg, FSi,and FO will be 8.2, 3.0, and 3.3‰, respectively. It is not knownwhether such a slow cooling rate would suppress anorthitenucleation, thereby generating the reversely zoned melilitebands seen experimentally by MacPherson et al. (1984). Asshown by the 0.1 K/h evaporation path at the same PH2
, how-ever, faster cooling rates than this produce insufficient evapo-ration to reach the compositions of Type B2 inclusions becausethe peak temperature is only 113 K above the solidus. Becauseof the increase in evaporation rate with increasing PH2
, thesame bulk composition change produced along the 0.07 K/hpath at 10�6 bar in Figure 7 can be generated at a PH2
of 10�3
bar, for example, but at �1.8 K/h, a cooling rate sufficientlyfast to ensure anorthite-suppression-induced reverse zoning.
While such evaporation conditions and those illustrated forcomposition � could produce residues having the compositionsof those Type B2 inclusions with 12 to 15 wt.% MgO and 26to 30 wt.% SiO2, it seems unlikely that those having between27 and 35 wt.% SiO2 at MgO � 12 wt.% can be produced as
evaporation residues of precursor compositions along this con-densation curve. There are two reasons for this. First, precur-sors more SiO2-rich than � are needed to produce these rela-tively SiO2-rich inclusions, but the slope of the condensationcurve in this region is such that precursors of the required SiO2
contents also have higher MgO contents than �. The differencein MgO content between such precursors and the inclusions inquestion increases with the SiO2 content of the precursors,requiring an ever-increasing degree of Mg evaporation to reachthe inclusion compositions. The second reason is that, as theMgO and SiO2 contents of the precursor compositions increase,the slopes of the evaporation paths steepen; i.e., a greaterdegree of SiO2 evaporation occurs for the same amount ofMgO evaporation as the precursor becomes more MgO- andSiO2-rich. As a result, evaporation conditions have not beenfound that can produce the relatively SiO2-rich Type B’s fromprecursor compositions along the illustrated condensationcurve without exceeding the maximum observed FMg. Thissuggests that a more appropriate condensation curve would beone whose SiO2 rises more steeply with MgO above 15% MgO,but such a curve has not yet been predicted.
4.4. Isotopic Zoning of Melilite
Another prediction of the evaporation model is that anymelilite crystal that grew continuously with falling temperatureshould be isotopically zoned because successively formed lay-ers of the crystals grew from progressively more evaporatedand isotopically mass-fractionated liquid. The evaporationmodel can be tested by making measurements of isotopiczoning on crystals that have not been recrystallized or over-printed by the effects of secondary alteration, using microbeaminstruments of appropriate sensitivity. Figure 9 shows the cor-respondence between chemical and magnesium isotopic zoningin melilite crystals predicted to form along six of the evapora-tion paths shown in Figure 7. Despite wide crystal-to-crystalvariations in chemical zoning profiles seen within individualinclusions and systematic errors in predicted åkermanite con-tents alluded to above, Figure 9 can be used as an approximateguide to the magnitudes of possible isotope effects and thethicknesses of zones to which they apply. The largest mass-fractionations are, of course, found in the outermost zones ofthe crystals, but the thicknesses of the zones enriched in heavyisotopes vary with starting composition, cooling rate and crys-tal size. Those paths for which the degree of evaporation isgreatest yield melilite with the largest mass-fractionations ofMg and other elements. On this figure, the volume fraction ofmelilite crystallized is converted to the radius of a hypothetical,250-�m spherical crystal. Smaller crystals formed under iden-tical conditions will have thinner zones at a particular averageisotopic composition, and larger crystals will have thickerzones. Fassaite and anorthite crystallize from the last liquids todisappear, and therefore from the most mass-fractionated ones.Whether these phases are more isotopically fractionated thanthe outermost measurable layers of the melilite crystals in thesame inclusion depends on what fraction of the total melilitecrystallized after the beginning of precipitation of fassaite andanorthite.
158 L. Grossman, D. S. Ebel, and S. B. Simon

4.5. Limitations
Throughout this work, the amounts and compositions ofphases crystallizing in a given temperature interval are assumedto be those given by liquid-crystal equilibrium, even as previ-ously formed crystals are assumed to be out of equilibrium withthe liquid. The variability of melilite zoning patterns foundwithin individual inclusions has been cited above as evidencefor nonequilibrium crystallization, a factor that may have alsocaused violation of the assumption that all of the investigatedliquids disappeared at the equilibrium solidus temperature of1500 K. In dynamic crystallization experiments conducted atcooling rates of 0.5 to 50 K/h, MacPherson et al. (1984) foundpersistence of liquids to temperatures as low as 1373 K. Evenif this is a kinetic effect due to fast cooling rates, the similarityof these rates to those found in the present study suggests thatthe assumption that all liquid disappeared at 1500 K may beincorrect, and may have caused the model to underestimate theextent of evaporation. On the other hand, the ubiquitous spinellayer on the surface of the inclusions and textural evidence thatmelilite preferentially nucleated on the edges of the melt drop-lets that became compact Type A and Type B1 inclusionssuggests that the surfaces of many of these melt droplets mayhave become crowded with crystals early in the cooling history.Failure of the present model to consider the effect of thisreduction of the surface area of liquid actually exposed to the
gas may result in an overestimate of the magnitude of evapo-ration effects.
In this work, the only combinations of starting compositionand cooling rate considered appropriate for forming refractoryinclusions are those that simultaneously yield bulk chemicaland isotopic compositions, and melilite zoning profiles, consis-tent with those observed in real inclusions. Even for the evap-oration conditions discussed above that pass these tests, how-ever, the final bulk FSi seems low relative to FMg whencompared to the isotopic compositions of the inclusions sum-marized in Grossman et al. (2000). FSi gradually increases from�1.5‰ to 3.5‰ as FMg increases from �3‰ to 7‰ in thelatter group of inclusions. All of the final FSi values predictedin this work for this range of FMg are between 0.4 and 1.8‰,however, suggesting that �10% more of the silicon evaporatedduring formation of the actual inclusions than is predicted bythis model. Use of the �SiO/�Mg ratio found in vacuum exper-iments instead of the ratio used here from hydrogen experi-ments would only increase this discrepancy. Perhaps the dis-crepancy is due to the inability of the model to produceevaporation residues with compositions like those of the rela-tively SiO2-rich Type B2 inclusions. Such objects require evap-oration of more SiO2-rich precursors for which the ratio of theamount of SiO2 evaporated to the amount of MgO evaporatedis always greater than for the more SiO2-poor precursors fromwhich the successful evaporation paths arise.
Examination of Figure 7 reveals a steady decline in coolingrates at constant PH2
and droplet size with increasing MgO andSiO2 content of inclusion precursors. This is a consequence ofthe petrologic constraint that peak temperatures were close tothe temperatures of incoming of melilite, and that the latterdecline with increasing MgO and SiO2 content, while thesolidus temperature remains constant. Because of the limitednumber of inclusions for which both FMg and FSi data exist, nodistinction can be made in the degree of evaporation betweendifferent inclusion types. As seen from Eqn. 5, for the degree ofevaporation to remain the same while the temperature intervaldecreases, the cooling rate must decline with increasing MgOand SiO2 content.
MacPherson and Davis (1993) and Beckett et al. (2000)observed that the Na and åkermanite contents of the åkerman-ite-rich portions of melilite crystals in some Type B refractoryinclusions are correlated. This suggests that Na, a volatileelement, was present in the liquids from which these portions ofthe melilite crystals precipitated, implying that the meltingevent recorded by this melilite occurred after secondary alter-ation had begun to introduce Na into the inclusions, and thattotal evaporative loss of Na had not occurred before the åker-manite-rich portions of the melilite crystals solidified. It is verydifficult to imagine melting at conditions that caused tens ofpercent of Mg and Si to evaporate without total loss of Na. Thisleads to the possibilities that Mg and Si loss occurred in amelting event that predated the one in which Na was present,and that the latest melting event erased Mg isotopic zoning ofmelilite crystals that should have been produced by progressiveMg volatilization during their growth in the earlier meltingevent. If the above interpretation of the Na-åkermanite corre-lation is correct, the isotopic zoning predicted for melilite inthis work may not be present in the high-åkermanite portions ofmelilite grains in which this correlation is found.
Fig. 9. (a) Chemical and (b) Mg isotopic zoning predicted formelilite crystals that form along some of the evaporation paths inFigure 7. Curves are labeled with Greek letters and numbers corre-sponding to initial compositions and cooling rates, respectively, inFigure 7. The volume fraction of melilite is converted to the radius ofa hypothetical, 250-�m spherical melilite crystal.
159Formation of refractory inclusions by evaporation of condensate precursors

This discussion focuses attention on the need for a completestudy of at least several whole, unaltered inclusions to test theevaporation model proposed here. Indeed, the bulk chemicalcomposition is known for only one of the inclusions whosebulk FMg and FSi are known. In such a study, inclusions ofdifferent types must be extracted whole to measure their sizesaccurately. An experimental protocol must be developed so thatbulk chemical and bulk magnesium, silicon, and oxygen iso-topic analyses can be made of truly representative samples,while preserving sufficient material for thin sections in whichchemical and isotopic zoning can be measured within individ-ual crystals.
There is also a need to determine the effect on compositionsof evaporation residues of elements in the gas phase in additionto hydrogen.
5. CONCLUSIONS
The sequence of equilibrium condensate assemblages pre-dicted to form during falling temperature in a solar gas at 10�5
bar total pressure produces a series of bulk chemical composi-tions that are suitable precursors for compact Type A and TypeB1 inclusions in CV3 chondrites. When these assemblages arepartially melted in pure hydrogen at peak temperatures in thevicinity of the initial crystallization temperature of melilite, therelative amounts of MgO and SiO2 that evaporate during sub-sequent cooling and crystallization are such that the bulk chem-ical compositions evolve into the composition fields of refrac-tory inclusions, mass-fractionated isotopic compositions of Mg,Si, and O are produced that are in the range of the isotopiccompositions of natural inclusions, and melilite zoning profilesresult that are similar to those observed in real inclusions. Fordroplets of radius 0.25 cm evaporating at PH2
� 10�6 bar,precursors containing 8 to 13 wt.% MgO and 20 to 23% SiO2
evolve into objects similar to compact Type A inclusions atcooling rates of 2 to 12 K/h, depending on the precise startingcomposition. Precursors containing 13 to 14 wt.% MgO and 23to 26% SiO2 evolve into objects with the characteristics ofType B1 inclusions at cooling rates of 1.5 to 3 K/h. Therelatively SiO2-poor members of the Type B2 group can beproduced from precursors containing 14 to 16 wt.% MgO and27 to 33% SiO2 at cooling rates of �1 K/h. Type B2’s con-taining 27 to 35 wt.% SiO2 and �12% MgO require precursorswith higher SiO2/MgO ratios at MgO � 15% than are found onthis or any other condensation curve. The characteristics offluffy Type A inclusions, including their reversely zoned me-lilite, can only be understood in the context of this model if theycontain relict melilite. Evaporation at higher PH2
allows highercooling rates than at 10�6 bar, by factors of 2.6, 8.1, and 25 at10�5, 10�4, and 10�3 bar, respectively, for droplets of thesame size. At constant PH2
, the required cooling rates areinversely proportional to droplet size.
Acknowledgments—This work benefited from discussions with R. N.Clayton, A. M. Davis, M. Humayun, and F. M. Richter. Funding forthis work from the National Aeronautics and Space Administrationthrough grant NAG5-4476 is gratefully acknowledged.
Associate editor: U. Ott
REFERENCES
Beckett J. R. (1986) The origin of calcium-aluminum-rich inclusionsfrom carbonaceous chondrites: An experimental study. Ph.D. thesis,University of Chicago.
Beckett J. R., Simon S. B., and Stolper E. (2000) The partitioning of Nabetween melilite and liquid: Part II. Applications to Type B inclu-sions from carbonaceous chondrites. Geochim. Cosmochim. Acta 64,2519–2534.
Berman R. G. (1983) A thermodynamic model for multicomponentmelts, with application to the system CaO-MgO-Al2O3-SiO2. Ph.D.thesis, University of British Columbia.
Berman R. G. (1988) Internally-consistent thermodynamic data forminerals in the system Na2O-K2O-CaO-MgO-FeO-Fe2O3-Al2O3-SiO2-TiO2-H2O-CO2. J. Petrol. 29, 445–522.
Charlu T. V., Newton R. C., and Kleppa O. J. (1981) Thermochemistryof synthetic Ca2Al2SiO7 (gehlenite)-Ca2MgSi2O7 (åkermanite) me-lilites. Geochim. Cosmochim. Acta 45, 1609–1617.
Clayton R. N., Onuma N., Grossman L., and Mayeda T. K. (1977)Distribution of the pre-solar component in Allende and other carbo-naceous chondrites. Earth Planet. Sci. Lett. 34, 209–224.
Davis A. M., Hashimoto A., and Richter F. M. (1998) Isotopic massfractionation under solar nebular conditions. Meteoritics Planet. Sci.33, A39.
Ghiorso M. S. and Sack R. O. (1995) Chemical mass transfer inmagmatic processes IV. A revised and internally consistent thermo-dynamic model for the interpolation and extrapolation of liquid-solidequilibria in magmatic systems at elevated temperatures and pres-sures. Contrib. Mineral. Petrol. 119, 197–212.
Grossman L., Ebel D. S., Simon S. B., Davis A. M., Richter F. M., andParsad N. M. (2000) Major element chemical and isotopic compo-sitions of refractory inclusions in C3 chondrites: The separate rolesof condensation and evaporation. Geochim. Cosmochim. Acta 64,2879–2894.
Kuroda D. and Hashimoto A. (2000) The reaction of forsterite withhydrogen-its apparent and real temperature dependences. In Antarc-tic Meteorites XXV, pp. 64–66. National Institute of Polar Research,Tokyo, Japan.
Lange R. A. and Carmichael I. S. E. (1987) Densities of Na2O-K2O-CaO-MgO-FeO-Fe2O3-Al2O3-TiO2-SiO2 liquids: New measure-ments and derived partial molar properties. Geochim. Cosmochim.Acta 51, 2931–2946.
MacPherson G. J. and Grossman L. (1981) A once-molten, coarse-grained, Ca-rich inclusion in Allende. Earth Planet. Sci. Lett. 52,16–24.
MacPherson G. J. and Grossman L. (1984) “Fluffy” Type A Ca-,Al-rich inclusions in the Allende meteorite. Geochim. Cosmochim.Acta 48, 29–46.
MacPherson G. J. and Davis A. M. (1993) A petrologic and ionmicroprobe study of a Vigarano Type B refractory inclusion: Evo-lution by multiple stages of alteration and melting. Geochim. Cos-mochim. Acta 57, 231–243.
MacPherson G. J., Paque J. M., Stolper E., and Grossman L. (1984)The origin and significance of reverse zoning in melilite from Al-lende Type B inclusions. J. Geol. 92, 289–305.
Morioka M. and Nagasawa H. (1991) Diffusion in single crystals ofmelilite: II. Cations. Geochim. Cosmochim. Acta 55, 751–759.
Osborn E. F. and Schairer J. F. (1941) The ternary system pseudowol-lastonite-åkermanite-gehlenite. Am. J. Sci. 239, 715–763.
Paque J. M. and Stolper E. (1984) Crystallization experiments on arange of Ca-Al-rich inclusion compositions. In Lunar Planet. Sci.XV, pp. 631–632. Lunar and Planetary Institute, Houston, TX.
Podosek F. A., Zinner E. K., MacPherson G. J., Lundberg L. L.,Brannon J. C., and Fahey A. J. (1991) Correlated study of initial87Sr/86Sr and Al-Mg isotopic systematics and petrologic propertiesin a suite of refractory inclusions from the Allende meteorite.Geochim. Cosmochim. Acta 55, 1083–1110.
Richter F. M., Davis A. M., Ebel D. S., and Hashimoto A. (in press)Elemental and isotopic fractionation of Type B CAIs: Experiments,theoretical considerations, and constraints on their thermal evolution.Geochim. Cosmochim. Acta.
Robie R. A., Hemingway B. S., and Fisher J. R. (1978) ThermodynamicProperties of Minerals and Related Substances at 298.15 K and 1
160 L. Grossman, D. S. Ebel, and S. B. Simon

Bar (105 Pascals) Pressure and at Higher Temperatures (USGSBulletin 1452).
Ryerson F. J. and McKeegan K. D. (1994) Determination of oxygenself-diffusion in åkermanite, anorthite, diopside, and spinel: Impli-cations for oxygen isotopic anomalies and the thermal histories ofCa-Al-rich inclusions. Geochim. Cosmochim. Acta 58, 3713–3734.
Sheng Y. J., Wasserburg G. J., and Hutcheon I. D. (1992) Self-diffusion of Mg in spinel and in equilibrium melts: Constraints onflash heating of silicates. Geochim. Cosmochim. Acta 56, 2535–2546.
Simon S. B., Davis A. M., and Grossman L. (1999) Origin of compacttype A refractory inclusions from CV3 carbonaceous chondrites.Geochim. Cosmochim. Acta 63, 1233–1248.
Stolper E. (1982) Crystallization sequences of Ca-Al-rich inclusions
from Allende: An experimental study. Geochim. Cosmochim. Acta46, 2159–2180.
Stolper E. and Paque J. M. (1986) Crystallization sequences of Ca-Al-rich inclusions from Allende: The effects of cooling rate and max-imum temperature. Geochim. Cosmochim. Acta 50, 1785–1806.
Wang J., Davis A. M., Clayton R. N., and Hashimoto A. (1999)Evaporation of single crystal forsterite: Evaporation kinetics, mag-nesium isotope fractionation, and implications of mass-dependentisotopic fractionation of a diffusion-controlled reservoir. Geochim.Cosmochim. Acta 63, 953–966.
Yurimoto H., Morioka M., and Nagasawa H. (1989) Diffusion in singlecrystals of melilite: I. Oxygen. Geochim. Cosmochim. Acta 53,2387–2394.
161Formation of refractory inclusions by evaporation of condensate precursors