formation of voltage control areas for...
TRANSCRIPT
__________________________________________________________
*Some parts of this chapter have been published in the following papers:
• Saran Satsangi, Ashish Saini and Amit Saraswat, “Clustering based Voltage Control Areas for Localized Reactive Power Management in Deregulated Power System”, Int. J. of Electrical and Computer Engineering (IJECE), Vol. 6, No.1, pp. 21-27, Winter 2010.
• Saran Satsangi, Ashish Saini and Amit Saraswat, “Voltage Control Areas for Reactive Power Management using Clustering Approach in Deregulated Power System”, Proc. of IET, Second Int. Conf. on Sustainable Energy and Intelligent System (IET SEISCON 2011), pp. 409-414, Chennai, India, 20th -22nd July 2011.
• Saran Satsangi, Ashish Saini and Amit Saraswat, “Identification of Clustering based Voltage Control Areas for Reactive Power Management in Deregulated Power System”, Proc. of First Int. Conf. on Adaptive Computing Technologies in Various Engineering Applications (ICACTEA-2011), Jaipur, India, 25th–26th February 2011.
Chapter 6
Formation of Voltage Control Areas for
Localized/Zonal Reactive Power Management using
K-means Clustering Approach*
6.1. Introduction
The reactive power is inherently of localized nature and therefore, it cannot travel over a
long distance in the power system. As high reactive power transmission losses are associated
with the reactive power transfer, therefore it is preferred to provide reactive power ancillary
services locally. This localized nature of reactive power results in limited number of
suppliers, generally available at any individual location (usually near a load center) to
provide the reactive power needed. In order to improve the voltage profile of the system, the
sufficient reactive power supports should be provided at different load centers in the power
system. However, from an economic point of view, the control of reactive power at every
load point of the grid is not viable. Since reactive power transmission over long distances is
also not economical, therefore the balance between reactive power generation and demand
must be maintained on a regional basis within the area of operation concerned. In this
situation, it is preferred that system operation should be optimized on a local basis so that the
balance of reactive power must be maintained.
A localized/zonal reactive power management may be an appropriate approach
because of the local nature of the reactive power and the common practices amongst most

Chapter 6: Formation of VCAs for Localized Reactive Power Management using K-means Clustering Approach 2013
Dept. of Electrical Engg., Faculty of Engineering, Dayalbagh Educational Institute, Agra-282110. 172
electric utilities to split the whole system into various reactive zones or Voltage Control
Areas (VCAs). In this approach, the whole power system is separated in to minimum
number of VCAs/Zones (appropriately selected) on the basis of electrical distances among
the different buses. The concept of VCAs/Zones based on electric distances ensures that the
reactive power injection at any bus in a particular VCA/Zone is able to control the voltage at
all the buses lying in the same VCA/Zone. The amount of reactive power injected or
absorbed at any bus is determined by using the sensitivity matrix (i.e. inverse Jacobian
matrix) of the system for a particular state of the power system. The reactive power and
voltage control based on the VCAs/Zones approach helps the ISO to achieve following goals
in a competitive electricity market:
• Improvement in the system security by improving the bus voltages.
• Reduction in real power losses in the transmission lines, efficiently.
• Improvement in transfer capability of transmission lines, and allows more
transactions to take place.
• Reduction in line flows in comparison to the line flows without reactive power
support. It reduces the cost of transacting real power, where transmission pricing
method is based on the line flows, i.e. MW-mile method. The cost of providing
reactive power comes out to be lesser than the saving in the cost of real power
transaction.
• Useful to create a localized/zonal reactive power market segregated from the real
power market. The investment in reactive power control centers is small and
hence it attracts more players to come in picture.
In order to incorporate the above advantages, an efficient and optimal reactive power
management scheme based on localized/zonal concept is advocated in the literature.
Although, the conventional hierarchical clustering based approaches [35], [180]-[181] are
adopted for the formation of VCAs/Zones. This approach requires the heuristics about the
power system topology [35]. In this chapter, an attempt is made to develop a more efficient
and robust approach based on K-means clustering to identify the desired VCAs/Zones for a
given power system. The proposed methodology may facilitate the ISO to automate the
VCAs/Zones identification processes and be used in a day-ahead reactive power
management model.
This chapter is further organized as follows: In Section 6.2, a brief description about
the significance of voltage control areas or reactive zones is given along with the concept of

Chapter 6: Formation of VCAs for Localized Reactive Power Management using K-means Clustering Approach 2013
Dept. of Electrical Engg., Faculty of Engineering, Dayalbagh Educational Institute, Agra-282110. 173
electrical distance. Section 6.3 presents the formation of VCAs/Zones based on the
conventional hierarchical clustering based approach and the proposed K-means clustering
based approach. In Section 6.4, the simulation results for the VCAs/Zones formation are
discussed for three different power systems such as IEEE 24 bus reliability test system, IEEE
30 bus power system and IEEE 118 bus power system. The concluding remarks are provided
in Section 6.6.
6.2. Voltage Control Areas/Reactive Zones
The formation of Voltage Control Areas (VCAs/Zones) for any electric power system is a
process of identifying some non overlapping coherent bus groups. These groups are the sets
of buses forming voltage control areas if they are sufficiently uncoupled electrically, from
their neighbouring areas. Each VCA consists of those buses which have significant electrical
couplings (dependencies) among them. A bus voltage profile of each VCA may be
effectively controlled by the localized reactive power supports within it and the controls
within the area are less influenced by other areas [182]. In Ref. [183], a two-stage systematic
method is reported for identification of VCAs in the French power system. This method
involves determination of electrical distance between the buses in the system, and
subsequently hierarchical clustering algorithm is applied to classify the areas and decide the
borders of each VCA. In Ref. [184], a conventional method is used to analyze “local”
voltage stability problems and assess voltage security, while it has been used for examining
localized/zonal voltage-control services in Ref. [180]. The significance of VCAs/Zones may
be explained based on the two concepts: The localized nature of reactive power and the
electrical distance between the nodes (buses) in a power system.
6.2.1. Localized Nature
It is a well known fact that for the most system contingencies related to bus voltages are due
to reactive power demand at load buses, the influence (of these abnormal conditions) on the
system are of a local nature, which means that the major influence of a perturbation (i.e.
contingency) in limited to a certain neighborhood close to the original perturbation point.
This concept has been well exploited in static voltage security analysis also, from the
concentric relaxation method [185] to the complete bounding method [186]. Since the major
concern in static voltage security analysis is the violation of system operational limits [184],
like the upper and lower voltage magnitude limits at buses, it is not necessary to take into
account the control relations between load buses and generation buses. The system is just

Chapter 6: Formation of VCAs for Localized Reactive Power Management using K-means Clustering Approach 2013
Dept. of Electrical Engg., Faculty of Engineering, Dayalbagh Educational Institute, Agra-282110. 174
divided into the inner subsystem near the contingency, the outer subsystem that is not
affected and the boundary subsystem, according to the contingency and system topology.
In the study of voltage stability problems, the local nature of contingency effects.
However, the local area (subsystem) studied must include the controlling buses (usually the
generation buses) as well as those load buses that they control, and sometimes the boundary
(interface) flow information. Thus, we may consider such a subsystem (i.e. local area) as a
self-contained voltage control area with its reactive power support services. The problem
then is how to properly define such a subsystem. Moreover, the reactive power and voltage-
control services are the eminently localized in nature and required to be provided locally.
Therefore, a competitive reactive power market must be considered more as a
localized/zonal market than a system-wide market. A localized/zonal reactive power market
settlement model based on these VCAs/Zones, where the prices of reactive power ancillary
services are determined on the basis of uniform price auction within each VCA/Zone, is thus
proposed in Chapter 7. Since all the buses in one voltage control area should have low
impedance paths to each other, the electrical distance developed in Ref. [183] may be a good
measure to decide the proper VCAs/zones.
6.2.2. Electrical Distance
The concept of electrical distance is used to measure the voltage interactions between
different buses of the electrical power system. Therefore, the electrical distance is physical
relationship between two buses in power system [187]. With the usual hypothesis of the real
and reactive decoupled system, the reactive model is written as:
[ ] [ ][ ]Q Q V V∆ = ∂ ∂ ∆ (6.1)
rewriting the eq.(6.1).
[ ] [ ] [ ] [ ][ ]1V Q V Q V Q Q
−∆ = ∂ ∂ ∆ = ∂ ∂ ∆ (6.2)
where [ ]Q V∂ ∂ is part of the power flow Jacobian matrix J and [ ]V Q∂ ∂ is its inverse and
is called as the sensitivity matrix.
Both matrices are real and non symmetrical. The elements of [ ]V Q∂ ∂ reflect the
propagation of voltage variation following reactive power injection at a bus. The degree of
voltage coupling [180] between two buses can be quantified by the maximum attenuation of
Chapter 6: Formation of VCAs for Localized Reactive Power Management using K-means Clustering Approach 2013
Dept. of Electrical Engg., Faculty of Engineering, Dayalbagh Educational Institute, Agra-282110. 175
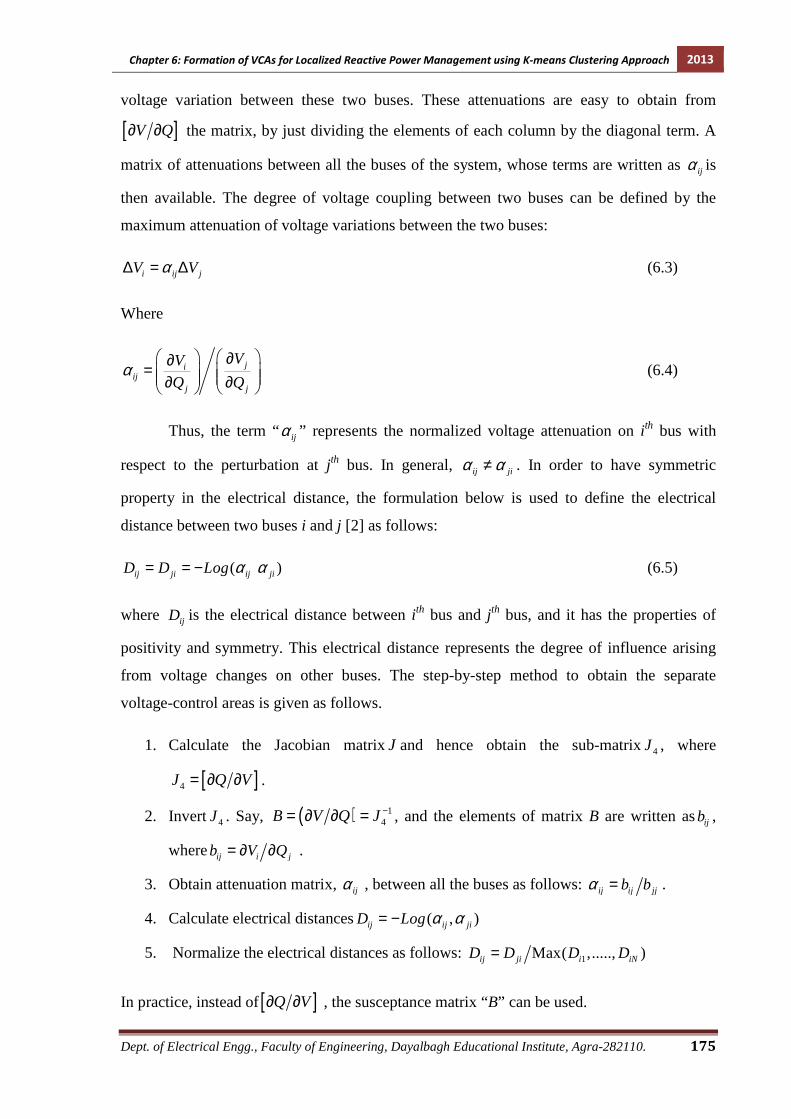
voltage variation between these two buses. These attenuations are easy to obtain from
[ ]V Q∂ ∂ the matrix, by just dividing the elements of each column by the diagonal term. A
matrix of attenuations between all the buses of the system, whose terms are written as ijα is
then available. The degree of voltage coupling between two buses can be defined by the
maximum attenuation of voltage variations between the two buses:
i ij jV Vα∆ = ∆ (6.3)
Where
jiij
j j
VV
Q Qα
∂∂= ∂ ∂ (6.4)
Thus, the term “ ijα ” represents the normalized voltage attenuation on ith bus with
respect to the perturbation at jth bus. In general, ij jiα α≠ . In order to have symmetric
property in the electrical distance, the formulation below is used to define the electrical
distance between two buses i and j [2] as follows:
( )ij ji ij jiD D Log α α= = − � (6.5)
where ijD is the electrical distance between ith bus and jth bus, and it has the properties of
positivity and symmetry. This electrical distance represents the degree of influence arising
from voltage changes on other buses. The step-by-step method to obtain the separate
voltage-control areas is given as follows.
1. Calculate the Jacobian matrixJ and hence obtain the sub-matrix4J , where
[ ]4J Q V= ∂ ∂ .
2. Invert 4J . Say, ( ) 14B V Q J −= ∂ ∂ = , and the elements of matrix B are written asijb ,
where ij i jb V Q= ∂ ∂ .
3. Obtain attenuation matrix, ijα , between all the buses as follows: ij ij jjb bα = .
4. Calculate electrical distances ( , )ij ij jiD Log α α= −
5. Normalize the electrical distances as follows: 1Max( ,....., )ij ji i iND D D D=
In practice, instead of[ ]Q V∂ ∂ , the susceptance matrix “B” can be used.
Chapter 6: Formation of VCAs for Localized Reactive Power Management using K-means Clustering Approach 2013
Dept. of Electrical Engg., Faculty of Engineering, Dayalbagh Educational Institute, Agra-282110. 176
6.3. Formation of Voltage Control Areas / Reactive Zones
Once the electrical distances for any pair of buses in the system are completely determined,
it is possible to trace the boundary of VCAs/Zones [180]. It is intended to group (cluster) the
set of buses within close range to form VCAs/Zones. These ranges of electrical distances
may be decided based on the judgment and experience of ISO. There is no unique way to do
so. The general idea is to give autonomy and independence, from a reactive power
management standpoint, to each VCA/Zone. This may be accomplished in different ways
depending on the power system, which requires an efficient clustering algorithm to form the
desired VCAs/Zones. The concept of VCA clustering, which is the main focus of the present
chapter, may be exploited by use of a robust clustering algorithm which is suitable for the
given data set of electrical distances of a large power system.
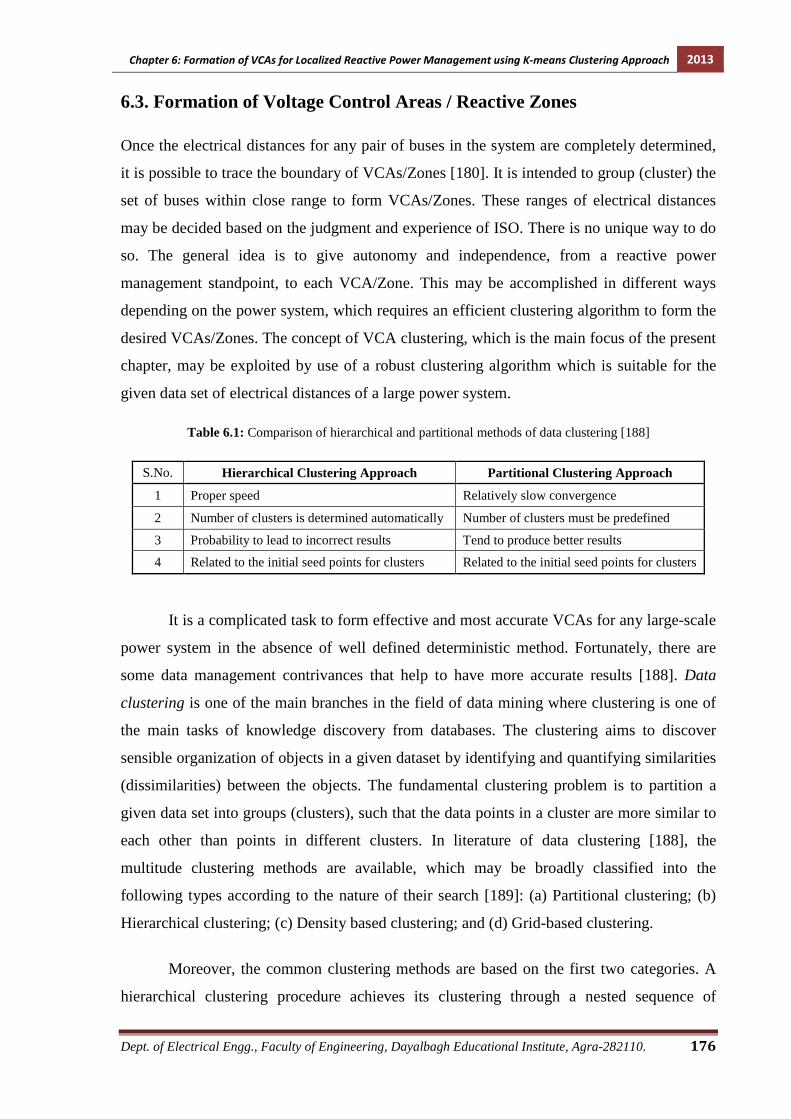
Table 6.1: Comparison of hierarchical and partitional methods of data clustering [188]
S.No. Hierarchical Clustering Approach Partitional Clustering Approach
1 Proper speed Relatively slow convergence
2 Number of clusters is determined automatically Number of clusters must be predefined
3 Probability to lead to incorrect results Tend to produce better results
4 Related to the initial seed points for clusters Related to the initial seed points for clusters
It is a complicated task to form effective and most accurate VCAs for any large-scale
power system in the absence of well defined deterministic method. Fortunately, there are
some data management contrivances that help to have more accurate results [188]. Data
clustering is one of the main branches in the field of data mining where clustering is one of
the main tasks of knowledge discovery from databases. The clustering aims to discover
sensible organization of objects in a given dataset by identifying and quantifying similarities
(dissimilarities) between the objects. The fundamental clustering problem is to partition a
given data set into groups (clusters), such that the data points in a cluster are more similar to
each other than points in different clusters. In literature of data clustering [188], the
multitude clustering methods are available, which may be broadly classified into the
following types according to the nature of their search [189]: (a) Partitional clustering; (b)
Hierarchical clustering; (c) Density based clustering; and (d) Grid-based clustering.
Moreover, the common clustering methods are based on the first two categories. A
hierarchical clustering procedure achieves its clustering through a nested sequence of

Chapter 6: Formation of VCAs for Localized Reactive Power Management using K-means Clustering Approach 2013
Dept. of Electrical Engg., Faculty of Engineering, Dayalbagh Educational Institute, Agra-282110. 177
partitions, which can be represented in a tree-like structure. On the other hand, partitional
clustering method performs clustering in one shot. Historically, the hierarchical clustering
techniques have been more popular in biological, social and behavioural sciences, whereas
partitional methods are more frequent in engineering applications. According to the Ref.
[188], a glance of advantages and disadvantages of the two categories of clustering methods
are listed in Table 6.1. The partitional methods usually lead to better results due to the nature
of iterative and revised-type grouping method and hence they are preferable if there is no
emphasis on speed. Unfortunately the fastness of the convergence could not have much
effect to overcome the deficiency of capturing in local minimums. The common method is to
run the algorithm several times and return the best (not necessary the optimal) clustering
found. The K-means clustering algorithm is well-known partitional clustering method. It is
popular because of its following advantages:
(a) The K-means clustering algorithm converges very fast in practice.
(b) The results of K-means clustering algorithm can be used as a pre estimation of final
clustering due to its fast convergence. This feature is suitable to be considered as the
initial values in advanced clustering algorithms like evolutionary based algorithms to
make a more efficient hybrid clustering algorithm.
(c) Although there is no guarantee of achieving a global minimum, though the
convergence of this algorithm is ensured [190].
A hierarchical classification algorithm based approach is reported in Ref. [35] to
identify the VCAs/Zones according to the electrical distances. In present chapter, an
alternative approach based on the K-means clustering algorithm is proposed to identify the
VCAs/Zones for the reactive power management and voltage control. These two approaches
are described in following subsections for VCAs/Zones formation.
6.3.1. Conventional Hierarchical Clustering based Approach
In this subsection, the procedure of a hierarchical classification algorithm to determine the
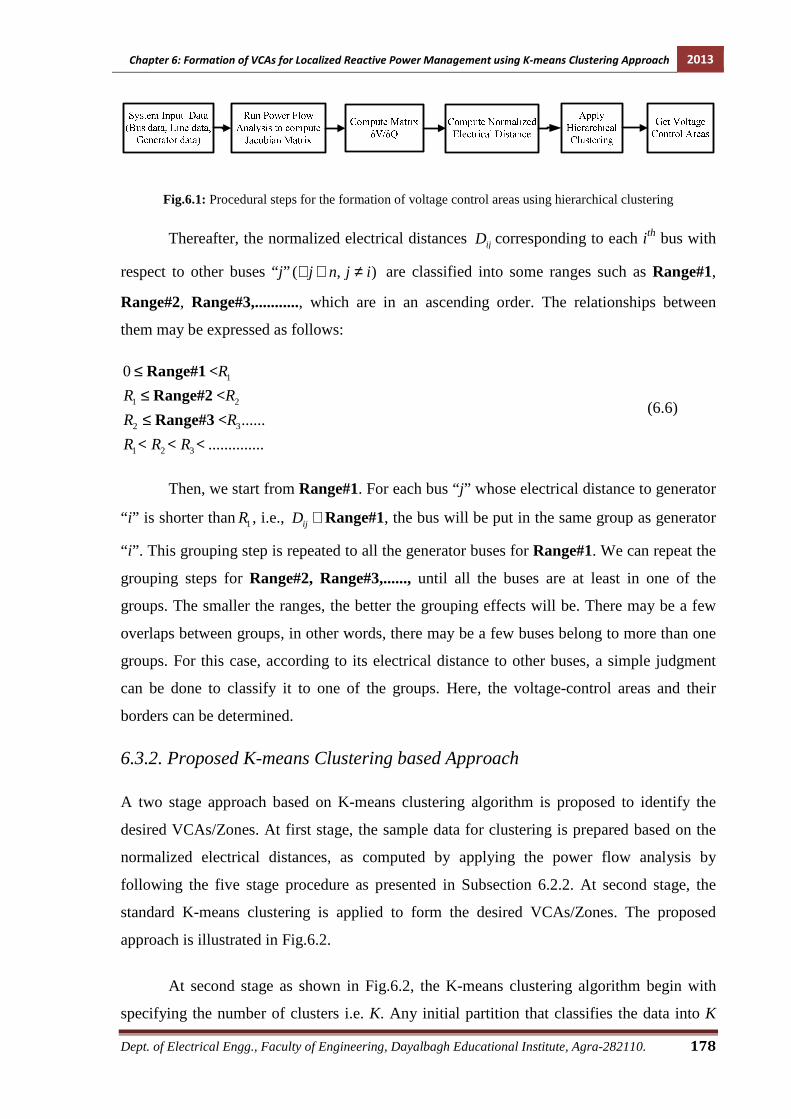
VCAs/Zones according to the electrical distances is described. A block diagram, as shown in
Fig.6.1, illustrates the procedural steps to identify the VCAs/Zones using a hierarchical
clustering based approach. The power flow analysis is performed on the given power system
data, the sensitivity matrix (i.e. V Qδ δ matrix) is computed and subsequently normalized
electrical distances are calculated (using all the five steps as explained in subsection 6.2.2).
Chapter 6: Formation of VCAs for Localized Reactive Power Management using K-means Clustering Approach 2013
Dept. of Electrical Engg., Faculty of Engineering, Dayalbagh Educational Institute, Agra-282110. 178
Fig.6.1: Procedural steps for the formation of voltage control areas using hierarchical clustering
Thereafter, the normalized electrical distances ijD corresponding to each ith bus with
respect to other buses “j” ( , )j n j i∀ ∈ ≠ are classified into some ranges such as Range#1,
Range#2, Range#3,..........., which are in an ascending order. The relationships between
them may be expressed as follows:
1
1 2
2 3
1 2 3
0
......
..............
R
R R
R R
R R R
≤≤≤
Range#1 <
Range#2 <
Range#3 <
< < <
(6.6)
Then, we start from Range#1. For each bus “j” whose electrical distance to generator
“ i” is shorter than1R , i.e., ijD ∈ Range#1, the bus will be put in the same group as generator
“ i”. This grouping step is repeated to all the generator buses for Range#1. We can repeat the
grouping steps for Range#2, Range#3,......, until all the buses are at least in one of the
groups. The smaller the ranges, the better the grouping effects will be. There may be a few
overlaps between groups, in other words, there may be a few buses belong to more than one
groups. For this case, according to its electrical distance to other buses, a simple judgment
can be done to classify it to one of the groups. Here, the voltage-control areas and their
borders can be determined.
6.3.2. Proposed K-means Clustering based Approach
A two stage approach based on K-means clustering algorithm is proposed to identify the
desired VCAs/Zones. At first stage, the sample data for clustering is prepared based on the
normalized electrical distances, as computed by applying the power flow analysis by
following the five stage procedure as presented in Subsection 6.2.2. At second stage, the
standard K-means clustering is applied to form the desired VCAs/Zones. The proposed
approach is illustrated in Fig.6.2.
At second stage as shown in Fig.6.2, the K-means clustering algorithm begin with
specifying the number of clusters i.e. K. Any initial partition that classifies the data into K
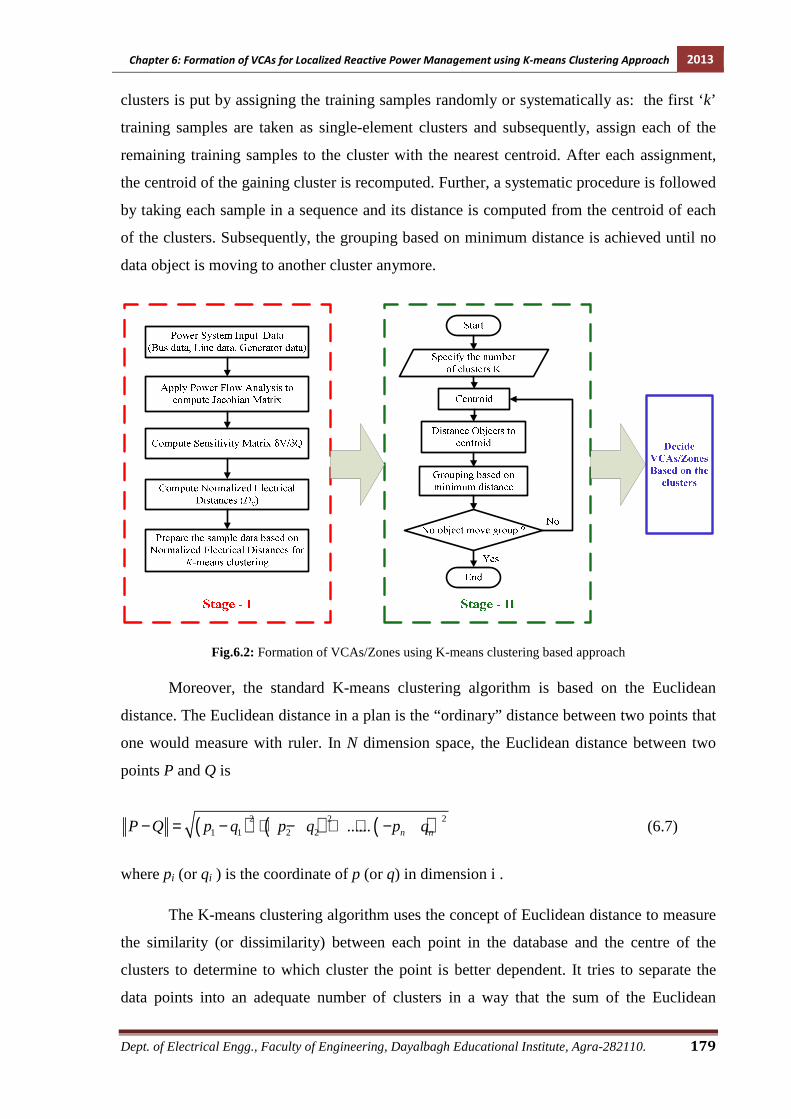
Chapter 6: Formation of VCAs for Localized Reactive Power Management using K-means Clustering Approach 2013
Dept. of Electrical Engg., Faculty of Engineering, Dayalbagh Educational Institute, Agra-282110. 179
clusters is put by assigning the training samples randomly or systematically as: the first ‘k’
training samples are taken as single-element clusters and subsequently, assign each of the
remaining training samples to the cluster with the nearest centroid. After each assignment,
the centroid of the gaining cluster is recomputed. Further, a systematic procedure is followed
by taking each sample in a sequence and its distance is computed from the centroid of each
of the clusters. Subsequently, the grouping based on minimum distance is achieved until no
data object is moving to another cluster anymore.
Fig.6.2: Formation of VCAs/Zones using K-means clustering based approach
Moreover, the standard K-means clustering algorithm is based on the Euclidean
distance. The Euclidean distance in a plan is the “ordinary” distance between two points that
one would measure with ruler. In N dimension space, the Euclidean distance between two
points P and Q is
( ) ( ) ( )2 2 2
1 1 2 2 ...... n nP Q p q p q p q− = − + − + + − (6.7)
where pi (or qi ) is the coordinate of p (or q) in dimension i .
The K-means clustering algorithm uses the concept of Euclidean distance to measure
the similarity (or dissimilarity) between each point in the database and the centre of the
clusters to determine to which cluster the point is better dependent. It tries to separate the
data points into an adequate number of clusters in a way that the sum of the Euclidean
Chapter 6: Formation of VCAs for Localized Reactive Power Management using K-means Clustering Approach 2013
Dept. of Electrical Engg., Faculty of Engineering, Dayalbagh Educational Institute, Agra-282110. 180
distances of all points of database to the centroid of their own cluster become minimized (at
least locally minimized as mentioned before). This procedure consists of the following steps:
Step 1: Choose K initial cluster centres z1(1), z2(1), . . ., zk(1) arbitrarily.
Step 2: At the rth iterative step distributes the samples {X} among the K cluster domains,
using the relation,
( ) ( ) < ( ) 1,2,...., andj j ix S r if x z r x z r i K i j∈ − − ∀ = ≠ (6.8)
where ( )jS r denotes the set of samples whose cluster centre is( )iz r .
Step 3: From the results of Step 2, compute the new cluster centers ( 1), 1,2,......,jz r j K+ = ,
such that the sum of the squared distances from all points in ( )jS r to the new cluster
centre is minimized. Those cluster centres are considered simply the sample mean of
( )jS k .
( )
1( 1) 1,2,..........,
j
jX S k
z k X j KN ∈
+ = =∑ (6.9)
where Nj is the number of samples in( )jS r .
Step 4: if ( 1) ( )j jz r z r+ = , for 1,2,......,j K= , the algorithm has converged and the
procedure is terminated. Otherwise go to Step 2.
6.4. Simulation Results and Discussion
The simulations related to the formation of VCAs/Zones are carried out on three different
power systems such as: IEEE 24 bus reliability test system, IEEE 30 bus power system and
IEEE 118 bus power system. These simulations comprise the formation of VCAs/Zones
obtained from the proposed K-means clustering based approach and subsequently, its
comparison with the conventional hierarchical clustering based approach.
Earlier, Nobile and Bose have conducted load flow simulations before and after
adding new reactive power load at specific location to verify the formation of different
VCAs in their work presented in Ref. [180]. The similar kinds of simulations are conducted
in present research work. The proposed methodology is tested for various disturbances as
created by sudden increments in the real and reactive power demand simultaneously at any

Chapter 6: Formation of VCAs for Localized Reactive Power Management using K-means Clustering Approach 2013
Dept. of Electrical Engg., Faculty of Engineering, Dayalbagh Educational Institute, Agra-282110. 181
load bus. Any such load disturbance may result in voltage fall at that particular bus below its
minimum acceptable limit and poor voltage profile at other buses lying in the same
VCA/Zone. In order to bring back the voltage profile within their permissible limits, the
required voltage control actions may be either by increasing the generator voltages or by
increasing the reactive power support from shunt capacitors installed in same VCA/Zone.
All the simulations are carried out using MATLAB 7.0 on a Pentium IV, 2.26 GHz, 2 GB
RAM computer system.
6.4.1. IEEE 24 bus Reliability Test System
The detailed description about the IEEE 24 bus reliability test system (i.e. IEEE 24 bus RTS)
including the Single Line Diagram (SLD) is given in Appendix A. Using the methodology as
described in previous section, the buses were grouped according to their electrical distances
for the system intact condition. The given IEEE 24 bus RTS is divided in to two
VCAs/Zones (namely VCA-I and VCA-II) by using the conventional hierarchical clustering
approach and the proposed K-means clustering approach as described in subsections 6.3.1
and 6.3.2 respectively.
(a) Conventional hierarchical clustering approach (b) K-means clustering approach
Fig.6.3: Formation of two VCAs/Zones for IEEE 24 bus RTS by using (a) Conventional hierarchical clustering
approach and (b) K-means clustering approach
Chapter 6: Formation of VCAs for Localized Reactive Power Management using K-means Clustering Approach 2013
Dept. of Electrical Engg., Faculty of Engineering, Dayalbagh Educational Institute, Agra-282110. 182
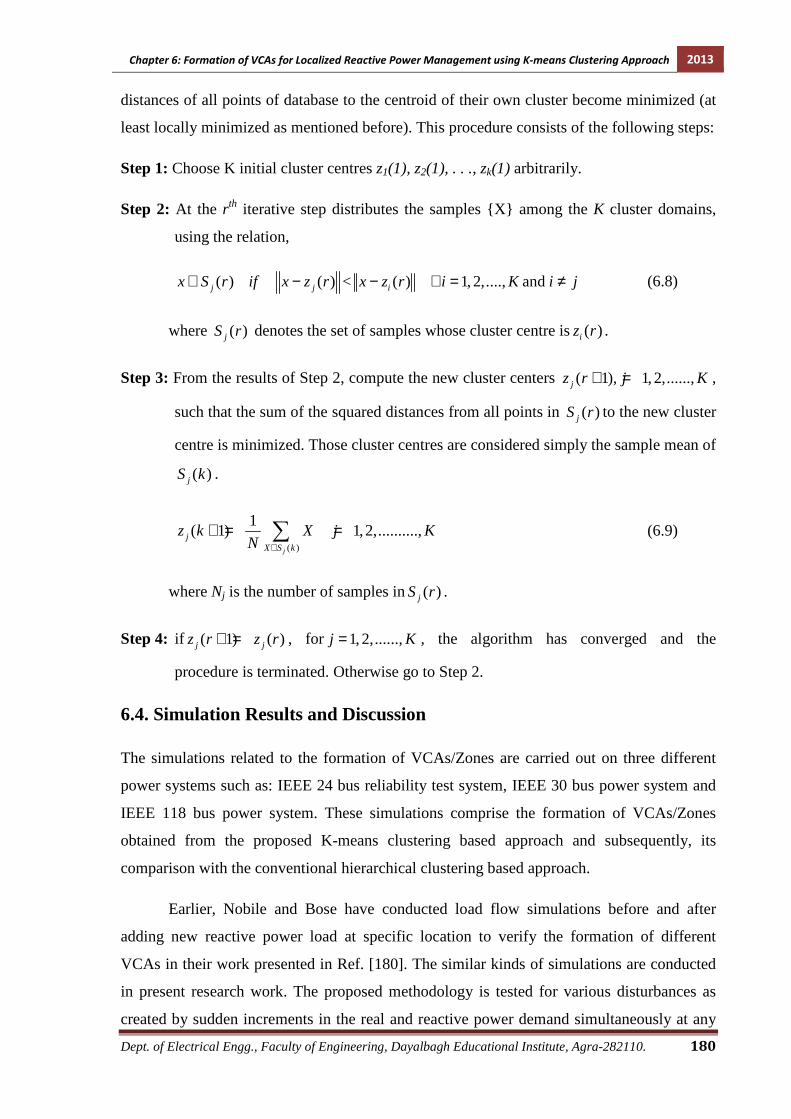
Table 6.2: Comparison of the two VCAs/Zones obtained from Hierarchical and K-means clustering approach
for IEEE 24 bus RTS
S.No. Approach VCAs/Zones
1 Conventional hierarchical clustering based approach
VCA-I = { 1, 2, 3, 4, 5, 6, 7, 8, 9, 10, 24}
VCA-II = {11, 12, 13, 14a, 15, 16, 17, 18, 19, 20, 21, 22, 23}
2 K-means clustering based
approach
VCA-I = { 1, 2, 4, 5, 6, 7, 8, 9, 10}
VCA-II = {3, 11, 12, 13, 14a, 15, 16, 17, 18, 19, 20, 21, 22, 23, 24} a Synchronous condenser (SC)
The results of the formation of two VCAs/Zones from the above mentioned two
approaches are given in Table 6.2. In this table, the generator buses are marked by bold
letters. The two VCAs/Zones formed by using conventional hierarchical clustering and K-
means clustering approaches are illustrated in Fig.6.3 and enclosed by dashed lines. It is
noticed that the VCA-I comprises of three generator buses (i.e. Bus 1, Bus 2 and Bus 7),
whereas the VCA-II comprises of seven generator buses (i.e. Bus 13, Bus 15, Bus 16, Bus
18, Bus 21, Bus 22 and Bus 23) and a synchronous condenser at Bus 14 as obtained by both
the clustering approaches (i.e. hierarchical and K-means). The only discrepancy is about the
Bus 3 i.e. whether it should be in VCA-I or in VCA-II (see Table 6.2 and Fig. 6.3).
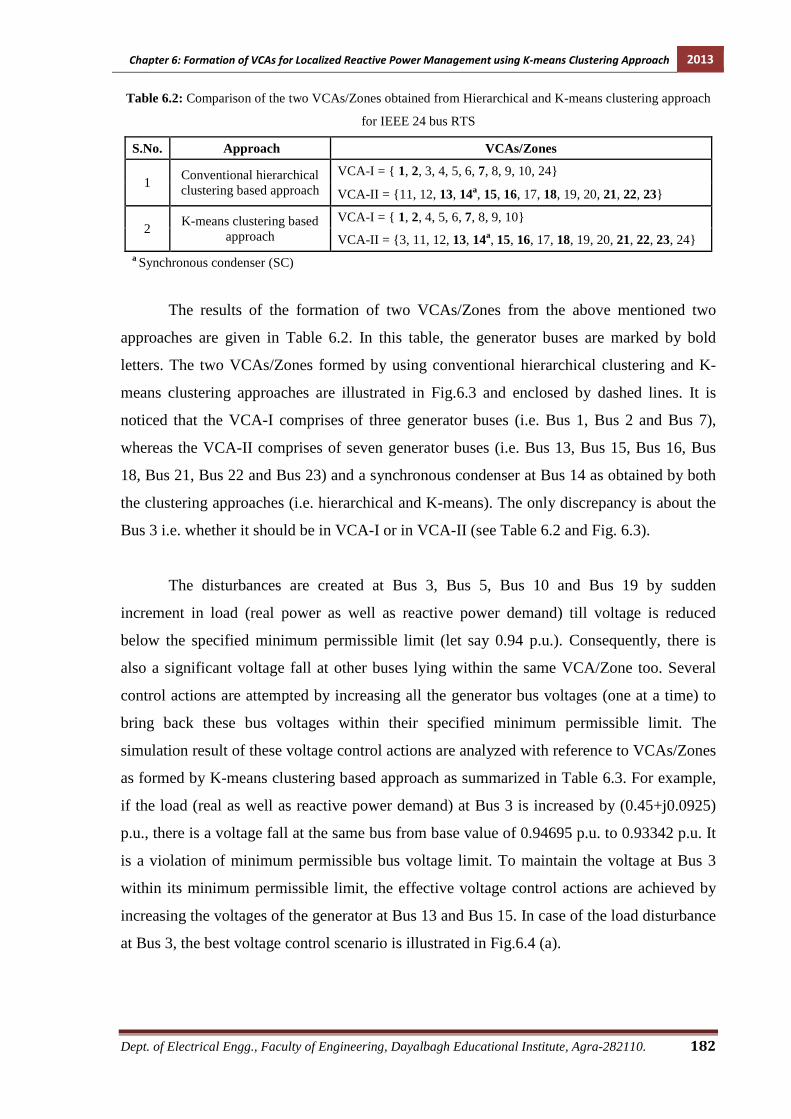
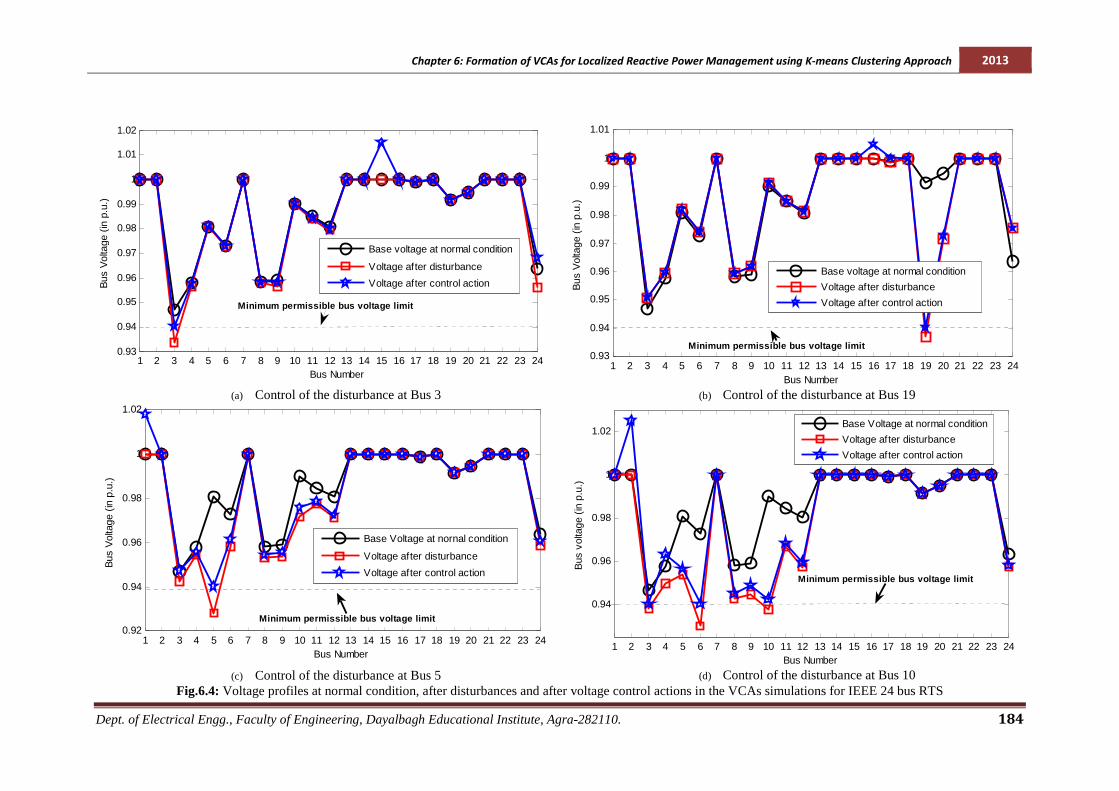
The disturbances are created at Bus 3, Bus 5, Bus 10 and Bus 19 by sudden
increment in load (real power as well as reactive power demand) till voltage is reduced
below the specified minimum permissible limit (let say 0.94 p.u.). Consequently, there is
also a significant voltage fall at other buses lying within the same VCA/Zone too. Several
control actions are attempted by increasing all the generator bus voltages (one at a time) to
bring back these bus voltages within their specified minimum permissible limit. The
simulation result of these voltage control actions are analyzed with reference to VCAs/Zones
as formed by K-means clustering based approach as summarized in Table 6.3. For example,
if the load (real as well as reactive power demand) at Bus 3 is increased by (0.45+j0.0925)
p.u., there is a voltage fall at the same bus from base value of 0.94695 p.u. to 0.93342 p.u. It
is a violation of minimum permissible bus voltage limit. To maintain the voltage at Bus 3
within its minimum permissible limit, the effective voltage control actions are achieved by
increasing the voltages of the generator at Bus 13 and Bus 15. In case of the load disturbance
at Bus 3, the best voltage control scenario is illustrated in Fig.6.4 (a).
Chapter 6: Formation of VCAs for Localized Reactive Power Management using K-means Clustering Approach 2013
Dept. of Electrical Engg., Faculty of Engineering, Dayalbagh Educational Institute, Agra-282110. 183
Table 6.3: Simulation results under different loading conditions for VCAs/Zones for IEEE 24 bus RTS using k-means clustering based approach
VCA-I = {1, 2, 4, 5, 6, 7, 8, 9, 10} VCA-II = {3, 11, 12, 13, 14a, 15, 16, 17, 18, 19, 20, 21, 22, 23, 24}
Other Effected Buses due to disturbance bus no.10
Voltage Control Area (VCA) VCA-II VCA-I VCA-I Bus No. Bus 3 Bus 19 Bus 5 Bus 10 Bus 6
Permissible voltage (p.u) Maximum 1.05000 1.05000 1.05000 1.05000 1.05000 Minimum 0.94000 0.94000 0.94000 0.94000 0.94000
Base Voltage (p.u.) (i.e. at normal condition) 0.94695 0.99152 0.98100 0.99018 -
Load Increment (p.u.) Real power (P) 0.45000 9.05000 1.77500 2.92500 - Reactive Power (Q) 0.09250 1.85000 0.35000 0.60000 -
Voltage after disturbance before voltage control (p.u.) 0.93342 0.93712 0.92826 0.93791 0.93022
Control with
VCA-I
For Gen. at Bus 1 Increment in Gen. Voltage (p.u.) 0.02300 0.05000 0.01800 0.05000 0.05000 Load bus voltage (p.u.) 0.94013 0.93712 0.94039 0.94942 0.93955
For Gen. at Bus 2 Increment in Gen. Voltage (p.u.) 0.05000 0.05000 0.05000 0.02500 0.02500 Load bus voltage (p.u.) 0.93712 0.93712 0.93274 0.94253 0.94033
For Gen. at Bus 7 Increment in Gen. Voltage (p.u.) 0.05000 0.05000 0.05000 0.05000 0.05000 Load bus voltage (p.u.) 0.93656 0.93712 0.93226 0.94591 0.93661
Control with
VCA-II
For Gen at Bus 13 Increment in Gen. Voltage (p.u.) 0.05000 0.05000 0.05000 0.03500 0.03500 Load bus voltage (p.u.) 0.94073 0.93714 0.93750 0.95106 0.94073
For Gen. at Bus14 Increment in Gen. Voltage (p.u.) 0.05000 0.05000 0.05000 0.05000 0.05000 Load bus voltage (p.u.) 0.93738 0.93713 0.93301 0.94754 0.93793
For Gen. at Bus 15 Increment in Gen. Voltage (p.u.) 0.01500 0.05000 0.05000 0.05000 0.05000 Load bus voltage (p.u.) 0.94023 0.93710 0.92895 0.93929 0.93125
For Gen. at Bus 16 Increment in Gen. Voltage (p.u.) 0.05000 0.00500 0.05000 0.05000 0.05000 Load bus voltage (p.u.) 0.93369 0.94024 0.92826 0.93791 0.93024
For Gen. at Bus 18 Increment in Gen. Voltage (p.u.) 0.05000 0.05000 0.05000 0.05000 0.05000 Load bus voltage (p.u.) 0.93351 0.93711 0.92826 0.93791 0.93023
For Gen. at Bus 21 Increment in Gen. Voltage (p.u.) 0.05000 0.05000 0.05000 0.05000 0.05000 Load bus voltage (p.u.) 0.93345 0.93711 0.92827 0.93792 0.93023
For Gen. at Bus 22 Increment in Gen. Voltage (p.u.) 0.05000 0.05000 0.05000 0.05000 0.05000 Load bus voltage (p.u.) 0.93343 0.93712 0.92826 0.93790 0.93022
For Gen. at Bus 23 Increment in Gen. Voltage (p.u.) 0.05000 0.00600 0.05000 0.05000 0.05000 Load bus voltage (p.u.) 0.93567 0.94000 0.93090 0.94327 0.93451
Remarks Controlled by both VCAs, but effective
control is achieved by VCA-II
Only Controlled by VCA-II
Only Controlled by VCA-I
Controlled by both VCAs, but effective control is achieved
by VCA-I
Voltage at Bus 6 is also effectively controlled by
VCA-I
a Synchronous condenser (SC)
Chapter 6: Formation of VCAs for Localized Reactive Power Management using K-means Clustering Approach 2013
Dept. of Electrical Engg., Faculty of Engineering, Dayalbagh Educational Institute, Agra-282110. 184
(a) Control of the disturbance at Bus 3
(b) Control of the disturbance at Bus 19
(c) Control of the disturbance at Bus 5
(d) Control of the disturbance at Bus 10
Fig.6.4: Voltage profiles at normal condition, after disturbances and after voltage control actions in the VCAs simulations for IEEE 24 bus RTS
1 2 3 4 5 6 7 8 9 10 11 12 13 14 15 16 17 18 19 20 21 22 23 240.93
0.94
0.95
0.96
0.97
0.98
0.99
1
1.01
1.02
Bus Number
Bus
Vol
tage
(in
p.u
.)
Base voltage at normal condition
Voltage after disturbance
Voltage after control action
Minimum permissible bus voltage limit
1 2 3 4 5 6 7 8 9 10 11 12 13 14 15 16 17 18 19 20 21 22 23 240.93
0.94
0.95
0.96
0.97
0.98
0.99
1
1.01
Bus Number
Bus
Vol
tage
(in
p.u
.)
Base voltage at normal condition
Voltage after disturbance
Voltage after control action
Minimum permissible bus voltage limit
1 2 3 4 5 6 7 8 9 10 11 12 13 14 15 16 17 18 19 20 21 22 23 240.92
0.94
0.96
0.98
1
1.02
Bus Number
Bus
Vol
tage
(in
p.u
.)
Base Voltage at nornal condition
Voltage after disturbance
Voltage after control action
Minimum permissible bus voltage limit
1 2 3 4 5 6 7 8 9 10 11 12 13 14 15 16 17 18 19 20 21 22 23 24
0.94
0.96
0.98
1
1.02
Bus Number
Bus
vol
tage
(in
p.u
.)
Base Voltage at normal condition
Voltage after disturbance
Voltage after control action
Minimum permissible bus voltage limit
Chapter 6: Formation of VCAs for Localized Reactive Power Management using K-means Clustering Approach 2013
Dept. of Electrical Engg., Faculty of Engineering, Dayalbagh Educational Institute, Agra-282110. 185
In a same manner, the voltage control actions are analyzed for subsequent
disturbances at Bus 19, Bus 5 and Bus 10 and are summarised in Table 6.3. The best voltage
control scenarios achieved for these load disturbances are also shown in Fig.6.4.
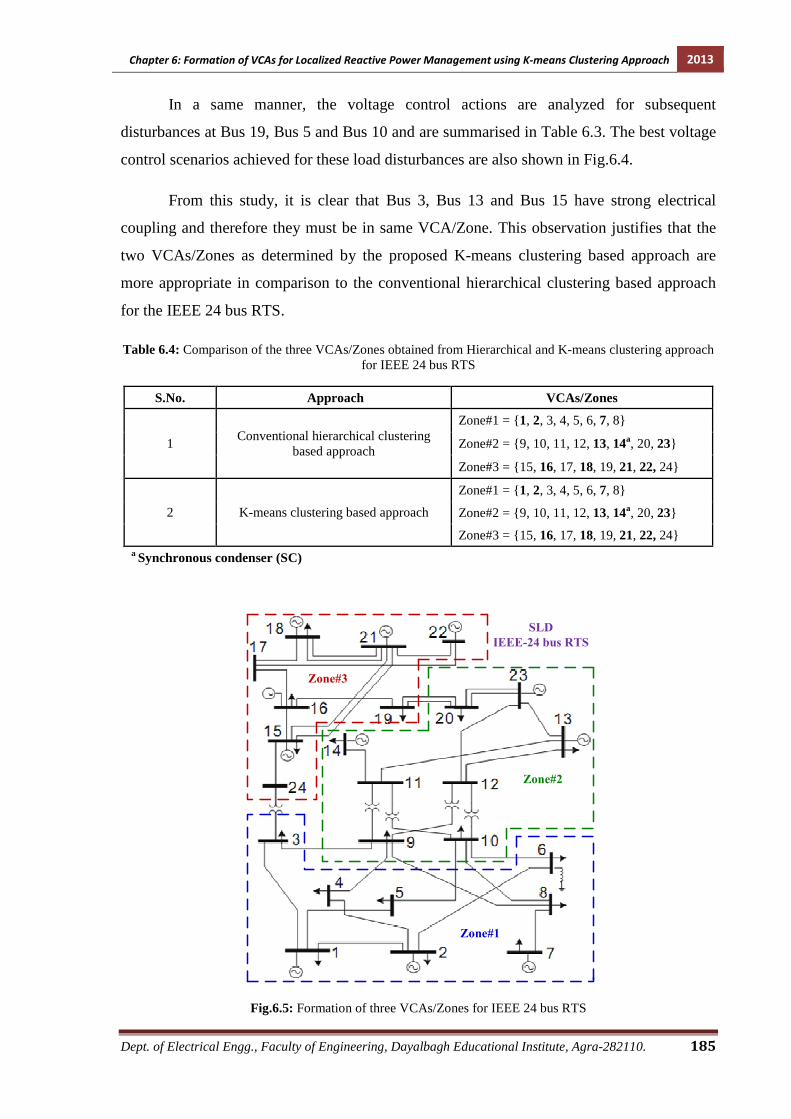
From this study, it is clear that Bus 3, Bus 13 and Bus 15 have strong electrical
coupling and therefore they must be in same VCA/Zone. This observation justifies that the
two VCAs/Zones as determined by the proposed K-means clustering based approach are
more appropriate in comparison to the conventional hierarchical clustering based approach
for the IEEE 24 bus RTS.
Table 6.4: Comparison of the three VCAs/Zones obtained from Hierarchical and K-means clustering approach for IEEE 24 bus RTS
S.No. Approach VCAs/Zones
1 Conventional hierarchical clustering
based approach
Zone#1 = {1, 2, 3, 4, 5, 6, 7, 8}
Zone#2 = {9, 10, 11, 12, 13, 14a, 20, 23}
Zone#3 = {15, 16, 17, 18, 19, 21, 22, 24}
2 K-means clustering based approach
Zone#1 = {1, 2, 3, 4, 5, 6, 7, 8}
Zone#2 = {9, 10, 11, 12, 13, 14a, 20, 23}
Zone#3 = {15, 16, 17, 18, 19, 21, 22, 24} a Synchronous condenser (SC)
Zone#2
Zone#1
Zone#3
SLD
IEEE-24 bus RTS
Fig.6.5: Formation of three VCAs/Zones for IEEE 24 bus RTS
Chapter 6: Formation of VCAs for Localized Reactive Power Management using K-means Clustering Approach 2013
Dept. of Electrical Engg., Faculty of Engineering, Dayalbagh Educational Institute, Agra-282110. 186
Further, the given IEEE 24 RTS is divided into three VCAs/Zones (namely Zone#1,
Zone#2 and Zone#3) by using the proposed K-means clustering based approach as shown in
Fig.6.5. Interestingly, the same VCAs/Zones are obtained from the conventional hierarchical
clustering based approach as shown in Table 6.4. Zone#1 consists of three generators at bus
number 1, 2 and 7 along with five load buses (Bus 3, Bus 4, Bus 5, Bus 6 and Bus 8);
Zone#2 is having two generator buses (bus number 13 and 23), one synchronous condenser
at Bus 14 and five load buses (Bus 9, Bus 10, Bus 11, Bus 12 and Bus 20); and Zone#3
includes five generator buses (Bus 15, Bus 16, Bus 18, Bus 21 and Bus 22) and three load
buses (Bus 17, Bus 19 and Bus 24).
6.4.2. IEEE 30 bus Power System
The proposed methodology for the formation of VCAs/Zones is also tested on IEEE 30 bus
power system. The detailed description about the IEEE 30 bus power system including the
Single Line Diagram (SLD) is given in Appendix B. The given IEEE 30 bus power system is
divided in to three VCAs/Zones (namely VCA-I, VCA-II and VCA-III) by using the
conventional hierarchical clustering approach and the proposed K-means clustering approach
as shown in Fig.6.6. The results of the formation of three VCAs/Zones by using the above
mentioned two approaches are also compared in Table 6.5. In this table, the generator buses
are marked by bold letters.
Table 6.5: Comparison of the three VCAs/Zones obtained from Hierarchical and K-means clustering approach
for IEEE 30 bus power system
S.No. Approach VCAs/Zones
1 Conventional hierarchical clustering based approach
VCA-I = { 1, 2, 3, 4, 5, 6, 7, 8, 9, 10, 11, 17, 21, 22, 24, 28}
VCA-II = {12, 13, 14, 15, 16, 18, 19, 20, 23, 25, 26}
VCA-III = {27, 29, 30}
2 K-means clustering based
approach
VCA-I = { 1, 2, 3, 4, 5, 6, 7, 8, 9, 11, 28}
VCA-II = {10, 12, 13, 14, 15, 16, 17, 18, 19, 20, 21, 22, 23, 24}
VCA-III = {25, 26, 27, 29, 30}
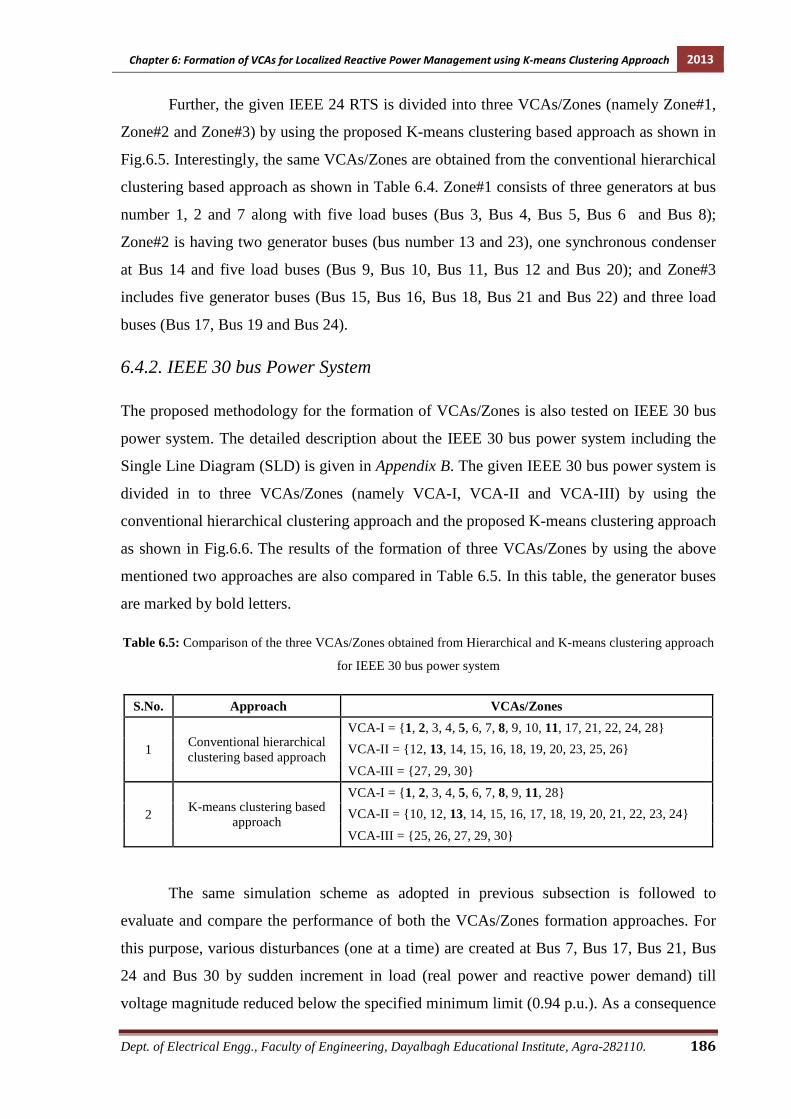
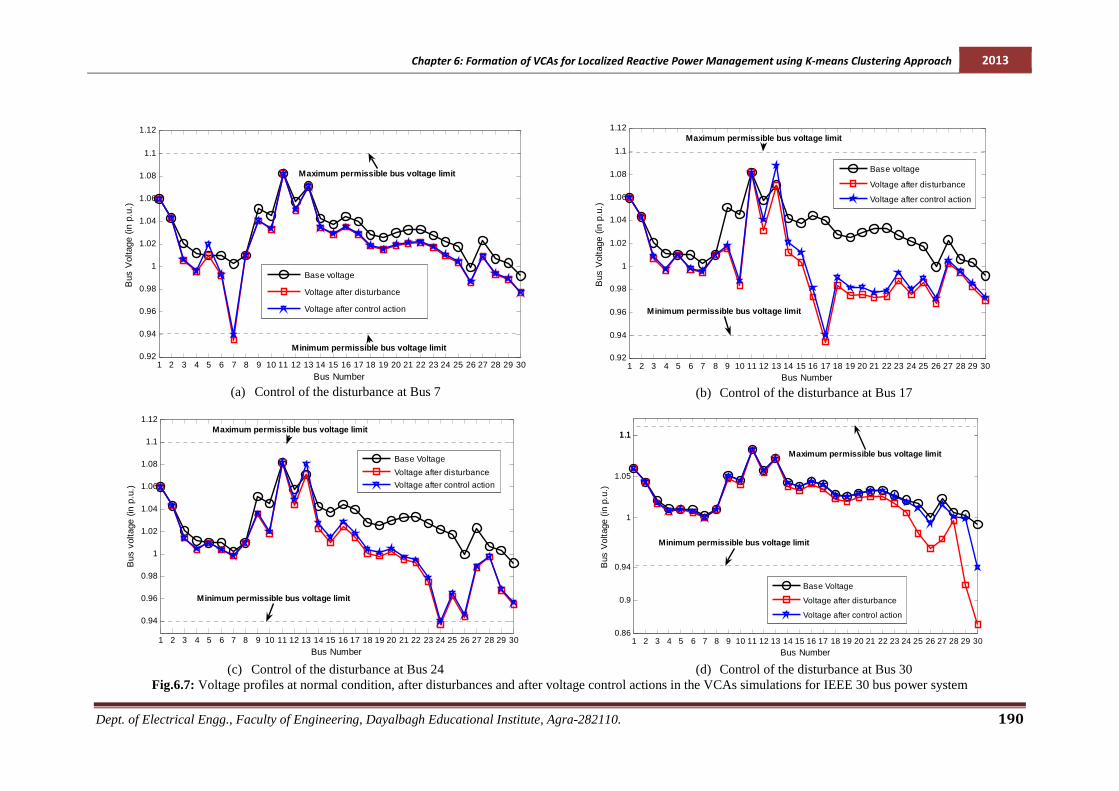
The same simulation scheme as adopted in previous subsection is followed to
evaluate and compare the performance of both the VCAs/Zones formation approaches. For
this purpose, various disturbances (one at a time) are created at Bus 7, Bus 17, Bus 21, Bus
24 and Bus 30 by sudden increment in load (real power and reactive power demand) till
voltage magnitude reduced below the specified minimum limit (0.94 p.u.). As a consequence

Chapter 6: Formation of VCAs for Localized Reactive Power Management using K-means Clustering Approach 2013
Dept. of Electrical Engg., Faculty of Engineering, Dayalbagh Educational Institute, Agra-282110. 187
of any disturbance, there are also significant voltage violations in their corresponding VCAs.
Again, several control actions are attempted by increasing all generator bus voltages (one at
a time) to bring back these bus voltages within their specified minimum permissible limits.
The simulation results of these voltage control actions are analyzed with reference to three
VCAs/Zones obtained by K-means clustering based approach and summarized in Table 6.6.
From Table 6.6, it is clear that when the load (real as well as reactive power) demand
is increased by an amount of (0.3045+j0.2345) p.u. at Bus 24, this load disturbance affects
the bus voltage i.e. the voltage fall at the same bus from base value 1.0216 p.u. to 0.93701
p.u. It is the violation of minimum permissible bus voltage limit. Therefore, in order to bring
back this bus voltage within its permissible bus voltage limits, the control action is obtained
by increasing the voltage of the generator at Bus 13. The best voltage control action is
obtained in the case of disturbance at Bus 24 as illustrated in Fig.6.7 (c). In the same
manner, the various voltage control actions taken for the other load disturbances are also
summarised in Table 6.6 and corresponding voltage profiles are shown in Fig.6.7.
From this study, it is evident that Bus 24 and Bus 13 have strong electrical coupling
and hence they must be in same VCA/Zone. The proposed K-means clustering based
approach includes Bus 24 and Bus 13 in same VCA/Zone whereas the conventional
hierarchical clustering based approach fails to do so. Further, it is also clear (see Table 6.6)
that if any VCA/Zone is formed in such a manner that no generator lies in same VCA/Zone
and load is increased in this VCA, then bus voltage profile is maintained within permissible
limits by providing reactive power support from local capacitor banks within the same
VCA/Zone. Moreover, if the load (real and reactive power demand) increment at Bus 30 is
about (0.212+j0.038) p.u., it results in voltage fall at the same bus and its neighbouring Bus
29. The best voltage control action is obtained in the case of disturbance at Bus 30 as
illustrated in Fig.6.7 (d). The detailed analysis of capacitor value for controlling the same is
also given in Table 6.6. Hence, this analysis supports that three VCAs/Zones as obtained by
proposed K-means based methodology are more appropriate in comparison to conventional
hierarchical based approach.

Chapter 6: Formation of VCAs for Localized Reactive Power Management using K-means Clustering Approach 2013
Dept. of Electrical Engg., Faculty of Engineering, Dayalbagh Educational Institute, Agra-282110. 188
SLD
IEEE 30 bus SystemVCA - 1
VCA - II
VCA - III
(a) Conventional hierarchical clustering approach (b) K-means clustering approach Fig.6.6: Formation of three VCAs/Zones for IEEE 30 bus power system by using (a) Conventional hierarchical clustering approach and (b) K-means clustering approach

Chapter 6: Formation of VCAs for Localized Reactive Power Management using K-means Clustering Approach 2013
Dept. of Electrical Engg., Faculty of Engineering, Dayalbagh Educational Institute, Agra-282110. 189
Table 6.6: Simulation results under different loading conditions for VCAs/Zones for IEEE 30 bus power system using k-means clustering based approach
VCA-I = {1, 2, 3, 4, 5, 6, 7, 8, 9, 11, 28} VCA-II = {10, 12, 13, 14, 15, 16, 17, 18, 19, 20, 21, 22, 23} VCA-III = {25, 26, 27, 29, 30}
Other effected buses due to disturbance
bus no.21
Other effected buses due to disturbance
bus no.30 Voltage Control Area (VCA) VCA-I VCA-II VCA-II VCA-III VCA-III
Bus No. Bus 7 Bus 17 Bus 24 Bus 21 Bus 22 Bus 30 Bus 29
Permissible voltage (p.u) Maximum 1.06000 1.06000 1.06000 1.06000 - 1.06000 - Minimum 0.94000 0.94000 0.94000 0.94000 - 0.94000 -
Pre disturbance Voltage(p.u.) 1.00240 1.03990 1.02160 1.03270 - 0.99191
Load Increment (p.u.) Real power (P) 1.25400 0.63000 0.30450 0.61250 - 0.21200 - Reactive Power (Q) 0.59950 0.40600 0.23450 0.39200 - 0.03800 -
Post disturbance Voltage(p.u.) 0.93532 0.93446 0.93701 0.93218 0.93983 0.87107 0.91819
Control with
VCA #1
For Gen. at bus 1 Increment in Gen. Voltage (p.u.) 0.04000 0.04000 0.04000 0.04000 0.04000 0.04000 0.04000 Load bus voltage (p.u.) 0.93723 0.93730 0.93910 0.93498 0.94260 0.87421 0.92115
For Gen. at bus 2 Increment in Gen. Voltage (p.u.) 0.03650 0.04170 0.03130 0.05210 0.05210 0.05700 0.05700 Load bus voltage (p.u.) 0.94018 0.94098 0.94195 0.94054 0.94813 0.88250 0.92896
For Gen. at bus 5 Increment in Gen. Voltage (p.u.) 0.01010 0.08590 0.06060 0.09000 0.09000 0.09000 0.09000 Load bus voltage (p.u.) 0.94048 0.94002 0.94108 0.93844 0.94603 0.87969 0.92632
For Gen at bus 8 Increment in Gen. Voltage (p.u.) 0.01510 0.02020 0.01010 0.02020 0.02020 0.09000 0.09000 Load bus voltage (p.u.) 0.94076 0.94185 0.94125 0.94070 0.94788 0.93468 0.97834
For Gen. at bus11 Increment in Gen. Voltage (p.u.) 0.01800 0.01800 0.01800 0.01800 0.01800 0.01800 0.01800 Load bus voltage (p.u.) 0.93594 0.93953 0.94116 0.93767 0.94519 0.87370 0.92068
Control with
VCA #2 For Gen. at bus 13
Increment in Gen. Voltage (p.u.) 0.02900 0.01710 0.00930 0.02780 0.02780 0.02900 0.02900
Load bus voltage (p.u.) 0.93630 0.94035 0.94002 0.94021 0.94786 0.87658 0.92339
Control with
VCA #3
At bus 25 Capacitor provided(MVAR) - - - - - 21 21 Load bus voltage (p.u.) - - - - - 0.93522 0.97886
At bus 26 Capacitor provided(MVAR) - - - - - 10 10 Load bus voltage (p.u.) - - - - - 0.90141 0.94682
At bus 27 Capacitor provided(MVAR) - - - - - 18 18 Load bus voltage (p.u.) - - - - - 0.94375 0.98696
At bus 29 Capacitor provided(MVAR) - - - - - 12 12 Load bus voltage (p.u.) - - - - - 0.94036 0.99907
At bus 30 Capacitor provided(MVAR) - - - - - 10 10 Load bus voltage (p.u.) - - - - - 0.94331 0.96959
Remarks Only
controlled by VCA-I
Controlled by both VCAs, but
effectively controlled by
VCA-II
Controlled by both VCAs, but
effectively controlled by
VCA-II
Controlled by both VCAs, but
effectively controlled by
VCA-II
Voltage at bus No. 22 also controlled
effectively by VCA-II
Only controlled by
VCA-III
Voltage at Bus No. 29 also effectively
controlled by VCA-III
Chapter 6: Formation of VCAs for Localized Reactive Power Management using K-means Clustering Approach 2013
Dept. of Electrical Engg., Faculty of Engineering, Dayalbagh Educational Institute, Agra-282110. 190
(a) Control of the disturbance at Bus 7
(b) Control of the disturbance at Bus 17
(c) Control of the disturbance at Bus 24
(d) Control of the disturbance at Bus 30
Fig.6.7: Voltage profiles at normal condition, after disturbances and after voltage control actions in the VCAs simulations for IEEE 30 bus power system
1 2 3 4 5 6 7 8 9 10 11 12 13 14 15 16 17 18 19 20 21 22 23 24 25 26 27 28 29 300.92
0.94
0.96
0.98
1
1.02
1.04
1.06
1.08
1.1
1.12
Bus Number
Bus
Vol
tage
(in
p.u
.)
Base voltage
Voltage after disturbance
Voltage after control action
Maximum permissible bus voltage limit
Minimum permissible bus voltage limit
1 2 3 4 5 6 7 8 9 10 11 12 13 14 15 16 17 18 19 20 21 22 23 24 25 26 27 28 29 30
0.94
0.96
0.98
1
1.02
1.04
1.06
1.08
1.1
1.12
Bus Number
Bus
vol
tage
(in
p.u
.)
Base Voltage
Voltage after disturbance
Voltage after control action
Maximum permissible bus voltage limit
Minimum permissible bus voltage limit
1 2 3 4 5 6 7 8 9 10 11 12 13 14 15 16 17 18 19 20 21 22 23 24 25 26 27 28 29 300.86
0.9
0.94
1
1.05
1.11.1
Bus Number
Bus
Vol
tage
(in
p.u
.)
Base Voltage
Voltage after disturbance
Voltage after control action
Maximum permissible bus voltage limit
Minimum permissible bus voltage limit
Chapter 6: Formation of VCAs for Localized Reactive Power Management using K-means Clustering Approach 2013
Dept. of Electrical Engg., Faculty of Engineering, Dayalbagh Educational Institute, Agra-282110. 191
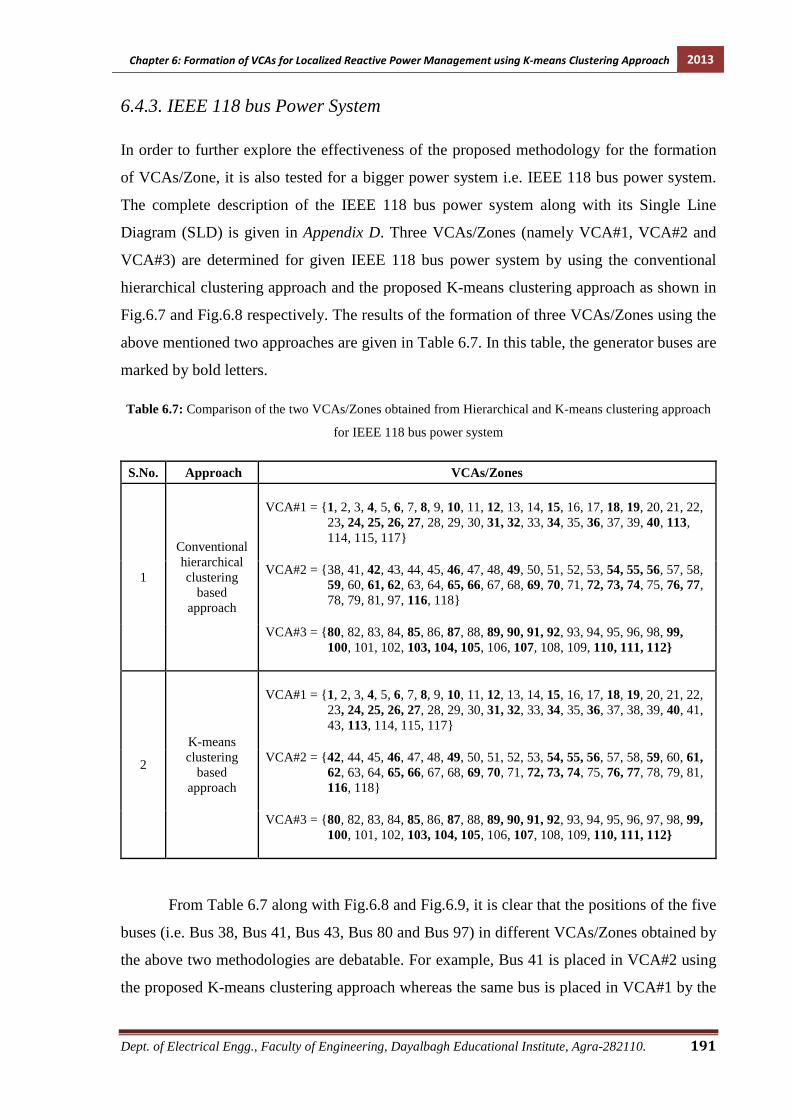
6.4.3. IEEE 118 bus Power System
In order to further explore the effectiveness of the proposed methodology for the formation
of VCAs/Zone, it is also tested for a bigger power system i.e. IEEE 118 bus power system.
The complete description of the IEEE 118 bus power system along with its Single Line
Diagram (SLD) is given in Appendix D. Three VCAs/Zones (namely VCA#1, VCA#2 and
VCA#3) are determined for given IEEE 118 bus power system by using the conventional
hierarchical clustering approach and the proposed K-means clustering approach as shown in
Fig.6.7 and Fig.6.8 respectively. The results of the formation of three VCAs/Zones using the
above mentioned two approaches are given in Table 6.7. In this table, the generator buses are
marked by bold letters.
Table 6.7: Comparison of the two VCAs/Zones obtained from Hierarchical and K-means clustering approach
for IEEE 118 bus power system
S.No. Approach VCAs/Zones
1
Conventional hierarchical clustering
based approach
VCA#1 = {1, 2, 3, 4, 5, 6, 7, 8, 9, 10, 11, 12, 13, 14, 15, 16, 17, 18, 19, 20, 21, 22,
23, 24, 25, 26, 27, 28, 29, 30, 31, 32, 33, 34, 35, 36, 37, 39, 40, 113, 114, 115, 117}
VCA#2 = {38, 41, 42, 43, 44, 45, 46, 47, 48, 49, 50, 51, 52, 53, 54, 55, 56, 57, 58,
59, 60, 61, 62, 63, 64, 65, 66, 67, 68, 69, 70, 71, 72, 73, 74, 75, 76, 77, 78, 79, 81, 97, 116, 118}
VCA#3 = {80, 82, 83, 84, 85, 86, 87, 88, 89, 90, 91, 92, 93, 94, 95, 96, 98, 99,
100, 101, 102, 103, 104, 105, 106, 107, 108, 109, 110, 111, 112}
2
K-means clustering
based approach
VCA#1 = {1, 2, 3, 4, 5, 6, 7, 8, 9, 10, 11, 12, 13, 14, 15, 16, 17, 18, 19, 20, 21, 22,
23, 24, 25, 26, 27, 28, 29, 30, 31, 32, 33, 34, 35, 36, 37, 38, 39, 40, 41, 43, 113, 114, 115, 117}
VCA#2 = {42, 44, 45, 46, 47, 48, 49, 50, 51, 52, 53, 54, 55, 56, 57, 58, 59, 60, 61,
62, 63, 64, 65, 66, 67, 68, 69, 70, 71, 72, 73, 74, 75, 76, 77, 78, 79, 81, 116, 118}
VCA#3 = {80, 82, 83, 84, 85, 86, 87, 88, 89, 90, 91, 92, 93, 94, 95, 96, 97, 98, 99,
100, 101, 102, 103, 104, 105, 106, 107, 108, 109, 110, 111, 112}
From Table 6.7 along with Fig.6.8 and Fig.6.9, it is clear that the positions of the five
buses (i.e. Bus 38, Bus 41, Bus 43, Bus 80 and Bus 97) in different VCAs/Zones obtained by
the above two methodologies are debatable. For example, Bus 41 is placed in VCA#2 using
the proposed K-means clustering approach whereas the same bus is placed in VCA#1 by the
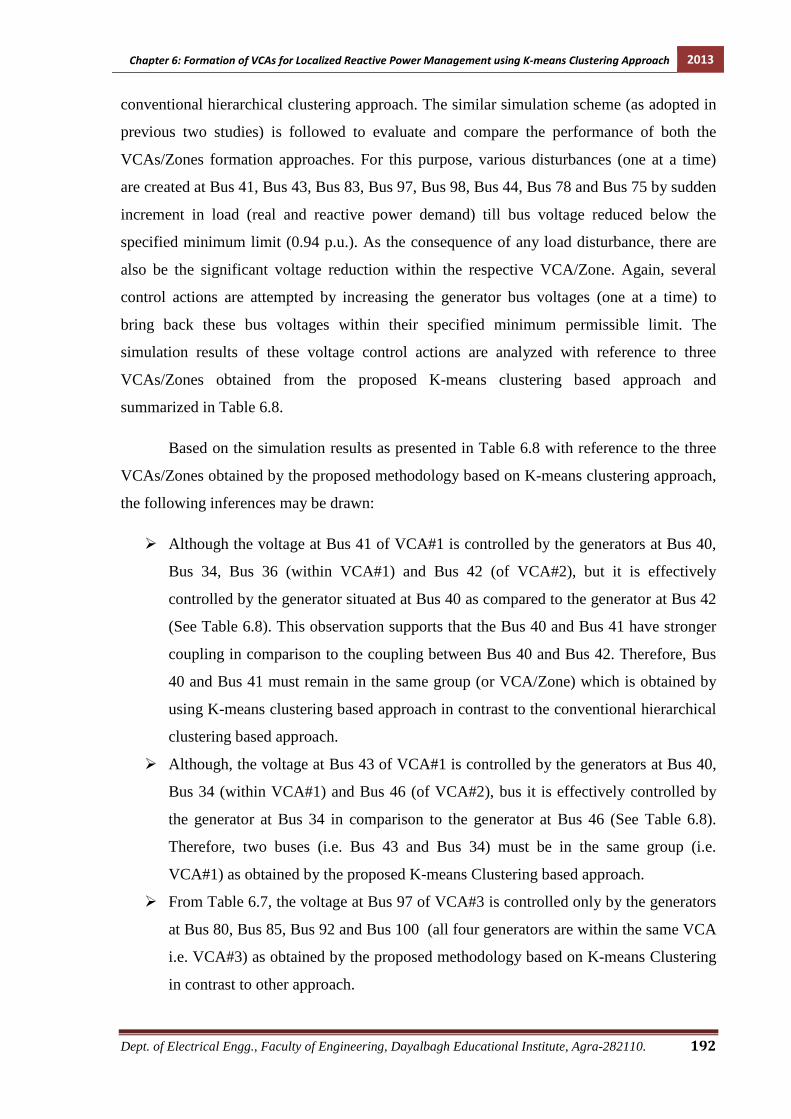
Chapter 6: Formation of VCAs for Localized Reactive Power Management using K-means Clustering Approach 2013
Dept. of Electrical Engg., Faculty of Engineering, Dayalbagh Educational Institute, Agra-282110. 192
conventional hierarchical clustering approach. The similar simulation scheme (as adopted in
previous two studies) is followed to evaluate and compare the performance of both the
VCAs/Zones formation approaches. For this purpose, various disturbances (one at a time)
are created at Bus 41, Bus 43, Bus 83, Bus 97, Bus 98, Bus 44, Bus 78 and Bus 75 by sudden
increment in load (real and reactive power demand) till bus voltage reduced below the
specified minimum limit (0.94 p.u.). As the consequence of any load disturbance, there are
also be the significant voltage reduction within the respective VCA/Zone. Again, several
control actions are attempted by increasing the generator bus voltages (one at a time) to
bring back these bus voltages within their specified minimum permissible limit. The
simulation results of these voltage control actions are analyzed with reference to three
VCAs/Zones obtained from the proposed K-means clustering based approach and
summarized in Table 6.8.
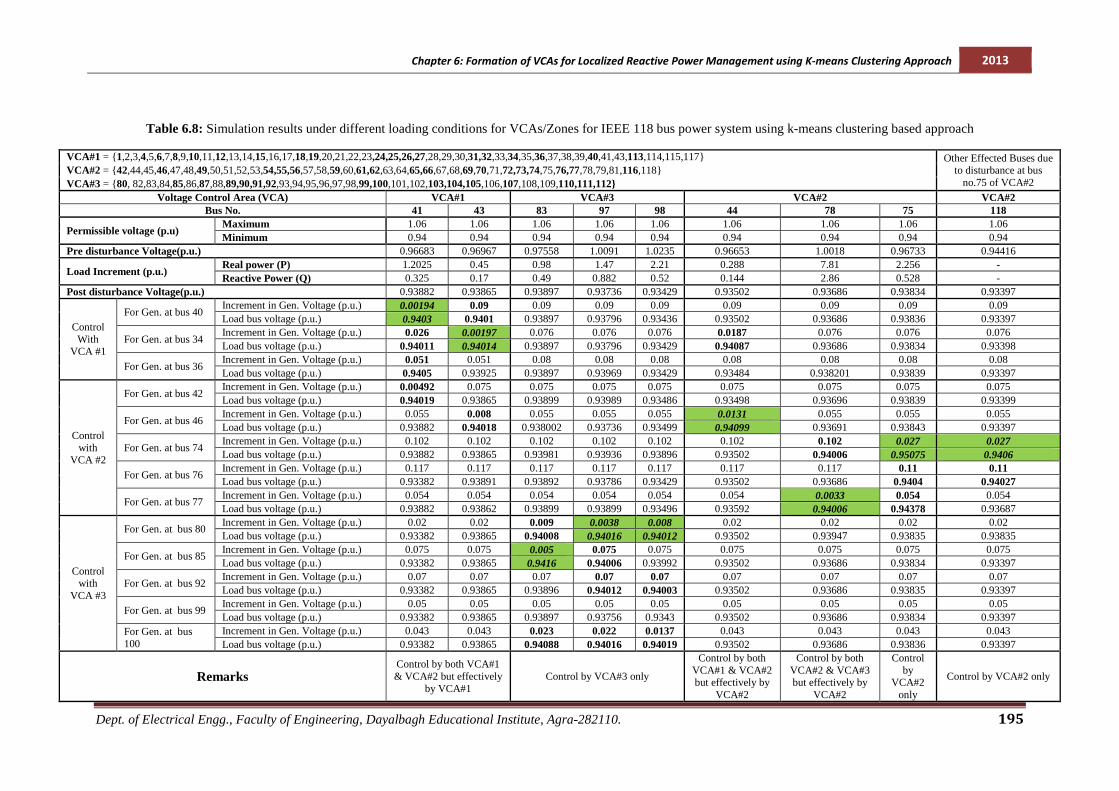
Based on the simulation results as presented in Table 6.8 with reference to the three
VCAs/Zones obtained by the proposed methodology based on K-means clustering approach,
the following inferences may be drawn:
� Although the voltage at Bus 41 of VCA#1 is controlled by the generators at Bus 40,
Bus 34, Bus 36 (within VCA#1) and Bus 42 (of VCA#2), but it is effectively
controlled by the generator situated at Bus 40 as compared to the generator at Bus 42
(See Table 6.8). This observation supports that the Bus 40 and Bus 41 have stronger
coupling in comparison to the coupling between Bus 40 and Bus 42. Therefore, Bus
40 and Bus 41 must remain in the same group (or VCA/Zone) which is obtained by
using K-means clustering based approach in contrast to the conventional hierarchical
clustering based approach.
� Although, the voltage at Bus 43 of VCA#1 is controlled by the generators at Bus 40,
Bus 34 (within VCA#1) and Bus 46 (of VCA#2), bus it is effectively controlled by
the generator at Bus 34 in comparison to the generator at Bus 46 (See Table 6.8).
Therefore, two buses (i.e. Bus 43 and Bus 34) must be in the same group (i.e.
VCA#1) as obtained by the proposed K-means Clustering based approach.
� From Table 6.7, the voltage at Bus 97 of VCA#3 is controlled only by the generators
at Bus 80, Bus 85, Bus 92 and Bus 100 (all four generators are within the same VCA
i.e. VCA#3) as obtained by the proposed methodology based on K-means Clustering
in contrast to other approach.
Chapter 6: Formation of VCAs for Localized Reactive Power Management using K-means Clustering Approach 2013
Dept. of Electrical Engg., Faculty of Engineering, Dayalbagh Educational Institute, Agra-282110. 193
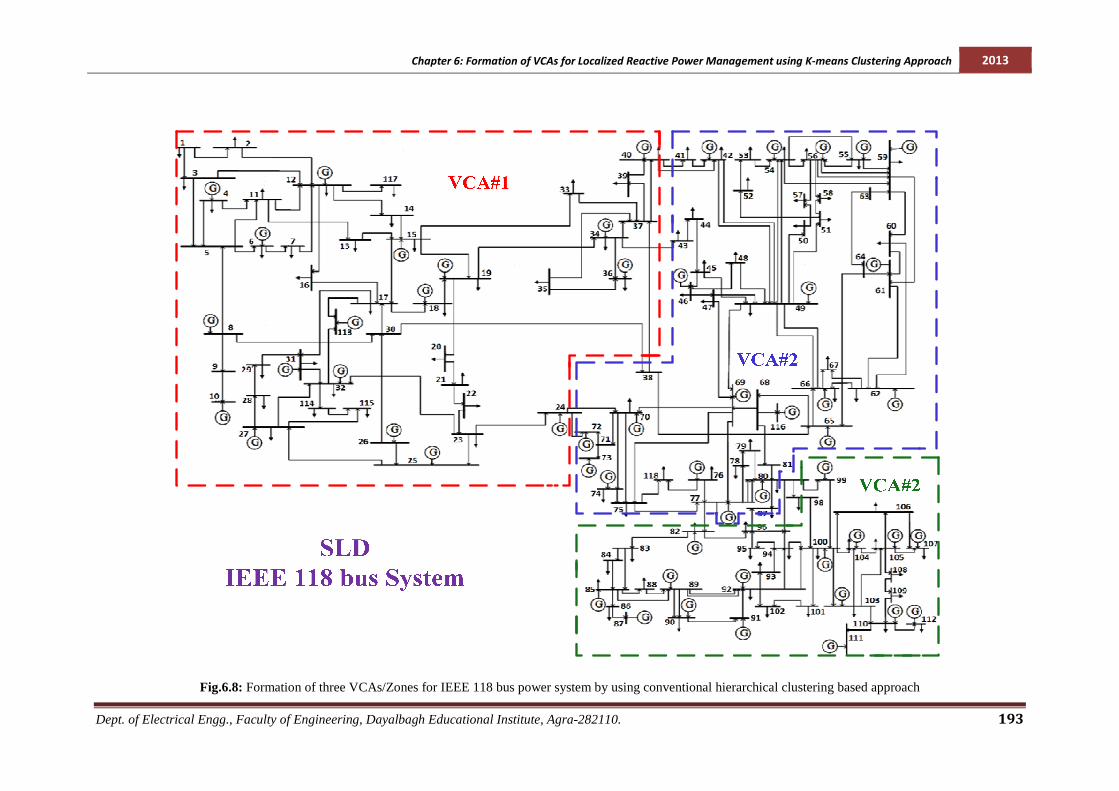
Fig.6.8: Formation of three VCAs/Zones for IEEE 118 bus power system by using conventional hierarchical clustering based approach
Chapter 6: Formation of VCAs for Localized Reactive Power Management using K-means Clustering Approach 2013
Dept. of Electrical Engg., Faculty of Engineering, Dayalbagh Educational Institute, Agra-282110. 194
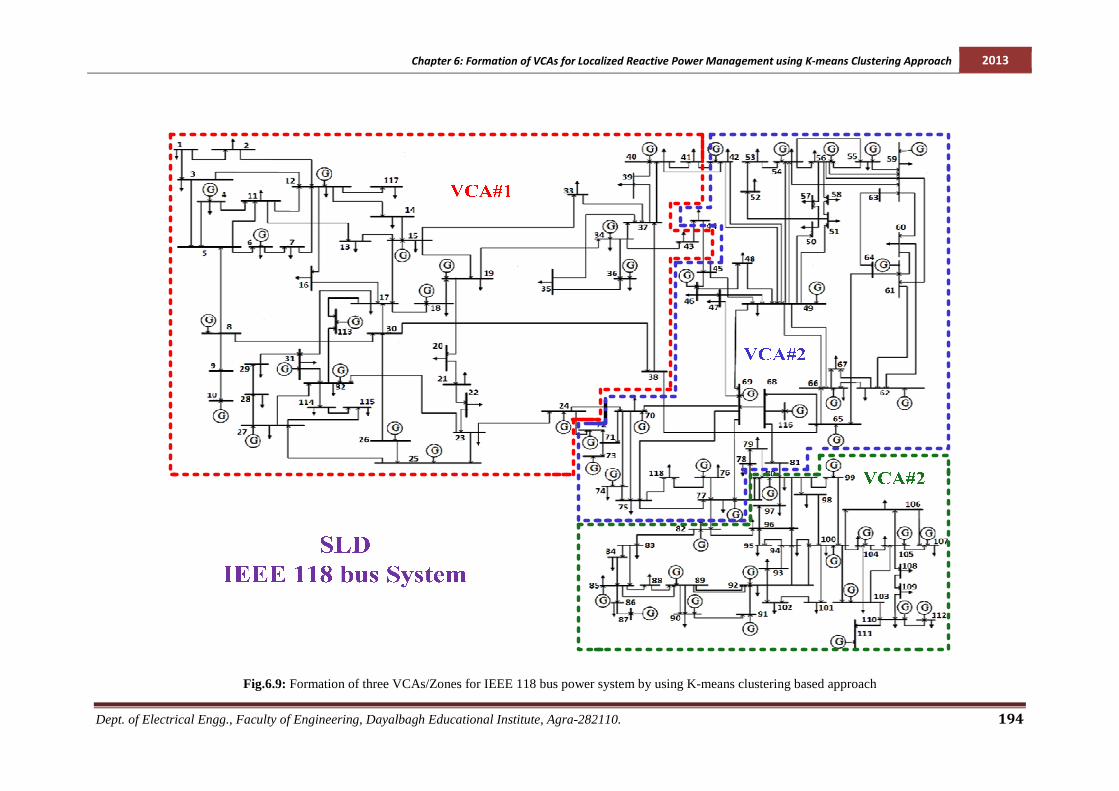
Fig.6.9: Formation of three VCAs/Zones for IEEE 118 bus power system by using K-means clustering based approach
Chapter 6: Formation of VCAs for Localized Reactive Power Management using K-means Clustering Approach 2013
Dept. of Electrical Engg., Faculty of Engineering, Dayalbagh Educational Institute, Agra-282110. 195
Table 6.8: Simulation results under different loading conditions for VCAs/Zones for IEEE 118 bus power system using k-means clustering based approach
VCA#1 = {1,2,3,4,5,6,7,8,9,10,11,12,13,14,15,16,17,18,19,20,21,22,23,24,25,26,27,28,29,30,31,32,33,34,35,36,37,38,39,40,41,43,113,114,115,117} Other Effected Buses due to disturbance at bus
no.75 of VCA#2 VCA#2 = {42,44,45,46,47,48,49,50,51,52,53,54,55,56,57,58,59,60,61,62,63,64,65,66,67,68,69,70,71,72,73,74,75,76,77,78,79,81,116,118} VCA#3 = {80, 82,83,84,85,86,87,88,89,90,91,92,93,94,95,96,97,98,99,100,101,102,103,104,105,106,107,108,109,110,111,112}
Voltage Control Area (VCA) VCA#1 VCA#3 VCA#2 VCA#2 Bus No. 41 43 83 97 98 44 78 75 118
Permissible voltage (p.u) Maximum 1.06 1.06 1.06 1.06 1.06 1.06 1.06 1.06 1.06 Minimum 0.94 0.94 0.94 0.94 0.94 0.94 0.94 0.94 0.94
Pre disturbance Voltage(p.u.) 0.96683 0.96967 0.97558 1.0091 1.0235 0.96653 1.0018 0.96733 0.94416
Load Increment (p.u.) Real power (P) 1.2025 0.45 0.98 1.47 2.21 0.288 7.81 2.256 - Reactive Power (Q) 0.325 0.17 0.49 0.882 0.52 0.144 2.86 0.528 -
Post disturbance Voltage(p.u.) 0.93882 0.93865 0.93897 0.93736 0.93429 0.93502 0.93686 0.93834 0.93397
Control With
VCA #1
For Gen. at bus 40 Increment in Gen. Voltage (p.u.) 0.00194 0.09 0.09 0.09 0.09 0.09 0.09 0.09 0.09 Load bus voltage (p.u.) 0.9403 0.9401 0.93897 0.93796 0.93436 0.93502 0.93686 0.93836 0.93397
For Gen. at bus 34 Increment in Gen. Voltage (p.u.) 0.026 0.00197 0.076 0.076 0.076 0.0187 0.076 0.076 0.076 Load bus voltage (p.u.) 0.94011 0.94014 0.93897 0.93796 0.93429 0.94087 0.93686 0.93834 0.93398
For Gen. at bus 36 Increment in Gen. Voltage (p.u.) 0.051 0.051 0.08 0.08 0.08 0.08 0.08 0.08 0.08 Load bus voltage (p.u.) 0.9405 0.93925 0.93897 0.93969 0.93429 0.93484 0.938201 0.93839 0.93397
Control with
VCA #2
For Gen. at bus 42 Increment in Gen. Voltage (p.u.) 0.00492 0.075 0.075 0.075 0.075 0.075 0.075 0.075 0.075 Load bus voltage (p.u.) 0.94019 0.93865 0.93899 0.93989 0.93486 0.93498 0.93696 0.93839 0.93399
For Gen. at bus 46 Increment in Gen. Voltage (p.u.) 0.055 0.008 0.055 0.055 0.055 0.0131 0.055 0.055 0.055 Load bus voltage (p.u.) 0.93882 0.94018 0.938002 0.93736 0.93499 0.94099 0.93691 0.93843 0.93397
For Gen. at bus 74 Increment in Gen. Voltage (p.u.) 0.102 0.102 0.102 0.102 0.102 0.102 0.102 0.027 0.027 Load bus voltage (p.u.) 0.93882 0.93865 0.93981 0.93936 0.93896 0.93502 0.94006 0.95075 0.9406
For Gen. at bus 76 Increment in Gen. Voltage (p.u.) 0.117 0.117 0.117 0.117 0.117 0.117 0.117 0.11 0.11 Load bus voltage (p.u.) 0.93382 0.93891 0.93892 0.93786 0.93429 0.93502 0.93686 0.9404 0.94027
For Gen. at bus 77 Increment in Gen. Voltage (p.u.) 0.054 0.054 0.054 0.054 0.054 0.054 0.0033 0.054 0.054 Load bus voltage (p.u.) 0.93882 0.93862 0.93899 0.93899 0.93496 0.93592 0.94006 0.94378 0.93687
Control with
VCA #3
For Gen. at bus 80 Increment in Gen. Voltage (p.u.) 0.02 0.02 0.009 0.0038 0.008 0.02 0.02 0.02 0.02 Load bus voltage (p.u.) 0.93382 0.93865 0.94008 0.94016 0.94012 0.93502 0.93947 0.93835 0.93835
For Gen. at bus 85 Increment in Gen. Voltage (p.u.) 0.075 0.075 0.005 0.075 0.075 0.075 0.075 0.075 0.075 Load bus voltage (p.u.) 0.93382 0.93865 0.9416 0.94006 0.93992 0.93502 0.93686 0.93834 0.93397
For Gen. at bus 92 Increment in Gen. Voltage (p.u.) 0.07 0.07 0.07 0.07 0.07 0.07 0.07 0.07 0.07 Load bus voltage (p.u.) 0.93382 0.93865 0.93896 0.94012 0.94003 0.93502 0.93686 0.93835 0.93397
For Gen. at bus 99 Increment in Gen. Voltage (p.u.) 0.05 0.05 0.05 0.05 0.05 0.05 0.05 0.05 0.05 Load bus voltage (p.u.) 0.93382 0.93865 0.93897 0.93756 0.9343 0.93502 0.93686 0.93834 0.93397
For Gen. at bus 100
Increment in Gen. Voltage (p.u.) 0.043 0.043 0.023 0.022 0.0137 0.043 0.043 0.043 0.043 Load bus voltage (p.u.) 0.93382 0.93865 0.94088 0.94016 0.94019 0.93502 0.93686 0.93836 0.93397
Remarks Control by both VCA#1 & VCA#2 but effectively
by VCA#1 Control by VCA#3 only
Control by both VCA#1 & VCA#2 but effectively by
VCA#2
Control by both VCA#2 & VCA#3 but effectively by
VCA#2
Control by
VCA#2 only
Control by VCA#2 only

Chapter 6: Formation of VCAs for Localized Reactive Power Management using K-means Clustering Approach 2013
Dept. of Electrical Engg., Faculty of Engineering, Dayalbagh Educational Institute, Agra-282110. 196
Therefore, the above simulations and the subsequent analysis suggest that the
proposed methodology based on K-means clustering approach is also an appropriate method
for splitting the IEEE 118 bus power system in to the better VCAs/Zones in comparison to
the conventional hierarchical clustering based approach. Further, these VCAs/Zones may be
used in any voltage control and reactive power management applications in the present
deregulated environment.
6.5. Concluding Remarks
This chapter presents a new K-means clustering based approach to identity the desired
Voltage Control Areas (VCAs) for a given power system. Similar to the conventional
hierarchical clustering based approach, the proposed methodology based on K-means
clustering algorithm also exploits the concept of electrical distance and localized nature of
reactive power. In proposed methodology, the choice of K-means clustering algorithm is
obvious because of its robustness and suitability for engineering applications. Moreover, the
proposed methodology is compatible for the establishment of a localized/zonal day-ahead
reactive power market necessary for effective reactive power management as dealt in the
next chapter. The effectiveness of the proposed K-means clustering based approach has been
demonstrated on three different power system such as IEEE 24 bus RTS, IEEE 30 bus power
system and IEEE 118 bus power system for the different load disturbances. The results and
subsequent discussions presented show that the K-mean clustering based methodology is a
well deserved approach for the effective identification of desired VCAs/Zones and compete
with the conventional hierarchical clustering based approach. The extensive simulations for
different critical load disturbances are applied to verify and compare the clustering
performances of both the approaches. It is found that the K-means clustering based approach
provides more appropriate VCAs/Zones as compared to other existing approach.
Furthermore, the developed methodology is useful for determining the allowable voltage
ranges for each cluster, which facilitates the effective and secure reactive power supply in
the power system operation. And it is also valuable for providing the signal for reactive
power management in each cluster and hence may be used for managing the price-related
risk in the competitive market operation.
***